advances in analytics of chemical hazards in...
TRANSCRIPT

Advances in Analytics of Chemical Hazards in Foods
Manoj Pillai. Ph.D; Director Application Support (India), Sciex

Agenda
• Introduction
• Analytes and Analytics
• Hyphenated technology – LC MS
• Mass analysers
• Scan function for Quantitation
• Applications of LC MS
• Where MRM can fail
• Hybrid Linear Ion traps
• Use of Library search in LC MS/MS applications
• HRMS for targeted and non targeted screening of hazards

3 © 2015 AB Sciex
Food Analysis
• Continuous demand for more robust, efficient, sensitive and cost effective methodologies
• Guarantee the safety, Quality and traceability of foods in compliance with legislation and consumers demand
Old methods – concepts based
on Wet chemistry
Powerful instrumental
techniques used in food labs
Sample throughput
Analytical Accuracy
Precision
Specificity
Detection limits

4 © 2015 AB Sciex
Broad areas Analysis
Chemical Constituents Instrumental analysis Microbiological parameters
Sample
Moisture , Crude protein Crude fat, Crude fiber
Dry matter, Organic Matter Inorganic Matter, Protein
Non Protein Nitrogen Lipids, Pigments, Starch,
Sugards Organic acids, Pectins,
Hemicellulose, Cellulose, lignin, Fiber bound
nitrogen, insoluble Ash, Soluble Ash, neutral detergent fiber, acid
detergent fiber, Silica
Pesticides, Drug residues,
Mycotoxins, Allergens,
Dyes Antioxidants
Bioactive principles Dioxins
Organic pollutants Heavy metals
Vitamins Amino acids
Fatty acid analysis Lipid analysis
Hormones Antiparasites Plasticizers
Pathogens and Toxins Listeria monocytogenes
Salmonella Legionella pneumophila Escherichia coli O157
(E.coli) Vibrio spp.
Clostridium perfringens Bacillus cereus
Enterobacter sakazakii Campylobacter
Enterotoxins Staphylococcus aureus

5 © 2015 AB Sciex
Analytics
Analytical techniques – classification according to their working principle
• Biological • Spectroscopic • Electrochemical • Separation Based • Hyphenated

6 © 2015 AB Sciex
High-risk compounds commonly targeted in routine food testing :
Incr
easi
ng M
W
Increasing polarity
Other chemical properties of interest: - Solubility - Structure - Stability - Charge
Quaternary ammonium salts
Acidic/polar herbicides
Macrolide antibiotics
Acrylamide
Melamine
Packaging migrants
Mycotoxins
Marine biotoxins
Assorted pesticides
Heterocyclic antibiotics
Aminoglycoside antibiotics
Assorted antibiotics
Why the trending workflows?

7 © 2015 AB Sciex
Other contaminants emerge almost daily
Incr
easi
ng M
W
Increasing polarity
Quaternary ammonium salts
Acidic/polar herbicides
Macrolide antibiotics
Acrylamide
Melamine
Packaging migrants
Mycotoxins
Marine biotoxins
Assorted pesticides
Heterocyclic antibiotics
Aminoglycoside antibiotics
Assorted antibiotics
Assorted
pesticide metabolites
Other unknown adulterants / chemical contaminants
Allergens
Steroids & Hormones
‘Gutter oil’
Recycled chemical
migrants
But, to further complicate matters…
8 © 2015 AB Sciex
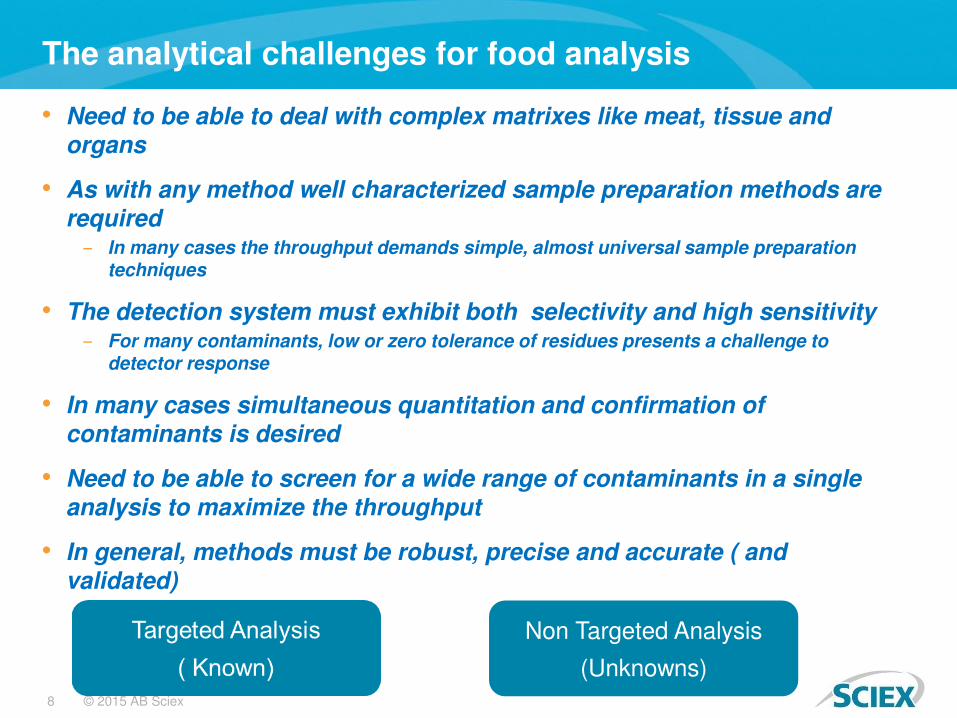
The analytical challenges for food analysis
• Need to be able to deal with complex matrixes like meat, tissue and
organs
• As with any method well characterized sample preparation methods are
required ‒ In many cases the throughput demands simple, almost universal sample preparation
techniques
• The detection system must exhibit both selectivity and high sensitivity ‒ For many contaminants, low or zero tolerance of residues presents a challenge to
detector response
• In many cases simultaneous quantitation and confirmation of
contaminants is desired
• Need to be able to screen for a wide range of contaminants in a single
analysis to maximize the throughput
• In general, methods must be robust, precise and accurate ( and
validated)
Non Targeted Analysis
(Unknowns)

9 © 2015 AB Sciex
Is it possible to do Multiresidue analysis efficiently using UV or FL detector?
1.0 2.0 3.0 4.0 5.0 6.0 7.0 8.0 9.0 10.0 11.0 12.0 13.0 14.0 15.0Time, min
0.0
2.0e5
4.0e5
6.0e5
8.0e5
1.0e6
1.2e6
1.4e6
1.6e6
1.8e6
2.0e6
2.2e6
2.4e6
Inte
nsity
, cps
2.9
Detection of >750 compounds in a forensic screening method
10 © 2015 AB Sciex
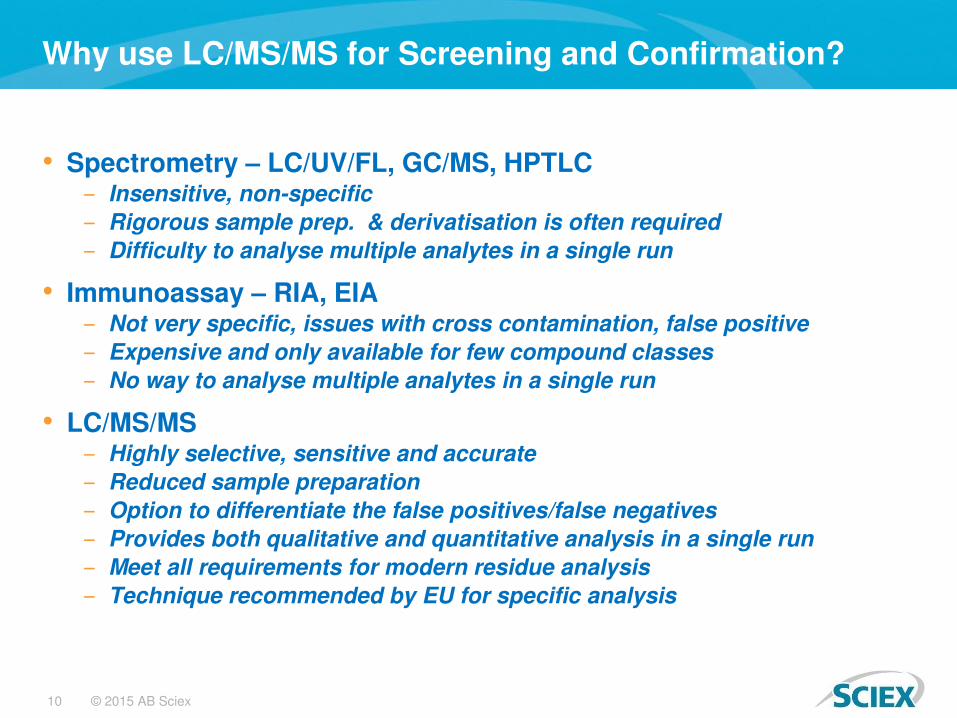
Why use LC/MS/MS for Screening and Confirmation?
• Spectrometry – LC/UV/FL, GC/MS, HPTLC ‒ Insensitive, non-specific
‒ Rigorous sample prep. & derivatisation is often required
‒ Difficulty to analyse multiple analytes in a single run
• Immunoassay – RIA, EIA ‒ Not very specific, issues with cross contamination, false positive
‒ Expensive and only available for few compound classes
‒ No way to analyse multiple analytes in a single run
• LC/MS/MS ‒ Highly selective, sensitive and accurate
‒ Reduced sample preparation
‒ Option to differentiate the false positives/false negatives
‒ Provides both qualitative and quantitative analysis in a single run
‒ Meet all requirements for modern residue analysis
‒ Technique recommended by EU for specific analysis

11 © 2015 AB Sciex
Weighing Atoms
Mass spectrometry (MS) is the science of "weighing" individual atoms and molecules
A mass spectrometer is an instrument that measures the
masses of individual molecules that have been
converted to ions; i.e., molecules that have been electrically charged.
A machine used to weigh molecules.
At molecular scale.

12 © 2015 AB Sciex
Liquid Chromatography Mass spectrometry
Chromatography helps in separation of analytes
Mass spectrometry helps in identification , confirmation and Quantitation of the analytes
Mass spectrometer identifies analyte masses only if they are in the form of ions in gaseous state
Need to convert analyte in solution to ions in gaseous state

13 © 2015 AB Sciex
MASS ANALYSERS
Time of Flight
GOLD STANDARD
FOR QUANTITATION
•Can Select a mass
•Scan a mass range
•Transfer Ions
UNIT RESOLUTION
Good for Scanning
Moderate Resolution
High efficiency for Scanning
High Resolution
IONISATION TECHNIQUES GENERALLY USED WITH LC MS INSTRUMENTATION
ELECTROSPRAY, APCI, APPI, MALDI
Qualitative Analysis
ION TRAPS
Quadrupole

14 © 2015 AB Sciex
What is LC/MS/MS Technology?
• Liquid Chromatography Coupled to a Mass Spectrometer
• (In this case the Mass Spectrometer is a QQQ instrument)
HPLC Column
Q1 Q2 Q3
923 765
923/765

15 © 2015 AB Sciex
O CH3
H2N
O
Benzocaine
NH2
O CH3
OEthenzamide
- Same Formula : C9H11NO2 - Same Mass : 165.19 daltons - Same number of double bonds : 4
Why LCMSMS and not LCMS?
Different fragmentation pattern

16 © 2015 AB Sciex
Typical fragmentation spectra m/z 200
Qualifier Quantifier

17 © 2015 AB Sciex
Selected Ion Monitoring (SIM) vs. Multiple Reaction Monitoring (MRM) MS detection schema for MS vs. MS/MS
• MRM provides superior selectivity and sensitivity for quantitation of targeted compounds (double-mass filtering)
• MRM ratio calculation for multiple ions provides good compound identification (qualifier/quantifier)
• MRM is highly efficient to enable multi-target screening for hundreds of compounds in a single injection
SIM (MS) MRM (MS/MS)
filter filter fragment filter

18 © 2015 AB Sciex
Single MS Analysis of Clonazepam – m/z 316.1 + other interferences with m/z 316 = multiple peaks
316.1 Extracted
MS/MS Analysis of Clonazepam – MRM of 316.1/270.1 Interferences present, but MRM is highly specific (unique Parent to Fragment transition)
316.1/270.1 Extracted
MS/MS Spectrum
Confirmation: Selectivity of MRM

19 © 2015 AB Sciex
1 2 3 4 5 6 7 8 9 10 11 12 13 14Time, min
0.0
1.0e4
2.0e4
3.0e4
4.0e4
5.0e4
6.0e4
7.0e4
8.0e4
9.0e4
1.0e5
1.1e5
1.2e5
1.3e5
1.4e5
1.5e5
1.6e5
Inte
nsi
ty,
cps
11.1
7.1
9.6
0.6
1 2 3 4 5 6 7 8 9 10 11 12 13 14Time, min
0
500
1000
1500
2000
2500
3000
3500
4000
4500
5000
5500
6000
6500
Inte
nsi
ty,
cps
6.9
Single Quadrupole vs. Triple Quadrupole
• Higher selectivity in MRM results in better S/N for quantitation
• Better accuracy and reproducibility in MRM detection
• MRM detection provides wider linear range for quantitation
• More reliable identification using MRM ratios over SIM
MRM SIM

20 © 2015 AB Sciex
Confirmation: 3-5 Criteria
XIC of +MRM (89 pairs): 194.137/163.200 amu Expected RT: 2.8 ID: MDMA 1 from Sample 5 (Cal4) of 10460 pos AB4.wiff (Turbo Spra... Max. 9.2e4 cps.
1.8 1.9 2.0 2.1 2.2 2.3 2.4 2.5 2.6 2.7 2.8 2.9 3.0 3.1 3.2 3.3 3.4 3.5 3.6 3.7 3.8Time, min
0.0
5000.0
1.0e4
1.5e4
2.0e4
2.5e4
3.0e4
3.5e4
4.0e4
4.5e4
5.0e4
5.5e4
6.0e4
6.5e4
7.0e4
7.5e4
8.0e4
8.5e4
9.0e4
In
te
ns
ity
, c
ps
2.79
1. Retention time 2. Q1 (parent) mass 3. Q3 (fragment mass) #1 4. Q3 (fragment mass) #2 5. Ratio of peak areas

21 © 2015 AB Sciex
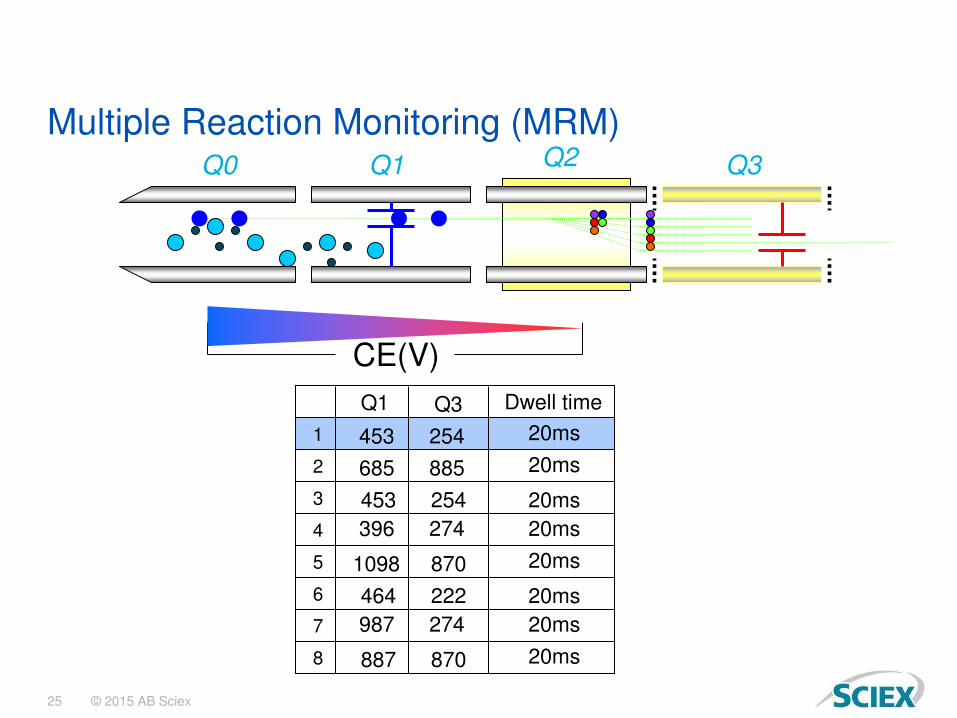
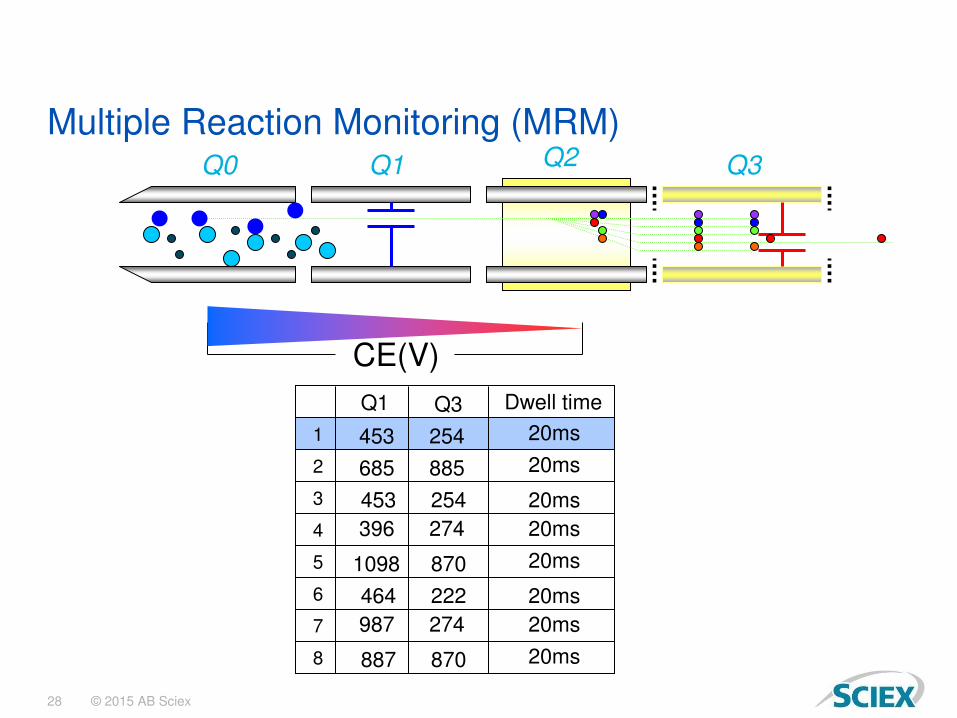
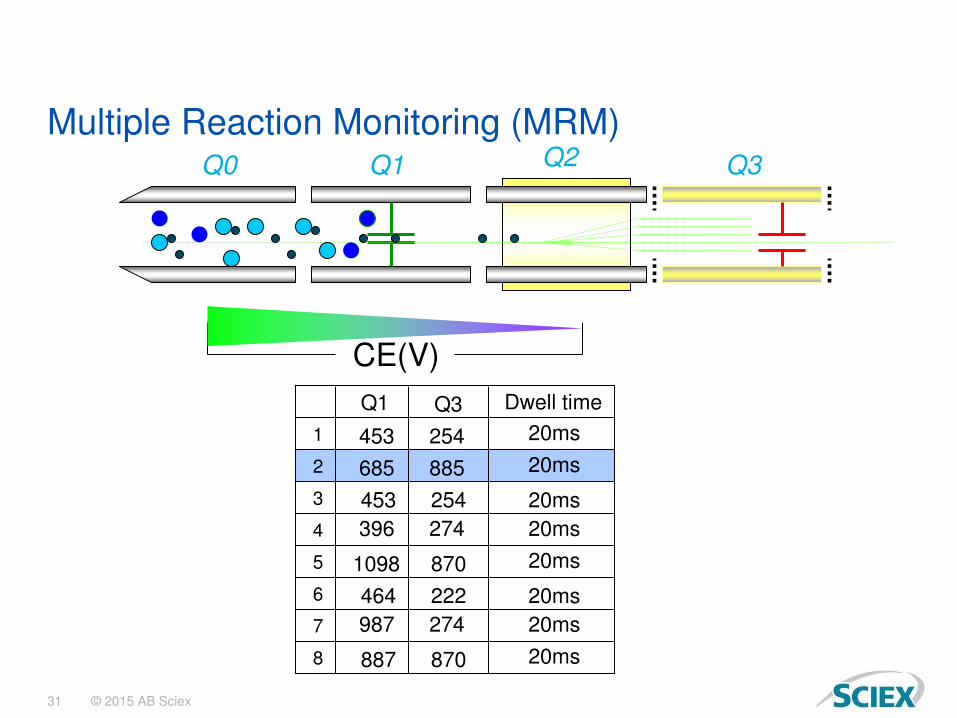
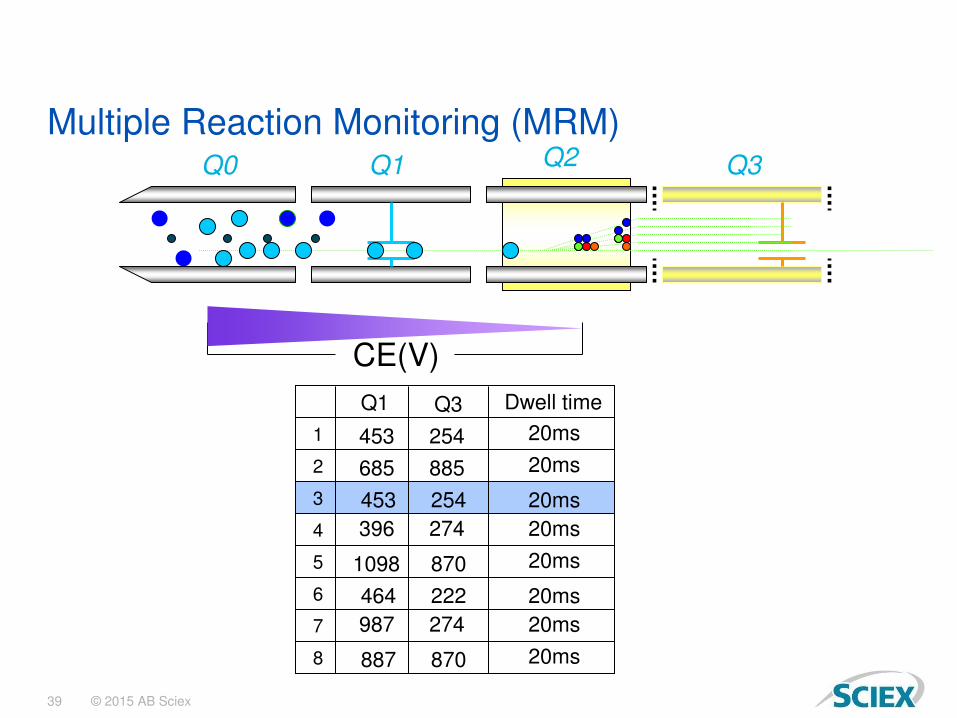
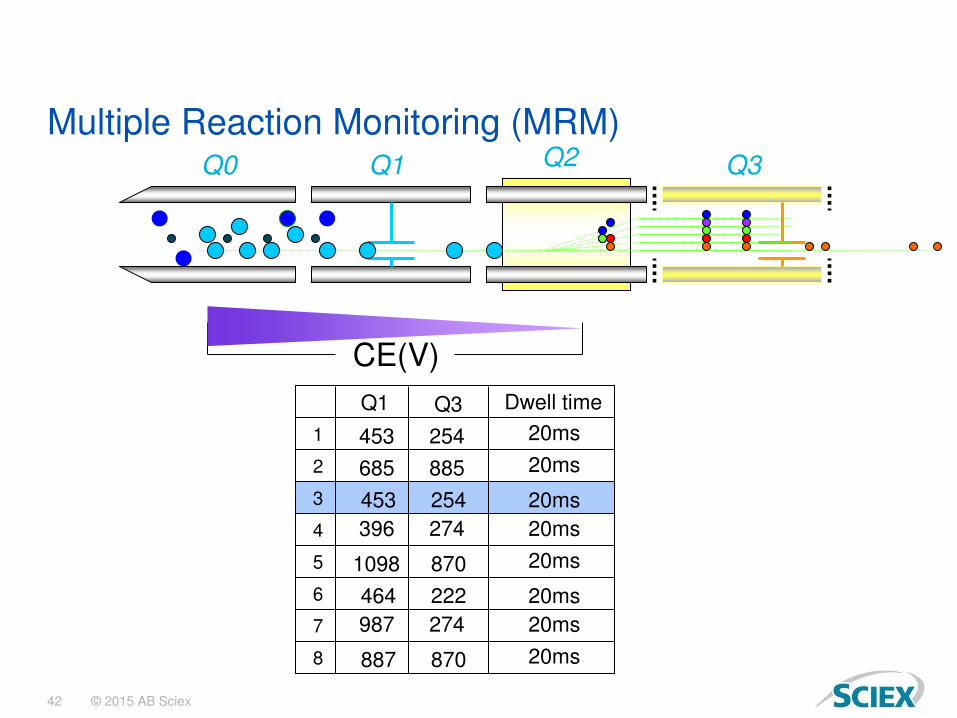
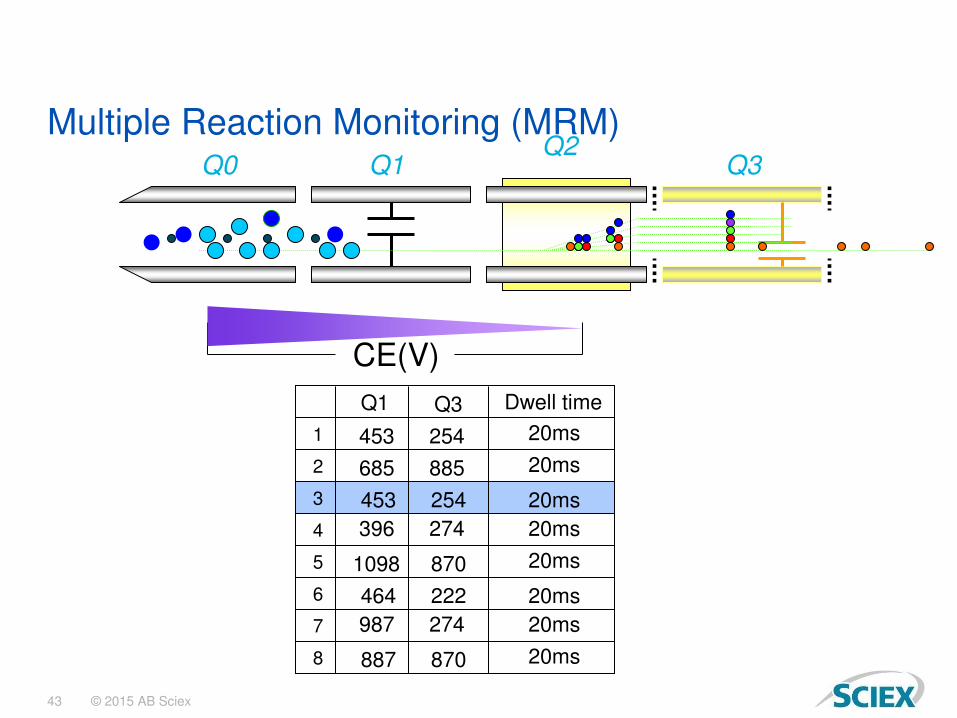
Triple Quadrupole MS Multiple Reaction Monitoring (MRM)
Continuous Ion Flow
Quadrupole 1 filters the desired precursor ion
Precursor ions fragment in Q2 LINAC Collision Cell (filled with Nitrogen CAD gas)
Quadrupole 3 filters the desired product ion
Product ion detection and registration
Selective quantitative information
Q3= Fixed
Q1= Fixed

22 © 2015 AB Sciex
Q1 Q3 Dwell time
1
2
3
4
5
6
7
8
453 254
685 885
453 254 396 274
1098 870
20ms
20ms
20ms 20ms
20ms
464 222 987 274
887 870
20ms 20ms
20ms
CE(V)
Q0 Q1 Q2 Q3
Multiple Reaction Monitoring (MRM)

23 © 2015 AB Sciex
Q1 Q3 Dwell time
1
2
3
4
5
6
7
8
453 254
685 885
453 254 396 274
1098 870
20ms
20ms
20ms 20ms
20ms
464 222 987 274
887 870
20ms 20ms
20ms
CE(V)
Q0 Q1 Q2 Q3
Multiple Reaction Monitoring (MRM)

24 © 2015 AB Sciex
Q1 Q3 Dwell time
1
2
3
4
5
6
7
8
453 254
685 885
453 254 396 274
1098 870
20ms
20ms
20ms 20ms
20ms
464 222 987 274
887 870
20ms 20ms
20ms
CE(V)
Q0 Q1 Q2 Q3
Multiple Reaction Monitoring (MRM)
25 © 2015 AB Sciex
Q1 Q3 Dwell time
1
2
3
4
5
6
7
8
453 254
685 885
453 254 396 274
1098 870
20ms
20ms
20ms 20ms
20ms
464 222 987 274
887 870
20ms 20ms
20ms
CE(V)
Q0 Q1 Q2 Q3
Multiple Reaction Monitoring (MRM)

26 © 2015 AB Sciex
Q1 Q3 Dwell time
1
2
3
4
5
6
7
8
453 254
685 885
453 254 396 274
1098 870
20ms
20ms
20ms 20ms
20ms
464 222 987 274
887 870
20ms 20ms
20ms
CE(V)
Q0 Q1 Q2 Q3
Multiple Reaction Monitoring (MRM)

27 © 2015 AB Sciex
Q1 Q3 Dwell time
1
2
3
4
5
6
7
8
453 254
685 885
453 254 396 274
1098 870
20ms
20ms
20ms 20ms
20ms
464 222 987 274
887 870
20ms 20ms
20ms
CE(V)
Q0 Q1 Q2 Q3
Multiple Reaction Monitoring (MRM)
28 © 2015 AB Sciex
Q1 Q3 Dwell time
1
2
3
4
5
6
7
8
453 254
685 885
453 254 396 274
1098 870
20ms
20ms
20ms 20ms
20ms
464 222 987 274
887 870
20ms 20ms
20ms
CE(V)
Q0 Q1 Q2 Q3
Multiple Reaction Monitoring (MRM)

29 © 2015 AB Sciex
Q1 Q3 Dwell time
1
2
3
4
5
6
7
8
453 254
685 885
453 254 396 274
1098 870
20ms
20ms
20ms 20ms
20ms
464 222 987 274
887 870
20ms 20ms
20ms
Q0 Q1 Q2 Q3
Multiple Reaction Monitoring (MRM)

30 © 2015 AB Sciex
Q1 Q3 Dwell time
1
2
3
4
5
6
7
8
453 254
685 885
453 254 396 274
1098 870
20ms
20ms
20ms 20ms
20ms
464 222 987 274
887 870
20ms 20ms
20ms
CE(V)
Q0 Q1 Q2 Q3
Multiple Reaction Monitoring (MRM)
31 © 2015 AB Sciex
Q1 Q3 Dwell time
1
2
3
4
5
6
7
8
453 254
685 885
453 254 396 274
1098 870
20ms
20ms
20ms 20ms
20ms
464 222 987 274
887 870
20ms 20ms
20ms
CE(V)
Q0 Q1 Q2 Q3
Multiple Reaction Monitoring (MRM)

32 © 2015 AB Sciex
Q1 Q3 Dwell time
1
2
3
4
5
6
7
8
453 254
685 885
453 254 396 274
1098 870
20ms
20ms
20ms 20ms
20ms
464 222 987 274
887 870
20ms 20ms
20ms
CE(V)
Q0 Q1 Q2 Q3
Multiple Reaction Monitoring (MRM)

33 © 2015 AB Sciex
Q1 Q3 Dwell time
1
2
3
4
5
6
7
8
453 254
685 885
453 254 396 274
1098 870
20ms
20ms
20ms 20ms
20ms
464 222 987 274
887 870
20ms 20ms
20ms
CE(V)
Q0 Q1 Q2 Q3
Multiple Reaction Monitoring (MRM)

34 © 2015 AB Sciex
Q1 Q3 Dwell time
1
2
3
4
5
6
7
8
453 254
685 885
453 254 396 274
1098 870
20ms
20ms
20ms 20ms
20ms
464 222 987 274
887 870
20ms 20ms
20ms
CE(V)
Q0 Q1 Q2 Q3
Multiple Reaction Monitoring (MRM)

35 © 2015 AB Sciex
Q1 Q3 Dwell time
1
2
3
4
5
6
7
8
453 254
685 885
453 254 396 274
1098 870
20ms
20ms
20ms 20ms
20ms
464 222 987 274
887 870
20ms 20ms
20ms
CE(V)
Q0 Q1 Q2 Q3
Multiple Reaction Monitoring (MRM)

36 © 2015 AB Sciex
Q1 Q3 Dwell time
1
2
3
4
5
6
7
8
453 254
685 885
453 254 396 274
1098 870
20ms
20ms
20ms 20ms
20ms
464 222 987 274
887 870
20ms 20ms
20ms
Q0 Q1 Q2 Q3
Multiple Reaction Monitoring (MRM)

37 © 2015 AB Sciex
Q1 Q3 Dwell time
1
2
3
4
5
6
7
8
453 254
685 885
453 254 396 274
1098 870
20ms
20ms
20ms 20ms
20ms
464 222 987 274
887 870
20ms 20ms
20ms
CE(V)
Q0 Q1 Q2 Q3
Multiple Reaction Monitoring (MRM)

38 © 2015 AB Sciex
Q1 Q3 Dwell time
1
2
3
4
5
6
7
8
453 254
685 885
453 254 396 274
1098 870
20ms
20ms
20ms 20ms
20ms
464 222 987 274
887 870
20ms 20ms
20ms
CE(V)
Q0 Q1 Q2 Q3
Multiple Reaction Monitoring (MRM)
39 © 2015 AB Sciex
Q1 Q3 Dwell time
1
2
3
4
5
6
7
8
453 254
685 885
453 254 396 274
1098 870
20ms
20ms
20ms 20ms
20ms
464 222 987 274
887 870
20ms 20ms
20ms
CE(V)
Q0 Q1 Q2 Q3
Multiple Reaction Monitoring (MRM)

40 © 2015 AB Sciex
Q1 Q3 Dwell time
1
2
3
4
5
6
7
8
453 254
685 885
453 254 396 274
1098 870
20ms
20ms
20ms 20ms
20ms
464 222 987 274
887 870
20ms 20ms
20ms
CE(V)
Q0 Q1 Q2 Q3
Multiple Reaction Monitoring (MRM)

41 © 2015 AB Sciex
Q1 Q3 Dwell time
1
2
3
4
5
6
7
8
453 254
685 885
453 254 396 274
1098 870
20ms
20ms
20ms 20ms
20ms
464 222 987 274
887 870
20ms 20ms
20ms
CE(V)
Q0 Q1 Q2 Q3
Multiple Reaction Monitoring (MRM)
42 © 2015 AB Sciex
Q1 Q3 Dwell time
1
2
3
4
5
6
7
8
453 254
685 885
453 254 396 274
1098 870
20ms
20ms
20ms 20ms
20ms
464 222 987 274
887 870
20ms 20ms
20ms
CE(V)
Q0 Q1 Q2 Q3
Multiple Reaction Monitoring (MRM)
43 © 2015 AB Sciex
Q1 Q3 Dwell time
1
2
3
4
5
6
7
8
453 254
685 885
453 254 396 274
1098 870
20ms
20ms
20ms 20ms
20ms
464 222 987 274
887 870
20ms 20ms
20ms
CE(V)
Q0 Q1 Q2
Q3
Multiple Reaction Monitoring (MRM)

44 © 2015 AB Sciex
Q1 Q3 Dwell time
1
2
3
4
5
6
7
8
453 254
685 885
453 254 396 274
1098 870
20ms
20ms
20ms 20ms
20ms
464 222 987 274
887 870
20ms 20ms
20ms
CE(V)
Q0 Q1 Q2 Q3
Multiple Reaction Monitoring (MRM)

45 © 2015 AB Sciex
Q1 Q3 Dwell time
1
2
3
4
5
6
7
8
453 254
685 885
453 254 396 274
1098 870
20ms
20ms
20ms 20ms
20ms
464 222 987 274
887 870
20ms 20ms
20ms
Q0 Q1 Q2 Q3
Multiple Reaction Monitoring (MRM)

46 © 2015 AB Sciex
The Key for Multi-Target Analysis – Fast MS/MS
• Linear Accelerator (LINAC® Collision Cell): tilted quadrupole rods of the collision cell cause an electrical field gradient and accelerate product ions after fragmentation
• Faster MS/MS experiments without loss in sensitivity and without false positive results due to cross talk
1.31 1.13 1.14 1.08 1.13 1.10 1.13 1.11 1.12 1.15 peak area x10e6 counts
1ms 2ms 3ms 4ms 5ms 10ms 15ms 20ms 25ms 50ms Sample Name: "1msec" Sample ID: "01" File: "Data d...Peak Name: "Atrazine" Mass(es): "216.1/174.0 amu"Comment: "" Annotation: ""
7.0 7.5 8.0 8.5 9.0 9.5Time, min
0.0
1.0e4
2.0e4
3.0e4
4.0e4
5.0e4
6.0e4
7.0e4
8.0e4
9.0e4
1.0e5
1.1e5
1.2e5
1.3e5
1.4e5
1.5e5
1.6e5
1.7e5
1.8e57.9
Sample Name: "2msec" Sample ID: "02" File: "Data d...Peak Name: "Atrazine" Mass(es): "216.1/174.0 amu"Comment: "" Annotation: ""
7.0 7.5 8.0 8.5 9.0 9.5Time, min
0.0
1.0e4
2.0e4
3.0e4
4.0e4
5.0e4
6.0e4
7.0e4
8.0e4
9.0e4
1.0e5
1.1e5
1.2e5
1.3e5
1.4e5
1.5e5
1.6e5
1.7e5
1.8e5
Intensi
ty, cps
8.1
Sample Name: "3msec" Sample ID: "03" File: "Data d...Peak Name: "Atrazine" Mass(es): "216.1/174.0 amu"Comment: "" Annotation: ""
7.0 7.5 8.0 8.5 9.0 9.5Time, min
0.0
1.0e4
2.0e4
3.0e4
4.0e4
5.0e4
6.0e4
7.0e4
8.0e4
9.0e4
1.0e5
1.1e5
1.2e5
1.3e5
1.4e5
1.5e5
1.6e5
1.7e5
1.8e5
Intensi
ty, cps
8.1
Sample Name: "4msec" Sample ID: "04" File: "Data d...Peak Name: "Atrazine" Mass(es): "216.1/174.0 amu"Comment: "" Annotation: ""
7.0 7.5 8.0 8.5 9.0 9.5Time, min
0.0
1.0e4
2.0e4
3.0e4
4.0e4
5.0e4
6.0e4
7.0e4
8.0e4
9.0e4
1.0e5
1.1e5
1.2e5
1.3e5
1.4e5
1.5e5
1.6e5
1.7e5
1.8e5
Intensi
ty, cps
8.1
Sample Name: "5msec" Sample ID: "05" File: "Data d...Peak Name: "Atrazine" Mass(es): "216.1/174.0 amu"Comment: "" Annotation: ""
7.0 7.5 8.0 8.5 9.0 9.5Time, min
0.0
1.0e4
2.0e4
3.0e4
4.0e4
5.0e4
6.0e4
7.0e4
8.0e4
9.0e4
1.0e5
1.1e5
1.2e5
1.3e5
1.4e5
1.5e5
1.6e5
1.7e5
1.8e5
Intensi
ty, cps
8.1
Sample Name: "10msec" Sample ID: "10" File: "Data ...Peak Name: "Atrazine" Mass(es): "216.1/174.0 amu"Comment: "" Annotation: ""
7.0 7.5 8.0 8.5 9.0 9.5Time, min
0.0
1.0e4
2.0e4
3.0e4
4.0e4
5.0e4
6.0e4
7.0e4
8.0e4
9.0e4
1.0e5
1.1e5
1.2e5
1.3e5
1.4e5
1.5e5
1.6e5
1.7e5
1.8e5
Intensi
ty, cps
8.1
Sample Name: "15msec" Sample ID: "15" File: "Data ...Peak Name: "Atrazine" Mass(es): "216.1/174.0 amu"Comment: "" Annotation: ""
7.0 7.5 8.0 8.5 9.0 9.5Time, min
0.0
1.0e4
2.0e4
3.0e4
4.0e4
5.0e4
6.0e4
7.0e4
8.0e4
9.0e4
1.0e5
1.1e5
1.2e5
1.3e5
1.4e5
1.5e5
1.6e5
1.7e5
1.8e5
Intensi
ty, cps
8.1
Sample Name: "20msec" Sample ID: "20" File: "Data ...Peak Name: "Atrazine" Mass(es): "216.1/174.0 amu"Comment: "" Annotation: ""
7.0 7.5 8.0 8.5 9.0 9.5Time, min
0.0
1.0e4
2.0e4
3.0e4
4.0e4
5.0e4
6.0e4
7.0e4
8.0e4
9.0e4
1.0e5
1.1e5
1.2e5
1.3e5
1.4e5
1.5e5
1.6e5
1.7e5
1.8e5
Intensi
ty, cps
8.1
Sample Name: "25msec" Sample ID: "25" File: "Data ...Peak Name: "Atrazine" Mass(es): "216.1/174.0 amu"Comment: "" Annotation: ""
7.0 7.5 8.0 8.5 9.0 9.5Time, min
0.0
1.0e4
2.0e4
3.0e4
4.0e4
5.0e4
6.0e4
7.0e4
8.0e4
9.0e4
1.0e5
1.1e5
1.2e5
1.3e5
1.4e5
1.5e5
1.6e5
1.7e5
1.8e5
Intensi
ty, cps
7.9
Sample Name: "50msec" Sample ID: "50" File: "Data ...Peak Name: "Atrazine" Mass(es): "216.1/174.0 amu"Comment: "" Annotation: ""
7.0 7.5 8.0 8.5 9.0 9.5Time, min
0.0
1.0e4
2.0e4
3.0e4
4.0e4
5.0e4
6.0e4
7.0e4
8.0e4
9.0e4
1.0e5
1.1e5
1.2e5
1.3e5
1.4e5
1.5e5
1.6e5
1.7e5
1.8e5
Intensi
ty, cps
8.1

47 © 2015 AB Sciex
XIC of +MRM (378 pairs): 194.0/122.0 amu Expected RT: 3.2 ID: 3,4,5-Trimethacarb 1 from Sample 27 (apple 60564) of Eurofins sMRM on 5... Max. 1774.0 cps.
0.5 1.0 1.5 2.0 2.5 3.0 3.5 4.0 4.5 5.0 5.5 6.0 6.5 7.0 7.5 8.0 8.5 9.0 9.5Time, min
0.0
5.0e4
1.0e5
1.5e5
2.0e5
2.5e5
3.0e5
3.5e5
4.0e5
4.5e5
5.0e5
5.5e5
6.0e5
6.5e5
7.0e5
7.5e5
8.0e5
Inte
nsi
ty,
cps 2. LC-MS/MS
Routine in a Food Testing Laboratory
3. Quantitation and Identification
1. Extraction 1. Extraction

48 © 2015 AB Sciex
LC-MS/MS data evaluation
• For quantitative evaluation of the data the following criteria are applied: – Correlation coefficient ( r value) – intercept – relative standard deviations of average and single response factors

49 © 2015 AB Sciex
For qualitative evaluation the following criteria are applied:
– Retention time
– Peak area ratio of quantifier and qualifier mass transition (MRM ratio)
LC-MS/MS data evaluation
The MRM ratio of the selected analyte specific mass transitions obtained in the
sample should be the same in standards Due to the characteristic physico-chemical behaviour of the analyte during the
collision induced fragmentation

50 © 2015 AB Sciex
EU Criteria for Confirmation
• Guideline 2002/657/EG
‒ SIM and MRM (4 identification points) – MS precursor 1.0 – MSn product 1.5
‒ Full scan spectra (ions > 10% of base peak, mass spectral libraries)
‒ High resolution MS (>10 000)
2 MRMs = 4

51 © 2015 AB Sciex
…but every year is a big year in food & environmental topics!
Consumer topics and trends
Health impacts of vitamins & supplements
Fungicides in water Overuse of antibiotics in feed animals Pesticides in bee colonies
Undeclared allergens
Bans on brominated flame retardants
Horsemeat contamination in beef products What’s
next?

52 © 2015 AB Sciex
Developing new workflows that address pertinent topics & trends
• Meat speciation by LC-MS/MS
• Allergen testing by LC-MS/MS
• Vitamin testing by LC-MS/MS

53 © 2015 AB Sciex
Meat speciation & allergens testing by LC-MS/MS The world of ‘foodomics’
The most accurate and reliable approach to finding allergens or identifying meat species in food samples:
• Detect and quantify the proteins associated with the allergen or species
Intact protein
Enzyme - Trypsin
Peptide fragments
200 400 600 800
m/z
0
MS/MS – Q3 m/z
* *
* *
Peptide Q1 m/z
MRM Method
54 © 2015 AB Sciex
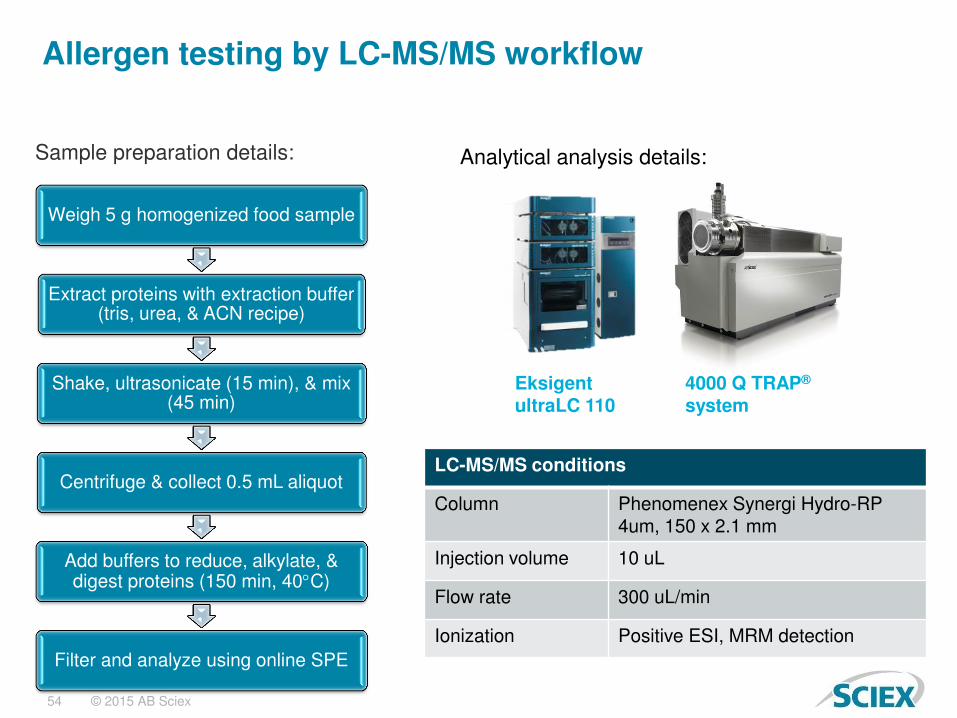
Allergen testing by LC-MS/MS workflow
Analytical analysis details:
Weigh 5 g homogenized food sample
Extract proteins with extraction buffer (tris, urea, & ACN recipe)
Shake, ultrasonicate (15 min), & mix (45 min)
Centrifuge & collect 0.5 mL aliquot
Add buffers to reduce, alkylate, & digest proteins (150 min, 40C)
Filter and analyze using online SPE
Eksigent ultraLC 110
4000 Q TRAP® system
Sample preparation details:
LC-MS/MS conditions
Column Phenomenex Synergi Hydro-RP 4um, 150 x 2.1 mm
Injection volume 10 uL
Flow rate 300 uL/min
Ionization Positive ESI, MRM detection

55 © 2015 AB Sciex
Results Monitoring multiple allergenic peptides simultaneously – Detection of milk, egg, wheat, & peanut allergens in bread

56 © 2015 AB Sciex
Meat speciation by LC-MS/MS workflow
Analytical analysis details:
Weigh 2 g homogenized meat tissue sample
Extract proteins with 10 mL extraction buffer (tris, urea, & ACN recipe)
Shake, ultrasonicate (15 min), & mix (45 min)
Centrifuge & collect 0.5 mL aliquot
Add buffers to reduce, alkylate, & digest proteins (60 min, 40C)
Purify filtrate using polymeric SPE cartridge (PHX)
ekspert ™ microLC 200
QTRAP® 5500 system
Sample preparation details:
LC-MS/MS conditions
Column Halo C18 2.7 um, 90Å, 50 x 0.5 mm
Injection volume 10 uL
Flow rate 20 uL/min
Mobile phases 0.1% formic acid in water (A) or acetonitrile (B) – gradient
Ionization Positive ESI, MRM detection

57 © 2015 AB Sciex
Results Monitoring 3 unique horse meat peptide markers – Can detect as low as 1% horse meat contamination in beef

58 © 2015 AB Sciex
Vitamin testing by LC-MS/MS Example: Vitamin B series testing
• Verifying what’s on these labels:
• Analyzing for water-soluble B vitamins by LC-MS/MS provides accurate & reliable quantitation
Vitamin DV (mg)
Thiamine Vitamin B1 1.5
Riboflavin Vitamin B2 1.7
Niacin Vitamin B3 20
Pyridoxal HCl Vitamin B6 2
Folic acid Vitamin B9 0.4
Cyanocobalamin Vitamin B12 0.006
Biotin Vitamin B7 0.3
Pantothenic acid Vitamin B5 10
59 © 2015 AB Sciex
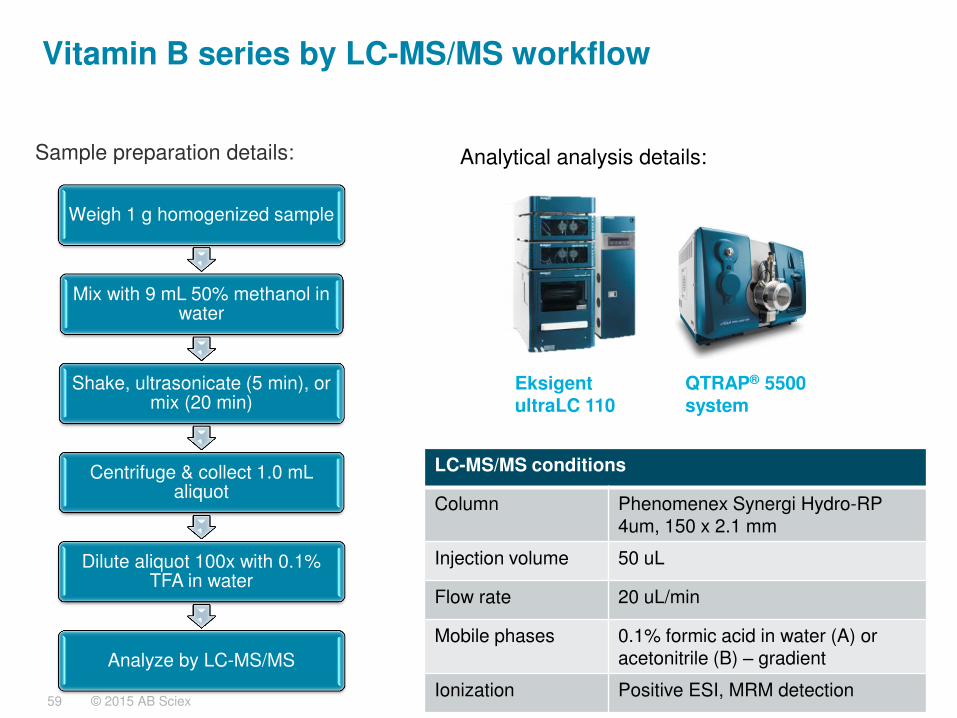
Vitamin B series by LC-MS/MS workflow
Analytical analysis details:
Weigh 1 g homogenized sample
Mix with 9 mL 50% methanol in water
Shake, ultrasonicate (5 min), or mix (20 min)
Centrifuge & collect 1.0 mL aliquot
Dilute aliquot 100x with 0.1% TFA in water
Analyze by LC-MS/MS
QTRAP® 5500 system
Sample preparation details:
LC-MS/MS conditions
Column Phenomenex Synergi Hydro-RP 4um, 150 x 2.1 mm
Injection volume 50 uL
Flow rate 20 uL/min
Mobile phases 0.1% formic acid in water (A) or acetonitrile (B) – gradient
Ionization Positive ESI, MRM detection
Eksigent ultraLC 110

60 © 2015 AB Sciex
Results Monitoring B vitamins in dog food – All claimed vitamin additives listed on the label were detected
XIC of +MRM (39 pairs): 220.106/202.100 amu Expected RT: 4.6 ID: VITAMIN B5 1 from Sample 3 (DOOG FOOD) of WATER SOL.wi... Max. 8.1e5 cps.
0.5 1.0 1.5 2.0 2.5 3.0 3.5 4.0 4.5 5.0 5.5 6.0 6.5 7.0 7.5 8.0Time, min
0.00
5.00e4
1.00e5
1.50e5
2.00e5
2.50e5
3.00e5
3.50e5
4.00e5
4.50e5
5.00e5
5.50e5
6.00e5
6.50e5
7.00e5
7.50e5
8.00e5
8.50e5
9.00e5
9.50e5
1.00e6
1.05e6
1.10e6
1.15e6
1.20e6
1.25e61.29e6
Inte
ns
ity
, c
ps
4.38
B1
B3
B5
B2
61 © 2015 AB Sciex
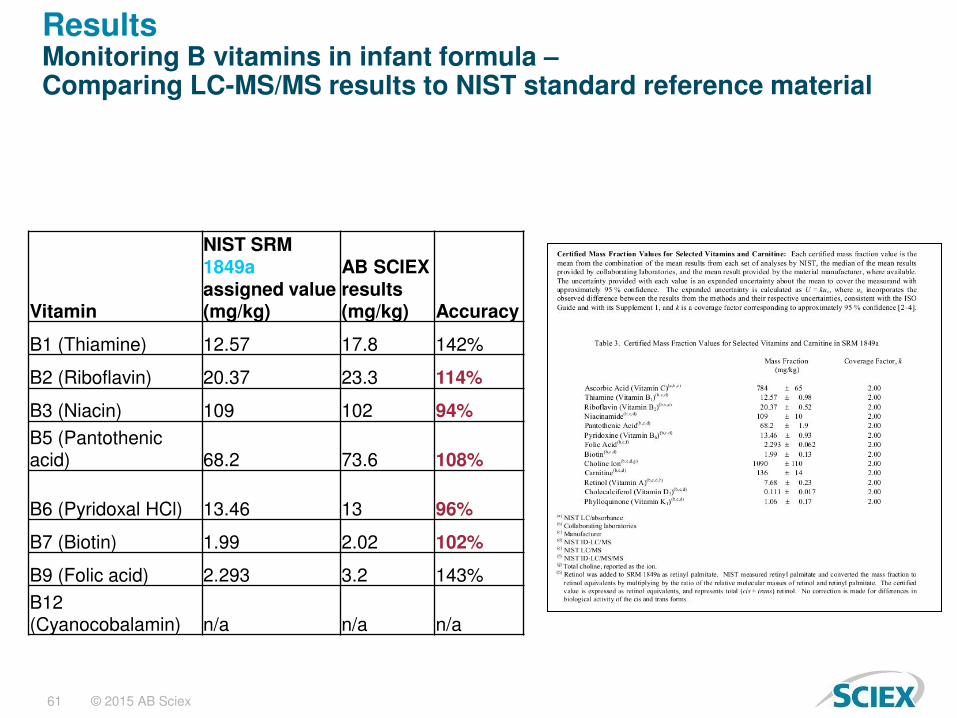
Results Monitoring B vitamins in infant formula – Comparing LC-MS/MS results to NIST standard reference material
Vitamin
NIST SRM 1849a assigned value (mg/kg)
AB SCIEX results (mg/kg) Accuracy
B1 (Thiamine) 12.57 17.8 142%
B2 (Riboflavin) 20.37 23.3 114%
B3 (Niacin) 109 102 94%
B5 (Pantothenic acid) 68.2 73.6 108%
B6 (Pyridoxal HCl) 13.46 13 96%
B7 (Biotin) 1.99 2.02 102%
B9 (Folic acid) 2.293 3.2 143%
B12 (Cyanocobalamin) n/a n/a n/a

62 © 2013 AB SCIEX
Antibiotics and veterinary drug residues
Natural toxins Vitamin and nutritional content
Pesticide residues
Genetically modified organisms (GMO)
Bacteria and microbial contaminations
Heavy metals
Production & packaging contaminants
Chemical adulterants
Allergens
Authenticity and integrity
AB SCIEX and Food & Beverage Testing Food & Beverage testing covers a wide scope of areas
63 © 2015 AB Sciex
XIC of +MRM (158 pairs): 130.1... Max. 1.8e5 cps.
2 4 6 8 10Time, min
0.0
5.0e4
1.0e5
1.5e5
1.8e5
Inte
ns
ity
, c
ps
0.6
+EPI (130.10) Charge (+0) CE ... Max. 1.2e6 cps.
80 100 120 140 160 180 200m/z, Da
0.00
2.00e5
4.00e5
6.00e5
8.00e5
1.00e6
1.20e6
Inte
ns
ity
, c
ps
88.9
70.9
68.9112.0
83.975.8
130.2
XIC of +MRM (158 pairs): 130.1... Max. 2.7e4 cps.
2 4 6 8 10Time, min
0.0
1.0e4
2.0e4
3.0e4
4.0e4
5.0e4
Inte
ns
ity
, c
ps
0.7
+EPI (130.00) CE (20): Exp 1, ... Max. 1.1e6 cps.
80 100 120 140 160 180 200m/z, Da
0.00
2.00e5
4.00e5
6.00e5
8.00e5
1.00e6
1.14e6
Inte
ns
ity
, c
ps
71.0
130.2
85.168.0
113.0
66.4 132.0
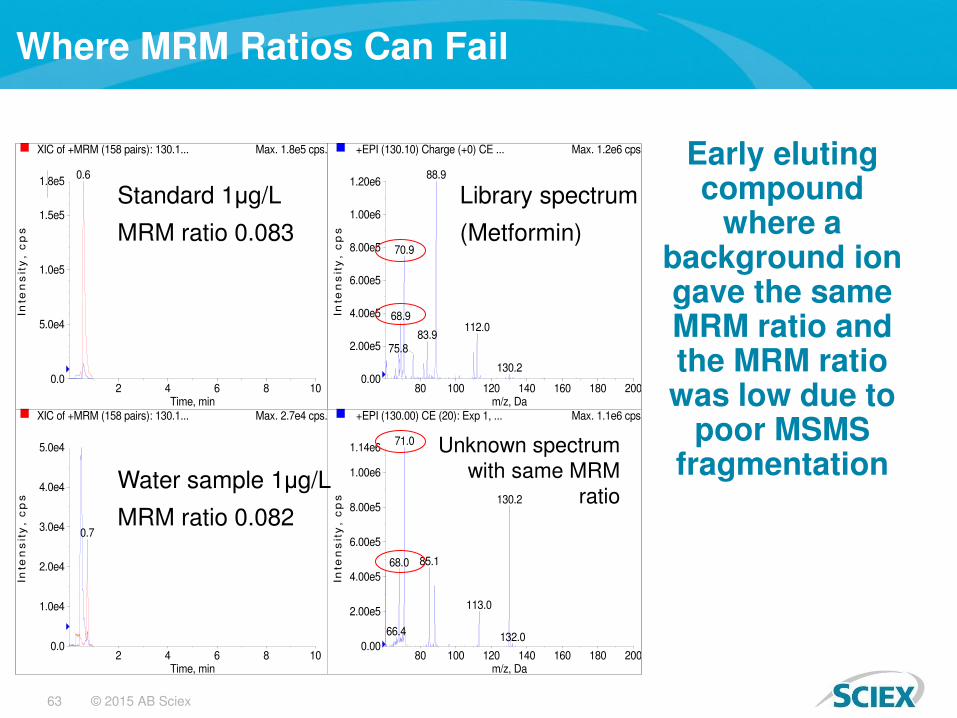
Standard 1μg/L
MRM ratio 0.083
Water sample 1μg/L
MRM ratio 0.082
Library spectrum
(Metformin)
Unknown spectrum with same MRM
ratio
Early eluting compound
where a background ion gave the same MRM ratio and the MRM ratio was low due to
poor MSMS fragmentation
Where MRM Ratios Can Fail

64 © 2015 AB Sciex
Quantitation Using MRM
• Positives: ‒ Fast – can analyse hundreds of analytes in a single injection ‒ Sensitive – specific Q1 and Q3 mass maximises signal/noise ‒ Best solution for quantitation ‒ Ion ratio helps confirm compound identity ‒ Wide dynamic range
• Negatives ‒ No detailed structural information ‒ MRM ratio can fail
‒ Concentration outside linear range ‒ Possibility of interfering peaks
• Need a technique complementary to MRM . . . . ‒ Detailed product ion spectra gives structural information ‒ Can then compare against library for confirmation ‒ Triple quads have poor full scan sensitivity ‒ Ion trap needed

65 © 2015 AB Sciex
Full scan Using Quadrupole – Why Not?
Ions are continuously fed into the quadrupole
Only one ion pair is stable at any one time
Consequently ions are lost
Low Duty Cycle
Continuous Ion Flow
Quad = Scanning

66 © 2015 AB Sciex
Principle of a Linear Ion Trap - Scanning

67 © 2015 AB Sciex
Q0 Q1 Q2 Q3
Q TRAP® System - Enhanced Product Ion Scanning
1. Precursor ions selection in Q1-No Isolation time.
N2 CAD Gas linear ion trap
3x10⁻⁵ Torr
Precursor ion selection
Ion accumulation
Fragmentation
Exit lens Steps MS2: 1 2 3 &4
2. Fragmentation in Q2-for a richer fragmentation pattern, no low mass cutoff
3. Trap products in Q3-short, efficient fill
4. Mass scan.
High sensitivity , richer fragmentation pattern - EPI

68 © 2015 AB Sciex
QTrap® – What Does It Give? 1. Sensitivity!
QqQ – Product ion scan
Enhanced product ion spectra More sensitivity
No LOW MASS CUT OFF

69 © 2015 AB Sciex
IDA – Information Dependent Acquisition
• Hybrid instrument combining MRM quantitation and ion trap full scan capabilities
• Individually, these techniques can be useful, but need a way of linking them together in a useful way
• Software solution is IDA – information dependent acquisition
• Added capability of having combination of scan functions in one single run

70 © 2015 AB Sciex
Information Dependent Acquisition
On the fly acquisition of masses eluting along with the simultaneous generation of Enhanced resolution data and enhanced product ion spectra
Will help in carrying out the combination of operating modes in a Linear ion trap

71 © 2015 AB Sciex
Real Time Dynamic Background Subtraction Increasing IDA Efficiency
72 © 2015 AB Sciex
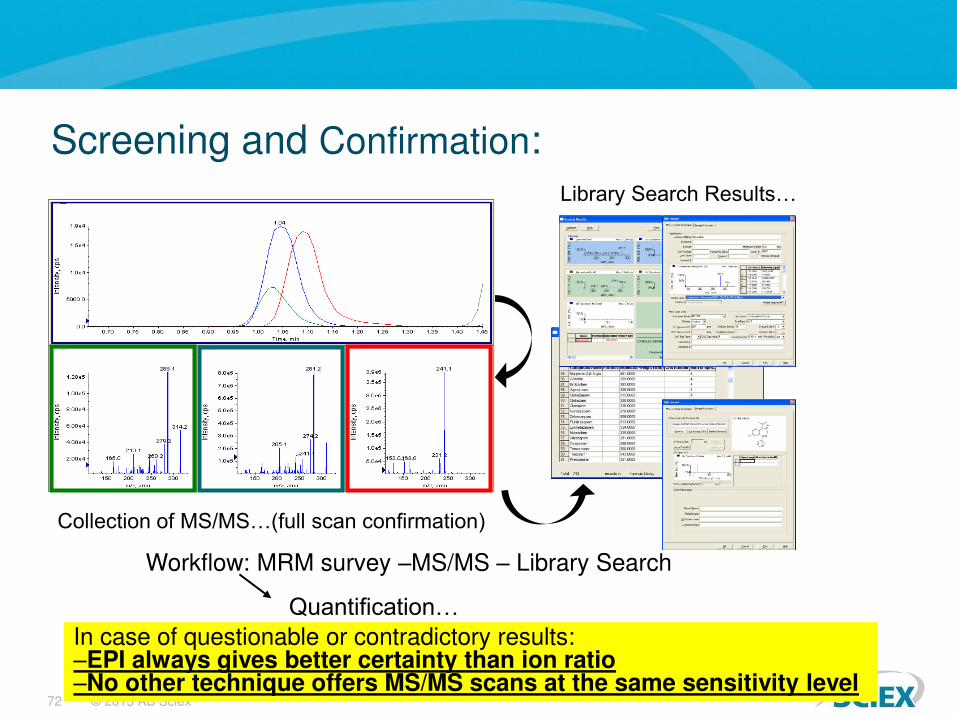
Screening and Confirmation:
Workflow: MRM survey –MS/MS – Library Search
Collection of MS/MS…(full scan confirmation)
Library Search Results…
Quantification… In case of questionable or contradictory results: –EPI always gives better certainty than ion ratio –No other technique offers MS/MS scans at the same sensitivity level

73 © 2015 AB Sciex
QTRAP® Systems: MRM – IDA – EPI Experiments XIC of +MRM (10 pairs): Exp 1, 216.1/174.0 amu from Sample 7 (10) of Data EPI vs MS2 - EPI dynFT 216.wiff (Turbo Spray) Max. 1.4e4 cps.
1 2 3 4 5 6 7 8 9 10 11 12 13 14Time, min
0.0
1000.0
2000.0
3000.0
4000.0
5000.0
6000.0
7000.0
8000.0
9000.0
1.0e4
1.1e4
1.2e4
1.3e4
1.4e4
In
te
ns
it
y,
c
ps
7.20
+EPI (216.10) CE (35): Exp 2, 7.073 to 7.299 min from Sample 7 (10) of Data EPI vs MS2 - EPI dynFT 216.wiff (Turbo Spray) Max. 6.0e5 cps.
70 80 90 100 110 120 130 140 150 160 170 180 190 200 210 220 230m/z, amu
0.0
5.0e4
1.0e5
1.5e5
2.0e5
2.5e5
3.0e5
3.5e5
4.0e5
4.5e5
5.0e5
5.5e5
6.0e5
In
te
ns
it
y,
c
ps
174.0
103.9132.0 146.096.0
216.079.0
138.0110.0
Quantitation: Hundreds of MRM
Confirmation using EPI spectra Library search – PUR 95.6%
0 10 20 30 40 50 60 70 80 90 100 110 120 130 140 150 160 170 180 190 200Concentration, ng/mL
0.0
5.0e4
1.0e5
1.5e5
2.0e5
2.5e5
3.0e5
3.4e5
Ar
ea
,
co
un
t

74 © 2015 AB Sciex
Benefits of QTRAP® – Overcome matrix ambiguity
A. Enhanced Product Ion (EPI) scanning with QTRAP® is basically like having more than 4 MRMs for any detected compounds in your sample.
s. XIC of +MRM (202 pairs): 297.0/... Max. 7300.0 cps.
7 8 9 10 11 12Time, min
0
1000
2000
3000
4000
5000
6000
7000
Inte
ns
ity
, c
ps
9.1
s. XIC of +MRM (202 pairs): 297.0/... Max. 1000.0 cps.
7 8 9 10 11 12Time, min
0
200
400
600
800
1000
Inte
ns
ity
, c
ps
9.3
10ppb Imazalil MRM ratio = 0.63 0.093
Imazalil in sample?? (10x diluted extract) MRM ratio = 0.50
?
Example
75 © 2015 AB Sciex
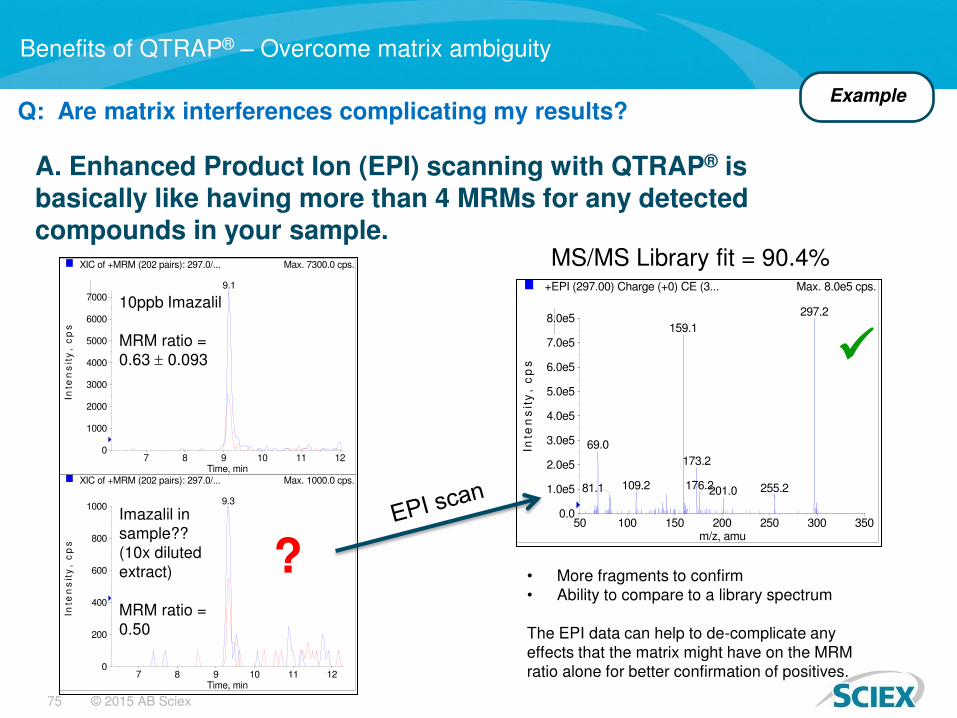
Q: Are matrix interferences complicating my results?
Benefits of QTRAP® – Overcome matrix ambiguity
A. Enhanced Product Ion (EPI) scanning with QTRAP® is basically like having more than 4 MRMs for any detected compounds in your sample.
s. XIC of +MRM (202 pairs): 297.0/... Max. 7300.0 cps.
7 8 9 10 11 12Time, min
0
1000
2000
3000
4000
5000
6000
7000
Inte
ns
ity
, c
ps
9.1
s. XIC of +MRM (202 pairs): 297.0/... Max. 1000.0 cps.
7 8 9 10 11 12Time, min
0
200
400
600
800
1000
Inte
ns
ity
, c
ps
9.3
10ppb Imazalil MRM ratio = 0.63 0.093
Imazalil in sample?? (10x diluted extract) MRM ratio = 0.50
?
s. +EPI (297.00) Charge (+0) CE (3... Max. 8.0e5 cps.
50 100 150 200 250 300 350m/z, amu
0.0
1.0e5
2.0e5
3.0e5
4.0e5
5.0e5
6.0e5
7.0e5
8.0e5
Inte
ns
ity
, c
ps
201.0
297.2159.1
69.0173.2
109.2 176.2 255.281.1
MS/MS Library fit = 90.4%
• More fragments to confirm • Ability to compare to a library spectrum
The EPI data can help to de-complicate any effects that the matrix might have on the MRM ratio alone for better confirmation of positives.
Example

76 © 2015 AB Sciex
Q: Am I sure of the positive hits? A: Your QTRAP® can give you that extra sense of security when confirming positives.
Benefits of QTRAP® – Added confidence
XIC of +MRM (150 pairs): 280.2/2... Max. 1.7e4 cps.
2 4 6 8 10 12 14Time, min
0.0
2000.0
4000.0
6000.0
8000.0
1.0e4
1.2e4
1.4e4
1.6e4
Inte
ns
ity
, c
ps
7.7
6.2
XIC of +MRM (150 pairs): 280.2/... Max. 2100.0 cps.
2 4 6 8 10 12 14Time, min
0
500
1000
1500
2000
Inte
ns
ity
, c
ps
7.9
10 ppb Metalaxyl Standard MRM ratio = 0.74
Metalaxyl in sample? (10x diluted extract)
?
. +EPI (280.00) CE (35) CES (15):... Max. 6.6e7 cps.
50 100 150 200 250 300 350 400m/z, amu
1.0e7
2.0e7
3.0e7
4.0e7
5.0e7
6.0e7
6.6e7
Inte
ns
ity
, c
ps
160.1
145.1 192.2
132.1 148.1 162.2220.3
134.0105.1248.3 280.3
. +EPI (280.20) Charge (+0) CE (3... Max. 3.3e5 cps.
50 100 150 200 250 300 350 400m/z, amu
5.0e4
1.0e5
1.5e5
2.0e5
2.5e5
3.0e5
3.3e5
Inte
ns
ity
, c
ps
280.3
220.3
192.4
148.3
202.3134.0
Library spectrum Metalaxyl
Unknown sample spectrum FIT for Metalaxyl = 23.6%
Calculated concentration = 13.3μg/kg MRM ratio = 0.72
MRM ratio would suggest this sample was positive for Metalaxyl RT was slightly off (but not unusual in food matrices)
Am I sure??
Example 1

77 © 2015 AB Sciex
Q: Am I sure of the positive hits? A: Your QTRAP® can give you that extra sense of security when confirming positives. Benefits of QTRAP® – Added confidence
XIC of +MRM (150 pairs): 280.2/2... Max. 1.7e4 cps.
2 4 6 8 10 12 14Time, min
0.0
2000.0
4000.0
6000.0
8000.0
1.0e4
1.2e4
1.4e4
1.6e4
Inte
ns
ity
, c
ps
7.7
6.2
XIC of +MRM (150 pairs): 280.2/... Max. 2100.0 cps.
2 4 6 8 10 12 14Time, min
0
500
1000
1500
2000
Inte
ns
ity
, c
ps
7.9
10 ppb Metalaxyl Standard MRM ratio = 0.74
Metalaxyl in sample? (10x diluted extract)
?
. +EPI (280.00) CE (35) CES (15):... Max. 6.6e7 cps.
50 100 150 200 250 300 350 400m/z, amu
1.0e7
2.0e7
3.0e7
4.0e7
5.0e7
6.0e7
6.6e7
Inte
ns
ity
, c
ps
160.1
145.1 192.2
132.1 148.1 162.2220.3
134.0105.1248.3 280.3
. +EPI (280.20) Charge (+0) CE (3... Max. 3.3e5 cps.
50 100 150 200 250 300 350 400m/z, amu
5.0e4
1.0e5
1.5e5
2.0e5
2.5e5
3.0e5
3.3e5
Inte
ns
ity
, c
ps
280.3
220.3
192.4
148.3
202.3134.0
Library spectrum Metalaxyl
Unknown sample spectrum FIT for Metalaxyl = 23.6%
Calculated concentration = 13.3μg/kg MRM ratio = 0.72
The EPI data can help to de-complicate the results for better confirmation of positives – or, in this case, confirmation that this peak is not Metalaxyl.
Example 1
78 © 2015 AB Sciex
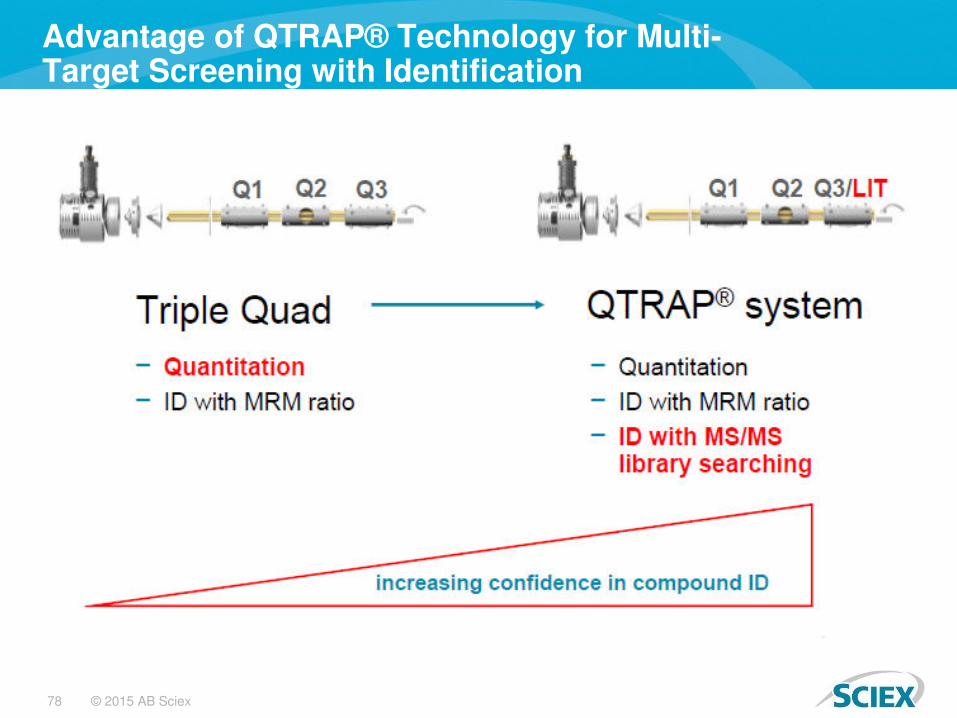
Advantage of QTRAP® Technology for Multi- Target Screening with Identification

79 © 2015 AB Sciex
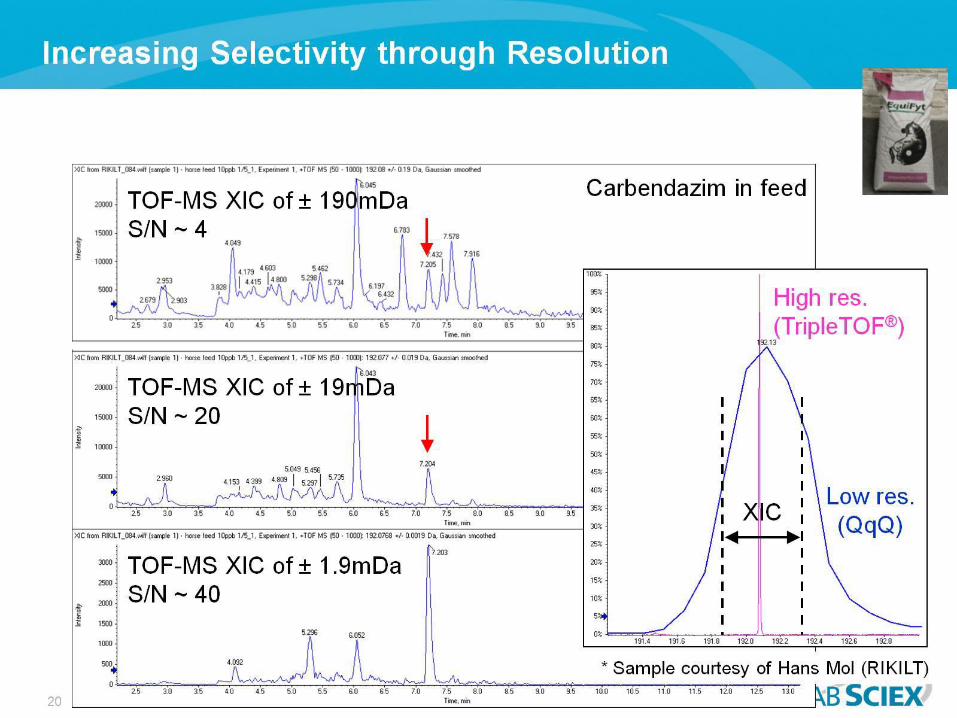
High Resolution Mass Spectrometry
Resolution measures of the ability to distinguish two peaks of slightly different mass-to-charge ratios ΔM, in a mass spectrum.
From Current protocols in Protein Science, J.Wiley and Sons 1996
Triple Quadrupole - Unit resolution

80 © 2015 AB Sciex
• HRMS instruments can be used for ‒ Accurate mass Measurements
‒ Helps in determining the elemental formula ‒ Collection of Full Scan Spectra
‒ Greater insight in to the m/z present in the sample ‒ High resolution Product Ion Spectra
‒ Insight in to the structural information ‒ Freedom to measure compounds without previous compound specific tuning
‒ Targeted Screening ‒ Identification of known molecules and confirmation using MS/MS
‒ Non Targeted Screening ‒ Identification of Unknown molecules
‒ Similarity check or cross sample comparison using HRMS data and statistical tools like PCA
‒ Possibility to retrospective analysis ‒ Possibility of high resolution quantitation
• Excellent technique to analyse multi-components in complex matrix
Role of High Resolution Mass Spectrometry

81 © 2015 AB Sciex

82 © 2015 AB Sciex

83 © 2015 AB Sciex

84 © 2015 AB Sciex

85 © 2015 AB Sciex

86 © 2015 AB Sciex

87 © 2015 AB Sciex
88 © 2015 AB Sciex

89 © 2015 AB Sciex

90 © 2015 AB Sciex
NEG

91 © 2015 AB Sciex

92 © 2015 AB Sciex

93 © 2015 AB Sciex

94 © 2015 AB Sciex
95 © 2015 AB Sciex
96 © 2015 AB Sciex

97 © 2015 AB Sciex
98 © 2015 AB Sciex
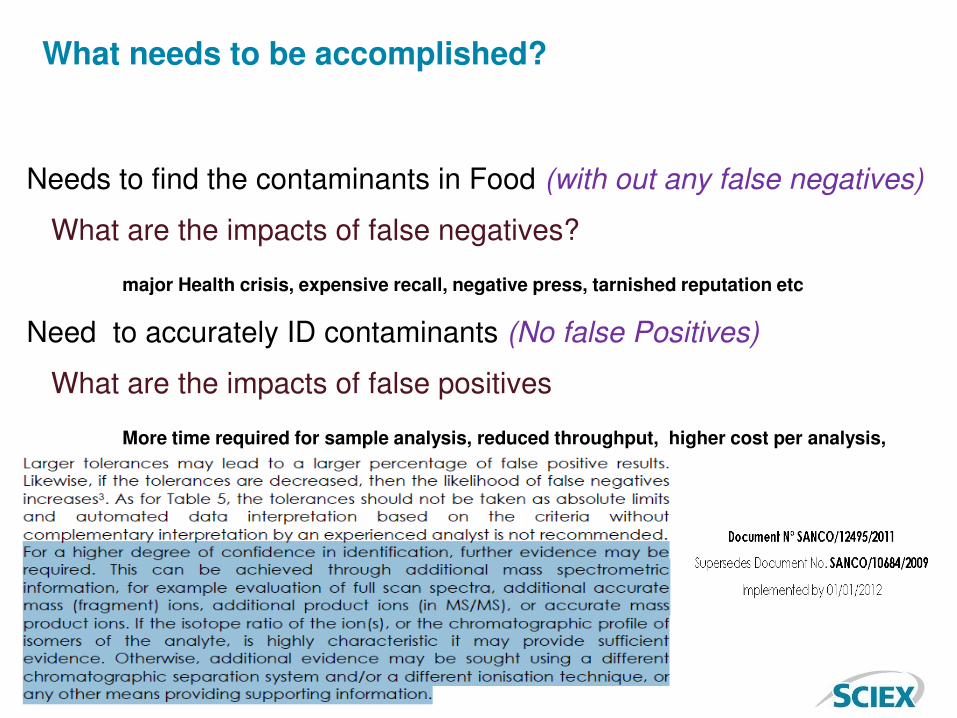
What needs to be accomplished?
Needs to find the contaminants in Food (with out any false negatives)
What are the impacts of false negatives?
major Health crisis, expensive recall, negative press, tarnished reputation etc
Need to accurately ID contaminants (No false Positives)
What are the impacts of false positives
More time required for sample analysis, reduced throughput, higher cost per analysis,
tarnished reputation

99 © 2015 AB Sciex
Improving confidence in results
Workflows Advantages
MRM based analysis – Triple Quads
•Gold standard for Quantitation •MRM is highly selective and sensitive •Targeted Quantitation applications
•Do not have Full Scan capabilities ( (no good sensitivity to generate Full Scan product Ion spectra on an LC scale) •Limited to only MRM Quant or targeted screening using MRM only
TRAP analysers Full scan capabilities are good for not used for high throughput Quantitation
Hybrid QTRAP 1. Work as a Triple Quad and as a TRAP, 2. Switch scan functions of QQQ to TRAP in 2 ms 3. MRM Quantitation Possible 4. High sensitive Product Ion Spectra on LC scale triggered on MRM
identification possible 5. Library Search using the Product ion Spectra Possible for Known
molecules 6. MRM based screening along with Library Search Possible for Known
molecules
QqTOF •Acquisition of Highly sensitive Full Scan MS spectra with high resolution and Mass accuracy •IDA can be used to collect high resolution MS/MS spectra and reliable compound identification using Library searching •Screening of Unknown compounds - possible

100 © 2015 AB Sciex
COE Focus Areas
• LC MS Training Programs
• Hands-on Workshops
• Method development assistance & Troubleshooting support
• Joint Research activities for qualified applications.
• Presale Demos and Sample analysis
Five key focus areas for the COE

101 © 2015 AB Sciex
LC-MS/MS method is a combination of things
Data Processing
Success of an LC/MS method
Is a combination of things
MS HPLC Sample Processing
Analytical Scientist
