advances in intelligent and soft computing 74 · eugénio c. ferreira ibb/ceb, university of minho...
TRANSCRIPT

Advances in Intelligent andSoft Computing 74Editor-in-Chief: J. Kacprzyk
Advances in Intelligent and Soft Computing
Editor-in-Chief
Prof. Janusz KacprzykSystems Research InstitutePolish Academy of Sciencesul. Newelska 601-447 WarsawPolandE-mail: [email protected]
Further volumes of this series can be found on our homepage: springer.com
Vol. 58. J. Mehnen, A. Tiwari,M. Köppen, A. Saad (Eds.)Applications of Soft Computing, 2009ISBN 978-3-540-89618-0
Vol. 59. K.A. Cyran,S. Kozielski, J.F. Peters,U. Stanczyk, A. Wakulicz-Deja (Eds.)Man-Machine Interactions, 2009ISBN 978-3-642-00562-6
Vol. 60. Z.S. Hippe,J.L. Kulikowski (Eds.)Human-Computer Systems Interaction, 2009ISBN 978-3-642-03201-1
Vol. 61. W. Yu, E.N. Sanchez (Eds.)Advances in ComputationalIntelligence, 2009ISBN 978-3-642-03155-7
Vol. 62. B. Cao,T.-F. Li, C.-Y. Zhang (Eds.)Fuzzy Information andEngineering Volume 2, 2009ISBN 978-3-642-03663-7
Vol. 63. Á. Herrero, P. Gastaldo,R. Zunino, E. Corchado (Eds.)Computational Intelligence in Security forInformation Systems, 2009ISBN 978-3-642-04090-0
Vol. 64. E. Tkacz, A. Kapczynski (Eds.)Internet – Technical Development andApplications, 2009ISBN 978-3-642-05018-3
Vol. 65. E. Kacki, M. Rudnicki,J. Stempczynska (Eds.)Computers in Medical Activity, 2009ISBN 978-3-642-04461-8
Vol. 66. G.Q. Huang,K.L. Mak, P.G. Maropoulos (Eds.)Proceedings of the 6th CIRP-SponsoredInternational Conference on DigitalEnterprise Technology, 2009ISBN 978-3-642-10429-9
Vol. 67. V. Snášel, P.S. Szczepaniak,A. Abraham, J. Kacprzyk (Eds.)Advances in Intelligent Web Mastering - 2, 2010ISBN 978-3-642-10686-6
Vol. 68. V.-N. Huynh, Y. Nakamori,J. Lawry, M. Inuiguchi (Eds.)Integrated Uncertainty Management andApplications, 2010ISBN 978-3-642-11959-0
Vol. 69. E. Pietka and J. Kawa (Eds.)Information Technologies in Biomedicine, 2010ISBN 978-3-642-13104-2
Vol. 70. XXX
Vol. 71. XXX
Vol. 72. J.C. Augusto, J.M. Corchado,P. Novais, C. Analide (Eds.)Ambient Intelligence and Future Trends, 2010ISBN 978-3-642-13267-4
Vol. 73. J.M. Corchado, P. Novais,C. Analide, J. Sedano (Eds.)Soft Computing Models in Industrial andEnvironmental Applications, 5th InternationalWorkshop (SOCO 2010), 2010ISBN 978-3-642-13160-8
Vol. 74. M.P. Rocha, F.F. Riverola, H. Shatkay,J.M. Corchado (Eds.)Advances in BioinformaticsISBN 978-3-642-13213-1

Miguel P. Rocha,Florentino Fernández Riverola, Hagit Shatkay,and Juan Manuel Corchado (Eds.)
Advances in Bioinformatics
4th International Workshop on PracticalApplications of Computational Biologyand Bioinformatics 2010 (IWPACBB 2010)
ABC

Editors
Miguel P. RochaDep. Informática / CCTCUniversidade do MinhoCampus de Gualtar4710-057 BragaPortugal
Florentino Fernández RiverolaEscuela Superior deIngeniería InformáticaEdificio Politécnico,Despacho 408Campus UniversitarioAs Lagoas s/n32004 OurenseSpainE-mail: [email protected]
Hagit ShatkayComputational Biology andMachine Learning LabSchool of ComputingQueen’s University KingstonOntario K7L 3N6CanadaE-mail: [email protected]
Juan Manuel CorchadoDepartamento de Informáticay AutomáticaFacultad de CienciasUniversidad de SalamancaPlaza de la Merced S/N37008 SalamancaSpainE-mail: [email protected]
ISBN 978-3-642-13213-1 e-ISBN 978-3-642-13214-8
DOI 10.1007/978-3-642-13214-8
Advances in Intelligent and Soft Computing ISSN 1867-5662
Library of Congress Control Number: 2010928117
c© 2010 Springer-Verlag Berlin Heidelberg
This work is subject to copyright. All rights are reserved, whether the whole or part of the material isconcerned, specifically the rights of translation, reprinting, reuse of illustrations, recitation, broadcasting,reproduction on microfilm or in any other way, and storage in data banks. Duplication of this publicationor parts thereof is permitted only under the provisions of the German Copyright Law of September 9,1965, in its current version, and permission for use must always be obtained from Springer. Violationsare liable for prosecution under the German Copyright Law.
The use of general descriptive names, registered names, trademarks, etc. in this publication does notimply, even in the absence of a specific statement, that such names are exempt from the relevant protectivelaws and regulations and therefore free for general use.
Typeset & Cover Design: Scientific Publishing Services Pvt. Ltd., Chennai, India.
Printed on acid-free paper
5 4 3 2 1 0
springer.com

Preface
The fields of Bioinformatics and Computational Biology have been growing steadily over the last few years boosted by an increasing need for computational techniques that can efficiently handle the huge amounts of data produced by the new experimental techniques in Biology. This calls for new algorithms and ap-proaches from fields such as Data Integration, Statistics, Data Mining, Machine Learning, Optimization, Computer Science and Artificial Intelligence.
Also, new global approaches, such as Systems Biology, have been emerging replacing the reductionist view that dominated biological research in the last dec-ades. Indeed, Biology is more and more a science of information needing tools from the information technology field. The interaction of researchers from differ-ent scientific fields is, more than ever, of foremost importance and we hope this event will contribute to this effort.
IWPACBB'10 technical program included a total of 30 papers (26 long papers and 4 short papers) spanning many different sub-fields in Bioinformatics and Computational Biology. Therefore, the technical program of the conference will certainly be diverse, challenging and will promote the interaction among computer scientists, mathematicians, biologists and other researchers.
We would like to thank all the contributing authors, as well as the members of the Program Committee and the Organizing Committee for their hard and highly valuable work. Their work has helped to contribute to the success of the IWAPCBB’10 event. IWPACBB’10 wouldn’t exist without your contribution.
Miguel Rocha Florentino Fernández Riverola IWPACBB’10 Organizing Co-chairs
Juan Manuel Corchado Hagit Shatkay
IWPACBB’10 Programme Co-chairs

Organization
General Co-chairs
Miguel Rocha University of Minho (Portugal) Florentino Riverola University of Vigo (Spain) Juan M. Corchado University of Salamanca (Spain) Hagit Shatkay Queens University, Ontario (Canada)
Program Committee
Juan M. Corchado (Co-chairman)
University of Salamanca (Spain)
Alicia Troncoso Universidad of Pablo de Olavide (Spain) Alípio Jorge LIAAD/INESC, Porto LA (Portugal) Anália Lourenço University of Minho (Portugal) Arlindo Oliveira INESC-ID, Lisboa (Portugal) Arlo Randall University of California Irvine (USA) B. Cristina Pelayo University of Oviedo (Spain) Christopher Henry Argonne National Labs (USA) Daniel Gayo University of Oviedo (Spain) David Posada Univ. Vigo (Spain) Emilio S. Corchado University of Burgos (Spain) Eugénio C. Ferreira IBB/CEB, University of Minho (Portugal) Fernando Diaz-Gómez University of Valladolid (Spain) Gonzalo Gómez-López UBio/CNIO, Spanish National Cancer Research
Centre (Spain) Isabel C. Rocha IBB/CEB, University of Minho (Portugal) Jesús M. Hernández University of Salamanca (Spain) Jorge Vieira IBMC, Porto (Portugal) José Adserias University of Salamanca (Spain) José L. López University of Salamanca (Spain) José Luís Oliveira Univ. Aveiro (Portugal) Juan M. Cueva University of Oviedo (Spain) Júlio R. Banga IIM/CSIC, Vigo (Spain)
OrganizationVIII
Kaustubh Raosaheb Patil Max-Planck Institute for Informatics(Germany) Kiran R. Patil Biocentrum, DTU (Denmark) Lourdes Borrajo University of Vigo (Spain) Luis M. Rocha Indiana University (USA) Manuel J. Maña López University of Huelva (Spain) Margarida Casal University of Minho (Portugal) Maria J. Ramos FCUP, University of Porto (Portugal) Martin Krallinger CNB, Madrid (Spain) Nicholas Luscombe EBI (UK) Nuno Fonseca CRACS/INESC, Porto (Portugal) Oscar Sanjuan University of Oviedo (Spain) Paulo Azevedo University of Minho (Portugal) Paulino Gómez-Puertas University Autónoma de Madrid (Spain) Pierre Balde University of California Irvine (USA) Rui Camacho LIACC/FEUP, University of Porto (Portugal) Rui Brito University of Coimbra (Portugal) Rui C. Mendes CCTC, University of Minho (Portugal) Sara Madeira IST/INESC, Lisboa (Portugal) Ségio Deusdado IP Bragança (Portugal) Vítor Costa University of Porto (Portugal)
Organizing Committee
Miguel Rocha (Co-chairman)
CCTC, Univ. Minho (Portugal)
Florentino Fernández Riverola (Co-chairman)
University of Vigo (Spain)
Juan F. De Paz University of Salamanca (Spain) Daniel Glez-Peña University of Vigo (Spain) José P. Pinto University of Minho (Portugal) Rafael Carreira University of Minho (Portugal) Simão Soares University of Minho (Portugal) Paulo Vilaça University of Minho (Portugal) Hugo Costa University of Minho (Portugal) Paulo Maia University of Minho (Portugal) Pedro Evangelista University of Minho (Portugal) Óscar Dias University of Minho (Portugal)
Contents
Microarrays
Highlighting Differential Gene Expression between TwoCondition Microarrays through Heterogeneous GenomicData: Application to Lesihmania infantum StagesComparison . . . . . . . . . . . . . . . . . . . . . . . . . . . . . . . . . . . . . . . . . . . . . . . . . 1Liliana Lopez Kleine, Vıctor Andres Vera Ruiz
An Experimental Evaluation of a Novel Stochastic Methodfor Iterative Class Discovery on Real Microarray Datasets . . . 9Hector Gomez, Daniel Glez-Pena, Miguel Reboiro-Jato,Reyes Pavon, Fernando Dıaz, Florentino Fdez-Riverola
Automatic Workflow during the Reuse Phase of a CBPSystem Applied to Microarray Analysis . . . . . . . . . . . . . . . . . . . . . . 17Juan F. De Paz, Ana B. Gil, Emilio Corchado
A Comparative Study of Microarray Data ClassificationMethods Based on Ensemble Biological Relevant GeneSets . . . . . . . . . . . . . . . . . . . . . . . . . . . . . . . . . . . . . . . . . . . . . . . . . . . . . . . . . 25Miguel Reboiro-Jato, Daniel Glez-Pena, Juan Francisco Galvez,Rosalıa Laza Fidalgo, Fernando Dıaz, Florentino Fdez-Riverola
Data Mining and Data Integration
Predicting the Start of Protein α-Helices Using MachineLearning Algorithms . . . . . . . . . . . . . . . . . . . . . . . . . . . . . . . . . . . . . . . . . 33Rui Camacho, Rita Ferreira, Natacha Rosa, Vania Guimaraes,Nuno A. Fonseca, Vıtor Santos Costa, Miguel de Sousa,Alexandre Magalhaes
X Contents
A Data Mining Approach for the Detection of High-RiskBreast Cancer Groups . . . . . . . . . . . . . . . . . . . . . . . . . . . . . . . . . . . . . . . 43Orlando Anunciacao, Bruno C. Gomes, Susana Vinga,Jorge Gaspar, Arlindo L. Oliveira, Jose Rueff
GRASP for Instance Selection in Medical Data Sets . . . . . . . . . 53Alfonso Fernandez, Abraham Duarte, Rosa Hernandez,Angel Sanchez
Expanding Gene-Based PubMed Queries . . . . . . . . . . . . . . . . . . . . 61Sergio Matos, Joel P. Arrais, Jose Luis Oliveira
Improving Cross Mapping in Biomedical Databases . . . . . . . . . . 69Joel Arrais, Joao E. Pereira, Pedro Lopes, Sergio Matos,Jose Luis Oliveira
An Efficient Multi-class Support Vector Machine Classifierfor Protein Fold Recognition . . . . . . . . . . . . . . . . . . . . . . . . . . . . . . . . . 77Wies�law Chmielnicki, Katarzyna Stapor, Irena Roterman-Konieczna
Feature Selection Using Multi-Objective EvolutionaryAlgorithms: Application to Cardiac SPECT Diagnosis . . . . . . . 85Antonio Gaspar-Cunha
Phylogenetics and Sequence Analysis
Two Results on Distances for Phylogenetic Networks . . . . . . . . 93Gabriel Cardona, Merce Llabres, Francesc Rossello
Cramer Coefficient in Genome Evolution . . . . . . . . . . . . . . . . . . . . 101Vera Afreixo, Adelaide Freitas
An Application for Studying Tandem Repeats inOrthologous Genes . . . . . . . . . . . . . . . . . . . . . . . . . . . . . . . . . . . . . . . . . . 109Jose Paulo Lousado, Jose Luis Oliveira, Gabriela Moura,Manuel A.S. Santos
Accurate Selection of Models of Protein Evolution . . . . . . . . . . . 117Mateus Patricio, Federico Abascal, Rafael Zardoya, David Posada
Scalable Phylogenetics through Input Preprocessing . . . . . . . . . 123Roberto Blanco, Elvira Mayordomo, Esther Montes, Rafael Mayo,Angelines Alberto
The Median of the Distance between Two Leaves in aPhylogenetic Tree . . . . . . . . . . . . . . . . . . . . . . . . . . . . . . . . . . . . . . . . . . . 131Arnau Mir, Francesc Rossello
Contents XI
In Silico AFLP: An Application to Assess What Is Neededto Resolve a Phylogeny . . . . . . . . . . . . . . . . . . . . . . . . . . . . . . . . . . . . . . 137Marıa Jesus Garcıa-Pereira, Armando Caballero, Humberto Quesada
Employing Compact Intra-Genomic Language Modelsto Predict Genomic Sequences and Characterize TheirEntropy . . . . . . . . . . . . . . . . . . . . . . . . . . . . . . . . . . . . . . . . . . . . . . . . . . . . . 143Sergio Deusdado, Paulo Carvalho
Biomedical Applications
Structure Based Design of Potential Inhibitors of SteroidSulfatase . . . . . . . . . . . . . . . . . . . . . . . . . . . . . . . . . . . . . . . . . . . . . . . . . . . . . 151Elisangela V. Costa, M. Emılia Sousa, J. Rocha,Carlos A. Montanari, M. Madalena Pinto
Agent-Based Model of the Endocrine Pancreas andInteraction with Innate Immune System . . . . . . . . . . . . . . . . . . . . . 157Ignacio V. Martınez Espinosa, Enrique J. Gomez Aguilera,Marıa E. Hernando Perez, Ricardo Villares,Jose Mario Mellado Garcıa
State-of-the-Art Genetic Programming for PredictingHuman Oral Bioavailability of Drugs . . . . . . . . . . . . . . . . . . . . . . . . 165Sara Silva, Leonardo Vanneschi
Pharmacophore-Based Screening as a Clue for theDiscovery of New P-Glycoprotein Inhibitors . . . . . . . . . . . . . . . . . 175Andreia Palmeira, Freddy Rodrigues, Emılia Sousa, Madalena Pinto,M. Helena Vasconcelos, Miguel X. Fernandes
Bioinformatics Applications
e-BiMotif: Combining Sequence Alignment and Biclusteringto Unravel Structured Motifs . . . . . . . . . . . . . . . . . . . . . . . . . . . . . . . . 181Joana P. Goncalves, Sara C. Madeira
Applying a Metabolic Footprinting Approach toCharacterize the Impact of the Recombinant ProteinProduction in Escherichia Coli . . . . . . . . . . . . . . . . . . . . . . . . . . . . . . 193Sonia Carneiro, Silas G. Villas-Boas, Isabel Rocha,Eugenio C. Ferreira

XII Contents
Rbbt: A Framework for Fast Bioinformatics Developmentwith Ruby . . . . . . . . . . . . . . . . . . . . . . . . . . . . . . . . . . . . . . . . . . . . . . . . . . . 201Miguel Vazquez, Ruben Nogales, Pedro Carmona, Alberto Pascual,Juan Pavon
Analysis of the Effect of Reversibility Constraints on thePredictions of Genome-Scale Metabolic Models . . . . . . . . . . . . . . 209Jose P. Faria, Miguel Rocha, Rick L. Stevens, Christopher S. Henry
Enhancing Elementary Flux Modes Analysis UsingFiltering Techniques in an Integrated Environment . . . . . . . . . . 217Paulo Maia, Marcellinus Pont, Jean-Francois Tomb, Isabel Rocha,Miguel Rocha
Genome Visualization in Space . . . . . . . . . . . . . . . . . . . . . . . . . . . . . . 225Leandro S. Marcolino, Braulio R.G.M. Couto, Marcos A. dos Santos
A Hybrid Scheme to Solve the Protein Structure PredictionProblem . . . . . . . . . . . . . . . . . . . . . . . . . . . . . . . . . . . . . . . . . . . . . . . . . . . . 233Jose C. Calvo, Julio Ortega, Mancia Anguita
Author Index . . . . . . . . . . . . . . . . . . . . . . . . . . . . . . . . . . . . . . . . . . . . . . . . 241

M.P. Rocha et al. (Eds.): IWPACBB 2010, AISC 74, pp. 1–8, 2010. springerlink.com © Springer-Verlag Berlin Heidelberg 2010
Highlighting Differential Gene Expression between Two Condition Microarrays through Heterogeneous Genomic Data: Application to Lesihmania infantum Stages Comparison
Liliana López Kleine and Víctor Andrés Vera Ruiz
1
Abstract. Classical methods for the detection of gene expression differences be-tween two microarray conditions often fail to detect interesting and important differences, because they are weak in comparison with the overall variability. Therefore, methodologies that highlight weak differences are needed. Here, we propose a method that allows the fusion of other genomic data with microarray data and show, through an example on L. infantum microarrays comparing pro-mastigote and amastigote stages, that differences between the two microarray conditions are highlighted. The method is flexible and can be applied to any organism for which microarray and other genomic data is available.
1 Introduction
Protozoan of the genus Leishmania are parasites that are transmitted by blood-feeding insect vectors to mammalian hosts, and cause a number of important hu-man diseases, collectively referred as leishmaniasis. During their life cycle, these parasites alternate between two major morphologically distinct developmental stages. In the digestive tract of the sandfly vector, they exist as extracellular elon-gated, flagellated, and motile promastigotes that are exposed to pH 7 and fluctuat-ing temperatures averaging 25ºC. Upon entry into a mammalian host, they reside in mononuclear phagocytes or macrophages (37ªC), wherein they replicate as cir-cular, aflagellated and non-motile amastigotes. In order to survive, these two ex-treme environments, Leishmania sp. (L. sp) has developed regulatory mechanisms that result in important morphological and biochemical adaptations [1, 2, 3].
1 Liliana López Kleine . Victor Andrés Vera Ruiz Universidad Nacional de Colombia (Sede Bogotá), Cra 30, calle 45, Statistics Department e-mail: [email protected], [email protected]
2 L.L. Kleine and V.A.V. Ruiz
Microarray studies allow measuring the expression level of thousands of genes at the same time by just one hybridization experiment and the comparison of two conditions (here the development stages of L. Sp.). Several microarray analyses have been done to study global gene expression in developmental stages of L. sp. [3, 4, 5]. Results show that L. sp genome can be considered to be constitutively expressed, as more than 90% of the genes is expressed in the same amount in both stages, and that only a limited number (7-9.3%) of genes show stage-specific ex-pression [3, 6]. Furthermore, no metabolic pathway or cell function characteristic of any stage has been detected [3, 4, 6, 7, 8, 9]. This is an astonishing result be-cause morphological and physiological differences between the two stages are huge, indicating that different specialized stage proteins are needed and therefore gene expression should change. In order to explain the weak differences in gene expression between both stages, it has been proposed that regulations and adaptations take place after translation and not at the gene expression level [10].
The detection of gene expression differences has been of great interest [11], as an understanding of the adaptation and resistance factors of Leishmania sp. can provide interesting therapeutic targets. Analytical methods used until now, even improved ones such as the Gene Set Enrichment Analysis [13], have difficulties in the determination of differences between gene expression in both L. sp. life cycle stages because in the context of global gene expression variation, the detection of weak differences is not possible using classical methods. Microarray data analysis can still be improved if a way to highlight weak differences in gene expression between L. sp. stages is found.
The present method consists of using additional information to the microarrays to achieve this. It allows incorporating different genomic and post-genomic data (positions of genes on the chromosome, metabolic pathways, phylogenetic pro-files, etc.) to detect differences between two experimental microarray conditions The method can be applied to detect gene expression differences between any two conditions and for all completely sequenced organisms if genomic data are available. It will be especially useful for the comparison of conditions in which apparently, using classical methods, gene expression seems small.
To apply the proposed strategy, four steps need to be taken: i) Database con-struction of the genomic data for the same genes that are present on the microarray, ii) kernel construction and parameter estimation, iii) determination of differences in gene expression between two microarray conditions at the kernel level, and iv) interpretation of differences in regard of the original microarray data.
In the present work, we apply the proposed methodology to determine differ-ences between L. infantum amastigotes and promastigotes microarray data ob-tained by Rochette et al [3]. The methodology is proposed for all genes of a microarray data set. Nevertheless, taking into account the interest in determining adaptation and defense mechanisms in the pathogen, we concentrated on genes that could explain the adaptation and resistance of L. sp. to the environmental changes between a promastigote and an amastigote. Therefore, we searched pri-marily for changes in expression of 180 known and putative transport proteins and stress factors.
Highlighting Differential Gene Expression between Two Condition Microarrays 3
2 Methodology
2.1 Data Base Construction of Microarray and Genomic Data
2.1.1 Microarrays The data used are microarray data from Rochette et al. [3]. From these data, we extracted only the expression data comparing promastigotes and amastigotes of L. infantum (8317 genes for 14 replicates). Microarray data was downloaded from the NCBI’s GEO Datasets [14] (accession number GSE10407). We worked with normalized and log2 transformed gene expression intensities from the microarray data obtained by Rochette and colleagues [3].
2.1.2 Phylogenetic Profiles They were constructed using the tool Roundup proposed by DeLuca et al [15] (http://rodeo.med.harvard.edu/tools/roundup) which allows the extraction of the presence or absence of all genes of an organism in other organisms chosen by the user. The result can be retrieved as a phylogenetic profile matrix of presence and absence (0,1) of each L. sp. gene in the genomes of the other organisms. We generated a phylogenetic profile matrix for 30 organisms(1) and 2599 genes of L. infantum sharing common genes.
(1)A._thaliana, Bacillus_subtilis, C._elegans, Coxiella_burnetii (Cb), Cb_CbuG_Q212, Cb_Dugway_7E9-12, Cb_RSA_331, D._melanogaster, Enterobac-ter_638, E._faecalis_V583, Escherichia_coli_536, H._sapiens, Lactobacil-lus_plantarum, Lactococcus._lactis, Listeria_innocua, L._monocytogenes, Mycobac-terium_bovis, M._leprae, Nostoc_sp, P._falciparum, Pseudomonas_putida_KT2440, S._cerevisiae, Salmonella_enterica_Paratypi_ATCC_9150, Staphylococ-cus_aureus_COL, Staphylococcus_epidermidis_ATCC_12228, Streptococ-cus_mutans, S._pyogenes_MGAS10394, S._pyogenes_MGAS10750, T._brucei, V._cholerae
2.1.3 Presence of Genes on Chromosomes For the same 8317 genes we obtained the presence of each of them on the 36 chromosomes of L. infantum. This information was obtained directly from the gene name as registered in NCBI (http://www.ncbi.nlm.nih.gov/) and used to con-struct a presence and absence (0,1) table for each gene in each chromosome (8317 x 36).
2.1.4 Genes of Interest We constructed a list of 180 genes coding for known or putative transporters and stress factors annotated with these functions in GeneDB (http://www.genedb.org//genedb/).
Once all data types were obtained, determining genes present in all databases was done automatically using functions written in R [16]. Without taking into ac-count the 180 genes of interest, 2092 genes were common to microarrays, pres-ence on the chromosomes and phylogenetic profiles. Using only the 180 genes of interest, we obtained a list of 161 genes common to all 3 datasets.

4 L.L. Kleine and V.A.V. Ruiz
2.2 Kernel Construction
We built a kernel similarity matrix for each data type. These representations allow the posterior fusion of heterogeneous data. Data are not represented individually, but through the pair-wise comparison of objects (here 161 genes). The comparison is expressed as the similarity between objects through the data. A comparison function of type RXXk →×: is used and the data are represented by a
nn × comparison matrix: ),(, jiji xxkk = [17]. Kernels are semi definite posi-
tive matrices, and can be used in several kernel algorithms [17]. There are differ-ent ways to construct a kernel. The simplest kernels are linear and Gaussian. They have been used for genomic and post-genomic data in previous works, which aimed to infer biological knowledge by the analysis of heterogeneous data [18].
We built Gaussian kernels for all data-types: ( )( )
22
,
,σ
ji xxd
ji exxk−
= ,where σ is a
parameter and d is an Euclidian distance. The constructed kernels were: KA1 for the gene expression data on amastigotes, KP1 for the gene expression data on promastigotes, K2 for the phylogenetic profiles and K3 for the presence on the chromosomes. The parameters associated to each kernel were sigma1A, sigma1P, sigma2, sigma3.
Then, we constructed two unique kernels KA1sum and KP1sum for the gene expres-sion data together with the other types of data by addition:
33221),(11),( KwKwKwK PAsumPA ++= , where w are weights and considered
also as parameters. Taking into account the objectives of the present work (detection of gene ex-
pression differences between amastigote and promastigote microarray), parame-ters sigma and w were found using a search algorithm evaluating all combination of parameters, that optimized the difference between KA1sum and KP1sum. The crite-rion was the minimum covariance between both kernels. The values tested for σ were: 0.01,0.1,0.5,1,10,15,50 and the values tested for w were 0,0.1,0.5,0.9.
2.3 Detection of Differences between Amastigote and Promastigote Gene Expression
Differences in similarity and gene expression
Kernels KA1sum and KP1sum were compared to detect differences in gene expression between both L. infantum stages by computing a Dif matrix as follows: Dif = KA1sum - KP1sum. The resulting matrix values were ordered, and those with higher value than a certain threshold were retained. The same was done for the kernels without integration of other data types, the ones constructed only based on the mi-croarray data: KA1 and KP1. Two thresholds used were: 10% (T1) and 20% (T2) of the maximum distance value found in Dif.
Subsequently, a list of pairs of genes implicated in each change of similarity is generated. To interpret this change in similarity we returned to the original

Highlighting Differential Gene Expression between Two Condition Microarrays 5
microarray data and calculated the sum of gene expression intensities in each con-dition. This allows to determine which one of the two genes is responsible for the similarity change and finally to identify potential targets that explain the differences that occur for L. infantum adaptations during its life cycle. R code is available under request: [email protected].
The most interesting targets (which show the highest difference or are present repeatedly on the list), are candidates to perform wet-lab experiments.
3 Results and Discussion
The parameters that were determined by the search algorithm to maximize differ-ences between amastigote and promastigote gene expression are shown in table 1.
Table 1 Parameters obtained optimizing differences between amastigote and promastigote gene expression
Kernel KA1 KP1 K2 K3
Sigma 1 1 15 50
Weight 0.9 0.9 0 0.1
K2 seemed not to be useful to highlight the differences between gene expres-
sions in both stages. Nevertheless, phylogenetic profiles have shown to be infor-mative in other studies, i.e., for the determination of protein functions [18, 19]. It is possible that either phylogenetic profiles are definitely not useful to highlight the differences between the two conditions analyzed here, or that the organisms that were chosen to construct the profiles are phylogenetically too distant from L. infantum and therefore poorly informative. The fact that only a few genes are pre-sent in most of them (data not shown), corroborates the second explanation and opens the possibility that phylogenetic profiles could be useful if appropriate organisms were chosen.
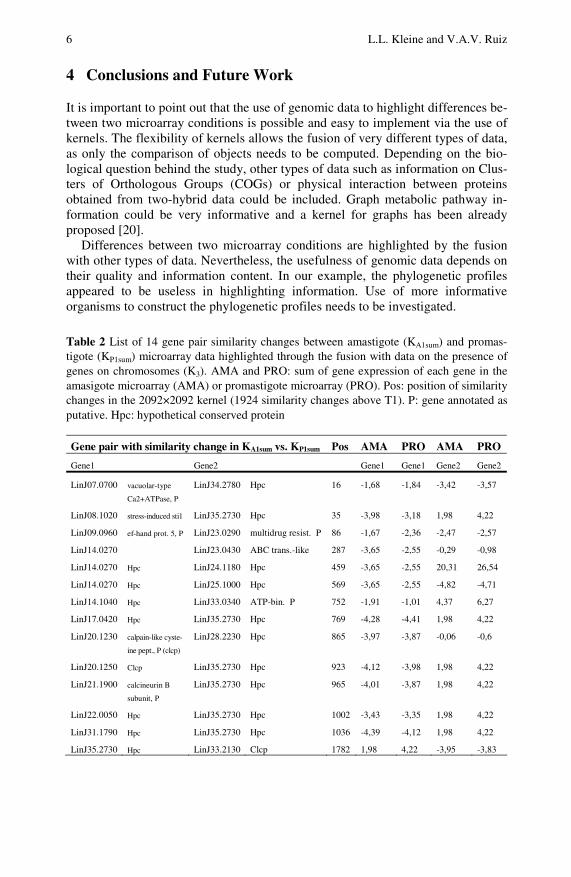
The result of the parameter search leaves only the K3 kernel with a low weight (0.1) to be added to the microarray data kernels. This indicates that apparently the fusion with data other than microarrays is not useful. Nevertheless, the results ob-tained when similarity changes were detected indicates that including K3 is indeed useful. The differences detected between KA1 and KP1 (based only on microarray data) implicate a change in only 10 similarities for threshold 1 (T1) and 44 changes for T2 using the 161×161 kernel. The fusion with K3 allows the detection of more differences: 14 for T1 and 61 for T2. The 14 gene pairs which show simi-larity changes for above T1 in the fusion kernels are shown in Table 2. As the be-havior of the genes of interest should be regarded in the context of all the genes, the position of these similarity changes when all genes (2092) are analyzed is im-portant. Using these 2092, 1924 similarity changes are detected above T1. The po-sition (Pos) in the 1924 list of genes of interest is also indicated in Table 2 for comparison.
6 L.L. Kleine and V.A.V. Ruiz
4 Conclusions and Future Work
It is important to point out that the use of genomic data to highlight differences be-tween two microarray conditions is possible and easy to implement via the use of kernels. The flexibility of kernels allows the fusion of very different types of data, as only the comparison of objects needs to be computed. Depending on the bio-logical question behind the study, other types of data such as information on Clus-ters of Orthologous Groups (COGs) or physical interaction between proteins obtained from two-hybrid data could be included. Graph metabolic pathway in-formation could be very informative and a kernel for graphs has been already proposed [20].
Differences between two microarray conditions are highlighted by the fusion with other types of data. Nevertheless, the usefulness of genomic data depends on their quality and information content. In our example, the phylogenetic profiles appeared to be useless in highlighting information. Use of more informative organisms to construct the phylogenetic profiles needs to be investigated.
Table 2 List of 14 gene pair similarity changes between amastigote (KA1sum) and promas-tigote (KP1sum) microarray data highlighted through the fusion with data on the presence of genes on chromosomes (K3). AMA and PRO: sum of gene expression of each gene in the amasigote microarray (AMA) or promastigote microarray (PRO). Pos: position of similarity changes in the 2092×2092 kernel (1924 similarity changes above T1). P: gene annotated as putative. Hpc: hypothetical conserved protein
Gene pair with similarity change in KA1sum vs. KP1sum Pos AMA PRO AMA PRO
Gene1 Gene2 Gene1 Gene1 Gene2 Gene2
LinJ07.0700 vacuolar-type
Ca2+ATPase, P
LinJ34.2780 Hpc 16 -1,68 -1,84 -3,42 -3,57
LinJ08.1020 stress-induced sti1 LinJ35.2730 Hpc 35 -3,98 -3,18 1,98 4,22
LinJ09.0960 ef-hand prot. 5, P LinJ23.0290 multidrug resist. P 86 -1,67 -2,36 -2,47 -2,57
LinJ14.0270 LinJ23.0430 ABC trans.-like 287 -3,65 -2,55 -0,29 -0,98
LinJ14.0270 Hpc LinJ24.1180 Hpc 459 -3,65 -2,55 20,31 26,54
LinJ14.0270 Hpc LinJ25.1000 Hpc 569 -3,65 -2,55 -4,82 -4,71
LinJ14.1040 Hpc LinJ33.0340 ATP-bin. P 752 -1,91 -1,01 4,37 6,27
LinJ17.0420 Hpc LinJ35.2730 Hpc 769 -4,28 -4,41 1,98 4,22
LinJ20.1230 calpain-like cyste-
ine pept., P (clcp)
LinJ28.2230 Hpc 865 -3,97 -3,87 -0,06 -0,6
LinJ20.1250 Clcp LinJ35.2730 Hpc 923 -4,12 -3,98 1,98 4,22
LinJ21.1900 calcineurin B
subunit, P
LinJ35.2730 Hpc 965 -4,01 -3,87 1,98 4,22
LinJ22.0050 Hpc LinJ35.2730 Hpc 1002 -3,43 -3,35 1,98 4,22
LinJ31.1790 Hpc LinJ35.2730 Hpc 1036 -4,39 -4,12 1,98 4,22
LinJ35.2730 Hpc LinJ33.2130 Clcp 1782 1,98 4,22 -3,95 -3,83

Highlighting Differential Gene Expression between Two Condition Microarrays 7
The present work opens the possibility of implementing a kernel method that will allow determining differences in a more precise way once the data are fused. The detection of differences can be improved in several ways. Here, only a pre-liminary and very simple comparison of similarities is proposed. The kernel method could be based on multidimensional scaling via the mapping of both kernels on a common space that could allow the measure of distances between similarities on that space.
Although differences between kernels are ordered, having a probability associ-ated to each difference would be useful. This could be achieved by a bootstrapping procedure or a matrix permutation test.
References
[1] McConville, M.J., Turco, S.J., Ferguson, M.A.J., Saks, D.L.: Developmental modifi-cation of lipophosphoglycan during the differentiation of Leishmania major promas-tigotes to an infectious stage. EMBO J. 11, 3593–3600 (1992)
[2] Zilberstein, D., Shapira, M.: The role of pH and temperature in the development of Leishmania parasites. Annu. Rev. Microbiol. 48, 449–470 (1994)
[3] Rochette, A., Raymond, F., Ubeda, J.M., Smith, M., Messier, N., Boisvert, S., Ri-gault, P., Corbeil, J., Ouellette, M., Papadopoulou, B.: Genome-wide gene expression profiling analysis of Leishmania major and Leishmania infantum developmental stages reveals substantial differences between the two species. BMC Genomics 9, 255–280 (2008)
[4] Cohen-Freue, G., Holzer, T.R., Forney, J.D., McMaster, W.R.: Global gene expres-sion in Leishmania. Int. J. Parasitol. 37, 1077–1086 (2007)
[5] Leifso, K., Cohen-Freue, G., Dogra, N., Murray, A., McMaster, W.R.: Genomic and proteomic expression analysis of Leishmania promastigote and amastigote life stages: the Leishmania genome is constitutively expressed. Mol. Biochem. Parasitol. 152, 35–46 (2007)
[6] Saxena, A., Lahav, T., Holland, N., Aggarwal, G., Anupama, A., Huang, Y., Volpin, H., Myler, P.J., Zilberstein, D.: Analysis of the Leishmania donovani transcriptome reveals an ordered progression of transient and permanent changes in gene expression during differentiation. Mol. Biochem. Parasitol 52, 53–65 (2007)
[7] Ivens, A.C., Lewis, S.M., Bagherzadeh, A.: A physical map of Leishmania major friedlin genome. Genome Res. 8, 135–145 (1998)
[8] Holzer, T.R., McMaster, W.R., Forney, J.D.: Expression profiling by whole-genome interspecies microarray hybridization reveals differential gene expression in procyclic promastigotes, lesion-derived amastigotes, and axenic amastigotes in Leishmania mexicana. Mol. Biochem. Parasitol 146, 198–218 (2006)
[9] McNicoll, F., Drummelsmith, J., Müller, M., Madore, E., Boilard, N., Ouellette, M., Papadopoulou, B.: A combined proteomic and transcriptomic approach to the study of stage differentiation in Leishmania infantum. Proteomics 6, 3567–3581 (2006)
[10] Rosenzweig, D., Smith, D., Opperdoes, F., Stern, S., Olafson, R.W., Zilberstein, D.: RetoolingLeishmania metabolism: from sand fly gut to human macrophage. FASEB J. (2007), doi:10.1096/fj.07-9254com
[11] Lynn, M.A., McMaster, W.R.: Leishmania: conserved evolution-diverse diseases. Trends Parasitol 24, 103–105 (2008)

8 L.L. Kleine and V.A.V. Ruiz
[12] Storey, J.D., Tibshirani, R.: Statistical significance for genome-wide experiments. Proc. Natl. Acad. Sci. 100, 9440–9445 (2003)
[13] Subramanian, A., Tamayo, P., Mootha, V.K., Mukherjee, S., Ebert, B.L., Gillette, M.A., Paulovich, A., Pomeroy, S.L., Golub, T.R., Lander, E.S., Mesirov, J.P.: Gene set enrichment analysis: A knowledge-based approach for interpreting genome-wide expression profiles. PNAS 102, 15545–15550 (2005)
[14] Edgar, R., Domrachev, M., Lash, A.E.: Gene Expression Omnibus: NCBI gene ex-pression and hybridization array data repository. Nucleic Acid Res. 30, 207–210 (2002)
[15] DeLuca, T.F., Wu, I.H., Pu, J., Monaghan, T., Peshkin, L., Singh, S., Wall, D.P.: Roundup: a multi-genome repository of orthologs and evolutionary distances. Bioin-formatics 22, 2044–2046 (2006)
[16] R Development Core Team R: A language and environment for statistical computing. R Foundation for Statistical Computing. Vienna, Austria (2005), ISBN 3-900051-07-0, http://www.R-project.org
[17] Vert, J., Tsuda, K., Schölkopf, B.: A primer on kernels. In: Schölkopf, B., Tsuda, K., Vert, J. (eds.) Kernel methods in computational biology. The MIT Press, Cambridge (2004)
[18] Yamanishi, Y., Vert, J.P., Nakaya, A., Kaneisha, M.: Extraction of correlated clusters from multiple genomic data by generalized kernel canonical correlation analysis. Bio-informatics 19, 323–330 (2003)
[19] López Kleine, L., Monnet, V., Pechoux, C., Trubuil, A.: Role of bacterial peptidase F inferred by statistical analysis and further experimental validation. HFSP J. 2, 29–41 (2008)
[20] Kondor, R.I., Lafferty, J.: Diffusion kernels on graphs and other discrete structures. In: Sammut, C., Hoffmann, A.G. (eds.) Machine learning: proceedings of the 19th in-ternational conference. Morgan Kaufmann, San Francisco (2002)
M.P. Rocha et al. (Eds.): IWPACBB 2010, AISC 74, pp. 9–16, 2010. springerlink.com © Springer-Verlag Berlin Heidelberg 2010
An Experimental Evaluation of a Novel Stochastic Method for Iterative Class Discovery on Real Microarray Datasets
Héctor Gómez, Daniel Glez-Peña, Miguel Reboiro-Jato, Reyes Pavón, Fernando Díaz, and Florentino Fdez-Riverola
1
Abstract. Within a gene expression matrix, there are usually several particular macroscopic phenotypes of samples related to some diseases or drug effects, such as diseased samples, normal samples or drug treated samples. The goal of sample-based clustering is to find the phenotype structures of these samples. A novel method for automatically discovering clusters of samples which are coherent from a genetic point of view is evaluated on publicly available datasets. Each possible cluster is characterized by a fuzzy pattern which maintains a fuzzy discretization of relevant gene expression values. Possible clusters are randomly constructed and iteratively refined by following a probabilistic search and an optimization schema.
Keywords: microarray data, fuzzy discretization, gene selection, fuzzy pattern, class discovery, simulated annealing.
1 Introduction
Following the advent of high-throughput microarray technology it is now possible to simultaneously monitor the expression levels of thousands of genes during important biological processes and across collections of related samples. In this
1 Héctor Gómez . Daniel Glez-Peña . Miguel Reboiro-Jato . Reyes Pavón Florentino Fdez-Riverola ESEI: Escuela Superior de Ingeniería Informática, University of Vigo, Edificio Politécnico, Campus Universitario As Lagoas s/n, 32004, Ourense, Spain e-mail: [email protected], {dgpena, mrjato, pavon, riverola}@uvigo.es
Fernando Díaz EUI: Escuela Universitaria de Informática, University of Valladolid, Plaza Santa Eulalia, 9-11, 40005, Segovia, Spain e-mail: [email protected]

10 H. Gómez et al.
context, sample-based clustering is one of the most common methods for discov-ering disease subtypes as well as unknown taxonomies. By revealing hidden struc-tures in microarray data, cluster analysis can potentially lead to more tailored therapies for patients as well as better diagnostic procedures.
From a practical point of view, existing sample-based clustering methods can be (i) directly applied to cluster samples using all the genes as features (i.e., classical techniques such as K-means, SOM, HC, etc.) or (ii) executed after a set of informa-tive genes are identified. The problem with the first approach is the signal-to-noise ratio (smaller than 1:10), which is known to seriously reduce the accuracy of cluster-ing results due to the existence of noise and outliers of the samples [1]. To overcome such difficulties, particular methods can be applied to identify informative genes and reduce gene dimensionality prior to clustering samples in order to detect their phenotypes. In this context, both supervised and unsupervised informative gene selection techniques have been developed.
While supervised informative gene selection techniques often yield high clus-tering accuracy rates, unsupervised informative gene selection methods are more complex because they assume no a priori phenotype information being assigned to any sample [2]. In such a situation, two general strategies have been adopted to address the lack of prior knowledge: (i) unsupervised gene selection, this aims to reduce the number of genes before clustering samples by using appropriate statis-tical models and (ii) interrelated clustering, that takes advantage of utilizing the re-lationship between the genes and samples to perform gene selection and sample clustering simultaneously in an iterative paradigm. Following the second strategy for unsupervised informative gene selection (interrelated clustering), Ben-Dor et al. [3] present an approach based on statistically scoring candidate partitions ac-cording to the overabundance of genes that separate the different classes. Xing and Karp [1] use a feature filtering procedure for ranking features according to their intrinsic discriminability and irredundancy to other relevant features. Their clus-tering algorithm is based on the concept of a normalized cut for grouping samples in new reference partition. Von Heydebreck et al. [4] and Tang et al. [5] propose algorithms for selecting sample partitions and corresponding gene sets by defining an indicator of partition quality and a search procedure to maximize this parame-ter. Varma and Simon [6] describe an algorithm for automatically detecting clus-ters of samples that are discernable only in a subset of genes.
In this contribution we are focused in the evaluation a novel simulated anneal-ing-based algorithm for iterative class discovery. The rest of the paper is structured as follows: Section 2 sketches the proposed method and introduces the relevant as-pects of the technique. Section 3 presents the experimental setup carried out and the results obtained from a publicly available microarray data set. Section 4 com-prises a discussion about the obtained results by the proposed technique. Finally, Section 5 summarizes the main conclusions extracted from this work.
2 Overview of the Iterative Class Discovery Algorithm
In this article we propose a simulated annealing-based algorithm for iterative class discovery that uses a novel fuzzy logic method for informative gene selection. The
An Experimental Evaluation of a Novel Stochastic Method 11
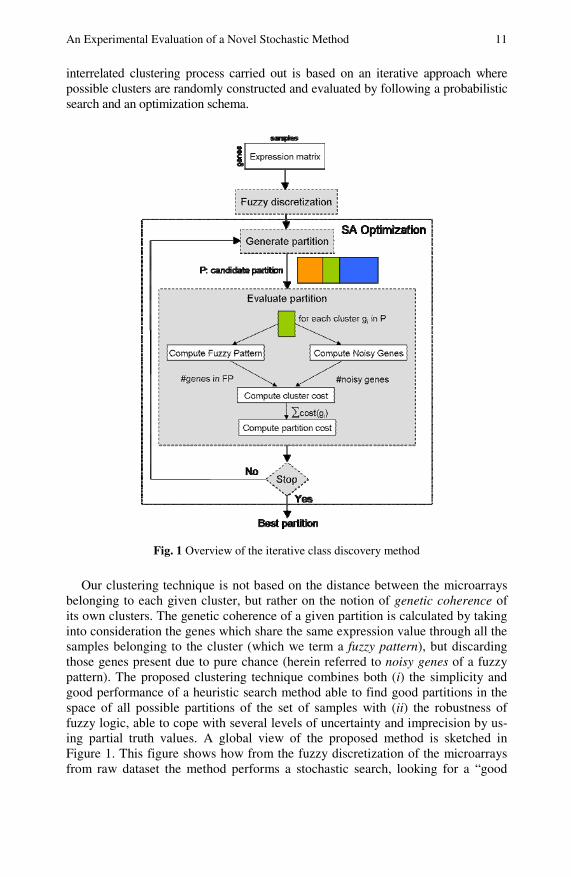
interrelated clustering process carried out is based on an iterative approach where possible clusters are randomly constructed and evaluated by following a probabilistic search and an optimization schema.
Fig. 1 Overview of the iterative class discovery method
Our clustering technique is not based on the distance between the microarrays belonging to each given cluster, but rather on the notion of genetic coherence of its own clusters. The genetic coherence of a given partition is calculated by taking into consideration the genes which share the same expression value through all the samples belonging to the cluster (which we term a fuzzy pattern), but discarding those genes present due to pure chance (herein referred to noisy genes of a fuzzy pattern). The proposed clustering technique combines both (i) the simplicity and good performance of a heuristic search method able to find good partitions in the space of all possible partitions of the set of samples with (ii) the robustness of fuzzy logic, able to cope with several levels of uncertainty and imprecision by us-ing partial truth values. A global view of the proposed method is sketched in Figure 1. This figure shows how from the fuzzy discretization of the microarrays from raw dataset the method performs a stochastic search, looking for a “good

12 H. Gómez et al.
partition” of microarrays in order to maximize the genetic coherence of each one cluster within the tentative partition.
3 Experimental Results
In this Section we evaluate the proposed algorithm on two public microarray data-sets, herein referred to as HC-Salamanca dataset [7] and Armstrong dataset [8].
3.1 The HC-Salamanca Dataset
This dataset consists of bone marrow samples from 43 adult patients with de novo diagnosed acute myeloid leukemia (AML) – 10 acute promyelocytic leukemias (APL) with t(15;17), 4 AML with inv(16), 7 monocytic leukemias and 22 non-monocytic leukemias, according to the WHO classification. All samples contained more than 80% blast cells and they were analyzed using high-density oligonucleo-tide microarrays (specifically, the Affymetrix GeneChip Human Genome U133A Array) [7]. In [7], hierarchical clustering analysis segregated APL, AML with inv(16), monocytic leukemias and the remaining AML into separate groups, so we consider this partition as the reference classification for validating our proposed technique in the following experimentation.
As each execution of the simulated annealing algorithm gives a different result (due the stochastic nature of the search), then for each available microarray has been computed the percentage of the times that it has been grouped together with other microarrays belonging to the reference groups (APL, AML with inversion, Monocytic and Other AML) in ten executions of the whole algorithm. The per-centage of times (on average) in which microarrays of each reference cluster have been grouped together with microarrays belonging to different classes is shown in each row of Table 1. This table can be interpreted as a confusion matrix numeri-cally supporting the facts commented above, since the APL and Other-AML groups are the better identified pathologies (in an average percentage of 76.19% and 77.12% for all their samples and runs of the algorithm), followed by the monocytic leukemias (with an average percentage of 51.73%). As mentioned above, the group of AML with inversion is confused in a mean percentage of 33.66% and 32.06% with samples from monocytic and Other-AML groups, re-spectively. If we consider that the highest percentage for each microarray deter-mines the cluster to which it belongs, the final clustering obtained by our simu-lated annealing-based algorithm is shown in Table 2.
Table 1 Confusion matrix for the HC-Salamanca dataset
Predicted class
APL Inv Mono Other
APL 76.19% 2.71% 2.18% 18.92%
Inv 7.79% 26.49% 33.66% 32.06%
Mono 3.11% 17.81% 51.73% 27.35%
True class
Other 8.62% 5.56% 8.70% 77.12%

An Experimental Evaluation of a Novel Stochastic Method 13
Table 2 Final clustering for the HC-Salamanca dataset
Cluster Samples in cluster
APL APL-05204, APL-10222, APL-12366, APL-13058, APL-13223, APL-14217, APL-14398, APL-16089, APL-16739, APL-17074, Other-00139
Mono Inv-00355, Inv-10891, Mono-06667, Mono-09949, Mono-12361, Mono-13701, Mo-no-13774, Mono-13850, Mono-14043
Other
Inv-00185, Inv-07644, Other-00170, Other-06209, Other-07297, Other-09376, Other-09875, Other-10232, Other-10557, Other-11567, Other-12570, Other-13296, Other-13451, Other-14399, Other-14698, Other-14735, Other-15443, Other-15833, Other-16221, Other-16942, Other-16973, Other-17099, Other-17273
Assuming as “ground truth” the clustering given by authors in [7], the perform-ance of the clustering process can be tested by comparing the results given in both tables. Some commonly used indices such as the Rand index and the Jaccard coef-ficient have been defined to measure the degree of similarity between two parti-tions. For the clustering given by our experiment, the Rand index was 0.90 and the Jaccard coefficient was 0.77.
3.2 The Armstrong Dataset
In [8] the authors proposed that lymphoblastic leukemias with MLL translocations (mixed-lineage leukemia) constitute a distinct disease, denoted as MLL, and show that the differences in gene expression are robust enough to classify leukemias correctly as MLL, acute lymphoblastic leukemia (ALL) or acute myeloid leuke-mia (AML). The public dataset of this work, herein referred to as the Armstrong dataset, has been also used to test our proposal. The complete group of samples consists of 24 patients with B-Precursor ALL (ALL), 20 patients with MLL rear-ranged B-precursor ALL (MLL) and 28 patients with acute myeloid leukemia (AML). All the samples were analyzed using the Affymetrix GeneChip U95a which contains 12600 known genes.
Table 3 Confusion matrix for the Armstrong dataset
Predicted class
ALL AML MLL
ALL 65.88% 5.16% 28.95%
AML 4.42% 86.40% 9.18% True class
MLL 34.74% 12.85% 52.41%
The percentage of times (on average) in which microarrays of each reference cluster have been grouped together with microarrays of different classes (across the ten executions of the algorithm) is shown in Table 3. These percentages can be considered as an estimation of the overlapping area of the membership functions of any two potential groups in the sector associated to a true class.

14 H. Gómez et al.
Table 4 Final clustering for the Armstrong dataset
Cluster Samples in cluster
ALL ALL-01, ALL-02, ALL-04, ALL-05, ALL-06, ALL-07, ALL-08, ALL-09, ALL-10, ALL-11, ALL-12, ALL-13, ALL-14, ALL-15, ALL-16, ALL-17, ALL-18, ALL-19, ALL-20, ALL-58, ALL-59, ALL-60, MLL-25, MLL-32, MLL-34, MLL-62
AML
ALL-03, AML-38, AML-39, AML-40, AML-41, AML-42, AML-43, AML-44, AML-46, AML-47, AML-48, AML-49, AML-50, AML-51, AML-52, AML-53, AML-54, AML-55, AML-56, AML-57, AML-65, AML-66, AML-67, AML-68, AML-69, AML-70, AML-71, AML-72
MLL ALL-61, AML-45, MLL-21, MLL-22, MLL-23, MLL-24, MLL-26, MLL-27, MLL-28, MLL-29, MLL-30, MLL-31, MLL-33, MLL-35, MLL-36, MLL-37, MLL-63, MLL-64
As in the HC-Salamanca dataset, if the highest percentage for each sample determines the cluster of the microarray, the final clustering obtained by our simu-lated annealing-based algorithm is shown in Table 4. As in the previous experi-ment, assuming the clustering given by authors in [8] is the “ground truth”, the Rand index and the Jaccard coefficient for experiments carried out are 0.89 and 0.72, respectively.
4 Discussion
The aim of the experiments reported in the previous section is to test the validity of the proposed clustering method. Dealing with unsupervised classification, it is very difficult to test the ability of a method to perform the clustering since there is no supervision of the process. In this sense, the classification into different groups proposed by the authors in [7, 8] is assumed to be the reference partition of sam-ples in our work. This assumption may be questionable in some cases, since the reference groups are not well established. For example, in the HC-Salamanca dataset the AML with inversion group is established by observation of the karyo-type of cancer cells, but there is no other evidence (biological, genetic) suggesting that this group corresponds to a distinct disease. Even so, the assumption of these prior partitions as reference groups is the only way to evaluate the similarity (or dissimilarity) of the results computed by the proposed method based on existing knowledge. As it turns out, there is no perfect match among the results of our pro-posed method and the reference partitions, but they are compatible with the cur-rent knowledge of each dataset. For example, for the HC-Salamanca dataset the better characterized groups are the APL and Other-AML groups, the worst is the AML with inversion group, and there is some confusion of the monocytic AML with the AML with inversion and Other-AML groups. These results are compati-ble with the state-of-the-art discussed in [7], where the APL group is the better characterized disease (it can be considered as a distinct class), the monocytic AML is a promising disease, the AML with inversion in chromosome 16 is the weaker class, and the Other-AML group acts as the dumping ground for the rest of samples which are not similar enough to the other possible classes. For the