advances in pediatrics - emory department of … health/global child... · advances in pediatrics...
TRANSCRIPT
Advances in Pediatrics 56 (2009) 301–339
ADVANCES IN PEDIATRICS
Global Child Health: Promises Madeto Children—Not Yet Kept
Burris Duncan, MDDepartment of Pediatrics and Public Health, Arizona Health Sciences Center, Mel and EnidZuckerman, College of Public Health, 1295 N. Martin Ave., Tucson, AZ 85724, USA
This article represents an overview of the state of the world’s children fromthe late 1970s, starting with the high hopes issued from the InternationalConference in Alma Ata declaring ‘‘Health for all by the year 2000.’’ It
progresses through the Revolution for Children including the World Summitfor Children in 1990 followed by the Millennium Development Goals of2000. We are halfway to 2015, the year when the Millennium DevelopmentGoals should be realized, but most of these goals are appearing illusive. Formillions, many of the promises will not be kept. However, progress towardimproving the health and well-being of children has been substantial, and isdocumented in the last half of the article that ends with a call to get involved.
THE ALMA ATA 1978 DECLARATION: HEALTH FOR ALLBY THE YEAR 2000The 1978 Declaration at the International Conference held in Alma Ata, thenKazakhstan, stated that: ‘‘Governments have a responsibility for the health oftheir people which can be fulfilled only by the provision of adequate health andsocial measures. A main social target of governments, international organiza-tions and the whole world community in the coming decades should be theattainment by all peoples of the world by the year 2000 of a level of healththat will permit them to lead a socially and economically productive life.Primary health care is the key to attaining this target as part of developmentin the spirit of social justice’’[1]. The attendees representing almost all of themember nations of World Health Organization (WHO) and the UnitedNations Children’s Fund (UNICEF) affirmed that health care is a fundamentalhuman right requiring a change from the generally accepted narrow concept ofhealth to embrace an interdisciplinary, intersectorial approach involving broadcommunity support and collaboration. The International Conference onPrimary Health Care extended an urgent call to all nations to join in a collab-orative effort ‘‘to develop and implement primary health care throughout theworld.’’
E-mail address: [email protected]
0065-3101/09/$ – see front matterª 2009 Elsevier Inc. All rights reserved.doi:10.1016/j.yapd.2009.08.013

302 DUNCAN
THE REVOLUTION FOR CHILDREN: UNICEFAND JAMES P. GRANTMotivated by the Declaration of Alma Ata and the visionary leadership of itsExecutive Director, James Grant, UNICEF launched an ambitious, boldprogram to bring low-cost, low-level technologies to the developing world.The program was based on the belief that scientific discoveries had advancedat a faster rate than had the application of that knowledge. The plan was todecrease child morbidity and child mortality by training community healthworkers in 4 basic programs: Growth monitoring, Oral rehydration, Breastfeeding, and Immunization: GOBI.
Growth monitoring
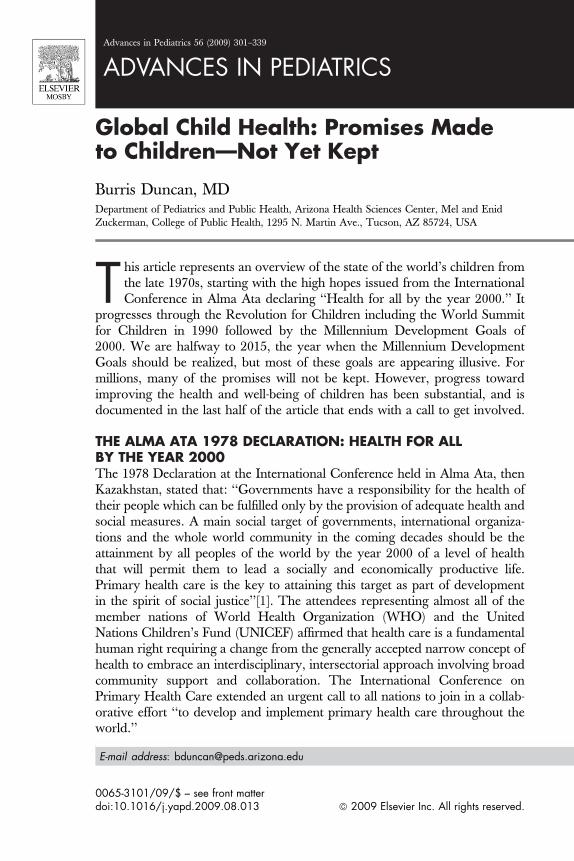
Several important facts make this a cornerstone to the Revolution for Children.(1) The development of malnutrition is insidious. The day-to-day slow loss ofbody mass often goes unrecognized by the child’s family until it is brought tothe mother’s attention by a family member or friend who has not seen the childfor some time. (2) The vicious cycle of infection, malnutrition, and immunoin-competence is unrelenting. The cycle can begin at any one of the interlacingpoints of the triangle. Infection in a child is invariably associated with anorexia.If the illness is prolonged or if the child is on the edge of malnutrition, thetumble into acute malnutrition is precipitous and predictable. (3) Diets inpoor countries are often deficient in essential micronutrients such as iron andvitamin A; a lack of either encourages a swift decline into severe malnutritionand infections. Meats are too expensive. Iron-containing foods are seldoma part of the child’s meal. Staples are either rice or corn. Other vegetablesand fruits are lacking. Any intake of b-carotene or vitamin A is low. (4) Malnu-trition is an integral component of a least 50% of the deaths of the childrenyounger than 5 years. (5) Early detection of a declining nutritional status fol-lowed by appropriate intervention could break the vicious cycle.James Grant expanded the ideas of Dr. David Morley, an English pediatri-cian who had worked in West Africa where he instituted the Under-FiveClinics. These centers were basically well child clinics that emphasized goodnutrition and growth. An important component of these clinics was the‘‘Road to Health Chart’’ (Fig. 1) [2,3].
The chart has some very unique features. The horizontal axis represents thechild’s age, but not as the age in months; the columns are identified by thecalendar months starting with the month the child was born. This chart elim-inates the need for the health care worker to estimate the age of the child, mini-mizing mistakes. Only weights are recorded and only 2 reference lines (ratherthan 7) are shown on the graph. On this chart; the upper line is the 50thpercentile for boys and the lower line is the third percentile for girls. The chartuses the National Centre for Health Statistics (NCHS) as a reference; not asa standard [4]. The child’s individual line is plotted to show the mother thetrajectory of her child’s weight. The smaller box in the left upper corner shows3 possible trajectories: an upward line is the best trajectory, a flat line indicates
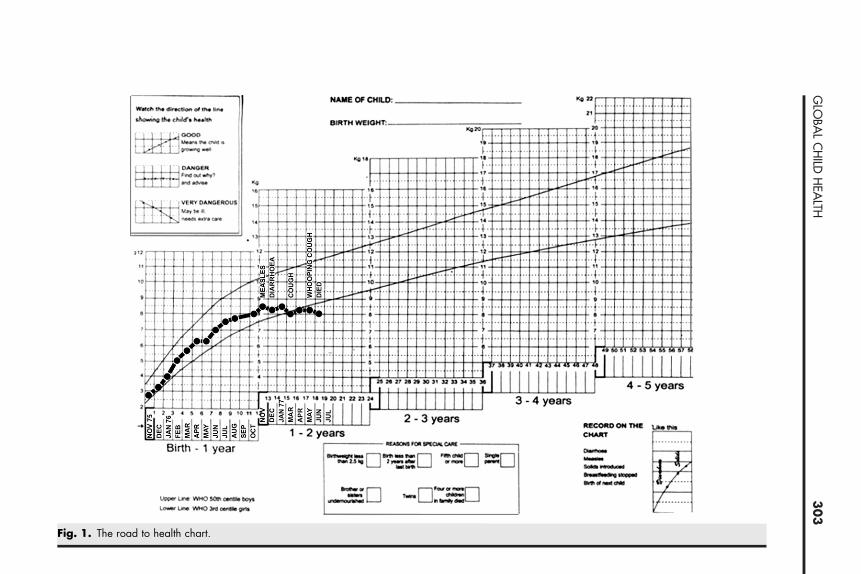
Fig. 1. The road to health chart.
30
3G
LOBA
LC
HILD
HEA
LTH

304 DUNCAN
danger, and a downward trajectory shouts an alarm. The chart also containsspace to record any perinatal problems or complications at birth as well as birthweight, length, and head circumference, the clinic the child usually attends, andall immunizations the child receives. The health worker is advised to notewhen the child was weaned from the breast and when the next child wasborn. Significant illnesses are recorded on the chart in the month they occurred.Any change in weight trajectory with these sentinel events are points for discus-sion with the mother. There is also information extolling the benefits of breastfeeding and when important developmental milestones should be met. Thetime when immunizations are due is also given on the chart.
The Road to Health Chart is given to the mother in a plastic, watertight bagat the birth of her child. She is instructed to keep it safe and to bring it to theclinic each month. Scenes like the one represented in Fig. 2 are a part of the lifeof the mother and her new child. Each month the child is weighed, and theweight plotted on the graph along with any significant illnesses the child hadhad since the last visit. With counsel, the mother can easily see the slope ofthe child’s weight and compare the trajectory with the 3 lines in the smallerbox. Intervention can be instituted with the first sign of ‘‘danger’’ before anyserious consequences develop.
Oral rehydration
In much of the developing world, clean uncontaminated water is a rarity.Women and young children must often travel many miles to a river or welleach day for portable but, all too frequently, not potable water. Piping waterFig. 2. A typical weight-in scene in East Africa.

305GLOBAL CHILD HEALTH
to villages and rural homes is very expensive, and ‘‘at-source’’ purification isnot frequently practiced. In this environment, every child younger than 5 yearswill have a minimum of 3 episodes of diarrhea each year [5]. Diarrheal deathsaccount for 21% of all deaths in children younger than 5 living in developingcountries [6]. Although 37% fewer people died of diarrhea in 2002 comparedwith 1990, 1.8 million continue to die each year, most of which are preventabledeaths [7–9].
In the mid 1970s, children with diarrhea and severe dehydration wereadmitted to ‘‘rehydration centers’’ scattered throughout the cities in developingcountries. These centers administered intravenous fluids through butterfly nee-dles. These needles were in short supply, hence the same needles were usedrepeatedly and interchanged between children. ‘‘Sterilization’’ of the needleswas done by soaking them in a dilute ‘‘antiseptic’’ solution. In the 1980s,with the introduction of oral rehydration therapy (ORT), all of that changed.The oral rehydration solution (ORS) was developed in the treatment ofcholera, with the discovery that the greatest absorption of water occurredwhen the ratio of sodium and glucose was close to 1:1. ORS contained 90mmol/L of sodium and 111 mmol/L of glucose along with potassium and bicar-bonate. One packet of the powdered mixture (Fig. 3) was dissolved in onequart (0.95 L) of water. At a cost of less than 10 US cents, many countries man-ufactured their own packets. This solution was effective in 90% of the cases ofdiarrhea, even in the presence of hyper- and hyponatremic dehydration. In chil-dren who were in shock or who had greater than 10% dehydration, a push ofintravenous fluids was initiated, followed by the oral solution. Once hydration
Fig. 3. A 10-cent package of rehydration salt to be mixed with 1 quart of clean water.
306 DUNCAN
was reestablished, the ORS was given in quantities equal to the fluid lost in thestool, but this did not immediately stop the watery diarrhea. The mother wastold the solution would help her child but when she continued to see diarrheashe was confused, and acceptance was slow. Other formulations were tried inan attempt to thicken the stools, but success was mixed. However, the effect ofORT was dramatic. Each year, 1 million fewer children were dying a diarrhealdeath. Eight years after the introduction of this treatment (1980–1988), 36% ofthe cases of diarrhea were being treated with ORT [10]. If this therapy could beextended to all diarrhea episodes, another 2.5 million deaths would be averted.By 2005, 43% of the children with diarrhea in 31 countries in the developingworld were receiving ORS; further along, but not there yet (Fig. 4) [11].
Breast feeding
Spurred by the unscrupulous behavior of some infant formula companies thatwere promoting their product as superior to breast milk, the WHO publishedThe International Code of Marketing of Breast Milk Substitutes [12]. TheCode was designed to promote the safety, adequacy, and benefits of breastmilk. Its guidelines state that the promotion of artificial milk substitutes bymanufacturers and their representatives must be limited to discussing scientificand factual matters with health professionals, and were not to imply that bottlefeeding is equal to or superior to breastfeeding. Advertisements to the generalpublic and particularly to pregnant women that either explicitly or implicitlyindicated that breast milk was inferior to a milk substitute would not bepermitted. Representatives of these companies would not be allowed in thenurseries to promote their products to the unsuspecting new mothers. Sampleswould not be distributed. Health providers would extol the advantages ofbreast milk and discuss the disadvantages of substitutes.Shortly after the International Code in 1991, the WHO and UNICEFlaunched the Baby-friendly Hospital Initiative [13]. Just 15 years later, morethan 20,000 hospitals in 152 countries had been designated Baby-friendly.Exclusive breast feeding for at least the first 6 months of life in countless infantshad expanded.
Fig. 4. (From UNICEF. Progress for children—a world fit for children: statistical review. Number6, December 2007. http://www.unicef.org/progressforchildren/2007n6/index_41401.htm; with permission.)

307GLOBAL CHILD HEALTH
The ten steps to successful breastfeeding inherent in a Baby-friendlyHospital [14]:
1. Have a written breastfeeding policy that is routinely communicated to all healthcare staff.2. Train all health care staff in the skills necessary to implement this policy.3. Inform all pregnant women about the benefits and management of
breastfeeding.4. Help mothers initiate breastfeeding within a half-hour after birth.5. Show mothers how to breastfeed, and how to maintain lactation even if they
should be separated from their infants.6. Give newborn infants no food or drink other than breast milk, unless medically
indicated.7. Practice rooming-in: allow mothers and infants to remain together 24 hours
a day.8. Encourage breastfeeding on demand.9. Give no artificial teats or pacifiers (dummies or soothers) to breastfeeding
infants.10. Foster the establishment of breastfeeding support groups and refer mothers to
them on discharge from the hospital or clinic.
Of all the arguments extolling the virtues of breast milk or ‘‘breast is best,’’perhaps the most convincing is the ‘‘enteromammary system’’ [15]. Anyantigen that inhabits the intestinal tract of the lactating mother stimulates theproduction of IgA antibodies in the Peyer patches in her intestinal tract. Thosespecific antibodies enter the adjacent lymphatic nodes; travel to the thoracicduct, and into the blood stream. The antibodies then hone to the mother’sbreast. The specific IgA levels in her breast milk are higher than the levels inher blood stream. Two molecules of IgA fuse forming secretory IgA, thepredominant immunoglobin in human milk. The infant ingests these anti-bodies, which enter the infant’s intestinal tract where they attach to the epithe-lial cells. Invasion by the antigen is prevented. This system is so effective thatpathogenic viruses, bacteria, and even some parasites have been cultured orfound in the infant’s stool yet the infant is not diseased!
Immunizations
When the Revolution for Children began in the early 1980s, immunizationrates for children younger than 2 years living in the developing world werefrom 5% to 10%. Fourteen years later, rates for 5 of the 6 targeted diseases,diphtheria, pertussis, tetanus, polio, and measles, were close to 80% and thesixth, the BCG vaccine against tuberculosis given at birth, was greater than80%. However, only 40% of pregnant women had received the second doseof tetanus (Fig. 5). This low rate kept the incidence of neonatal tetanus high[16]. Mortality and morbidity from these diseases decreased proportionately.By 2006, global coverage of infants with 3 doses of diphtheria/polio/tetanusvaccine was still close to 80% but 114 countries (59% of all countries) hadachieved 90% coverage. However, there is a sharp disparity. In many African
Fig. 5. Global immunization coverage 1977 to 1991. (Data from Expanded Programme onImmunizations Programme report for the year 1992. Incorporating the recommendations ofthe global advisory group, October 1992. World Health Organization. January 1993.http://whqlibdoc.who.int/hq/1993/WHO_EPI_GEN_93.1.pdf.)
308 DUNCAN
countries, coverage is 82%, whereas in the Americas it is 94% and in Europe,95% [17,18].
The efficacy of both the polio and measles vaccines decreases when the ‘‘coldchain’’ is broken. This finding prompted the use of thermal indicators packedwith these vaccines to alert health care workers if the ‘‘cold chain’’ has beenviolated and the efficacy of the vaccine has been reduced. Appropriate author-ities are notified to prevent recurrence of the problem.
In the fall of 1991, the last case of polio was seen in the Americas and by2003 polio had been eradicated from all but 3 countries in the world. Thena few cases were imported from Nigeria and soon 21 countries were reportingpolio cases. The involved countries rapidly instituted ‘‘Supplementary Immu-nization Activity’’ to quickly abort any new cases. It is expected that verysoon polio will meet the same fate as smallpox: elimination [19].
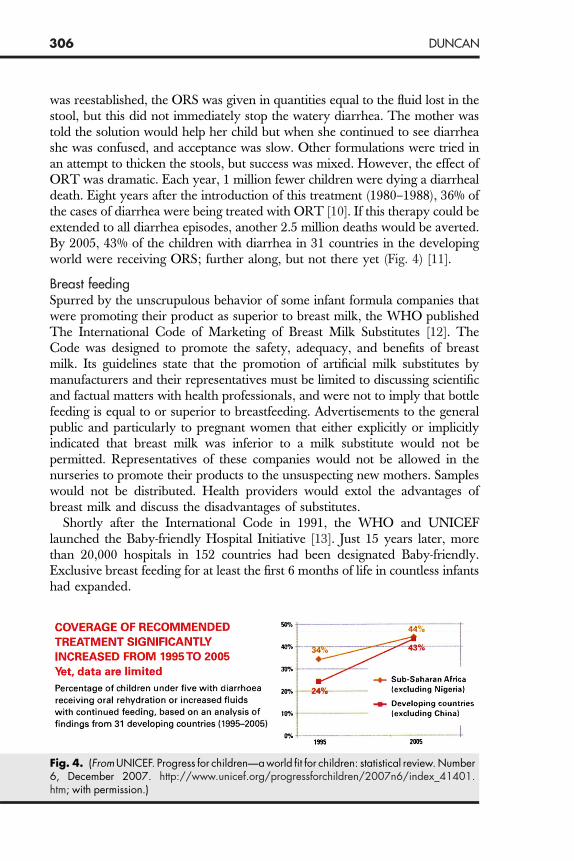
Eradicating measles has been a more difficult job. Whereas coverage hasimproved, it has been slow. Dr. Margaret Chan, WHO Director-General, re-ported that measles deaths decreased by 60% (873,000 to 345,000) from 1999to 2005 [20] (Fig. 6), a remarkable achievement, but unfortunately coverage isinsufficient. Too many children are still dying from this preventable illness.
One hundred and twenty-three countries have added the Rubella vaccine tothe list of immunizations [17]. By 2006, many countries had expanded coverageof children to include hepatitis B and Haemophilus influenza type B (Fig. 7) [11].
FFF: THREE OTHER LOW-COST, LOW-LEVEL TECHNOLOGIESWERE ADDED
Female education It is generally accepted that the more education a women has, the healthier sheand her family are, the fewer children she has, and the greater is her potential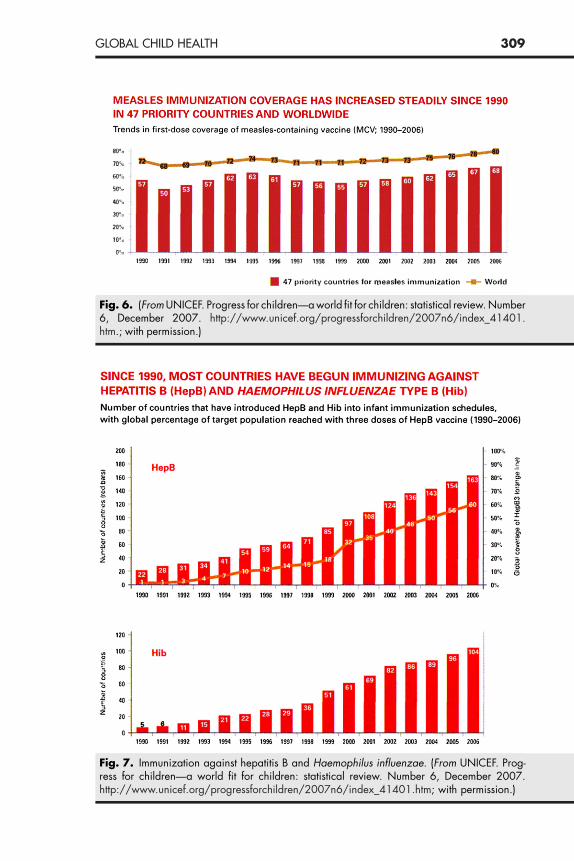
Fig. 6. (From UNICEF. Progress for children—a world fit for children: statistical review. Number6, December 2007. http://www.unicef.org/progressforchildren/2007n6/index_41401.htm.; with permission.)
Fig. 7. Immunization against hepatitis B and Haemophilus influenzae. (From UNICEF. Prog-ress for children—a world fit for children: statistical review. Number 6, December 2007.http://www.unicef.org/progressforchildren/2007n6/index_41401.htm; with permission.)
309GLOBAL CHILD HEALTH

310 DUNCAN
for income generation. In the early 1980s, the disparity in primary andsecondary education between the genders was large and unacceptable [21].Perhaps the best example of the impact female education can have on thewhole population is in the State of Kerala in India. The per capita income inKerala is less than throughout most of India, yet in Kerala the commitmentto female education is strong. In India, one-half of girls drop out of schoolbefore completing 5 grades, and only 34% of women are literate. In Kerala,the dropout percentage is zero before grade 5, and 87% of the women areliterate. The average number of births per woman in 1990 in India was 4. InKerala, it was half that (1.9), and twice as many women in Kerala use birthcontrol. In 1990, infant mortality was 83 per 1000 live births in India. In Keralait was only 17 per 1000 live births. The life expectancy in Kerala for womenwas 15 years longer than in the whole of India (74 compared with 59) [22].
Family spacing
The rallying cry of nongovernmental organizations (NGO) as well as manygovernments was ‘‘too young, too many, too soon.’’ In many developing coun-tries, the custom is for young adolescent girls to marry older men and starthaving babies at a very early age. Fertility is good. Sterility is not. A 1992survey in Niger found that 47% of women aged 20 to 24 years had marriedbefore they were 15 years old and 87% had married before the age of 18.More than half had had a child before they had left the teenage years [23].Complications from a teen pregnancy are numerous and include a highpercentage of school dropouts as well as a high prevalence of anemia, anddue to the smaller pelvis of young mothers, obstructed labor is more frequent.The WHO estimates that maternal mortality rates are fivefold greater for girlsbetween 10 and 14 and twice as high for adolescents who are between 15 and19 compared with women who are 20 to 24 years old. In societies where theinfant and childhood mortality rates are high, families have grown to anticipatethat several of their children will die prematurely. To ensure a significant workforce, women have more children. In country after country, as infant and child-hood mortality rates decrease and more children live, fertility rates alsodecrease, although it may take a generation or two to realize this [24]. From1960 to1980, infant and childhood mortality rates fell close to 60% and fertilityrates decreased by 48%. The ‘‘too soon’’ refers to too short a period betweenone pregnancy and the next. The ‘‘simple’’ strategy of waiting 2 to 3 yearsbetween pregnancies will cut infant mortality almost by half and if the intervalis greater than 4 years, infant mortality decreases by 60%. Due to the contra-ceptive effects of exclusive breast feeding, delaying weaning has helped lengthenthe time between pregnancies.
Food supplementation
Many studies have reported the benefits of supplementing diets of pregnantwomen and young children. Perhaps the most well known is the Guatemalastudy conducted by the Institute of Nutrition of Central America and Panama(INCAP) [25–27]. Two randomly chosen villages received a nutritious
311GLOBAL CHILD HEALTH
supplement (atole, containing 163 kcal of energy and 11.5 g of protein for each180 mL of fluid). Two other randomly chosen villages received a less nutritioussupplement (fresco, which contained approximately one-third as many caloriesand no protein). The women in the study who supplemented their usual dietwith 20,000 kcal or more during pregnancy had half the risk of deliveringa low birth weight infant. Infant mortality rates were reduced by 66% in theatole villages compared with 24% in the fresco villages. A follow-up study in1987 to 1988 reported that half of the women who as children had receivedthe fresco supplement had short stature compared with only one-third of thewomen who had received the more nutritious atole supplement [28]. Shortstature is associated with a small pelvis. Thus, the infants fared better andthe girls were less likely to have obstructed labor when they became pregnantthemselves.
The Guatemala food supplementation programs has also had very signifi-cant long-term economic effects [29,30]. A follow-up study involved 60% ofthe 2392 children, aged 0 to 7 years, from the original INCAP study. Linearregression models were adjusted for confounding variables to estimate theannual income, hours worked, and average hourly wages of the adults. Theadult men, who as children had received the more nutritious supplement atolefrom birth to age 2, had a 46% increase in average wages compared with thosewho received the less nutritious supplement. Boys who had received the atoleduring their first 3 years of life had an increase of 37% in hourly wages.However, there was no difference in hourly wages in those who received theatole after age 3.
MICRONUTRIENT DEFICIENCIES CAUSED CONCERNAND ACTIONIodineIn 1993, it was estimated that iodine deficiency was responsible for cretinismin 5.7 million and for mental retardation in another 26 million of the 1.6billion at-risk populations. In 1990, a goal was set to eliminate all new casesof iodine deficiency by the year 2000. To achieve that goal, every countrywas to have iodized 95% of the salt supplies by 1995 [22]. The goal hasnot been met; but by 2003 approximately 70% of the world’s salt consumedby humans was iodized. Areas where there is much work yet to be doneinclude some West and East African countries, some Middle Eastern coun-tries, and Russia. China is a story of success. In a span of just 10 years,the population of that huge country had increased its use of iodized saltfrom 50% to 95% [31].
Vitamin A
In 1994, of the 562 million children younger than 5 years living in the devel-oping world, 500,000 suffered severe eye damage or were blind as a resultof vitamin A deficiency; another 3 million had xerophthalmia, and another13.5 million had ‘‘night blindness.’’ Forty-four percent of the entire under-5
312 DUNCAN
population was deficient in vitamin A, inviting a 20% to 30% increased risk ofdeath from common diseases [22]. The risk was even higher for those childrenwho contracted measles. This exanthem is a highly desquamating disease, withloss of epithelium in numerous organs. Vitamin A is essential in the repair ofthese epithelial cells. With a deficiency of vitamin A, corneal necrosis (kerato-malacia) occurs and ulcerates, with the potential expulsion of the lens andblindness. The denuded epithelium-lined tracts are susceptible to bacterial inva-sion through pneumonia, gastroenteritis, and nephritis. Sepsis is often theresult. Without epithelial repair, death can occur as long as 9 months afterthe measles exanthem. An observant ophthalmologist, Dr. Al Sommer, re-ported that the survival of children who are deficient in vitamin A can beincreased by 35% if they are given a high dose of vitamin A supplementation(200,000 units on 2 successive days) [32]. A meta-analysis by Fawzi andcolleagues concluded with the recommendation that ‘‘Vitamin A supplementsshould be given to all measles patients in developing countries whether or notthey have symptoms of vitamin A deficiency’’ [33].
UNICEF and other NGOs, and some countries started programs to orallyadminister 200,000 units of vitamin A every 5 to 6 months to all childrenbetween the ages of 12 months and 5 years. The vitamin A is dispensed ina capsule containing oil to improve absorption, which costs less than 10 cents.The vitamin is stored in the liver, and an adequate supply is maintained unlessthe child develops repeated illnesses that call on an excessive amount ofvitamin A to repair damaged epithelial cells. In southern Nepal, a highpercentage of pregnant women are deficient in vitamin A [34]. If the pregnantwoman’s diet remains inadequate in b-carotene or vitamin A and is withoutsupplementation, her newborn will be deficient and will remain so due to inad-equate levels in her breast milk. Until the intake is sufficient, the newborn willbe more susceptible to disease and death.
Iron
It is estimated that more than 1 billion people have iron deficiency anemia; 16%of the world’s population [35]. In 1990, half of the pregnant women in thedeveloping world suffered from iron deficiency anemia. These women weretired and having difficulty doing all the chores of daily living, and were atan increased risk of death in childbirth. Their infants were more likely to besmall, with lower birth weights and with impaired development [36]. Insome areas it was even worse; 90% of pregnant women living in an urbanarea in Pakistan had anemia [37]. The anemia was mild in 75% of thesewomen, with hemoglobin (Hg) level between 9 and 10.9 g/dL, and in 14% itwas moderate, with Hg level between 7 and 8.9 g/dL. More than 40% of chil-dren younger than 5 years have a Hg level less than 11 g/dL. In the short termthis is responsible for considerable morbidity and mortality. Long-term conse-quences include a diminution in cognitive abilities and less income potential.This major problem has not been adequately addressed.
313GLOBAL CHILD HEALTH
Zinc
Thirty percent of the world’s population is deficient in zinc, largely due to thefact that zinc is mainly found in red meat (expensive) and there are no tissuestores. The areas with the highest deficiencies are in Central and East Africa,Angola, Zambia, Zimbabwe, Afghanistan, India, and South East Asia. Zincsupplementation benefits children with diarrhea and respiratory illnesses, andimproves linear growth. Pooled analysis of zinc studies has not shown a reduc-tion in infant mortality, but has shown an 18% reduction in mortality in chil-dren between 12 months and 5 years old. The lack of effect on mortality ininfants has a biological basis, as this age group is not thought to have a defi-ciency of zinc [38].A recently published community-based, cluster-randomized, double-masked,placebo-controlled, and zinc supplemental trial involved 41,276 children aged 1to 35 months living in southern Nepal [39]. The 4 groups received daily dosesof: (1) placebo; (2) zinc (10 mg); (3) iron (12.5 mg) and folic acid (50 lg); or (4)zinc plus iron and folic acid. The mortality in children younger than 12 monthswas not affected by the supplemental zinc. Although mortality was 20% lowerin the older children, the difference did not reach statistical significance.Contrary to the 1999 report of the Zinc Investigators Collaborative Group[40], the study in Nepal found no difference in the frequency and durationof diarrhea and respiratory infections between the groups. The discrepancywas explained with the observation that most of the studies cited in the Collab-orative review involved high-risk children; those just recovering from acutediarrhea or who had persistent diarrhea, and children who were underweightor stunted. Results from studies on unselected populations published after theCollaborative Group report are mixed. The final chapter on morbidity data hasnot been written.
THEINTEGRATEDMANAGEMENTOFCHILDHOODILLNESS(IMCI)Within the past few years, the WHO and UNICEF have adopted a morecomprehensive approach to child care that emphasizes not just the child’s acuteillness and nutritional deficiencies but the child’s total well-being. The child’spresenting complaint is dealt with first. The community health care workermakes a careful and systematic assessment of common symptoms and well-selected specific clinical danger signs that provide sufficient information toguide rational and effective actions. The emphasis is on the severity of the acuteproblem rather than on a specific diagnosis. Algorithms have been developed toassist the health care worker who may have had limited training to make aninformed determination as to where and how best to treat the child. Theworker follows a chart color-coded by red (danger), yellow (caution), or green(safe). For example, danger signs are depicted on a chart whose center has a bigred stop sign surrounded by danger words (‘‘lethargy or unconscious,’’‘‘inability to drink or breast feed,’’ and ‘‘convulsions’’). If the child has thedanger signs, immediate referral is made to the nearest appropriate facility. Ifthe danger signs are not present and the child can be treated at home, the
314 DUNCAN
family is given an explanation of the problem, why it has occurred, and instruc-tions on how to implement the care suggested.
After addressing the acute problem, the focus shifts to addressing what isnecessary to promote the child’s growth and development. In addition to theassessment and management of the child’s acute condition, more chronic issuesare identified and addressed, including nutritional status and immunizationcoverage. The child younger than 5 years receives the greatest scrutiny.
IMCI not only includes both curative and preventative elements, but alsostrives to engage the family and the entire community in health promotion.IMCI is a full program that also involves improving the training of the healthworkers, educating the community in preventive measures to decreasemorbidity and mortality of the children, upgrading the available care in thelocal health clinics, strengthening the available care in the hospital for thosechildren too sick to be treated at the local clinic, and helping local governmentsplan and include the program as part of the national health policy [41].
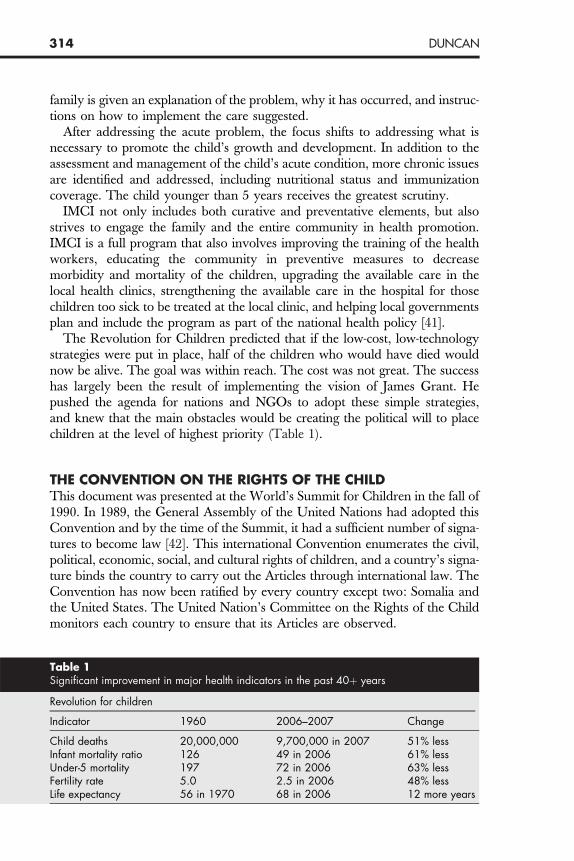
The Revolution for Children predicted that if the low-cost, low-technologystrategies were put in place, half of the children who would have died wouldnow be alive. The goal was within reach. The cost was not great. The successhas largely been the result of implementing the vision of James Grant. Hepushed the agenda for nations and NGOs to adopt these simple strategies,and knew that the main obstacles would be creating the political will to placechildren at the level of highest priority (Table 1).
THE CONVENTION ON THE RIGHTS OF THE CHILDThis document was presented at the World’s Summit for Children in the fall of1990. In 1989, the General Assembly of the United Nations had adopted thisConvention and by the time of the Summit, it had a sufficient number of signa-tures to become law [42]. This international Convention enumerates the civil,political, economic, social, and cultural rights of children, and a country’s signa-ture binds the country to carry out the Articles through international law. TheConvention has now been ratified by every country except two: Somalia andthe United States. The United Nation’s Committee on the Rights of the Childmonitors each country to ensure that its Articles are observed.
Table 1Significant improvement in major health indicators in the past 40þ years
Revolution for children
Indicator 1960 2006–2007 Change
Child deaths 20,000,000 9,700,000 in 2007 51% lessInfant mortality ratio 126 49 in 2006 61% lessUnder-5 mortality 197 72 in 2006 63% lessFertility rate 5.0 2.5 in 2006 48% lessLife expectancy 56 in 1970 68 in 2006 12 more years

315GLOBAL CHILD HEALTH
THE WORLD’S SUMMIT FOR CHILDRENClose to one-half of the world’s Presidents and Prime Ministers convened inNew York in September of 1990 to ensure that the welfare of children wouldbe placed highest on their political agendas. The challenge of the Summit was:‘‘Enhancement of children’s health and nutrition is a first duty, and also a taskfor which solutions are now within reach. The lives of tens of thousands ofboys and girls can be saved every day because the causes of their death arereadily preventable. Child and infant mortality is unacceptably high in manyparts of the world, but can be lowered dramatically with means that are alreadyknown and easily accessible.’’
From the Summit came the World Declaration on the Survival, Protectionand Development of Children and Plans of Action [43]. In September 1990,the following Declaration was signed by 71 heads of state and governmentsand has subsequently been endorsed by 181 countries.
1. We will work to promote earliest possible ratification and implementation of theConvention on the Rights of the Child. Programs to encourage information aboutchildren’s rights should be launched worldwide, taking into account the distinctcultural and social values in different countries.
2. We will work for a solid effort of national and international action to enhancechildren’s health, to promote prenatal care, and to lower infant and childmortality in all countries and among all peoples. We will promote the provisionof clean water in all communities for all their children, as well as universalaccess to sanitation.
3. We willwork for optimal growthanddevelopment in childhood, throughmeasuresto eradicate hunger, malnutrition, and famine, and thus to relieve millions of chil-dren of tragic sufferings in a world that has the means to feed all its citizens.
4. We will work to strengthen the role and status of women. We will promoteresponsible planning of family size, child spacing, breastfeeding and safemotherhood.
5. We will work for respect for the role of the family in providing for children andwill support the efforts of parents, other caregivers, and communities to nurtureand care for children, from the earliest stages of childhood through adoles-cence. We also recognize the special needs of children who are separatedfrom their families.
6. We will work for programs that reduce illiteracy and provide educational oppor-tunities for all children, irrespective of their background and gender; thatprepare children for productive employment and lifelong learning opportunities,ie, through vocational training; and that enable children to grow to adulthoodwithin a supportive and nurturing cultural and social context.
7. We will work to ameliorate the plight of millions of children who live under espe-cially difficult circumstances—as victims of apartheid and foreign occupation;orphans and street children and children of migrant workers; the displaced chil-dren and victims of natural and man-made disasters; the disabled and the abused,the socially disadvantaged and the exploited. Refugee children must be helped tofind new roots in life. We will work for special protection of the working child andfor the abolition of illegal child labor. We will do our best to ensure that childrenare not drawn into becoming victims of the scourge of illicit drugs.

316 DUNCAN
8. We will work carefully to protect children from the scourge of war and to takemeasures to prevent further armed conflicts, in order to give children every-where a peaceful and secure future. We will promote the values of peace,understanding, and dialogue in the education of children. The essential needsof children and families must be protected even in times of war and inviolence-ridden areas. We ask that periods of tranquility and special relief corri-dors be observed for the benefit of children, where war and violence are stilltaking place.
9. We will work for common measures for the protection of the environment, at alllevels, so that all children can enjoy a safer and healthier future.
10. We will work for a global attack on poverty, which would have immediate bene-fits for children’s welfare. The vulnerability and special needs of the children ofthe developing countries, and in particular the least developed ones, deservepriority. But growth and development need promotion in all States, throughnational action and international cooperation. That calls for transfers of appro-priate additional resources to developing countries as well as improved terms oftrade, further trade liberalization, and measures for debt relief. It also impliesstructural adjustments that promote world economic growth, particularly indeveloping countries, while ensuring the well-being of the most vulnerablesectors of the populations, in particular the children.
In 2000, The Millennium Development Goals (MDGs) were signed by 189countries, and were to be accomplished in the next 15 years (2015) [44].
Goal 1 Eradicate extreme poverty and hunger: Decrease by half from 1990the proportion of people whose income is less than 1 dollar a dayand the proportion of people who suffer from hunger. Achieve fulland productive employment and decent work for all, includingwomen and young people.
Goal 2 Achieve universal primary education: Ensure that children every-where, boys and girls alike, will be able to complete a full courseof primary schooling.
Goal 3 Promote gender equality and empower women: Eliminate genderdisparity in primary and secondary education at all levels.
Goal 4 Reduce child mortality: Reduce the under-5 mortality rate by two-thirds from 1990.
Goal 5 Improve maternal health: Reduce the maternal mortality ratio bythree-quarters from 1990. Achieve universal access to reproductivehealth.
Goal 6 Combat human immunodeficiency virus (HIV)/AIDS, malaria, andother diseases: Have halted and begun to reverse the spread ofHIV/AIDS. Achieve universal access to treatment for HIV/AIDS forall those who need it. Have halted and begun to reverse the inci-dence of malaria and other major diseases.
Goal 7 Ensure environmental sustainability: Integrate the principles ofsustainable development into country policies and programs;reverse loss of environmental resources. Reduce biodiversity lossand a significant reduction in the rate of loss. Halve the proportionof people without sustainable access to safe drinking water and
317GLOBAL CHILD HEALTH
basic sanitation. By 2020, achieve a significant improvement in thelives of at least 100 million slum dwellers.
Goal 8 Develop a global partnership for development: Further develop anopen trading and financial system that is rule-based, predictable,and nondiscriminatory, and that includes a commitment to goodgovernance, development and poverty reduction; nationally andinternationally. Address the special needs of the least developedcountries, including tariff and quota free access for their exports;enhanced program of debt relief for heavily indebted poor coun-tries; and cancellation of official bilateral debt; and more generousofficial development assistance for countries committed to povertyreduction. Address the special needs of landlocked and small-islanddeveloping States. Deal comprehensively with the debt problems ofdeveloping countries through national and international measures inorder to make debt sustainable in the long term. In cooperation withdeveloping countries, develop and implement strategies for decentand productive work for youth. In cooperation with pharmaceuticalcompanies, provide access to affordable essential drugs in devel-oping countries. In cooperation with the private sector, make avail-able the benefits of new technologies, especially information andcommunications.
WORLD HEALTH ORGANIZATION ALTERING COURSE:VERTICAL TO HORIZONTAL PROGRAMSDr. Margaret Chan, the WHO’s Director-General, recently stated that interna-tional evidence overwhelmingly demonstrates that the primary health careapproach is the most efficient and cost-effective way to organize a health systemand is the way to achieve ‘‘Health Care for All’’ [45–47]. She observed thatwhereas it was once thought that attacking single diseases (the verticalapproach) would strengthen health care systems, the opposite has occurred.In fact, when some targeted projects implemented by some NGOs or largefoundations initiated strategies to ameliorate a specific disease their good inten-tions often actually disrupted basic health care services. The limited numbers ofhealth care workers were drawn from their government-sponsored jobs ofdelivering primary health care to these outside higher-paying, more attractive,and more narrowed focused jobs. Dr. Chan argued for a return to primaryhealth care as the only means to meet the 8 Millennium Developmental Goals.This call is emphasized in the World Health Report 2008, Primary HealthCare Now More than Ever [48].
Dr. Chan confirmed her strong commitment to social justice and equityin health care, and noted the ever widening gaps between wealthy urbanpopulations and poor rural populations. She recognized the link betweenhealth and poverty, and described the vicious circle of how poor healthinduces poverty and poverty is embedded in poor health. Both must be ad-dressed actively, vigorously, and urgently. She emphasized the necessity ofthe multisectorial approach outlined at the Alma Ata Conference onPrimary Health Care. Dr. Chan extolled governments to strengthen health
318 DUNCAN
policies, with particular attention to poor communities. Equity of access wasa strong theme of her remarks, and is given further emphasis in the WorldHealth Report 2008 [46,47].
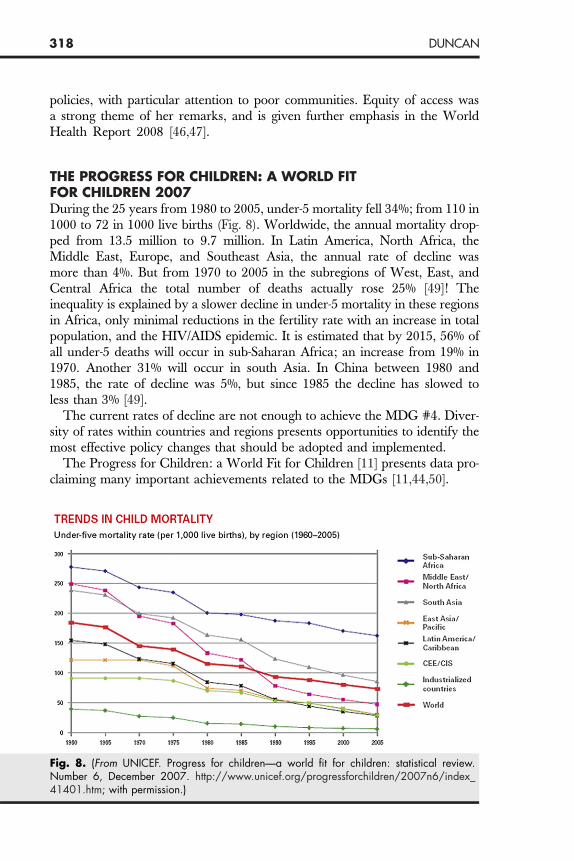
THE PROGRESS FOR CHILDREN: A WORLD FITFOR CHILDREN 2007During the 25 years from 1980 to 2005, under-5 mortality fell 34%; from 110 in1000 to 72 in 1000 live births (Fig. 8). Worldwide, the annual mortality drop-ped from 13.5 million to 9.7 million. In Latin America, North Africa, theMiddle East, Europe, and Southeast Asia, the annual rate of decline wasmore than 4%. But from 1970 to 2005 in the subregions of West, East, andCentral Africa the total number of deaths actually rose 25% [49]! Theinequality is explained by a slower decline in under-5 mortality in these regionsin Africa, only minimal reductions in the fertility rate with an increase in totalpopulation, and the HIV/AIDS epidemic. It is estimated that by 2015, 56% ofall under-5 deaths will occur in sub-Saharan Africa; an increase from 19% in1970. Another 31% will occur in south Asia. In China between 1980 and1985, the rate of decline was 5%, but since 1985 the decline has slowed toless than 3% [49].
The current rates of decline are not enough to achieve the MDG #4. Diver-sity of rates within countries and regions presents opportunities to identify themost effective policy changes that should be adopted and implemented.
The Progress for Children: a World Fit for Children [11] presents data pro-claiming many important achievements related to the MDGs [11,44,50].
Fig. 8. (From UNICEF. Progress for children—a world fit for children: statistical review.Number 6, December 2007. http://www.unicef.org/progressforchildren/2007n6/index_41401.htm; with permission.)

Prom�
���
�
��
Prov�
�
Com��
�
319GLOBAL CHILD HEALTH
oting healthy livesIn 2006, the number of deaths in children younger than 5 years fell below 10million (9.7 million)—half what it was in 1960 (20 million)In 2005, 4 times as many children received 2 doses of vitamin A as in 1999.The use of insecticide-treated bed nets tripled in 16 of 20 African countries.From 1990 to 2006, in the 47 countries which account for 95% of measlesdeaths, measles immunization coverage had increased 11% (57% 68%).More than 1.2 billion people gained access to improved drinking watersources.Sanitation increased but not at a rate to meet the MDG #7.Insufficient progress has been made to reduce maternal mortality.
iding a quality educationFrom 2002 to 2006, the number of school-aged children out of schooldecreased by 18 million or 19% (115 to 93 million).But, in sub-Saharan Africa only 1 out of 4 children of secondary school ageattend secondary schools.
bating HIV/AIDSAlmost two-thirds of all people with HIV live in sub-Saharan Africa.Only 11% of over 2 million pregnant women living with HIV/AIDS receivedantiretroviral therapy to prevent transmission to their unborn child.Only 15% of children younger than 15 years in need of antiretroviral therapyreceived that therapy.
MORTALITY AND MORBIDITY: HOW ACCURATEARE THE NUMBERS?Murray and colleagues site 5 problems that raise questions concerning the accu-racy of the statistical reports from the WHO and UNICEF [49]: (1) childmortality data are missing in some countries; (2) figures do not distinguishbetween actual measurements and predictions; (3) Methods used to obtain thenumbers are not transparent and are not reproducible; (4) data from differentcountries are not obtained with the same precision; and (5) there has been a trendto overestimate mortality in several sub-Saharan countries (Fig. 9).
THE 2008 HIV/AIDS PROGRESS REPORT (MDG #6): POSITIVEAND NEGATIVE STATISTICSFrom 2006 to 2007, access to antiretroviral therapy in low- and middle-incomecountries increased 7.5-fold, an increase of almost 1 million; but coverageremains low, with only 31% of those in need receiving therapy and in 2007an estimated 2.5 million becoming newly infected. Decreases in mortality ofthose receiving treatment is the same for low- and middle-income countriesas for high-income countries. In 2007, 33% of HIV-positive pregnant womenin low- and middle-income countries received antiretroviral drugs to preventtransmission to their child; almost a 3-fold increase from 2004 when only12% received the drugs. Tuberculosis is the leading cause of death amongpeople with HIV. Unfortunately, many people do not know their HIV status

Fig. 9. Human immunodeficiency virus. (From UNICEF. Progress for children—a world fit forchildren: statistical review. Number 6, December 2007. http://www.unicef.org/progress-forchildren/2007n6/index_41401.htm.; with permission.)
320 DUNCAN
and a large number live with undiagnosed HIV. Unless that status is checkedand only the tuberculosis is treated, satisfactory results are elusive. Targeting ofhigh-risk groups is effective [51].
New evidence from the Comprehensive International Program for Researchin AIDS suggests that diagnosis of infants as young as 6 weeks followed bya combination of 3 antiretroviral drugs (lopinavir-ritonavir, zidovudine, andlamivudine) substantially reduces infant mortality (75%) as well as the progres-sion of HIV (76%). The randomized study involved infants 6 to 12 weeks old;252 received early treatment and 125 received treatment delayed by a mean of40 weeks. Four percent of the infants in the early treatment group diedcompared with 16% in the delayed group [52].
Male circumcision reduces the risk of heterosexually acquired HIV infectionin men. A large Randomized Clinical Trial (RCT) of HIV-negative men aged15 to 49 years were assigned either to an immediate circumcised group (2474)or to a 24-month delayed circumcision group (2522) [53]. The subjects werefollowed with HIV testing, physical examination, and interviews at baseline,and at 6, 12, and 24 months. The groups were similar at baseline and ateach evaluation period. There was 90% to 92% retention in both groups.Over the 24 months, the incidence of HIV conversion in the group whoreceived immediate circumcision was 0.66 cases per 100 person-years
321GLOBAL CHILD HEALTH
compared with an incidence of 1.33 cases per 100 person-years in those whohad delayed circumcision.
Breast milk transmitted HIV
The HIV/AIDS epidemic and the strong likelihood of vertical transmission ofthe virus through breast milk to the suckling infant and milk substitutes intro-duced considerable controversy. Were deaths more likely from newborns in-gesting breast milk contaminated with the AIDS virus or from drinkingformula mixed with water contaminated with bacteria or enteroviruses? Inareas where water contamination is not a serious problem, mothers who areHIV-infected are advised not to breastfeed their newborn infant. In regionswhere the water supply is not optimal, breast milk was safer; provided itwas the exclusive and only nutrient the infant ingested. Maternal characteristicsthat enhance transmission include recently acquired HIV infection, a high viralload, lower CD4 counts, and breast abnormalities or breast infections. Infantcharacteristics that promote transmission are oral lesions or sores such as candi-diasis [54]. Breast milk contaminated with HIV is responsible for transmittingthe virus to 200,000 (40%) of the 500,000 new infections occurring in childreneach year. Observational cohort studies in Africa indicate that postnatal trans-mission of HIV through breast feeding increases the risk of infection by a factorof 7.5 [55]. Exclusive breast feeding for the first 4 to 6 months will reduce the riskof transmission. A single dose of peripartum prophylaxis with antiretroviralagents reduces intrapartum transmission, but the effect does not extend beyond4 to 6 weeks. The large RCT study by Kumwenda and colleagues providedevidence that extended antiretroviral prophylaxis reduces breast milk transmis-sion. These investigators screened 46,186 pregnant women for HIV in Malawiand enrolled 3016 infants in the 3-armed study [56]. All infants in the controlgroup (788) received only a single dose of nevirapine plus 1 week zidovudinegiven twice daily. Infants in another group (800) received what the controlgroup received plus daily prophylaxis with nevirapine for 14 weeks. Infantsin the third group (801) received what the control group received, plus dailynevirapine and zidovudine for 14 weeks. The frequency and duration of breastfeeding did not differ between the 3 groups. Nearly 90% were breastfeeding at6 months but only 27% to 32% were still nursing at 9 months. The controlgroup had consistently higher conversion rates from 6 weeks through 18months than the infants in either the second or third group, with no statisticaldifference between the latter 2 groups. At 9 months, conversion rates were10.6%, 5.2%, and 6.4%, respectively. Regardless of HIV infection, 9.5% or285 of the 3016 infants in the study died. At 9 months, mortality in the controlgroup was 8.9% and 6.8% in group 2 and 6.3% in group 3 (no statistical differ-ence). The primary causes of death were gastroenteritis and pneumonia.Survival in the HIV-negative infants was significantly better in both extendedprophylaxis groups at 9 months and in the extended nevirapine group at 15months [57]. (For reference: in 2006, the infant mortality rate in Malawi was76/1000 or 7.6%.)
322 DUNCAN
THE WHO CONSENSUS STATEMENT ON HIV AND INFANTFEEDING (NEW FINDINGS)‘‘The most appropriate infant feeding option for an HIV-infected mothershould continue to depend on her individual circumstances, including herhealth status and the local situation, but should take greater consideration inthe health services available and the counseling and support she is likely toreceive. Exclusive breastfeeding is recommended for HIV-infected women forthe first 6 months of life unless replacement feeding is acceptable, feasible,affordable, sustainable and safe for them and their infants before that time.When replacement feeding is acceptable, feasible, affordable, sustainable andsafe, avoidance of all breastfeeding by HIV-infected women is recommended.At 6 months, if replacement feeding is still not acceptable, feasible, affordable,sustainable and safe, continuation of breastfeeding with additional complemen-tary foods is recommended, while the mother and baby continue to be regu-larly assessed. All breastfeeding should stop once a nutritionally adequateand safe diet without breast milk can be provided’’ [58].
The new findings that prompted the statement included: exclusive breastfeed-ing (BF) for up to 6 months is associated with a 3- to 4-fold decrease in the riskof HIV transmission compared with nonexclusive BF; where free infantformula was provided the combined risk of HIV transmission and death wassimilar whether infants were formula fed or breast fed from birth; early cessa-tion of breast feeding was associated with reduced HIV transmission but withan increase risk of morbidity and child mortality.
In places where water contamination was inevitable, if formula was suppliedand hygienic preparation was insured, would it make a difference [59]? Basedon the following observations, the answer is no. Promotion of exclusive BF inHIV-endemic countries would prevent 13% of current deaths whereas use ofnevirapine and formula feeding would prevent only 2% of current childhooddeaths. In a comprehensive ‘‘formula plus’’ program in Haiti, including weeklyvisits for formula milk and education of proper preparation and growth moni-toring, HIV transmission was greatly reduced but infant mortality was veryhigh (217/1000 live births). In 1999, a program in Botswana provided freeformula to HIV-infected mothers. In the first quarter of 2006, an area in thatcountry experienced a diarrhea epidemic, and reported 35,000 cases of diar-rhea and 532 deaths compared with 100 cases and 21 deaths during thesame period a year earlier. Powdered formulas are not sterile products andmay contain pathogenic bacteria. Health care professionals need to go beyondthe ‘‘molecular-level’’ of disease and address larger issues such as ‘‘social,economic, and political determinants of health and sickness.’’ This issue willbe addressed more extensively later, but note that lack of clean water kills 5times more children than HIV/AIDS, and hampers economic growth. Of the6 billion people in the world, 1.1 billion lack proper access to clean waterand 2.6 billion lack access to sanitation. Sub-Saharan Africa loses 5% of itsGross Domestic Product (GDP) every year due to a lack of proper access toclean water and sanitation. That is more money than it obtains from aid.

323GLOBAL CHILD HEALTH
The ‘‘water crisis’’ is ‘‘deeply rooted in poverty, inequality, and unequal powerrelationships.’’
THREE ROOT CAUSES OF CHILD MORBIDITY AND MORTALITYHealth professionals working in the international child health arena need tolook beyond the long lines of patients that gather at the health facilities. Thenumbers defy the resources. The diseases they present are but the conse-quences of fundamental underlying problems. The diseases are merely symp-toms of more basic issues. Until the root causes are ameliorated, the lineswill not go away. As populations increase, so will the hordes of patients.The lines will grow longer and longer. The needs will continue to increaseand even further outstrip the limited resources.
There are at least 3 basic ‘‘wrongs’’ or disparities that are responsible for thestill unacceptably high rate of infant and childhood mortality and of maternalmortality, as well as the enormous levels of morbidity seen in many parts of thedeveloping world. In the leading author’s (B.D.) view, the big 3 priorities are:(1) the elimination of severe poverty, (2) improving the levels of educationparticularly for females, and (3) the provision of accessible potable water andadequate sanitation.
Raising the level of income gives families the ability to purchase nutritiousfood and to send their children to school. Thus, improving economic levelswill increase the likelihood that the children will receive higher education, re-sulting in a spiral of better jobs and improved income. An informed, educatedmother will see that her child gets immunized and is taken to the health facilityearly in the course of an illness. The treatment of diarrhea is ORS, but the solu-tion is clean water.
1. Elimination of severe poverty (MDG #1, #4, and #8)Growth and development are more dependent on socioeconomic status than genetics
In April 2006, the WHO published a set of new growth charts for childrenfrom birth to 5 years of age [60]. The charts were based on a prospective inter-national sample of infants and children selected to represent optimal growthfrom 6 diverse countries; Brazil, Ghana, India, Norway, Oman, and the UnitedStates. Prospective longitudinal data were collected from a favorable socioeco-nomic population of more than 8000 single, term infants without any signifi-cant morbidity, who had been exclusively breastfed for at least 4 monthsand had been born to mothers who did not smoke before or after delivery.This study found that the growth of children is less influenced by geneticsor divergent populations than it is from the environment and feeding practices.Although individual children grow differently, the growth pattern of the chil-dren in these 6 countries was very similar. The charts also documented timeswhen key motor milestones should be met.Most of the world has been using the National Center for Health Statisticscharts published over 30 years ago as a growth reference [4]. Those curves
324 DUNCAN
were based on a limited sample of children living in the United States, most ofwhom had been fed formula rather than breast milk.
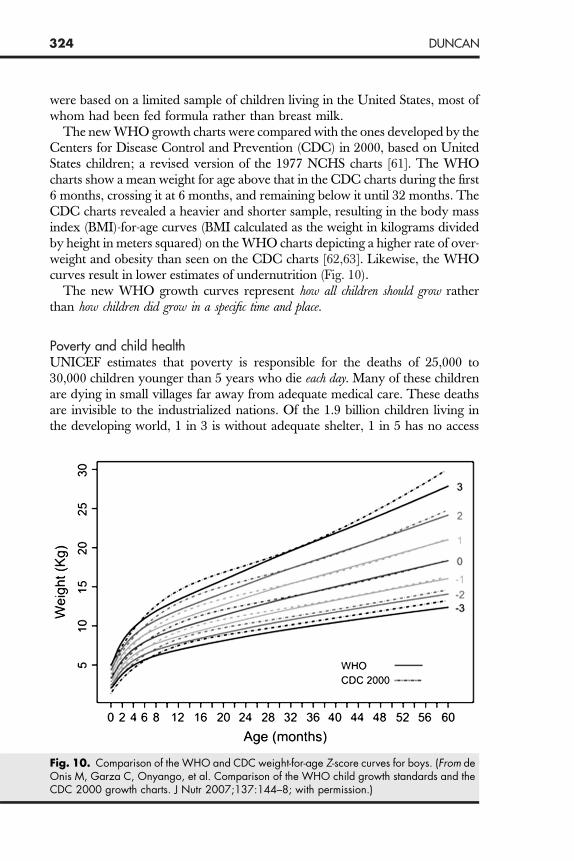
The new WHO growth charts were compared with the ones developed by theCenters for Disease Control and Prevention (CDC) in 2000, based on UnitedStates children; a revised version of the 1977 NCHS charts [61]. The WHOcharts show a mean weight for age above that in the CDC charts during the first6 months, crossing it at 6 months, and remaining below it until 32 months. TheCDC charts revealed a heavier and shorter sample, resulting in the body massindex (BMI)-for-age curves (BMI calculated as the weight in kilograms dividedby height in meters squared) on the WHO charts depicting a higher rate of over-weight and obesity than seen on the CDC charts [62,63]. Likewise, the WHOcurves result in lower estimates of undernutrition (Fig. 10).
The new WHO growth curves represent how all children should grow ratherthan how children did grow in a specific time and place.
Poverty and child health
UNICEF estimates that poverty is responsible for the deaths of 25,000 to30,000 children younger than 5 years who die each day. Many of these childrenare dying in small villages far away from adequate medical care. These deathsare invisible to the industrialized nations. Of the 1.9 billion children living inthe developing world, 1 in 3 is without adequate shelter, 1 in 5 has no accessFig. 10. Comparison of the WHO and CDC weight-for-age Z-score curves for boys. (From deOnis M, Garza C, Onyango, et al. Comparison of the WHO child growth standards and theCDC 2000 growth charts. J Nutr 2007;137:144–8; with permission.)
325GLOBAL CHILD HEALTH
to safe water, 1 in 7 has no access to health services, and 2.2 million childrendie each year from illnesses that could have been prevented, but were not.These 2.2 million children would be alive if only they had received the recom-mended immunizations and had been afforded adequate health care. A civilizedworld cannot/should not accept this appalling situation.
In 2005, 12% of the world’s citizens were living on US$1 per day and almosthalf of all the children on this planet were living below the poverty line.Twenty percent were living on less than $2 per day and over 3 billion weretrying to survive on less than $2.50 per day. Eighty percent or 5.1 billion ofthe 6 billion of all the earth’s inhabitants earned less than $10 per day [64].
SOCIAL RISK FACTORS AND CHILD SURVIVALIN THE UNITED STATESThere is much to do both at home and abroad. Larson and colleagues exam-ined the effects of 8 social risk factors on a child’s general health in the UnitedStates (ie, dental health, socio-emotional health, and overweight) [65]. Theirstudy emphasized some of the disparities in the United States and the needto address multiple levels of social problems if the health of children here inthe United States is to be improved.
These investigators used data from the 2003 National Survey of Children’sHealth, a telephone survey of 102,353 parents of children between birth and 17years of age. The 8 risk factors included no education beyond high school ofany household member, uninsured children, a family income less than 200%of the federal poverty level, not a 2-parent household, race/ethnicity, familyconflicts, low maternal mental health, and living in an unsafe neighborhood.More than half of the children had 2 or more risk factors and one-quarterhad 4 or more risk factors. Low maternal mental health, black or Hispanicrace/ethnicity, less than 200% below the federal poverty line, low householdeducation, living in an unsafe neighborhood, and lack of health insuranceincreased the odds for poor health.
What interventions work?
There is a strong association between undernutrition and mortality. In addi-tion, micronutrient deficiencies account for 10% of childhood deaths. Ninetypercent of these children live in sub-Saharan Africa and South-Central Asia.It is estimated that worldwide, there are 178 million children who are stunted(height-for-age Z score more than 2 SD below the mean), 55 million who arewasted (weight for height Z score less than 2 SD below the mean), and 19million who have severe wasting or severe acute malnutrition (weight forheight Z score less than 3 SD below the mean). Bhutta and colleagues con-ducted an extensive review of 209 articles spanning the past 25 years, withthe vast majority of the studies published after 2000. These investigatorssought to determine whether food supplementation interventions actuallyimprove maternal and childhood nutrition and survival [66]. Food supplemen-tation can reduce the prevalence of stunting by one-third; reduce mortality
326 DUNCAN
from birth to 36 months by one-fourth; reduce disability-adjusted life-years(DALYs) associated with stunting, severe wasting, intrauterine growth restric-tion, and child mortality associated with micronutrient by one-fourth; and withuniversal supplementation of calcium, iron, and folic acid during pregnancycan prevent almost one-fourth of all maternal deaths. The long-term effectsof stunting on cognition and earning potential are other importantconsiderations.
Because it is difficult to affect stunting after 36 months of age, interventionsmust be directed at pregnant women and at children from birth to 24 months.Supplemental feeding programs that focus on older children will not affectlinear growth. Moreover, rapid weight gain from supplemental programsdirected at older children may result in an increase in BMI with probableadverse long-term effects. Food supplementation programs like the one inGuatemala have shown beneficial long-term economic benefits [29,30].
Evidence-based intervention programs show beneficial outcomes. What isneeded is the technical expertise to determine ‘‘which interventions shouldbe given the highest priorities and ensure their effective implementation’’ and‘‘the political will to combat undernutrition in the very countries that need itmost’’ [66].
Two solutions to combat poverty and improve healthConditional cash transfer programs: a ‘‘magic bullet for health’’
Conditional cash transfer (CCT) programs began in Mexico 10 years ago(1998) when Fernald and colleagues randomly assigned 506 low-incomecommunities for either immediate enrollment (320 communities with 6311households) or after a wait of 18 months, enrollment of 186 communitieswith 4029 households [67]. The families would receive a monthly fixed stipend,but the money transfer would occur only on the condition that the familywould obtain preventive medical care and agree to use the funds to purchasemore nutritious foods. A second type of transfer was through educationalscholarships that were received by the family, but only if their children at-tended school a minimum of 85% of the time and did not repeat a grademore than twice. Only 1% of the families were denied cash transfers becauseof noncompliance. Nine years later,; the total cost of the program was $3.7billion and had reached more than 5 million families, for an average expendi-ture of $740 per family. The outcome of 2449 children aged between 24 and 38months who had been enrolled in the program since birth was assessed. Theresults were encouraging: 70% of the cash transfer was spent on purchase of‘‘better quality calories,’’ there was a lower prevalence of stunting and a lowerprevalence of overweight, as determined by a decrease in BMI for age;language development; and an improvement in mental development inshort-term or working memory, which is most sensitive to differences in socio-economic status and is a measure of executive function.A literature search by Lagarde and colleagues uncovered 28 articles on CCT,of which only 6 met their criteria for study design. There were 5 programs in

327GLOBAL CHILD HEALTH
Latin America (Mexico, Honduras, Columbia, Nicaragua, and Brazil) and 1 inAfrica (Malawi) [68]. In general, CCT programs resulted in an increased useof health services, improved nutritional and anthropometric outcomes,and preventive behaviors. The nutritional improvement was greatestin the younger children. Immunization rates varied. The ‘‘overall effect on healthstatus was less clear.’’ The results were somewhat dependent on the size of themonetary transfers but, most importantly, on the availability and ease of accessto primary health care services.
In 2007, New York City launched its own CCT pilot program, the first to beestablished in the United States. A third component (workforce-participation)was added to the 2 traditional components of health and education.
Microenterprise or Microcredit
Muhammad Yunus received the 2006 Nobel Peace Prize for his innovation ofmicrocredit for the poorest of the poor. Realizing that the poor have no collat-eral and hence no way to secure loans from commercial banks, he establisheda different kind of bank: the Grameen Bank. The Bank offered small loans of30 to 40 US dollars to individuals using the only collateral they had; their wordthat they would repay the loan. The Bank felt women would use the fundsmore wisely than men and were more responsible, as their lives and the livesof their children were in the balance. These loans enabled families to start smallbusinesses. A global movement of microcredit was launched. Thousands ofinstitutions have now adopted this strategy, and it is present in 43 differentcountries. More than 100 million poor people have taken advantage of micro-loans and many are escaping poverty. The loans are paid back at a rate ofgreater than 98%. Dr Yunus is extending the program from starting businessesto helping people pay for education and housing. His goal over the next 10years is to extend the loans to half a billion people who are living in poverty[69,70].MDG #8: A global partnership for development
Data 2007 is the second annual report on the progress of commitments made bythe Group of Eight (G8) in Gleneagles in 2005; ‘‘the year of Africa’’ and theGlobal Call to Action Against Poverty [71]. The G8 is composed of the 8 richestindustrialized countries: France, Germany, Italy, Japan, the United Kingdom,the United States, Canada, and Russia. Some important gains have beenachieved. Debt cancellation for some African nations and targeted aid hashelped 20 million African children enter school. In 2002, only 50,000 or1% of Africans in need of antiretroviral treatment had access to it but by2006, the number had increased to 1.34 million, yet was reaching only26% of those in need of treatment. More effective aid has improved economicgrowth and decreased poverty; for example, in Mozambique, from 2002 to2004 aid increased from $49 to $63 per capita and the country’s annualGDP growth rate increased from 2% to 8%, while the under-5 mortalityrate dropped from 178 to 152 per 1000 live births. The Lubombo regionof South Africa has used this aid to buy insecticide-treated bed nets, resulting
328 DUNCAN
in a 90% reduction of malaria prevalence with a potential of furtherdecreasing the 3000 daily malaria-related deaths in Africa.
Individual G8 nations are keeping their promise in specific areas: Japan andthe United Kingdom have increased aid; the United Kingdom and Canadahave invested in education; The United States has made good on its promisesfor aid in the fight against HIV/AIDS and malaria; Germany, France, and Italyhave invested in water and sanitation. However, all is not positive. Total G8assistance increased only $2.3 billion, less than half of the $5.4 billion prom-ised; the United Kingdom and Japan have kept to their deal but the UnitedStates, Canada, Germany, and France have not, and Italy has actually cut itsaid. Only small increases in aid were scheduled for 2007 and 2008. A lackof global agreement on trade and failure to focus on Africa will prevent evenwell-governed African countries from succeeding in their efforts to reducepoverty. The way the G8 decided to account for debt relief masks the realpicture of development assistance. Piecemeal progress on specific issues willnot lead to the overall results promised by the G8 countries.
2. Improving the levels of education and the numbers of educated females(partially addressed earlier under female education, MDG #2, #3, and #5)Economic discrepancies related to maternal and child health
Health outcomes are directly related to household income, as are educationallevels, particularly of women. Houweling and colleagues examined the inequal-ities among 4 economic groups (the urban rich, the urban poor, the rural rich,and the rural poor) living in 45 developing countries [72]. Assignment to these4 wealth-related groups was done by using household ownership of durablegoods, housing quality, and water and sanitation facilities. Five indicatorswere used to estimate the level of health care; professional delivery attendance,professional antenatal care, fully immunized children, and childhood treatmentof diarrhea and of acute respiratory infections. No discrepancies were seen inrespect to these child care indicators. However, wealth and maternity careare linked; the less wealth, the less care with the poor-rich inequalities, loominglarger in respect of deliveries by professional trained care providers than provi-sion of antenatal care. Professional delivery attendance is higher in urban thanin rural areas, but in most countries the urban poor and the rural rich havevery similar levels. The percentage of poor mothers who receive antenatalcare is high, but the percentage being delivered by professional trainedproviders is very low. Relative inequalities tend to be larger in the countrieswhere there are lower overall levels of health care use. Cultural differencesmay partially explain some of the discrepancies: poor women may favor tradi-tional birth attendants or family members to assist in the deliveries and mayfavor home deliveries; women in richer families are often better educatedand have a more ‘‘modern view;’’ and some families may be less willing tospend money on women’s health (perhaps particularly true in South EastAsia). Availability of resources are implicated in explaining the difference inhealth outcome for maternal and child health services: there are serious
329GLOBAL CHILD HEALTH
insufficiencies of well-trained personnel who are trained to recognize dangersigns in the pregnant woman; there is a lack of 24-hour easy accessible deliveryservice facilities equipped with the supplies and personnel to handle emergen-cies; there is a serious lack of available timely transportation for the woman inlabor who is experiencing problems; and then there is the expense, as adequateand appropriate physical infrastructure is more costly for deliveries than for thechild care indicators. A few countries have addressed these barriers. Indonesiahas concentrated on improving the availability of a narrow range of maternitycare services whereas Honduras, Cuba, Sir Lanka, and the Kerala State inIndia have improved a broader range of health services that include maternityservices.
This study provides important insights into why there has been so little prog-ress in decreasing the unacceptably high maternal mortality rates in manycounties and with the different populations within countries. We are farfrom reaching the MDG #5 of reducing maternal mortality by 75% by 2015,with just 7 years left. Pediatricians are very much aware of this issue, asa maternal death is a death toll for her infant. Mortality within the first 28days of life accounts for 27% of all childhood deaths. Reducing maternal deathswill in turn help reduce childhood mortality.
Maternal mortality and safe motherhood strategies (MDG #5)
Compared with the gains made in infant and under-5 mortality over the past 25years, there has been little change in maternal mortality. Saving the mother’slife not only averts the death of her newborn infant, it also prevents emotionaltrauma to her other children and the likelihood of their ill health and starva-tion. Each year, half a million women die a maternal death; a death duringpregnancy, at the time of labor, or during the 42 days following delivery.Ninety-nine percent of these deaths occur in the developing world. The lifetimerisk of a woman dying a maternal death in industrialized countries is 1 in 8000,but for a woman living in sub-Saharan Africa the risk is 1 in 22 [11]. Hemor-rhage is responsible for approximately 25% of the deaths, infections andeclampsia each another 13%, and obstructed labor 8%. All of these complica-tions demand early recognition and prompt referral to a facility equipped todeal with the emergency.Safe motherhood practices have been instituted in only a relative few areas.One such area is Nepal. Freedman and colleagues stress the importance ofstrengthening the capacity of the district health system to implement integrated‘‘functioning services that are accessible to and used by all segments of the pop-ulation’’ [73]. Isolated changes are not enough. The focus must be a broad-based multisectorial change. Establishing such a system will also have a positiveeffect on other emergency and referral services. Practical lessons can be learnedfrom the 4 major global safe motherhood initiatives of the past decade. Threekey elements are crucial: family planning, skilled care for all deliveries, andaccess to emergency obstetric care for women who are identified as havinglife-threatening complications. What to do is known, but how to do it will
330 DUNCAN
vary with the local situation. Geographic distribution, skilled personnel, thehigh cost of keeping adequate obstetric facilities open 24 hours a day, and trans-portation all present challenging problems. The ultimate goal is for every birthto be attended by a skilled health professional, one who can recognize risks andcomplications and initiate an appropriate referral to a center where the womencan receive appropriate obstetric care. A needs assessment is fundamental toidentify how to proceed in implementing the most important positive changes.Such an assessment allows the building blocks of the health care system to beput in place.
Maternal mortality rates over a 30-year period in 2 adjacent areas inBangladesh with different levels of care have been compared [74]. In 2002,the population in these areas was 220,000 and the 2 areas were similar in socio-economic criteria. One area was served by the International Center for Diar-rhoeal Disease Research (ICDDR). There, maternal and child health serviceswere introduced in the late 1970s and a safe motherhood program was pilotedin 1987. The health centers were staffed by trained midwives and transporta-tion was provided to a referral hospital when necessary. The other areareceived routine government services.
Over the 30-year period, maternal mortality fell substantially. In the ICDDRarea the decrease was 68%, from 412 to 131 per 100,000 live births. In theGovernment service area the decrease was 54%, from 451 to 206. From1990 onward the decline was 7% and 4% per year, respectively. Introductionof the safe motherhood program did not produce a statistically significantdifference. Nor was there a statistically significant difference with the shiftfrom home births to facility-based births or the availability of antibiotics.The proportion of pregnant women with formal education increased 50%.Mortality was 3 times lower in women who had 8 or more years of educationcompared with women with no formal education, and abortion mortality was11 times lower in the highly educated women. The number of pregnant womenwho lived in the lowest asset quintile decreased from one-third to less than 1%.The gap in mortality between the rich and the poor and between the educatedand uneducated was striking.
Investment in trained birth attendants and the availability of emergencyservices are important in reaching the MDG #5, but female education anddecrease in poverty are essential to sustain any of the success that was achievedin Bangladesh.
3. The provision of accessible potable water and adequate sanitation(MDG #7)
From 1990 to 2004, there has been considerable improvement in the provisionof safe drinking water to developing world countries, from 71% to 80%, witha goal of 86% by 2015. The greatest strides were seen in South Asia (71% to85%, with a goal of 86%), less in the East Asia/Pacific area (72% to 79%,with a goal of 86%), but far too little progress in sub-Saharan Africa (48% to55%, with a goal of 74%) (Fig. 11).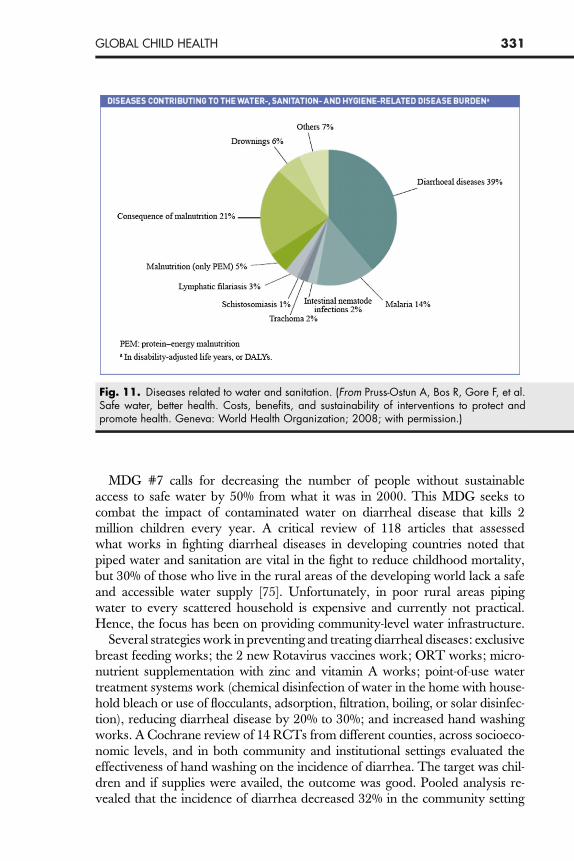
Fig. 11. Diseases related to water and sanitation. (From Pruss-Ostun A, Bos R, Gore F, et al.Safe water, better health. Costs, benefits, and sustainability of interventions to protect andpromote health. Geneva: World Health Organization; 2008; with permission.)
331GLOBAL CHILD HEALTH
MDG #7 calls for decreasing the number of people without sustainableaccess to safe water by 50% from what it was in 2000. This MDG seeks tocombat the impact of contaminated water on diarrheal disease that kills 2million children every year. A critical review of 118 articles that assessedwhat works in fighting diarrheal diseases in developing countries noted thatpiped water and sanitation are vital in the fight to reduce childhood mortality,but 30% of those who live in the rural areas of the developing world lack a safeand accessible water supply [75]. Unfortunately, in poor rural areas pipingwater to every scattered household is expensive and currently not practical.Hence, the focus has been on providing community-level water infrastructure.
Several strategies work in preventing and treating diarrheal diseases: exclusivebreast feeding works; the 2 new Rotavirus vaccines work; ORT works; micro-nutrient supplementation with zinc and vitamin A works; point-of-use watertreatment systems work (chemical disinfection of water in the home with house-hold bleach or use of flocculants, adsorption, filtration, boiling, or solar disinfec-tion), reducing diarrheal disease by 20% to 30%; and increased hand washingworks. A Cochrane review of 14 RCTs from different counties, across socioeco-nomic levels, and in both community and institutional settings evaluated theeffectiveness of hand washing on the incidence of diarrhea. The target was chil-dren and if supplies were availed, the outcome was good. Pooled analysis re-vealed that the incidence of diarrhea decreased 32% in the community setting

332 DUNCAN
and 39% in the institutional setting [76]. Education by itself was the least cost-effective measure, particularly when maternal literacy was low.
2008 is the international year of sanitation
From 1990 to 2004, there has been considerable improvement in the provisionof sanitation to developing world countries, from 35% to 50%, but well belowthe goal of 68% by 2015. The greatest strides were seen in the East Asia/Pacificarea (30% to 51%, with a goal of 65%) and South Asia (17% to 37%, with a goalof 59%), but little progress is apparent in sub-Saharan Africa (22% to 27%, witha goal of 66%).A longitudinal study determined the effect on diarrheal morbidity in childrenyounger than 3 years following an intervention that improved sewage coveragefrom 26% to 80% in households in Salvador, Brazil. The intervention hada significant effect, with diarrhea days per child-year decreasing by 22% [77].
Data on the economic status, level of childhood underweight, availability ofclean water, and type of sanitation and indoor air pollution from householdfuels from 52 countries in Latin America, the Caribbean, South Asia, andsub-Saharan Africa was used to estimate what reduction would occur in childmortality if child nutrition was improved and if clean water, sanitation, andclean fuels were provided [78]. The effects of the interventions were relatedto the economic status of those receiving the interventions. If these strategiesreached all the children who needed them, the predicted result would reducechild deaths each year by 49,700 (14%) in Latin America and the Caribbean,by 0.8 million (24%) in South Asia, and by 1.47 million (31%) in sub-SaharanAfrica. As expected, the poor were at greatest risk for all the factors assessed. Ifthe strategies targeted the poor first, the reductions would be 30% to 75% largerthan if the same 50% coverage reached the wealthier households before thepoor households. Targeting the poor first would have the greatest impactand would help close the disparity in child mortality between the poor andthe wealthy.
Large-scale investments in water and sanitation infrastructure can havea strong positive impact on child mortality. In the United States, filtrationand chlorination technology was responsible for one-half of the decline in childmortality. An increase of 10% of the homes with improved water and sanitationon Native American Reservations in the United States resulted in a 4%decrease of child mortality. Community water sources often do not havea significant health impact, particularly if the source is surface water, as it isoften contaminated with pathogens and, unfortunately, wells often fall intodisrepair due to poor maintenance. Nearly half of the borehole wells in Kenyaare in disrepair. One-quarter of India’s water infrastructure is in need of repair.More than one-third of the rural water infrastructure in South Asia is not func-tional. There is a high degree of recontamination of water in transport or instorage. Sanitation and hygiene is as important or more important than waterquality.
333GLOBAL CHILD HEALTH
The ultimate goal is piped water to all households, but until then emphasisshould be on: (1) concentrating efforts on point-of-use water treatmentprograms; (2) encouraging village councils headed by women as they aremore likely to invest in public infrastructure for drinking water; (3) givingcommunities direct control or ownership over key decisions.
Access to safe water and basic sanitation would result in 200 million fewerepisodes of diarrhea each year and prevent 2.1 million deaths each year.Improving water supply, sanitation, hygiene. and management of waterresources could reduce the global disease burden by 10% [79].
The rapid growth of slums has slowed reaching the MDG #7 target
The quality of available water and the adequacy of sanitary facilities are evenworse in the sprawling slums of the major cities in the developing world. Across-sectional study assessed the effect of overcrowding and resultant prox-imity of water supply and pit latrines in an urban slum in Eldoret, Kenya[80]. Forty percent of the pit latrines were less than the recommended 15 mfrom the water source, and 30% of children did not use latrines but defecatedin the field. Most people (91%) used wells for their water supply, but the wellswere highly contaminated with fecal matter. Shallow wells were used by 89% ofthe population and Escherichia coli was found in all samples taken from theseshallow wells. The shallow wells lacked concrete slabs, often the openingwas not covered at all, and none met the WHO requirements for drinkingwater. Deep wells had a pipe system but were used by only 2% of the popula-tion, and 3 of 4 samples taken from these deep wells were contaminated withcoliform organisms. Only 42% of those using well water boiled the water usedfor drinking.In Kenya, the number of people living in slums nearly doubled in the 18years from 1980 to 1998. Slums are home to 70% of all urban residents insub-Saharan Africa. Many governments either do not accept any responsibilityfor the health of squatting slum dwellers or do not have sufficient funds toprovide clean water, drainage, sewerage, and rubbish removal. The percentageof people living in the urban slums who lack these vital services is already high,and the numbers are growing. The prevalence of diarrhea among slumdwellers was double what it was for the city and for the national average.Moreover, the under-5 mortality in slum residents in Nairobi is 35% higherthan in the city or among rural populations.
There are many factors that lure rural farmers from the land to the city. Thesize of family plots has decreased due to governmental acquisition and to divi-sion among the children. ‘‘Fair trade’’ practices of foreign governments and thesubsidies given to in-country farmers make it difficult for the local farmers tocompete in the market place. It is increasingly difficult for farmers to makea living in the rural areas. All of this plus the lure of the city and the dreamof getting rich has driven many to urban areas. Municipal governments havenot prepared for this influx. The sprawl begins, but the usual vital utilitiesare not there. Poverty and disease infuse the area and crime rises. The problem
334 DUNCAN
is huge and growing. In Ethiopia and Chad, 99.4% of the urban populationslive in slums. The next highest percentage of slum dwellers is in Afghanistan(98.5%) and Nepal (92%). Ten to 12 million people live in the slums of Mum-bai, and 9 to10 million live in the slums of Mexico City [81].
GLOBAL CLIMATE CHANGE AND CHILDREN’S HEALTHThe American Academy of Pediatrics (AAP) statement on climate changeemphasizes the fact that children are a particularly vulnerable group that ‘‘islikely to suffer disproportionately from both direct and indirect adverse healtheffects of climate change.’’ The AAP cites several adverse examples that theanticipated climate change will cause: reduction in the availability of food re-sulting in an increase in malnutrition; water availability will become less insome regions, potentiating dehydration in children; flooding will occur in otherareas; and people living in coastal areas will be displaced. Greater adverseeffects will be seen on the less mobile and more dependent citizens, the chil-dren. The AAP makes a series of recommendations to pediatricians and togovernments to mitigate the effects of climate change [82].
A UNICEF report focused on what affect climate change may have on theMDGs, and concluded that climate change will likely reduce any likelihoodthat several of the 8 goals will be met [83]. As the world warms and rains fail, cropswill wither and livestock will die. A lack of food will result in an increase in malnu-trition and childhood mortality. Malnutrition will also have an adverse affect onpregnant women, and their fetuses will suffer. The WHO estimates that in 2000,climate change was responsible for 2.4% of worldwide episodes of diarrhea and6% of malaria in some middle-income countries. As the world warms, watershortages will increase; by 2020 an estimated 75 million people in Africa alonewill experience water stress. Weather-related events like hurricanes and floodingwill intensify, coastal areas will be inundated, and millions will be displaced. Chil-dren are more affected, and more will die of starvation while many will becomeorphans. In the first half of the 20th century, 12 natural disasters occurred annu-ally. In 2004, the number was 350.
There is already some response to this impending problem. In Niger, commu-nity gardens are encouraged and are nourishing hope. Conservation throughtree planting is increasing; the Ethiopian Government has set a goal of planting20 million trees and the United Nations Environment Program launched the‘‘Plant for the Planet: Billion Tree Campaign’’ with the goal of planting 1 billiontrees by 2007. Community-based advocacy programs are involving youth inplanning and decision making. The United Nations Environment Programand UNICEF are developing an Environmental Education Resource Pack forChild-Friendly Schools offering comprehensive solutions to empower children.
INTERNATIONAL HEALTH TRAINING IN PEDIATRICRESIDENCY PROGRAMSTen years ago, the AAP’s Section on International Child Health surveyed pedi-atric residency programs in the United States to document the interest in

335GLOBAL CHILD HEALTH
international electives [84]. Nelson and colleagues recently conducted a similarsurvey of 201 accredited pediatric residency programs in the United States, Pu-erto Rico, and the Caribbean. More than half of the responding programs offera ‘‘global health’’ elective as compared with just 25% from the survey done 10years earlier [85]. Half of these programs had a global health curriculumincluding didactic lectures and case reports. Six percent had a formal globalhealth track, and another 7% said they were intending to initiate one withinthe next 2 years. Only 36% of the programs provided prerequisite clinicaltraining or cultural orientation as recommended by the AAP, but the majorityoffered pretravel briefing, faculty mentorship, and debriefing sessions. Aquarter of the programs reported that ‘‘at least half’’ of their residents hadhad an international health experience before beginning residency training.The majority of the residents take the elective during their third year, andthe programs reported a mean total of 3 participating residents from theirprogram. The programs listed several potential barriers to establishing a globalhealth elective, including call-free time and funding. (The Residency TravelGrants of $500 offered by the AAP’s Section on International Child Healthwere established to assist with the expense.)
The growing interest in international health should encourage programs toincorporate the opportunity for a global health elective for their residents.Barriers are there but are not insurmountable. A short-term international expe-rience has the potential to improve the lives of children and give a broader
Fig. 12. Yes, you can help. (Copyright UNICEF; reproduced with permission.)

336 DUNCAN
perspective and understanding of the way the majority of the world lives. Aword of caution: such a venture has the potential of altering the way a physicianviews the world and just might influence life-changing decisions.
It is inappropriate for pediatricians from the ‘‘developed’’ world to even tryto make or even suggest policy changes without involving the local pediatri-cians, and they will invariably fail if they try to do so. However, the ‘‘guests’’are in a unique position to assist their colleagues who live this reality every day,pushing their governments to put children higher on the priority scale andfulfill the contracts they agreed to when they signed the World Declarationon the Survival, Protection and Development of Children, the Plans of Action,and the Convention of the Rights of the Child. Only by realigning govern-mental priorities will the MDGs stand a chance of being met.
SUMMARYPerhaps this article can be best summed up by the UNICEF poster (Fig. 12).
References
[1] Declaration of Alma Ata of 1978. Available at: http://www.righttohealthcare.org/Docs/DocumentsC.htm. Accessed October 2008.[2] Asuzu MC. A comparative study of the commonly used nutritional assessment tools for
primary health care. East Afr Med J 1991;68(11):913–22.[3] Schoeman SE, Hendricks MK, Hattingh SP, et al. The targeting of nutritionally at-risk children
attending a primary health care facility in the Western Cape Province of South Africa. PublicHealth Nutr 2006;9(8):1007–12.
[4] Owen GM. The new National Center for Health Statistics growth charts. South Med J1978;71(3):296–7.
[5] Kosek M, Bern C, Guerrant RL. The global burden of diarrhoeal disease, as estimated fromstudies published between 1992 and 2000. Bull World Health Organ 2003;81:197–204.
[6] Parashar UD, Bresee JS, Glass RI. The global burden of diarrhoeal disease in children. BullWorld Health Organ 2003;81:236.
[7] Murray CJL, Lopez AD. The Global Burden of Disease. Boston: Harvard University Press;1996.
[8] Murray CJL, Lopez AD. Global and regional cause of death patterns in 1990. Bull WorldHealth Org 1994;72:447–80.
[9] Murray CJL, Lopez AD. Quantifying disability: data, methods, and results. Bull World HealthOrg 1994;72:481–94.
[10] The State of the World’s Children 1990. Oxford, New York: UNICEF Oxford UniversityPress; 1990. page 23.
[11] UNICEF. Progress for children—a world fit for children: statistical review. Number 6,December. 2007. Available at: http://www.unicef.org/progressforchildren/2007n6/in-dex_41401.htm. Accessed October 2008.
[12] International Code of Marketing of Breast Milk Substitutes. Available at: http://www.ibfan.org/english/resource/who/fullcode.html (reviewed 11/08).
[13] Baby-friendly Hospital Initiative. Available at: http://www.who.int/nutrition/topics/bfhi/en/index.html (reviewed 11/08).
[14] World Health Organization/UNICEF document. published in 1989 by WHO, Geneva,Switzerland.
[15] Kleinman RE, Walker WA. The Enteromammary immune system: an important new conceptin breast milk host defense. Dig Dis Sci 1979;24(11):876–82.
337GLOBAL CHILD HEALTH
[16] Expanded Programme on Immunizations Programme report for the year 1992. Incorpo-rating the recommendations of the global advisory group, October 1992. World HealthOrganization. January 1993. Available at: http://whqlibdoc.who.int/hq/1993/WHO_EPI_GEN_93.1.pdf.
[17] WHO vaccine preventable disease monitoring system. Available at: www.who.int/vaccines-documents/globalsummary/globalsummary.pdf (reviewed 11/08).
[18] WHO vaccine-preventable diseases: monitoring system—2007 global summary.Expanded Programme on Immunization of the Dept. of Immunization, Vaccines, andBiologicals.
[19] Supplementary Immunization Activities (SIAs) operations and quality. Available at: http://www.comminit.com/en/node/223738/292 (reviewed 11/08).
[20] Coghlan A. Measles deaths tumble by 60% worldwide. New Scientist.com news service.12:21.January 19, 2007 (quoting Dr. Margaret Chan, WHO Director-General).
[21] The state of the world’s children 2004. Oxford, New York: (Focus on girl’s education) UNI-CEF Oxford University Press; 2004.
[22] The state of the world’s children 1995. UNICEF. Oxford, New York: Oxford University Press;1995.
[23] Peterson SA. Marriage structure and contraception in Niger. J Biosoc Sci 1999;31:93–104.
[24] The state of the world’s children 1994. Oxford, New York: UNICEF Oxford University Press;1994.
[25] Martorell R, Habicht J-P, Rivera JA. History and design of the INCAP longitudinal study(1969–77) and its follow-up (1988–89). J Nutr 1995a;125:1027S–41S.
[26] Habicht JP, Martorell R. Objectives, research design and implementation of the INCAPlongitudinal study. Food Nutr Bull 1993;14:176–90.
[27] Rivera J, Martorell R, Castro H. Data collection of the INCAP follow-up study: Organization,coverage, sample sizes. Food Nutr Bull 1993;14:258–69.
[28] Ruel MT, Rivera J, Habicht JP, et al. Differential response to early nutrition supplementation:long-term effects on height at adolescence. Int J Epidemiol 1995;24(2):404–12.
[29] Hoddinott J, Maluccio JA, Behrman JR, et al. Effect of a nutrition intervention duringearly childhood on economic productivity in Guatemalan adults. Lancet 2008;371:411–6.
[30] Grosse S, Roy K. Long-term economic effect of early childhood nutrition [Editorial]. Lancet2008;371:365–6.
[31] Mannar MGV. Iodized salt for the elimination of iodine deficiency. Available at: http://206.191.51.240/documents/Iodized%20Salt%20for%20the%20Elimination%20of%20IDD.pdf (reviewed 11/08).
[32] Sommer A. Xerophthalmia, keratomalacia and nutritional blindness. Int Ophthalmol1990;14(3):195–9.
[33] Fawzi WW, Chalmers TC, Herrera MG, et al. Vitamin A supplementation and mortality. Ameta-analysis. JAMA 1993;269(7):898–903.
[34] Sankaranarayanan S, Suarez M, Taren D, et al. The concentration of free holo-retinolbinding protein is higher in vitamin A-sufficient than in deficient Nepalese women in latepregnancy. J Nutr 2005;135(12):2817–22.
[35] Trowbridge F, Martorell R. Forging: effective strategies to combat iron deficiency. Summaryand recommendations. J Nutr 2002;132:875S–9S.
[36] World Health Organization. The prevalence of anemia in women: a tabulation of availableinformation. Geneva: WHO; 1992.
[37] Baig-Ansari N, Badruddin SH, Karmaliani R, et al. Anemia prevalence and risk factors inpregnant women in an urban area of Pakistan. Food Nutr Bull 2008;29(2):132–9.
[38] Lazzerini M. Effect of zinc supplement on child mortality (editorial). Lancet 2007;370:1194–5.
338 DUNCAN
[39] Tielsch JM, Khatry SK, Katz J, et al. Effect of daily zinc supplementation on child mortality insouthern Nepal: a community-based, cluster randomized, placebo-controlled trial. Lancet2007;370:1230–9.
[40] Bhutta ZA, Black RE, Brown KH, et al. Prevention of diarrhea and pneumonia by zinc supple-mentation in children in developing countries: pooled analysis of randomized controlledtrials. Zinc Investigators’ Collaborative Group. J Pediatr 1999;135(6):689–97.
[41] Integrated Management of Childhood Illness. Available at: http://www.who.int/child_adolescent_health/topics/prevention_care/child/imci/en/index.html (reviewed 11/08).
[42] Convention on the Rights of the Child. Available at: http://www.unhchr.ch/html/menu3/b/k2crc.htm (reviewed 11/08).
[43] World Declaration on the Survival. Protection and development of children and plans ofaction. Available at: http://www.unicef.org/wsc/declare.htm (reviewed 11/08).
[44] Millennium Development Goals. Available at: http://un.org/millenniumgoals/bkgd.shtml(reviewed 9/08).
[45] Chan M. Margaret Chan puts primary health care centre stage at WHO [editorial]. Lancet2008;371:1811.
[46] Chan M. Keynote address at the International Seminar on Primary Health Care in RuralChina. Beijing, China: International Seminar on Primary Health Care in Rural China; 2007.
[47] Chan M. Return to Alma-Ata. Lancet 2008;372(9642):865–6.[48] The World Health Report. Primary health care now more than ever. Geneva 27,
Switzerland: World Health Organization; 2008.[49] Murray CJL, Laakso T, Shi buya K, et al. Can we achieve Millennium Development Goal 4
(reduce under-five mortality by two-thirds)? New analysis of country trends and forecasts ofunder-5 mortality to 2015. Lancet 2007;370:1040–54.
[50] Countdown Coverage Writing Group. Countdown to 2015 for maternal, newborn, andchild survival: the 2008 report on tracking coverage of interventions. Lancet 2008;371:1247–58.
[51] Toward Universal Access: Scaling up priority HIV/AIDS interventions in the health sector –progress report 2008. WHO, UNAIDS, UNICEF.
[52] Violari A, Cotton MF, Gibb DM, et al. CHER Study Team. Early antiretroviral therapy andmortality among HIV-infected infants. N Engl J Med 2008;359(21):2233–44.
[53] Gray RH, Kigazi G, Serwadda D, et al. Male circumcision for HIV prevention in men inRakai, Uganda: a randomized trial. Lancet 2007;369:657–66.
[54] Read JS, Committee on Pediatrics AIDS. Human milk, breastfeeding, and transmission ofhuman immunodeficiency virus type 1 in the United States. Pediatrics 2003;112(5):1196–205.
[55] Gray GE, Saloojee H. Breast-feeding, antiretroviral prophylaxis, and HIV [Editorial]. N EnglJ Med 2008;359(2):189–91.
[56] Kumwenda NI, Hoover DR, Mofenson LM, et al. Extended antiretroviral prophylaxis toreduce breast-milk HIV-1 transmission. N Engl J Med 2008;359:119–29.
[57] The state of the world’s children 2008. Oxford, New York: Oxford University Press; 2008.[58] TheWHOconsensus statementonHIVand infant feeding (newfindings).Availableat: http://
www.infactcanada.ca/Newsletters/2007-Winter/who_statement.htm (reviewed 11/08).[59] Coutsoudis A, Coovadia HM, Wilfert CM. HIV, infant feeding and more perils for poor
people: new WHO guidelines encourage review of formula milk policies. Bull World HealthOrgan 2008;86(3):210–4.
[60] WHO Multicentre Growth Reference Study Group. WHO child growth standards based onlength/height, weight, and age. Acta Paediatr Suppl 2006;450:76–85.
[61] de Onis M, Garza C, Onyango AW, et al. Comparison of the WHO child growth standardsand the CDC 2000 growth charts. J Nutr 2007;137:144–8.
[62] Kuczmarski RJ, Ogden CL, Grummer-Strawn LM, et al. CDC growth charts: United States.Advance data from vital and health statistics no. 314. Hyattsville (MD): National Centerfor Health Statistics; 2000.
339GLOBAL CHILD HEALTH
[63] Kuczmarski RJ, Ogden CL, Guo SS, et al. 2000 CDC growth charts for the United States:methods and development. Vital Health Stat 20 2002;11(246):1–190.
[64] Poverty. Available at: http://www.globalissues.org/article/26/poverty-facts-and-stats(reviewed 11/08).
[65] Larson K, Russ SA, Crall JJ, et al. Influence of multiple social risks on children’s health. Pedi-atrics 2008;121(2):337–44.
[66] Bhutta ZA, Ahmed T, Black RE, et al. Maternal and Child Undernutrition Study Group. Whatworks? Interventions for maternal and child under nutrition and survival. Lancet 2008;371:417–40.
[67] Fernald LCH, Gertler PJ, Neufeld LM. Role of cash in conditional cash transfer programs forchild health, growth, and development: an analysis of Mexico’s Oportunidades. Lancet2008;371:828–37.
[68] Lagarde M, Haines A, Palmer N. Conditional cash transfers for improving uptake of healthinterventions in low- and middle-income countries: a systematic review. JAMA 2007;298:1900–10.
[69] Yunus M. Banker to the poor: micro-lending and the battle against world poverty. New York:Public Affairs a member of Perseus Books Group; 1999.
[70] Yunus M. Creating a world without poverty: social business and the future of capitalism.New York: Public Affairs a member of Perseus Books Group; 2008.
[71] The Data Report 2007. Keep the G8 promise to Africa. Available at: http://www.thedatareport.org/pdf/DATAREPORT2007.pdf (reviewed 12/08).
[72] Houweling TAJ, Ronsmans C, Campbell OMR, et al. Huge poor-rich inequalities in maternitycare: an international comparative study of maternity and child care in developing coun-tries. Bull World Health Organ 2007;85:745–54.
[73] Freedman LP, Graham WJ, Brazier E, et al. Practical lessons from global safe motherhoodinitiatives: time for a new focus on implementation. Lancet 2007;370:1383–91.
[74] Chowdhury ME, Botlero R, Koblinsky M, et al. Determinants of reduction in maternalmortality in Matlab, Bangladesh: a 30-year cohort study. Lancet 2007;370:1320–8.
[75] Zwane AP, Kremer M. What works in fighting diarrheal disease in developing countries? Acritical review. World Bank Res Obs 2007;22(1):1–24.
[76] Ejemot RI, Ehiri JE, Meremikwu MM, et al. Hand washing for preventing diarrhoea. Co-chrane Database Syst Rev 2008;23(1):CD00426.
[77] Barreto M, Genser B, Strina A, et al. Effect of city-wide sanitation programme on reduction inrate of childhood diarrhoea in northeast Brazil: assessment of two cohort studies. Lancet2007;370:1622–8.
[78] Gakidou G, Oza S, Fuertes CV, et al. Improving child survival through environmental andnutritional interventions: the importance of targeting interventions toward the poor. JAMA2007;298:1876–87.
[79] Pruss-Ostun A, Bos R, Gore F, et al. Safe water, better health. Costs, benefits, and sustain-ability of interventions to protect and promote health. Geneva: World Health Organization;2008.
[80] Kimani-Murage EW, Ngindu AM. Quality of water the slum dwellers use: the case of a Ken-yan slum. J Urban Health 2007;84(6):829–38.
[81] Davis M. Planet of slums. New York: Verso; 2006.[82] Global climate change and children’s health. AAP policy statement from the Committee on
Environmental Heath. Pediatrics 2007;120(5):1149–52.[83] Climate change and children UNICEF AM Veneman Executive Director Dec.2007.[84] Torjesen K, Mandalakas A, Kahn RS, et al. Survey of pediatric residency programs
offering international child health electives. Arch Pediatr Adolesc Med 1999;153:1297–302.
[85] Nelson BD, Lee ACC, Newby PK, et al. Global health training in pediatric residencyprogram. Pediatrics 2008;122:28–33.