advancing knowledge - vancouver coastal health · advancing knowledge ... program as well as the...
TRANSCRIPT

Promoting wellness. Ensuring care. I
ANNUAL REPORT 2012/13Advancing Knowledge
Published November 2013

Promoting wellness. Ensuring care. i
ContentsExecutive Summary ............................................................................................................................................ 1VCH Vision, Values & Strategic Directions ................................................................................................... 3
Clinical Quality and Patient Safety Strategic Plan .......................................................................................................... 3
Introduction .......................................................................................................................................................... 6Acknowledgements .................................................................................................................................................................... 6Quality & Patient Safety and Infection Prevention and Control Team Members ........................................................................................................ 7Sites ................................................................................................................................................................................................... 8
Portal ....................................................................................................................................................................... 9Global Trigger Tool ............................................................................................................................................10Clinical Guidelines Initiative ..........................................................................................................................13
About CGI ..................................................................................................................................................................................... 13
Accreditation .......................................................................................................................................................18Key Partnerships/Committees/Working Groups ...................................................................................20Human Factors ....................................................................................................................................................22Health Economic Evaluations of Quality Initiatives ...............................................................................23Venous Thromboembolism Prophylaxis ....................................................................................................26Positive Deviance and Liberating Structures ..........................................................................................28Tissue Banking and Cellular Therapy .........................................................................................................30Utilization Management ..................................................................................................................................33Releasing Time to CareTM .................................................................................................................................35Surgical Quality ..................................................................................................................................................40
Surgical Site Infection (SSI) Rates ..................................................................................................................................... 50VCH News Item on decolonization project .................................................................................................................... 54
Surgical Safety Checklist .................................................................................................................................56Antibiotic Prophylaxis .....................................................................................................................................58Catheter Associated UTIs (CAUTI) ...............................................................................................................59Long Term Care ..................................................................................................................................................62GF Strong Rehabilitation Centre ...................................................................................................................63
A Four Cornerstone Approach to Reducing Healthcare Associated Infections.............................................. 66
Hospital Associated Infection (HAI) Indicators .......................................................................................76

Promoting wellness. Ensuring care. ii
Hand Hygiene Compliance.................................................................................................................................................... 76Clostridium difficile Infections (CDI) Incidence Rate ................................................................................................. 82Methicillin-resistant Staphylococcus aureus (MRSA) Incidence Rate................................................................. 86Bloodstream Infection (BSI) Incidence Rate ................................................................................................................ 91Patients identified as having Mycobacterium tuberculosis .........................................................................................95Laboratory Confirmed Influenza ....................................................................................................................................... 97
Outbreak Management ....................................................................................................................................99Publications/Posters ..................................................................................................................................... 101
New Grants ................................................................................................................................................................................101Awards ........................................................................................................................................................................................101Articles .......................................................................................................................................................................................101Abstracts .....................................................................................................................................................................................102
Antibiograms .................................................................................................................................................... 103VGH/UBC Hospital Hospital Wide Antibiogram, 2011 and 2012 ......................................................................103VGH ICU Antibiogram, 2011 and 2012 ..........................................................................................................................104LGH Hospital Wide Antibiogram, 2011 and 2012 ....................................................................................................105RH Hospital Wide Antibiogram, 2011 and 2012 ......................................................................................................106
Appendix ........................................................................................................................................................... 107Terminology & Abbreviations ...........................................................................................................................................107Case Definitions .......................................................................................................................................................................108

Promoting wellness. Ensuring care. 1
Executive Summary Another great year with many successful initiatives has passed for the Clinical Quality and Patient Safety program within Vancouver Coastal Health Authority (VCH). Quality and Patient Safety is a key strategy for VCH due to an increasing focus on the common occurrence of adverse events in hospitals, as well as their harm and costs. Our mandate is to provide the best quality of care and improve the experience for all patients, clients and residents who receive services from VCH.
VCH is one of the largest Health Authorities in Canada. We deliver health services to more than one million people, or 25% of British Columbia’s population. The VCH Clinical Quality and Patient Safety program is structured around six key themes for our overall strategic plan; Communication and Culture, Infection Prevention and Control, Workforce/Worklife, Medication Safety, Performance Measurement and Monitoring, and System Redesign. Although this is a regional strategy the main driver for success is fostering and building local relationships for front-line initiatives. Developing and supporting those local relationships is key to sustaining improvements within the system.
This year we have expanded many of our initiatives such as developing an antimicrobial stewardship program which is linked to other initiatives such as medication safety and reducing urinary tract infections. Our Four Cornerstones business case was accepted and we have made great headway in developing a sustainable environmental cleaning program that includes mobile equipment. This program has seen a significant reduction in certain healthcare acquired infections.
We have completed an evaluation of both the VCH National Surgical Quality Improvement Program as well as the Releasing Time to Care Initiative using a health economic lens. Both of these programs have proven to be very effective in improving staff and surgeon engagement as well as reducing adverse event rates overall.
Finally, we have extended our national and international links with our infection control program as well as our quality and patient safety work. We chair the Western CEO Quality and Patient Safety subcommittee as well as the B.C. Clinical Care Management Coordination and Measurement committee. Human Factors expertise is being utilized across B.C. our partnership with the HSSBC and well as some of the Western provinces. Infection Control continues its work in South Africa and received an international award for the development of a successful preoperative decolonization program. Our ongoing partnership with the Emily Carr University of Art and Design has led to an opportunity to partner with a Danish hospital and Danish Design University in Kolding Denmark to further develop design into health initiatives.

Promoting wellness. Ensuring care. 2
The team has continued to work hard to support dedicated teams within VCH who provide outstanding care to patients and their families. We are proud to give you a snapshot of the work we have done over the past year in this annual report.
Linda Dempster, RN, MA Executive Director, Clinical Quality, Patient Safety and Infection Control
Elizabeth Bryce, MD, FRCPC Regional Medical Director, Infection Prevention and Control
Dr. Patrick O’Connor signs the Releasing Time To Care Visit Pyramid

Promoting wellness. Ensuring care. 3
VCH Vision, Values & Strategic DirectionsIn 2012, the “People First” lens continues to guide and govern all we do. The goal is to provide patients, clients and residents with more say in their care by adopting the “nothing about me without me” approach as we treat and care for them. We believe that this partnership will return us to the heart of healthcare.
Our People First lens is equally balanced on our staff and the physicians we work with as we increasingly engage them in our efforts to continually improve quality and safety by taking advantage of their skills, knowledge, experience and high level of commitment and dedication to those we serve.
In working towards a seamless system, VCH aims to:
• Provide the best quality of care;
• Promote better health for our communities;
• Optimize our current workforce and prepare for the future;
• Use our resources efficiently to sustain a viable health care system.
Clinical Quality and Patient Safety Strategic Plan
The Clinical Quality and Patient Safety Strategic Plan was developed as a three year plan. Overall the plan remains the same however, in response to changes required by the Ministry of Health as well as Accreditation Canada some specific initiatives have been added to the plan.
These include a further focus on healthcare-associated infections such as urinary tract infections and pneumonia. These are considered in addition to falls and pressure ulcers to be nursing-sensitive adverse events. The BC Ministry of Health has recently introduced a pay for performance strategy that may also include some of the initiatives within the strategic plan for Quality and Patient Safety. For the purposes of this report we will continue using the original plan but expand the focus for reducing healthcare associated infections.

Promoting wellness. Ensuring care. 4
Aim
Quality and Patient Safety – Strategic Plan (External)
Objectives Drivers Measures
Reduce Adverse Events
Enhance Patient / Staff Experience and Culture
Become a Learning
Organization
Financial Stewardship
Improve Patient Experience (Culture)
Improve Staff Engagement
(Culture)
Increased Awareness of Adverse Event
Rates
Infection Prevention and Control Program (Four Cornerstones)
Become a Learning Organization –increase awareness of adverse event rates, QI strategies, change management, reporting and learning
Communication and Culture
Infection Prevention and Control
Workforce / Worklife Medication SafetyPerformance,
Measurement, and Monitoring
System Redesign
THEMES
Healthcare Associated Infections
Antimicrobial Stewardship
Environmental Cleaning
Surgical Care (NSQIP)
Hand Hygiene Program
Standardization of Quality Improvement
Knowledge
Medication Safety
Health Economics (value and sustainability)
MRSA / VRE / CDI / UTI Rates by Facility
BSI Rates by Facility (i.e., urosepsis, pneumonia)
NSQIP (indicators)
SSCL Compliance
Surgical Site Infections (SSI) and Antibiotic Prophylaxis
Adverse Event Rates
Mobile Equipment Cleaning and Environmental Audit Results
CDI Algorithm Compliance
HH Metrics
% Compliance for VTE Reduction Program
ROI Costs and Reductions
Medication Reconciliation Compliance
Initiatives
Improve Surgical Care
Environmental Cleaning and Mobile Equipment
Project
‘Releasing Time to Care’NHS Collaborative
Health Economic Evaluations
Antimicrobial Stewardship Program
VTE Program
Hand Hygiene
Medication Reconciliation Program
Quality 101
‘Releasing Time to Care’Demonstration Projects
Clinical Care Management (MOH)
Accreditation
Build Sustainability
Increase Use of Human Factors
Principles
Visible Leadership Commitment
Transparent Reporting /Visible Performance
Measures
Performance scorecard (Portal)
Ward to Board Reporting- Timely and Accessible
Information
Internal guidelines, policies, protocols
(accountability)
Improve Adverse Event Rates
Attendance #
Evaluate Quality Improvement
Projects using a Health Economic
Framework
Improve HSMR (Surgery, Medicine,
Critical Care)
Use of Standardized Protocols and Guidelines
Reducing HAI Rates**- CDI Initiative- CAUTI- SSI Decolonization- MRSA Reduction Program-CLABSI Prevention
48/6 (Assessment and Care Planning for all Admitted Patients)
Antibiotic Usage
48/6 Metrics
CDI Protocol Compliance
# of visible Quality and Safety Boards on Units
# of hits on Portal / Website
Evaluation of Releasing Time to Care Demonstration Projects
Provincial Patient Experience Program
Patient Experience Scores
Safety and Engagement Survey (Gallup)
Patient Experience Improvement
Safety and Engagement Safety and Engagement
Strategies
Human Factors (value and sustainability)
HF Measures of SuccessHuman Factors
Initiatives
Falls Prevention
In Hospital Fractures and Reported Fall Rates
October 2012

Promoting wellness. Ensuring care. 5

Promoting wellness. Ensuring care. 6
IntroductionThe Clinical Quality and Patient Safety department including Infection Prevention and Control is a regional program whose priority is the implementation of programs and initiatives that support the organization to reduce the risk of adverse events and to provide the best quality of care. The program is under the supervision of Ms. Linda Dempster, Executive Director, Clinical Quality, Patient Safety, and Infection Prevention and Control and Dr. Elizabeth Bryce, Regional Medical Director, Infection Prevention and Control. Dr. Patrick O’Connor, Vice-President, Medicine, Clinical Quality and Patient Safety is our Executive Lead. The team consists of infection control practitioners, a hospital epidemiologist and data analysts and information systems experts, a regional hand hygiene coordinator, human factors specialists, tissue banking expert, accreditation specialist, surgical quality coordinators, health economist, utilization management coordinator, quality improvement and change management experts and infection control officers.
The philosophy of the department is to support quality improvement at the local level and ensure sustainability over time. Partnering with other departments such as operations, workplace health and professional practice is key to spread and sustainability.
Acknowledgements
We would like to acknowledge the efforts of our partners across VCH as well as external to VCH who volunteer their time and efforts on behalf of their Infection Control Committees and Quality and Safety Committees.

Promoting wellness. Ensuring care. 7
Quality & Patient Safety and Infection Prevention and Control Team Members
VP, Medicine, Quality & Patient SafetyDr. Patrick O’Connor
Executive Director, Quality, Patient Safety & Infection ControlLinda Dempster
Medical Director, Infection Prevention and ControlDr. Elizabeth Bryce
Director, Quality and Patient Safety Dermot Kelly - RichmondDr. Kellé Payne – Coastal Jacqueline Per - Vancouver
Director, Innovation & EvaluationDr. Janet Joy
Medical Microbiologists/Infection Control OfficersDr. Elizabeth BryceDr. Patrick DoyleDr. Jennifer GrantDr. Diane RoscoeDr. Aleksandra StefanovicDr. Leigh LindsayDr. Titus Wong
Clinical Quality & Patient Safety OfficerMichael McAuley – Richmond
Epidemiologist/Manager, Performance MeasuresLeslie Forrester
Program Manager, NSQIPMary Cameron-Lane
Leader, Accreditation & Patient/Client SatisfactionSerena Bertoli-Haley
Human Factors SpecialistSarah Rothwell
Coordinator, Hand HygieneSheila Browning
Project ManagerFelicia Laing
Coordinator, Tissue BankingJulie Frketich
Coordinators, Quality & Patient Safety/NSQIPBarbara BillasBarbara DrakeTracey HongElena MurzelloKathy RawlingIrene SiuKim SoltysikMarkus ZurbergCatherine Parcero
Reviewer, Clinical Utilization ManagementJanet Lakusta
Systems Analyst/DesignerChandi PandithaJeffrey Reimer
Executive AssistantsJoan SaundersLidija PiovesanKim Jamieson
Infection Control PractitionersLinda AdamGail BustoEithne ConnollyMelissa CrumpRita DeKleerJay EstoqueRosma FacundoSandi GabrielCarolyn GossLisa HarrisJennifer IrwinSandie JacksonHugo MongeMunira MurjiSydney ScharfAnnie SheCraig PienkowskiMichelle Varty

Promoting wellness. Ensuring care. 8
Regional Research AssistantMitra Eshghpour
Health EconomistStefanie Raschka
Infection Control OfficersDr. Elizabeth BryceDr. Jennifer GrantDr. Leigh LindsayDr. Aleksandra Stefanovic
Sites
SitesVancouver General HospitalUBC HospitalRichmond HospitalLions Gate HospitalPowell River General HospitalSt. Mary’s HospitalSquamish General Hospital Whistler ClinicPemberton ClinicGF StrongRW Large Memorial HospitalBella Coola General Hospital
Long Term Care/Residential CareBanfield PavilionPurdy PavilionGeorge PearsonDogwood LodgeEvergreen HouseNorth Shore Kiwanis Care Cedarview LodgeMinoru ResidenceRichmond Lions ManorHilltop HouseEvergreen Extended Care Olive Devaud ResidenceShornecliffe Totem Lodge

Promoting wellness. Ensuring care. 9
PortalIn collaboration with Decision Support, we continue to build our Quality Patient Care portal providing staff with a “one stop shop” location for reports. A variety of performance measures are available such as healthcare associated infection rates, hand hygiene compliance, falls, and medication reconciliation compliance to name but a few. Where possible the reports incorporate a hyperlinked Table of Contents allowing readers to quickly navigate to relevant information.
Over the last fiscal year we have added an icon to all VCH desktops providing staff with direct access to our portal. In addition, we have added many more reports including a pivot table for MRSA and CDI which allows users to filter by facility, time and unit. The pivot table is updated weekly ensuring that staff have access to timely and meaningful information on their performance.
Our portal continues to grow as we develop and add more reports. Please visit often!

Promoting wellness. Ensuring care. 10
Global Trigger ToolBeyond the treatment of diseases, recovery and rehabilitation; health care’s overall goal includes the reduction if not total prevention in patient’s injury or harm. Distinguishing between errors and harm is important in the process of improving safety in health care delivery. Concentrating on actual events that patients or clients experienced, a health care facility can begin to foster a culture of safety that shifts from individual blame for errors to working on comprehensive system designs that reduces patient suffering.
Why is this important?Traditional efforts to detect adverse events have focused on voluntary reporting and tracking of errors. However, public health researchers have established that only 10 to 20 percent of errors are even reported and of those, 90 to 95% cause no harm to patients. Hospitals need a more effective way to identify events that cause harm to patients in order to quantify its degree and severity beyond the clinical assessment of the healthcare team that looks after them, but more importantly take in to consideration how patients perceive the harm they have experienced .
Where do we start?Before any processes can be initiated towards improving safety in patient care, adverse patient outcomes needs to first be identified, measured and analyzed. In 2003, to assist in collecting data pertaining to adverse events, the Institute for Healthcare Improvement (IHI) developed a tool that would help identify adverse events that patients encountered within their current admission including any healthcare encounters 30 days prior.
The IHI-Global Trigger Tool (GTT) for Measuring Adverse Events provides an easy-to-use method for accurately identifying adverse events (harm) and measuring the rate of adverse events over time. Tracking adverse events over time is a useful way to tell if changes being made are improving the safety of the care processes. The GTT methodology includes a retrospective review of random sample of patient records, using “triggers” (clues) to identify possible adverse events. Many hospitals have used this tool to identify adverse events, to measure the level of harm from each adverse event, and to identify areas for improvement in their organizations. It is important to note, however that the IHI GTT is NOT meant to identify every single adverse event in a patient record.
How are we doing? The IHI GTT review generates the following data or indicators that the Quality & Patient team presents to both the VCH Senior Executive Team and the Board of Directors on a regular basis:

Promoting wellness. Ensuring care. 11
a. Type of adverse events
b. Severity of adverse events,
c. Total number of adverse events/ 1000 patient days,
d. Total number of adverse events/ 100 admissions
e. Percent of admissions with at least 1 adverse event identified (Figure 1)
f. Percent Distribution by Type of Adverse Events (Figure 2)
90
100
Percent of Patients with at Least One Adverse Event (2010 - 2013)
60
70
80
90
30
40
50
60
Perc
ent
Jan Feb Mar Apr May Jun Jul Aug Sep Oct Nov Dec Jan Feb Mar Apr May Jun Jul Aug Sep Oct Nov Dec Jan Feb Mar Apr May Jun Jul Aug Sep Oct Nov Dec Jan Feb Mar0
10
20
Jan Feb Mar Apr May Jun Jul Aug Sep Oct Nov Dec Jan Feb Mar Apr May Jun Jul Aug Sep Oct Nov Dec Jan Feb Mar Apr May Jun Jul Aug Sep Oct Nov Dec Jan Feb Mar
2010 2011 2012 2013
VGH 20 40 45 35 45 30 20 25 20 30 40 20 15 15 30 45 20 30 20 25 25 45 66 40 28 35 5 25 30 30 20 15 25 35 20 5 40 30 20
LGH 20 15 20 25 35 30 15 20 15 10 15 10 40 25 30 25 40 25 25 15 25 30 25 15 20 20 25 10 15 15 15 35 5 5 20 25 15 10 15
RH 20 40 15 5 20 35 5 0 25 5 5 15 15 20 5 20 10 20 25 0 20 30 15 25 30 10 15 20 20 20 33 10 25 15 15 25 10 15 30
Figure 1. Percent of acute care patients, who experienced at least one adverse event during their hospitalization. An adverse event is any occurrence that has required a treatment and may have resulted in harm that is NOT related to the reason for the hospital stay.
Unlike other quality improvement measures, the IHI GTT looks at the bigger picture, covering a wide range of care modalities where results are tracked over time. Results are intended to provide a reflection of actual harm our patients or clients experienced, including those that they perceived as harm, regardless of preventability. Having identified areas of improvement, this information is shared & made available to the different stake holders interested or are already currently working on initiatives & projects where need for improvement is the greatest.
As these indicators reflect the “bigger picture”, data generated using GTT are not intended to “be all and end all” of QI measurements, rather where applicable, GTT data can be used to complement existing (e.g. NSQIP, UTI/Urosepsis, CDI, MRSA, Hand Hygiene Surveillance, etc) as well as future quality improvement metrics in our organization.

Promoting wellness. Ensuring care. 12
0.05
0.1
0.15
0.2
0.25
0.3
0.35
0.4
Vancouver Coastal HealthGTT - Adverse Event Breakdown
by Fiscal Year
FY 2010/11 FY 2011/12 FY: 2012/13
0
Alle
rgic
/ Tr
ansf
usio
n Re
actio
n
Blee
ding
/ Pos
t Op
Anem
ia
Decu
biti
Delir
ium
/ Hal
luci
natio
n/Co
nfus
ion
DVT/
VTE
/ Pul
mon
ary
Embo
li
Fall
Flui
d O
verlo
ad/ P
ulm
onar
y Ed
ema
Hem
atom
a/ B
ruisi
ng/ S
wel
ling
Hypo
glyc
emia
Hypo
tens
ion
Infe
ctio
n-Al
l Oth
er
Infe
ctio
n-C.
Diff
icile
Infe
ctio
n-Li
ne (A
cces
s De
vice
)
Infe
ctio
n-Pn
eum
onia
(VAP
)
Infe
ctio
n-Pn
eum
onia
/ Asp
iratio
n
Infe
ctio
n-Pn
eum
onia
/ Pne
umon
itis
Infe
ctio
n-Su
rgic
al S
ite
Infe
ctio
n-UT
I/ U
rose
psis
w/o
Fol
ey
Infe
ctio
n-UT
I/ U
rose
psis
with
Fol
ey
Infe
ctio
n-W
ound
/Cel
lulit
is/De
cubi
ti
Nau
sea/
Vom
iting
/ Ile
us
Ove
r Sed
atio
n
Retu
rn to
Sur
gery
Trau
ma-
Bloo
d Ve
ssel
/ O
rgan
/ Tiss
ue
Urin
ary
Rete
ntio
n
Figure 2.
GTT Clinical Reviewer Catherine Parcero

Promoting wellness. Ensuring care. 13
Clinical Guidelines InitiativeAbout CGI
A key strategy in VCH’s mission to “Provide the Best Quality of Care” is to reduce unwarranted practice variation. The Clinical Guidelines Initiative (CGI) is a systems level approach to reducing this variation in care at VCH by using evidence-based protocols. To work towards resolving the systems challenges, CGI’s team includes executive level representation to connect health systems integration, quality, medicine, professional practice, and decision support.
CGI was established in 2010 with two over-arching aims:
1. Pick up the pace on implementing region-wide, evidence-based guidelines and protocols in key priority areas.
2. Create a region-wide system for reporting on progress & outcomes of guidelines and protocols implemented for priority topics.
Progress on Aim #1: Speeding Up the Implementation of Regional GuidelinesSystem Improvement: In 2011, CGI worked closely with Lean Transformation, Pharmacy and Therapeutics, and Professional Practice teams to create a streamlined process for the development and approval of new regional Pre-Printed Order Sets (PPOs). In Fall 2012, CGI took on the role of “way-finder” to support developers of new regional PPOs. CGI also audits the process to resolve system barriers in real-time.

Promoting wellness. Ensuring care. 14
The first trial of the new system in 2013 demonstrated a vast improvement. Whereas the development and approval process for previous regional PPOs took up to 24 months, these orders were developed and approved in only 5 months. This success enables VCH/PHC to better care for patients, since we can more quickly incorporate evidence-based guidelines into practice.
Further work continues to streamline the process for new PPOs in development. These efforts to ‘get it right on paper first’ will help lay groundwork for the implementation of VCH/PHC’s Clinical Systems Transformation, which will utilize computerized orders.
System Consultation: Developing regional guidelines for clinical practice is one step towards improving patient care. The next step is to ensure that the guidelines are implemented and followed. In some cases, usage of PPOs is disappointingly low (for Heart Failure, one audit showed it to be at 11%). To further support the work of guideline implementation, CGI hosted a Forum in May 2013 with 30 leaders to discuss how to increase uptake of Heart Failure order sets and other CGI/CCM initiatives at VCH/PHC.
The Heart Failure team outlined the barriers they encountered as they sought to implement Heart Failure PPOs, as displayed in the fishbone diagram below.

Promoting wellness. Ensuring care. 15
These barriers are not unique to Heart Failure. Other initiatives who seek to reduce unwarranted practice variation through the use of PPOs face many of the same challenges. Forum attendees discussed these barriers and used an inventive problem-solving tool called “TRIZ” to come up with actions VCH/PHC could take to increase PPO usage.
From these ideas, attendees chose 4 themes based on importance and our ability to tackle them:
1. Culture of safety and accountability
2. Access to PPOs
3. Awareness of PPOs and education regarding their usage
4. Auditing and reporting: Creating mechanisms to report on usage and outcomes, and ensuring that these methods are consistent across sites
Potential solutions are detailed in the CGI Forum Report. CGI is currently working with a few CGI/CCM initiatives to implement these solutions to increase usage of regional guidelines at VCH/PHC.
Progress on Aim #2: Reporting Progress & OutcomesReporting for Accountability: CGI also supports the BC Ministry of Health’s Clinical Care Management (CCM) initiative. The purpose of CCM, which mirrors that of CGI, is to:

Promoting wellness. Ensuring care. 16
Improve the quality of patient care in BC through a well-supported system-wide approach to establishing, promoting implementation of, and
reporting out on evidence-based clinical best practices.
CGI coordinates VCH/PHC’s reporting to CCM on a quarterly basis. These reports and scorecards are reviewed by various VCH/PHC councils and committees to assess performance, as well as by CCM leadership.
CGI has also worked closely with the Provincial CCM Steering Committee and the Measurement and Coordination Working Group to support the alignment of policy and operational dimensions of CCM.
Reporting for Quality Improvement: CGI is currently examining how VCH/PHC’s performance data (CCM & otherwise) travels from ward to board (for accountability) and back to the ward (for quality improvement).
The reports and scorecards created to display data for accountability aren’t able to display data in sufficient granularity to help point of care staff answer that question. Therefore, together with various colleagues and initiatives across VCH, including Quality & Patient Safety, Decision Support, and Lean Transformation Services, CGI is investigating how we can help to meet the needs of staff for quality improvement data.
Through focus groups, individual conversations, and site tours to see how units currently display data, CGI is gathering information from managers and point of care staff around how best to
Historically, the bulk of effort focuses on reporting for
accountability. Similar to other VCH/PHC groups, CGI has been discovering that data for quality improvement often doesn’t get
back to staff providing care.
VCH/PHC clinicians are asking, “How can we improve care if we don’t know how we’re doing?”

Promoting wellness. Ensuring care. 17
visualize data for quality improvement purposes. This work will inform future CGI strategies to help stimulate unit level quality improvement work.
List of CGI Initiatives:
Antimicrobial Stewardship - CDI Treatment
Prevention of CAUTI (Catheter-Associated UTIs)
Hand Hygiene
Heart Failure Management
Medication Reconciliation
Regional Stroke Strategy
Seniors in Acute Care (48/6)
Sepsis Prevention
Surgical Site Infection (SSI)
COPD - Chronic Obstructive Pulmonary Disease
Surgical Safety Checklist
Critical Care – Improving Glycemic Control
Venous Thromboembolism (VTE) Prevention

Promoting wellness. Ensuring care. 18
AccreditationAccreditation is one of the most effective ways for VCH to regularly and consistently examine and improve the quality of their services, consistent with our commitment to provide the best quality of care.
Accreditation allows us to:
• Identify which patient and client services we do well, while noting where there is room to improve the client and patient journey.
• Analyze our services through an open and rigorous methodology.
• Have our services recognized as meeting national standards.
• Confirm the importance of staff and physician engagement in providing quality and safe healthcare outcomes.
• Engage our teams in continuous quality improvement.
The Qmentum journey starts with a self-assessment questionnaire open for response by front line staff. We then learn from self-assessment results by validating them against standards, prioritize opportunities for improvement; and engage in action planning to address key priorities with quick wins and longer-term improvements. Self-assessments are a basis for developing our own roadmap for improvement and enable us to engage staff and physicians in quality improvement, determine sustainable locally relevant action plans, and build on existing improvement initiatives.
Clinical services throughout the Vancouver Community of Care, as well as the leadership and governance for VCH as a region, underwent accreditation November 25 – 30, 2012.
Exactly how well did we do?On November 30th, 2012, the team of Accreditation Canada surveyors shared with VCH their observations from the site visit. We learned that VCH and Vancouver Community of Care had met 98% of almost 2,300 criteria examined by our surveyors. This was among the best scores in Canada for an integrated health system. In a follow-up report issued three weeks later, Accreditation Canada confirmed that Vancouver Coastal Health is Accredited. The report highlighted a few remaining areas of work in progress tied to Required Organizational Practices (ROPs) as conditions for accreditation, on which VCH provided further status updates in May and October 2012.
The improvements that were highlighted in our status updates to satisfy the conditions for accreditation include:

Promoting wellness. Ensuring care. 19
• Process for checking in patients in Ambulatory Care (tied to the ROP on using two client identifiers)
• Examples of written patient information materials in the Renal Program, Hyperbaric and Palliative Care Units (tied to the ROP on patient/client and family roles in promoting safety)
• Rollout of a consistent toolkit for falls prevention throughout Medicine and Surgical Services in Vancouver that reflects the new Regional Falls Prevention Guidelines for Acute Care (tied to the ROP on falls prevention)
Next stepsVancouver Coastal Health currently participates in accreditation on a four-year cycle, with separate site visits to different communities of care on each year. The next site visit is scheduled to take place in the Richmond Community of Care, focusing on clinical services throughout the continuum, during the week of November 25-29, 2013. We welcome our surveyors’ feedback and look forward to showcasing the quality journey that Richmond has sustained since their last site visit in 2010, and the many improvements that resulted.
Going forward, Vancouver Coastal Health is working with Accreditation Canada to transition to a site visit model that showcases VCH as a unified region and aligns with the work of Clinical and Systems Transformation as a key strategic priority.
Tracers as a quality improvement toolMock tracers are one of the most visible and best-recognized activities in preparation for each site visit survey, and the majority of staff who have an opportunity to be involved tell us how helpful they find them in identifying areas that need more attention or that are doing particularly well. We encourage teams to continue to use tracers as part of their ongoing quality improvement tactics, as a handy, intuitive, patient-centred tool. Tracers map the journey of a patient or a process from end to end, and can be done by staff and leaders alike, with minimal time commitment in any program or service. To find out more about tracers, Accreditation Canada has developed two short videos, available on VCH Connect under Accreditation Resources. To set up a tracer session, or learn how you too can conduct tracers for your area, please contact Serena Bertoli-Haley.

Promoting wellness. Ensuring care. 20
Key Partnerships/Committees/Working GroupsQuality & Patient Safety and Infection Control have close partnerships with many departments within Vancouver Coastal Health, are active participants in many professional organizations and are members of many provincial, national and international committees including:
Within Vancouver Coastal Health
• Professional Practice
• Decision Support
Provincial
• American Operating Room Nurses (AORN)
• Association of Registered Nurses of British Columbia (ARNBC)
• BC Accreditation Advisory Committee
• BC Clinical Care Management Measurement and Coordination Working Group
• BC Environmental Cleaning Best Practices Working Group
• BC Health Information Management Professionals Society (BCHIMPS)
• BC Health Quality Network
• BC Patient Reported Experience Measures Steering Committee (BC PREMS)
• BC Patient Safety and Quality Council
• BC Patient Safety and Quality Council ‘Quality Academy’ Advisory Council
• BC Patient Safety and Quality Council ‘Quality Forum’ Steering Committee
• BC Patient Safety and Quality Council Director Network
• BC Provincial Hand Hygiene Working Group
• BC Provincial Infection Control Scientific Advisory Council
• BC Quality Group on Culture
• College of Registered Nurses of British Columbia (CRNBC)
• Emily Carr University of Art and Design
• International Society of Infectious Diseases (ISID)
• Provincial Accreditation Advisory Committee (PAAC)

Promoting wellness. Ensuring care. 21
• Provincial Hand Hygiene Working Group
• Provincial Infection Control Network (PicNet)
• RN Networking Group
• Surgical Quality Action Network (SQAN)
• Tropical Medicine Expert Group BC (TMEG, BC)
National
• Association of Professionals in Infection Control and Epidemiology (APIC)
• Canadian Healthcare Engineering Society (CHES)
• Canadian Nosocomial Infection Surveillance Program (CNISP)
• Canadian Western CEO Quality and Patient Safety Committee
• Community and Hospital Infection Control Association (CHICA)
International
NHS/CareOregon/BC Patient Safety and Quality Council Collaborative
Dr. Elizabeth Bryce and Ministry of Health and healthcare workers at Kalafong Hospital outside of Pretoria, South Africa – the 5 year project’s goal is to reduce occupational exposure to multi-drug resistant TB and blood borne diseases.

Promoting wellness. Ensuring care. 22
Human FactorsWe have had a busy and exciting year! Here are some of the projects we have focused on this year:
Evaluation of Automated Dispensing Cabinets (ADCs). As part of the Provincial HSSBC RFP process for automated dispensing cabinets, a multi-disciplinary evaluation occurred with a clinical, technical and quality & safety focus. Nurses and pharmacy technicians participated in an extensive usability evaluation of ADCs to quantify the clinical experience and provide vital information about the device’s ease of use and safety.
Improve user adoption and patient satisfaction of low acuity vital signs monitoring systems. A multi-disciplinary working group led the charge to improve nurse adoption and patient satisfaction of the Masimo monitoring system on T8 with the aim to improve nurse adoption and patient satisfaction. We are working towards reducing the number of nuisance alarms by collaborating with Masimo to enhance their alarm notification system and providing education to staff on best practices and alarm troubleshooting methods. We also conducted interviews with our patients to better understand how we can design and educate patients and their families about the monitoring system. We will be implementing their recommendations shortly!
Community Electronic Healthcare Records Evaluation: This year we have been working with Mental Health and Addictions to understand their clinical workflow and needs to improve the usability of their electronic healthcare record software. By focusing on our end users (their environment, workflow, clinical needs etc.) we will be able to improve adoption, ease of use and safety.

Promoting wellness. Ensuring care. 23
Health Economic Evaluations of Quality InitiativesIn an effort to ensure that we are constantly improving and evaluating the value of our programs from both a quality and economic lens VCH uses a standard methodology to measure the overall health economic benefit.
VCH evaluates the value of quality initiatives, identifies strengths and weaknesses of these, and seeks to provide opportunities for further improvements. These approaches include measuring quality outcomes (e.g. patient or employee satisfaction, healthcare acquired infection rates, adverse events), productivity and efficiency measures (e.g. the analysis of length of stay, admissions and readmission, and employee turnover), program costs and investments (e.g. operational costs, education and training, and consultancy support), as well as their impact from a health economic perspective (e.g. cost compared to benefits, return-on-investment), as summarized in the figure below.
Evaluation Framework1 Quality Outcomes 2. Productivity & Efficiency1. Quality Outcomes
• Patient/Employee Satisfaction and Experiences
• Adverse Events / OccurrencesH lth A i d I f ti
2. Productivity & Efficiency• Length of Stay
• Admissions / Readmissions• Work Flow / Surgical Volume
E l T d S ff Ab• Healthcare Acquired Infections• Mortality & Morbidity
• Employee Turnover and Staff Absence
Making
3. Health Economics4. Program Costs / Investments
Making “Cents“
• Cost-Benefit Analysis• Return-on-Investment
• Cost Avoidance• Access (e g additional patient days beds freed)
g /• Operational costs
• Implementation costs • Training and Education• Consultancy Support • Access (e.g. additional patient days, beds freed)• Consultancy Support

Promoting wellness. Ensuring care. 24
Our goal is to provide comparative analyses over time to measure and evaluate improvements, to identify where potential for further improvements are, and to ensure sustainable patient focused quality of care.
As noted in our annual report from 2011/2012 a health economic measurement methodology was used to evaluate the value of our Infection Prevention and Control Program within Quality & Patient Safety by evaluating selected healthcare acquired infection rates over a time period of four years. We showed that the costs of operating an Infection Prevention and Control program is worth its investment and was self-sustaining in the second year of evaluation by comparing the costs to the costs avoided by preventing, and therefore reducing healthcare acquired infections within our organization. This research was published in the American Journal of Infection Control in August 2013.
Additionally we reported last year that for every dollar spent on embedding Human Factor’s principles during the acquisition process of medical devices, two dollars are saved on a five year period, and five dollars was saved on a ten year evaluation period. The results confirm that an investment in quality and patient safety programs such as human factors engineering are an investment in sustainability of the system.
This year we completed two additional health economic evaluations.
• Does using the National Surgical Quality Improvement Program lead to improvement in surgical care and is it of economic benefit.
• The NHS Productive Series- Releasing Time to Care. A comprehensive evaluation of a pilot program was completed using the health economic evaluation framework.
Results showed that the investment in a National Surgical Quality Improvement Program has a significant return on investment from an improved outcomes, team engagement, financial stewardship as well as patient experience perspective. This evaluation has been accepted for presentation at an international forum on quality and patient safety in April 2014.
The second program that was evaluated using this methodology was the NHS Releasing Time to Care program that we introduced as a pilot program to VCH in April 2012. A comprehensive evaluation was undertaken and the results demonstrate that the initial training costs and ongoing staffing costs are significantly less than the economic benefits achieved with the program. We have seen significant reductions in patient harm leading to reduced length of stay, reduced costs to treat preventable harm events as well as improvements in patient experience. We have also demonstrated reduced absence rates, turnover rates and savings associated with less orientation of new staff due to improved retention.

Promoting wellness. Ensuring care. 25
In summary, using a health economic framework to fully evaluated a program and prove or disprove a return on investment is very beneficial to understand and ensure sustainability of a program over time. Conversely, this method could be used to disinvest in programs if they are not providing an overall health economic benefit to the system.
Stefanie Raschka presenting health economics at the Quality Forum

Promoting wellness. Ensuring care. 26
Venous Thromboembolism ProphylaxisVTE – aligning with True North Goal “Provide the Best Care”In 2011/2012, VCH committed to implementing evidence based DVT/VTE prophylaxis protocols. VTE is the most preventable cause of hospital death and disability. Both hospital costs and median length of stay increases for patients who develop VTE. Long term consequences to patients of hospital acquired VTE are the risk of developing recurrent thrombolytic events as well as developing chronic leg swelling. Both impact the quality of life of the patient.
VCH is ensuring that all hospitalized patients in acute care are assessed for risk of VTE, and prescribed appropriate prophylaxis (pharmacological or mechanical) as their clinical presentation indicates. In cases where a clinical indication not to prescribe VTE prophylaxis is evident, documentation in the patients’ chart communicates this to other members of the healthcare team.
Measurement for compliance to this protocol is aligned with the BC Ministry of Health (MOH) Clinical Care Management Guidelines (CCM). We report our progress every fiscal quarter to the MOH and our compliance to our protocol is shared with staff and physicians through our Quality and Patient Safety portal on a monthly basis.
What have we done?To date we have implemented a Regional Thromboprophylaxis Policy and Venous Thromboembolism Prevention Guideline for VTE. To augment this policy, VCH developed and now finalized a regional VTE PPO (Pre-Printed Order) for medical and for surgical patients. These orders, which guide the prescriber through the risk assessment and support ordering of appropriate prophylaxis, are now embedded into all program PPO’s within VCH. Our rural sites have recently begun using the PPO’s while the PPO’s have cascaded through our urban centers since 2011.
How are we doing?Our target is 100% of our at risk patients in acute care centers are appropriately being prophylaxed for VTE on every admission. We audit on a fiscal period basis at all acute sites within VCH. Auditors review charts for 1) PPO present on the chart, 2) a risk assessment is completed, 3) appropriate prophylaxis is ordered or documented when contraindicated. Currently, 94% of all audited charts illustrate that our patients are receiving the appropriate prophylaxis. Our period results are then posted every period by unit, by site and also rolled up regionally on the Quality & Patient Safety portal (intranet webpage) for all clinicians and physicians to review.

Promoting wellness. Ensuring care. 27
100%
VCH Percent of Patients Receiving Appropriate VTE Prophylaxis
70%
80%
90%
100%
40%
50%
60%
Perc
ent
10%
20%
30%
P12 P13 P1 P2 P3 P4 P5 P6 P7 P8 P9 P10 P11 P12 P132011-12 2012-13
VCH 100% 100% 100% 100% 90% 95% 92% 94% 91% 91% 92% 90% 94% 94% 94%
0%
Getting Better Award, Quality Forum

Promoting wellness. Ensuring care. 28
Positive Deviance and Liberating Structures (Encouraging change at the Frontlines)
What is Positive Deviance?Positive Deviance (PD) is about looking within the community, organization, or group for the solution to the problem with the premise that someone within it has made adaptations. It is about allowing for a platform where people can have a conversation about how they have solved a problem or would like to solve the problem. Positive Deviance is about creating sustainable changes because the solutions have come from those within the community. Positive Deviance is about ‘people’ engagement at all levels.
What is a Liberating Structure?A Liberating Structure is a tool or aid that can be used to promote conversation and creative thinking. When used appropriately great solutions to problems can be unraveled.
Why use Positive Deviance and Liberating Structures?Positive Deviance and Liberating Structures are a great ways to approach, address and unravel issues that are difficult to tackle. For example, issues and problems that are influenced by culture can successfully be solved with use of Positive Deviance and Liberating Structures.
Positive Deviance and Liberating Structures is about getting to the deep rooted problems, behaviors and emotions that are entrenched in cultures without destroying the community. More specifically think of Positive Deviance and Liberating Structures as the tools you would use to peel away the layers of an onion. The onion represents all the dimensions and issues that surround the core organization and protects the community from making changes. When the layers are peeled away, core issues are revealed and space is made for change and innovation.
Why does it work?Positive Deviance and Liberating Structures work because they engage people at all levels. It also works because senior leaders allow those at the frontline, the autonomy to make changes and find solutions to their unit issues. Finally, this allows for sustainable changes that are embedded in the culture.

Promoting wellness. Ensuring care. 29
What has Vancouver Coastal VGH done this year?CP7AB and CD as well as CP10D continue to use Positive Deviance to support the quality improvement initiatives on their unit. Positive Deviance has been used to generate ideas and change in the areas of CDI reduction, fall reduction, CAUTI and reduction of hospital acquired infections.
T12 also continues to use Positive Deviance during their monthly meetings to discuss their hospital acquired infections. They have found the use of PD to be very beneficial in creating change and a platform for staff to express their thoughts and ideas.
The great work at VGH has opened doors for other areas within healthcare to embrace Positive Deviance. This has been demonstrated by supporting staff at Children’s Hospital Critical Care team learn some of the liberating structure tools and skills to aid in creating change at the frontline.
Positive Deviance Leader Melissa Crump

Promoting wellness. Ensuring care. 30
Tissue Banking and Cellular TherapyWithin VCHA exists the Eye Bank of British Columbia (EBBC), BC Tissue Bank, and the Leukemia/ Bone Marrow Transplant Program of BC, all of which work in conjunction with Health Canada, and other health agencies and professionals in ensuring the safety, efficacy and quality of all transplanted tissues and cellular products used in our health authority, and beyond. The Quality and Patient Safety Department supports these Programs with ongoing reviews and improvements to their Quality Management Systems.
Eye Bank of BCThe Eye Bank, which operates out of VCH, has the only comprehensive ocular program in the province that recovers over 600 donors annually and distributes tissue provincially and nationally when there is an abundance of tissue. The quality framework of the EBBC follows that of the Regulations for the Safety of Human Cells, Tissues, and Organs for Transplantation Regulations (CTO Regulations) and the Eye Bank Association of America (EBAA). The EBBC has maintained successful accreditation and inspections by the EBAA and Health Canada, respectively, over several years.
As of January 1, 2013, the EBBC migrated to a web-based electronic record system to document all aspects of tissue recovery, processing, distribution, and follow-up as well as hospital development and family services. A staged implementation was planned with the first phase now complete, all in-house processing activities are being performed on the new system. Phase 2, scheduled for later in the fall, is where staff recovering tissue would use tablets to enter the information in real time. The system has the potential to automate many tasks that are currently manual, for example, scheduling and managing requests from surgeons, collating statistics, and data mining for quality indicators.
Another significant development this last year was creating a Facebook™ page to provide awareness to the public and to collaborate with other health professionals in related areas.

Promoting wellness. Ensuring care. 31
The site has received much interest and is a great forum for donor families and recipients to share their stories, if they desire.
Tissue Bank of BCThe Tissue Bank follows the model of a centralized distribution centre with strict adherence to the Regulations for the Safety of Human Cells, Tissues and Organs for Transplantation. A variety of tissues from bones to cardiac grafts are received from different manufacturers, stored and distributed to clients within VCHA ensuring indefinite traceability. All tissue is obtained from suppliers that are accredited and/or registered with the following agencies:
American Association of Tissue Banking, the Food and Drug Administration of the United States of America, and Health Canada. The Tissue Bank underwent a successful inspection by Health Canada in November 2012.
Leukemia/ Bone Marrow Transplant Program of BCThe clinical program, which resides within two health authorities, Vancouver Coastal Health Authority (VCHA) and the Provincial Health Services Authority (PHSA), is responsible for the provision of care for adult patients with hematological malignancies in the Province of British Columbia including chemotherapy and stem cell transplant. The program includes the Clinical area where the complete coordination of care occurs, the Apheresis unit where products are collected, and the Clinical Cellular Therapy Laboratory where products are processed as required. The Program works in conjunction with the CBS OneMatch program to receive and also provide products nationally and internationally. The highly-regulated Program is governed by the laws of Canada and of the Province of British Columbia. In addition, the Program and/or its staff maintain(s) registration with and are subject to regulations of:
1. Health Canada as a Canadian program subject to and compliant with the Safety of Human Cells, Tissues, and Organs for Transplantation Regulations (CTO Regulations). The Program underwent a successful inspection in February 2012.
2. The Food and Drug Administration of the United States of America as a registered establishment for Human Cells, Tissues, and Cellular and Tissue-Based Products (CFR Title 21, Part 1271);
3. The World Marrow Donor Association International Standards for Unrelated Hematopoietic Stem Cell Donor Registries (current version) as a production facility for unrelated donor stem cells for transplant
Just this year, the program underwent a successful, first accreditation from the Foundation for the Accreditation of Cellular Therapy (FACT). FACT-accredited organizations voluntarily seek and

Promoting wellness. Ensuring care. 32
maintain FACT accreditation through a rigorous process, demonstrating their belief that patient needs are paramount and FACT is the only accrediting organization that addresses all quality aspects of cellular therapy treatments through a set of requirements that are updated regularly through the collaboration and input of the most knowledgeable minds in cellular therapy. Through the diligence and effort of the Leukemia / Bone Marrow Transplant team over the last couple of years, being FACT-accredited came to fruition. This was a great milestone for the program in terms of receiving validation that they are indeed providing the best quality of care to their patients in accordance with the region’s true north goals.

Promoting wellness. Ensuring care. 33
Utilization ManagementUtilization Management is a service that is accessible for the Vancouver Coastal Health Authority’s (VCHA) operational/clinical staff or program delivery service to provide them with an objective assessment or evaluation of their utilization management proactive procedures (ie: discharge planning, VTE compliance, process of ALC designation, data quality assurance etc…). Clinical utilization reviews are conducted when it is to inquire or when it is required by necessity. A basic utilization review may be in combination of the following: an assessment of appropriateness, an evaluation of the medical/service needs in each levels of care based on a guideline or evidenced-based criteria(s) and an assessment of the efficiency of health care services procedures/facilities through the identification of patient flow delays.
VCHA has implemented the MedWorxx Utilization Management System (UMS) phase 1 project at Lions’ Gate Hospital and Richmond Hospital in April 2012. The MedWorxx UMS was adopted to provide clinicians with an on-line utilization management tool to conduct concurrent reviews of each patient during their acute care hospital of stay, validating each patient’s appropriateness of stay in the acute care setting using evidenced-based, clinical support criteria (ACTIV) by MedWorxx. The use of the UMS system has assisted the frontline staff two-fold: it has complemented the iCare/rCare program that has enabled the frontline staff to effectively improve patient flow by identifing barriers, service delays and delays in plan of care that required immediate resolution in the process; and it has enhanced the interdisciplinary communication with the most concurrent information about each patient. Phase 2 of the project will include software configuration and training for the remaining MedWorxx Criteria Sets of each hospital which is currently under development.
Clinical Utilization Management has expanded. It has been consulted and involved in regional projects that required an independent assessment and evaluation of a program or process, as well as providing supplemental support on regional projects and operational tasks and duties required in the Health Authority.
1. The standardization and eventual roll-out of the new Regional “Alternate Level of Care” Definition and Process Development. This is lead by Joleen Wright (Director, Data Release Management/ Decision Support).
2. The validation of data quality process and procedures with respect to the NSQIP Project and the current data reporting to the Canadian Institute for Health Information. This is a lead by Mary Cameron-Lane (VCHA NSQIP Lead Coordinator/ Quality & Pt Safety)
3. UM ALC Reconciliation Reviews/Audits (by period end) – Lions’ Gate Hospital

Promoting wellness. Ensuring care. 34
4. Regional Auditing Support – Regional Hand Hygiene program, VTE compliance auditing, Med Reconciliation process reviews
5. Critical Incidence Clinical UM Review Project – Under development with Risk Management and Quality & Patient Safety.
6. Phase 2 MedWorxx UMS Project – Under development with Decision Support and LGH/RH HSDA.
Janet Lakusta, Clinical Utilization Management Reviewer/Auditor

Promoting wellness. Ensuring care. 35
Releasing Time to CareTM
Why is it important?The past year has seen remarkable change and improvements on the units doing Releasing Time to Care at Squamish General Hospital and Richmond Hospital. The demonstration project has been a means to pilot a program that provides a systematic way to deliver safe, reliable and efficient patient care by enabling front line staff to ask questions about their practice and making positive changes to the way they work. Since the introduction of Releasing Time to CareTM, staff have become actively engaged in sharing ideas and have participated in activities aimed at improving unit function. This allows more time to be spent providing direct care to patients thereby improving patient safety and the experience of both patients and staff.
“We treat all patients the way we want to be treated and Releasing Time to Care gives us a tool to have more time for the patients” ~ Staff nurse
What are we doing?Releasing Time to Care™ (RT2C) is a rigorously tested quality improvement program that has shown international success for empowering staff to build measurement and improvement into their everyday work. It is a structured framework that uses Lean principles and puts patients and providers at the centre of the changes that are needed to transform a culture. Since April 2012, Squamish General Hospital and three medicine units, (2S, 3S and 3N) from Richmond Hospital have been working through three modules that are foundational to the implementation of RT2C. Frontline staff who were identified to be Ward Leads helped drive improvements with their peers and are making sustainable changes that are transforming how care is delivered to patients.
1. Knowing How We’re Doing Staff collected real time data and track improvement measures directly on the Knowing How We’re Doing board. Data is posted for daily team huddle discussions that prompt staff to test changes and use dot-voting surveys for group decision-making. Key metrics that staff worked on were related to efficient and safe patient care, patient satisfaction and staff well-being such as decreasing patient falls, improving hand hygiene, improving patient satisfaction and increasing staff well-being.

Promoting wellness. Ensuring care. 36
Four core objectives for key measurements
Releasing Time to Care - Knowing How We’re DoingDetermine unit-based measures to improve
Improve patient safety and reliability of care
I f ti t (MRSA UTI
Improve patient experience
A t ti t• Infection rates (MRSA, UTI,C.diff…)
• Hand Hygiene compliance rate• In hospital falls
• Acute care patientexperience
• Patient Satisfaction Survey• In-hospital falls• Timing of meal delivery• Patient transfers
Improve staff well-being
Improve efficiency of care
• Volume of patient admissionsImprove staff well being
• Survey/Dot-voting• QI knowledge
Volume of patient admissions• Direct care time• LOS• Readmission rates
1
g• Staff absence • Overtime
• Materials and Stocking• Bed moves
Courtesy of S. Raschka
2. Well Organized WardStaff participated in decluttering and reorganization of various areas including the soiled utility room, patient kitchen, rehabilitation storage room, medication area and linen storage. The goal was to achieve efficiencies on the units by reducing time wasted hunting and gathering supplies and optimizing equipment and supply placement to decrease time spent in unnecessary motion.
3. Patient Status At A Glance. Questions on patient status and location were identified as common interruptions on the RT2C units and ranged from 110 to 219 interruptions per day shift. Together with allied health staff and physicians, the units worked to include at-a-glance information on their communications board that was helpful to patients and families and to staff and physicians.
Since implementing the three foundational modules, the RT2C units have also initiated improvements with admissions & planned discharges, shift handover, patient observations and nursing procedures.

Promoting wellness. Ensuring care. 37
How are we doing?Although it has only been 12 to 16 months since all four units have implemented RT2C, the transformation on the units is apparent to patients, visitors, staff and senior leadership. Based on input from staff the Ward Leaders have created standard operating procedures that clarify role responsibilities and expectations for communications for night time duties, shift reports and basic care including care plans. Bedside whiteboards are available for every patient and serves as a way for patients and families to stay up-to date with their care and be involved as much as possible. When compared to the results of the last three provincial acute care patient survey from NRC Picker Canada (2005, 2008 and 2011/12), patient satisfaction on 3N increased by an average range of 4% to 44% in four dimensions since implementing RT2C.
20%30%40%50%60%70%80%90%
100%
Patient Satisfaction Survey ComparisonRichmond Hospital - 3N
Availability of Nurse Response Time after Call Bell Reasonable
Dignity and Respect for Patient Noticed Hand washing
Pre RT2C 82% 48% 66% 77%Dec. 2012 89% 82% 94% 94%Jan. 2013 71% 86% 100% 71%Apr. 2013 92% 85% 100% 80%May. 2013 86% 85% 100% 85%
0%10%
Pre-RT2C results are averaged from years 2005, 2008 and 20011/12 of the NRC Picker Provincial Survey
Since starting RT2C, staff morale and well-being have improved. Unplanned absences at Squamish General decreased when staff initiated safety crosses to track unintended sick days.

Promoting wellness. Ensuring care. 38
6
8
10
12
14
Unp
lann
ed A
bsen
ces
Unplanned absences - Day Shift
0
2
4
Nov 2012 Dec Jan 2013 Feb March 2013
Num
ber o
f
Although falls still occur on all four units, the increased awareness by staff about how they are doing with falls prevention has been part of the success the units experience. By implementing a number of key prevention processes, the units are all showing a downward trend in their falls rate, averaging an overall decrease of 25% over one year.
12
Falls - 3N Richmond Hospital
10
12Goal: To reduce falls by 50% by June 2013 to two falls per month.
-Clarified definition for falls
8
-Risk assessment on admission-Yconnectors link call bell to bed alarm-Safety checks qshift
6
Number of patient falls -New Falls & Injury Reduction
flowsheet
2
4
-Families pamphlet on fall prevention-Motion-sensored lights in all
Jan0
2g
rooms-LOM on white boards
May Jun July Aug Sept Oct Nov Dec Jan 2013 Feb Mar
# Falls (Safety Cross) 10 6 8 1 5 5 12 9 4 1 3
Trendline

Promoting wellness. Ensuring care. 39
What’s next?At Richmond Hospital and Squamish General Hospital we have demonstrated promising results with RT2C for staff engagement in compassionate and better patient care. The program is sustainable because it resonates with staff and gives them control over which improvements to drive. The RT2C units provide a nimble clinical area for starting new quality initiatives and integrating existing organizational priorities. Staff are open to change and have developed an aptitude for drilling through the necessary steps of improvement cycles.
The next steps include:
• Finalize a VCH improvement framework that blends RT2C with Lean management methodology and expand scope to include other disciplines besides nursing
• Further develop the in-house basic training for new Ward Leads
• Implement RT2C on remaining units at Richmond Hospital and other Vancouver Coastal Health facilities.
• Continue leading work into the eight process modules that focus on aspects of the patient’s hospital journey
• Continue to create a cascade of leadership development that roots from Ward Leads to every staff member
• Develop capacity for patient-centred care so that it is embedded in everyday practice.
Squamish General Hospital team at their Knowing How We’re Doing Board

Promoting wellness. Ensuring care. 40
Surgical QualityWhat are we doing?VCH conducts several thousand surgical procedures every year. Over many years we have been monitoring the rates of surgical site infections for selected cases and are expanding this program to measure other indicators of quality surgical care. The VCH Quality and Patient Safety department, in collaboration with the VCH Regional Surgical Executive Council, is participating in a provincial initiative aimed at reducing adverse events from surgical care.
The B.C. Surgical Collaborative uses a risk-adjusted data collection tool called the National Surgical Quality Improvement Program (NSQIP) that was developed by the American College of Surgeons. This program collects and analyzes clinical outcomes data that empowers participating hospitals to develop quality initiatives to improve surgical outcomes.
The NSQIP sites in BC have joined together to form the BC Surgical Collaborative which is supported by the BC Patient Safety & Quality Council. There is a dedicated Quality Improvement Leader and a provincial Clinical Lead to provide guidance for surgical activities in the province.
How are we doing?The NSQIP collects data on 135 variables for each case reviewed. Information includes demographics, pre-operative risk assessment variables, intra-operative variables and post-operative occurrences. Information is obtained from the Operating Room Information Systems (ORMIS), patient care systems and the chart. Each case requires a 30 day post-operative telephone call to the patient.
Outcomes are reported as observed versus expected (O/E) ratios and are distributed in semi-annual reports (SARs). These comprehensive reports, along with continuously available online reports, allow each hospital to monitor and benchmark its surgical outcomes with other participating hospitals and national averages.
The VCH Clinical Quality and Patient Safety Coordinator Nurses are working closely with our Surgeon Champions to ensure this program is successful.
How does it work?Participating hospitals collect data on pre-operative patient risk factors, pre-operative laboratory results, intra-operative variables, 30-day post-operative morbidity and mortality for patients undergoing major surgery which meet program criteria. NSQIP performs risk-adjustment analysis

Promoting wellness. Ensuring care. 41
on the data from all participating hospitals to enable the calculation of an odds ratio. Odds ratios are produced for each individual participating hospital and reported bi-annually.
Methodology: How is the data collected?Surgical cases are selected using a systematic sampling process. Each site reviews between 1600 and 2200 cases annually. Data is collected by Clinical Quality and Safety Coordinators by reviewing patient records, following up with physicians and surgeons and conducting 30-day post-surgery patient telephone surveys.
What is being measured?The surgical outcomes measured are reported as odds ratios and include mortality, morbidity, cardiac, pneumonia, unplanned intubations, ventilator 48 hours, deep vein thrombosis/pulmonary embolism, renal failure, urinary tract infection, surgical site infection and unplanned return to the operating room. The odds ratio is calculated by taking the odds of having an adverse surgical outcome in the reporting hospital divided by the odds of having an adverse surgical outcome in the comparator group. The comparator group is comprised of other NSQIP participating hospitals that perform the same surgical procedures.
What are the results?The following charts show the aggregated adverse events for each site. Adverse events includes pneumonia, unplanned intubations, ventilator > 48 hours, deep vein thrombosis, pulmonary embolus, renal failure, urinary tract infection, surgical site infections, stroke, cardiac events and sepsis. Each data point represents one year of data. Risk adjusted reports are now received every 3 months and will increase overlapping of data from 6 to 9 months.
0 40.60.8
11.21.41.61.8
Odd
s Rat
io
Richmond Surgical Adverse Events
00.20.4
Jan 1, 2011 - Dec 31, 2011
Jul 1, 2011 - Jun 30, 2012
Jan 1, 2012 - Dec 31, 2012
Apr 1, 2012 -Mar 31, 2013

Promoting wellness. Ensuring care. 42
0 60.8
11.21.41.61.8
dds R
atio
Vancouver General Hospital Surgical Adverse Events
00.20.40.6
Jan 1, 2011 - Dec 31, 2011
Jul 1, 2011 - Jun 30, 2012
Jan 1, 2012 - Dec 31, 2012
Apr 1, 2012 - Mar 31, 2013
Od
0.81
1.21.41.61.8
ds R
atio
Lions Gate Hospital Surgical Adverse Events
00.20.40.6
Jan 1, 2011 - Dec 31, 2011
Jul 1, 2011 - Jun 30, 2012
Jan 1, 2012 - Dec 31, 2012
Apr 1, 2012 - Mar 31, 2013
Od
0 60.8
11.21.41.61.8
Odd
s Rat
io
UBC Surgical Adverse Events
00.20.40.6
Jan 1, 2011 - Dec 31, 2011
Jul 1, 2011 - Jun 30, 2012
Jan 1, 2012 - Dec 31, 2012
Apr 1, 2012 - Mar 31, 2013
O

Promoting wellness. Ensuring care. 43
An odds ratio of greater than 1 indicates that the hospital is experiencing more adverse surgical outcomes than expected whereas an odds ratio of less than one indicates that the hospital has fewer adverse surgical outcomes than expected. Odds ratios are adjusted to take into consideration pre-operative patient risk factors and complexity of the surgical procedures performed.
How are we using the results?Regionally, respiratory occurrences, urinary tract infections and surgical site infections provide areas of opportunity to improve our systems. Each site has identified the priorities and has initiated plans to address concerns.
Richmond Hospital
Richmond has established a multidisciplinary pneumonia prevention group that is working with the surgical units to review and audit best practices, identify patients most at risk, and initiate improvements in practice.
Richmond NSQIP Non Risk d d
5.0%
Adusted Data
3.5%
4.0%
4.5%
mon
ia
2.5%
3.0%
ases
with
Pne
um
1.0%
1.5%
2.0%
Perc
ent o
f ca
0.0%
0.5%
%
Jul Aug Sep Oct Nov Dec Jan Feb Mar Apr May Jun Jul Aug Sep Oct Nov Dec Jan Feb Mar Apr May JunJul 2011
Aug Sep Oct Nov Dec Jan 2012
Feb Mar Apr May Jun Jul Aug Sep Oct Nov Dec Jan 2013
Feb Mar Apr May Jun
Richmond Trendline
Lions Gate Hospital
Lions Gate Hospital has focused on decreasing their surgical site infection rate. The first step is to optimize application of best practices. This is being addressed by auditing the practice in the operating room with regard to antibiotic prophylaxis, skin preparation and prevention of hypothermia. The action team consists of operating room leadership, educator, frontline staff, anaesthesia, surgeons, infection prevention & control, medical microbiologist and the NSQIP

Promoting wellness. Ensuring care. 44
Quality Coordinator. In addition, the OR group was awarded a summer student by the Surgical Quality Action Network of the BC Quality & Patient Safety, to work with the action team.
3.16% 3.11%3%
4%
5%
6%
of c
ases
with
SSI
LGH Surgical Site InfectionsNSQIP Non Risk Adjusted Data
2.48%
1.97%2.23% 2.20%
0%
1%
2%
Q3 2011 Q4 2011 Q1 2012 Q2 2012 Q3 2012 Q4 2012
Perc
ent o
Vancouver General Hospital
Colorectal SurgeryThe risk adjusted NSQIP report indicates that these surgeries have a higher than expected rate of adverse events. The Enhanced Recovery after Surgery pathway is an evidenced based program that has been shown to improve outcomes following major surgery. The general surgery service is implementing this for the colorectal patients in September 2013. The program is designed to enhance recovery by optimizing preoperative, intraoperative and post-operative factors.
Normothermia InitiativeDrs. Kelly Mayson/Neil Ramsey, in collaboration with the NSQIP Quality Coordinators, reviewed 870 adult patients undergoing major non-cardiac surgical procedures in the NSQIP dataset at Vancouver Acute. Their review revealed a 21% incidence of hypothermia. These patients had higher incidence of hypotension and pain in the recovery room, and had a higher incidence of surgical site infections (SSI) and number of blood transfusions.

Promoting wellness. Ensuring care. 45
ActionsPatients undergoing major surgeries in general surgery, vascular, thoracic, neurosurgery, spine, plastics and urology are being actively prewarmed and temperature maintained with forced air warmer blankets, fluid warmers as appropriate and temperature changes within the operating room.
Cardiac SciencesThe Quality Improvement Multidisciplinary group from cardiac surgery is an engaged inclusive group that consists of nursing, support staff, anaesthesia, surgeons, managers, educators, infection prevention and control and NSQIP Q&PS team. Liaisons with committees such as the Antimicrobial Stewardship committee ensure best practice is supported locally and is consistent regionally.
This poster was created by the team.
Prevention of Surgical Site Infection
C Clean Hands Chlorhexidine Pre-Op wash X 2 Nasal De-Colonization Project
L Leave Dressing on 24 hours post op Leave Pink Solution on 6 hours post op
E Engage Patients and Staff on Best practices for prevention of SSIs
A Appropriate Antibiotic Use: Pre-op timing/Intraop timing/Post op timing
N Normothermia (36 C to 38 C) (Pre/Intra/Post OP)
Normal blood glucose range <10 mmol/L Nutritious Meals No Smoking
Pneumonia Prevention Early data from the NSQIP non risk adjusted reports showed an higher than expected rate of postoperative pneumonia overall at VGH. General Surgery, vascular and otolaryngology services in particular were identified as higher than their comparison group. This was validated with the risk adjusted report. The majority of patients from these services are on unit T8 & T9. This information was shared with the nursing, allied and physician groups through unit meetings, information sessions and Mortality & Morbidity rounds. T8 and T9 formed a multidisciplinary action team. Pneumonia prevention best practice was identified, target goal set, the ICOUGH poster was adapted (with permission from Boston Medical) and the current practice on the units assessed.
Goal: To reduce post-op pneumonia rate in T8 &9 by 50% by June 2013 in comparison to the current state as evidenced by NSQIP databases.

Promoting wellness. Ensuring care. 46
Poster Initial Audit
Action Plan
1. Involve the patient with a poster in each room.
2. Pre printed care plans
3. All appropriate patients will each have an incentive spirometer post op.
4. Education and awareness Roll out.
VGH T8 & T9 Post-op Pneumonia Prevention ProjectSecond Audit: Feb 2013
T8 T9
85%
92%
100% 100%96%96%
92%
100%96%100%
74%
67%
76% 76%
81%80%
60%
Perc
enta
ge
40%
P
20%
0%Use of Incentive
SpirometerCough & Deep
Breathing Exercises
Oral Care Understand (Patient
Education)
Get out of bed HOB 30˚or higher Pain Control
I COUGHSM is a registered service mark of Boston Medical Center Corporation. We gratefully acknowledge their consent to use it in VCH materials.
Have YOU
ICOUGH today? Prevent Post-operative Pneumonia!
Incentive spirometry: Use 5 times per hour
Coughing & deep breathing: Do 5 times per hour
Oral care: Do twice per day
Understand: Ask questions about prevention
Get moving: Ask your health care provider for
suggestions about your activity level \
Head of bed elevated: 30 degrees
Ask your health care provider if I COUGHSM is right for you
Don’t give pneumonia a chance!
SM
VGH T8 & T9 Post-op Pneumonia Prevention ProjectBaseline Audit Aug 2012
T8 T9
0.875
0.96
0.88
1
0.75
0.81 0.8120.8
0.5
0.62
0 46
0.6
0 25
0.38
0.46
0.4
0.125
0.25
0.19 0.190.2
0Use of Incentive
SpirometerCough & Deep
Breathing ExercisesOral Care Understand (Patient
Education)Get out of bed HOB 30or higher Pain Control

Promoting wellness. Ensuring care. 47
Pneumonia rates have decreased as evidenced by the trendline in black in the figure below.
4%
5%
6%
7%
8%
9%
10%
%ca
sesw
ith P
neum
onia
VGH General Surgery Post-op Pneumonia Rate/month
Data Sharing
First Compliance Audit
Action Team at Work
Team Building & Best Practice Review
iCOUGH in-services
0%
1%
2%
3%
%
VGH VGH Median NSQIP median
NSQIP EvaluationA health economic evaluation framework was used to assess qualitative and quantitative benefits of participating in the ACS NSQIP program. This evaluation illuminated the burden that surgical adverse events add to the health system by identifying the potential additional patient case opportunities and financial cost. The physician and staff interviews were positive, the main themes included solid reliable data, platform for communication within multi-disciplines and a strong belief that NSQIP will improve the overall quality of surgical care.
1. Physician/Staff Interview Results:
4
3.2
5.9
4.9
3.6
5.2
NSQIP has improved communication
NSQIP has influenced a culture change
I see value in the program
PHC
VCH
4.3
4
4.8
0 1 2 3 4 5 6
NSQIP is improving quality of surgical care
People strongly agree that there is value in the
program.
81% of the people feel that NSQIP is already improving quality of
surgical care in their area.
VCH Average Results

Promoting wellness. Ensuring care. 48
2. Patient Satisfaction Scores:
Average Patient Satisfaction Scores by SiteMay 2012 - October 2012
4 27
4.42
LGH
UBC
4.26
4.27
VGH
LGH
4.09
4.26
RH
VCH
0 1 2 3 4 5
Being the Being the Worst BestWorst Best
3. The Surgical Quality Action Network of BC Quality & Patient Safety Council engaged an external consultant to work with all the health authorities in identifying potential economic benefits. This was presented as the potential for increased number of surgical procedures if the adverse events were decreased by 25, 50 or 100%.
Patient Case Opportunities
4. Additionally we looked at just the hospital financial burden of these events, this does not include the significant impact on patients and their families.
1600
VCH - Patient Case Opportunities
1200
1400
1600
s (pe
r yea
r)
800
1000
ppor
tuni
ties
200
400
600
ent C
ase
Op
0
200
25% Reduction 50% Reduction 100% Reduction
Patie
If we reduce occurrence rate by 100%:
VCH; highest potential for General Surgery (522 cases), Orthopedics (254
cases)
Patient Case Opportunities

Promoting wellness. Ensuring care. 49
Surgical Adverse Events & Economic Burden
Adverse EventPatient
Cases per Year
Patient Days per
YearCost per Surgical
Adverse EventCost for the treatment of surgical adverse events
Cardiac Events 89 575 $7,789 $695,588Pneumonia 300 2,079 $10,019 – 57,158 $3,009,708Unplanned intubation 47 376
$10,019 $2,5247,88Ventilator > 48 hours 205 1,577DVT/PE 108 558 $18,310 $1,971,987Renal Failure 119 690 $18,414 – 25,219 $2,196,790UTI 123 671 $942 $116,149SSI 422 2,693 $15,331 $6,474,281Total 1,415 9,219 $16,989,260
1,415 adverse events out of 21,680 annual inpatient cases (7%)
We are actively working on decreasing the adverse events associated with surgical care with the goal of providing the best care at all times.
NSQIP Team

Promoting wellness. Ensuring care. 50
Surgical Site Infection (SSI) Rates
What is a surgical site infection (SSI)?A surgical site infection (SSI) is an infection of the tissue in and around a surgical wound. To be considered a SSI the infection must occur within a designated time following surgery. A SSI is a potential major complication after surgery, leading to a longer hospital stay, prolonged recovery, higher costs and patient dissatisfaction.
What is the purpose of this indicator and why is it important?This indicator measures the incidence of SSIs among patients that have had a select surgical procedure at a VCH facility. Measuring the incidence of SSIs is an important measure of surgical quality. It allows infection prevention and control (IPAC) to identify potential infection-related sources and work collaboratively with surgeons to reduce the risk of infection to patients.
What is being measured?IPAC performs SSI surveillance on targeted orthopedic, spinal, cardiac, vascular, thoracic, and neurosurgical procedures. The SSI rate is calculated by taking the total number of SSIs acquired by patients that had a select surgical procedure at a VCH hospital, divided by the number of the same surgical procedures performed and multiplied by 100.
Methodology: How was the data collected?Surveillance is performed using standard definitions for the identification and classification of SSIs (CDC/NHSN 2008). Traditionally, patients who have had procedures without an implant are followed for 30 days from the date of surgery whereas patients who have had a procedure involving an implant are followed for one year post surgery. Recently there has been debate concerning the optimal post-operative surveillance period for the detection of SSIs.
A recent analysis of ten years of SSI data for Vancouver Coastal Health (2000 to 2010/11; 888 SSIs; 50,128 procedures) revealed that 86% of all SSIs were identified within one month of surgery and 93% were identified within 3 months.1 It is well established that to be effective surveillance requires that results be communicated in a timely manner particularly when evaluating performance improvement initiatives. As such, VCH has changed its post-operative surveillance period to three months beginning with surgeries performed in 2011/2012. In January 2013 CDC/NHSN released updated definitions which also reduced the post-operative follow up period from one year to 90 days for procedures involving implants.
1 Bryce, E & Forrester, L. How Long is Long Enough? Determining the Optimal Surgical Site Infection Surveillance Period. Infect Control Hosp Epidemiol 2012; 33(11):1178-1179.

Promoting wellness. Ensuring care. 51
How did we do?Orthopedic Procedures: Surveillance for SSIs associated with select orthopedic hip and knee procedures is performed at the VCH hospitals that perform these procedures; namely Vancouver General, UBC, Richmond, Lions Gate and Squamish General hospitals. Surveillance was not performed at UBC Hospital in 2012/13 but has resumed in 2013/14.
The table below shows the VCH regional rates for total hip and knee primary procedures. The regional rates are below the CDC/NHSN (2009) benchmark rates.
Procedure Group2010/11 2011/12 2012/13
Rate 95% CI Rate 95% CI Rate 95% CITotal hip (Primary) 1.00 0.57-1.62 0.70 0.35-1.25 0.84 0.31-1.84Total hip (Revision) 2.84 1.23-5.59 2.41 0.97-4.97 0.74 0.09-2.68All hips 1.28 0.82-1.90 0.96 0.57-1.52 0.82 0.35-1.61Total knee (Primary) 0.34 0.13-0.74 0.60 0.30-1.06 1.09 0.55-1.96Total knee (Revision) 2.53 0.69-6.48 0.61 0.02-3.42 1.33 0.60-4.79All knees 0.52 0.25-0.96 0.60 0.31-1.04 1.12 0.60-1.92Knee arthroscopy 0.35 0.11-0.82 0.34 0.13-0.75 0.21 0.04-0.61Hip hemiarthroplasty 0.48 0.01-2.68 1.30 0.27-3.80Total procedures 0.75 0.53-1.02 0.48 0.01-2.68 0.71 0.47-1.03
CDC/NHSN (2009): Hip prosthesis (primary) = 1.27 (95% CI = 1.21-1.33); Knee prosthesis (primary) =0.89 (95% CI = 0.85-0.94)
The graph below presents the aggregate VCH rates for total hip and knee (primary) and arthroscopic knee procedures for the last three fiscal years.
1.20
VCH Orthopedic SSI Rates by Fiscal Year
0.80
1.00
roce
dure
s
0.40
0.60
te p
er 1
00 p
r
2010-11 2011-12 2012-130.00
0.20Rat
2010 11 2011 12 2012 13Hip Primary 1.00 0.70 0.84Knee Primary 0.34 0.60 1.09Knee Arthroscopy 0.35 0.34 0.21py 0.35 0.34 0.21

Promoting wellness. Ensuring care. 52
The rate for primary hip replacement (0.84; 95% CI = 0.31 – 1.84) increased in 2012/13 but rates have been consistently below the NHSN benchmark. The rate for primary knee replacement (1.09; 95% CI = 0.55 – 1.96) increased sharply in 2012/13 and surpassed the NHSN benchmark rate though the difference in rates is not statistically significant. Rates for arthroscopic knee procedures have been low and declined further in 2012/13.
Procedure Group 2010/11 2011/12 2012/13
Spinal Procedures Rate 95% CI Rate 95% CI Rate 95% CILaminectomy/Discectomy 2.14 0.58-5.48 4.35 1.88-8.57 0.91 0.11-3.27Spinal fusion with hardware 4.87 3.15-7.19 5.00 3.33-7.27 3.58 2.09-5.73Aggregate Spinal Rate 4.07 2.73-5.85 4.92 3.45-6.82 2.70 1.63-4.22
CDC/NHSN Rates Spinal fusion (1.54; 95% CI = 1.42-1.66); Laminectomy (1.02; 95% CI = 0.92-1.12)
Cardiac Procedures Rate 95% CI Rate 95% CI Rate 95% CICABG 3.57 2.12-5.64 4.26 2.60-6.59 3.39 1.90-5.59CABG + Valve repairs 0.00 0.00-2.90 2.55 0.69-6.52 0.00 0.00-3.07Valve repairs 0.92 0.11-3.31 0.48 0.01-2.67 0.00 0.00-1.95Pacemakers 0.00 0.00-14.76 0.00 0.00-18.44 0.00 0.00-18.44Aggregate Cardiac Rate 2.29 1.40-3.53 2.93 1.89-4.32 1.94 1.09-3.21
CDC/NHSN Rates CABG (2.83; 95% CI = 2.74-2.92); Cardiac Surgery (1.29; 95% CI = 1.16-1.42); Pacemakers (0.44; 95% CI = 0.25-0.73)
Vascular Procedures Rate 95% CI Rate 95% CI Rate 95% CIBypass grafts 1.76 0.57-4.11 1.65 0.45-4.21 1.10 0.23-3.22Aggregate Vascular Rate 1.76 0.57-4.11 1.65 0.45-4.21 1.10 0.23-3.22CDC/NHSN Rates There are no comparable benchmarks availableThoracic Procedures Rate 95% CI Rate 95% CI Rate 95% CIThoracotomy 0.00 0.00-0.76 0.20 0.00-1.09 0.00 0.00-0.67Esophagectomy 0.00 0.00-8.78 0.00 0.00-7.23 0.00 0.00-10.54Aggregate Thoracic Rate 0.00 0.00-0.70 0.18 0.00-0.99 0.00 0.00-0.62CDC/NHSN Rates Thoracic surgery (1.11; 95% CI = 0.70-1.68)Neurosurgical Procedures Rate 95% CI Rate 95% CI Rate 95% CICraniotomy 0.39 0.05-1.41 0.56 0.12-1.64 0.18 0.00-0.97VP shunts 0.00 0.00-11.90 1.89 0.05-10.51 0.00 0.00-9.00Laminectomy/Discectomy 0.00 0.00-8.82 0.00 0.00-8.58 0.00 0.00-9.00Deep Brain Stimulation 4.17 0.11-23.22 0.00 0.00-11.90 0.00 0.00-16.77Aggregate Neuro Rate 0.49 0.10-1.43 0.60 0.16-1.55 0.15 0.00-0.83
CDC/NHSN Rates Craniotomy (2.61; 95% CI = 2.30-2.95); Ventricular shunt (5.61; 95% CI = 4.98-6.29); Laminectomy (1.02; 95% CI = 0.92-1.12)

Promoting wellness. Ensuring care. 53
Other targeted procedures: In addition to orthopedic hip and knee procedures, IPAC at Vancouver General Hospital performs SSI surveillance on targeted spinal, cardiac, vascular, thoracic and neurosurgical procedures. The table on the previous page shows the rates for 2010/11 through to 2012/13 for the surgical procedures followed along with the comparable CDC/NHSN (2009) benchmark rates.
Benchmark & Comparators: How do our rates compare to our benchmarks?CDC/NHSN (2009) comparable benchmarks, where available, are used to evaluate our performance. With the exception of spinal fusion with hardware, all SSI rates are within the range (95% CI) of the comparable benchmark and in fact most are statistically significantly lower particularly for craniotomies, thoracic surgery, VP shunts and neurosurgical laminectomies.
What is the 2013/14 Annual Target the organization seeks to reach?Our goal is to keep our SSI rates below or within the range of the comparable CDC/NHSN benchmarks.
What actions have we taken over the last year?Observed immediate preoperative decolonization therapy using a novel combination of nasal photodynamic therapy and chlorhexidine impregnated body wipes was implemented at VGH for scheduled cardiac, neurosurgical, spine, thoracic, vascular and orthopaedic surgeons starting June 1, 2011. During the project period 3,068 treated and 206 untreated patients were followed for the development of a SSI (94% compliance rate for decolonization therapy) Preliminary results showed that the risk of having a surgical site infection if the patient did not receive decolonization treatment was approximately 10 times higher compared to those who received therapy.
When compared to our historical average of 85 surgical site infections a year (2.7 SSIs/year), an approximate 40% reduction in SSIs was realized during the project period. In addition, the first four fiscal periods of this year has seen a dramatic reduction in readmissions for a surgical site infection from a historical average of 4.04 readmissions/fiscal period (48.5 readmissions/yr) to a total of 5 cases in the last four fiscal periods (1.25 readmissions/fiscal period) (projected at 15 readmissions/ year). This translated into 552 additional days avoided stay for treatment of infection, and these hospital days have been available for other admissions and surgical cases.
Observed decolonization therapy was safe and effective. Considerable patient morbidity was avoided and additional operating time was available for other surgical procedures. Based on this information, the program was sustained at VGH and this fiscal year our overall SSI rate has fallen to an all-time low of 1.2%.

Promoting wellness. Ensuring care. 54
VCH News Item on decolonization project
Way to go! VGH team takes top prize for pilot project to prevent surgical site infections.
Last week, a Vancouver General Hospital team led by Dr. Elizabeth Bryce was recognized at a prestigious international conference for their Pre-Surgical Decolonization Pilot Project that reduced surgical site infections by 39 per cent.
The VGH team competed against 40 international teams to win the Innovation Award of Excellence from the International Consortium for Prevention & Infection Control (ICPIC), which highlights innovations in the practice of infection control and prevention of anti-microbial resistance.
Why the focus on SSIs? Patients who develop infections after surgery are five times more likely to be readmitted to a hospital, and twice as likely to die. On average, SSIs require an extended hospital stay of eight days in an acute care setting and add hundreds of millions of dollars in additional costs to the Canadian health care system every year.
About the pilot The Pre-Surgical Decolonization Project was a 12-month non-antibiotic pilot involving more than 5,000 patients who were treated with MRSAid™ photodisinfection therapy prior to major surgery. Photodisinfection kills potentially harmful bacteria, viruses and fungi harboured on a patient with non-thermal light energy.
“Our pilot marked the first time this combination of non-pharmaceutical therapies has been used in a hospital in North America to reduce SSIs,” says Dr. Bryce, regional medical director of infection prevention and control at VCH.
When combined with chlorhexidine body wipes prior to surgery, the pilot saw SSIs decrease by 39 per cent and the number of readmissions due to SSIs decline from four to 1.25 cases per month. Photodisinfection was found to decrease the amount specific bacteria examined in the study in 80 per cent of cases.

Promoting wellness. Ensuring care. 55
The MRSAid™ photodisinfection pilot has saved VGH more than $1 million in costs associated with treating patients who develop SSIs. ”This technology not only has the potential to prevent infections but the money saved can then be reinvested into direct patient care. I’m very honoured and thrilled to receive this award on behalf of our research team and to further explore infection control techniques.” says Dr. Bryce.
Special thanks to the people who made it happen• Surgery: Bas Masri; Gary Redekop
• Perioperative Services: Debbie Jeske; Claire Johnston; Kelly Barr; Shelly Errico; Anna-Marie MacDonald; Tammy Thandi; Lorraine Haas; Pauline Goundar; Lucia Allocca; Dawn Breedveld; Steve Kabanuk
• Infection Control: Elizabeth Bryce; Chandi Panditha; Leslie Forrester; Diane Louke; Tracey Woznow
• Medical Microbiology: Diane Roscoe; Titus Wong
• Patient Safety: Linda Dempster
• Ondine Biomedical: Shelagh Weatherill et al
Special Thanks: microbiology technologists, and perioperative staff andVGH & UBC Hospital Foundation that provided funding for the pilot.
Photodisinfection technologyThe photodisinfection technology used was developed by Ondine Biomedical Inc.
How the prize money will be used The team was awarded prize money of 10,000 Swiss Francs (approximately $11,000 CAD) that will be reinvested to further advance photodisinfection technology across the region.
About ICPICICPIC is an international conference that brings together more than 1,200 leaders in infection control from 84 countries. The goal is to exchange best practices, highlight current research in the field and share innovations in infection control.

Promoting wellness. Ensuring care. 56
Surgical Safety ChecklistWhat are we doing?The Surgical Safety Checklist (SSCL) is designed to promote effective team functioning, by developing an interactive tool to empower healthcare teams, improve team dynamics, and increase team communication in high-risk healthcare procedures. A high-risk healthcare procedure is one that involves two or more healthcare professionals who are involved in and rely on each other in completing a multi-step procedure together. By applying human factors principles to the development and implementation of the surgical safety checklist, improvements to safe practices, greater situational awareness, increased leadership and management, compliance with infection control policies, and increased team communication can be achieved between clinical disciplines.
The SSCL is used as an opportunity to verify that all critical safety steps are consistently completed during three strategic phases: Briefingbefore induction of anaesthesia; Time Out before skin incision and before the patient leaves the operating room.
VCH is committed to ensuring that the SSCL and other surgical safety tools are used in all operating rooms in VCH, all the time, for all patients. Compliance with the Checklist may help to reduce the rate of complications experienced within operating room settings.
Overall compliance and compliance on each of three components is measured every fiscal period and is reported in the PSQI scorecard. In addition, reports by facility and surgical service are posted to our portal every fiscal period.
How are we doing?The results show that overall compliance with the SSCL has been steadily improving from its first introduction in 2010/11. The average compliance in 2012/13 was 74.5% compared to 62.9% in 2011/12 representing a percent improvement of 18.4%. When examining compliance on each of

Promoting wellness. Ensuring care. 57
the three components we see that there have been significant improvements in compliance with the Timeout and Debriefing components.
100
VCH Overall SSCL Compliance
70
80
90
nce
40
50
60
Perc
ent C
ompl
ian
0
10
20
30P
P6 P7 P8 P9 P10 P11 P12 P13 P1 P2 P3 P4 P5 P6 P7 P8 P9 P10 P11 P12 P13 P1 P2 P3 P4 P5 P6 P7 P8 P9 P10 P11 P12 P132010-11 2011-12 2012-13
VCH 14 14 28 30 29 40 51 57 53 54 56 58 66 66 65 65 69 69 66 68 63 65 69 76 76 75 75 75 76 75 74 76 79 78
0
Percentage of completed surgical cases compliant on the use of all three components to the SSCL (Briefing, Timeout, Debriefing). Measured by fiscal period and reported quarterly on the PSQI Scorecard. Target 100%.
100
VCH SSCL Components Compliance
60
70
80
90
lianc
e
30
40
50
60
Perc
ent C
omp
P6 P7 P8 P9 P10 P11 P12 P13 P1 P2 P3 P4 P5 P6 P7 P8 P9 P10 P11 P12 P13 P1 P2 P3 P4 P5 P6 P7 P8 P9 P10 P11 P12 P132010-11 2011-12 2012-13
0
10
20
Briefing 34 27 56 59 59 70 79 84 81 80 80 82 86 85 85 84 88 87 84 86 81 81 86 92 91 92 92 90 91 90 90 91 92 91Timeout 93 97 95 96 94 95 96 97 96 95 94 96 96 97 96 94 97 96 96 96 93 89 96 97 97 97 97 97 97 96 96 97 97 97Debrief 15 14 30 32 32 43 54 60 56 58 61 63 69 72 71 71 74 74 71 71 68 68 74 80 80 80 79 81 82 80 80 82 84 83
Percentage of completed surgical cases compliant on each of the three components to the SSCL (Briefing, Timeout, Debriefing). Measured by fiscal period and reported quarterly on the PSQI Scorecard. Target 100%.

Promoting wellness. Ensuring care. 58
Antibiotic ProphylaxisImproving Surgical CareAppropriate timing and dosage of pre-operative prophylaxis plays a key role in reducing the risk of surgical site infections.
Why is it important?Evidence suggests that the appropriate antibiotic at the appropriate dose should be administered within one hour of the start of certain surgical procedures. VCH Quality and Patient Safety department monitors this data and informs the surgical teams of their performance on a regular basis. Reports are generated every fiscal period and posted to our portal. This information is provided to the surgical teams to improve their compliance with this important guideline.
90
100
VCH Antibiotic Prophylaxis Compliance (2012-2013)
70
80
90
nce
40
50
60
cent
Com
plia
n
20
30
Perc
P1 P2 P3 P4 P5 P6 P7 P8 P9 P10 P11 P12 P13% Compliance 27 37 45 44 45 48 47 47 46 46 48 48 47
0
10
How are we doing?Overall compliance increased in the first three periods and then stabilized at approximately 47%. Documentation issues remain a challenge and skew the results significantly. Periodic auditing of compliance has shown that the appropriate antibiotic was being administered within the correct time frame but that it was not being documented.

Promoting wellness. Ensuring care. 59
Catheter Associated UTIs (CAUTI)What is CAUTI?Catheter-associated urinary tract infections (CAUTIs) represent patient harm, reservoirs of antimicrobial-resistant microorganisms and unnecessary costs. Forty percent of all healthcare-associated infections are CAUTIs, yet as many as 65-75% of these could be avoided through current evidence-based strategies. Additionally, we know that of the 12-25% of hospitalized patients who receive a urinary catheter, 50% do not have a valid indication. Successfully reducing CAUTIs potentially prevents 50,000 patients from developing infections, 1300 deaths each year and an estimated $1.5 million in savings to the cost of healthcare (Gravel 2007, Umscheid 2011).
The impetus behind this initiative is to improve the care of our patients by implementing the best evidence-based practices to prevent catheter-associated urinary tract infections. This is done with the knowledge that while the harm caused by catheter-associated urinary tract infection is not intentional, it is often preventable. It acknowledges that many medical errors are systems failures, rather than individual failures. Our goal, therefore, is to provide health care workers with the knowledge and tools required to prevent and minimize harm from the use of urinary catheters.
What are we doing?VCH has focused efforts on reducing catheter associated urinary tract infections (CAUTI) by striking a Regional Steering Committee dedicated to reducing the number of infections over the next fiscal year and beyond with a goal to achieve a target rate of 5/1000 discharges.
As part of a larger VCH quality improvement initiative, the CAUTI Team is working with other key quality improvement programs to leverage the skills and dedicated commitment of frontline staff in reducing the number of hospital acquired infections.
Guided by input from our clinicians, the Committee has been focused on reformatting Clinical Practice Guidelines, Pre-Printed Orders, and Education Tools while making these resources available at the point of care. Prevention strategies are focused on 4 key drivers including: avoiding unnecessary urinary catheters; standardized aseptic insertion techniques; following guidelines for care and management including appropriate urine sampling; daily review of catheter necessity and prompt removal where appropriate.
Based on experience with other change initiatives, implementation will likely occur over several months while full compliance will almost certainly take longer as it requires a combination of behaviour changes, simplified communication and data collection to measure and sustain improvement. Data is critical in any effort to drive change at the frontline which is why we’re

Promoting wellness. Ensuring care. 60
integrating outcome measures data from the National Surgical Quality Improvement Program (NSQIP), Canadian Institute for Health Information (CIHI) discharge abstract data and VCH urosepsis data. Additionally, clinicians are actively involved in the collection of process measures data through chart and observational audits to identify unit based and organizational opportunities for improvement, building ownership at the unit level. Through regular sharing of data, individual units develop action plans and report their progress through regular monthly ‘check-ins’ and Quality Council reports.
How are we doing?Through leadership provided by the regional Quality & Patient Safety and Professional Practice teams, Vancouver Acute has initiated a phased approach to implementing CAUTI in 2 strategic waves. Each clinical area has been responsible for the development of their unit level action plans, ongoing monitoring of area identified process measures and sustainment of change initiatives. The learning’s from each of the clinical areas have been shared throughout VA with great success and has recently spread to the Coastal Community of Care as they begin their work to reduce CAUTI. The final transition of the CAUTI initiative to Richmond Community of Care will take place in the new year as this multidisciplinary collaborative effort continues to spread across VCH.
One of the measures used to assess how we are doing in reducing CAUTIs is urosepsis. Last fiscal year, urinary tract infections leading to bacteremia was identified as a priority area.
What is Urosepsis?Urosepsis is a bloodstream infection that originates from a urinary tract infection. The graph below shows the annual rates of urosepsis since 2005/06. The results show that the rates have declined at VGH and have remained stable at both LGH and RH. The VCH rate is 1.4 (95% CI = 1.1 – 1.8).
What is being measured? The rate of blood stream infections with a urinary tract infection as the primary source (urosepsis) is being followed.
Methodology: How was the data collected? The data are collected by Infection Control Practitioners using standardized definitions and surveillance protocols. VCH case definitions are provided in Appendix 1.
How did we do compared to our 2012/13 Annual Target? The target for 2012/13 was to reduce our VCH urosepsis rate by 10% for a rate of 1.62 per 10,000 patient days. We achieved our target by reducing our rate to 1.4 (95% CI = 1.1 – 1.8) which represents a reduction of 22.2%.

Promoting wellness. Ensuring care. 61
4.0
Annual Rates of Urosepsis
2.5
3.0
3.5
patie
nt d
ays
1.0
1.5
2.0
ate
per 1
0,00
0
2005-06 2006-07 2007-08 2008-09 2009-10 2010-11 2011-12 2012-13VGH 1.9 2.9 3.6 2.5 2.1 2.4 2.6 2.0
0.0
0.5Ra
VGH 1.9 2.9 3.6 2.5 2.1 2.4 2.6 2.0LGH 2.0 1.9 0.6 1.2 0.8 0.7RH 0.5 0.8 0.6 0.6VCH 3.1 2.3 1.6 1.9 1.8 1.4
What is the Annual Target the organization seeks to reach? Our goal for 2013/14 is to reduce our 2012/13 rate by 10% for an annual regional target of 1.3 per 10,000 patient days.
VGH Infection Control Practitioners win People First Award
Promoting wellness. Ensuring care. 62
Long Term CareVCH has 16 directly-funded facilities that provide residential care to clients across the region. In total there are 1770 directly-funded residential care beds.
There is no standardized provincial or national surveillance for MRSA or CDI for residential care. The screening of residents is not routinely performed and cases are therefore identified through passive surveillance.
MRSA: There were a total of 49 cases of MRSA identified over the 2012/13 fiscal year compared to 33 in 2011/12 and 40 in 2010/11. Of the cases identified this fiscal year, 25 represented infections.
CDI: There were 34 episodes of CDI identified over the 2012/13 fiscal year compared to 19 in 2011/12 and 24 in 2010/11. Of the CDI episodes this year, 24 were new infections and 10 were relapses.
Kiwanis Care Centre hand hygiene embassadors

Promoting wellness. Ensuring care. 63
GF Strong Rehabilitation CentreGF Strong is British Columbia’s largest rehabilitation Centre with 68 beds serving residents of BC and the Yukon. GF Strong provides inpatient, outpatient, outreach and clinical support services to clients in four unique programs: Acquired Brain Injury, Spinal Cord Injury, Arthritis and Neuromusculoskeletal, and Adolescent and Young Adult (with congenital disabilities).
There is no standardized provincial or national surveillance for MRSA and CDI at GF Strong. Screening of clients at the time of admission was initiated in October 2011. Clients are now screened for MRSA if they have been in any healthcare facility for 48 hours or longer in the last six months. As part of the VCH VRE risk managed approach, screening for VRE stopped in April 2013. Clients are also screened for resistant gram negative bacilli (GNB) if they stayed in a healthcare facility outside of Canada.
For 2012/13, there were eight cases of MRSA and five CDI cases acquired at GF Strong compared to 10 MRSA and two CDI in 2011/12.
The graph below shows the rates for newly identified MRSA, VRE and CDI (including relapses) by fiscal year. Rates are reported as the number of cases per 10,000 client days.
30.0
MRSA and CDI Acquired at GFS: Rates by Fiscal Year
20.0
25.0
ent D
ays
10.0
15.0
per 1
0,00
0 Cl
ie
2005/06 2006/07 2007/08 2008/09 2009/10 2010/11 2011/12 2012/130.0
5.0Rate
p
2005/06 2006/07 2007/08 2008/09 2009/10 2010/11 2011/12 2012/13MRSA 17.8 17.2 28.3 6.2 6.8 3.0 3.8 3.3CDI 5.1 2.8 1.6 2.6 5.1 3.0 0.8 2.0
Surveillance for catheter-associated urinary tract infections (CAUTI) was initiated in April 2010 with a point prevalence study and then ongoing monthly surveillance. The graph below shows the crude rates per 1000 client days. There is currently no mechanism in place to capture catheter days to be able to provide a proper device-associated rate.

Promoting wellness. Ensuring care. 64
In 2012/13 a total of 87 episodes of urinary tract infection (UTI) were identified among clients of GF Strong compared to 163 the year prior representing a 46.6% decrease in cases. The annual incidence rates was 3.51 per 1,000 client days (95% CI = 2.81 – 4.33) in 2012/13 compared to 6.12 in 2011/12 (95% CI = 5.22 – 7.14). This reduction in rates is statistically significant.
The majority of UTIs were catheter-associated (CAUTIs). In 2012/13 there were 69 CAUTIs compared to 154 in 2011/12 representing a 55.2% decrease in cases. The annual incidence rate was 2.79 per 1,000 client days (95% CI = 2.17 – 3.53) in 2012/13 compared to 5.78 (95% CI = 4.91 – 6.77) in 2011/12. This reduction in rates is statistically significant.
Overall UTI and CAUTI annual facility rates per 1,000 client days are shown below.
9.00
GFS: Annual Rates UTI/CAUTI
6.00
7.00
8.00
nt D
ays
3 00
4.00
5.00
per
100
0 Cl
ien
1.00
2.00
3.00
Rate
2010-11 2011-12 2012-13UTIs 7.95 6.12 3.51CAUTI 6.58 5.78 2.79
0.00
Rates are calculated for the specific client populations. Clients on the spinal cord injury ward (SCI) are much more likely to be catheterized for extended periods of time and consequently have a considerably higher risk of CAUTI than other clients who receive care at GF Strong.
In 2012/13 there were 65 UTIs acquired on the SCI ward compared to 138 in 2011/12 representing a decrease of 52.9% in cases. Of the UTIs, 59 were CAUTI in 2012/13 compared to 65 in 2011/12 representing a decrease of 56.0%.
The quarterly rates by ward are presented below. The results show that there is an overall downward trend in the rates for the SCI ward. The rates for the other two wards (Acute Brain Injury/Adolescent and Young Adult (ABI) and Neuromuscular/Arthritis (NM)) have remained consistently low.

Promoting wellness. Ensuring care. 65
25.0
CAUTI Quarterly Rates by Ward: 2010-11 to 2012-13
15.0
20.0
25.0
Clie
nt D
ays
5.0
10.0
Rate
per
1,0
00 C
11-Q1 11-Q2 11-Q3 11-Q4 12-Q1 12-Q2 12-Q3 12-Q4 13-Q1 13-Q2 13-Q3 13-Q42010-11 2011-12 2012-13
2 (SCI) 20 2 20 7 19 9 16 1 14 9 16 5 17 7 15 0 8 6 11 6 5 2 5 6
0.0
R
2 (SCI) 20.2 20.7 19.9 16.1 14.9 16.5 17.7 15.0 8.6 11.6 5.2 5.63 (ABI) 1.8 2.0 1.5 1.8 1.9 3.9 1.5 1.4 2.0 1.5 1.1 0.04 (NM) 0.0 0.0 0.0 0.0 0.4 0.0 0.0 0.0 0.0 0.0 0.5 0.0
Regional initiatives to prevent CAUTI continue at GF Strong.
Preventing Catheter-Associated Urinary Tract Infections (CAUTI) in a Rehabilitation Facility -- Meeting the Standards
Objectives
Introduction
Surveillance
Interventions Conclusions
Future Steps
References Point Prevalence Study: A point prevalence study was conducted by chart review on a single day in April 2010. Patients were identified as having a catheter and/or a UTI based on nursing notes, microbiological data and treatment records. Surveillance: The microbiology database was searched retrospectively for urine culture results. The client chart was reviewed to identify if the clinical team identified UTI (e.g. treated with appropriate antibiotic) and if patient had a catheter in place. Catheter days data was not collected. Reporting: Surveillance data was reported monthly to physicians, client-care coordinators, educators, and administrators.
Lisa Harris RN CIC, Leslie Forrester MA MSc, Jennifer Grant MDCM FRCPC
Vancouver Coastal Health Authority, Division of Medical Microbiology and Infection Control
GF Strong Rehabilitation Center provides in-patient rehabilitation to clients with spinal cord injury, acute brain injury, arthritis and neuromuscular disease. Urinary catheters are most prevalent in the spine injury and acute brain injury client groups. Surveillance for CAUTI began with a point prevalence study, which identified spinal rehabilitation patients as being at highest risk. Monthly surveillance continued for all wards. Review of the new guidelines identified differences in practice and opportunities to decrease CAUTI. Innovative new practices were introduced to facilitate practices that are appropriate for both healthcare and for eventual client discharge.
1. Determine CAUTI and UTI rates on a spinal rehabilitation ward. 2. Assess practices to prevent CAUTI. 3. Identify practice gaps with new practice guidelines (1) 4. Change practices to meet standards. 5. Provide ongoing surveillance and feedback to care providers.
• UTI rates are high in spinal cord rehabilitation clients
• Best practice is not always followed
• Intervention, including:
•Education
•Implementation of standards
•Ongoing surveillance and feedback
has a measurable impact in reducing CAUTI rates
• Ongoing surveillance and timely reporting of results
• Review clean technique taught to clients (for home use)
• Review changing indwelling catheter at one month interval
• Develop video of aseptic technique
• Expand guideline practices to wards at other sites
• Gould, C.V. et al. HICPAC Guideline. Guideline for Prevention of Catheter-Associated Urinary Tract Infections 2009. ICHE, April 2012, vol. 31, no.4.
•VCH U-100 urinary catheter guidelines
Results
Guidelines recommendation Specific intervention Date implemented
II.C. In acute care hospital, insert urinary catheters using aseptic technique and sterile equipment
1.All urinary catheters inserted using aseptic technique 2. Aseptic technique reviewed with all staff with return demonstration
December 2010 March 2011
III.B.3. Empty collecting bag regularly using a separate, clean container for each patient
Non-sterile multiuse urinals replaced with clean, client-specific, non-sterile containers, discarded every 24 hours December 2010
III.A. Following aseptic insertion of the urinary catheter, maintain a closed drainage system
Closed system of leg bag attached to indwelling catheter with piggy-back of night bag (see figure 3) January 2012
Additional Measures
Education /discussion sessions with staff Review of guidelines, brain-storming, feedback sessions, safety huddles
12 sessions between January 2011 and December 2011
Vendor meetings Review products available to meet needs of client population
Three meetings between January 2011 and December 2011
Physician meetings Reviewed guidelines and changes to practice, as well as surveillance activity
September 2011 and November 2011
Figure 2: Results of point prevalence study.
Fig 4: Ongoing surveillance of CAUTIs. Downward trend on SCI ward depicted with dotted line
Figure 1: novel leg-bag arrangement
Left picture is day bag
Right picture is night bag system
Acknowledgements • The authors gratefully acknowledge the contributions of the staff and physicians at GF Strong Rehabilitation Center and the Microbiology Department at Vancouver General Hospital
Fig 3: UTI rate overall showing statistically significant decrease in rates of UTI
2 (SCI) 3 (ABI) 4 (NM) Total 23 22 23 UTI 5 0 1
0
5
10
15
20
25
30
Num
ber o
f Clie
nts
UTI Point Prevalence Study
11-Q1 11-Q2 11-Q3 11-Q4 12-Q1 12-Q2 12-Q3 12-Q4 2 (SCI) 20.2 20.7 19.9 16.1 14.9 16.5 17.7 15.0 3 (ABI) 1.8 2.0 1.5 1.8 1.9 3.9 1.5 1.4 4 (NM) 0.0 0.0 0.0 0.0 0.4 0.0 0.0 0.0
0.0
5.0
10.0
15.0
20.0
25.0
Rat
e pe
r 100
0 C
lient
Day
s
CAUTI Quarterly Rates by Ward: (2010-11 & 2011-12)
Q1 Q2 Q3 Q4 Q1 Q2 Q3 Q4 2010-11 2011-12
Overall UTI 9.0 9.1 7.9 6.3 5.9 7.0 6.3 5.5 CAUTI 7.0 8.1 6.8 5.7 5.4 6.8 5.9 5.1
0.0
2.0
4.0
6.0
8.0
10.0
Rat
e pe
r 100
0 C
lient
Day
s
Overall UTI & CAUTI Quarterly Rates: (2010-11 & 2011-12)
Mar 15, 2011 - sterile technique catheter insertion

Promoting wellness. Ensuring care. 66
A Four Cornerstone Approach to Reducing Healthcare Associated Infections
A multidisciplinary team was convened, regionally, in April 2012, to address new strategies to reduce healthcare associated infections (particularly Clostridium difficile) and to optimize antimicrobial therapy. Two cornerstones, hand hygiene and standardized infection prevention protocols, had been in place for many years. Two new programs were created to complete this four cornerstone approach: An Antimicrobial Stewardship Program and an Environmental Cleanliness Program. The purpose of this report is to summarize the impact of the Environmental Program to date.
The Environmental Cleanliness Program is a multidisciplinary approach to preventing hospital acquired infections. In year one, the program is well established at Richmond Hospital (RH), Lions Gate Hospital (LGH) and Vancouver General Hospital (VGH). At VGH, this program has strong linkages with the CDI Working Group. Key elements in place at the three sites include: a commitment to a decluttered environment, the introduction of Personal Protective Equipment (PPE) carts, wall mounted dispensers for disinfectants, personal bins for personal patient belongings and the identification of unit champions to maintain a clean and tidy workplace.
Regional milestones to date:
1. Introduction of colour coded microfiber cloths and buckets for housekeeping carts;
2. Plain language housekeeping cards explaining isolation requirements;
3. Successful decluttering of all nursing units;
4. Three cycles of completed UV housekeeping audits;
5. A risk managed approach to VRE isolation;
6. Swap out of chlorhexidine soap to a neutral soap;
7. Improved laundry utilization with a 10% reduction in the delivery of isolation gowns to LGH, RH, VGH and UBC Hospital;
8. A saving of $34,000.00 in one month due to decreased glove use and/or waste.

Promoting wellness. Ensuring care. 67
Sitespecificdetailsinclude:Vancouver General Hospital (VGH): The formal opening of a newly organized Equipment Depot on March 19th 2013. Additionally, a Mobile Equipment Cleaning and Distribution Program (MECD) has been in place on ten units since late March. Completion of this program is pending the delivery of more infusion pumps.
Lions Gate Hospital (LGH): After locating an appropriate space on the ground floor of the Activation Building, renovation of the LGH equipment Depot is near completion. This will function as a Central Equipment Storage and Repair area. The planned opening is July 22, 2013. This will coincide with the launch of the MECD program at LGH.
Richmond Hospital (RH): Space limitations have been a challenge at RH and a location for an Equipment Depot has now been designated in the Rotunda area. Renovations are planned and this will be the central location for the RH equipment cleaning and distribution program. The planned launch date for the MECD program at RH is early July 2013.
Key partnerships have been developed in many areas:
1. With HSSBC to monitor glove usage and to look at opportunities to decrease waste. Glove use at the three sites is monitored monthly and any deviations and spikes in use will be addressed at the ward/unit level. This will be a “how can we help” approach.
2. With Occupational Therapy and Physiotherapy to ensure that wheelchairs and rehabilitation equipment is cleaned after patient use.
3. With BISS to monitor laundry utilization (fewer yellow isolation gowns used) linked to a reduction in the number of patients isolated daily for VRE (at VGH for example, there has
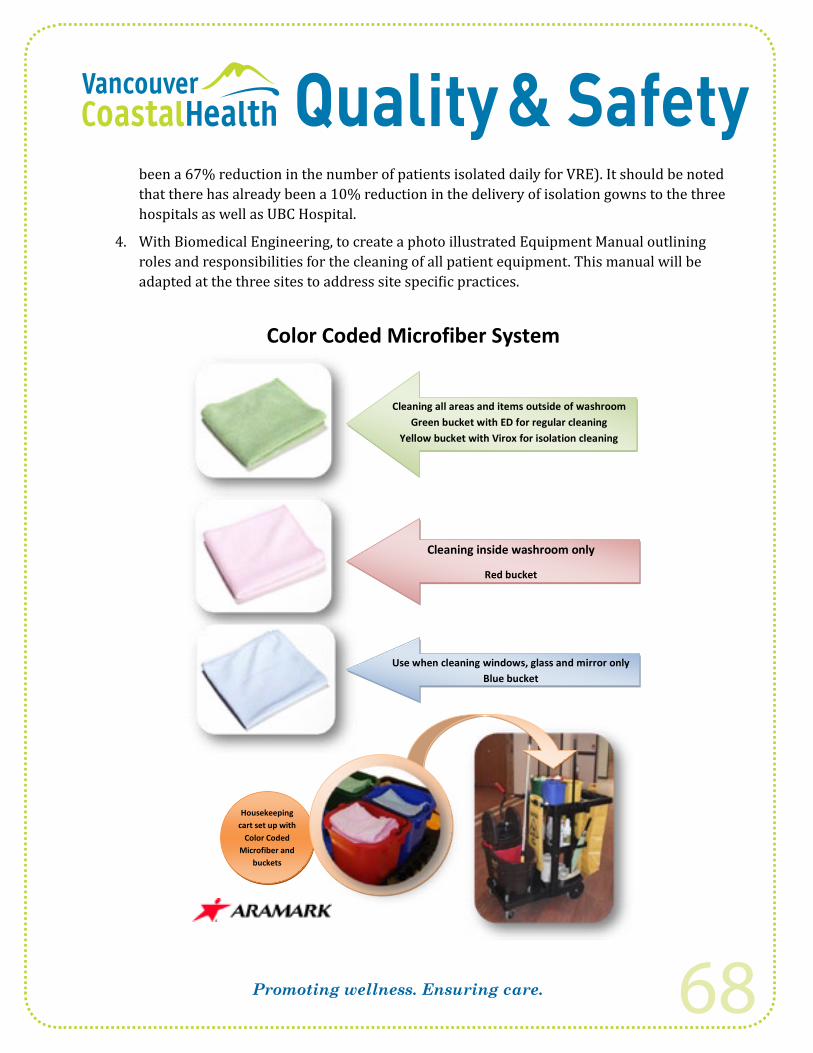
Promoting wellness. Ensuring care. 68
been a 67% reduction in the number of patients isolated daily for VRE). It should be noted that there has already been a 10% reduction in the delivery of isolation gowns to the three hospitals as well as UBC Hospital.
4. With Biomedical Engineering, to create a photo illustrated Equipment Manual outlining roles and responsibilities for the cleaning of all patient equipment. This manual will be adapted at the three sites to address site specific practices.
Cleaning all areas and items outside of washroom Green bucket with ED for regular cleaning
Yellow bucket with Virox for isolation cleaning
Regual
Cleaning inside washroom only
Red bucket
Use when cleaning windows, glass and mirror only Blue bucket
Housekeeping cart set up with
Color Coded Microfiber and
buckets
Color Coded Microfiber System
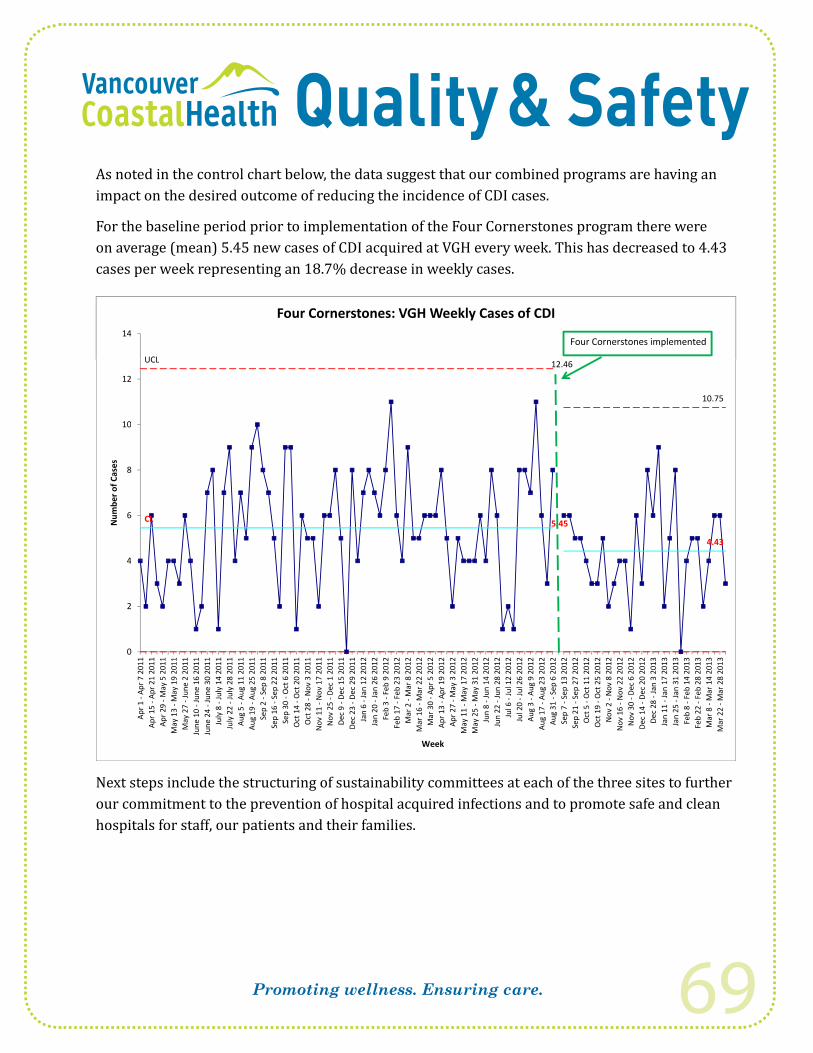
Promoting wellness. Ensuring care. 69
As noted in the control chart below, the data suggest that our combined programs are having an impact on the desired outcome of reducing the incidence of CDI cases.
For the baseline period prior to implementation of the Four Cornerstones program there were on average (mean) 5.45 new cases of CDI acquired at VGH every week. This has decreased to 4.43 cases per week representing an 18.7% decrease in weekly cases.
UCL
14
Four Cornerstones: VGH Weekly Cases of CDI
Four Cornerstones implemented
UCL 12.46
10.75
10
12
8
10
r of C
ases
CL 5.45
4.43
4
6
Num
ber
2
4
0
Apr 7
201
1Ap
r 21
2011
May
5 2
011
ay 1
9 20
11un
e 2
2011
ne 1
6 20
11ne
30
2011
uly
14 2
011
uly
28 2
011
ug 1
1 20
11ug
25
2011
Sep
8 20
11ep
22
2011
Oct
6 2
011
Oct
20
2011
Nov
3 2
011
ov 1
7 20
11De
c 1
2011
Dec
15 2
011
Dec
29 2
011
an 1
2 20
12an
26
2012
Feb
9 20
12eb
23
2012
Mar
8 2
012
Mar
22
2012
Apr 5
201
2Ap
r 19
2012
May
3 2
012
ay 1
7 20
12ay
31
2012
un 1
4 20
12un
28
2012
Jul 1
2 20
12Ju
l 26
2012
Aug
9 20
12ug
23
2012
Sep
6 20
12ep
13
2012
ep 2
7 20
12O
ct 1
1 20
12O
ct 2
5 20
12N
ov 8
201
2ov
22
2012
Dec
6 20
12De
c 20
201
2Ja
n 3
2013
an 1
7 20
13an
31
2013
eb 1
4 20
13eb
28
2013
Mar
14
2013
Mar
28
2013
Apr 1
-Ap
r 15
-AAp
r 29
-MM
ay 1
3 -M
May
27
-JJu
ne 1
0 -J
uJu
ne 2
4 -J
uJu
ly 8
-Ju
July
22
-Ju
Aug
5 -A
Aug
19 -
ASe
p 2
-Se
p 16
-S
Sep
30 -
Oct
14
-OO
ct 2
8 -N
Nov
11
-NN
ov 2
5 -
Dec
9 -D
Dec
23 -
DJa
n 6
-JJa
n 20
-J
Feb
3 -
Feb
17 -
FM
ar 2
-M
Mar
16
-MM
ar 3
0 -
Apr 1
3 -A
Apr 2
7 -M
May
11
-MM
ay 2
5 -M
Jun
8 -J
Jun
22 -
JJu
l 6 -
JJu
l 20
-JAu
g 3
-AAu
g 17
-A
Aug
31 -
Sep
7 -S
Sep
21 -
SO
ct 5
-O
Oct
19
-ON
ov 2
-N
Nov
16
-NN
ov 3
0 -
Dec
14 -
DDe
c 28
-Ja
n 11
-J
Jan
25 -
JFe
b 8
-FFe
b 22
-F
Mar
8 -
MM
ar 2
2 -M
Week
Next steps include the structuring of sustainability committees at each of the three sites to further our commitment to the prevention of hospital acquired infections and to promote safe and clean hospitals for staff, our patients and their families.

Promoting wellness. Ensuring care. 70
smart prescribing
What is Antimicrobial Stewardship?Antimicrobial stewardship is the practice of using anti-infectives (such as antibiotics, antifungals, and antivirals) appropriately for the treatment of infections. This involves selecting the best anti-infective and using the right dose, route, frequency and duration when treating patients.
What is the Antimicrobial Stewardship Programme?Antimicrobial Stewardship Programme: Innovation, Research, Education, and Safety (ASPIRES) is a clinical quality improvement initiative that aims to achieve the best clinical outcomes for patients through optimal antimicrobial therapy, clinician education programmes, and outcomes-based research.
The ASPIRES programme was launched in November of 2012 at the three acute care facilities of Vancouver Coastal Health: Lions Gate Hospital (LGH), Richmond Hospital (RH), and Vancouver General Hospital VGH). More information on ASPIRES is available at the following intranet site: http://vchconnect.vch.ca/programs_services/patient_safety/antimicrobial_stewardship_program_-_aspires/page_118232.htm
What are ASPIRES’ Goals?ASPIRES’ overall goal is to improve clinical quality and patient safety at our hospitals. We aim to achieve this goal through collaboration with healthcare providers to:
• successfully treat infections
• reduce inappropriate antimicrobial use
• reduce adverse drug reactions (ADR)
• prevent antimicrobial-resistance
• save health care costs.

Promoting wellness. Ensuring care. 71
What are the Core Activities and Initiatives of ASPIRES? Since its inception, ASPIRES has collaborated closely with physicians, pharmacists, nurses, and other health care professionals to promote appropriate anti-infective use at Vancouver Coastal Health. ASPIRES efforts have been mainly focused on the following four core areas:
I. Prospective audit and feedback
II. Best clinical practice guidelines and tools
III. Education
IV. Antimicrobial Utilization Evaluation
I. Prospective Audit and FeedbackAudit and feedback is an evidence-based process of reviewing a patient’s anti-infective therapy with the prescriber to optimize treatment. The ASPIRES’ clinical audit and feedback team (Drs. Jennifer Grant and Tim Lau) reviews patients who are on targeted antimicrobials and provides recommendations to the health care team. This practice involves the selection of the most appropriate anti-infective based on clinical status, indication, allergies, culture and susceptibility results, potential drug interactions and adverse effects, in compliance with clinical practice guidelines.
The prospective audit and feedback initiative started on the CTU wards at VGH in March of 2013. Further expansion to the general surgery and Leukemia/Bone Marrow Transplant wards are planned for August of 2013. A clinical pharmacist-managed model of the prospective audit and feedback programme will commence in the acute care nursing units at Lions Gate Hospital and the medicine unit at Richmond Hospital in August of 2013.
ASPIRES’ clinical audit and feedback team has made recommendations for over 50% of patients reviewed; 77% of all ASPIRES’ suggested interventions have
been accepted and implemented by the attending physicians

Promoting wellness. Ensuring care. 72
10152025303540
mbe
r of I
nter
vent
ions
Number of prospective audit and feedback interventions on CTU units, March 15 – May 26, 2013
05
Broad-spectrum Anti-infective
Multiple Anti-infectives with
Overlapping Spectrum
IV Anti-infective That Can Be
Stepped Down to PO
Prolonged Anti-infective
ID Consult Unnecessary Anti-infective
Num
II. Best Clinical Practice Guidelines and ToolsThe ASPIRES’ clinical team works with Infectious Diseases, Pharmacy, Medical Microbiology, and other stakeholder groups to identify key areas for improvement in the diagnostics and management of infections, with the aim to improve prescribing and treatment based on best practices.
Current clinical practice improvement initiatives focus on the following priority areas:
Clostridium difficile Infection (CDI):
The C. difficile Infection (CDI) quality assurance initiative is a regional programme that was developed as a collaborative effort between Pharmacy and Infection Control to ensure all CDI patients receive optimal treatment. Patients are required to be treated based on the evidence-based CDI Treatment Algorithm in the VCH CDI Management Policy. All evaluable CDI patients are followed by Clinical Pharmacists at LGH, RH, and VGH who assess for treatment appropriateness and recommend changes, where appropriate, to optimize treatment. Follow-up with physicians occur to encourage adherence to support this Policy. The target for Pharmacist Assessment is 100%.
Pharmacist Assessment of CDI patients is used as a metric to reflect that patients are receiving optimal therapy based on the CDI Treatment Algorithm, this metric is collected and reported each period.
The proportion of CDI cases followed by a clinical pharmacist has been increasing since ASPIRES’ inception; in periods 10, 11, and 13 of FY 2012/13, 100% of CDI
cases at LGH, RH, and VGH were followed up by clinical pharmacists

Promoting wellness. Ensuring care. 73
102030405060708090
100
% A
sses
sed
Percent of CDI Cases Assessed by Pharmacists by Fiscal Period
P1 P2 P3 P4 P5 P6 P7 P8 P9 P10 P11 P12 P13VGH 82.2 71.0 91.9 92.3 84.4 100.0 100.0 100.0 100.0LGH 40.0 100.0 100.0 83.3 100.0RH 57.1 77.8 100.0 83.3 87.5 100.0 100.0 100.0 100.0
010
Urinary Tract Infection (UTI):
In consultation with the hospitalists and nursing groups at VGH, ASPIRES developed a urinary tract infection (UTI) management algorithm. The algorithm was launched on the hospitalist units in February of 2013 in conjunction with the VCH Catheter-associated Urinary Tract Infection (CAUTI) initiative which is co-led by Quality & Patient Safety and Professional Practice. Hospital-wide implementation of the UTI algorithm is being planned. The UTI algorithm has been shared with the LGH and RH physician groups with the intent of implementation at those sites in the near future.
ASPIRES is currently conducting an evaluation of the UTI algorithm on the hospitalist units at VGH as a quality assurance measure. Findings from this assessment will assist in determining the potential impact of the intervention at other VCH sites.
ASPIRES will continue to work with the CAUTI team to develop UTI management teaching material to ensure proper sampling of urine cultures and use of optimal empiric anti-infective treatments for UTIs.
The number of redundant urine samples sent to Medical Microbiology lab for cultures have decreased by 25% on the hospitalist nursing units that received
education on proper urine sampling.

Promoting wellness. Ensuring care. 74
Community-acquired Pneumonia (CAP):
In a joint effort with the Emergency Department (ED) physicians at RH, ASPIRES has developed CAP Management Guidelines and pre-printed physician orders, which will be used in the ED to standardize CAP therapy and will be a resource for audit and feedback initiatives on the medicine ward (2 South) at RH. At LGH and VGH, ASPIRES is working with the ED physicians to adopt these guidelines.
Surgical Prophylaxis Guidelines:
Partnering with the Cardiac Surgery Quality Improvement Team and the National Surgical Quality Improvement Program (NSQIP), ASPIRES has developed a standardized antibiotic surgical prophylaxis pre-printed order for cardiovascular surgery at VGH.
ASPIRES is collaborating with Providence Health Care to develop a joint VCH-PHC regional surgical prophylaxis guidelines that will standardize antibiotic use based on best practices across the two health authorities.
III. EducationASPIRES engages in teaching health care providers the appropriate management of infectious diseases through educational sessions. So far, the ASPIRES education sessions have covered topics including appropriate treatments for gram positive and gram negative pathogens, correct collection of urinary samples and interpretation of cultures, bioequivalencies of IV and PO anti-infectives, and optimal anti-infective dosing.
ASPIRES is currently developing online educational modules to be made accessible through the Course Catalogue Registration System. The online educational modules will provide clinicians access to antimicrobial stewardship topics with continuing education credits.
IV. Antimicrobial Utilization EvaluationOverall anti-infective utilization, measured in defined daily dose (DDD) per 100 patient-days are calculated at facility (see table below) and ward level for the three acute care facilities. This information is used to identify priority areas for ASPIRES interventions, to track antimicrobial utilization trends, and to evaluate specific ASPIRES interventions by comparing utilization of targeted anti-infectives pre- and post-interventions.
Piperacillin-tazobactam, Cefazolin, and Ceftriaxone are the three most commonly utilized antibiotics at acute care units of VGH, RH and LGH

Promoting wellness. Ensuring care. 75
Table 1. Standardized antibiotic utilization (DDD/100 patient-days) for acute care units at LGH, RH,andVGH,fiscalyear2012/13
Indicators – Fiscal Year 2012/13 VGH RH LGH
Antibiotic DDD/100 Patient Days 55.2 53.4 60.7
02000400060008000
100001200014000160001800020000
n- Inj
Inj
Inj
Inj
Inj
Inj
n- Inj
Inj
Orl Inj
RL NJ
NJ
RL - NJ
DDD
Most Dispensed Antibiotics at Acute Care Units, VGH, RH, and LGH Fiscal Year 2012/13
pipe
raci
llin
tazo
bact
am
ceFA
Zolin
vanc
omyc
in
clox
acill
in
ceft
riAXO
NE
ceft
riAXO
NE
pipe
raci
llin
tazo
bact
am
vanc
omyc
in
cipr
oflo
xaci
n O
ceFA
Zolin
mox
iflox
acin
O
ceft
riAXO
NE
I
ceFA
Zolin
I
cipr
oflo
xaci
n O
pipe
raci
llin
tazo
bact
am I
VGH RH LGH
Whataretheplansfornextfiscalyear?
Prospective Audit and Feedback:
Formalized prospective audit and feedback will be expanded to General Surgery and the Leukemia/Bone Marrow Transplant units at VGH, the medicine unit (2S) at RH, and to acute nursing units at LGH in August of 2013. ASPIRES will continue to provide periodical summaries of their audit and feedback activities to each respective medical/surgical team.
Collaboration with Clinicians to Improve Antimicrobial Use:
In addition to providing continued support for the current initiatives in promoting best treatment practices for CDI, UTI and CAP, ASPIRES will work with the intensivists at VGH to optimize the diagnosis and management of ventilator-associated pneumonia (VAP). ASPIRES will also collaborate with the ED physicians at VGH to develop a pyelonephritis management guideline, and with the Leukemia/Bone Marrow Transplant team to update the outpatient febrile neutropenia pre-printed physician order. Further projects to update the empiric treatment pathways for sepsis with the ED physicians and intensivists are planned for 2013.
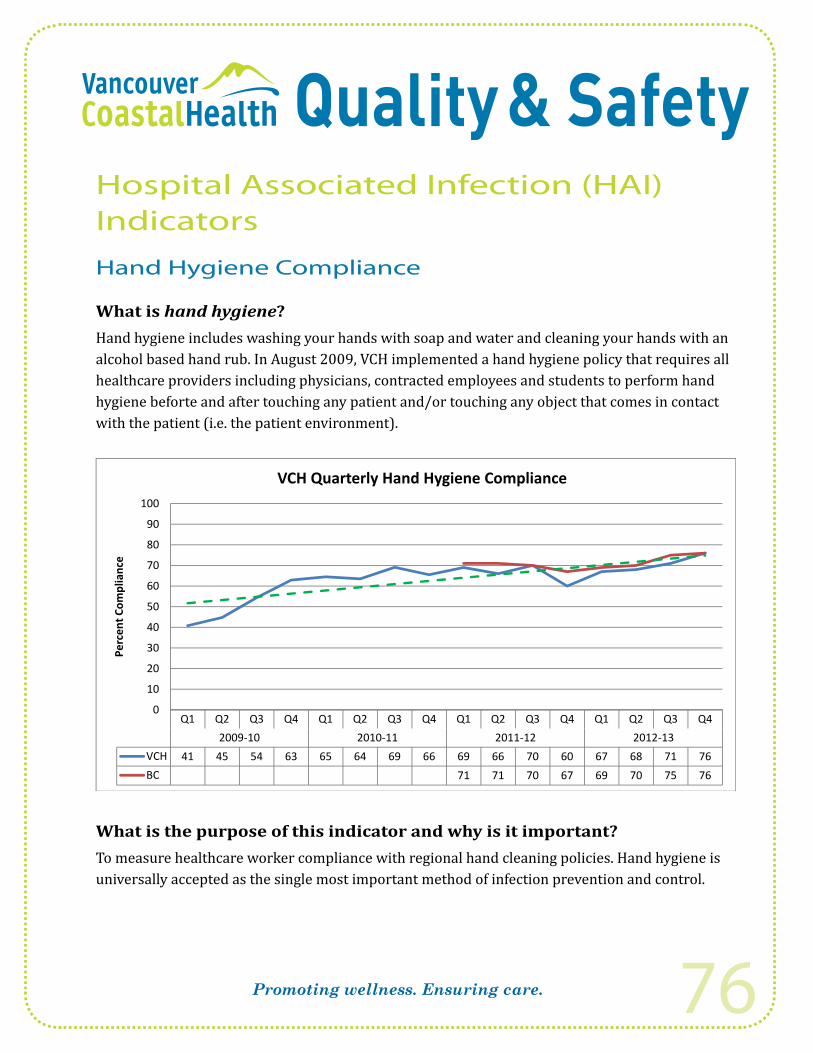
Promoting wellness. Ensuring care. 76
Hospital Associated Infection (HAI) Indicators
Hand Hygiene Compliance
What is hand hygiene?Hand hygiene includes washing your hands with soap and water and cleaning your hands with an alcohol based hand rub. In August 2009, VCH implemented a hand hygiene policy that requires all healthcare providers including physicians, contracted employees and students to perform hand hygiene beforte and after touching any patient and/or touching any object that comes in contact with the patient (i.e. the patient environment).
90
100
VCH Quarterly Hand Hygiene Compliance
60
70
80
90
plia
nce
30
40
50
Perc
ent C
omp
Q1 Q2 Q3 Q4 Q1 Q2 Q3 Q4 Q1 Q2 Q3 Q4 Q1 Q2 Q3 Q40
10
20
P
Q1 Q2 Q3 Q4 Q1 Q2 Q3 Q4 Q1 Q2 Q3 Q4 Q1 Q2 Q3 Q42009-10 2010-11 2011-12 2012-13
VCH 41 45 54 63 65 64 69 66 69 66 70 60 67 68 71 76BC 71 71 70 67 69 70 75 76
What is the purpose of this indicator and why is it important? To measure healthcare worker compliance with regional hand cleaning policies. Hand hygiene is universally accepted as the single most important method of infection prevention and control.

Promoting wellness. Ensuring care. 77
What is being measured?Hand hygiene compliance is measured using the Canadian Patient Safety Institute (CPSI) audit tool on the 4 Moments for Hand Hygiene. The audit tool measures the percent of observed correct hand cleaning among healthcare workers. Hand hygiene audits are conducted monthly in VCH hospitals. The percent compliance is calculated by taking the total number of hand cleaning observations divided by the total number of opportunities for hand cleaning, multiplied by 100. In 2012/13 a total of 30,225 hand hygiene opportunities were observed by auditors.
Methodology: How is the data collected?Hand hygiene compliance is measured using the Canadian Patient Safety Institute audit tool. Each hospital ward/unit is audited at least three times a month for 15 minutes and a minimum of 48 observations. The data is collected by observers trained in performing hand hygiene audits. Inter-rater reliability (which measures whether auditors agree in their assessment) is assessed periodically to ensure that auditing is performed consistently.
How did we do compared to our 2012/13 Target?Our 2012/13 target was 100% in non-emergency situations. Unfortunately, our annual percentage compliance this fiscal year (71%) has only slightly increased over last fiscal year (69%).
What is the 2013/14 Annual Target the organization seeks to reach?The annual target is 100% in non-emergency situations – a goal that will significantly reduce the transmission of infection.
Benchmark & Comparators: How does the rate compare to other areas?Provincial reporting on hand hygiene compliance started in 2011/12. Each Health Authority (HA) submits their hand hygiene data to the Provincial Infection Control Network (PICNet) on a quarterly basis for provincial reporting.
The provincial percentage overall compliance for 2012/13 was 73% which is slightly higher than for VCH (71%). In addition to looking at overall hand hygiene compliance, auditors differentiate hand cleaning opportunities on the basis of whether it occurred before or after patient contact. The percentage compliance before patient contact was 50% for VCH compared to 64% provincially whereas it was 80% after patient contact for VCH and provincially.
Due to variation in auditing and methodology between health authorities and between facilities (i.e. auditing may be performed by auditors who work in the same unit or small facility as the healthcare providers they are observing (self-auditing) or may be performed by external auditors such as infection control practitioners (ICPs) or members of the healthcare quality department

Promoting wellness. Ensuring care. 78
of the hospital), PICNet does not recommends making direct comparisons between health authorities and facilities.
Trend: What does the data show?The results show that over the last fiscal year our quarterly hand hygiene compliance rates have been trending upwards after two years of stability. The increase in compliance is seen in all occupational groups. Despite this our VCH compliance is slightly below the provincial percentage compliance largely due to a lower compliance before patient care. The graph below shows the quarterly rates for our acute care hospitals. Our rural sites (Squamish General Hospital, St. Mary’s Hospital and Powell River General Hospital) formally implemented hand hygiene compliance auditing in quarter 4 of 2012/13.
90
100
Hand Hygiene: Percent Compliance by Site(s)
50
60
70
80
Com
plia
nce
10
20
30
40
Perc
ent
Q1 Q2 Q3 Q4 Q1 Q2 Q3 Q4 Q1 Q2 Q3 Q4 Q1 Q2 Q3 Q42009-10 2010-11 2011-12 2012-13
VGH 46 50 56 64 66 64 69 67 73 74 73 71 70 71 75 78
0
10
RH 30 33 41 44 58 57 71 60 65 61 67 60 62 61 61 68LGH 30 43 51 62 68 70 67 67 66 63 64 61 59 62 63 73UBCH 60 69 72 69 76 69 73 68 68 70 76 82Rural 6565

Promoting wellness. Ensuring care. 79
100
Quarterly Hand Hygiene Compliance by Occupational Group
5060708090
ompl
ianc
e
1020304050
Perc
ent C
o
Q1 Q2 Q3 Q4 Q1 Q2 Q3 Q42011-12 2012-13
Nurses 72 73 74 70 69 71 72 77Physicians 49 54 52 57 57 54 66 67
0
Physicians 49 54 52 57 57 54 66 67Clinical Support 56 64 62 58 60 57 62 68Other 61 76 73 70 76 72 82 85
90
100
Quarterly Hand Hygiene Compliance: Before and After
60
70
80
plia
nce
30
40
50
Perc
ent C
omp
0
10
20
P
Q1 Q2 Q3 Q4 Q1 Q2 Q3 Q42011-12 2012-13
Before 60 52 53 49 47 48 48 58After 75 79 79 77 77 78 81 84
0
After 75 79 79 77 77 78 81 84

Promoting wellness. Ensuring care. 80
What actions have been taken over the last year?• A Blackberry™ application to facilitate HH auditing is being used by audit team.
• VCH is an active member of the Provincial Hand Hygiene Working Group.
• Hand hygiene education continues regionally at all new staff orientation sessions.
• Hand hygiene self-audits are ongoing at LTC facilities.
• Congratulations/Oops cards to be given out by audit team, hand hygiene champions, ICPs.
• Auditors are providing in the moment feedback to staff as much as possible, both positive and negative.
• Emily Carr project rolled out throughout the region including elevator wraps, updating “stop signs,” door messaging and new posters. 60 inch television installed in the lobby at VGH which “counts” clean hands as staff and visitors enter and exit the building.
• Updated screen savers showing that as hand hygiene rates go up, MRSA rates go down.
• Soap and hand sanitizer dispensers being replace with clear dispensers to make it easier for cleaning staff to see when dispenser is empty. Hand cream dispensers have been installed at all high use staff sinks.
• All staff must complete on-line hand hygiene education module every 2 years.
Whatactionswillbetakenoverthenextfiscalyear?1. Hand hygiene champions will be trained in the audit process to give “instant feedback” to
staff and use missed opportunities as a “teaching moment.”
2. Focus groups will be undertaken to:
• Learn about people’s barriers to washing their hands including environmental and behavioral;
• Find out what they think of the current hand hygiene messaging; and
• Find out the best locations for hand hygiene signage.
3. “Caught Clean Handed” campaign will be launched October 31, 2013 to highlight staff who perform excellent hand hygiene. The campaign has 3 components:
• Screensavers will be updated every 2 months.
• Bi-weekly features in VCH news featuring a staff member including their picture and a short statement on why hand hygiene is important to them.
• To highlight staff at the unit level, large posters will be on each unit in a highly visible spot. Hand hygiene auditors and unit level auditors have hand-shaped post-it notes. When they observe a staff member performing excellent hand hygiene they will write their name on the post-it note and stick it to the poster.

Promoting wellness. Ensuring care. 81

Promoting wellness. Ensuring care. 82
Clostridium difficile Infections (CDI) Incidence Rate
What is Clostridium difficile infection?Clostridium difficile is a bacterium that can cause infections of the gastrointestinal system. Clostridium difficile infection (CDI) happens when antibiotics kill the good bacteria in the gut and allow Clostridium difficile to grow and produce toxins that can damage the bowel. CDI can cause infections ranging from diarrhea (common) to rare but serious complications that require prolonged treatment with antibiotics and sometimes surgery. In extreme cases CDI can result in death. The elderly and immunocompromised are particularly at risk for these complications.
What is the purpose of this indicator and why is it important?This indicator measures the incidence of CDI infection among hospitalized patients. Measuring the incidence of CDI and the locations in facilities where it occurs, allows infection prevention and control (IPAC) to more effectively identify potential sources of the organism and target interventions.
What is being measured?This indicator measures the rate of new episodes of CDI identified in patients admitted to hospital and considered to be due to a stay within a VCH hospital.
The CDI rate is calculated by taking the total number of new cases of CDI acquired by patients as a result of their stay in a VCH hospital, divided by the number of inpatient days and multiplied by 10,000.
Methodology: How is the data collected?Data are collected by Infection Control Practitioners using provincial and national standardized definitions and surveillance protocols. (The provincial case definition is provided in Appendix 1.)
Importantly, VCH uses a molecular method (called PCR) to detect cases of CDI; this has increased our ability to detect C.difficile by approximately 35%.
How did we do compared to our 2012/13 Annual Target?Our annual target for 2013/13 was to decrease our nosocomial CDI incidence rate by 15% for an annual regional rate of 7.3 cases per 10,000 inpatient days. Our annual regional rate for 2012/13 was 8.1 (95% CI = 7.3 – 9.0) which is above our target.
What is the 2013/14 Annual Target the organization seeks to reach?Our goal for 2013/14 is to reduce our 2012/13 rate by 10% for an annual regional target of 6.5 per 10,000 inpatient days.

Promoting wellness. Ensuring care. 83
Benchmark & Comparators: How does the rate compare to other areas?The graph below shows the quarterly nosocomial rates for VCH and BC. Provincial surveillance for CDI began in British Columbia in 2008 though provincial rates for nosocomial infections are available only as of the 2009/10 fiscal year. The provincial CDI reports are available publicly on the following website: http://www.picnetbc.ca/.
12.0
Quarterly CDI Rates by Fiscal Year: VCH and BCPCR testing implemented
8.0
10.0
patie
nt d
ays
4.0
6.0
ate
per 1
0,00
0 p
Q1 Q2 Q3 Q4 Q1 Q2 Q3 Q4 Q1 Q2 Q3 Q4 Q1 Q2 Q3 Q4 Q1 Q2 Q3 Q4 Q1 Q2 Q3 Q40.0
2.0
Ra
2007-08 2008-09 2009-10 2010-11 2011-12 2012-13Before PCR 9.4 7.8 6.5 8.9 8.1PCR 10.3 8.4 10.1 11.2 9.9 6.7 10.7 11.3 8.7 8.0 7.9 6.9 9.3 8.8 9.3 8.3 10.6 6.9 7.1BC 10.0 8.1 7.5 8.6 9.0 7.3 7.7 8.3 7.1 7.7 7.9 9.2 7.6 6.2 5.8 6.5
The dotted trendline shows that the rates for VCH continue to decline despite variation by fiscal quarter. The rates for VCH are higher than the provincial rates though this may be partly accounted for by the more sensitive molecular laboratory testing methods (i.e., PCR) used in VCH. This more sensitive laboratory testing has increased case detection by approximately 35%. This increase in case detection is consistent with what is reported in the research literature.
National surveillance data are available through the Canadian Nosocomial Infection Surveillance Program (CNISP) for 2011. The national incidence rate for nosocomial infections for adult and mixed sites (excludes pediatric stand-alone sites) was 6.32 per 10,000 patient days.
Trend: What does the data show?Over the 2012/13 fiscal year there was a total of 695 cases of CDI (including relapses) identified among admitted patients within VCH acute care facilities. Of these, 427 (61.4%) were acquired within a VCH acute care facility, 97 (14.0%) were healthcare associated from another health care facility, and 170 (24.5%) were acquired in the community.

Promoting wellness. Ensuring care. 84
The proportion of cases acquired in the community increased in 2010/11 and has remained at approximately 26% since then (i.e., 2012/13 (24.5%; 95% CI = 21.4 – 27.8); 2011/12 (26.2%; 95% CI = 23.1 – 29.5) and 2010/11 (25.3%; 95% CI = 22.3 – 28.6)) and has increased statistically significantly compared to 15.9 (95% CI = 13.0 – 19.4) in 2008/09 and 15.7% (95% CI = 12.8 – 19.0) in 2009/10. This increase is likely the result of a change in our surveillance definitions. In 2010/11 the provincial and national surveillance definitions for a healthcare associated case changed the time period for previous hospitalization from eight weeks to four weeks. Cases that had a hospitalization four to eight weeks prior to symptom onset previously categorized as healthcare associated are now categorized as community acquired.
The data show that the annual regional rate of nosocomial CDI within VCH acute care hospitals has decreased for the third consecutive year from a peak of 9.7 (95% CI = 8.8 – 10.7) in 2009/10 to 8.1 (95% CI = 7.3 – 9.0) in 2012/13. The reduction is not statistically significant.
21 1
25.0
VCH Complications, Relapse and All Cause Mortality by Fiscal Year
16.815.9 16.6
17.616.2
21.1
20.0
ses
12.713.412.5 12.4
9.9 10.410.0
15.0
erce
nt H
CA C
a
4.83.0
2.0 1.90 6
5.0
P
0.60.0
2007-08 2008-09 2009-10 2010-11 2011-12 2012-13
Complications Relapse Mortality
Complications: CDI patients are monitored for 30 days or up until discharge/transfer following diagnosis for complications (i.e., toxic megacolon, total or partial colectomy, bowel perforation, gastrointestinal bleed and secondary bacteremia).
The IPAC team is particularly pleased that the percentage of healthcare associated cases experiencing CDI-related complications has declined from a high of 16.8% (95% CI = 13.4 – 20.8) in 2007/08 to 0.6% (95% CI = 0.2 – 1.7) in 2012/13. This decrease is highly statistically significant. PCR technology has allowed cases to be detected sooner and more accurately. In

Promoting wellness. Ensuring care. 85
addition, clinical treatment pathways and a partnership between Medical Microbiology and Pharmacy have ensured that patients receive the appropriate treatment in a more timely fashion - usually less than one day after the diagnosis is made.
Relapses: As with complications, CDI patients are monitored for 30 days or up until discharge/transfer following diagnosis for relapses. Relapses are defined as a recurrence of CDI-associated diarrhea within two to eight weeks from the date of CDI diagnosis. CDI-associated diarrhea less than two weeks from the previous episode is considered to be a continuation of the case and not a relapse. Some patients may experience multiple relapses.
The percentage of relapses among healthcare associated cases has increased in 2012/13 to 16.0% (95% CI = 13.1 – 19.4) from 12.7% (95% CI = 10.1 – 15.7) in 2011/12. The difference is not statistically significant.
All Cause Mortality: Within VCH, 10.3% (95% CI = 8.0 – 13.2) of healthcare associated CDI cases died of any cause compared to 9.9% (95% CI = 7.6 – 12.7) in 2011/12. The difference is not statistically significant.
What actions have been taken over the last year?A comprehensive infection prevention and control program (known as Four Cornerstones) with four key cornerstones: hand hygiene, standard protocols and guidelines for preventing and treating infections, antimicrobial stewardship and environmental and equipment cleaning as well as recommendation for purchase and building design was launched July 16, 2012.
The objectives of the Four Cornerstones program are to:
1. Implement an environmental program to improve equipment and surface cleanliness;
2. Establish a VCH Antimicrobial Stewardship Program to ensure appropriate, evidence-based antibiotic use;
3. Improve patient outcome by preventing healthcare associated infection and the emergence of antimicrobial resistance;
4. Implement a risk managed approach for the isolation of VRE patients.
The program has been implemented in a staged approach. Since the start of the program, CDI rates have declined at VGH with decreases in quarter four for RH. Follow up is ongoing to ensure that these decreases are sustained.
Clinical Pharmacists at VGH, RH and LGH assess treatment appropriateness for each evaluable inpatient with CDI and recommend changes to optimize treatment based on the VCH CDI Management Policy. Follow-up with physicians occur to encourage adherence to support this Policy. The target for Pharmacy assessment is 100%.

Promoting wellness. Ensuring care. 86
Methicillin-resistant Staphylococcus aureus (MRSA) Incidence Rate
What is MRSA?Methicillin-resistant Staphylococcus aureus (MRSA) is a strain of Staphylococcus aureus (S. aureus) bacterium that is resistant to a number of antibiotics. S. aureus normally lives on human skin and in the noses of about 25% of the general population (a process called colonization). However, S. aureus can cause skin infections such as boils and abscesses and more serious diseases such as bloodstream and respiratory infections.
Infections that occur in people who have been in hospital or who have had other healthcare encounters (e.g. dialysis treatment, residents of long term care facilities) are referred to as healthcare-associated MRSA (HA-MRSA). Risk factors for HA-MRSA infections include invasive procedures such as surgery, insertion of indwelling catheters or intravenous tubing. When the organism is acquired during a hospital stay it is called “nosocomial” MRSA to distinguish it from other healthcare encounters.
Another type of MRSA infection is associated with acquiring the organism in the community (CA-MRSA). Factors that have been associated with the spread of CA-MRSA include close skin-to-skin contact, openings in the skins such as abrasions, sharing of contaminated items, crowded living conditions and poor personal hygiene.
VCH Nosocomial Rates of MRSA by Fiscal Year
10.1 9.79.1
8.47.9 7.6
8 0
10.0
12.0
ent d
ays
6.3
4.75.3
4.5 4.94.3
3.52.9 2.94.0
6.0
8.0
per 1
0,00
0 pa
tie
1.7
0.0
2.0
2005 06 2006 07 2007 08 2008 09 2009 10 2010 11 2011 12 2012 13
Rate
p
2005-06 2006-07 2007-08 2008-09 2009-10 2010-11 2011-12 2012-13
All Infections

Promoting wellness. Ensuring care. 87
12.0
s
MRSA Annual Nosocomial Rates by Fiscal Year
8.0
10.0
0 pa
tient
day
s
2.0
4.0
6.0
te p
er 1
0,00
0
2007-08 2008-09 2009-10 2010-11 2011-12 2012-13VGH 11.3 10.4 8.7 7.5 5.3 8.9
0.0
2.0
Rat
RH 5.0 10.5 7.3 3.5 6.4 5.1LGH 8.4 4.7 8.3 5.9 4.6 6.6Coastal Rural 3.5 3.4 3.7 6.2 3.9 7.9
Note: Coastal Rural includes Squamish General, St. Mary’s, Powell River General, Bella Coola General and RW Large Memorial hospitals.
What is the purpose of this indicator and why is it important?This indicator measures the incidence (new cases) of MRSA among hospitalized patients. Measuring the incidence of MRSA and the locations in facilities where it occurs allows infection prevention and control (IPAC) to more effectively identify potential sources of the organism and target interventions.
What is being measured?This indicator measures the rate of newly identified cases of MRSA among patients admitted to hospital and considered to be due to a stay within a VCH hospital.
The MRSA rate is calculated by taking the total number of newly identified MRSA cases acquired by patients as a result of their stay in a VCH hospital, divided by the number of inpatient days and multiplied by 10,000.
Methodology: How was the data collected?The data are collected by Infection Control Practitioners using provincial and national standardized definitions and surveillance protocols. Provincial surveillance for MRSA began in 2011/12. (The provincial case definitions are provided in Appendix 1.)

Promoting wellness. Ensuring care. 88
How did we do compared to our 2012/13 Annual Target?Our annual target for 2012/13 was to decrease our nosocomial MRSA incidence rate by 10% for an annual regional rate of 4.2 cases per 10,000 inpatient days. We achieved a rate of 7.2 (95% CI = 6.8 – 8.4) which is significantly higher than our rate last year (4.7; 95% CI = 4.0 – 5.0) and our 2012/13 performance target.
What is the 2013/14 Annual Target the organization seeks to reach?Our goal for 2013/14 is to reduce our 2012/13 rate by 10% for an annual regional target of 6.5 per 10,000 inpatient days.
Benchmark & Comparators: How does the rate compare to other areas?The 2010 national CNISP nosocomial rates for MRSA are 5.92 per 10,000 patient days for colonizations and infections and 1.71 per 10,000 patient days for MRSA infections only. The corresponding VCH rates are both below the national averages with rates of 4.7 and 1.71 per 10,000 patient days, respectively.
The graph below shows the quarterly nosocomial rates for VCH and BC. Provincial surveillance for MRSA began in British Columbia in 2011/12 with Health Authorities submitting historical data for 2010/11. The provincial MRSA reports are available publicly on the following website: http://www.picnetbc.ca/.
12.0
Quarterly MRSA Rates by Fiscal Year: VCH and BC
8.0
10.0
atie
nt d
ays
4.0
6.0
e pe
r 10,
000
pa
Q1 Q2 Q3 Q4 Q1 Q2 Q3 Q4 Q1 Q2 Q3 Q4 Q1 Q2 Q3 Q4 Q1 Q2 Q3 Q4 Q1 Q2 Q3 Q40.0
2.0Rate
2007-08 2008-09 2009-10 2010-11 2011-12 2012-13VCH 10.0 8.8 7.7 9.4 9.8 8.5 8.8 6.9 5.5 9.2 8.4 8.3 6.4 6.8 7.3 5.0 3.9 3.6 5.0 5.6 6.1 7.5 9.5 7.3BC 4.6 4.7 4.3 4.1 4.5 3.4 4.4 4.3 5.0 4.9 5.1 5.2

Promoting wellness. Ensuring care. 89
The dotted trendline shows that the MRSA rates at VCH are trending downwards, though they increased from Q3 in 2011/12 and through much of 2012/13. We did experience a decline in Q4 after five consecutive quarterly increases. The VCH rates throughout 2012/13 were higher than the provincial rates.
250
Nosocomial MRSA Infections by Body Site and Fiscal Year
100
150
200
nfec
tions
2005/06 2006/07 2007/08 2008/09 2009/10 2010/11 2011/12 2012/130
50
100
Num
ber o
f I
other 24 23 3 7 3 5 4 7blood 21 19 9 13 10 11 8 12urine 23 32 50 40 35 27 12 24
i l dsurgical wound 32 26 41 33 44 31 21 28sputum/respiratory 40 52 52 45 31 36 16 41skin/soft tissue/burn 80 52 45 41 30 20 15 27
We have been investigating many different possible causes for why there has been an increase in the VCH MRSA rates. The increase has been observed in most facilities and has been noted in other health authorities. The possible causes and outcomes of these investigations is noted below:
1. Increased sensitivity of MRSA detection: There has been no change in the laboratory diagnosis of MRSA.
2. Increased delay in collecting screening cultures: An analysis comparing 2012/13 data to historical data showed no significant difference in the timing of collection of screening cultures.
3. Introduction of new Antibiotic Resistant Organism Screening form: A new screening form and process was introduced in February 2013 and although this may contribute to an increased detection of cases from February onwards, the increase in MRSA pre-dated the introduction of the form. Further MRSA rates decreased in quarter 4 suggesting that the new form is not responsible for any increases.
4. Increased community prevalence: Community prevalence continues to be low as demonstrated by the recent 16 month surgical site decolonization project where more than

Promoting wellness. Ensuring care. 90
6,000 patients were screened for MRSA. The prevalence was less than 1% and most of these patients had prior hospital encounters.
5. Increased MRSA prevalence within the hospital: An analysis using data from RH and VGH found no relationship between MRSA burden in the hospital (as measured by MRSA flagged census days by fiscal period) and MRSA incidence rates.
6. Alternate Level of Care: There has been some suggestion that there are increasing rates of ALC bed days which may put pressure on hospital wards for cohorting and appropriately isolating patients. Unfortunately, it appears that ALC bed days data is not consistently defined regionally limiting the usefulness of the data. Standard definitions for ALC were implemented in October 2013.
7. MRSA infections and body sites: The distribution of body sites infected does not appear to suggest a particular area of focus. There has been an increase in infections but the distribution is similar to 2009/10 and 2010/11.
Trend: What does the data show?Over the 2012/13 fiscal year there was a total of 720 cases of MRSA identified among admitted patients within VCH acute care facilities. Of these 565 (78.5%) were healthcare associated, 129 (17.9%) were acquired in the community, and 26 (3.6%) were of unknown origin. Of the 565 healthcare associated cases, 351 (62.1%) were acquired within a VCH acute care facility, 189 (33.5%) were healthcare associated from another health care facility, and 25 (4.4%) were associated with another healthcare exposure (e.g. outpatient treatment).
The regional annual nosocomial rate has increased significantly from last fiscal year (4.7 per 10,000 patient days; 95% CI = 4.0 – 5.3) to 7.6 (95% CI = 6.8 – 8.4). Similarly, the annual nosocomial infection rate has also increased significantly from 1.7 per 10,000 patient days (95% CI = 1.3 – 2.1) to 2.9 (95% CI = 2.4 – 3.4).
What actions have been taken over the last year?The iCOUGH program has been implemented in key clinical areas to address the transmission of MRSA in respiratory secretions. A review of wound care management has been conducted as well. The environmental cleaning program (as discussed under C. difficile) should address the environment or equipment as a source of transmission. The CAUTI program to prevent urinary tract infections should also address transmission of MRSA.

Promoting wellness. Ensuring care. 91
Bloodstream Infection (BSI) Incidence Rate
What is a bloodstream infection?Bloodstream infections (BSI) occur when bacteria enter the bloodstream. Bacteria may enter the bloodstream through a wound, surgery, or other invasive procedures, or as a consequence of a pre-existing disease. Bloodstream infections can range from having transient infections that resolve on their own to infections that are life-threatening.
Nosocomial Bloodstream Infection Rates by Fiscal Year
16.0
18.0
s
Nosocomial Bloodstream Infection Rates by Fiscal Year
10.0
12.0
14.0
0 pa
tient
day
s
4 0
6.0
8.0
te p
er 1
0,00
0
2005-06 2006-07 2007-08 2008-09 2009-10 2010-11 2011-12 2012-130.0
2.0
4.0Rat
2005 06 2006 07 2007 08 2008 09 2009 10 2010 11 2011 12 2012 13VGH 13.3 13.9 15.4 11.8 10.6 8.0 8.4 9.1LGH 6.0 3.4 4.0 3.0 2.2 2.1RH 1.6 1.8 1.9 2.4VCH 12.7 9.4 7.3 5.8 5.9 6.3
Note: RH started bacteremia surveillance in January 2010. The 2009/10 rate for RH is therefore based on three months of data (January – March, 2010).
What is the purpose of this indicator and why is it important?This indicator measures the incidence of hospital acquired bloodstream infections among hospitalized patients. Measuring the incidence of BSI, the source of the infection as well as the locations in facilities where it occurs allows infection prevention and control (IPAC) to more effectively identify potential sources of the responsible organisms and target interventions accordingly.

Promoting wellness. Ensuring care. 92
120
Distribution of Nosocomial Bacteremia by Primary Site and Fiscal Year
80
100
r of B
SIs
40
60
Tota
l Num
ber
Urine CVC Respiratory Soft Tissue Surgical Site Gastrointestinal Vascular No primary
source Other source0
20
2010/11 81 29 33 28 25 73 3 30 222011/12 85 31 44 31 32 104 3 31 142012/13 67 59 47 28 40 96 6 36 14
What is being measured?This indicator measures the rate of bloodstream infections (BSI) among patients admitted to hospital and considered to be due to a stay within a VCH hospital. BSI surveillance is conducted at Vancouver General (VGH), Richmond (RH) and Lions Gate (LGH) hospitals. Richmond Hospital began performing BSI surveillance in January 2010.
The annual rate of BSI per 10,000 patient days, which is the number of episodes of BSI (excluding gastrointestinal sources*) acquired by patients as a result of their stay in hospital, divided by the number of inpatient days multiplied by 10,000.
Methodology: How was the data collected?The data are collected by Infection Control Practitioners using standardized definitions and surveillance protocols. VCH case definitions are provided in Appendix 1.
How did we do compared to our 2012/13 Annual Target?Our annual target for 2012/13 was to decrease our nosocomial BSI incidence rate by 10% for an annual regional rate of 5.3 cases per 10,000 inpatient days. We achieved a rate of 6.3 (95% CI = 5.6 – 7.1) which is above our target and higher than our rate last fiscal year at 5.9 (95% CI = 5.2 – 6.6).
* Gastrointestinal sources of BSI are excluded from this indicator as they often due to pre-existing disease (e.g. inflammatory bowel disease) and are not a result of the patient’s stay.

Promoting wellness. Ensuring care. 93
What is the Annual Target the organization seeks to reach? Our goal for 2013/14 is to reduce our 2012/13 rate by 10% for an annual regional target of 5.7 per 10,000 inpatient days.
Benchmark & Comparators: How does the rate compare to other areas?There are no national benchmark data for the type of comprehensive blood stream surveillance that we perform. However, VCH participates in national (CNISP) surveillance for central line associated blood stream infections (CLABSI) among hospitalized patients in an intensive care unit (ICU).
There was a total of 8 CLABSI in ICU cases this fiscal year (7 at VGH and 1 at RH). The graph below shows the annual rates for CLABSI in ICU for VGH, LGH, RH, VCH (aggregate of three facilities) along with the CNISP national rates. Our rates have been consistently below the national rates.
3
ays
Annual Rates of CLABSI in ICU
1.5
2
2.5
0 CV
C Li
ne D
a
0.5
1
Rate
per
100
0
2007-08 2008-09 2009-10 2010-11 2011-12 2012-13VGH 2.55 1.46 0.61 0.76 0.71 0.92LGH 1.25 0.94 0.38 0.00
0
R
LGH 1.25 0.94 0.38 0.00RH 0.00 0.00 0.50VCH 0.76 0.67 0.55 0.69CNISP 1.54 1.13 0.94
Note: Lions Gate and Richmond hospitals began comprehensive bacteremia surveillance in 2009/10 and 2010/11, respectively. National rates are based on the calendar year with 2011 results being still preliminary.
Trend: What does the data show?The focus of the bacteremia surveillance is on bacteremias acquired as a result of a healthcare encounter or hospital/healthcare facility stay. Cases acquired in the community are not included in our surveillance. For 2012/13 there were 710 healthcare-related cases of bacteremia identified in VCH of which 300 (42%) were nosocomial (excluding those from gastrointestinal sources). Bacteremias

Promoting wellness. Ensuring care. 94
associated with gastrointestinal sources are excluded because they are often due to pre-existing disease such as inflammatory bowel disease and not the result of the patient’s stay in hospital.
The regional annual rate of nosocomial BSI is higher in 2012/13 (6.3; 95% CI = 5.6 – 7.1) compared to last fiscal year (5.9; 95% CI = 5.2 – 6.6) though the difference is not statistically significant. When compared to last fiscal year, we see that the rates for VGH and RH have increased whereas LGH has remained stable.
Last year we focused on reducing the causes of urinary tract infections that lead to bacteremia. We have been successful in reducing our urosepsis rates. Please refer to the section of our report on catheter-associated UTIs (CAUTI) for the details.
What actions have been taken over the last year?Bacteremias are followed closely and trends monitored on the clinical units with immediate feedback to the staff as appropriate. A CLABSI program in ICU has been very effective. The focus for the next year will continue to be on causes of urinary tract infections leading to bacteremia.
Infection Control Team
Promoting wellness. Ensuring care. 95
Patients identified as having Mycobacterium tuberculosis
What is Mycobacterium tuberculosis?Tuberculosis is a disease caused by the bacterium called Mycobacterium tuberculosis (MTB). The bacterium usually attacks the lungs. Tuberculosis is spread through the air from person to person.
What is the purpose of this indicator and why is it important?This indicator measures the number M. tuberculosis cases that required patient screening for potential exposure. Cases of tuberculosis that are not promptly identified can have a significant impact on the hospital resulting in the screening of many other patients. Hospitals need to ensure that they have mechanisms to promptly detect potential TB patients to avoid exposure to other patients and hospital staff.
What is being measured?This indicator measures the number of cases of tuberculosis identified in hospital that required patient screening for exposure.
Methodology: How was the data collected?The data are collected by Infection Control Practitioners.

Promoting wellness. Ensuring care. 96
35
M.Tuberculosis in Acute Care: TB Cases Requiring Screening for Patient Exposure by Fiscal Year
25
30ee
ning
Change in Screening Policy
15
20
Req
uirin
g Sc
re
5
10Num
ber
2005-06 2006-07 2007-08 2008-09 2009-10 2010-11 2011-12 2012-13# Cases Requiring Patient Screening 7 4 5 8 4 7 13 29
0
5
Trend: What does the data show?The data show that the number of cases of tuberculosis that required the screening of other patients for exposure has doubled each year for the last three fiscal years. We believe that the increase is related to a change in screening policy. In August of 2011/12 we started to screen patients exposed to TB cases that are smear negative but turn out to be culture positive. In the past fiscal year a total of 42 TB cases were identified within the hospital setting of which 29 required the screening of other patients.
It is important to note however, that some cases of tuberculosis are identified in patients who have no apparent symptoms and therefore would not have met the criteria for enhanced precautions with the respiratory algorithm.
What actions have been taken over the last year?Infection Prevention and Control continues to reinforce the use of the respiratory algorithm to detect potential cases of communicable respiratory infections (e.g. TB, influenza) among patients visiting the Emergency Department. All patients admitted to hospital who fit the criteria for a possible communicable airborne infection are placed on Airborne Isolation Precautions and their electronic record “flagged” for surveillance and consistent door-to-door management for the protection of staff, visitors and other patients.

Promoting wellness. Ensuring care. 97
Laboratory Confirmed Influenza
WhatisInfluenza?Influenza (commonly referred to as the flu) is an infectious respiratory illness caused by influenza viruses. Influenza is transmitted through the air by coughs or sneezes which create aerosols containing the virus. Influenza can also be transmitted by direct contact with nasal secretions or contact with contaminated surfaces. Though frequently confused with the common cold, influenza is more severe and remains a significant cause of morbidity, mortality and hospital costs during influenza season.
14
Laboratory-Confirmed Influenza Among Hospitalized Patients: 2012-2013
8
10
12
f Cas
es
4
6
Num
ber o
f
0
2
Community Nosocomial Other LTC
What is being measured?This indicator measures the impact of influenza among hospitalized adults (i.e. 16 years old or greater) on VCH acute care facilities.
Methodology: How was the data collected?VCH participates in national surveillance for laboratory-confirmed influenza which ran from November 1 2012 to May 31 2013. The national (Canadian Nosocomial Infection Surveillance Program) case definitions are provided in Appendix 1.

Promoting wellness. Ensuring care. 98
Trend: What does the data show?There were a total of 82 cases of influenza among hospitalized adults this last fiscal year. The vast majority of these cases were community-acquired (N = 75; 91.4%). There were four cases (4.9%) that were acquired in long term care and three cases (3.7%) nosocomially within the hospital. A total of 13 cases (15.9%) required admission to the intensive care unit and nine (11.0%) required mechanical ventilation. A total of seven patients died (8.5%).
What actions have been taken over the last year?The Patient Vaccination Program at VGH and GF Strong: The patient vaccination program is a joint program of Medical CTU’s and Infection Control/Patient Safety, under the medical direction of Dr. Patrick Doyle. It provides Influenza and Pneumoccoccal vaccinations to patients. It is a model program that achieves compliance with hospital accreditation requirements, and with the Public Health Agency of Canada’s recommendation to vaccinate people at high risk who are being discharged from hospital. The program has two components: a) wards that vaccinate their own patients, often in a blitz at the start of influenza season in November (Hemodialysis, STAT centre, GF Strong); and b) wards where the dedicated vaccine nurse provides service on an ongoing basis between November 1st and April 30th for patients prior to discharge.
Healthcare Worker Flu Policy: On December 1 2012 a new provincial healthcare worker influenza control policy took effect. This policy covers all healthcare workers in publicly funded healthcare facilities including long term care facilities. The policy requires that healthcare workers get vaccinated against influenza or wear a surgical mask when in areas where patient contact may be expected. The policy is aimed at protecting patients and residents of long term care as well as reducing illness among healthcare workers.

Promoting wellness. Ensuring care. 99
Outbreak ManagementThis section summarizes the gastrointestinal and respiratory outbreaks that occurred during the 2012/13 fiscal year. Any comparison of results from year to year must consider the community prevalence of both gastrointestinal and respiratory communicable viruses. Norovirus activity increased appreciably this year particularly at VGH. Norovirus in the community was particularly higher this year because of the appearance of a new strain to which there was limited immunity.
In total there were 17 outbreaks in acute care (17 gastrointestinal and 0 respiratory) and 14 outbreaks in our directly funded long term care facilities (11 gastrointestinal and 3 respiratory). This compares to 14 in acute care (13 gastrointestinal and 1 respiratory) and 11 in long term care (8 gastrointestinal and 3 respiratory) in 2011/12.
The graph below shows the duration and number of staff and patients affected by outbreaks in VCH’s acute care facilities over the last eight fiscal years. The results show an increase in the number of patients in the last two years. The number of staff affected in 2012/13 is the highest it has been in the last eight years again reflecting lower immunity to the new norovirus strain and more acute facility outbreaks. The total days closure for 2012/13 was 155 compared to 95 last fiscal year. The total days closure has increased for the last two years.
180200
Outbreaks in Acute Care: VCH Summary by Fiscal Year
180
120
140
160
140
160
180
ure
ecte
d
101
73
93 91
110
73
9160
80
100
60
80
100
120
Tota
l Day
s Clo
su
tal N
umbe
r Affe
73
48
1831
48 52
73
23
41 41
0
20
40
0
20
40
60 T
Tot
002005-06 2006-07 2007-08 2008-09 2009-10 2010-11 2011-12 2012-13
Patients Affected Staff Affected Days Closure
There were 31 outbreaks this fiscal year involving both acute and long term care facilities; 28 were gastrointestinal and 3 were respiratory. A comparison of the viral gastrointestinal outbreaks for the last five fiscal years is provided in the table below. It should be noted that despite the novel

Promoting wellness. Ensuring care. 100
strain there was no significant difference in the number of patients/residents affected, days a unit was closed or number of staff affected.
Comparison of Viral Gastrointestinal Outbreaks
Indicator 2008/09 2009/10 2010/11 2011/12 2012/13
Number of outbreaks 23 12 13 21 28
Number outbreaks in long term care
12 4 8 8 11
Number outbreaks in acute care 11 8 5 13 17
Average total days closed 9.4 17.7 10.1 10.0 11.0
Average long term care days closed
10.5 41.3 12.3 13.3 13.8
Average acute care days closed 8.3 7.1 10.8 7.8 9.1
Average number of patients/residents affected
11.8 8.8 7.7 12.4 9.5
Average number long term care residents affected
16.6 14.5 24.8 25.0 14.2
Average number acute care patients affected
7.0 6.0 3.6 8.6 6.5
Average number staff affected 9.9 3.9 7.2 4.8 5.9
Average number long term care staff affected
14.2 6.0 8.4 8.4 6.6
Average number acute care staff affected
5.5 2.9 8.2 4.1 5.4

Promoting wellness. Ensuring care. 101
Publications/PostersNew Grants
1. WorkSafe BC The Impact of a mandated provincial hand hygiene program on healthcare worker complicance, health and perception of safety climate…. $156,442
2. Vancouver Coastal Health Innovation Award. Promiting a healthier environment for patients: evaluating the use of ultraviolet light room disinfection and ATP bioluminescence to assess equipment cleaning. $65,484.
Awards
1. Excellence in BC Health Care Awards. Award of Merit for Collaborative Solutions June 25, 20122. Association of Medical Microbiology and Infectious Diseases. John Conley Innovation Academy Award
April 20123. Vancouver Champions for Change Award. December 20124. British Columbia Patient Safety and Quality – Getting Better Award. Feb 28, 20135. College of Dental Surgeons of British Columbia. Special Group Award Infection Prevention and Control
March 7, 2013
Articles
1. Mitchell R, Ogunremi T, Astrakianakis G, Bryce E, Gervais R, Gravel D, Johnston L, Leduc S, Roth V, Taylor G, Vearncombe M, Weir C; Canadian Nosocomial Infection Surveillance Program. Impact of the 2009 influenza A (H1N1) pandemic on Canadian healthcare workers: A survey on vaccination, illness, absenteeism, and personal protective equipment. Am J Infect Control. 2012;40:611-616.
2. Mataseje LF, Bryce E, Roscoe D, Boyd DA, Embree J, Gravel D, Katz K, Kibsey P, Kuhn M, Mounchili A, Simor A, Taylor G, Thomas E, Turgeon N, Mulvey MR. Carbapenem-resistant Gram-negative bacilli in Canada 2009/10: results from the Canadian Nosocomial Infection Surveillance program (CNISP). J Antimicrob Chemother. 2012 Jun;67(6):1359-67. Epub 2012 Mar
3. Grant J, Jastrzebski J, Johnston J, Stefanovic A, Jastrabesky J, Elwood K, Roscoe D, Balshaw R, Bryce E. Interferon-gamma release assays are a better tuberculosis screening test for hemodialysis patients: a study and review of the literature. Can J Infect Dis Med Microbiol 2012;23:114-116
4. Bryce E and Forrester L. How long is long enough? Determining the optimal surgical site infection surveillance period. Infect Control Hosp Epid 2012;13”1178-79
5. Raschka S, Bryce E, Dempster L. Health economic evaluation of an infection prevention and control program: are quality and patient safety programs worth the investment? Am J Infect Control (in press)
6. Mitchell R, Roth V, Gravel D, Astrakianakis G, Bryce E et al Are health care workers protected? An observational study of selection and removal of personal protective equipment in Canadian acute care hospitals. Am J Infect Control 2013;41:240-4

Promoting wellness. Ensuring care. 102
7. Bryce EA, Henry B Hand hygiene: two hundred years after Semmelweis we still have work to do. BCMJ 2013;55:332-333.
8. Fillatrault L, McKay RM, Patrick DM, Roscoe DL, Quan G, et al. Antibiotic resistance in isolates recovered from women with community-acquired urinary tract infections presenting to a tertiary care emergency department. CJEM 2012;14:295-305.
Abstracts
1. Wong T, Roscoe D, Street C, Jeske D, Masri B, Weatherill S, Forrester L, Bryce E. Nasal Decolonization of Staphylococcus aureus with Antimicrobial Photodynamic Therapy. AMMI Canada Annual Conference. Vancouver, BC May 3 – 5, 2012
2. Crump M, Bryce E, Ko, S Busto G. Unleashing the positive deviants at the frontline: more than just sparking change. APIC annual conference, San Antonio, TX June 4-6, 2012
3. Masri, B. Bryce E, Wong T. Nasal decolonization of Staphylococcus aureus with antimicrobial photodynamic therapy. American Academy of Orthopedic Surgeons Annual Meeting March 19-23, 2013 Chicago IL.
4. Bryce E, Forrester L. How long is long enough? Determining the optimal period for surgical site surveillance. British Columbia Patient Safety and Quality Forum. Vancouver Feb 28 – March 2, 2013
5. Bryce E, Wong T. Immediate preoperative decolonization therapy reduces surgical site infections: a multidisciplinary quality improvement project. British Columbia Patient Safety and Quality Forum. Vancouver Feb 28-March 2, 2013.
6. Liataud A, Yassi A, Engelbrecht MC, O’Hara LM, Rau A, Bryce EA, Spiegel K et al. Building capacity to design, implement and evaluate action research projects to decrease the burden of HIV and tuberculosis in the healthcare workforce: a South African-Canadian collaboration. Afri-Can Forum Entebbe, Uganda January 17-19, 2013
7. Golding GR, Simor AE, Pelude L, Bryce E, Frenette C et al. Characterization of methicilin-resistant Staphylococcus aureus (MRSA) in patients with bloodstream infection (BSI) identified by the Canadian Nosocomial Infection Surveillance Program (CNISP), 2008/10. Infectious Disease Society of America October 2-6, 2013, San Francisco.
8. Masri B, Bryce E, Wong T, Roscoe D. Intranasal photodisinfection therapy and chlorhexidine body wipes decreases surgical site infections. AAOS Annual Meeting March 11-15, 2014 New Orleans, Louisiana.
9. Jeffrey Reimer. Optimizing Medication Reconciliation Data Submission and Reporting for Residential Care. British Columbia Patient Safety and Quality Forum. Vancouver Feb 28 – March 2, 2013
10. Chandima Panditha. Where are We Now? Data Collection, Technology and Practice Change (Panel Discussion). British Columbia Patient Safety and Quality Forum. Vancouver Feb 28 – March 2, 2013
11. Improving Patient Care through Releasing Time to Care: Local & International Experience, Quality Forum 2013, March 1/13, Vancouver – Felicia Laing
12. Outbreak investigation of Stenotrophomonas maltophilia in a rural community healthcare facility Sandie Jackson A.R.T. Clin Mic, Infection Control Practitioner, Leslie Forrester, BA (Hons), MA, MSc, Regional Epidemiologist, Vancouver Coastal Health Authority

AntibiogramsIn general the susceptibility patterns are stable, and in most case if there is a change it is in the positive direction. This is particularly noted for Acinetobacter where we did not have the outbreak of the resistant strain as in 2008/09, and the improvement in susceptibility is quite dramatic.
VGH/UBC Hospital Hospital Wide Antibiogram, 2011 and 2012*
Gram-Positive Organisms, % SusceptibleMSSA MRSA S.epidermidis S.pneumoniae** E. faecalis*** E. faecium****
Year 2011 2012 2011 2012 2011 2012 2011 2012 2011 2012 2011 2012# Isolates 1915 1073 815 505 476 436 115 70 1032 942 253 278Cephalexin 100 100 0 0 29 30 NT NT 0 0 0 0Cefazolin 100 100 0 0 29 30 NT NT 0 0 0 0Cefotaxime NT NT 0 0 NT NT 100 100 0 0 0 0Clindamycin 82 84 42 43 44 39 NT NT 0 0 0 0Cloxacillin 100 100 0 0 29 30 NT NT 0 0 0 0Penicillin 23 24 0 0 5 4 98 100 99 99 21 17SXT 95 96 92 92 43 42 NT NT 0 0 0 0Tetracycline 96 96 88 88 91 88 64 68 20 21 52 58Vancomycin 100 100 100 100 100 100 100 100 99 99 NA NA
* 2011 reflects fiscal year 2011/12 and 2012 reflects fiscal year 2012/23 **S. pneumoniae 99% susceptible to moxifloxacin and 61% susceptible to azithromycin (70 isolates tested)
*** E. faecalis 48% susceptible to ciprofloxacin and 98% susceptible to nitrofurantoin (used for simple cystitis only) ****E. faecium is not susceptible to carbapenem antibiotics
****S. pyogenes (Group A streptococci) approximately 80% susceptible to clindamycin and erythromycin (80 isolates tested)
Gram-Negative Organisms, % SusceptibleE.coli K.pneumoniae E.cloacae P.mirabilis S.marcescens Acinetobacter** P.aeruginosa
Year 2011 2012 2011 2012 2011 2012 2011 2012 2011 2012 2011 2012 2011 2012# Isolates 2844 3331 645 743 297 329 305 386 99 144 88 127 395 434AntibioticAmpicillin 55 55 0 0 0 0 75 71 0 0 0 0 0 0Cephalexin 81 80 87 88 0 0 4 4 0 0 0 0 0 0Cefazolin 84 84 89 89 0 0 41 27 0 0 0 0 0 0Cefotaxime 89 88 93 95 73 74 98 99 98 99 26 20 0 0Ceftazidime 89 89 93 93 75 76 100 100 100 100 86 82 92 90Ciprofloxacin 75 75 93 94 95 94 79 78 96 92 91 93 81 82Gentamicin 90 89 97 97 97 96 94 93 99 97 93 85 95 93Imipenem 100 100 99 100 100 99 98 98 98 97 92 95 86 86Meropenem 100 100 99 100 100 99 100 100 100 99 95 96 96 91Pip/tazo 97 98 95 96 78 80 100 100 98 99 82** 84 94 96SXT 74 76 92 91 89 90 80 79 97 99 86 94 0 0Tetracycline 72 71 87 83 89 88 0 0 0 0 87 91 0 0Tobramycin 88 87 95 96 97 95 93 90 86 76 92 89 98 98Nitrofurantoin (simple cystitis only) 98 97 42 43 31 29 0 0 0 0 0 0 0 0
*2011 reflects fiscal year 2011/2012 and 2012 reflects fiscal year 2012/2013 * Acinetobacter includes A. baumanii, A. calcoaceticus, A. haemolyticus, and other Acinetobacter species. In vitro susceptibility testing of
Acinetobacter may over-estimate susceptibility to beta-lactam/beta-lactam inhibitor combinations Please note: Antibiogram susceptibility profiles based on fewer than 100 organisms are less reliable and may show large fluctuations
NT=Not tested | NA=Not available

Promoting wellness. Ensuring care. 104
VGH ICU Antibiogram, 2011 and 2012*
Gram-Positive Organisms, % Susceptible MSSA MRSA S.epidermidis S.pneumoniae** E.faecalis*** E.faecium****
Fiscal Year 2011 2012 2011 2012 2011 2012 2011 2012 2011 2012 2011 2012# Isolates 134 93 34 34 88 89 15 14 33 43 35 39AntibioticsCephalexin 100 100 0 0 27 31 NT NT 0 0 0 0Cefazolin 100 100 0 0 27 31 NT NT 0 0 0 0Cefotaxime NT NT 0 0 NT NT 100 100 0 0 0 0Clindamycin 83 83 43 41 44 43 NT NT 0 0 0 0Cloxacillin 100 100 0 0 27 31 NT NT 0 0 0 0Penicillin 25 22 0 0 8 3 100 100 100 95 20 8SXT 98 98 87 80 47 48 NT NT 0 0 0 0Tetracycline 98 97 90 80 90 92 63 69 8 16 83 51Vancomycin 100 100 100 100 100 100 NT NT 88 89 NA NA
*2011 reflects fiscal year 2011/12 and 2012 reflects fiscal year 2012/13 ** S. pneumoniae 100% susceptible to moxifloxacin and 69% susceptible to azithromycin (14 isolates tested)
***E. faecalis 55% susceptible to ciprofloxacin and 94% susceptible to nitrofurantoin (used for simple cystitis only) ****E. faecium is not susceptible to carbapenem antibiotics
Gram-Negative Organisms, % SusceptibleE.coli K.pneumoniae E.cloacae S.marcescens Acinetobacter** P.aeruginosa
Fiscal Year 2011 2012 2011 2012 2011 2012 2011 2012 2011 2012 2011 2012# Isolates 91 78 67 55 38 40 17 22 20 23 32 23AntibioticAmpicillin 51 45 0 0 0 0 0 0 0 0 0 0Cephalexin 71 58 82 85 0 0 0 0 0 0 0 0Cefazolin 77 63 84 87 0 0 0 0 0 0 0 0Cefotaxime 86 78 85 96 63 73 100 100 30 13 0 0Ceftazidime 86 81 85 96 66 75 100 100 75 91 81 87Ciproflox 78 74 93 93 92 98 94 86 80 96 81 91Gentamicin 88 82 93 98 95 98 94 91 90 87 88 91Imipenem 99 99 94 100 100 100 94 95 80 91 72 83Meropenem 100 100 94 100 100 100 100 100 86 95 81 91Pip/tazo 89 97 85 95 76 80 100 91 71** 91** 91 96SXT 78 72 94 93 90 98 94 95 85 100 0 0Tetracycline 63 93 100 80 57 68 0 0 NA 96 0 0Tobramycin 87 78 93 93 95 98 82 64 80 87 91 91
*2011 reflects fiscal year 2011/12 and 2012 reflects fiscal year 2012/13 **Acinetobacter includes A. baumanii, A. calcoaceticus, A. haemolyticus, and other Acinetobacter species. In vitro susceptibility testing of
Acinetobacter may over-estimate susceptibility to beta-lactam/beta-lactam inhibitor combinations Please note: Antibiogram susceptibility profiles based on fewer than 100 organisms are less reliable and may show large fluctuations
NT=Not tested | NA=Not available

Promoting wellness. Ensuring care. 105
LGH Hospital Wide Antibiogram, 2011 and 2012*
Gram-Positive Organisms, % SusceptibleMSSA MRSA S.epidermidis S.pneumoniae** E.faecalis*** E.faecium****
Year 2011 2012 2011 2012 2011 2012 2011 2012 2011 2012 2011 2012# Isolates 327 396 92 118 34 59 27 30 342 321 23 37
AntibioticsCephalexin 100 100 0 0 41 36 NT NT 0 0 0 0Cefazolin 100 100 0 0 41 36 NT NT 0 0 0 0Cefotaxime NT NT 0 0 NT NT 100 100 0 0 0 0Clindamycin 86 84 72 63 21 47 NT NT 0 0 0 0Cloxacillin 100 100 0 0 41 36 NT NT 0 0 0 0Penicillin 25 25 0 0 9 7 100 100 100 100 11 17SXT 96 95 92 91 67 67 NT NT 0 0 0 0Tetracycline 98 96 93 93 90 63 79 80 52 23 93 75Vancomycin 100 100 100 100 100 100 NT NT 99 99 NA NA
* 2011 reflects fiscal year 2011/12 and 2012 reflects fiscal year 2012/013 **S. pneumoniae 93% susceptible to moxifloxacin and 67% susceptible to azithromycin (30 isolates tested) *** E. faecalis 46% susceptible to ciprofloxacin and 98% susceptible to nitrofurantoin (simple cystitis only)
****E. faecium is not susceptible to carbapenem antibiotics *****S. pyogenes (Group A Streptococci) 80% susceptible to both clindamycin and erythromycin (30 isolates tested)
Gram-Negative Organisms, % SusceptibleE.coli K.pneumoniae E.cloacae P.mirabilis S.marcescens Acinetobacter** P.aeruginosa
Year 2011 2012 2011 2012 2011 2012 2011 2012 2011 2012 2011 2012 2011 2012# Isolates 1107 1265 192 223 42 61 107 129 13 29 15 14 96 139
AntibioticAmpicillin 60 61 0 0 0 0 65 76 0 0 0 0 0 0Cephalexin 85 84 97 94 0 0 3 8 0 0 0 0 0 0Cefazolin 89 88 97 97 0 0 36 29 0 0 0 0 0 0Cefotaxime 93 92 100 100 76 87 98 99 85 100 7 14 0 0Ceftazidime 93 92 100 100 76 89 99 100 100 100 80 86 91 94Ciproflox 79 80 100 98 100 97 75 81 85 93 80 100 92 84Gentamicin 92 94 100 99 100 97 92 95 100 100 93 93 95 94Imipenem 100 100 100 100 100 100 100 99 100 96 100 100 92 96Meropenem 100 100 100 100 100 100 100 100 100 100 100 100 96 96Pip/tazo 99 98 97 99 76 90 100 98 92 100 80** 93** 99 97SXT 78 79 96 97 95 90 73 79 100 97 93 100 0 0Tetracycline 90 80 97 96 98 87 0 0 0 0 98 100 0 0Tobramycin 90 92 100 100 100 97 93 93 62 69 93 93 99 96Nitrofurantoin (simple cystitis only) 97 98 51 41 45 27 0 0 0 0 0 0 0 0
* 2011 reflects fiscal year 2011/12 and 2012 reflects fiscal year 2012/13 ** Acinetobacter includes A. baumanii, A. calcoaceticus, A. haemolyticus, and other Acinetobacter species. In vitro susceptibility testing of
Acinetobacter species may over-estimate susceptibility to beta-lactam/beta-lactam inhibitor combinations Please note: Antibiogram susceptibility profiles based on fewer than 100 organisms are less reliable and may show large fluctuations
NT=Not tested | NA=Not available

Promoting wellness. Ensuring care. 106
RH Hospital Wide Antibiogram, 2011 and 2012*
Gram-Positive Organisms, % SusceptibleMSSA MRSA S.epidermidis S.pneumoniae** E.faecalis*** E. faecium****
Year 2011 2012 2011 2012 2011 2012 2011 2012 2011 2012 2011 2012# Isolates 444 325 167 102 53 45 20 24 202 214 53 39AntibioticsCephalexin 100 100 0 0 55 36 NT NT 0 0 0 0Cefazolin 100 100 0 0 55 36 NT NT 0 0 0 0Cefotaxime NT NT 0 0 NT NT 100 100 0 0 0 0Clindamycin 80 80 63 63 57 25 NT NT 0 0 0 0Cloxacillin 100 100 0 0 55 36 NT NT 0 0 0 0Penicillin 27 24 0 0 12 4 100 100 100 100 22 31SXT 94 95 92 95 54 35 NT NT 0 0 0 0Tetracycline 98 93 98 96 98 92 89 92 50 19 79 38Vancomycin 100 100 100 100 100 100 100 100 100 100 NA NA
* 2011 reflects fiscal year 2011/12 and 2012 reflects fiscal year 2012/13 **S. pneumoniae 100% susceptible to moxifloxacin and 75% susceptible to azithromycin (24 isolates tested) *** E. faecalis 53% susceptible to ciprofloxacin and 99% susceptible to nitrofurantoin (simple cystitis only)
****E. faecium is not susceptible to carbapenem antibiotics *****Streptococcus pyogenes (Group A streptococci) 96% susceptible to clindamycin and 91% susceptible to erythromycin (23 isolates tested)
Gram-Negative Organisms, % SusceptibleE.coli K.pneumoniae E.cloacae P.mirabilis S.marcescens Acinetobacter** P.aeruginosa
Year 2011 2012 2011 2012 2011 2012 2011 2012 2011 2012 2011 2012 2011 2012# Isolates 1008 1004 161 177 58 47 115 103 18 26 20 20 99 89AntibioticAmpicillin 54 51 0 0 0 0 77 84 0 0 0 0 0 0Cephalexin 79 79 90 88 0 0 8 5 0 0 0 0 0 0Cefazolin 84 82 93 91 0 0 46 32 0 0 0 0 0 0Cefotaxime 88 86 93 94 79 77 98 98 94 100 20 26 0 0Ceftazidime 89 87 93 93 81 79 100 100 100 100 75 65 100 94Ciprofloxacin 75 73 93 94 90 96 73 78 100 92 75 100 91 91Gentamicin 89 87 94 95 95 91 98 94 89 100 70 90 95 96Imipenem 100 100 99 99 100 98 100 99 94 96 75 100 93 92Meropenem 100 100 99 99 100 98 100 100 100 92 78 95 98 99Pip/tazo 98 97 97 97 83 81 100 100 100 100 70** 84** 97** 97SXT 72 73 91 94 91 83 81 84 94 100 65 100 0 0Tetracycline 85 70 94 90 99 83 0 0 0 0 92 99 0 0Tobramycin 86 85 93 94 90 91 95 93 61 69 75 95 100 96Nitrofurantoin (simple cystitis only) 97 97 47 42 29 27 0 0 0 0 0 0 0 0
* 2011 reflects fiscal year 2011/12 and 2012 reflects fiscal year 2012/13 ** Acinetobacter includes A. baumanii, A. calcoaceticus, A. haemolyticus, and other Acinetobacter species. In vitro susceptibility testing of
Acinetobacter species may over-estimate susceptibility to beta-lactam/beta-lactam inhibitor combinations Please note: Antibiogram susceptibility profiles based on fewer than 100 organisms are less reliable and may show large fluctuations
NT=Not tested | NA=Not available

Promoting wellness. Ensuring care. 107
Appendix Terminology & Abbreviations
Annual Target - A goal that is set on a yearly basis.
Benchmark - A point of reference for judging value, quality, change, or the like; standard to which others can be compared.
Clostridium difficile Infection (CDI) also C. difficile – C. difficile is a germ that produces a toxin that can cause diarrhea and serious illness of the bowel. Generally, C. difficile does not cause problems in healthy people; however, CDI can be serious in people who are sick, elderly, or have weakened immune systems. In rare cases it can be fatal.
CNISP - Canadian Nosocomial Infection Surveillance Program
Facility Type - A healthcare facility categorized by the range of services offered.
Hand Hygiene - Preventing the spread of illness through washing hands with soap and water or cleaning hands with alcohol based hand-rubs.
Healthcare Associated Infections (HAI) also Nosocomial Infections - Infections patients get while staying in healthcare facility, which include germs from other patients, the environment, or staff. The germs cause illness in patients during or after their stay.
Indicator - A statistical measurement that shows how well something is working or operating.
Limitations - Limits or restrictions.
Methicillin-resistant Staphylococcus aureus (MRSA) - Staphylococcus aureus is a germ that is normally found on the skin and in the nose of healthy people. Some bacteria have become resistant to the medicines used to treat infections (antibiotics). MRSA is a type of Staphylococcus aureus that is resistant to most antibiotics, including the antibiotic called penicillin. Staphylococcus aureus can cause minor skin infections such as boils, or infections in a surgical incision site.
Methodology - The methods, principles, and rules used to for the activity or result.
Responsible Organism - The germ causing the infection.
Source - The person or thing that gave the information.
Trend - The general movement or direction of change.
Vancomycin-resistant Enterococci (VRE) - Enterococci are germs that are commonly found in the stomach and bowels of healthy people. Some bacteria have become resistant to the medicines used to treat infections (antibiotics). Vancomycin is an antibiotic used to treat serious infections. VRE is a type of Enterococci that has become resistant to Vancomycin. These germs rarely cause illness in healthy people. However, when VRE gets into open cuts and skin sores, they can cause infections. Occasionally, VRE can also cause more serious infections of the blood or other body tissues.

Promoting wellness. Ensuring care. 108
Case Definitions
MRSAcasedefinition(CanadianNosocomialInfectionSurveillanceProgram)• isolation of Staphylococcus aureus from any body site
AND
• resistance of isolate to oxacillin
AND
• patient must be admitted to the hospital
AND
• is a “newly identified MRSA case” at a CHEC facility at the time of hospital admission or identified during hospitalization.
This includes:
• MRSA cases identified for the first time during this hospital admission
• Cases that have been previously identified at other non-CHEC sites (since we want newly identified MRSA cases at CHEC sites).
• Cases that have already been identified at your site but are new cases. This can only be identified if the previously identified case has another strain. This means the person was exposed again to MRSA and acquired another strain of it from another source (a new Patient identifier should be assigned only if it is an MRSA infection, identified as a clinical isolate or bacteremia).
This DOES NOT include:
• MRSA cases previously identified at other CHEC sites
• Emergency, clinic, or other outpatient cases
• Cases re-admitted with MRSA (unless it is a different strain)
Healthcare-associated case definition:
Once the patient has been identified with MRSA, they will be classified as healthcare-associated based on an assessment of the practitioner using the following criteria:
• length of time in hospital prior to MRSA identification (> 48 hours)
• knowledge of previous MRSA status
Promoting wellness. Ensuring care. 109
• date of admission
• length of stay in hospital
• prior hospitalization or other healthcare facility history (previously admitted in past 12 months)
• where patient admitted from (e.g. long-term care)
Clostridiumdifficileinfection(BC Provincial Infection Control Network (PICNet): A diagnosis of CDI applies to a person with:
• Acute onset of diarrhea (> 3 loose stools within a 24 hr period) without another etiology (loose stool is defined as that which takes the shape of the container that holds it).
And one or more of the following:
• Laboratory confirmation (positive toxin or culture with evidence of toxin production)
OR
• Diagnosis of typical pseudo-membranes on sigmoidoscopy or colonoscopy or histological/ pathological diagnosis of CDI
OR
• Diagnosis of toxic megacolon.
A case is considered to be healthcare associated if the patient’s symptoms occurred 48 hours or later post-admission or the patient’s symptoms cause readmission in a patient who had been hospitalized in the previous two months of the current admission date, and who is not a resident in a chronic care hospital or nursing home.
Bloodstream Infections Nosocomial Bacteraemia: Bacteremic events occurring 48 hours or more after admission or within five days of discharge. This depends to some extent on the incubation period and individual patient factors. Thus, on occasion, Nosocomial infections may fall outside these time parameters. For example there are some instances when bacteremic events may be related to an invasive procedure (like emergency surgery or central line insertion) that has taken place within the first 48 hours of the hospital stay – these would be counted as a Nosocomial infection. Conversely a bacteraemia that was a complication or extension of a pre-existing condition on admission (e.g. bacteraemia following a community acquired pneumonia) is not a Nosocomial infection. Bacteremic events occurring in patients that meet the Health Canada definition for nosocomial surgical site infections are also included here if the bacteraemia is felt to be related to the surgical procedure.
