adverse macro-financial scenario for the 2018 eu-wide ... · |1 adverse macro-financial scenario...
TRANSCRIPT

|1
Adverse macro-financial scenario for the 2018 EU-wide banking
sector stress test
This document sets out the adverse macro-financial scenario that banks are required to use
in the 2018 EU-wide stress test in order to estimate what the potential impact may be on
profits and capital. In accordance with its mandate, the European Banking Authority (EBA),
together with the European Systemic Risk Board (ESRB), initiates and coordinates EU-wide
stress tests to assess the resilience of banks to adverse market developments. The ECB, in
collaboration with the ESRB, has developed the narrative and methodology and has
calibrated the adverse macro-financial scenario for the 2018 exercise. The scenario includes
variables such as GDP, inflation, unemployment, asset prices and interest rates. It covers
three years, starting from the first quarter of 2018 (when the shocks are assumed to
materialise) and ending in the last quarter of 2020. The scenario has been approved by the
ESRB General Board and transmitted to the EBA.
1. Main risks to stability of the EU financial sector
The narrative of the adverse scenario reflects the four systemic risks identified by the ESRB
General Board as representing the most material threats to the stability of the EU financial
sector:1
1. abrupt and sizeable repricing of risk premia in global financial markets – triggered e.g.
by a policy expectation shock – leading to a tightening of financial conditions;
2. adverse feedback loop between weak bank profitability and low nominal growth, amid
structural challenges in the EU banking sector;
3. public and private debt sustainability concerns amid a potential repricing of risk premia
and increased political fragmentation;
4. liquidity risks in the non-bank financial sector with potential spillovers to the broader
financial system.
In the adverse scenario, the first systemic risk is assessed to be the most significant of
the four. It could act as a trigger for the remaining risks, which are more closely related to the
1 These threats do not represent either ESRB expectations about future economic and financial developments or any unintended
consequence of future monetary policy decisions.
16 January 2018
ECB-PUBLIC

|2
EU banking system. An abrupt repricing of risk premia in global financial markets triggered
outside the European Union would spill over to European countries via both financial and
trade channels, giving rise to domestic confidence shocks. This would adversely affect
demand in the European Union, which would enter a deep recession.
Elevated valuations in major global equity and bond markets, coupled with low realised
and implied levels of volatility, render financial markets susceptible to an abrupt and
sizeable repricing. Political uncertainty linked to geopolitical tensions and changes in market
participants’ expectations regarding economic policies in major economies outside the
European Union could trigger such a repricing of risk premia which would then spill over to
European equity and bond markets.2 This would result in a large fall in asset prices in global
financial markets and an upward shift and steepening of the yield curve across all
jurisdictions. The steepening of the yield curve would be more pronounced for countries with
higher public debt sustainability risks. The repricing of risk premia would be amplified by the
unwinding of short positioning in volatility markets and high leverage in some corporate
sectors.
Political uncertainty and increased volatility in financial markets could also trigger
adverse confidence shocks in developed economies at the beginning of the projection
horizon.3 This could in turn result in capital outflows from those jurisdictions. At the same
time, the phasing-in of more protectionist policies in some advanced economies would also
exert a large negative effect on global demand in the longer term. A contraction in global
demand would have a negative impact on commodity prices. Against the backdrop of global
financial tensions, bilateral nominal exchange rates of the central and eastern European
countries (CEECs) against the euro would depreciate significantly while the Swiss franc would
appreciate against the euro.
The fall in global demand would lead to a decline in economic activity in the European
Union, generating adverse feedback loops between bank profitability and low nominal
growth, especially in countries facing structural challenges in their banking sectors.
The economic slowdown would result in an increase in unemployment across the European
Union. This would put further downward pressure on aggregate demand which would also
affect real estate markets, especially in countries where prices are considered to be above
fundamental valuations. An increase in the unemployment rate and an increase in long-term
bond yields would also negatively affect households’ creditworthiness and their ability to
service their mortgages. Moreover, a prolonged period of low economic activity combined with
the rise in corporate bond yields would increase the credit risk of non-financial corporations,
2 Monetary policy is assumed, under the adverse scenario, to follow the expectations implied by the baseline scenario. Therefore, the
increase in sovereign bond yields and interest rates does not reflect any monetary policy change compared with the baseline scenario.
3 The adverse scenario encompasses a wide range of macroeconomic risks that could be associated with Brexit. Elements of the
baseline scenario already reflect the average of a range of possible outcomes from the United Kingdom’s trading relationship with the
European Union.

|3
leading to higher risk premia. The resulting increase in corporate financing costs would
negatively affect investment. Overall, the increase in borrower credit risk would result in banks
facing higher levels of non-performing loans (NPLs) and a concomitant rise in forgone interest
income. At the same time, a slowdown in aggregate demand would exert downward pressure
on banks’ lending rates, especially in countries characterised by structural overcapacity in the
banking sector. Owing to these factors, banking sector counterparty risk would increase and,
consequently, banks’ funding conditions would tighten. This would be reflected in a gap
between the policy rates and reference money market rates.
Developments in global financial markets and the global real economy would trigger
the re-emergence of public and private debt sustainability concerns. The increase in
bond yields and the weakening of foreign demand would raise public and private debt
sustainability concerns in the European Union, further fuelling an increase in the average
level and dispersion of government bond yields across EU countries. A rise in interest rates in
some segments of the banking sector would imply a tightening of credit conditions for the
private sector, especially for smaller banks which are not fully hedged against this risk. In
turn, these developments would further weigh negatively on real economic growth.
Liquidity risks in the non-bank financial sector would be reflected in a sell-off of assets
by non-banking financial institutions, which would amplify the decline in asset prices.
While the withdrawal by non-bank financial institutions of funds from the banking sector might
create pressure on the funding costs of banks, stress on pension funds, insurance and
investment funds would lead to feedbacks to the real economy via wealth effects on private
households.
|4
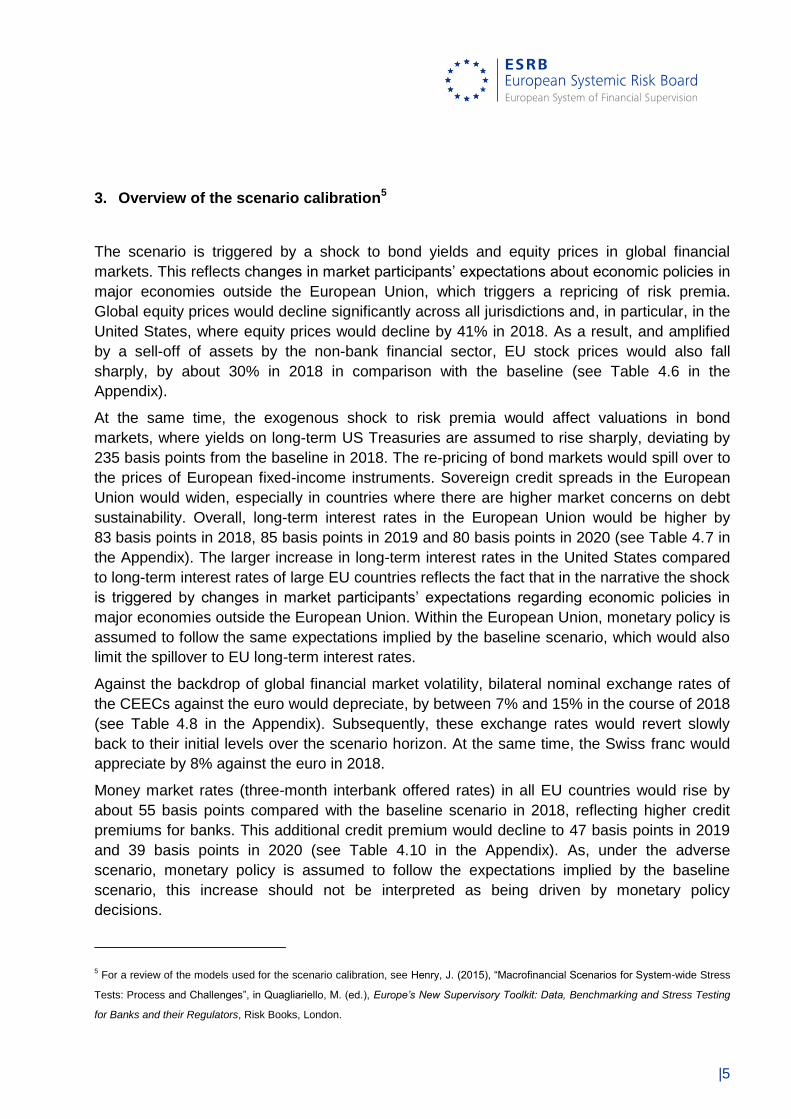
2. Mapping of main risks into macro-financial shocks
Specific macro-financial shocks that are assumed to materialise under each of the parts of the
scenario are presented in Table 1 below.
Table 1: Main financial stability risks and assumed financial and economic shocks
Source of risk Financial and economic shocks
Abrupt and sizeable repricing of risk premia in global financial markets – triggered e.g. by a policy expectation shock – leading to a tightening of financial conditions
- Upward shift and steepening of the yield curve and increase in risk premia in the United States and other advanced economies
- Global equity price shock
- Increase in the Chicago Board Options Exchange Volatility Index (VIX) and spillover to emerging market economies
- Foreign demand shocks in the European Union
- Exchange rate shocks
- Negative oil and commodity price shocks
- Shocks to financing conditions for small and medium-sized enterprises in EU countries due to limited hedging against a rise in interest rates in some segments of the banking sector (via shocks to the user cost of capital)
Adverse feedback loop between weak bank profitability and low nominal growth, amid structural challenges in the EU banking sector
- Investment and consumption demand shocks in EU countries
- Residential and commercial property price shocks in EU countries
- EU-wide uniform shock to interbank money market rates due to higher credit risk of the banking sector
Public and private debt sustainability concerns amid potential repricing of risk premia and increased political fragmentation
- Country-specific shocks to sovereign credit spreads
- Shocks to corporate credit spreads
- Shocks to financing conditions for small and medium-sized enterprises in EU countries due to limited hedging against a rise in interest rates in some segments of the banking sector (via shocks to the user cost of capital)
4
Liquidity risks in the non-bank financial sector with potential spillovers to the broader financial system
- Shocks to EU financial asset prices
- Shocks to financing conditions in EU countries (via shocks to household nominal wealth)
- Shock to Moody’s KMV Expected Default Frequency (EDF) of the largest non-bank financial sector institutions
- EU-wide uniform shock to interbank money market rates
4 This shock is not double counted; it is associated with the overall increase of interest rates due both to the first and third building
blocks.
|5
3. Overview of the scenario calibration5
The scenario is triggered by a shock to bond yields and equity prices in global financial
markets. This reflects changes in market participants’ expectations about economic policies in
major economies outside the European Union, which triggers a repricing of risk premia.
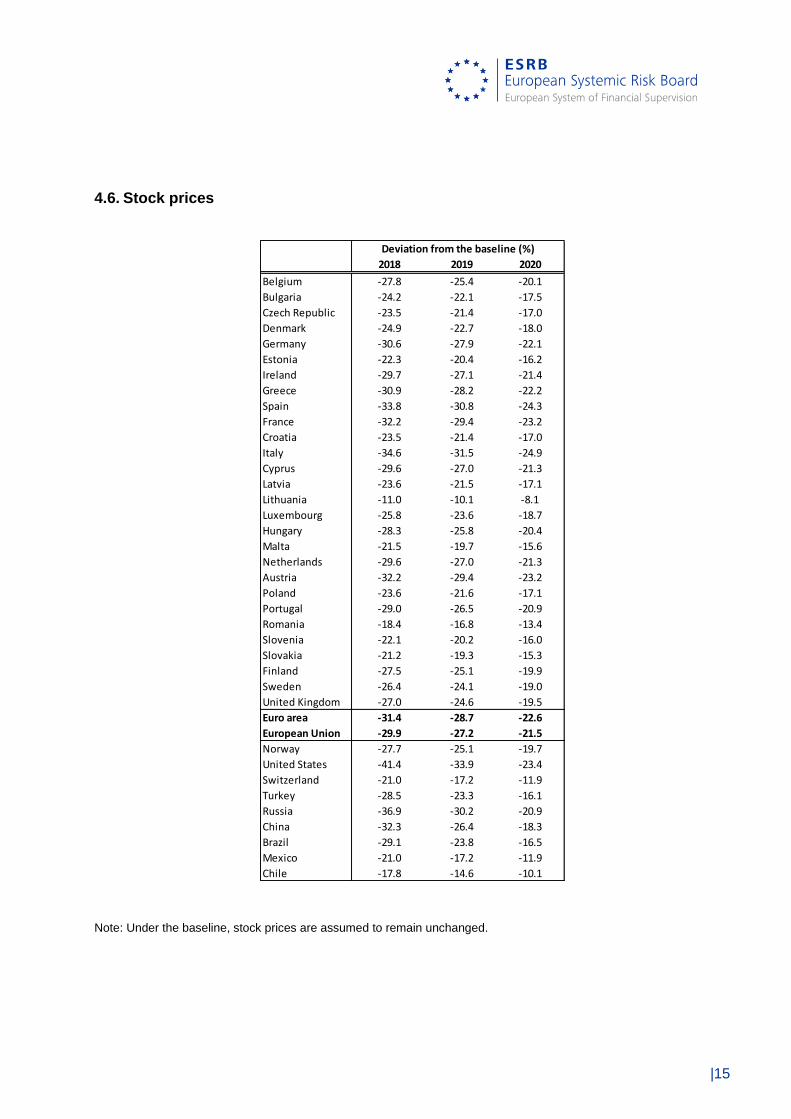
Global equity prices would decline significantly across all jurisdictions and, in particular, in the
United States, where equity prices would decline by 41% in 2018. As a result, and amplified
by a sell-off of assets by the non-bank financial sector, EU stock prices would also fall
sharply, by about 30% in 2018 in comparison with the baseline (see Table 4.6 in the
Appendix).
At the same time, the exogenous shock to risk premia would affect valuations in bond
markets, where yields on long-term US Treasuries are assumed to rise sharply, deviating by
235 basis points from the baseline in 2018. The re-pricing of bond markets would spill over to
the prices of European fixed-income instruments. Sovereign credit spreads in the European
Union would widen, especially in countries where there are higher market concerns on debt
sustainability. Overall, long-term interest rates in the European Union would be higher by
83 basis points in 2018, 85 basis points in 2019 and 80 basis points in 2020 (see Table 4.7 in
the Appendix). The larger increase in long-term interest rates in the United States compared
to long-term interest rates of large EU countries reflects the fact that in the narrative the shock
is triggered by changes in market participants’ expectations regarding economic policies in
major economies outside the European Union. Within the European Union, monetary policy is
assumed to follow the same expectations implied by the baseline scenario, which would also
limit the spillover to EU long-term interest rates.
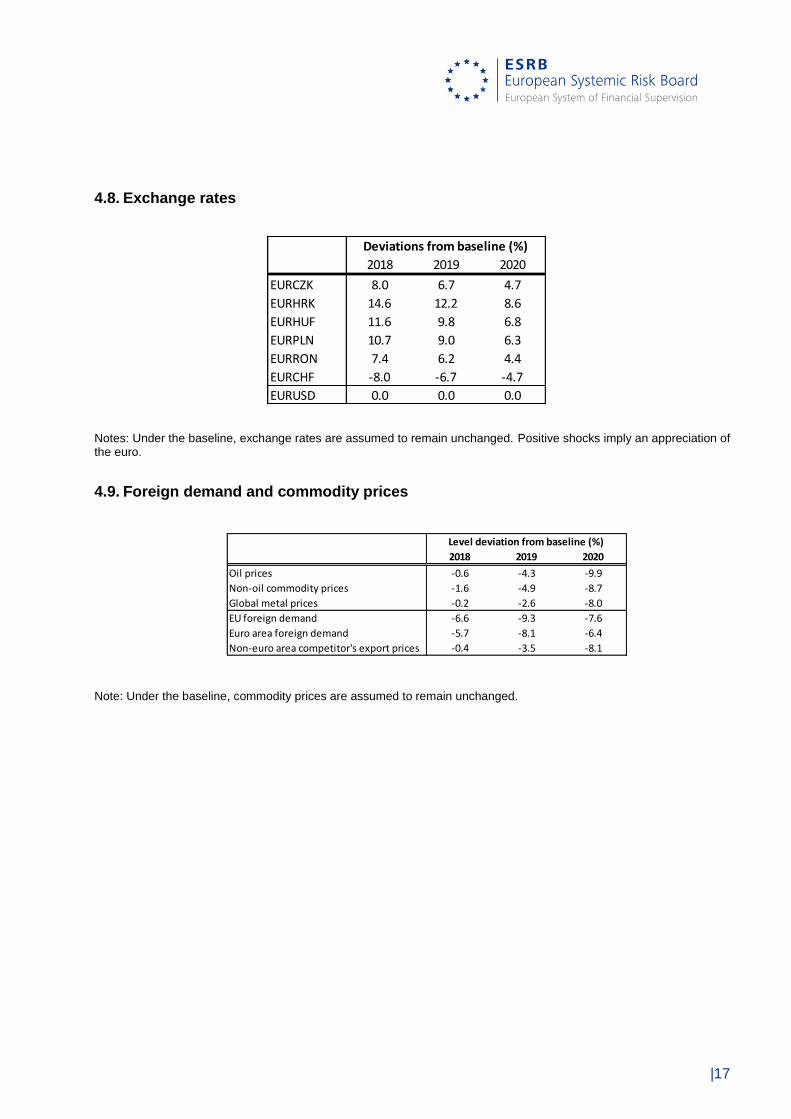
Against the backdrop of global financial market volatility, bilateral nominal exchange rates of
the CEECs against the euro would depreciate, by between 7% and 15% in the course of 2018
(see Table 4.8 in the Appendix). Subsequently, these exchange rates would revert slowly
back to their initial levels over the scenario horizon. At the same time, the Swiss franc would
appreciate by 8% against the euro in 2018.
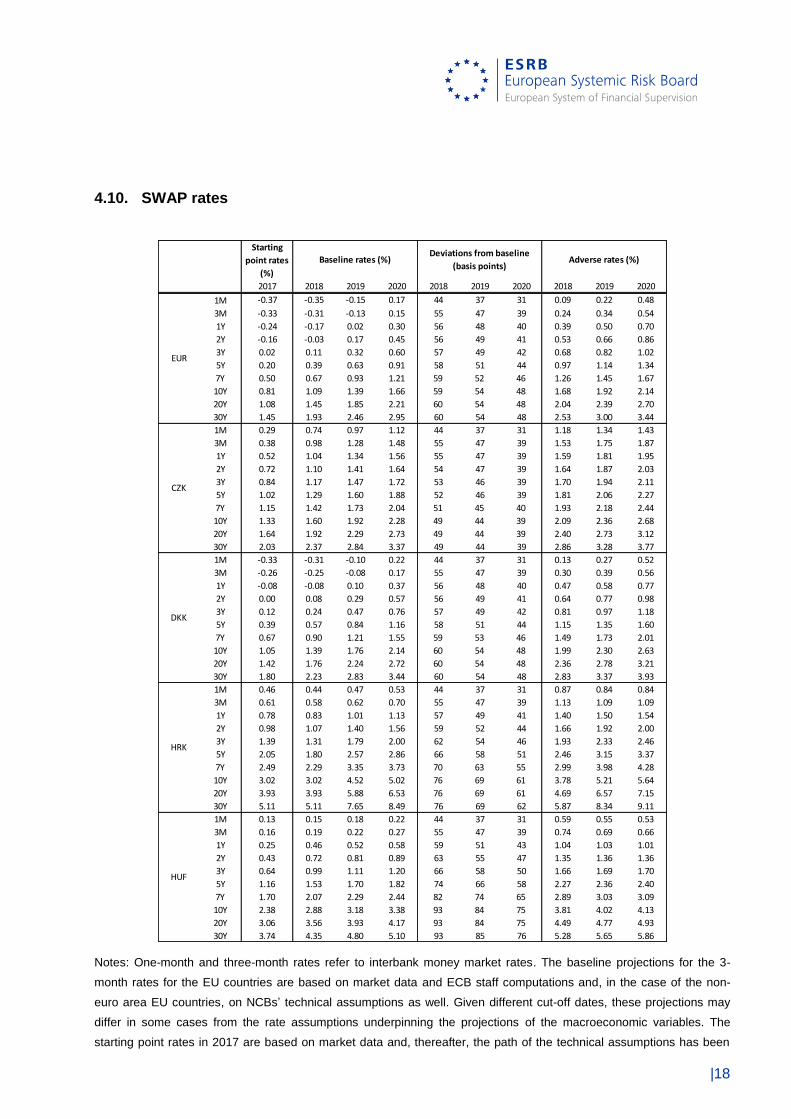
Money market rates (three-month interbank offered rates) in all EU countries would rise by
about 55 basis points compared with the baseline scenario in 2018, reflecting higher credit
premiums for banks. This additional credit premium would decline to 47 basis points in 2019
and 39 basis points in 2020 (see Table 4.10 in the Appendix). As, under the adverse
scenario, monetary policy is assumed to follow the expectations implied by the baseline
scenario, this increase should not be interpreted as being driven by monetary policy
decisions.
5 For a review of the models used for the scenario calibration, see Henry, J. (2015), “Macrofinancial Scenarios for System-wide Stress
Tests: Process and Challenges”, in Quagliariello, M. (ed.), Europe’s New Supervisory Toolkit: Data, Benchmarking and Stress Testing
for Banks and their Regulators, Risk Books, London.

|6
Increased global uncertainty and changes in market participant expectations would reduce
global economic growth, notably through confidence and financial spillovers to advanced non-
EU countries and emerging market economies. The spillovers give rise to a sudden re-
assessment of growth expectations in these countries. In turn, a reduction in asset prices
causes domestic demand in these economies to suffer from both tighter financing conditions
and business and consumer confidence shocks. In the adverse scenario, GDP would fall
between 2.5% and 7.4% below the baseline level by 2020 for the non-EU countries
considered (see Table 4.1 in the Appendix). By 2020, as the impact of the shocks would
begin to wear off, GDP growth rates would approach those projected under the baseline
scenario. Among the main emerging economies, deviations from the baseline would be
particularly strong for Turkey, India and Russia. This would have an impact on EU economies,
as foreign demand for EU exports would be materially reduced by 9.3% in terms of deviation
from baseline levels in 2019 (see Table 4.9 in the Appendix). This would affect in particular
those countries that are more dependent on trade with non-EU economies. Commodity prices
would also be affected by the slowdown in the global economy, responding to financial
shocks and the expected weakening of global economic growth, with oil prices falling by
about 9.9% in 2020.
The global shocks are also assumed to negatively affect confidence in all EU countries,
resulting in country-specific reductions in private consumption and investment which take into
account recent economic performance of each country. The significant decline of domestic
demand, together with increased risk premia, would trigger domestic vulnerabilities in the
residential and commercial real estate sectors which would result in a major slowdown in
property market activity, both in the residential and commercial property segments.
Residential property prices would fall by 27.7% below the baseline level by 2020 and the
cumulative fall in residential property prices over the scenario horizon is about 19% at the EU
aggregate level (see Table 4.4 in the Appendix). Commercial property prices would also
decline substantially over the scenario horizon and, on average in the European Union, would
fall about 27% below the baseline (see Table 4.5 in the Appendix). The cross-country
distribution of the property price shocks reflects mainly individual countries’ vulnerability to
these sectors and the magnitude of (any) overvaluation or undervaluation of property prices in
both market segments.
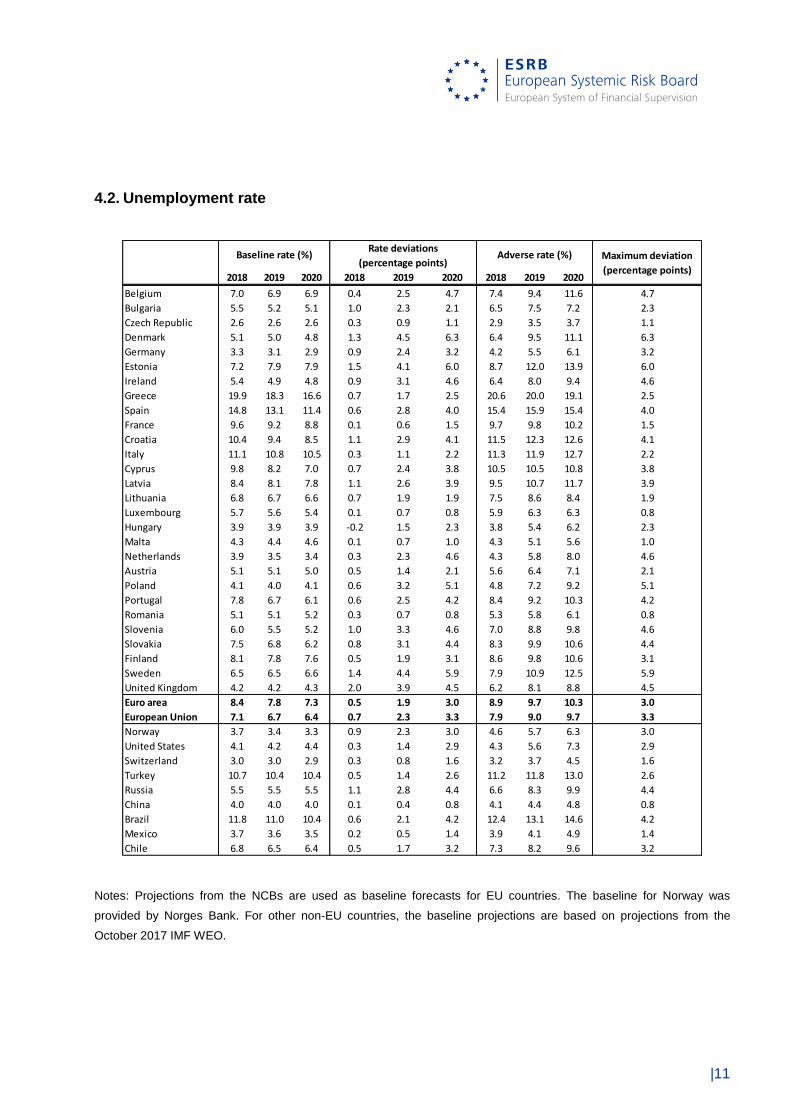
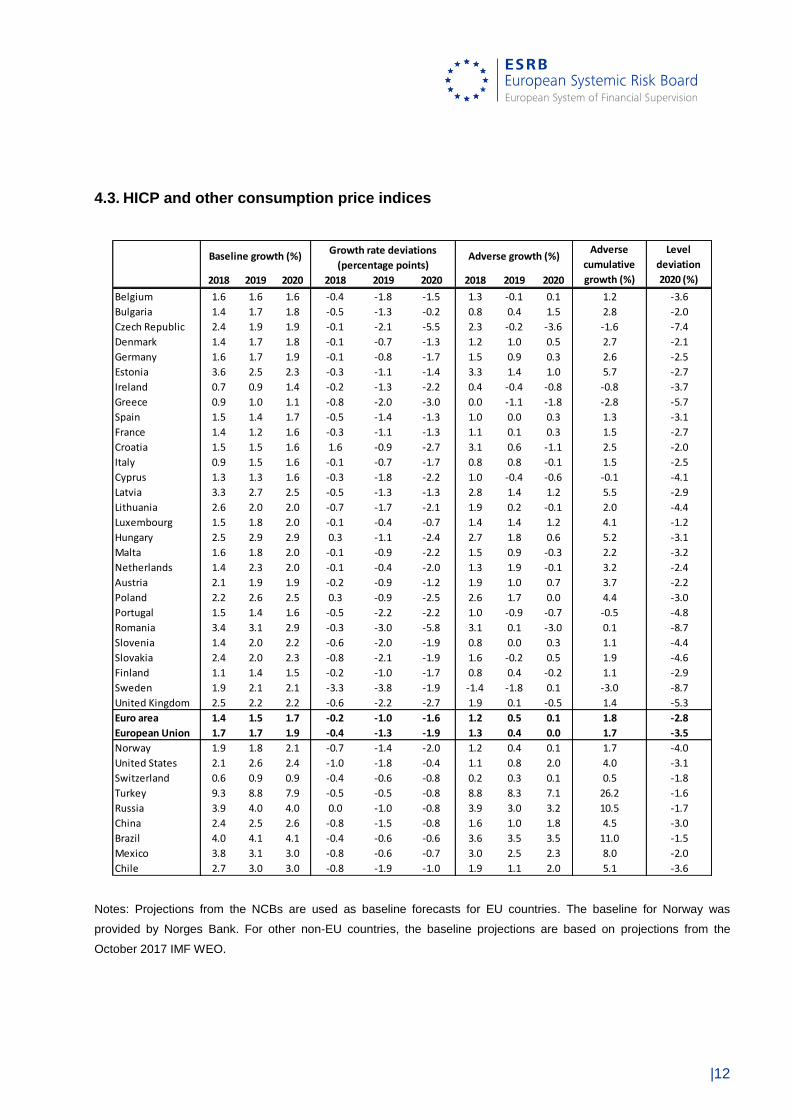
The economic slowdown would also lead to an increase in the unemployment rate of about
3.3 percentage points by 2020 (see Table 4.2 in the Appendix). The Harmonised Index of
Consumer Prices (HICP) inflation rate in the European Union under the adverse scenario
would fall by 1.9% below the baseline in 2020 (see Table 4.3 in the Appendix).
Overall, as a result of the combined foreign and domestic real and financial shocks, the
scenario implies a deviation of EU GDP from its baseline level by 8.3% in 2020, resulting in
the most severe scenario in terms of GDP deviation from baseline levels compared with the
previous two EBA exercises (see Chart 1 below). The implied EU real GDP growth rates
under the adverse scenario amounts to −1.2%, −2.2% and +0.7%, in 2018, 2019 and 2020
respectively. A large part of the impact on GDP is driven by the domestic confidence shocks
triggered by the global turmoil, which together reduce EU real GDP by about 3.6 percentage
|7
points compared with the baseline by 2020 (see Chart 2 below). Foreign real and financial
shocks contribute a further 2.6 percentage points to the total 2020 deviation of EU GDP from
the baseline, reflecting the main financial stability risks identified. The combined impact of
domestic financial shocks and residential property price shocks is somewhat weaker and
amounts to 2.1 percentage points.
These aggregate figures are also reflected in the cross-country distribution of GDP deviations
from the baseline, whereby countries with higher trade openness and countries with
vulnerabilities in the housing sector would be particularly affected by the scenario. The size of
the shocks to the macroeconomic parameters varies across countries for a number of
reasons. Countries with greater trade openness tend to experience larger shocks, all else
being equal. Countries characterised by high vulnerabilities in real estate markets and
particularly high levels of overvaluation in their residential property markets experience larger
shocks. This is especially true of countries which are also more vulnerable to shocks in
housing markets. In addition, countries where public debt sustainability concerns are greater
would experience larger shocks to sovereign yields.
In order to ensure an adequate level of severity for the adverse scenario across all EU
countries, the GDP level for each country is below the starting point in 2017 at the end of the
stress test horizon in 2020 (i.e. the cumulative GDP growth under the adverse scenario is
negative for all countries). To this end, additional domestic real and financial shocks have
been applied to the following countries: Bulgaria, Ireland, Croatia, Cyprus, Latvia,
Luxembourg, Hungary, Malta, Poland, Slovenia and Slovakia. These additional shocks
increase the severity of the GDP deviation from baseline for these countries so that the
cumulative GDP growth under the adverse scenario is negative. These shocks are not
intended to reflect any specific imbalance or any increase in the sensitivity of those countries
to a given shock.

|8
Chart 1: EU real GDP deviation from the baseline – comparison between EBA exercises for 2014, 2016 and 2018 (percent)
Chart 2: Contributions of individual shocks to deviation of EU real GDP from baseline (percentage points)

|9
4. Appendix – Detailed tables6
4.1. GDP
2018 2019 2020 2018 2019 2020 2018 2019 2020
Belgium 1.7 1.6 1.4 -3.2 -4.4 -1.6 -1.5 -2.8 -0.2 -4.5 -8.8
Bulgaria 3.6 3.6 3.8 -6.2 -4.4 -0.5 -2.7 -0.8 3.3 -0.2 -10.4
Czech Republic 3.4 3.1 3.1 -4.7 -6.2 -1.8 -1.2 -3.1 1.3 -3.1 -11.9
Denmark 1.8 1.7 1.7 -4.0 -4.9 -0.4 -2.2 -3.2 1.3 -4.1 -9.0
Germany 2.5 1.7 1.5 -4.4 -4.5 -0.2 -1.9 -2.8 1.4 -3.3 -8.6
Estonia 4.2 3.1 2.7 -4.7 -4.1 -2.4 -0.5 -1.0 0.3 -1.2 -10.4
Ireland 4.3 4.0 3.4 -4.7 -5.0 -2.2 -0.4 -1.0 1.3 -0.2 -11.0
Greece 2.4 2.5 2.4 -3.7 -4.6 -2.2 -1.3 -2.1 0.2 -3.3 -10.0
Spain 2.4 2.1 2.1 -2.7 -3.6 -1.0 -0.3 -1.5 1.1 -0.8 -7.0
France 1.7 1.8 1.6 -1.8 -3.2 -1.7 0.0 -1.4 -0.1 -1.5 -6.4
Croatia 3.1 3.0 3.0 -5.0 -4.2 -0.1 -1.9 -1.1 2.9 -0.2 -8.8
Italy 1.4 1.3 1.3 -2.0 -2.8 -1.9 -0.6 -1.5 -0.6 -2.7 -6.5
Cyprus 3.4 3.2 3.1 -3.1 -4.0 -2.8 0.3 -0.8 0.3 -0.2 -9.3
Latvia 4.1 3.2 3.0 -4.3 -4.3 -1.9 -0.2 -1.1 1.1 -0.2 -9.8
Lithuania 2.8 2.7 2.5 -4.3 -4.8 0.0 -1.5 -2.1 2.5 -1.1 -8.7
Luxembourg 3.7 3.6 3.5 -6.4 -5.2 -0.2 -2.7 -1.6 3.3 -1.0 -11.0
Hungary 3.7 3.2 3.2 -3.7 -5.3 -1.3 0.0 -2.1 1.9 -0.2 -9.7
Malta 5.6 4.5 4.0 -6.5 -6.7 -0.9 -0.9 -2.2 3.0 -0.2 -12.9
Netherlands 3.1 2.3 1.9 -3.2 -4.5 -1.7 -0.1 -2.2 0.2 -2.1 -8.9
Austria 2.8 1.9 1.6 -3.9 -4.4 -0.7 -1.2 -2.5 0.9 -2.7 -8.6
Poland 3.6 3.2 3.0 -2.5 -4.5 -3.0 1.1 -1.3 0.0 -0.2 -9.4
Portugal 2.3 1.9 1.7 -3.4 -4.9 -1.9 -1.1 -3.0 -0.2 -4.3 -9.7
Romania 4.4 3.4 2.7 -4.7 -5.0 -1.9 -0.3 -1.6 0.8 -1.0 -10.7
Slovenia 4.2 3.6 3.4 -4.9 -5.3 -1.2 -0.7 -1.7 2.2 -0.2 -10.5
Slovakia 4.3 4.7 3.8 -4.8 -6.2 -2.1 -0.5 -1.5 1.7 -0.4 -12.1
Finland 2.6 1.5 1.4 -3.4 -4.1 -1.3 -0.8 -2.6 0.1 -3.3 -8.4
Sweden 2.7 2.0 1.7 -5.8 -8.0 -3.3 -3.1 -6.0 -1.7 -10.4 -15.9
United Kingdom 1.6 1.7 1.7 -4.5 -3.9 0.1 -2.8 -2.2 1.8 -3.3 -8.0
Euro area 2.3 1.9 1.7 -3.1 -3.9 -1.2 -0.9 -2.0 0.5 -2.4 -7.8
European Union 2.2 1.9 1.8 -3.5 -4.1 -1.1 -1.2 -2.2 0.7 -2.7 -8.3
Norway 2.3 2.2 1.9 -3.4 -3.2 -1.1 -1.1 -1.0 0.8 -1.4 -7.4
United States 2.3 1.9 1.8 -2.7 -2.5 1.3 -0.3 -0.6 3.1 2.2 -3.8
Japan 0.7 0.8 0.2 -1.8 -1.2 0.3 -1.1 -0.4 0.5 -1.0 -2.6
Canada 2.1 1.7 1.7 -1.8 -2.1 0.9 0.3 -0.5 2.6 2.4 -3.0
Switzerland 1.3 1.6 1.7 -1.5 -1.3 0.2 -0.1 0.3 1.9 2.1 -2.5
Australia & New Zealand 2.9 2.9 2.8 -1.4 -1.4 -0.7 1.6 1.5 2.1 5.2 -3.4
Turkey 3.5 3.5 3.5 -4.3 -1.6 0.0 -0.8 1.9 3.5 4.6 -5.6
Russia 1.6 1.5 1.5 -3.5 -1.9 0.6 -1.9 -0.4 2.1 -0.2 -4.7
Emerging Asia 6.5 6.5 6.5 -3.3 -1.6 0.3 3.1 4.8 6.8 15.5 -4.3
China 6.5 6.3 6.2 -2.8 -1.6 0.4 3.7 4.7 6.6 15.7 -3.8
India 7.4 7.8 7.9 -3.8 -2.1 -0.1 3.6 5.7 7.8 18.0 -5.6
Latin America 1.9 2.4 2.6 -3.0 -1.6 1.2 -1.1 0.8 3.8 3.5 -3.4
Brazil 1.5 2.0 2.0 -3.3 -1.6 1.5 -1.8 0.4 3.5 2.0 -3.4
Mexico 1.9 2.3 2.7 -2.6 -2.0 1.2 -0.8 0.4 3.9 3.5 -3.3
Chile 2.5 2.7 2.9 -3.0 -1.5 0.9 -0.5 1.3 3.8 4.6 -3.5
Rest of the World 3.5 3.4 3.5 -3.2 -1.9 0.1 0.2 1.5 3.6 5.4 -4.8
Baseline growth (%)Growth rate deviations
(percentage points)Adverse growth (%)
Adverse
cumulative
growth (%)
Level
deviation
2020 (%)
Notes: Projections from the national central banks (NCBs) are used as baseline forecasts for EU countries. The
baseline for Norway was provided by Norges Bank. For other non-EU countries the baseline projections are based on
6 In all tables the number reported for each year corresponds to the annual average.

|10
projections from the October 2017 IMF World Economic Outlook (WEO).
In order to ensure an adequate level of severity for the adverse scenario across all EU countries, the GDP level for each
country is below the starting point in 2017 at the end of the stress test horizon in 2020 (i.e. the cumulative GDP growth
under the adverse scenario is negative for all countries). To this end, additional domestic real and financial shocks have
been applied to the following countries: Bulgaria, Ireland, Croatia, Cyprus, Latvia, Luxembourg, Hungary, Malta, Poland,
Slovenia and Slovakia. These additional shocks increase the severity of the GDP deviation from baseline for these
countries so that the cumulative GDP growth under the adverse scenario is negative. These shocks are not intended to
reflect any specific imbalance or any increase in the sensitivity of those countries to a given shock.
|11
4.2. Unemployment rate
2018 2019 2020 2018 2019 2020 2018 2019 2020
Belgium 7.0 6.9 6.9 0.4 2.5 4.7 7.4 9.4 11.6 4.7
Bulgaria 5.5 5.2 5.1 1.0 2.3 2.1 6.5 7.5 7.2 2.3
Czech Republic 2.6 2.6 2.6 0.3 0.9 1.1 2.9 3.5 3.7 1.1
Denmark 5.1 5.0 4.8 1.3 4.5 6.3 6.4 9.5 11.1 6.3
Germany 3.3 3.1 2.9 0.9 2.4 3.2 4.2 5.5 6.1 3.2
Estonia 7.2 7.9 7.9 1.5 4.1 6.0 8.7 12.0 13.9 6.0
Ireland 5.4 4.9 4.8 0.9 3.1 4.6 6.4 8.0 9.4 4.6
Greece 19.9 18.3 16.6 0.7 1.7 2.5 20.6 20.0 19.1 2.5
Spain 14.8 13.1 11.4 0.6 2.8 4.0 15.4 15.9 15.4 4.0
France 9.6 9.2 8.8 0.1 0.6 1.5 9.7 9.8 10.2 1.5
Croatia 10.4 9.4 8.5 1.1 2.9 4.1 11.5 12.3 12.6 4.1
Italy 11.1 10.8 10.5 0.3 1.1 2.2 11.3 11.9 12.7 2.2
Cyprus 9.8 8.2 7.0 0.7 2.4 3.8 10.5 10.5 10.8 3.8
Latvia 8.4 8.1 7.8 1.1 2.6 3.9 9.5 10.7 11.7 3.9
Lithuania 6.8 6.7 6.6 0.7 1.9 1.9 7.5 8.6 8.4 1.9
Luxembourg 5.7 5.6 5.4 0.1 0.7 0.8 5.9 6.3 6.3 0.8
Hungary 3.9 3.9 3.9 -0.2 1.5 2.3 3.8 5.4 6.2 2.3
Malta 4.3 4.4 4.6 0.1 0.7 1.0 4.3 5.1 5.6 1.0
Netherlands 3.9 3.5 3.4 0.3 2.3 4.6 4.3 5.8 8.0 4.6
Austria 5.1 5.1 5.0 0.5 1.4 2.1 5.6 6.4 7.1 2.1
Poland 4.1 4.0 4.1 0.6 3.2 5.1 4.8 7.2 9.2 5.1
Portugal 7.8 6.7 6.1 0.6 2.5 4.2 8.4 9.2 10.3 4.2
Romania 5.1 5.1 5.2 0.3 0.7 0.8 5.3 5.8 6.1 0.8
Slovenia 6.0 5.5 5.2 1.0 3.3 4.6 7.0 8.8 9.8 4.6
Slovakia 7.5 6.8 6.2 0.8 3.1 4.4 8.3 9.9 10.6 4.4
Finland 8.1 7.8 7.6 0.5 1.9 3.1 8.6 9.8 10.6 3.1
Sweden 6.5 6.5 6.6 1.4 4.4 5.9 7.9 10.9 12.5 5.9
United Kingdom 4.2 4.2 4.3 2.0 3.9 4.5 6.2 8.1 8.8 4.5
Euro area 8.4 7.8 7.3 0.5 1.9 3.0 8.9 9.7 10.3 3.0
European Union 7.1 6.7 6.4 0.7 2.3 3.3 7.9 9.0 9.7 3.3
Norway 3.7 3.4 3.3 0.9 2.3 3.0 4.6 5.7 6.3 3.0
United States 4.1 4.2 4.4 0.3 1.4 2.9 4.3 5.6 7.3 2.9
Switzerland 3.0 3.0 2.9 0.3 0.8 1.6 3.2 3.7 4.5 1.6
Turkey 10.7 10.4 10.4 0.5 1.4 2.6 11.2 11.8 13.0 2.6
Russia 5.5 5.5 5.5 1.1 2.8 4.4 6.6 8.3 9.9 4.4
China 4.0 4.0 4.0 0.1 0.4 0.8 4.1 4.4 4.8 0.8
Brazil 11.8 11.0 10.4 0.6 2.1 4.2 12.4 13.1 14.6 4.2
Mexico 3.7 3.6 3.5 0.2 0.5 1.4 3.9 4.1 4.9 1.4
Chile 6.8 6.5 6.4 0.5 1.7 3.2 7.3 8.2 9.6 3.2
Baseline rate (%)Rate deviations
(percentage points)Adverse rate (%) Maximum deviation
(percentage points)
Notes: Projections from the NCBs are used as baseline forecasts for EU countries. The baseline for Norway was
provided by Norges Bank. For other non-EU countries, the baseline projections are based on projections from the
October 2017 IMF WEO.
|12
4.3. HICP and other consumption price indices
2018 2019 2020 2018 2019 2020 2018 2019 2020
Belgium 1.6 1.6 1.6 -0.4 -1.8 -1.5 1.3 -0.1 0.1 1.2 -3.6
Bulgaria 1.4 1.7 1.8 -0.5 -1.3 -0.2 0.8 0.4 1.5 2.8 -2.0
Czech Republic 2.4 1.9 1.9 -0.1 -2.1 -5.5 2.3 -0.2 -3.6 -1.6 -7.4
Denmark 1.4 1.7 1.8 -0.1 -0.7 -1.3 1.2 1.0 0.5 2.7 -2.1
Germany 1.6 1.7 1.9 -0.1 -0.8 -1.7 1.5 0.9 0.3 2.6 -2.5
Estonia 3.6 2.5 2.3 -0.3 -1.1 -1.4 3.3 1.4 1.0 5.7 -2.7
Ireland 0.7 0.9 1.4 -0.2 -1.3 -2.2 0.4 -0.4 -0.8 -0.8 -3.7
Greece 0.9 1.0 1.1 -0.8 -2.0 -3.0 0.0 -1.1 -1.8 -2.8 -5.7
Spain 1.5 1.4 1.7 -0.5 -1.4 -1.3 1.0 0.0 0.3 1.3 -3.1
France 1.4 1.2 1.6 -0.3 -1.1 -1.3 1.1 0.1 0.3 1.5 -2.7
Croatia 1.5 1.5 1.6 1.6 -0.9 -2.7 3.1 0.6 -1.1 2.5 -2.0
Italy 0.9 1.5 1.6 -0.1 -0.7 -1.7 0.8 0.8 -0.1 1.5 -2.5
Cyprus 1.3 1.3 1.6 -0.3 -1.8 -2.2 1.0 -0.4 -0.6 -0.1 -4.1
Latvia 3.3 2.7 2.5 -0.5 -1.3 -1.3 2.8 1.4 1.2 5.5 -2.9
Lithuania 2.6 2.0 2.0 -0.7 -1.7 -2.1 1.9 0.2 -0.1 2.0 -4.4
Luxembourg 1.5 1.8 2.0 -0.1 -0.4 -0.7 1.4 1.4 1.2 4.1 -1.2
Hungary 2.5 2.9 2.9 0.3 -1.1 -2.4 2.7 1.8 0.6 5.2 -3.1
Malta 1.6 1.8 2.0 -0.1 -0.9 -2.2 1.5 0.9 -0.3 2.2 -3.2
Netherlands 1.4 2.3 2.0 -0.1 -0.4 -2.0 1.3 1.9 -0.1 3.2 -2.4
Austria 2.1 1.9 1.9 -0.2 -0.9 -1.2 1.9 1.0 0.7 3.7 -2.2
Poland 2.2 2.6 2.5 0.3 -0.9 -2.5 2.6 1.7 0.0 4.4 -3.0
Portugal 1.5 1.4 1.6 -0.5 -2.2 -2.2 1.0 -0.9 -0.7 -0.5 -4.8
Romania 3.4 3.1 2.9 -0.3 -3.0 -5.8 3.1 0.1 -3.0 0.1 -8.7
Slovenia 1.4 2.0 2.2 -0.6 -2.0 -1.9 0.8 0.0 0.3 1.1 -4.4
Slovakia 2.4 2.0 2.3 -0.8 -2.1 -1.9 1.6 -0.2 0.5 1.9 -4.6
Finland 1.1 1.4 1.5 -0.2 -1.0 -1.7 0.8 0.4 -0.2 1.1 -2.9
Sweden 1.9 2.1 2.1 -3.3 -3.8 -1.9 -1.4 -1.8 0.1 -3.0 -8.7
United Kingdom 2.5 2.2 2.2 -0.6 -2.2 -2.7 1.9 0.1 -0.5 1.4 -5.3
Euro area 1.4 1.5 1.7 -0.2 -1.0 -1.6 1.2 0.5 0.1 1.8 -2.8
European Union 1.7 1.7 1.9 -0.4 -1.3 -1.9 1.3 0.4 0.0 1.7 -3.5
Norway 1.9 1.8 2.1 -0.7 -1.4 -2.0 1.2 0.4 0.1 1.7 -4.0
United States 2.1 2.6 2.4 -1.0 -1.8 -0.4 1.1 0.8 2.0 4.0 -3.1
Switzerland 0.6 0.9 0.9 -0.4 -0.6 -0.8 0.2 0.3 0.1 0.5 -1.8
Turkey 9.3 8.8 7.9 -0.5 -0.5 -0.8 8.8 8.3 7.1 26.2 -1.6
Russia 3.9 4.0 4.0 0.0 -1.0 -0.8 3.9 3.0 3.2 10.5 -1.7
China 2.4 2.5 2.6 -0.8 -1.5 -0.8 1.6 1.0 1.8 4.5 -3.0
Brazil 4.0 4.1 4.1 -0.4 -0.6 -0.6 3.6 3.5 3.5 11.0 -1.5
Mexico 3.8 3.1 3.0 -0.8 -0.6 -0.7 3.0 2.5 2.3 8.0 -2.0
Chile 2.7 3.0 3.0 -0.8 -1.9 -1.0 1.9 1.1 2.0 5.1 -3.6
Baseline growth (%)Growth rate deviations
(percentage points)Adverse growth (%)
Adverse
cumulative
growth (%)
Level
deviation
2020 (%)
Notes: Projections from the NCBs are used as baseline forecasts for EU countries. The baseline for Norway was
provided by Norges Bank. For other non-EU countries, the baseline projections are based on projections from the
October 2017 IMF WEO.

|13
4.4. Residential real estate prices
2018 2019 2020 2018 2019 2020 2018 2019 2020
Belgium 2.2 1.9 1.6 -17.0 -16.1 -4.3 -14.8 -14.2 -2.7 -28.9 -32.8
Bulgaria 8.4 10.2 10.8 -12.2 -12.4 -4.9 -3.8 -2.2 5.8 -0.5 -24.8
Czech Republic 11.1 8.7 8.7 -15.9 -14.4 -3.9 -4.7 -5.7 4.7 -5.9 -28.3
Denmark 2.9 2.8 2.4 -12.6 -19.3 -7.1 -9.8 -16.4 -4.7 -28.1 -33.6
Germany 4.8 4.0 3.8 -13.6 -13.5 -3.6 -8.8 -9.5 0.2 -17.3 -26.9
Estonia 7.6 5.5 5.8 -27.1 -25.4 -9.0 -19.5 -19.8 -3.3 -37.6 -48.0
Ireland 7.1 5.4 4.9 -8.4 -7.9 -6.3 -1.3 -2.4 -1.4 -5.1 -19.8
Greece -0.5 0.5 1.0 -6.8 -7.2 -4.6 -7.3 -6.7 -3.6 -16.6 -17.4
Spain 5.2 4.9 4.7 -4.6 -13.2 -11.8 0.6 -8.3 -7.2 -14.3 -25.8
France 3.7 3.5 3.8 -15.3 -12.9 0.0 -11.6 -9.4 3.8 -16.9 -25.4
Croatia 3.1 1.3 1.6 -5.9 -8.2 -4.4 -2.8 -6.9 -2.8 -12.1 -17.2
Italy 1.5 2.2 2.6 -8.9 -7.1 -2.7 -7.3 -4.9 -0.1 -12.0 -17.3
Cyprus 3.0 3.5 3.5 -9.7 -8.4 -2.3 -6.7 -4.9 1.2 -10.2 -18.6
Latvia 5.9 6.2 3.0 -27.3 -24.9 -2.8 -21.4 -18.8 0.2 -36.0 -44.7
Lithuania 4.2 4.7 4.7 -19.2 -17.9 -9.7 -15.0 -13.2 -5.0 -29.9 -38.6
Luxembourg 6.3 6.4 6.1 -25.0 -23.0 -2.6 -18.7 -16.6 3.6 -29.8 -41.5
Hungary 12.6 12.6 12.6 -16.9 -18.0 -2.6 -4.3 -5.4 10.0 -0.4 -30.3
Malta 5.0 4.1 3.2 -15.1 -21.0 -16.4 -10.0 -16.9 -13.2 -35.2 -42.5
Netherlands 7.1 5.2 3.9 -9.8 -11.7 -7.7 -2.7 -6.4 -3.8 -12.5 -25.2
Austria 3.3 3.2 3.3 -22.4 -21.2 -2.8 -19.1 -18.1 0.5 -33.3 -39.4
Poland 6.5 2.2 1.0 -5.6 -6.1 -5.9 0.9 -4.0 -4.9 -7.9 -16.2
Portugal 4.4 3.8 3.8 -8.6 -9.9 -5.2 -4.2 -6.2 -1.4 -11.3 -21.2
Romania 7.4 5.9 5.9 -12.4 -9.8 -5.2 -5.1 -3.9 0.7 -8.2 -23.7
Slovenia 6.3 5.8 5.5 -13.2 -13.1 -3.1 -6.9 -7.4 2.5 -11.6 -25.5
Slovakia 3.8 3.6 3.2 -11.9 -11.3 -1.8 -8.1 -7.7 1.4 -14.0 -22.5
Finland 2.2 1.9 2.1 -11.6 -12.5 -4.0 -9.4 -10.6 -1.9 -20.5 -25.2
Sweden 6.3 4.8 4.2 -33.7 -32.8 -7.3 -27.4 -28.0 -3.1 -49.4 -56.4
United Kingdom 2.7 3.1 3.2 -18.5 -17.4 -5.2 -15.9 -14.3 -2.0 -29.3 -35.3
Euro area 4.0 3.6 3.6 -12.2 -12.2 -4.1 -8.2 -8.6 -0.5 -16.5 -25.2
European Union 4.1 3.7 3.6 -13.8 -13.5 -4.4 -9.6 -9.8 -0.8 -19.1 -27.7
Norway -1.6 2.9 4.2 -29.5 -17.5 0.0 -31.1 -14.6 4.2 -38.7 -41.9
United States 5.4 5.4 5.4 -20.5 -15.3 0.0 -15.0 -9.9 5.4 -19.2 -31.1
Switzerland 1.1 1.1 1.1 -18.7 -13.9 0.0 -17.6 -12.8 1.1 -27.4 -29.7
Turkey 13.0 13.0 13.0 -14.5 -9.8 0.0 -1.5 3.1 13.0 14.8 -20.4
Russia -0.9 -0.9 -0.9 -15.9 -11.2 0.0 -16.8 -12.1 -0.9 -27.5 -25.5
China 1.7 1.7 1.7 -16.3 -11.6 0.0 -14.6 -9.9 1.7 -21.8 -25.6
Brazil 0.9 0.9 0.9 -16.5 -11.8 0.0 -15.7 -10.9 0.9 -24.2 -26.2
Mexico 6.2 6.2 6.2 -14.8 -10.2 0.0 -8.6 -4.1 6.2 -6.9 -22.2
Chile 6.1 6.1 6.1 -17.4 -12.6 0.0 -11.3 -6.5 6.1 -12.1 -26.3
Baseline growth (%)Growth rate deviations
(percentage points)Adverse growth (%)
Adverse
cumulative
growth (%)
Level
deviation
2020 (%)
Notes: Projections from the NCBs are used as baseline forecasts for EU countries. The baseline for Norway was
provided by Norges Bank. For other non-EU countries, the baseline projections are based on ECB staff calculations
based on historical series from the OECD Economic Outlook.

|14
4.5. Commercial real estate prices
2018 2019 2020 2018 2019 2020 2018 2019 2020
Belgium 1.6 1.6 1.6 -16.5 -12.1 -5.5 -14.9 -10.5 -3.9 -26.9 -30.2
Bulgaria 9.6 8.8 8.1 -12.0 -10.3 -8.6 -2.4 -1.5 -0.5 -4.3 -25.8
Czech Republic 9.7 8.8 8.1 -14.9 -12.1 -9.2 -5.2 -3.3 -1.1 -9.4 -29.8
Denmark 2.5 2.4 2.4 -19.7 -14.9 -7.1 -17.2 -12.5 -4.8 -31.0 -35.8
Germany 4.0 3.8 3.7 -14.6 -11.0 -6.3 -10.6 -7.1 -2.6 -19.1 -27.8
Estonia 6.1 5.7 5.4 -25.4 -20.1 -11.0 -19.3 -14.4 -5.6 -34.8 -44.9
Ireland 5.8 5.4 5.2 -10.4 -8.3 -6.2 -4.6 -2.9 -1.0 -8.3 -21.8
Greece 0.3 0.3 0.3 -9.5 -6.4 -2.5 -9.2 -6.1 -2.2 -16.6 -17.4
Spain 4.6 4.4 4.2 -13.5 -10.2 -6.3 -8.9 -5.9 -2.1 -16.1 -26.1
France 3.4 3.3 3.2 -14.5 -10.8 -5.9 -11.1 -7.5 -2.7 -20.0 -27.5
Croatia 1.8 1.8 1.8 -9.6 -6.9 -3.5 -7.8 -5.1 -1.8 -14.0 -18.5
Italy 2.0 1.9 1.9 -9.8 -7.0 -3.7 -7.8 -5.1 -1.8 -14.1 -18.9
Cyprus 3.1 3.0 3.0 -11.7 -8.7 -4.9 -8.5 -5.6 -2.0 -15.4 -22.7
Latvia 4.8 4.6 4.4 -24.9 -19.7 -10.3 -20.1 -15.1 -5.9 -36.2 -44.2
Lithuania 4.3 4.1 4.0 -21.3 -16.4 -8.6 -17.0 -12.3 -4.7 -30.6 -38.6
Luxembourg 6.1 5.7 5.4 -19.2 -14.8 -8.8 -13.1 -9.1 -3.3 -23.7 -35.5
Hungary 11.0 9.9 9.0 -13.4 -11.4 -9.5 -2.4 -1.5 -0.5 -4.3 -28.1
Malta 3.9 3.7 3.6 -18.2 -13.8 -7.3 -14.3 -10.0 -3.7 -25.8 -33.5
Netherlands 5.3 5.0 4.8 -13.7 -10.5 -6.7 -8.4 -5.5 -1.9 -15.1 -26.7
Austria 3.1 3.0 3.0 -17.8 -13.3 -6.8 -14.6 -10.3 -3.8 -26.3 -32.7
Poland 2.9 2.9 2.8 -8.7 -6.5 -4.1 -5.8 -3.7 -1.3 -10.4 -17.6
Portugal 4.0 3.9 3.7 -12.0 -9.1 -5.6 -8.0 -5.2 -1.8 -14.3 -23.6
Romania 6.1 5.7 5.4 -12.1 -9.6 -6.8 -6.0 -3.9 -1.3 -10.9 -24.6
Slovenia 5.7 5.4 5.1 -13.5 -10.5 -6.9 -7.8 -5.1 -1.8 -14.1 -26.6
Slovakia 3.3 3.2 3.1 -13.0 -9.6 -5.4 -9.6 -6.4 -2.3 -17.3 -24.8
Finland 1.9 1.9 1.8 -16.1 -11.8 -5.5 -14.2 -9.9 -3.7 -25.6 -29.6
Sweden 4.8 4.6 4.4 -28.6 -23.3 -12.1 -23.8 -18.7 -7.7 -42.8 -50.0
United Kingdom 2.8 2.7 2.6 -19.2 -14.5 -7.1 -16.4 -11.8 -4.5 -29.5 -35.0
Euro area 3.0 2.9 2.9 -12.9 -9.5 -5.2 -9.8 -6.5 -2.3 -17.7 -24.5
European Union 3.2 3.1 3.0 -14.4 -10.7 -5.8 -11.1 -7.5 -2.7 -20.0 -27.1
Norway -1.4 2.6 3.8 -26.5 -15.7 0.0 -27.9 -13.1 3.8 -35.0 -38.0
United States 5.1 4.9 4.7 -14.2 -13.9 -4.7 -9.1 -9.0 0.0 -17.3 -28.3
Switzerland 1.0 1.0 0.9 -14.1 -14.2 -0.9 -13.2 -13.2 0.0 -24.6 -26.7
Turkey 13.2 11.7 10.5 -6.7 -5.4 -10.5 6.5 6.3 0.0 13.3 -18.9
Russia -0.8 -0.8 -0.8 -12.3 -12.5 0.8 -13.1 -13.3 0.0 -24.7 -22.8
China 1.5 1.5 1.5 -11.8 -11.8 -1.5 -10.3 -10.3 0.0 -19.5 -23.1
Brazil 0.8 0.8 0.8 -12.3 -12.4 -0.8 -11.5 -11.6 0.0 -21.8 -23.6
Mexico 5.9 5.6 5.3 -9.0 -8.7 -5.3 -3.1 -3.1 0.0 -6.2 -20.3
Chile 5.8 5.5 5.2 -11.4 -11.0 -5.2 -5.6 -5.5 0.0 -10.8 -24.0
Baseline growth (%)Growth rate deviations
(percentage points)Adverse growth (%)
Adverse
cumulative
growth (%)
Level
deviation
2020 (%)
Note: The baseline for all countries has been projected by ECB staff. Both baseline and adverse have been derived
using the same satellite model (see reference in footnote 6).
|15
4.6. Stock prices
2018 2019 2020
Belgium -27.8 -25.4 -20.1
Bulgaria -24.2 -22.1 -17.5
Czech Republic -23.5 -21.4 -17.0
Denmark -24.9 -22.7 -18.0
Germany -30.6 -27.9 -22.1
Estonia -22.3 -20.4 -16.2
Ireland -29.7 -27.1 -21.4
Greece -30.9 -28.2 -22.2
Spain -33.8 -30.8 -24.3
France -32.2 -29.4 -23.2
Croatia -23.5 -21.4 -17.0
Italy -34.6 -31.5 -24.9
Cyprus -29.6 -27.0 -21.3
Latvia -23.6 -21.5 -17.1
Lithuania -11.0 -10.1 -8.1
Luxembourg -25.8 -23.6 -18.7
Hungary -28.3 -25.8 -20.4
Malta -21.5 -19.7 -15.6
Netherlands -29.6 -27.0 -21.3
Austria -32.2 -29.4 -23.2
Poland -23.6 -21.6 -17.1
Portugal -29.0 -26.5 -20.9
Romania -18.4 -16.8 -13.4
Slovenia -22.1 -20.2 -16.0
Slovakia -21.2 -19.3 -15.3
Finland -27.5 -25.1 -19.9
Sweden -26.4 -24.1 -19.0
United Kingdom -27.0 -24.6 -19.5
Euro area -31.4 -28.7 -22.6
European Union -29.9 -27.2 -21.5
Norway -27.7 -25.1 -19.7
United States -41.4 -33.9 -23.4
Switzerland -21.0 -17.2 -11.9
Turkey -28.5 -23.3 -16.1
Russia -36.9 -30.2 -20.9
China -32.3 -26.4 -18.3
Brazil -29.1 -23.8 -16.5
Mexico -21.0 -17.2 -11.9
Chile -17.8 -14.6 -10.1
Deviation from the baseline (%)
Note: Under the baseline, stock prices are assumed to remain unchanged.

|16
4.7. Long-term rates
Starting point
rates (%)
2017 2018 2019 2020 2018 2019 2020 2018 2019 2020
Belgium 0.7 0.8 1.0 1.3 73 74 70 1.5 1.8 2.0
Bulgaria 1.8 1.8 1.9 2.1 58 60 56 2.3 2.5 2.7
Czech Republic 1.0 1.3 1.7 2.2 67 68 64 2.0 2.4 2.8
Denmark 0.6 0.6 0.9 1.2 53 55 52 1.2 1.4 1.7
Germany 0.4 0.5 0.7 0.9 62 64 60 1.1 1.4 1.5
Estonia 0 0 0 0.0 0.0 0.0
Ireland 0.8 1.0 1.3 1.5 82 84 79 1.8 2.1 2.3
Greece 6.1 5.5 5.7 6.0 131 133 126 6.8 7.1 7.2
Spain 1.6 1.7 2.1 2.4 115 118 111 2.9 3.3 3.5
France 0.8 0.7 1.0 1.3 76 78 73 1.5 1.8 2.0
Croatia 2.8 2.7 2.9 3.2 58 60 56 3.3 3.5 3.8
Italy 2.1 2.1 2.5 2.8 121 124 117 3.3 3.7 4.0
Cyprus 1.9 1.2 1.4 1.6 77 79 74 2.0 2.2 2.3
Latvia 0.8 0.8 1.1 1.3 59 60 56 1.4 1.7 1.9
Lithuania 0.8 1.2 1.8 2.3 78 80 75 1.9 2.6 3.1
Luxembourg 0.6 0.7 0.9 1.1 84 86 81 1.5 1.8 1.9
Hungary 3.1 3.8 4.1 4.4 62 64 61 4.4 4.8 5.0
Malta 1.4 1.5 1.7 1.9 63 64 60 2.1 2.3 2.6
Netherlands 0.5 0.6 0.9 1.1 65 66 63 1.3 1.5 1.7
Austria 0.6 0.7 0.9 1.1 79 81 76 1.5 1.7 1.9
Poland 3.4 4.0 3.7 3.9 76 78 74 4.8 4.5 4.6
Portugal 3.2 2.3 2.8 3.2 137 140 132 3.7 4.2 4.5
Romania 3.9 4.4 5.1 6.1 57 58 55 5.0 5.7 6.7
Slovenia 1.0 1.0 1.3 1.6 64 65 62 1.6 2.0 2.2
Slovakia 1.0 0.9 1.2 1.4 77 79 74 1.7 2.0 2.2
Finland 0.5 0.6 0.9 1.1 74 76 72 1.4 1.6 1.8
Sweden 0.6 1.1 1.7 2.2 71 73 69 1.8 2.4 2.9
United Kingdom 1.2 1.4 1.6 1.8 87 89 84 2.3 2.5 2.6
Euro area 1.1 1.1 1.4 1.6 84 86 81 1.9 2.2 2.5
European Union 1.2 1.3 1.6 1.8 83 85 80 2.1 2.4 2.6
Norway 1.6 1.6 1.6 1.9 62 81 77 2.2 2.4 2.7
United States 2.3 2.8 3.3 3.4 235 145 30 5.1 4.7 3.7
Switzerland -0.1 -0.1 0.0 0.2 29 18 4 0.2 0.2 0.2
Turkey 11.0 9.7 9.2 8.4 76 47 10 10.5 9.7 8.5
Russia 7.9 4.5 4.5 4.5 45 28 6 4.9 4.7 4.5
China 4.2 6.5 5.0 5.0 6 4 1 6.6 5.1 5.0
Brazil 10.3 10.4 11.0 11.3 42 26 5 10.8 11.2 11.4
Mexico 7.1 7.2 7.3 7.3 62 38 8 7.8 7.6 7.3
Chile 4.2 4.6 4.9 4.9 18 11 2 4.7 5.1 5.0
Deviation from the baseline
(basis points)Baseline rates (%) Adverse rates (%)
Notes: Due to absence of liquid benchmark bonds issued by Estonia, paths of long-term interest rates are not provided
for this country. The baseline projections for the EU countries are based on market data and on ECB staff computations
and, in the case of the non-euro area EU countries, on NCBs’ technical assumptions as well. Given different cut-off
dates, these projections may differ in some cases from the rate assumptions underpinning the projections of the
macroeconomic variables. The starting point rates in 2017 are based on market data and, thereafter, the path of the
technical assumptions has been applied. The baseline forecasts for other countries are ECB staff calculations based on
market data.
|17
4.8. Exchange rates
Notes: Under the baseline, exchange rates are assumed to remain unchanged. Positive shocks imply an appreciation of the euro.
4.9. Foreign demand and commodity prices
2018 2019 2020
Oil prices -0.6 -4.3 -9.9
Non-oil commodity prices -1.6 -4.9 -8.7
Global metal prices -0.2 -2.6 -8.0
EU foreign demand -6.6 -9.3 -7.6
Euro area foreign demand -5.7 -8.1 -6.4
Non-euro area competitor's export prices -0.4 -3.5 -8.1
Level deviation from baseline (%)
Note: Under the baseline, commodity prices are assumed to remain unchanged.
2018 2019 2020
EURCZK 8.0 6.7 4.7
EURHRK 14.6 12.2 8.6
EURHUF 11.6 9.8 6.8
EURPLN 10.7 9.0 6.3
EURRON 7.4 6.2 4.4
EURCHF -8.0 -6.7 -4.7
EURUSD 0.0 0.0 0.0
Deviations from baseline (%)
|18
4.10. SWAP rates
Starting
point rates
(%)
2017 2018 2019 2020 2018 2019 2020 2018 2019 2020
1M -0.37 -0.35 -0.15 0.17 44 37 31 0.09 0.22 0.48
3M -0.33 -0.31 -0.13 0.15 55 47 39 0.24 0.34 0.54
1Y -0.24 -0.17 0.02 0.30 56 48 40 0.39 0.50 0.70
2Y -0.16 -0.03 0.17 0.45 56 49 41 0.53 0.66 0.86
3Y 0.02 0.11 0.32 0.60 57 49 42 0.68 0.82 1.02
5Y 0.20 0.39 0.63 0.91 58 51 44 0.97 1.14 1.34
7Y 0.50 0.67 0.93 1.21 59 52 46 1.26 1.45 1.67
10Y 0.81 1.09 1.39 1.66 59 54 48 1.68 1.92 2.14
20Y 1.08 1.45 1.85 2.21 60 54 48 2.04 2.39 2.70
30Y 1.45 1.93 2.46 2.95 60 54 48 2.53 3.00 3.44
1M 0.29 0.74 0.97 1.12 44 37 31 1.18 1.34 1.43
3M 0.38 0.98 1.28 1.48 55 47 39 1.53 1.75 1.87
1Y 0.52 1.04 1.34 1.56 55 47 39 1.59 1.81 1.95
2Y 0.72 1.10 1.41 1.64 54 47 39 1.64 1.87 2.03
3Y 0.84 1.17 1.47 1.72 53 46 39 1.70 1.94 2.11
5Y 1.02 1.29 1.60 1.88 52 46 39 1.81 2.06 2.27
7Y 1.15 1.42 1.73 2.04 51 45 40 1.93 2.18 2.44
10Y 1.33 1.60 1.92 2.28 49 44 39 2.09 2.36 2.68
20Y 1.64 1.92 2.29 2.73 49 44 39 2.40 2.73 3.12
30Y 2.03 2.37 2.84 3.37 49 44 39 2.86 3.28 3.77
1M -0.33 -0.31 -0.10 0.22 44 37 31 0.13 0.27 0.52
3M -0.26 -0.25 -0.08 0.17 55 47 39 0.30 0.39 0.56
1Y -0.08 -0.08 0.10 0.37 56 48 40 0.47 0.58 0.77
2Y 0.00 0.08 0.29 0.57 56 49 41 0.64 0.77 0.98
3Y 0.12 0.24 0.47 0.76 57 49 42 0.81 0.97 1.18
5Y 0.39 0.57 0.84 1.16 58 51 44 1.15 1.35 1.60
7Y 0.67 0.90 1.21 1.55 59 53 46 1.49 1.73 2.01
10Y 1.05 1.39 1.76 2.14 60 54 48 1.99 2.30 2.63
20Y 1.42 1.76 2.24 2.72 60 54 48 2.36 2.78 3.21
30Y 1.80 2.23 2.83 3.44 60 54 48 2.83 3.37 3.93
1M 0.46 0.44 0.47 0.53 44 37 31 0.87 0.84 0.84
3M 0.61 0.58 0.62 0.70 55 47 39 1.13 1.09 1.09
1Y 0.78 0.83 1.01 1.13 57 49 41 1.40 1.50 1.54
2Y 0.98 1.07 1.40 1.56 59 52 44 1.66 1.92 2.00
3Y 1.39 1.31 1.79 2.00 62 54 46 1.93 2.33 2.46
5Y 2.05 1.80 2.57 2.86 66 58 51 2.46 3.15 3.37
7Y 2.49 2.29 3.35 3.73 70 63 55 2.99 3.98 4.28
10Y 3.02 3.02 4.52 5.02 76 69 61 3.78 5.21 5.64
20Y 3.93 3.93 5.88 6.53 76 69 61 4.69 6.57 7.15
30Y 5.11 5.11 7.65 8.49 76 69 62 5.87 8.34 9.11
1M 0.13 0.15 0.18 0.22 44 37 31 0.59 0.55 0.53
3M 0.16 0.19 0.22 0.27 55 47 39 0.74 0.69 0.66
1Y 0.25 0.46 0.52 0.58 59 51 43 1.04 1.03 1.01
2Y 0.43 0.72 0.81 0.89 63 55 47 1.35 1.36 1.36
3Y 0.64 0.99 1.11 1.20 66 58 50 1.66 1.69 1.70
5Y 1.16 1.53 1.70 1.82 74 66 58 2.27 2.36 2.40
7Y 1.70 2.07 2.29 2.44 82 74 65 2.89 3.03 3.09
10Y 2.38 2.88 3.18 3.38 93 84 75 3.81 4.02 4.13
20Y 3.06 3.56 3.93 4.17 93 84 75 4.49 4.77 4.93
30Y 3.74 4.35 4.80 5.10 93 85 76 5.28 5.65 5.86
DKK
HRK
HUF
Baseline rates (%)Deviations from baseline
(basis points)Adverse rates (%)
EUR
CZK
Notes: One-month and three-month rates refer to interbank money market rates. The baseline projections for the 3-
month rates for the EU countries are based on market data and ECB staff computations and, in the case of the non-
euro area EU countries, on NCBs’ technical assumptions as well. Given different cut-off dates, these projections may
differ in some cases from the rate assumptions underpinning the projections of the macroeconomic variables. The
starting point rates in 2017 are based on market data and, thereafter, the path of the technical assumptions has been
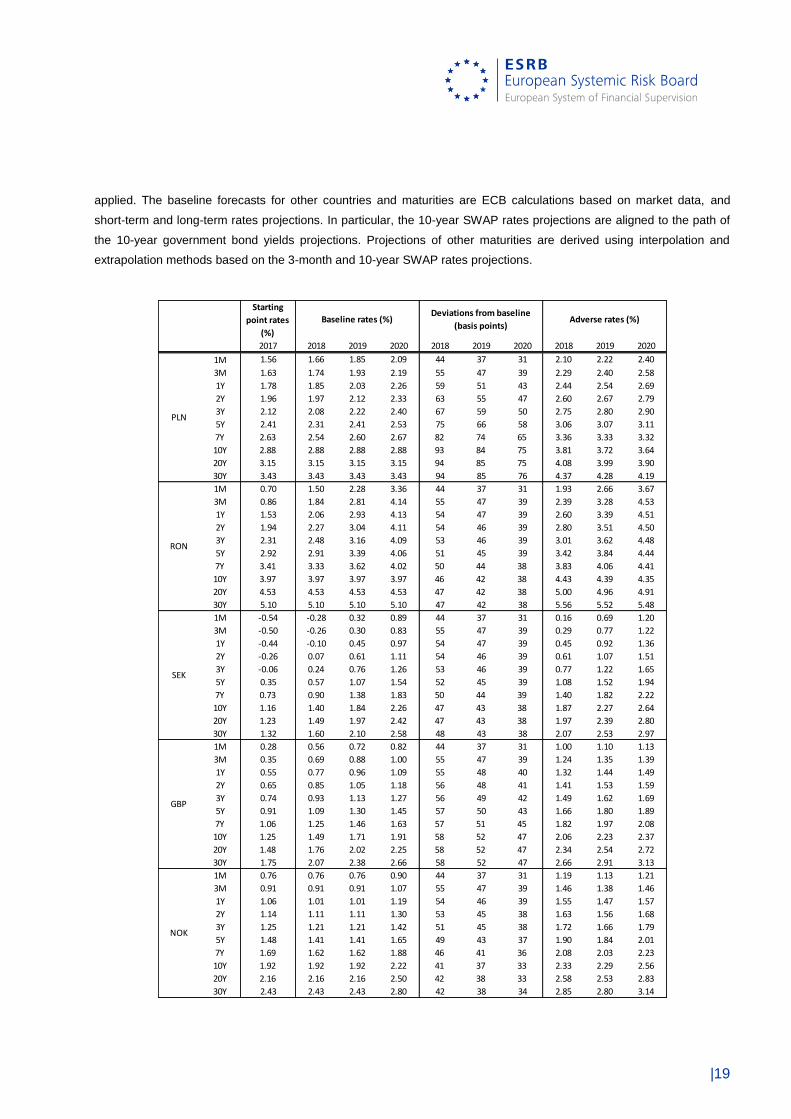
|19
applied. The baseline forecasts for other countries and maturities are ECB calculations based on market data, and
short-term and long-term rates projections. In particular, the 10-year SWAP rates projections are aligned to the path of
the 10-year government bond yields projections. Projections of other maturities are derived using interpolation and
extrapolation methods based on the 3-month and 10-year SWAP rates projections.
Starting
point rates
(%)
2017 2018 2019 2020 2018 2019 2020 2018 2019 2020
1M 1.56 1.66 1.85 2.09 44 37 31 2.10 2.22 2.40
3M 1.63 1.74 1.93 2.19 55 47 39 2.29 2.40 2.58
1Y 1.78 1.85 2.03 2.26 59 51 43 2.44 2.54 2.69
2Y 1.96 1.97 2.12 2.33 63 55 47 2.60 2.67 2.79
3Y 2.12 2.08 2.22 2.40 67 59 50 2.75 2.80 2.90
5Y 2.41 2.31 2.41 2.53 75 66 58 3.06 3.07 3.11
7Y 2.63 2.54 2.60 2.67 82 74 65 3.36 3.33 3.32
10Y 2.88 2.88 2.88 2.88 93 84 75 3.81 3.72 3.64
20Y 3.15 3.15 3.15 3.15 94 85 75 4.08 3.99 3.90
30Y 3.43 3.43 3.43 3.43 94 85 76 4.37 4.28 4.19
1M 0.70 1.50 2.28 3.36 44 37 31 1.93 2.66 3.67
3M 0.86 1.84 2.81 4.14 55 47 39 2.39 3.28 4.53
1Y 1.53 2.06 2.93 4.13 54 47 39 2.60 3.39 4.51
2Y 1.94 2.27 3.04 4.11 54 46 39 2.80 3.51 4.50
3Y 2.31 2.48 3.16 4.09 53 46 39 3.01 3.62 4.48
5Y 2.92 2.91 3.39 4.06 51 45 39 3.42 3.84 4.44
7Y 3.41 3.33 3.62 4.02 50 44 38 3.83 4.06 4.41
10Y 3.97 3.97 3.97 3.97 46 42 38 4.43 4.39 4.35
20Y 4.53 4.53 4.53 4.53 47 42 38 5.00 4.96 4.91
30Y 5.10 5.10 5.10 5.10 47 42 38 5.56 5.52 5.48
1M -0.54 -0.28 0.32 0.89 44 37 31 0.16 0.69 1.20
3M -0.50 -0.26 0.30 0.83 55 47 39 0.29 0.77 1.22
1Y -0.44 -0.10 0.45 0.97 54 47 39 0.45 0.92 1.36
2Y -0.26 0.07 0.61 1.11 54 46 39 0.61 1.07 1.51
3Y -0.06 0.24 0.76 1.26 53 46 39 0.77 1.22 1.65
5Y 0.35 0.57 1.07 1.54 52 45 39 1.08 1.52 1.94
7Y 0.73 0.90 1.38 1.83 50 44 39 1.40 1.82 2.22
10Y 1.16 1.40 1.84 2.26 47 43 38 1.87 2.27 2.64
20Y 1.23 1.49 1.97 2.42 47 43 38 1.97 2.39 2.80
30Y 1.32 1.60 2.10 2.58 48 43 38 2.07 2.53 2.97
1M 0.28 0.56 0.72 0.82 44 37 31 1.00 1.10 1.13
3M 0.35 0.69 0.88 1.00 55 47 39 1.24 1.35 1.39
1Y 0.55 0.77 0.96 1.09 55 48 40 1.32 1.44 1.49
2Y 0.65 0.85 1.05 1.18 56 48 41 1.41 1.53 1.59
3Y 0.74 0.93 1.13 1.27 56 49 42 1.49 1.62 1.69
5Y 0.91 1.09 1.30 1.45 57 50 43 1.66 1.80 1.89
7Y 1.06 1.25 1.46 1.63 57 51 45 1.82 1.97 2.08
10Y 1.25 1.49 1.71 1.91 58 52 47 2.06 2.23 2.37
20Y 1.48 1.76 2.02 2.25 58 52 47 2.34 2.54 2.72
30Y 1.75 2.07 2.38 2.66 58 52 47 2.66 2.91 3.13
1M 0.76 0.76 0.76 0.90 44 37 31 1.19 1.13 1.21
3M 0.91 0.91 0.91 1.07 55 47 39 1.46 1.38 1.46
1Y 1.06 1.01 1.01 1.19 54 46 39 1.55 1.47 1.57
2Y 1.14 1.11 1.11 1.30 53 45 38 1.63 1.56 1.68
3Y 1.25 1.21 1.21 1.42 51 45 38 1.72 1.66 1.79
5Y 1.48 1.41 1.41 1.65 49 43 37 1.90 1.84 2.01
7Y 1.69 1.62 1.62 1.88 46 41 36 2.08 2.03 2.23
10Y 1.92 1.92 1.92 2.22 41 37 33 2.33 2.29 2.56
20Y 2.16 2.16 2.16 2.50 42 38 33 2.58 2.53 2.83
30Y 2.43 2.43 2.43 2.80 42 38 34 2.85 2.80 3.14
Baseline rates (%)Deviations from baseline
(basis points)
NOK
Adverse rates (%)
PLN
RON
SEK
GBP
|20
Starting
point rates
(%)
2017 2018 2019 2020 2018 2019 2020 2018 2019 2020
1M 1.08 1.29 1.53 1.60 63 88 118 1.92 2.41 2.79
3M 1.24 1.47 1.75 1.83 68 90 116 2.15 2.65 2.99
1Y 1.42 1.59 1.90 1.98 68 86 105 2.27 2.75 3.03
2Y 1.60 1.72 2.04 2.14 103 123 144 2.74 3.28 3.58
3Y 1.74 1.84 2.19 2.29 123 141 156 3.07 3.60 3.86
5Y 1.94 2.09 2.49 2.61 163 178 188 3.72 4.27 4.49
7Y 2.09 2.33 2.79 2.92 174 181 183 4.08 4.60 4.74
10Y 2.25 2.70 3.23 3.38 209 206 198 4.79 5.29 5.37
20Y 2.46 2.94 3.52 3.69 209 197 180 5.03 5.49 5.49
30Y 2.68 3.21 3.84 4.02 209 187 163 5.30 5.71 5.65
1M -0.79 -0.79 -0.52 -0.52 16 14 11 -0.63 -0.38 -0.40
3M -0.73 -0.73 -0.48 -0.48 20 17 14 -0.53 -0.31 -0.34
1Y -0.66 -0.63 -0.35 -0.29 21 19 16 -0.41 -0.16 -0.13
2Y -0.60 -0.53 -0.21 -0.10 23 20 17 -0.30 -0.01 0.07
3Y -0.50 -0.43 -0.08 0.09 25 22 19 -0.18 0.13 0.28
5Y -0.28 -0.23 0.18 0.47 28 25 22 0.05 0.43 0.68
7Y -0.07 -0.03 0.45 0.85 31 28 24 0.28 0.72 1.09
10Y 0.20 0.27 0.84 1.41 35 31 28 0.62 1.16 1.70
20Y 0.29 0.39 1.22 2.05 35 31 28 0.74 1.54 2.33
30Y 0.42 0.57 1.77 2.98 35 32 28 0.92 2.09 3.26
1M 12.22 10.73 10.20 9.27 20 17 15 10.94 10.37 9.41
3M 12.41 10.90 10.35 9.41 26 22 18 11.16 10.57 9.59
1Y 12.33 10.80 10.26 9.32 28 24 20 11.08 10.50 9.52
2Y 12.15 10.71 10.17 9.22 30 26 22 11.01 10.42 9.44
3Y 11.96 10.62 10.07 9.13 31 28 24 10.93 10.35 9.37
5Y 11.76 10.43 9.89 8.94 35 31 27 10.78 10.20 9.22
7Y 11.61 10.24 9.70 8.76 39 35 31 10.63 10.05 9.06
10Y 11.47 9.96 9.42 8.48 44 39 35 10.40 9.81 8.83
20Y 11.33 9.84 9.30 8.37 44 40 35 10.28 9.70 8.73
30Y 11.19 9.72 9.19 8.27 44 40 35 10.16 9.59 8.62
1M 8.89 5.00 5.00 5.00 37 32 27 5.38 5.32 5.27
3M 8.66 4.87 4.87 4.87 47 40 34 5.34 5.28 5.21
1Y 8.19 4.88 4.88 4.88 46 40 33 5.35 5.28 5.21
2Y 7.61 4.89 4.89 4.89 45 39 33 5.35 5.28 5.22
3Y 7.29 4.90 4.90 4.90 45 38 33 5.35 5.29 5.23
5Y 6.95 4.92 4.92 4.92 43 37 32 5.35 5.29 5.24
7Y 6.72 4.94 4.94 4.94 40 36 31 5.35 5.30 5.26
10Y 6.48 4.98 4.98 4.98 37 33 30 5.34 5.31 5.27
20Y 6.18 4.74 4.74 4.74 37 33 30 5.11 5.08 5.04
30Y 5.89 4.52 4.52 4.52 37 33 30 4.89 4.85 4.82
1M 9.30 9.37 9.91 10.25 8 7 6 9.44 9.98 10.30
3M 9.30 9.37 9.91 10.25 10 8 7 9.47 10.00 10.32
1Y 9.30 9.46 10.01 10.35 12 10 9 9.58 10.12 10.44
2Y 9.30 9.56 10.12 10.46 13 12 10 9.70 10.23 10.56
3Y 9.79 9.66 10.22 10.56 15 13 12 9.81 10.35 10.68
5Y 10.28 9.86 10.42 10.77 19 17 15 10.04 10.59 10.92
7Y 10.28 10.05 10.63 10.98 22 20 18 10.27 10.82 11.16
10Y 10.28 10.35 10.93 11.29 26 24 21 10.61 11.17 11.51
20Y 10.28 10.35 10.93 11.29 27 24 21 10.61 11.17 11.51
30Y 10.28 10.35 10.93 11.29 27 24 22 10.61 11.18 11.51
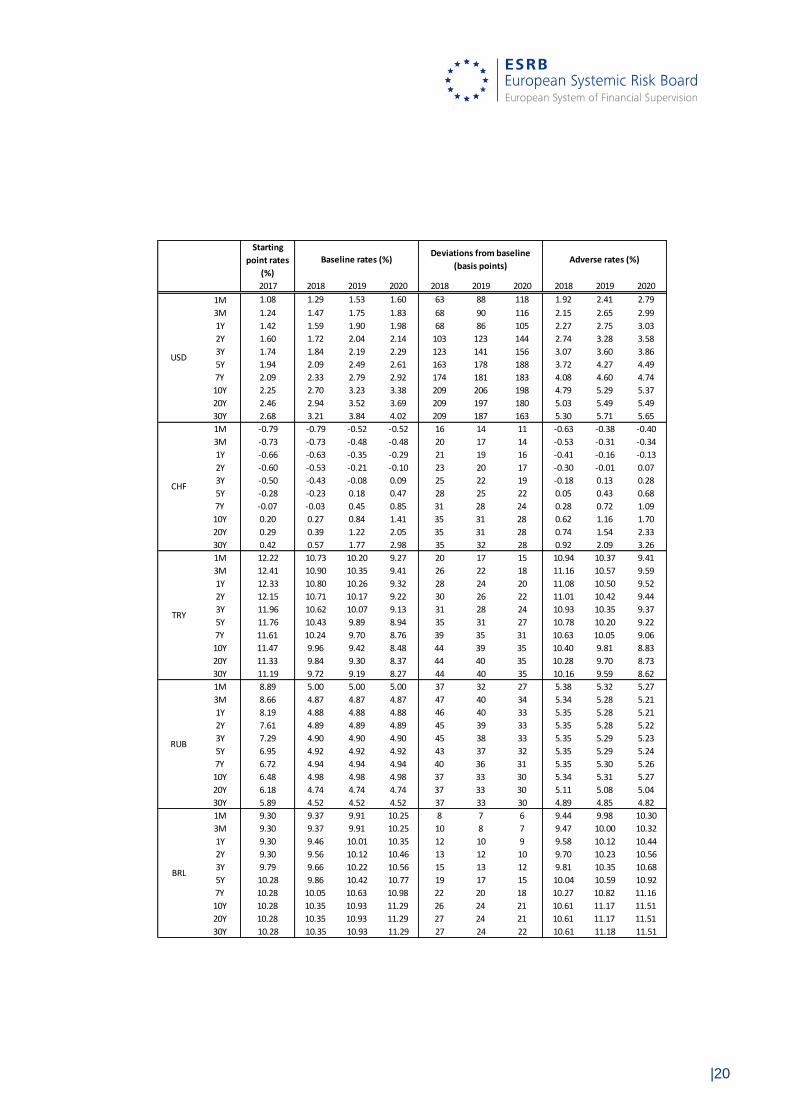
BRL
Baseline rates (%)Deviations from baseline
(basis points)Adverse rates (%)
USD
CHF
TRY
RUB

|21
Starting
point rates
(%)
2017 2018 2019 2020 2018 2019 2020 2018 2019 2020
1M 6.68 6.91 6.42 6.42 20 17 14 7.11 6.59 6.56
3M 6.84 7.08 6.58 6.58 25 22 18 7.33 6.80 6.76
1Y 7.27 7.12 6.63 6.63 29 25 21 7.41 6.88 6.84
2Y 7.20 7.17 6.69 6.69 32 28 24 7.49 6.97 6.93
3Y 7.21 7.21 6.74 6.74 36 31 27 7.57 7.05 7.01
5Y 7.27 7.30 6.84 6.84 42 38 33 7.72 7.22 7.17
7Y 7.40 7.38 6.95 6.95 49 44 39 7.87 7.39 7.34
10Y 7.46 7.51 7.11 7.11 58 53 47 8.09 7.64 7.58
20Y 7.58 7.63 7.22 7.22 59 53 47 8.22 7.75 7.70
30Y 7.70 7.75 7.34 7.34 59 53 48 8.34 7.87 7.81
1M 2.71 2.66 3.18 3.18 3 3 2 2.69 3.21 3.20
3M 2.65 2.60 3.11 3.11 4 4 3 2.64 3.15 3.14
1Y 2.60 2.79 3.26 3.26 6 6 5 2.85 3.32 3.31
2Y 2.78 2.98 3.41 3.41 9 8 7 3.06 3.49 3.48
3Y 3.04 3.16 3.57 3.57 11 10 9 3.27 3.66 3.65
5Y 3.49 3.54 3.87 3.87 15 14 12 3.69 4.01 3.99
7Y 3.83 3.91 4.17 4.17 20 18 16 4.11 4.35 4.33
10Y 4.13 4.47 4.63 4.63 26 23 21 4.73 4.86 4.84
20Y 4.39 4.76 4.92 4.92 26 23 21 5.02 5.16 5.13
30Y 4.67 5.06 5.23 5.23 26 24 21 5.32 5.47 5.44
1M 1.62 1.91 1.99 2.20 18 16 13 2.10 2.14 2.33
3M 1.74 2.06 2.13 2.37 23 20 16 2.28 2.33 2.53
1Y 1.96 2.19 2.27 2.52 28 24 20 2.46 2.51 2.72
2Y 2.09 2.32 2.41 2.67 32 28 24 2.64 2.69 2.91
3Y 2.23 2.45 2.55 2.82 37 33 28 2.82 2.87 3.10
5Y 2.47 2.72 2.82 3.12 46 41 36 3.18 3.24 3.49
7Y 2.66 2.99 3.10 3.43 55 50 44 3.54 3.60 3.87
10Y 2.88 3.39 3.51 3.88 68 62 55 4.07 4.13 4.43
20Y 3.12 3.67 3.81 4.21 69 62 55 4.36 4.43 4.76
30Y 3.38 3.98 4.13 4.56 69 62 55 4.67 4.75 5.12
1M 1.07 1.26 1.53 1.94 7 6 5 1.33 1.59 1.99
3M 1.13 1.34 1.61 2.05 8 7 6 1.42 1.69 2.11
1Y 1.26 1.44 1.73 2.18 13 12 10 1.57 1.84 2.28
2Y 1.39 1.54 1.84 2.32 18 16 14 1.72 2.00 2.45
3Y 1.51 1.64 1.96 2.45 23 20 18 1.87 2.16 2.63
5Y 1.69 1.84 2.18 2.71 32 29 26 2.17 2.47 2.97
7Y 1.83 2.05 2.41 2.98 42 37 34 2.46 2.78 3.31
10Y 2.05 2.35 2.75 3.38 55 50 45 2.90 3.25 3.82
20Y 2.26 2.59 3.03 3.72 55 50 45 3.15 3.53 4.17
30Y 2.49 2.86 3.34 4.10 55 50 45 3.41 3.85 4.55
1M 0.51 0.59 0.75 0.81 3 2 2 0.62 0.77 0.83
3M 0.87 1.01 1.27 1.37 3 3 2 1.04 1.30 1.39
1Y 1.13 1.17 1.51 1.63 5 5 4 1.22 1.55 1.67
2Y 1.38 1.34 1.74 1.88 7 7 6 1.41 1.80 1.94
3Y 1.57 1.50 1.97 2.14 10 8 7 1.60 2.05 2.21
5Y 1.83 1.83 2.43 2.65 14 12 11 1.97 2.55 2.76
7Y 1.99 2.16 2.89 3.16 18 16 14 2.34 3.05 3.31
10Y 2.16 2.65 3.59 3.93 23 21 19 2.88 3.80 4.12
20Y 2.38 2.92 3.96 4.34 23 21 19 3.16 4.17 4.53
30Y 2.63 3.23 4.37 4.79 24 21 19 3.46 4.58 4.98
Baseline rates (%)Deviations from baseline
(basis points)
HKD
MXN
CLP
AUD
CAD
Adverse rates (%)
|22
Starting point
rates (%)
2017 2018 2019 2020 2018 2019 2020 2018 2019 2020
1M 6.99 6.99 6.99 6.99 6 5 5 7.05 7.04 7.03
3M 7.22 7.22 7.22 7.22 8 7 6 7.30 7.29 7.28
1Y 7.14 7.30 7.30 7.30 10 9 7 7.40 7.39 7.38
2Y 7.13 7.38 7.38 7.38 12 11 9 7.51 7.49 7.47
3Y 7.22 7.46 7.46 7.46 14 13 11 7.61 7.59 7.57
5Y 7.49 7.62 7.62 7.62 18 17 14 7.81 7.79 7.77
7Y 7.74 7.78 7.78 7.78 23 21 18 8.01 7.99 7.96
10Y 8.02 8.02 8.02 8.02 28 25 22 8.30 8.27 8.25
20Y 8.13 8.13 8.13 8.13 28 25 23 8.41 8.39 8.36
30Y 8.25 8.25 8.25 8.25 28 25 23 8.53 8.50 8.48
Baseline rates (%)Deviations from baseline
(basis points)Adverse rates (%)
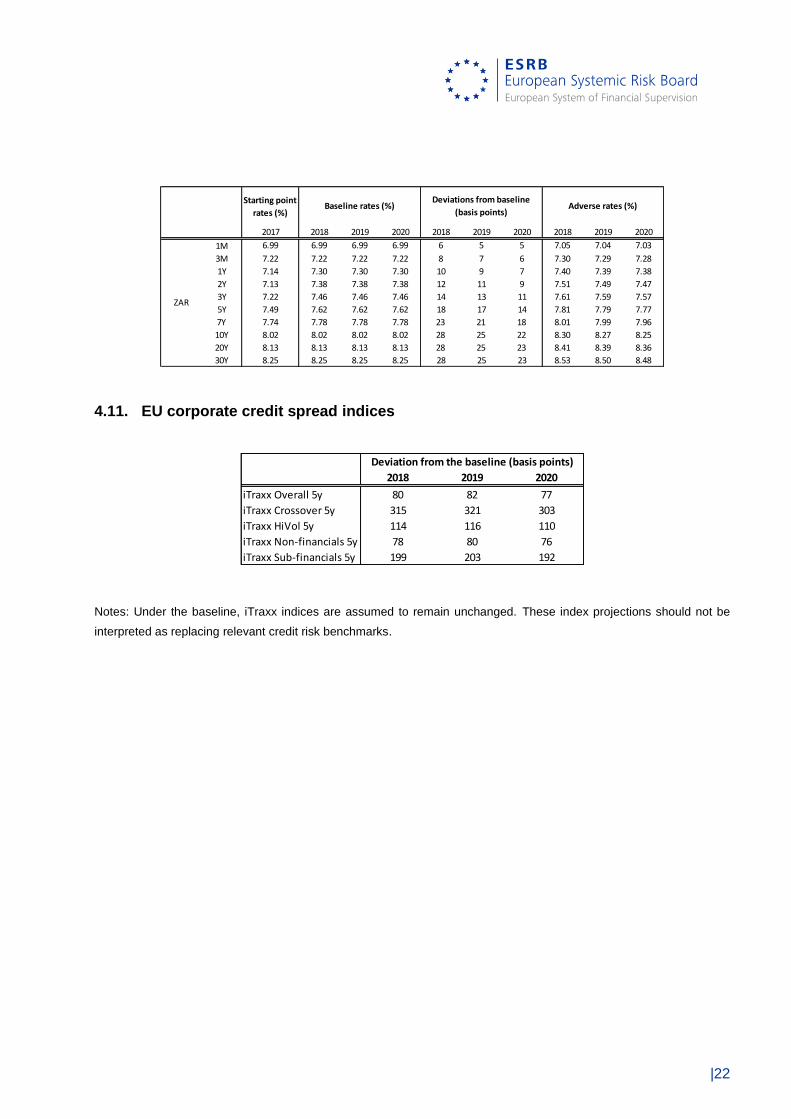
ZAR
4.11. EU corporate credit spread indices
2018 2019 2020
iTraxx Overall 5y 80 82 77
iTraxx Crossover 5y 315 321 303
iTraxx HiVol 5y 114 116 110
iTraxx Non-financials 5y 78 80 76
iTraxx Sub-financials 5y 199 203 192
Deviation from the baseline (basis points)
Notes: Under the baseline, iTraxx indices are assumed to remain unchanged. These index projections should not be
interpreted as replacing relevant credit risk benchmarks.