adverse vascular risk is related to cognitive decline in older
DESCRIPTION
ArtículoTRANSCRIPT

Adverse Vascular Risk is Related to Cognitive Decline in Older Adults
Angela L. Jefferson, PhD1, Timothy J. Hohman, PhD1, Dandan Liu, PhD2, Shereen Haj-Hassan, MS1, Katherine A. Gifford, PsyD1, Elleena M. Benson1, Jeannine S. Skinner, PhD3, Zengqi Lu, MS2, Jamie Sparling, MD4,5, Emily C. Sumner, MS1, Susan Bell, MBBS, MSCI1,6,7, and Frederick L. Ruberg, MD4,8
1Vanderbilt Memory & Alzheimer’s Center, Department of Neurology, Vanderbilt University Medical Center, Nashville, TN
2Department of Biostatistics, Vanderbilt University School of Medicine, Nashville, TN
3Vanderbilt-Meharry Alliance, Nashville, TN
4Boston University School of Medicine, Boston, MA
5Newton Wellesley Hospital, Department of Medicine, Newton, MA
6Division of Cardiovascular Medicine, Department of Medicine, Vanderbilt University School of Medicine, Nashville, TN
7Center for Quality Aging, Department of Medicine, Vanderbilt University School of Medicine, Nashville, TN
8Section of Cardiovascular Medicine, Boston Medical Center, Boston, MA
Abstract
Background—Cardiovascular disease (CVD) and related risk factors are associated with
Alzheimer’s disease (AD). This association is less well-defined in normal cognition (NC) or
prodromal AD (mild cognitive impairment (MCI)).
Objective—Cross-sectionally and longitudinally relate a vascular risk index to cognitive
outcomes among elders free of clinical dementia.
Methods—3117 MCI (74±8 years, 56% female) and 6603 NC participants (72±8 years, 68%
female) were drawn from the National Alzheimer’s Coordinating Center. A composite measure of
vascular risk was defined using the Framingham Stroke Risk Profile (FSRP) score (i.e., age,
systolic blood pressure, anti-hypertensive medication, diabetes, cigarette smoking, CVD history,
atrial fibrillation). Ordinary linear regressions and generalized linear mixed models related
baseline FSRP to cross-sectional and longitudinal cognitive outcomes, separately for NC and
MCI, adjusting for age, sex, race, education, and follow-up time (in longitudinal models).
Address Correspondence: Angela L. Jefferson, PhD, Department of Neurology, Vanderbilt University Medical Center, 2525 West End Ave, 12th Floor, Suite 1200, Nashville, TN 37203, Phone: 615-322-8676, Fax: 615-875-2727, [email protected].
DisclosuresNone
NIH Public AccessAuthor ManuscriptJ Alzheimers Dis. Author manuscript; available in PMC 2015 February 21.
Published in final edited form as:J Alzheimers Dis. 2015 January 1; 44(4): 1361–1373. doi:10.3233/JAD-141812.
NIH
-PA
Author M
anuscriptN
IH-P
A A
uthor Manuscript
NIH
-PA
Author M
anuscript
Results—In NC participants, increasing FSRP was related to worse baseline global cognition,
information processing speed, and sequencing abilities (p-values<0.0001) and a worse
longitudinal trajectory on all cognitive measures (p-values<0.0001). In MCI, increasing FSRP
correlated with worse longitudinal delayed memory (p=0.004). In secondary models using an age-
excluded FSRP score, associations persisted in NC participants for global cognition, naming,
information processing speed, and sequencing abilities.
Conclusions—An adverse vascular risk profile is associated with worse cognitive trajectory,
especially global cognition, naming, and information processing speed, among NC elders. Future
studies are needed to understand how effective management of CVD and related risk factors can
modify cognitive decline to identify the ideal timeframe for primary prevention implementation.
Keywords
Blood pressure; diabetes mellitus; smoking; Framingham Stroke Risk Profile; stroke
Introduction
Established vascular risk factors, such as hypertension [1], diabetes mellitus [2], and
cigarette smoking [3], are associated with increased risk for Alzheimer’s disease (AD). The
mechanism by which poor vascular health relates to AD is likely multifactorial with
possibilities including cerebral blood flow alterations [4], impaired clearance of
neuropathological substrates across the blood-brain barrier [5], and neural vulnerability from
vascular-related injury in both gray and white matter [6,7].
Vascular risk factors also relate to worse cognitive performance prior to the onset of clinical
AD [8,9]. Among older adults free of clinical dementia and stroke, elevations in a common
vascular risk index (i.e. the Framingham Stroke Risk Profile (FSRP)) [10] are cross-
sectionally [10] and longitudinally [11] associated with worse executive function, verbal
fluency, abstract reasoning, attention, and visuospatial episodic memory performance. In
contrast, for verbal episodic memory performance, some studies have reported cross-
sectional associations with FSRP [12,13], but a majority of longitudinal studies have failed
to detect a significant association [8,11,14]. Such disparate findings highlight the need for
additional work using more stringent longitudinal methods. For example, inconsistencies in
the literature may be due to cohort differences in vascular risk profiles, as studies
demonstrating no effect tend to come from younger cohorts at lower risk [9,11,14], while
studies demonstrating an effect or mixed effect tend to have higher baseline age [13] or
variability in FSRP [12]. Finally, a majority of studies are limited to individuals free of
clinical dementia and stroke but fail to consider diagnostic variations within the cognitive
aging spectrum prior to the onset of dementia (i.e., cognitively normal controls (NC) or
individuals with mild cognitive impairment (MCI), a precursor to AD [15]). Collectively,
existing findings have implicated FSRP in cognitive decline in NC but have not offered a
comprehensive understanding on how such relations differ in older adults with MCI versus
NC.
This study aims to reconcile discrepancies in the literature while expanding our current
understanding of vascular health and cognitive performance among older adults by cross-
Jefferson et al. Page 2
J Alzheimers Dis. Author manuscript; available in PMC 2015 February 21.
NIH
-PA
Author M
anuscriptN
IH-P
A A
uthor Manuscript
NIH
-PA
Author M
anuscript

sectionally and longitudinally analyzing a robust national dataset with over 9000
participants. We consider both cross-sectional and longitudinal analyses, we include
participants representing two key phases of the cognitive aging spectrum (i.e., normal
cognition and MCI), and we leverage an integrative vascular risk index rather than taking a
more traditional “silo” approach that focuses on a single risk factor, such as blood pressure.
We hypothesized that worse vascular risk would be associated with a decline in cognitive
performance among both groups, particularly in domains known to be affected by
microvascular disease (i.e., episodic memory, information processing speed, and executive
function) [16–18]. In light of our prior work highlighting the incremental value of
examining vascular health in a categorical manner versus just as a continuous variable [19],
we considered vascular risk both as a continuous and a categorical predictor.
Methods
Participants
The National Alzheimer's Coordinating Center (NACC) maintains a database of participant
information collected from 34 past and present National Institute on Aging-funded
Alzheimer’s Disease Centers. In 2005, NACC implemented the Uniform Data Set (UDS), a
standard data collection protocol, including clinical, medical history, neurological, and
neuropsychological results [20]. Participants between 55 and 90 years of age evaluated
between 9/01/2005 and 3/01/2014 with a diagnosis at first UDS visit of NC or MCI were
included in the current study. Participant selection and exclusion details (n=9720) are
provided in Figure 1. This study was approved by the local Institutional Review Board prior
to data access or analysis.
Cognitive Diagnostic Classification
Cognitive diagnosis for each participant is based upon clinician judgment or a multi-
disciplinary consensus team using information from the comprehensive UDS work-up,
including:
1. NC is defined by Clinical Dementia Rating (CDR) [21]=0 (no dementia), no
deficits in activities of daily living that could be directly attributable to cognitive
impairment, and no evidence of cognitive impairment defined as standard scores
equal to or more than −1.5 standard deviations from age-adjusted normative mean
[22].
2. MCI determinations are based upon Peterson et al. criteria [23] and defined as a
CDR score 0.0 to 1.0 (reflecting mild severity of impairment), relatively spared
activities of daily living, objective cognitive impairment in at least one cognitive
domain (i.e., performances equal to or more than −1.5 standard deviations from the
age-adjusted normative mean) or a significant decline over time on the
neuropsychological evaluation, and absence of a dementing syndrome.
Framingham Stroke Risk Profile (FSRP)
To assess systemic vascular health, we calculated a FSRP at baseline [12,24], which assigns
points for age, systolic blood pressure (accounting for anti-hypertensive treatment), history
Jefferson et al. Page 3
J Alzheimers Dis. Author manuscript; available in PMC 2015 February 21.
NIH
-PA
Author M
anuscriptN
IH-P
A A
uthor Manuscript
NIH
-PA
Author M
anuscript

of diabetes, current cigarette smoking, prevalent cardiovascular disease (defined as history
of myocardial infarction, angina pectoris, coronary insufficiency, intermittent claudication,
or congestive heart failure), history of atrial fibrillation, and left ventricular hypertrophy.
FSRP values range from 0 to 38 with higher values indicating worse vascular health risk
(e.g., increased stroke risk). Note that the FSRP calculation is modified here because ECG
measures (i.e., identifying left ventricular hypertrophy) are not available for NACC
participants. In light of our prior work highlighting the incremental value of examining
vascular health in a categorical manner versus just as a continuous variable [19], we
considered FSRP both as a continuous and a categorical predictor.
Neuropsychological Assessment
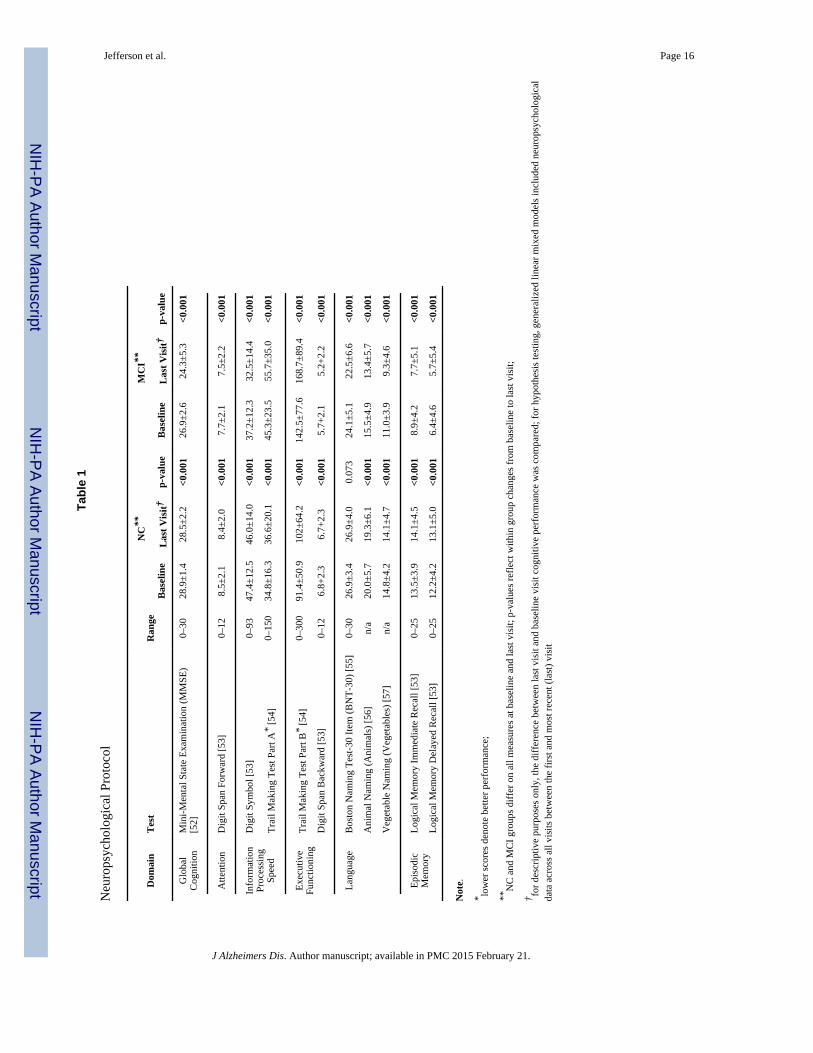
Participants completed a protocol assessing multiple cognitive systems [22].
Neuropsychological performance, neurological examination results, and medical history
details were used to diagnose participants at baseline. See Table 1 for more details on the
neuropsychological protocol.
Statistical Analyses
Descriptive statistics for baseline clinical, baseline cognitive, and last visit cognitive
variables were calculated for each diagnostic group (NC, MCI) and compared between
groups using Kruskal-Wallis (for continuous variables) and Pearson’s chi-square tests (for
categorical variables). For descriptive purposes only, the difference between last visit and
baseline cognitive variables was compared to illustrate whether cognitive performance
worsened over time in either group. Within each group, baseline clinical and cognitive
variables were compared across FSRP quartile subgroups obtained from the combined
population. Significance was set a priori at 0.05.
Prior to analyses, based on histogram evidence of a skewed distribution, logarithm
transformations were taken for Trail Making Test Part A plus 1 and Trail Making Test Part
B plus 1 to give each variable a more symmetrical distribution. Ordinary least squares
regressions were used to relate FSRP first as a continuous variable and then as a categorical
variable (i.e., FSRP Quartile group 1 (referent): 0–8, Quartile group 2: >8–11, Quartile
group 3: >11–14, and Quartile group 4: >14–29) to cross-sectional cognitive variables.
Generalized linear mixed models (GLMM) were used to model FSRP effects on longitudinal
neuropsychological trajectories using neuropsychological data available across all visits
between the first and most recent (last) UDS visit. Fixed effects for all models included
baseline clinical characteristics (i.e., age, sex, education, race). For longitudinal models,
follow-up period (i.e., time from first to most recent UDS visit) was also included as a fixed
effect, and random effects included subject-specific intercept and slope for follow-up time.
Histograms and residual plots were used to determine appropriate link function for GLMM.
For modeling longitudinal trajectories, the identity link function was used for all outcomes.
Because age and sex are included in the FSRP calculation and age and sex were included as
model covariates given their potential to independently confound neuropsychological
performance, we assessed the impact of multicollinearity on results. First, we generated
Spearman correlation coefficients between age (years) and FSRP score separately by
Jefferson et al. Page 4
J Alzheimers Dis. Author manuscript; available in PMC 2015 February 21.
NIH
-PA
Author M
anuscriptN
IH-P
A A
uthor Manuscript
NIH
-PA
Author M
anuscript
diagnosis. Because results suggested potential multicollinearity (NC r=0.74; MCI r=0.63),
we applied a more formal method of detection for multicollinearity using variance inflation
factor (VIF). Results by diagnosis yielded a VIF<2.2 for all three variables, well below the
suggested VIF>5 for defining multicollinearity [25]. Though multicollinearity was not
detected, in post-hoc analyses, models were re-calculated using an age-excluded FSRP score
to assess the effect of the remaining stroke risk factors on neuropsychological performance
independent of age.
Significance was set a priori using a strict Bonferroni correction factor for each set of
analyses (i.e., 0.0045 for 0.05/11 models per group). Analyses were conducted using R
2.14.1 (www.r-project.org). Note, for all results, a negative beta coefficient reflects worse
cross-sectional performance or trajectory over time except for Trail Making Test Parts A and
B, where positive beta coefficients reflect worse outcomes (i.e., both measures are speeded
tasks).
Results
Participant Characteristics
At baseline, participants in the NC and MCI groups differed on all clinical characteristics,
including age (F(1 ,9718)=145, p<0.001), sex (χ2=150, p<0.001), race (χ2=5.3, p=0.02),
education (F(1,9718)=59, p<0.001), follow-up period (F(1,9718)=221, p<0.001) and number
of observations (F(1,9718)=217, p<0.001). See Table 2. In addition, the NC and MCI groups
differed on all cognitive variables at baseline, last visit, and changes over follow-up (all p-
values<0.001). See Table 1 for baseline and longitudinal descriptive statistics for each
diagnostic group.
Within each diagnostic group, participants differed on certain clinical characteristics when
broken down into FSRP quartiles (see Table 3). Within the NC group, differences included
baseline age (F(3,6599)=2333, p<0.001), race (χ2=28, p<0.001), education (F(3,6599)=74,
p<0.001), follow-up period (F(3,6599)=7.6, p<0.001), and number of observations
(F(3,6599)=11, p<0.001). Within MCI, differences included baseline age (F(3,3113)=664,
p<0.001), race (χ2=17, p=0.001), education (F(3,3113)=11, p<0.001), and number of follow-
up visits (F(3,3113)=2.6, p=0.048). Within each diagnostic category, participants differed on
virtually all neuropsychological tests when examining across or between FSRP quartiles (see
Table 3).
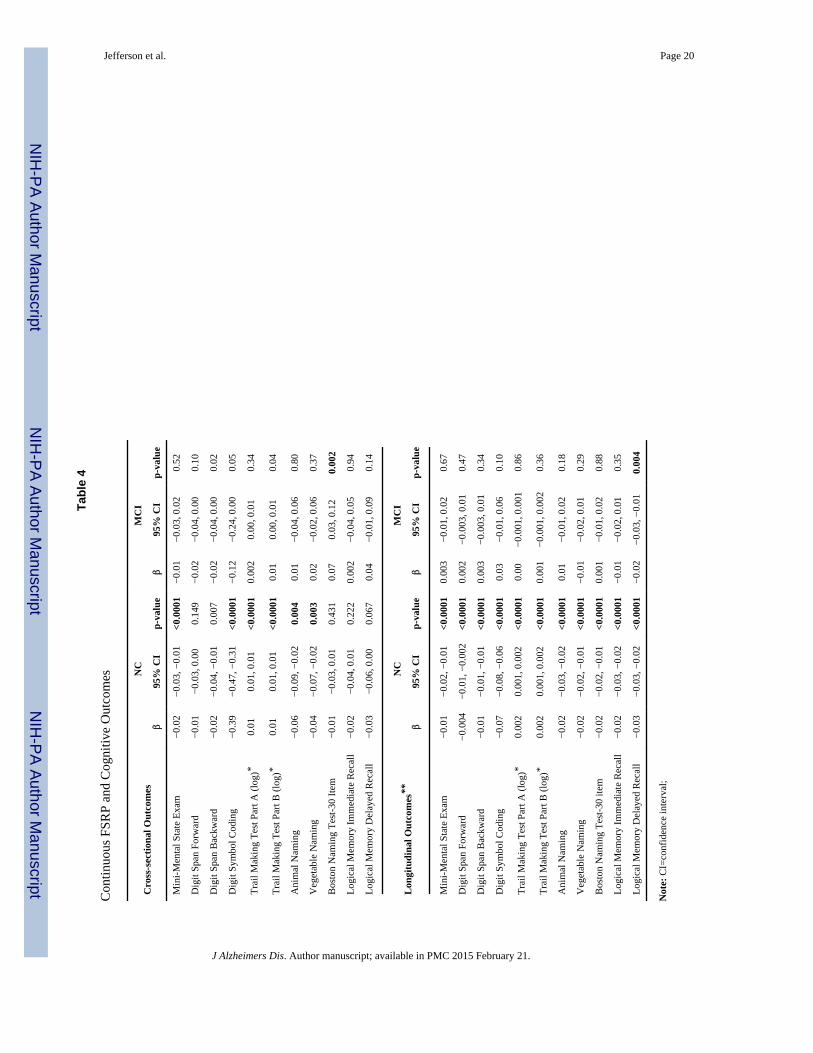
FSRP & Cognition in NC
Among NC participants, elevated FSRP was cross-sectionally related to worse performance
on a number of cognitive measures when correcting for multiple comparisons, including
Mini-Mental State Examination (MMSE; β=−0.02, p<0.0001), Digit Symbol Coding (β=
−0.39, p<0.001), log Trail Making Test Part A (β=0.01, p<0.0001), log Trail Making Test
Part B (β=0.01, p<0.0001), Animal Naming (β=−0.06, p=0.004), and Vegetable Naming (β=
−0.04, p=0.003). See Table 4. All associations persisted when using an age-excluded FSRP
score. See Supplementary Table 1.
Jefferson et al. Page 5
J Alzheimers Dis. Author manuscript; available in PMC 2015 February 21.
NIH
-PA
Author M
anuscriptN
IH-P
A A
uthor Manuscript
NIH
-PA
Author M
anuscript
When analyzing FSRP quartiles in relation to cross-sectional outcomes, the highest (or
worse vascular health) quartile as compared to the referent (i.e., healthiest quartile) was
associated with worse performance on MMSE (β=−0.26, p<0.001), Digit Symbol Coding
(β=−4.30, p<0.001), log Trail Making Test Part A (β=0.08, p<0.001), log Trail Making Test
Part B (β=0.09, p<0.001), Animal Naming (β=−0.71, p=0.004), and Vegetable Naming (β=
−0.58, p=0.002). The highest quartile compared to the lowest quartile differed for Digit
Span Backward (β=−0.26, p=0.02), but this observation did not sustain correction for
multiple comparison. See Table 5. A majority of associations persisted when using an age-
excluded FSRP score, with the exception of Animal Naming (p=0.01) and Vegetable
Naming (p=0.01), which did not survive correction for multiple comparisons. See
Supplementary Table 2.
Among the NC participants, baseline FSRP was related to decline on all longitudinal
cognitive outcomes over the follow-up period (all p-values<0.0001). See Table 4. When
using an age-excluded FSRP score, associations with MMSE (p=0.001), Digit Symbol
Coding (p<0.001), and Boston Naming (p<0.001) were retained, while associations for Digit
Span Forward (p=0.03), Digit Span Backward (p=0.01), log Trail Making Test Part A
(p=0.01), and Animal Naming (p=0.02) did not survive multiple correction comparison. See
Supplementary Table 1.
Similarly, when examining FSRP effects categorically on trajectories, the highest quartile
(or worse vascular health) was associated with longitudinal decline in all variables of
interest as compared to the referent, including MMSE (β=−0.19, p<0.0001), Digit Span
Forward (β=−0.05, p=0.001), Digit Span Backward (β=−0.09, p<0.0001), Digit Symbol
Coding (β=−0.85, p<0.0001), log Trail Making Test Part A (β=0.02, p<0.0001), log Trail
Making Test Part B (β=0.02, p<0.0001), Animal Naming (β=−0.30, p<0.0001), Vegetable
Naming (β=−0.22, p<0.0001), Boston Naming Test (β=−0.23, p<0.0001), Logical Memory
Immediate Recall (β=−0.29, p<0.0001), and Logical Memory Delayed Recall (β=−0.36,
p<0.0001). The second and third quartile also differed from the referent with respect to
decline on a subset of cognitive outcomes. See Table 6 for details. When using an age-
excluded FSRP score, associations with MMSE (p=0.001), Digit Symbol Coding (p<0.001),
and Boston Naming Test (p<0.001) persisted, while associations with Digit Span Backward
(p=0.02), log Trail Making Test A (p=0.01), and Animal Naming (p=0.01) did not survive
multiple comparison correction. See Supplementary Table 3.
FSRP & Cognition in MCI
Among MCI participants, FSRP associations with worse Digit Span Backward (p=0.02)
Digit Symbol Coding (p=0.05), and log Trail Making Test B performance (p=0.04) did not
persist following correction for multiple comparisons. See Table 4 for details. Interestingly,
an elevated FSRP was cross-sectionally related to better performance on Boston Naming
Test (β=0.07, p=0.002), an association that persisted when using the age-excluded FSRP
score (p=0.003). See Supplementary Table 1. Given this counterintuitive finding, post-hoc
analyses explored potential interactions and yielded mostly null results, including age-
excluded FSRP × education (p=0.41), age-excluded FSRP × sex (p=0.41), and age-excluded
FSRP × race (p=0.96). There was a nominal age-excluded FSRP × age interaction (p=0.03).
Jefferson et al. Page 6
J Alzheimers Dis. Author manuscript; available in PMC 2015 February 21.
NIH
-PA
Author M
anuscriptN
IH-P
A A
uthor Manuscript
NIH
-PA
Author M
anuscript

Follow-up analyses examining age by quartile suggest an inverted association between
FSRP and Boston Naming Test 30-item performance for the oldest participants (age 75–80
quartile: β=0.13, p=0.01; age 80–90 quartile: β=0.12, p=0.01), compared to the youngest
participants (age 55–69 quartile: β=−0.13, p=0.78).
When treating FSRP as a categorical variable in the regression models, the highest quartile
compared to the referent was cross-sectionally associated with slower log Trail Making Test
Part B performance (β=0.10, p=0.004). Cross-sectional associations which did not survive
multiple comparison correction were noted between the highest quartile and the referent for
Digit Span Forward (p=0.03), Digit Span Backward (p=0.01), and Digit Symbol Coding
(p=0.02). See Table 5. When using an age-excluded FSRP score, the association with log
Trail Making Test Part B did not survive multiple correction comparison (p=0.04). See
Supplementary Table 2.
Baseline FSRP was associated with worse trajectory among the MCI participants on Logical
Memory Delayed Recall (β=−0.02, p=0.004). See Table 4. When using an age-excluded
FSRP score, this finding did not persist (p=0.51). See Supplementary Table 1.
When analyzing FSRP as a categorical variable, the highest (worse vascular health) quartile
was associated with longitudinal decline in Logical Memory Delayed Recall (β=−0.26,
p=0.003). See Table 6. When using an age-excluded FSRP score, this observation did not
persist (p=0.19). See Supplementary Table 3.
Discussion
This study provides a comprehensive analysis of the association between an index for stroke
risk (FSRP) and cognitive abilities in older adults with a cognitive diagnosis of either NC or
MCI. Among the NC participants, higher stroke risk (especially the highest FSRP quartile)
was related to worse cross-sectional performances on a subset of variables, including global
cognition, information processing speed, working memory, and sequencing abilities.
Increased FSRP was also associated with cognitive decline among the NC participants for
all outcomes examined, including global cognition, working memory, information
processing speed, sequencing, verbal fluency, and episodic memory abilities. These results,
which cannot be explained by age, suggest that adverse vascular health risk is associated
with modest declines in cognitive health among cognitively normal older adults. In contrast,
among the MCI participants, higher stroke risk (especially the highest FSRP quartile) was
modestly related only to sequencing abilities at baseline and delayed episodic memory
decline over the follow-up, observations that appear to be associated in part by advancing
age. That is, age appears to strengthen the stroke risk estimate even when controlling for the
association between age and neuropsychological performance or change over time.
Collectively, results suggest increased vascular risk is associated with poorer cross-sectional
and longitudinal neuropsychological health, which is consistent with evidence that
concomitant cerebrovascular disease accelerates the clinical manifestation of AD pathology
[26–28]. The present findings are particularly relevant to the current dominating theoretical
model of AD pathophysiology, which puts forth a temporal ordering of dynamic biomarkers
Jefferson et al. Page 7
J Alzheimers Dis. Author manuscript; available in PMC 2015 February 21.
NIH
-PA
Author M
anuscriptN
IH-P
A A
uthor Manuscript
NIH
-PA
Author M
anuscript

seen in “pure” AD [29]. Despite mounting neuropathological evidence that AD rarely exists
without concomitant cerebrovascular disease among older adults [30–32], the model does
not incorporate the contribution of cerebrovascular health. Given the current results
implicate vascular risk factors as a correlate of neuropsychological decline in the earliest
portion of the cognitive aging spectrum, theoretical models of AD pathophysiology would
benefit from a more inclusive representation of mechanisms contributing to AD
neuropathology, clinical manifestation of neuropsychological symptoms, and progression
over time.
It also appears that worse systemic vascular health may has the greatest effect on cognitive
decline among elders with normal cognition as compared to individuals who are already
clinically manifesting AD pathology (i.e., diagnosed with MCI). There are several plausible
explanations accounting for the disparity of findings between groups. First, the follow-up
interval among the MCI cohort was approximately seven months shorter than that of the NC
cohort, possibly contributing to a shorter window for cognitive decline among the MCI
group. However, the difference between baseline and last visit outcomes suggests the MCI
group declined significantly faster on all outcomes compared to the NC group (data not
shown). Second, a floor effect in the MCI cohort might contribute to the absence of findings,
yet visual inspection of the data confirmed a wide range of performance across the MCI
participants. A more plausible explanation is that an adverse vascular risk profile has a
greater effect on brain aging for individuals with normal cognition compared to MCI. That
is, worse systemic vascular health may have circumscribed effects on cognitive trajectory
(i.e., limited to worsening episodic memory performance) among elders with prodromal AD
who are thought to have extensive amyloid accumulation and tau aggregation (rather than
cerebrovascular disease) accounting for their cognitive changes [29]. Finally, the source and
type of MCI cohort we studied may also account for the disparate findings between the MCI
and NC cohorts. That is, we relied on a cohort of MCI participants with a predominant
amnestic profile (i.e., Petersen criteria), which may contribute to differences in how vascular
health affects brain health [33]. Plus, utilization of MCI participants from an Alzheimer’s
Disease Center network likely yields a referral bias where individuals with cognitive
complaints or early objective cognitive changes are less likely to have vascular mechanisms
underlying such changes than if participants were identified through a community-based
cohort [34]. Future work should more precisely characterize the role of vascular risk factors
on cognitive decline across strictly controlled MCI subtypes.
The mechanism(s) underlying our observed associations between elevated FSRP and worse
cognitive outcomes are likely multifactorial and may include the clinical manifestations of
unrecognized cerebrovascular disease. For example, systemic vascular disease is associated
with reductions in cerebral blood flow [35], silent cortical infarcts [36,37], white matter
hyperintensities [38], and microbleeds [39]. Such structural changes related to
cerebrovascular disease likely contributed to the observed variation across all cognitive
variables among the NC participants. Unfortunately, neuroimaging data that might confirm
this hypothesis are not readily available for this dataset.
While the observed effects for the NC group are statistically significant, it is noteworthy that
some of these effects are relatively small in magnitude. For example, in mixed model
Jefferson et al. Page 8
J Alzheimers Dis. Author manuscript; available in PMC 2015 February 21.
NIH
-PA
Author M
anuscriptN
IH-P
A A
uthor Manuscript
NIH
-PA
Author M
anuscript

analysis the beta coefficient for FSRP and Logical Memory Immediate Recall is −0.02 while
the beta coefficient for age and Logical Memory Immediate Recall is −0.07 (data not
shown). By comparison, the effect of FSRP on Logical Memory Immediate Recall
performance is equivalent to more than 3 months of advanced cognitive aging. A similar
effect is present for FSRP and Logical Memory Delayed Recall (i.e., more than 4 months of
advanced cognitive aging). In contrast, the beta coefficient for FSRP and Digit Symbol
Coding is −0.07 while the beta coefficient for age and Digit Symbol Coding is −0.47 (data
not shown). A comparison of these results suggests the effect of FSRP on Digit Symbol
Coding performance is equivalent to approximately 2 months of advanced cognitive aging.
The small effects observed in the current study may be secondary to the late life nature of
the cohort, such that the window of vascular injury on brain health occurs earlier in mid-life
[40,41]. Furthermore, the modest effect we observed might be compounded over several
decades of aging given life expectancy in the United States extends late into the eighth
decade. Future work with extensive follow-up intervals will provide clarity on the long-term
cognitive implications of effects reported in the current study. The small effects observed
may also be due to a restriction of range of vascular risk or disease in our sample due to our
exclusion of clinical stroke and transient ischemic attack and the Alzheimer’s Disease
Center network referral bias mentioned above [34]. Effects of vascular health on cognitive
outcomes may be larger when studying a more representative sample.
It is notable that demographic factors differed by FSRP categorical values. That is,
participants with higher (worse) FSRP values were more likely to be older (which was
expected given increasing age earns more points in the stroke risk profile), non-white, and
have lower education levels at baseline as compared to the healthier FSRP values. These
findings align with previous studies reporting a higher prevalence of cardiovascular
comorbidities in minority elders in comparison to whites [42]. Socio-economic factors
contributing to such health disparities may include an earlier age of onset or treatment
differences for chronic health conditions among minorities [43,44]. Also, education
attainment is often used as a proxy measure for socioeconomic status or health literacy and
has been linked to cardiovascular health [45]. Given the higher burden of CVD among
minorities and the established link between impaired cardiovascular health and dementia
risk, additional research is needed to examine how multiple cardiovascular comorbities
influence cognitive trajectories in these populations.
One observation from the current study that warrants brief discussion is the cross-sectional
association between FSRP and Boston Naming Test 30-item performance in MCI. While
inspection of the raw-unadjusted mean Boston Naming Test 30-item performance by FSRP
quartile suggests more adverse vascular risk corresponds to poorer naming performance, the
fully adjusted models suggest it is associated with better naming performance. To
understand this counterintuitive finding, we examined interaction terms between age-
excluded FSRP and age, sex, education, and race, but only age emerged as a significant
(albeit weak) interaction term. Follow-up analyses suggest the counterintuitive effect was
present in participants age 75 and older. It is plausible that the ambiguous FSRP and naming
observation may be due to a more complex multi-variable interaction or confound not
captured with our available methods. Replication is needed to better understand this finding.
Jefferson et al. Page 9
J Alzheimers Dis. Author manuscript; available in PMC 2015 February 21.
NIH
-PA
Author M
anuscriptN
IH-P
A A
uthor Manuscript
NIH
-PA
Author M
anuscript

The current study enhances the existing literature in several important ways. First, much of
the existing literature has not considered the differential impact of diagnostic status (i.e.,
brains at risk in the normal cognition or MCI phase of cognitive aging). Second, inclusion of
both cross-sectional and longitudinal analyses offers an opportunity to reconcile prior
inconsistencies in the literature. Third, most prior work examining vascular health in relation
to brain aging has emphasized a “silo” approach by focusing on one single risk factor, such
as blood pressure [46]. However, vascular health is a complex construct, which is supported
by formal guidelines for managing cardiovascular and cerebrovascular disease suggesting
more emphasis on risk prediction models incorporating multiple vascular factors. Finally,
continuous FSRP models suggest increasing adverse vascular risk is associated with worse
cognitive trajectory across all neuropsychological measures of interest among cognitively
normal elders. Examination of the categorical FSRP models illustrates there is an
incremental effect of adverse vascular risk on certain cognitive outcomes like global
cognition, information processing speed, and fluency production over time. By contrast,
only the most adverse vascular risk category (i.e., Quartile 4 in comparison to Quartile 1)
relates to attention decrements over time among cognitively normal elders. Thus, as we have
previously shown [19], examining systemic vascular health as both a continuous and
categorical variable provides rich information to better understand associations between
vascular health and brain aging.
Additional strengths of the current study include our leveraging of the extensive NACC
UDS dataset which included standard cognitive diagnostic criteria applied across
participating sites and enabled assessment of vascular health in relation to both general
cognition and specific cognitive systems. Finally, the study’s longitudinal follow-up
permitted analysis of FSRP in relation to cognitive trajectory, providing power to identify
novel effects and reconciling ambiguous results from prior longitudinal work [11,47].
There are some methodological limitations to the current manuscript that warrant discussion.
First, participants comprising the NACC dataset are predominantly White and well-educated
and reflect a convenience sample, which limits generalizability. The use of a highly
educated population is noteworthy because participants’ FSRP values may be lower given
the well-educated cohort, reflecting better vascular health [48–50]. There was a relatively
short mean follow-up time (2 to 3 years), but we believe the large sample size (n=9720)
offers sufficient power to detect valid changes in cognition and function within this time
period. Reliance on a modified version of the FSRP may have underestimated vascular
health issues in the current sample given that LVH prevalence among adults age 50 and
older ranges from 14% to 48% [51]. Similarly, the reliance on self-report for some elements
of the FSRP may have contributed unwanted variance in the dataset. Finally, assessment of
episodic memory in NACC is restricted to immediate and delayed story paragraph recall.
The inability to assess associations between vascular risk and learning or recognition poses a
methodological limitation.
In summary, our findings suggest that underlying vascular health (as measured by a risk
factor score) is associated with cognitive decline in cognitively normal elders. Inexpensive
and easily determined vascular risk health information may serve as an informative and cost-
effective risk stratification tool for more detailed and costly assessments and interventions.
Jefferson et al. Page 10
J Alzheimers Dis. Author manuscript; available in PMC 2015 February 21.
NIH
-PA
Author M
anuscriptN
IH-P
A A
uthor Manuscript
NIH
-PA
Author M
anuscript

Future studies should incorporate subtypes of cognitive impairment to better understand
associations between adverse vascular health and cognitive outcomes. Integration of
neuroimaging and other biomarkers in future work will provide key information regarding
mechanisms underlying the associations observed here. Longitudinal research will also
determine whether favorable modification of a patient’s vascular risk profile modifies
cognitive trajectory.
Supplementary Material
Refer to Web version on PubMed Central for supplementary material.
Acknowledgements
Funding Sources
This research was supported by K23-AG030962 (Paul B. Beeson Career Development Award in Aging; ALJ); K24-AG046373 (ALJ); Alzheimer’s Association IIRG-08–88733 (ALJ); R01-HL11516 (ALJ); R01-AG034962 (ALJ); T32-MH65215 (TJH); Pharmaceutical Research and Manufacturers of America Foundation Fellowship in Translational Medicine and Therapeutics (TJH); Alzheimer’s Association NIRG-13–283276 (KAG); American Federation for Aging Research Medical Student Training in Aging Research Grant (JS; T35-AG038027); the National Alzheimer’s Coordinating Center (U01-AG016976); and the Vanderbilt Memory & Alzheimer’s Center.
References
1. Kivipelto M, Laakso MP, Tuomilehto J, Nissinen A, Soininen H. Hypertension and hypercholesterolaemia as risk factors for Alzheimer's disease: Potential for pharmacological intervention. CNS Drugs. 2002; 16:435–444. [PubMed: 12056919]
2. Arvanitakis Z, Wilson RS, Bienias JL, Evans DA, Bennett DA. Diabetes mellitus and risk of Alzheimer disease and decline in cognitive function. Arch Neurol. 2004; 61:661–666. [PubMed: 15148141]
3. Ott A, Slooter AJ, Hofman A, van Harskamp F, Witteman JC, Van Broeckhoven C, van Duijn CM, Breteler MM. Smoking and risk of dementia and Alzheimer's disease in a population-based cohort study: The Rotterdam study. Lancet. 1998; 351:1840–1843. [PubMed: 9652667]
4. Bangen KJ, Restom K, Liu TT, Jak AJ, Wierenga CE, Salmon DP, Bondi MW. Differential age effects on cerebral blood flow and bold response to encoding: Associations with cognition and stroke risk. Neurobiol Aging. 2009; 30:1276–1287. [PubMed: 18160181]
5. Bell RD, Zlokovic BV. Neurovascular mechanisms and blood-brain barrier disorder in Alzheimer's disease. Acta Neuropathol. 2009; 118:103–113. [PubMed: 19319544]
6. de Toledo Ferraz Alves TC, Scazufca M, Squarzoni P, de Souza Duran FL, Tamashiro-Duran JH, Vallada HP, Andrei A, Wajngarten M, Menezes PR, Busatto GF. Subtle gray matter changes in temporo-parietal cortex associated with cardiovascular risk factors. J Alzheimers Dis. 2011; 27:575–589. [PubMed: 21841245]
7. Jeerakathil T, Wolf PA, Beiser A, Massaro J, Seshadri S, D'Agostino RB, DeCarli C. Stroke risk profile predicts white matter hyperintensity volume: The Framingham study. Stroke. 2004; 35:1857–1861. [PubMed: 15218158]
8. Brady CB, Spiro A, McGlinchey-Berroth R 3rd, Milberg W, Gaziano JM. Stroke risk predicts verbal fluency decline in healthy older men: Evidence from the normative aging study. J Gerontol B Psychol Sci Soc Sci. 2001; 56:P340–P346. [PubMed: 11682587]
9. Elias MF, Sullivan LM, D'Agostino RB, Elias PK, Beiser A, Au R, Seshadri S, DeCarli C, Wolf PA. Framingham stroke risk profile and lowered cognitive performance. Stroke. 2004; 35:404–409. [PubMed: 14726556]
10. Wolf PA, D'Agostino RB, Belanger AJ, Kannel WB. Probability of stroke: A risk profile from the Framingham study. Stroke. 1991; 22:312–318. [PubMed: 2003301]
Jefferson et al. Page 11
J Alzheimers Dis. Author manuscript; available in PMC 2015 February 21.
NIH
-PA
Author M
anuscriptN
IH-P
A A
uthor Manuscript
NIH
-PA
Author M
anuscript

11. Kaffashian S, Dugravot A, Elbaz A, Shipley MJ, Sabia S, Kivimaki M, Singh-Manoux A. Predicting cognitive decline: A dementia risk score vs. The Framingham vascular risk scores. Neurology. 2013; 80:1300–1306. [PubMed: 23547265]
12. Llewellyn DJ, Lang IA, Xie J, Huppert FA, Melzer D, Langa KM. Framingham stroke risk profile and poor cognitive function: A population-based study. BMC Neurol. 2008; 8:12. [PubMed: 18430227]
13. Maineri Nde L, Xavier FM, Berleze MC, Moriguchi EH. Risk factors for cerebrovascular disease and cognitive function in the elderly. Arq Bras Cardiol. 2007; 89:142–146. 158–162. [PubMed: 17906814]
14. Kaffashian S, Dugravot A, Brunner EJ, Sabia S, Ankri J, Kivimaki M, Singh-Manoux A. Midlife stroke risk and cognitive decline: A 10-year follow-up of the whitehall II cohort study. Alzheimers Dement. 2012; 9:572–579. [PubMed: 23199495]
15. Albert MS, Dekosky ST, Dickson D, Dubois B, Feldman HH, Fox NC, Gamst A, Holtzman DM, Jagust WJ, Petersen RC, Snyder PJ, Carrillo MC, Thies B, Phelps CH. The diagnosis of mild cognitive impairment due to Alzheimer's disease: Recommendations from the national institute on aging-Alzheimer's association workgroups on diagnostic guidelines for Alzheimer's disease. Alzheimers & Dementia. 2011; 7:270–279.
16. de Groot JC, de Leeuw FE, Oudkerk M, van Gijn J, Hofman A, Jolles J, Breteler MM. Cerebral white matter lesions and cognitive function: The Rotterdam scan study. Ann Neurol. 2000; 47:145–151. [PubMed: 10665484]
17. Buckner RL. Memory and executive function in aging and ad: Multiple factors that cause decline and reserve factors that compensate. Neuron. 2004; 44:195–208. [PubMed: 15450170]
18. Qiu C, Cotch MF, Sigurdsson S, Jonsson PV, Jonsdottir MK, Sveinbjrnsdottir S, Eiriksdottir G, Klein R, Harris TB, van Buchem MA, Gudnason V, Launer LJ. Cerebral microbleeds, retinopathy, and dementia: The ages-reykjavik study. Neurology. 2010; 75:2221–2228. [PubMed: 21172845]
19. Jefferson AL, Himali JJ, Beiser AS, Au R, Massaro JM, Seshadri S, Gona P, Salton CJ, DeCarli C, O'Donnell CJ, Benjamin EJ, Wolf PA, Manning WJ. Cardiac index is associated with brain aging: The Framingham heart study. Circulation. 2010; 122:690–697. [PubMed: 20679552]
20. Beekly DL, Ramos EM, Lee WW, Deitrich WD, Jacka ME, Wu J, Hubbard JL, Koepsell TD, Morris JC, Kukull WA. The National Alzheimer's Coordinating Center (NACC) database: The uniform data set. Alzheimer Dis Assoc Disord. 2007; 21:249–258. [PubMed: 17804958]
21. Morris JC. The Clinical Dementia Rating (CDR): Current version and scoring rules. Neurology. 1993; 43:2412–2414. [PubMed: 8232972]
22. Weintraub S, Salmon D, Mercaldo N, Ferris S, Graff-Radford NR, Chui H, Cummings J, DeCarli C, Foster NL, Galasko D, Peskind E, Dietrich W, Beekly DL, Kukull WA, Morris JC. The Alzheimer's disease centers' Uniform Data Set (UDS): The neuropsychologic test battery. Alzheimer Dis Assoc Disord. 2009; 23:91–101. [PubMed: 19474567]
23. Petersen RC. Mild cognitive impairment as a diagnostic entity. J Intern Med. 2004; 256:183–194. [PubMed: 15324362]
24. D'Agostino RB, Wolf PA, Belanger AJ, Kannel WB. Stroke risk profile: Adjustment for antihypertensive medication. The Framingham study. Stroke. 1994; 25:40–43. [PubMed: 8266381]
25. O'Brien RM. A caution regarding rules of thumb for variance inflation factors. Qual Quant. 2007; 41:673–690.
26. Li J, Wang YJ, Zhang M, Xu ZQ, Gao CY, Fang CQ, Yan JC, Zhou HD. Chongqing Ageing Study G. Vascular risk factors promote conversion from mild cognitive impairment to Alzheimer disease. Neurology. 2011; 76:1485–1491. [PubMed: 21490316]
27. van der Flier WM, van der Vlies AE, Weverling-Rijnsburger AW, de Boer NL, Admiraal-Behloul F, Bollen EL, Westendorp RG, van Buchem MA, Middelkoop HA. MRI measures and progression of cognitive decline in nondemented elderly attending a memory clinic. Int J Geriatr Psychiatry. 2005; 20:1060–1066. [PubMed: 16250078]
28. Rossi R, Geroldi C, Bresciani L, Testa C, Binetti G, Zanetti O, Frisoni GB. Clinical and neuropsychological features associated with structural imaging patterns in patients with mild cognitive impairment. Dement Geriatr Cogn. 2007; 23:175–183.
Jefferson et al. Page 12
J Alzheimers Dis. Author manuscript; available in PMC 2015 February 21.
NIH
-PA
Author M
anuscriptN
IH-P
A A
uthor Manuscript
NIH
-PA
Author M
anuscript

29. Jack CR Jr, Knopman DS, Jagust WJ, Petersen RC, Weiner MW, Aisen PS, Shaw LM, Vemuri P, Wiste HJ, Weigand SD, Lesnick TG, Pankratz VS, Donohue MC, Trojanowski JQ. Tracking pathophysiological processes in Alzheimer's disease: An updated hypothetical model of dynamic biomarkers. Lancet Neurol. 2013; 12:207–216. [PubMed: 23332364]
30. Schneider JA, Arvanitakis Z, Bang W, Bennett DA. Mixed brain pathologies account for most dementia cases in community-dwelling older persons. Neurology. 2007; 69:2197–2204. [PubMed: 17568013]
31. Schneider JA, Bennett D. Where vascular meets neurodegenerative disease. Stroke. 2010; 41:S144–S146. [PubMed: 20876491]
32. Troncoso JC, Zonderman AB, Resnick SM, Crain B, Pletnikova O, O'Brien RJ. Effect of infarcts on dementia in the Baltimore longitudinal study of aging. Ann Neurol. 2008; 64:168–176. [PubMed: 18496870]
33. Delano-Wood L, Bondi MW, Sacco J, Abeles N, Jak AJ, Libon DJ, Bozoki A. Heterogeneity in mild cognitive impairment: Differences in neuropsychological profile and associated white matter lesion pathology. J Int Neuropsychol Soc. 2009; 15:906–914. [PubMed: 19891820]
34. Schneider JA, Aggarwal NT, Barnes L, Boyle P, Bennett DA. The neuropathology of older persons with and without dementia from community versus clinic cohorts. J Alzheimers Dis. 2009; 18:691–701. [PubMed: 19749406]
35. Petersen P, Kastrup J, Videbaek R, Boysen G. Cerebral blood flow before and after cardioversion of atrial fibrillation. J Cereb Blood Flow Metab. 1989; 9:422–425. [PubMed: 2715212]
36. Ezekowitz MD, James KE, Nazarian SM, Davenport J, Broderick JP, Gupta SR, Thadani V, Meyer ML, Bridgers SL. Silent cerebral infarction in patients with nonrheumatic atrial fibrillation. The veterans affairs stroke prevention in nonrheumatic atrial fibrillation investigators. Circulation. 1995; 92:2178–2182. [PubMed: 7554199]
37. Leys D, Erkinjuntti T, Desmond DW, Schmidt R, Englund E, Pasquier F, Parnetti L, Ghika J, Kalaria RN, Chabriat H, Scheltens P, Bogousslavsky J. Vascular dementia: The role of cerebral infarcts. Alzheimer Dis Assoc Disord. 1999; 3(13 Suppl):S38–S48. [PubMed: 10609680]
38. de Leeuw FE, de Groot JC, Oudkerk M, Witteman JC, Hofman A, van Gijn J, Breteler MM. Hypertension and cerebral white matter lesions in a prospective cohort study. Brain. 2002; 125:765–772. [PubMed: 11912110]
39. Hara M, Yakushiji Y, Nannri H, Sasaki S, Noguchi T, Nishiyama M, Hirotsu T, Nakajima J, Hara H. Joint effect of hypertension and lifestyle-related risk factors on the risk of brain microbleeds in healthy individuals. Hypertens Res. 2013; 36:789–794. [PubMed: 23575379]
40. Carmelli D, Swan GE, Reed T, Wolf PA, Miller BL, DeCarli C. Midlife cardiovascular risk factors and brain morphology in identical older male twins. Neurology. 1999; 52:1119–1124. [PubMed: 10214731]
41. Swan GE, DeCarli C, Miller BL, Reed T, Wolf PA, Jack LM, Carmelli D. Association of midlife blood pressure to late-life cognitive decline and brain morphology. Neurology. 1998; 51:986–993. [PubMed: 9781518]
42. Mensah GA, Mokdad AH, Ford ES, Greenlund KJ, Croft JB. State of disparities in cardiovascular health in the united states. Circulation. 2005; 111:1233–1241. [PubMed: 15769763]
43. Levine DA, Lewis CE, Williams OD, Safford MM, Liu K, Calhoun DA, Kim Y, Jacobs DR Jr, Kiefe CI. Geographic and demographic variability in 20-year hypertension incidence: The CARDIA study. Hypertension. 2011; 57:39–47. [PubMed: 21135358]
44. Hertz RP, Unger AN, Ferrario CM. Diabetes, hypertension, and dyslipidemia in Mexican Americans and non-Hispanic whites. Am J Prev Med. 2006; 30:103–110. [PubMed: 16459207]
45. Boykin S, Diez-Roux AV, Carnethon M, Shrager S, Ni H, Whitt-Glover M. Racial/ethnic heterogeneity in the socioeconomic patterning of CVD risk factors: In the United States: The multi-ethnic study of atherosclerosis. J Health Care Poor Underserved. 2011; 22:111–127. [PubMed: 21317510]
46. Gifford KA, Badaracco M, Liu D, Tripodis Y, Gentile A, Lu Z, Palmisano J, Jefferson AL. Blood pressure and cognition among older adults: A meta-analysis. Arch Clin Neuropsychol. 2013; 28:649–664. [PubMed: 23838685]
Jefferson et al. Page 13
J Alzheimers Dis. Author manuscript; available in PMC 2015 February 21.
NIH
-PA
Author M
anuscriptN
IH-P
A A
uthor Manuscript
NIH
-PA
Author M
anuscript

47. Dregan A, Stewart R, Gulliford MC. Cardiovascular risk factors and cognitive decline in adults aged 50 and over: A population-based cohort study. Age Ageing. 2013; 42:338–345. [PubMed: 23179255]
48. Diez-Roux AV, Nieto FJ, Muntaner C, Tyroler HA, Comstock GW, Shahar E, Cooper LS, Watson RL, Szklo M. Neighborhood environments and coronary heart disease: A multilevel analysis. Am J Epidemiol. 1997; 146:48–63. [PubMed: 9215223]
49. Smith GD, Hart C, Watt G, Hole D, Hawthorne V. Individual social class, area-based deprivation, cardiovascular disease risk factors, and mortality: The Renfrew and Paisley study. J Epidemiol Community Health. 1998; 52:399–405. [PubMed: 9764262]
50. Jefferson AL, Massaro JM, Beiser AS, Seshadri S, Larson MG, Wolf PA, Au R, Benjamin EJ. Inflammatory markers and neuropsychological functioning: The Framingham heart study. Neuroepidemiology. 2011; 37:21–30. [PubMed: 21757961]
51. Levy D, Anderson KM, Savage DD, Kannel WB, Christiansen JC, Castelli WP. Echocardiographically detected left ventricular hypertrophy: Prevalence and risk factors. The Framingham heart study. Ann Intern Med. 1988; 108:7–13. [PubMed: 2962527]
52. Pfeffer RI, Kurosaki TT, Harrah CH Jr, Chance JM, Filos S. Measurement of functional activities in older adults in the community. J Gerontol. 1982; 37:323–329. [PubMed: 7069156]
53. Wechsler, D. Wechsler memory scale-revised, Psychological Corporation. Texas: San Antonio; 1987.
54. Reitan RM. Validity of the trail making test as an indicator of organic brain damage. Percept Motor Skill. 1958; 8:271–276.
55. Kaplan, E.; Goodglass, H.; Weintraub, S. The Boston naming test. Philadelphia: Lea & Febiger; 1983.
56. Goodglass, H.; Kaplan, E. The assessment of aphasia and related disorders. Philadelphia, PA: Lea & Febiger; 1983.
57. Troyer AK, Moscovitch M, Winocur G. Clustering and switching as two components of verbal fluency: Evidence from younger and older healthy adults. Neuropsychology. 1997; 11:138–146. [PubMed: 9055277]
Jefferson et al. Page 14
J Alzheimers Dis. Author manuscript; available in PMC 2015 February 21.
NIH
-PA
Author M
anuscriptN
IH-P
A A
uthor Manuscript
NIH
-PA
Author M
anuscript

Figure 1. Participant Inclusion & Exclusion DetailsThe exclusion numbers are not mutually exclusive. Missing data includes baseline
demographic variables (i.e., education, race), FSRP values, and outcomes. Within the
missing data category (n=1399), the majority of individuals were excluded due to missing
outcomes (n=1043).
Jefferson et al. Page 15
J Alzheimers Dis. Author manuscript; available in PMC 2015 February 21.
NIH
-PA
Author M
anuscriptN
IH-P
A A
uthor Manuscript
NIH
-PA
Author M
anuscript
NIH
-PA
Author M
anuscriptN
IH-P
A A
uthor Manuscript
NIH
-PA
Author M
anuscript
Jefferson et al. Page 16
Tab
le 1
Neu
rops
ycho
logi
cal P
roto
col
Dom
ain
Tes
tR
ange
NC
**M
CI*
*
Bas
elin
eL
ast
Vis
it†
p-va
lue
Bas
elin
eL
ast
Vis
it†
p-va
lue
Glo
bal
Cog
nitio
nM
ini-
Men
tal S
tate
Exa
min
atio
n (M
MSE
)[5
2]0–
3028
.9±
1.4
28.5
±2.
2<0
.001
26.9
±2.
624
.3±
5.3
<0.0
01
Atte
ntio
nD
igit
Span
For
war
d [5
3]0–
128.
5±2.
18.
4±2.
0<0
.001
7.7±
2.1
7.5±
2.2
<0.0
01
Info
rmat
ion
Proc
essi
ngSp
eed
Dig
it Sy
mbo
l [53
]0–
9347
.4±
12.5
46.0
±14
.0<0
.001
37.2
±12
.332
.5±
14.4
<0.0
01
Tra
il M
akin
g T
est P
art A
* [5
4]0–
150
34.8
±16
.336
.6±
20.1
<0.0
0145
.3±
23.5
55.7
±35
.0<0
.001
Exe
cutiv
eFu
nctio
ning
Tra
il M
akin
g T
est P
art B
* [5
4]0–
300
91.4
±50
.910
2±64
.2<0
.001
142.
5±77
.616
8.7±
89.4
<0.0
01
Dig
it Sp
an B
ackw
ard
[53]
0–12
6.8+
2.3
6.7+
2.3
<0.0
015.
7+2.
15.
2+2.
2<0
.001
Lan
guag
eB
osto
n N
amin
g T
est-
30 I
tem
(B
NT
-30)
[55
]0–
3026
.9±
3.4
26.9
±4.
00.
073
24.1
±5.
122
.5±
6.6
<0.0
01
Ani
mal
Nam
ing
(Ani
mal
s) [
56]
n/a
20.0
±5.
719
.3±
6.1
<0.0
0115
.5±
4.9
13.4
±5.
7<0
.001
Veg
etab
le N
amin
g (V
eget
able
s) [
57]
n/a
14.8
±4.
214
.1±
4.7
<0.0
0111
.0±
3.9
9.3±
4.6
<0.0
01
Epi
sodi
cM
emor
yL
ogic
al M
emor
y Im
med
iate
Rec
all [
53]
0–25
13.5
±3.
914
.1±
4.5
<0.0
018.
9±4.
27.
7±5.
1<0
.001
Log
ical
Mem
ory
Del
ayed
Rec
all [
53]
0–25
12.2
±4.
213
.1±
5.0
<0.0
016.
4±4.
65.
7±5.
4<0
.001
Not
e.
* low
er s
core
s de
note
bet
ter
perf
orm
ance
;
**N
C a
nd M
CI
grou
ps d
iffe
r on
all
mea
sure
s at
bas
elin
e an
d la
st v
isit;
p-v
alue
s re
flec
t with
in g
roup
cha
nges
fro
m b
asel
ine
to la
st v
isit;
† for
desc
ript
ive
purp
oses
onl
y, th
e di
ffer
ence
bet
wee
n la
st v
isit
and
base
line
visi
t cog
nitiv
e pe
rfor
man
ce w
as c
ompa
red;
for
hyp
othe
sis
test
ing,
gen
eral
ized
line
ar m
ixed
mod
els
incl
uded
neu
rops
ycho
logi
cal
data
acr
oss
all v
isits
bet
wee
n th
e fi
rst a
nd m
ost r
ecen
t (la
st)
visi
t
J Alzheimers Dis. Author manuscript; available in PMC 2015 February 21.

NIH
-PA
Author M
anuscriptN
IH-P
A A
uthor Manuscript
NIH
-PA
Author M
anuscript
Jefferson et al. Page 17
Table 2
Sample Characteristics
NCn=6603
MCIn=3117
p-value
Age, years 72±8 74±8 <0.001
Sex, % Female 68 56 <0.001
Race, % White 80 77 0.021
Education, years 15.6±3 15±4 <0.001
Neuropsychological observations, total 3.6±2.3 2.9±2.0 <0.001
Follow-up time,* years 3.0±2.5 2.2±2.2 <0.001
FSRP, total risk points 11.5±4.8 12.6±4.5 <0.001
Systolic blood pressure, mmHg 133±18 136±19 <0.001
Antihypertensive medications, % 41 45 <0.001
Diabetes, % 11 15 <0.001
Current smoker, % 4 4 0.31
History of CVD, % 10 14 <0.001
Atrial fibrillation, % 6 6 0.21
Age-excluded FSRP, total risk points 5.7±3.3 6.2±3.4 <0.001
Note.
*defined as time between first and last UDS visit
J Alzheimers Dis. Author manuscript; available in PMC 2015 February 21.

NIH
-PA
Author M
anuscriptN
IH-P
A A
uthor Manuscript
NIH
-PA
Author M
anuscript
Jefferson et al. Page 18
Tab
le 3
Bas
elin
e W
ithin
-Gro
up C
hara
cter
istic
s by
FSR
P Q
uart
ile
NC
Q1
Q2
Q3
Q4
p-va
lue
Tot
aln=
6603
n=19
47n=
2031
n=13
14n=
1311
Age
, yea
rs64
±5§‖#
72±
6‡‖#
76±
7‡§#
80±
6‡§‖
<0.0
0172
±8
Sex,
% F
emal
e68
6870
680.
7568
Rac
e, %
Whi
te83‖#
81#
78‡
76‡§
<0.0
0180
Edu
catio
n, y
ears
16±
3§‖#
16±
3‡‖#
15±
3‡§#
15±
3‡§‖
<0.0
0115
.6±
3
Neu
rops
ycho
logi
cal o
bser
vatio
ns,
tota
l3.
4±2.
2‖#
3.6±
2.3‡
3.8±
2.3‡
3.7±
2.2‡
<0.0
013.
6±2.
3
Follo
w-u
p tim
e,*
year
s2.
8±2.
5§‖#
3.0±
2.5
3.2±
2.5
3.0±
2.5
<0.0
013.
0±2.
5
Min
i-M
enta
l Sta
te E
xam
29.3
±1.
1§‖#
29.0
±1.
3‡‖#
28.7
±1.
5‡§#
28.4
±1.
7‡§‖
<0.0
0128
.9±
1.4
Dig
it Sp
an F
orw
ard
8.9±
2.0§‖#
8.5±
2.1‡‖
8.3±
2.1‡
§8.
2±2.
1‡§
<0.0
018.
5±2.
1
Dig
it Sp
an B
ackw
ard
7.3±
2.3§‖#
6.8±
2.2‡‖
6.4±
2.3‡
§6.
4±2.
1‡§
<0.0
016.
8+2.
3
Dig
it Sy
mbo
l Cod
ing
54.0
±11
.2§‖
#47
.9±
11.6
‡‖#
43.5
±11
.2‡§
#40
.3±
11.5
‡§‖
<0.0
0147
.4±
12.5
Tra
il M
akin
g T
est P
art A
**28
.8±
11.2
§‖#
34.0
±14
.9‡‖
#37
.9±
17.0
‡§#
42.1
±19
.9‡§‖
<0.0
0134
.8±
16.3
Tra
il M
akin
g T
est P
art B
**71
.4±
33.8
§‖#
88.6
±47
.4‡‖
#10
1.0±
53.6
‡§#
116.
3±60
.9‡§‖
<0.0
0191
.4±
50.9
Ani
mal
Nam
ing
22.1
±5.
7§‖#
20.1
±5.
5‡‖#
19.0
±5.
4‡§#
18.0
±5.
3‡§‖
<0.0
0120
.0±
5.7
Veg
etab
le N
amin
g16
.0±
4.3§‖#
14.9
±4.
2‡‖#
14.2
±4.
0‡§#
13.5
±3.
9‡§‖
<0.0
0114
.8±
4.2
Bos
ton
Nam
ing
Tes
t-30
item
27.9
±2.
5§‖#
27.0
±3.
3‡‖#
26.6
±3.
5‡§#
25.8
±4.
2‡§‖
<0.0
0126
.9±
3.4
Log
ical
Mem
ory
Imm
edia
te R
ecal
l14
.3±
3.6§‖#
13.5
±3.
8‡‖#
13.0
±4.
0‡§
12.7
±4.
0‡§
<0.0
0113
.5±
3.9
Log
ical
Mem
ory
Del
ayed
Rec
all
13.2
±3.
9§‖#
12.2
±4.
1‡‖#
11.7
±4.
3‡§#
11.2
±4.
3‡§‖
<0.0
0112
.2±
4.2
MC
IQ
1Q
2Q
3Q
4p-
valu
eT
otal
n=31
17n=
549
n=10
22n=
766
n=78
0
Age
, yea
rs65
±5§‖#
73±
6‡‖#
77±
7‡§#
80±
6‡§‖
<0.0
0174
±8
Sex,
% F
emal
e55
5460
550.
0756
Rac
e, %
Whi
te80
#80
#78
72‡§
<0.0
0178
Edu
catio
n, y
ears
16±
3‖#
15±
4#15
±3
15±
4‡§
<0.0
0115
±4
J Alzheimers Dis. Author manuscript; available in PMC 2015 February 21.

NIH
-PA
Author M
anuscriptN
IH-P
A A
uthor Manuscript
NIH
-PA
Author M
anuscript
Jefferson et al. Page 19
MC
IQ
1Q
2Q
3Q
4p-
valu
eT
otal
n=31
17n=
549
n=10
22n=
766
n=78
0
Neu
rops
ycho
logi
cal o
bser
vatio
ns,
tota
l2.
9±2.
03.
0±2.
02.
9±2.
02.
7±1.
80.
052.
9±2.
0
Follo
w-u
p tim
e,*
year
s2.
2±2.
22.
3±2.
22.
2±2.
22.
0±2.
10.
102.
2±2.
2
Min
i-M
enta
l Sta
te E
xam
27.4
±2.
3§‖#
27.0
±2.
5‡#
26.9
±2.
6‡#
26.5
±2.
8‡§‖
<0.0
0126
.9±
2.6
Dig
it Sp
an F
orw
ard
8.0±
2.1#
7.8±
2.1
7.8±
2.1
7.5±
2.1‡
0.00
27.
7±2.
1
Dig
it Sp
an B
ackw
ard
6.1±
2.3§‖#
5.7±
2.1‡
5.7±
2.0‡
5.5±
2.1‡
<0.0
015.
7+2.
1
Dig
it Sy
mbo
l Cod
ing
41.6
±12
.5§‖
#38
.1±
12.1
‡‖#
36.4
±12
.0‡§
#33
.5±
11.4
‡§‖
<0.0
0137
.2±
12.3
Tra
il M
akin
g T
est P
art A
**39
.6±
20.8
§‖#
43.8
±22
.5‡#
45.5
±22
.1‡#
51.3
±26
.3‡§‖
<0.0
0145
.3±
23.5
Tra
il M
akin
g T
est P
art B
**11
8.2±
71.6
§‖#
138.
7±76
.0‡#
145.
7±77
.0‡#
162.
2±79
.3‡§‖
<0.0
0114
2.5±
77.6
Ani
mal
Nam
ing
16.9
±5.
1§‖#
15.7
±4.
8‡#
15.3
±4.
7‡#
14.7
±4.
9‡§‖
<0.0
0115
.5±
4.9
Veg
etab
le N
amin
g11
.7±
4.0§‖#
10.9
±4.
0‡11
.0±
3.8‡
10.7
±3.
6‡<0
.001
11.0
±3.
9
Bos
ton
Nam
ing
Tes
t-30
item
25.4
±4.
9§‖#
24.1
±5.
1‡#
23.8
±5.
2‡23
.6±
5.1‡
§<0
.001
24.1
±5.
1
Log
ical
Mem
ory
Imm
edia
te R
ecal
l9.
5±4.
1§‖#
8.8±
4.3‡
8.8±
4.1‡
8.4±
4.1‡
<0.0
018.
9±4.
2
Log
ical
Mem
ory
Del
ayed
Rec
all
7.2±
4.8§‖#
6.3±
4.7‡‖#
6.2±
4.7
6.2±
4.4
0.00
16.
4±4.
6
Not
e: Q
uart
iles
are
mut
ually
exc
lusi
ve;
* Follo
w-u
p is
tim
e fr
om f
irst
to la
st U
DS
visi
t;
**hi
gher
sco
res
deno
te w
orse
per
form
ance
;
‡ diff
eren
t fro
m Q
1,
§ diff
eren
t fro
m Q
2,
‖ diff
eren
t fro
m Q
3,
# diff
eren
t fro
m Q
4, a
ll at
p<
0.05
J Alzheimers Dis. Author manuscript; available in PMC 2015 February 21.
NIH
-PA
Author M
anuscriptN
IH-P
A A
uthor Manuscript
NIH
-PA
Author M
anuscript
Jefferson et al. Page 20
Tab
le 4
Con
tinuo
us F
SRP
and
Cog
nitiv
e O
utco
mes
Cro
ss-s
ecti
onal
Out
com
esN
CM
CI
β95
% C
Ip-
valu
eβ
95%
CI
p-va
lue
Min
i-M
enta
l Sta
te E
xam
−0.
02−
0.03
, −0.
01<0
.000
1−
0.01
−0.
03, 0
.02
0.52
Dig
it Sp
an F
orw
ard
−0.
01−
0.03
, 0.0
00.
149
−0.
02−
0.04
, 0.0
00.
10
Dig
it Sp
an B
ackw
ard
−0.
02−
0.04
, −0.
010.
007
−0.
02−
0.04
, 0.0
00.
02
Dig
it Sy
mbo
l Cod
ing
−0.
39−
0.47
, −0.
31<0
.000
1−
0.12
−0.
24, 0
.00
0.05
Tra
il M
akin
g T
est P
art A
(lo
g)*
0.01
0.01
, 0.0
1<0
.000
10.
002
0.00
, 0.0
10.
34
Tra
il M
akin
g T
est P
art B
(lo
g)*
0.01
0.01
, 0.0
1<0
.000
10.
010.
00, 0
.01
0.04
Ani
mal
Nam
ing
−0.
06−
0.09
, −0.
020.
004
0.01
−0.
04, 0
.06
0.80
Veg
etab
le N
amin
g−
0.04
−0.
07, −
0.02
0.00
30.
02−
0.02
, 0.0
60.
37
Bos
ton
Nam
ing
Tes
t-30
Ite
m−
0.01
−0.
03, 0
.01
0.43
10.
070.
03, 0
.12
0.00
2
Log
ical
Mem
ory
Imm
edia
te R
ecal
l−
0.02
−0.
04, 0
.01
0.22
20.
002
−0.
04, 0
.05
0.94
Log
ical
Mem
ory
Del
ayed
Rec
all
−0.
03−
0.06
, 0.0
00.
067
0.04
−0.
01, 0
.09
0.14
Lon
gitu
dina
l Out
com
es**
NC
MC
I
β95
% C
Ip-
valu
eβ
95%
CI
p-va
lue
Min
i-M
enta
l Sta
te E
xam
−0.
01−
0.02
, −0.
01<0
.000
10.
003
−0.
01, 0
.02
0.67
Dig
it Sp
an F
orw
ard
−0.
004
−0.
01, −
0.00
2<0
.000
10.
002
−0.
003,
0.0
10.
47
Dig
it Sp
an B
ackw
ard
−0.
01−
0.01
, −0.
01<0
.000
10.
003
−0.
003,
0.0
10.
34
Dig
it Sy
mbo
l Cod
ing
−0.
07−
0.08
, −0.
06<0
.000
10.
03−
0.01
, 0.0
60.
10
Tra
il M
akin
g T
est P
art A
(lo
g)*
0.00
20.
001,
0.0
02<0
.000
10.
00−
0.00
1, 0
.001
0.86
Tra
il M
akin
g T
est P
art B
(lo
g)*
0.00
20.
001,
0.0
02<0
.000
10.
001
−0.
001,
0.0
020.
36
Ani
mal
Nam
ing
−0.
02−
0.03
, −0.
02<0
.000
10.
01−
0.01
, 0.0
20.
18
Veg
etab
le N
amin
g−
0.02
−0.
02, −
0.01
<0.0
001
−0.
01−
0.02
, 0.0
10.
29
Bos
ton
Nam
ing
Tes
t-30
item
−0.
02−
0.02
, −0.
01<0
.000
10.
001
−0.
01, 0
.02
0.88
Log
ical
Mem
ory
Imm
edia
te R
ecal
l−
0.02
−0.
03, −
0.02
<0.0
001
−0.
01−
0.02
, 0.0
10.
35
Log
ical
Mem
ory
Del
ayed
Rec
all
−0.
03−
0.03
, −0.
02<0
.000
1−
0.02
−0.
03, −
0.01
0.00
4
Not
e: C
I=co
nfid
ence
inte
rval
;
J Alzheimers Dis. Author manuscript; available in PMC 2015 February 21.

NIH
-PA
Author M
anuscriptN
IH-P
A A
uthor Manuscript
NIH
-PA
Author M
anuscript
Jefferson et al. Page 21* po
sitiv
e va
lues
den
ote
wor
se p
erfo
rman
ce;
**lo
ngitu
dina
l dat
a pr
esen
ted
as in
tera
ctio
n te
rm (
time
to f
ollo
w-u
p*FS
RP)
J Alzheimers Dis. Author manuscript; available in PMC 2015 February 21.

NIH
-PA
Author M
anuscriptN
IH-P
A A
uthor Manuscript
NIH
-PA
Author M
anuscript
Jefferson et al. Page 22
Tab
le 5
Cat
egor
ical
FSR
P an
d C
ross
-sec
tiona
l Cog
nitiv
e O
utco
mes
NC
Q2*
Q3*
Q4*
β95
% C
Ip-
valu
eβ
95%
CI
p-va
lue
β95
% C
Ip-
valu
e
Min
i-M
enta
l Sta
te E
xam
0.00
−0.
09, 0
.09
0.99
−0.
12−
0.23
, 0.0
00.
04−
0.26
−0.
38, −
0.13
<0.0
01
Dig
it Sp
an F
orw
ard
−0.
14−
0.28
, 0.0
00.
05−
0.18
−0.
35, 0
.00
0.05
−0.
15−
0.35
, 0.0
40.
12
Dig
it Sp
an B
ackw
ard
−0.
16−
0.31
, −0.
010.
04−
0.32
−0.
51, −
0.14
<0.0
01−
0.26
−0.
46, −
0.05
0.02
Dig
it Sy
mbo
l Cod
ing
−1.
55−
2.28
, −0.
82<0
.001
−3.
28−
4.19
, −2.
37<0
.001
−4.
30−
5.30
, −3.
29<0
.001
Tra
il M
akin
g T
est P
art A
(lo
g)**
0.02
0.00
, 0.0
40.
100.
040.
01, 0
.07
0.00
40.
080.
04, 0
.11
<0.0
01
Tra
il M
akin
g T
est P
art B
(lo
g)**
0.01
−0.
01, 0
.04
0.32
0.04
0.00
3, 0
.07
0.03
0.09
0.06
, 0.1
3<0
.001
Ani
mal
Nam
ing
−0.
32−
0.67
, 0.0
40.
08−
0.52
−0.
96, −
0.08
0.02
−0.
71−
1.20
, −0.
220.
004
Veg
etab
le N
amin
g−
0.19
−0.
47, 0
.08
0.17
−0.
31−
0.65
, 0.0
30.
08−
0.58
−0.
95, −
0.20
0.00
2
Bos
ton
Nam
ing
Tes
t-30
Ite
m−
0.02
−0.
23, 0
.19
0.86
0.20
−0.
05, 0
.46
0.12
−0.
20−
0.49
, 0.0
80.
17
Log
ical
Mem
ory
Imm
edia
te R
ecal
l−
0.24
−0.
49, 0
.02
0.07
−0.
31−
0.63
, 0.0
00.
05−
0.26
−0.
60, 0
.09
0.15
Log
ical
Mem
ory
Del
ayed
Rec
all
−0.
19−
0.47
, 0.0
80.
17−
0.21
−0.
55, 0
.13
0.22
−0.
30−
0.67
, 0.0
80.
12
MC
IQ
2*Q
3*Q
4*
β[9
5% C
I]p-
valu
eβ
[95%
CI]
p-va
lue
β[9
5% C
I]p-
valu
e
Min
i-M
enta
l Sta
te E
xam
−0.
11−
0.39
, 0.1
70.
460.
02−
3.03
, 0.3
40.
92−
0.15
−0.
49, 0
.20
0.41
Dig
it Sp
an F
orw
ard
−0.
19−
0.42
, 0.0
40.
11−
0.14
−0.
40, 0
.12
0.30
−0.
32−
0.61
, −0.
040.
03
Dig
it Sp
an B
ackw
ard
−0.
31−
0.53
, −0.
080.
01−
0.23
−0.
49, 0
.02
0.08
−0.
36−
0.64
, −0.
080.
01
Dig
it Sy
mbo
l Cod
ing
−0.
48−
1.74
, 0.7
90.
46−
0.73
−2.
17, 0
.71
0.32
−1.
84−
3.42
, −0.
030.
02
Tra
il M
akin
g T
est P
art A
(lo
g)**
−0.
002
−0.
05, 0
.04
0.94
−0.
02−
0.67
, 0.0
40.
530.
04−
0.02
, 0.0
90.
17
Tra
il M
akin
g T
est P
art B
(lo
g)**
0.05
0.00
, 0.1
10.
050.
04−
0.02
, 0.1
00.
190.
100.
03, 0
.17
0.00
4
Ani
mal
Nam
ing
−0.
30−
0.84
, 0.2
30.
27−
0.18
−0.
79, 0
.43
0.56
−0.
34−
1.00
, 0.3
20.
31
Veg
etab
le N
amin
g−
0.30
−0.
72, 0
.13
0.17
−0.
09−
0.57
, 0.3
90.
71−
0.09
−0.
61, 0
.43
0.73
Bos
ton
Nam
ing
Tes
t-30
Ite
m−
0.28
−0.
80, 0
.24
0.29
0.02
−0.
57, 0
.61
0.95
0.38
−0.
26, 1
.02
0.24
Log
ical
Mem
ory
Imm
edia
te R
ecal
l−
0.24
−0.
71, 0
.24
0.33
−0.
06−
0.60
, 0.4
90.
84−
0.19
−0.
78, 0
.40
0.52
Log
ical
Mem
ory
Del
ayed
Rec
all
−0.
32−
0.86
, 0.2
10.
24−
0.17
−0.
78, 0
.43
0.57
0.09
−0.
57, 0
.75
0.79
Not
e: C
I=co
nfid
ence
inte
rval
;
J Alzheimers Dis. Author manuscript; available in PMC 2015 February 21.

NIH
-PA
Author M
anuscriptN
IH-P
A A
uthor Manuscript
NIH
-PA
Author M
anuscript
Jefferson et al. Page 23* re
fere
nt=
Q1;
**po
sitiv
e va
lues
den
ote
wor
se p
erfo
rman
ce
J Alzheimers Dis. Author manuscript; available in PMC 2015 February 21.

NIH
-PA
Author M
anuscriptN
IH-P
A A
uthor Manuscript
NIH
-PA
Author M
anuscript
Jefferson et al. Page 24
Tab
le 6
Cat
egor
ical
FSR
P an
d L
ongi
tudi
nal C
ogni
tive
Out
com
es
NC
Q2*
Q3*
Q4*
β95
% C
Ip-
valu
eβ
95%
CI
p-va
lue
β95
% C
Ip-
valu
e
Min
i-M
enta
l Sta
te E
xam
−0.
07−
0.10
, −0.
03<0
.001
−0.
08−
0.12
, −0.
05<0
.001
−0.
19−
0.23
, −0.
15<0
.001
Dig
it Sp
an F
orw
ard
−0.
02−
0.05
, 0.0
040.
11−
0.03
−0.
06, 0
.00
0.03
1−
0.05
−0.
08, −
0.02
0.00
1
Dig
it Sp
an B
ackw
ard
−0.
05−
0.07
, −0.
02<0
.001
−0.
06−
0.09
, −0.
03<0
.001
−0.
09−
0.12
, −0.
06<0
.001
Dig
it Sy
mbo
l Cod
ing
−0.
37−
0.49
, −0.
24<0
.001
−0.
58−
0.72
, −0.
45<0
.001
−0.
85−
0.99
, −0.
71<0
.001
Tra
il M
akin
g T
est P
art A
(lo
g)**
0.01
0.01
, 0.0
2<0
.001
0.02
0.01
, 0.0
2<0
.001
0.02
0.02
, 0.0
3<0
.001
Tra
il M
akin
g T
est P
art B
(lo
g)**
0.01
0.01
, 0.0
2<0
.001
0.02
0.01
, 0.0
2<0
.001
0.02
0.02
, 0.0
3<0
.001
Ani
mal
Nam
ing
−0.
14−
0.21
, −0.
06<0
.001
−0.
22−
0.30
, −0.
14<0
.001
−0.
30−
0.39
, −0.
22<0
.001
Veg
etab
le N
amin
g−
0.11
−0.
17, −
0.05
<0.0
01−
0.18
−0.
25, −
0.12
<0.0
01−
0.22
−0.
29, −
0.15
<0.0
01
Bos
ton
Nam
ing
Tes
t-30
Ite
m−
0.04
−0.
09, 0
.003
0.06
−0.
11−
0.16
, −0.
06<0
.001
−0.
23−
0.28
, −0.
17<0
.001
Log
ical
Mem
ory
Imm
edia
te R
ecal
l−
0.09
−0.
15, −
0.03
0.01
−0.
21−
0.28
, −0.
14<0
.001
−0.
29−
0.36
, −0.
22<0
.001
Log
ical
Mem
ory
Del
ayed
Rec
all
−0.
13−
0.20
, −0.
06<0
.001
−0.
26−
0.34
, −0.
19<0
.001
−0.
36−
0.43
, −0.
28<0
.001
MC
IQ
2*Q
3*Q
4*
β[9
5% C
I]p-
valu
eβ
[95%
CI]
p-va
lue
β[9
5% C
I]p-
valu
e
Min
i-M
enta
l Sta
te E
xam
−0.
26−
0.45
, −0.
070.
01−
0.12
−0.
32, 0
.08
0.24
−0.
07−
0.28
, 0.1
40.
52
Dig
it Sp
an F
orw
ard
0.11
0.05
, 0.1
7<0
.001
0.05
−0.
02, 0
.11
0.14
0.07
0.01
, 0.1
40.
04
Dig
it Sp
an B
ackw
ard
0.09
0.02
, 0.1
60.
010.
080.
01, 0
.15
0.03
0.04
−0.
04, 0
.11
0.32
Dig
it Sy
mbo
l Cod
ing
−0.
004
−0.
43, 0
.42
0.99
0.29
−0.
16, 0
.74
0.21
0.27
−0.
19, 0
.74
0.25
Tra
il M
akin
g T
est P
art A
(lo
g)**
0.00
2−
0.01
, 0.0
20.
86−
0.00
4−
0.02
, 0.0
10.
690.
001
−0.
02, 0
.02
0.88
Tra
il M
akin
g T
est P
art B
(lo
g)**
0.01
−0.
01, 0
.03
0.23
0.01
−0.
01, 0
.03
0.31
0.01
−0.
01, 0
.03
0.21
Ani
mal
Nam
ing
0.04
−0.
15, 0
.23
0.70
0.07
−0.
13, 0
.27
0.48
0.11
−0.
10, 0
.31
0.30
Veg
etab
le N
amin
g−
0.04
−0.
19, 0
.11
0.58
−0.
05−
0.20
, 0.1
10.
57−
0.09
−0.
25, 0
.08
0.30
Bos
ton
Nam
ing
Tes
t-30
Ite
m−
0.18
−0.
38, 0
.02
0.07
−0.
09−
0.30
, 0.1
20.
40−
0.03
−0.
24, 0
.18
0.80
Log
ical
Mem
ory
Imm
edia
te R
ecal
l−
0.12
−0.
28, 0
.03
0.12
−0.
13−
0.30
, 0.0
30.
11−
0.08
−0.
25, 0
.09
0.37
Log
ical
Mem
ory
Del
ayed
Rec
all
−0.
2−
0.36
, −0.
050.
01−
0.14
−0.
31, 0
.02
0.08
−0.
26−
0.42
, −0.
090.
003
Not
e: D
ata
pres
ente
d as
inte
ract
ion
term
(tim
e to
fol
low
-up*
FSR
P qu
artil
e);
J Alzheimers Dis. Author manuscript; available in PMC 2015 February 21.
NIH
-PA
Author M
anuscriptN
IH-P
A A
uthor Manuscript
NIH
-PA
Author M
anuscript
Jefferson et al. Page 25C
I=co
nfid
ence
inte
rval
;
* refe
rent
=Q
1;
**po
sitiv
e va
lues
den
ote
wor
se p
erfo
rman
ce
J Alzheimers Dis. Author manuscript; available in PMC 2015 February 21.