advertising and market structure
TRANSCRIPT
Advertising and Market Structure
A Study of the Norwegian Laundry
Detergent Market
Espen Bakke-Aas Steiro
Master Thesis for the Degree Master of Philosophy in Economics
UNIVERSITY OF OSLO
02. May 2011

II
Advertising and Market Structure
A Study of the Norwegian Laundry Detergent Market
© Espen Bakke-Aas Steiro
2011
Advertising and Market Structure, A Study of the Norwegian Laundry Detergent Market
Espen Bakke-Aas Steiro
http://www.duo.uio.no/
Print: Reprosentralen, University of Oslo

III
Summary
The Norwegian laundry detergent market is highly concentrated. Throughout the history of
industry, Lilleborg, has had an almost monopolistic position in the market with only a few
competitors, and none of comparable size. This thesis takes us through the history of the
Norwegian market from the birth of the Norwegian soap industry by Akerselva in Oslo,
through a resigning prime minister, a detergent war, and environmental concerns ending up in
the modern detergent industry. Through World War, attempted entry and environmental
changes, the market leader remains the number one producer of laundry detergent in Norway.
Based on the history of the industry, the developments of market structure, and entry and exit
in the Norwegian laundry detergent industry is analyzed using a foundation based on
economic theory. The theories introduced describe the industry life cycle as well as how
advertising, an important part of the laundry detergent market, affects structure. In addition,
theory describing how a firm may act strategically to maintain a dominant market position is
introduced.
Analysis of the Norwegian detergent market is fundamentally based on the industry life cycle,
and how market structure has developed over time. In its infancy, the soap and detergent
industry had several large local producers. As time passed, more and more of the local
producers dropped out of the market. After the industry matured, entry became more costly.
Increasing entry costs meant few companies succeeded in entering the Norwegian detergent
market after maturity.
This thesis analyzes when the industry developed into a mature state, and how industry
maturity affected entry. The effect of maturity on entry is largely analyzed through how
effective advertising was in breaking down brand loyalty. Because brand quality is important
in determining how effective advertising is, this thesis will attempt to explain how an
incumbent may increase the cost of entry by making sure brand quality is similar or superior
to potential entrant brands.
The result of the analysis provided is that current market structure in detergent markets today
is mostly the same as in the late 1930s. The explanation underlying this result is that the
detergent industry at this point was maturing, and entry by new firms proved costly. In most

IV
cases this high cost of entry has been effective in deterring new entrants, and hence market
structure has remained largely unchanged for the majority of the last 70 years.

V
Preface
In working with this thesis I have developed an enthusiasm and interest for a product and a
market I before had a relatively ambivalent relationship to. I have found the history and
workings of the laundry detergent market to be profoundly interesting. I hope I have been able
to translate some of this enthusiasm into a readable and interesting thesis.
I would like to thank my sister Christine Steiro for introducing me to the world of laundry
detergents and for putting me in contact with the right people at Lilleborg. Thanks to my
supervisor, Karen-Helene Ulltveit Moe for invaluable feedback especially during the last few
hectic weeks. I would also like to thank all the people at Lilleborg that have helped me find
data and information about laundry detergent markets, and especially Jenny Wolther at the
Lilleborg Museum. Special thanks also go to Espen Willassen Hoel, Rasmus Bøgh Holmen,
Martin Tufte Fjellanger, Mari Raddum Berg and Astrid Harjo for reading my thesis and
providing valuable feedback. Finally, thanks to my friends, family and fellow students at the
4th
floor for holding out on my never ending talk about laundry detergents in what has been a
thoroughly enjoyable and interesting semester.
Mistakes and inaccuracies are all mine. And as my old friend Al Gore once said: „the day I
made that statement, about inventing the Internet, I was tired because I‟d been up all night
inventing the camcorder‟.

VI
Contents
1 Introduction ........................................................................................................................ 1
2 About Laundry Detergents ................................................................................................. 3
2.1 Detergent Markets ....................................................................................................... 3
2.1.1 World Markets ...................................................................................................... 3
2.1.2 History of the Norwegian Market ........................................................................ 4
2.1.3 Current Market Situation ...................................................................................... 8
2.1.4 Production ............................................................................................................ 9
2.1.5 Lilleborg‟s Strategies ......................................................................................... 10
2.1.6 Why Tag and Ajax Failed in 1967 ..................................................................... 11
2.2 Advertising in Detergent Markets ............................................................................. 11
2.2.1 History ................................................................................................................ 11
2.2.2 Advertising Messages ........................................................................................ 14
3 Theory .............................................................................................................................. 16
3.1 Advertising and Market Structure ............................................................................. 16
3.1.1 Product Differentiation ....................................................................................... 16
3.1.2 Economies of Scale ............................................................................................ 18
3.1.3 Depreciable Advertising ..................................................................................... 19
3.1.4 Brand Loyalty ..................................................................................................... 23
3.2 The Dynamics of Market Structure ........................................................................... 26
3.2.1 Industry Life Cycle ............................................................................................. 26
3.3 Price Competition and Strategic Commitment .......................................................... 28
3.3.1 Price Competition ............................................................................................... 28
3.3.2 Games of Commitment ...................................................................................... 29
3.3.3 Monopolization by Brand Proliferation ............................................................. 30
4 Explaining Market Structure ............................................................................................ 31
4.1 Maturity of Detergent Markets .................................................................................. 31
4.2 Effectiveness of Advertising ..................................................................................... 34
4.2.1 The Rise of Blenda ............................................................................................. 34
4.2.2 The Failure of Tag and Ajax .............................................................................. 37
4.2.3 1935 and 1967 – A Comparison ......................................................................... 47
4.3 Brand Loyalty and Trade Liberalization ................................................................... 49

VII
4.4 Other Entry Barriers .................................................................................................. 50
4.5 Current Detergent Markets ........................................................................................ 52
5 Conclusions ...................................................................................................................... 54
Sources ..................................................................................................................................... 58
Appendix .................................................................................................................................. 63
Figures
1: Market shares top 3 brands .................................................................................................... 8
2: Market shares excluding Omo ............................................................................................... 9
3: Market shares Persil (1950 and 1960) .................................................................................. 13
4: The industry life cycle (Agrawal & Gort 1996 p. 490) ........................................................ 26
5: Firms producing soap and detergents (1827-1994) .............................................................. 33
6: Development of the number of firms including small firms (red line) and excluding small
firms (blue line) (1940-1994) ................................................................................................... 33
7: Lilleborg advertising (1920-1935) ....................................................................................... 35
8: Lilleborg market share (1964-1970) .................................................................................... 38
9: Market shares Lilleborg brands (1964-1970) ....................................................................... 38
10: Detergent sales (1964-1970) .............................................................................................. 39
11: Advertising 1967 ................................................................................................................ 41
12: Advertising Blenda, Sol, Omo 1964-1970 ......................................................................... 41
13: Detergent prices for major brands 1968-1969 .................................................................. 42
14: High quality (Omo, Tag, Ajax) and low quality brands (Blenda and Sol) 1966-1970 ...... 43
16: Market shares Bio-Tex, Tag, Ajax 1967-1970 ................................................................... 45
15: Total market share Bio-Tex, Tag, Ajax 1967-1970 ........................................................... 45
17: Detergent prices for Lilleborg brands 1965-1969 .............................................................. 46
18: STPP use in Western Europe ............................................................................................. 50
19: Product launches 1989-2011 .............................................................................................. 51
20: Product launches 1989-2011 .............................................................................................. 52
21: Market shares Blenda and Ariel (2007-2010) .................................................................... 53


1
1 Introduction
Consumers in Norway have relatively few choices when shopping for laundry detergent. This
lack of options may be illustrated by a simple comparison between Norwegian and European
markets. In Norway, Lilleborg control the three major brands and has a market share of 80
percent, while in Europe, three companies have a combined market share of approximately 76
percent. How can we explain this asymmetry between Norwegian and European markets?
Why does Lilleborg control such a large market share of the Norwegian market, while
European markets are less concentrated?
The times they are a-changing is the title of a song by American singer songwriter Bob Dylan.
Relating mostly to the currents of youth rebellion in the United States in the 1960s, the song
also captures the situation in Norwegian consumer goods markets at the time. Lilleborg had
been the major actor in Norwegian detergent markets since the mid-1930s. In 1960, the EFTA
agreement was signed, and trade barriers were about to be removed, opening Norwegian
markets for imports from abroad. Norwegian industry feared international competition, and
the laundry detergent market was no exception.
Following trade liberalization, major American companies attempted to enter the Norwegian
market. After a massive advertising war, the American companies gave up, and the status quo
prevailed. Why was the large American multinationals unable to enter Norwegian detergent
markets in the 1960s? In the following thesis I will analyze the events and developments
during the detergent war as well as developments before World War II in an attempt to
explain why things in fact did not change, and why market structure today is largely the same
as it was in the late 1930s.
Developments in the detergent market seem to contradict standard economic theory. Where
there are profit opportunities, firms will enter the market until profits are driven down to zero.
Why have we not seen this development in the market for laundry detergents in Norway? In
an attempt to explain this apparent asymmetry between observed market structure and basic
economic theory, I will draw on several explanatory frameworks, such as industry life cycle
theory to explain why market structure have been fairly stable despite the apparent profit
opportunities.
2
Advertising is an important part of laundry detergent markets. In an attempt to explain current
market structure I will also introduce theory that attempts to explain how advertising may
affect market structure.
Because Lilleborg has a long history as the market leader, it seems unlikely that the company
has not taken steps to make sure they maintain their strong position. In this thesis I will thus
examine how the market leader may have acted strategically to retain their market share.
This thesis will be structured in five main chapters. This chapter provides an introduction to
the problem and an overview of the thesis. Chapter 2 provides an overview of the detergents
industry in Norway and the World. Chapter 2 will also introduce how advertising is an
important part of the value chain in laundry detergents. Chapter 3 presents theory on how
advertising may affect market structure, industry life cycle theory and some insights relevant
to analyzing entry deterring strategies that may have been employed. Chapter 4 takes a look at
the Norwegian laundry detergent market in the light of theory introduced in the preceding
chapter. Chapter 5 provides concluding remarks.

3
2 About Laundry Detergents
This chapter will provide an introduction to history and current state of laundry detergent
markets with an emphasis on the developments in Norway. Because of the special importance
attached to advertising of laundry detergent, one section will also be devoted to this.
2.1 Detergent Markets
Markets for laundry detergents may be divided in two, one market for business customers like
hospitals, large firms and the government, and one market for consumers where laundry
detergent is sold over the counter in grocery outlets. This thesis will focus on the consumer
market for laundry detergents.
Laundry detergent is a so called Fast Moving Consumer Good (FMCG). FMCG‟s are
typically goods sold at a low price and at low margins. Despite their low margins, FMCGs are
sold in large volumes, hence giving rise to large profit opportunities (Gordon, 1999, p. 1).
2.1.1 World Markets
The detergent industry has been dominated by four firms worldwide. The European
companies Unilever and Henkel, and American consumer good companies Procter & Gamble
(P&G) and Colgate Palmolive. P&G recently purchased Colgate Palmolive‟s Western
European laundry detergent business, reducing “the big four” in world detergent markets to
three.
Unilever is the traditional giant on the European stage. Unilever was formed when the English
soap producer Lever Brothers merged with the Dutch margarine firm Margarine Unie in 1929.
Most of Unilever‟s sales in detergents are made in Western Europe, America and many
emerging markets. In 1961, Unilever estimated they accounted for 60 percent of world sales
of soap and detergents, their position deriving from barriers to entry arising from economies
of scale in production, research and marketing (Jones, 2005, p. 11). During the 1960s
Unilever became increasingly concerned about the emergence of private label products. A
private label product is a brand manufactured and sold by supermarket chains. After
considering several responses, among them third party manufacturing of private label

4
products, Unilever decided to concentrate on supporting their own premium brands and leave
the low end of the market to the private labels.
Unilever fiercest competitor in detergents is Procter & Gamble, today the largest actor in the
European market based on sales. P&G is largely focused on developed markets and its home
market in the United States. Europe‟s third largest producer, Henkel, was originally a
detergent company but later integrated vertically into chemicals. Ownership of the Persil
brand is shared between Henkel and Unilever.
The growth of private label in detergents was slow in Western Europe. Jones (2005, p. 138)
argues that this is because detergents build up strong relationships with consumers through
advertising and consistent performance in cleaning clothes.
2.1.2 History of the Norwegian Market
One of the characteristics of Norwegian detergent markets is Lilleborg‟s dominance. The
market leader‟s position has also affected the sources available on laundry detergent market
history. Most sources focus on Lilleborg. Because of this bias in existing literature the history
of Norwegian laundry detergent markets provided here is, unfortunately, biased towards
events occurring in and around the company from Sandaker, Oslo.
The Growth of Lilleborg – The Detergent Market Before 1967
In the 1920s, Lever Brothers was eager to expand its detergent business in Norway. Lever‟s
plan was to increase its market share through ownership of Denofa and the Kongsten soap
factory in Fredrikstad.1 Lever‟s plans of taking over Norwegian markets were not met with
enthusiasm by Lilleborg‟s management. Their initial reaction was to fight back. Already in
1926, Lilleborg had acquired a share of stock in Denofa from a German-Norwegian
businessman (Sandvik 2010:398). When Unilever was established through merger in 1929,
the newly formed soap and margarine giant pointed to Norway for further growth. After the,
Lilleborg‟s stance in the battle for the Norwegian soap market changed from fight to
cooperate. Lilleborg and Unilever negotiated an agreement where they would share ownership
of Denofa, while Denofa owned a share of Lilleborg. This gave Unilever indirect control of
1 Denofa was the world‟s largest producer of whale- and seal-oil, an important raw material used in production
of margarine and soap. Its value to Unilever was therefore more than just the possible profits from sales of soap
and margarine in Norwegian markets.
5
Lilleborg. Norwegian anti-trust authorities were concerned about Unilever‟s purchase of
Norwegian business interests. After a long process through parliament and government, the
Unilever purchase of Lilleborg stock through Denofa was approved by cabinet July 10th
1931.2 The agreement between Unilever and Lilleborg gave Lilleborg the right to distribute
Unilever‟s brands in the Norwegian market. In 1933 Lilleborg took over production of
Unilever‟s product range in Norway.
Henkel was the first company to introduce a specialized detergent in Norway, when they
introduced their Persil brand in 1930 (Lund, 2008, p. 44). In 1935 Lilleborg followed by
launching Blenda. According Ole Christian Moe, manager of Lilleborg‟s detergent business
in the 1970s, the launch of Blenda meant a “revolution in the detergent market” (Jacobsen,
1976, p. 90).3 Among the inventions provided by Blenda was that it dissolved in water,
relieving housewives of physically demanding scrubbing. Blenda also contained a bleach
system to keep textiles white. Before 1940, Blenda passed Persil as the largest detergent in
Norway (Lund, 2008, p. 78). For smaller factories the pressure of competition was getting
tough (Jensen, 1999). One attempt to prosper among the large producers was increased
cooperation.4
During World War II Norway was occupied by Nazi Germany. With help from the occupying
forces, German detergent producer Henkel won market shares in an environment that was
characterized by lack of raw material (Lund, 2008, p. 81). The lack of raw material was so
severe that manufacturers could not produce detergent of the same quality level as before the
war. Both Lilleborg and Henkel sold their detergents without brand names in this period.
After the war, the Persil factory in Moss, owned by the German company Henkel, was taken
over by the Norwegian government as enemy property, and put into new ownership. Although
the war ended, the shortage of raw material persisted until 1950.
2 The agreement was accepted under somewhat strange circumstances. The Mowinckel-government, who
supported Unilever‟s purchase of stock, lost a non-confidence vote on the subject May 8th 1931 and had to
resign. The new government changed their stance and accepted the Purchase, but only after the Norwegian
minister of trade, Per Larssen attempted to intervene. Larssen had been a strong spokesman against the purchase.
Under unknown circumstances, Larssen took a sudden leave of absence to attend a fisheries meeting in Harstad
before the crucial cabinet vote (Sandvik, 2010, p. 413). 3 My translation
4 One successful attempt was the cooperation between Goma in Kristiansund, and Jahre chemical factories in
Sandefjord. The two smaller producers developed a highly successful detergent. The cooperation between the
two smaller factories came to an abrupt stop in 1945 when an English airplane was shot down and crashed in
Jahre factories‟ facilities during World War II (Jensen, 1999, pp. 45-46).

6
In 1950 the detergent companies once again claimed they could produce detergent of the same
quality as before the war. As a consequence, detergent producers reintroduced brand names to
their products. After launching their brands in January, Blenda immediately won a significant
share of the market. In this new market environment, Blenda and Persil were the two major
competitors, while Tomtevask, a smaller producer, also had a significant market share.
The Detergent War (1967-70)
Believing further growth to be impossible, Lilleborg followed a strategy of defending its
market position throughout the 1960s. Following the signing of the EFTA agreement in 1960,
all import restrictions on industrial goods to Norway were lifted from January 1st. 1967.5 This
opened the Norwegian laundry detergent markets for imports from abroad.
Colgate‟s successful launch of their Ajax detergent in Denmark caused concern within
Lilleborg. In 1965 the market leader was certain that Colgate had taken over Persil‟s position
as their main competitor in many segments such as toothpaste, and that a launch in laundry
detergents was imminent (Lund, 2008, pp. 188-189). In 1967, P&G and Colgate entered
Norwegian detergent markets. For Lilleborg the detergent war was a matter of life and death.
They were determined to do whatever necessary to make sure their American rivals did not
achieve the 10 percent market share the market leader had calculated was necessary to break-
even (Lund, 2008, p. 48). Lilleborg succeeded and the two American giants withdrew their
products in 1970.
When the dust settled after the detergent war, Lilleborg reclaimed their position in Norwegian
detergent markets. Already before war broke out in the detergent market, their main
competitor through the 1950s, Persil experienced problems. P&G made a bid for the
company, but the factory owners wanted to keep ownership within Norway (Lilleborg, 1983,
p. 31). Lilleborg took over the Persil factory in 1967 in a move that gave them control over all
the factory‟s brand names, among them the Persil Brand. Following the detergent war,
Lilleborg continued to strengthen their position in the detergent market6.
5 According to Lilleborg‟s annual report for 1967, interest for several of their markets had been growing, but
interest in the detergent market (their most profitable segment) was noticeable only after the EFTA agreement
removed tariffs on industrial goods from 1967 (Lilleborg Annual Report (1967)). 6 Lilleborg purchased the majority of stocks in the Goma factory in Kristiansund in 1975 (Jensen, 1999, p. 83)

7
Towards a Modern Detergent Industry
In the 1970s, Norwegian housewives climbed the barricades to fight for the environment.
Public attention was drawn towards pollution in Norway‟s largest lake, Mjøsa. The
environmental problems were caused by Eutrophication, a chemical process caused by high
levels of nitrogen and phosphorous in water. Eutrophication causes excessive growth of algae
that again disturbs the ecosystem through reduced oxygen levels. Phosphorous pollution in
Mjøsa was caused by several factors, one of them was Sodium tri-polyphosphates (STPP),
used as a builder in laundry detergents. With laundry detergents containing STPP as their
enemy, local housewives campaigned for the use of detergents with reduced STPP content.
Through the public program „Save Mjøsa‟, environmental minister at the time, Gro Harlem
Brundtland, introduced a comprehensive program aimed at saving the lake from pollution. As
a part of the program STPP was banned in detergents from 1988. The environmental action
and later ban of STPP in detergents caused a significant effort within detergent companies to
develop alternative detergent formulations without STPP.
Throughout the 1990s liquid detergents became increasingly popular, and regular washing
powder was replaced by micro powder; a more concentrated washing powder. At this time, a
number of new product variants were introduced. This was consistent with a strategy where
the market leader launched several product variants to fill all possible niches that might arise
(Sørgard, 1997, p. 129). In 1996 Lilleborg demerged with Denofa, 27 years after merging
with their long term industrial partner. After separating the two companies, Lilleborg was to
focus attention on the branded consumer business, while Denofa was to develop its oil
business (Thoner, 2006, p. 72).
In 1997 Lilleborg opened a new detergent factory in Ski, outside of Oslo. After the opening of
the factory, Lilleborg shut down its detergent production by Akerselva in Oslo, closing the
book on 164 years of soap and detergent production in the Norwegian capital. Today,
Lilleborg‟s headquarters remain in the company‟s historical birthplace in Sandaker, Oslo
(Thoner, 2006, p. 72).
8
The Second Detergent War
In 2008, P&G again entered the Norwegian detergent market with their Ariel brand 38 years
after they gave up establishing Tag as a brand. In addition to P&G, an American consumer
goods company, Sara Lee, is present in the market with their Neutral brand, as well as Bio-
Tex. A number of private label products have also surfaced in the detergent market over the
last decades.
2.1.3 Current Market Situation
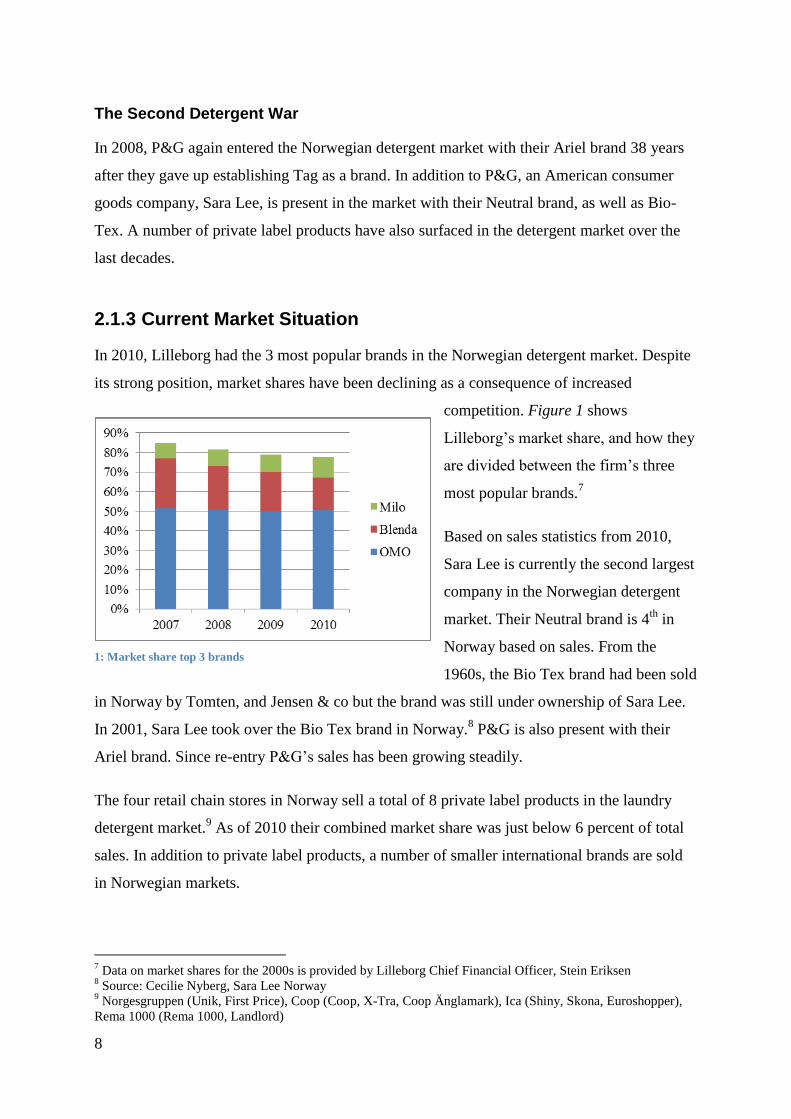
In 2010, Lilleborg had the 3 most popular brands in the Norwegian detergent market. Despite
its strong position, market shares have been declining as a consequence of increased
competition. Figure 1 shows
Lilleborg‟s market share, and how they
are divided between the firm‟s three
most popular brands.7
Based on sales statistics from 2010,
Sara Lee is currently the second largest
company in the Norwegian detergent
market. Their Neutral brand is 4th
in
Norway based on sales. From the
1960s, the Bio Tex brand had been sold
in Norway by Tomten, and Jensen & co but the brand was still under ownership of Sara Lee.
In 2001, Sara Lee took over the Bio Tex brand in Norway.8 P&G is also present with their
Ariel brand. Since re-entry P&G‟s sales has been growing steadily.
The four retail chain stores in Norway sell a total of 8 private label products in the laundry
detergent market.9 As of 2010 their combined market share was just below 6 percent of total
sales. In addition to private label products, a number of smaller international brands are sold
in Norwegian markets.
7 Data on market shares for the 2000s is provided by Lilleborg Chief Financial Officer, Stein Eriksen
8 Source: Cecilie Nyberg, Sara Lee Norway
9 Norgesgruppen (Unik, First Price), Coop (Coop, X-Tra, Coop Änglamark), Ica (Shiny, Skona, Euroshopper),
Rema 1000 (Rema 1000, Landlord)
1: Market share top 3 brands
9
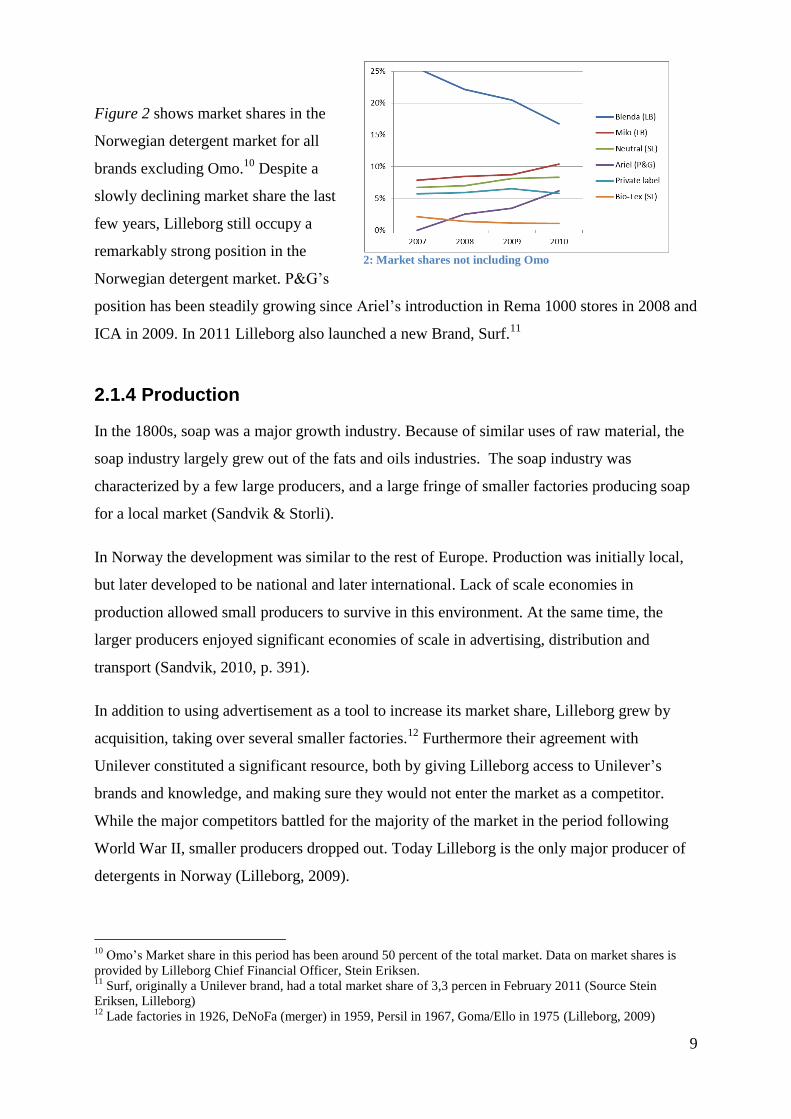
Figure 2 shows market shares in the
Norwegian detergent market for all
brands excluding Omo.10
Despite a
slowly declining market share the last
few years, Lilleborg still occupy a
remarkably strong position in the
Norwegian detergent market. P&G‟s
position has been steadily growing since Ariel‟s introduction in Rema 1000 stores in 2008 and
ICA in 2009. In 2011 Lilleborg also launched a new Brand, Surf.11
2.1.4 Production
In the 1800s, soap was a major growth industry. Because of similar uses of raw material, the
soap industry largely grew out of the fats and oils industries. The soap industry was
characterized by a few large producers, and a large fringe of smaller factories producing soap
for a local market (Sandvik & Storli).
In Norway the development was similar to the rest of Europe. Production was initially local,
but later developed to be national and later international. Lack of scale economies in
production allowed small producers to survive in this environment. At the same time, the
larger producers enjoyed significant economies of scale in advertising, distribution and
transport (Sandvik, 2010, p. 391).
In addition to using advertisement as a tool to increase its market share, Lilleborg grew by
acquisition, taking over several smaller factories.12
Furthermore their agreement with
Unilever constituted a significant resource, both by giving Lilleborg access to Unilever‟s
brands and knowledge, and making sure they would not enter the market as a competitor.
While the major competitors battled for the majority of the market in the period following
World War II, smaller producers dropped out. Today Lilleborg is the only major producer of
detergents in Norway (Lilleborg, 2009).
10
Omo‟s Market share in this period has been around 50 percent of the total market. Data on market shares is
provided by Lilleborg Chief Financial Officer, Stein Eriksen. 11
Surf, originally a Unilever brand, had a total market share of 3,3 percen in February 2011 (Source Stein
Eriksen, Lilleborg) 12
Lade factories in 1926, DeNoFa (merger) in 1959, Persil in 1967, Goma/Ello in 1975 (Lilleborg, 2009)
2: Market shares not including Omo
10
2.1.5 Lilleborg’s Strategies
After brand names were reintroduced to laundry detergents in 1950, Lilleborg spent only a
little time to regain their pre-war position in competition with Persil. After this, Lilleborg has
been in a position where focus has been on maintaining its market share rather than continued
growth.
Throughout the 1960s Lilleborg focused of developing its products continuously through
research and development. If in a given period of time, the product could not point to any
improvements in the chemical formulae, advertisement would focus on new areas so as to
give the impression of a product in continuous change for the benefit of the housewife.13
The
focus on research and development is still an important part of Lilleborg‟s philosophy. Thoner
(2006, p. 76) writes “Lilleborg‟s objective is to hold the number 1 and 2 positions in the
categories in which they compete, and the strategy is top line growth, mainly through
innovations”.
Even though the Persil brand no longer is a significant presence in Norwegian consumer
markets, control over this brand might have been an important strategic move by Lilleborg.
The owner of the Persil brand in Europe, Henkel, lost control of their Norwegian assets after
World War II. The Persil brand is still used by Lilleborg in 2011 but only in the business
market.
In a seminar organized by Norwegian competition authorities in 1993, Halvord Stensvold,
Chief Executive Officer of Orkla, Lilleborg‟s parent company, is quoted as saying
„[Lilleborg] developed a variety of products in the laundry detergent market to “fill all black
holes”‟ (Sørgard, 1997, p. 127).14
By introducing many product variants, Lilleborg wanted to
prevent profitable market segments to arise. Since Lilleborg established market leadership
after brands were re-introduced after World War 2, the number of product variants has been
increasing steadily. Compared to preceding periods, Lilleborg launched more products in the
period leading up to the detergent war in 1967. The same pattern is observed in the period
leading up to what may be termed the second detergent war in the first decade of the new
millennium. Lilleborg‟s use of product proliferation as strategy of maintaining a dominant
position is also well argued in Sørgard (1997).
13
An example is the launch of the larger size pack of detergent made to save housewives time by reducing the
amount of trips they had to make to supermarkets. 14
My translateion. In Norwegian, Stensvold said “fylle alle sorte hull”
11
2.1.6 Why Tag and Ajax Failed in 1967
Lund‟s (2008) analysis of why P&G and Colgate failed to establish Tag and Ajax in
Norwegian markets is based on an article by marketing manager of Lilleborg Ole Christian
Moe. According to Moe, there were four reasons why Lilleborg won the war.
1. Continuing product improvements
2. P&G‟s test launch of Tag in two counties in Norway.
3. The lack of TV advertisement in Norway.
4. A mix of particularly Norwegian circumstances, among these a boycott keeping Tag
and Ajax away from 20% of Norwegian grocery store outlets.
Moe also highlight Lilleborg‟s cooperation with Unilever as an important factor (Lund, 2008,
p. 39). Lund points to Lilleborg‟s marketing methods in her analysis, and the fact that
Lilleborg accumulated significant knowledge in competing with other brands during the
1950s and early 1960s.
2.2 Advertising in Detergent Markets
Advertising is an important part of Laundry detergent markets. Below we will see the
development of advertising in the Norwegian market as well as a brief discussion on how
advertising messages have changed over time.
2.2.1 History
In 1884 William Lever decided to wrap soap in fixed size packages. In addition to wrapping
and fixing the size of the product, Lever came up with the idea of giving the product a name.
William Lever‟s „Sunlight‟ is largely accepted as the first industrial brand, and survives until
this day. Following Lever‟s idea of branding of his soap product, advertising became an
increasingly important part of soap markets. As laundry detergents later grew out of soap
markets, advertising and brand identity persisted as an important part of the industry. Even
today laundry detergents are some of the most heavily advertised consumer goods (Morse,
Perry, & Lester, 1995, pp. 115-116).

12
The launch of Blenda in 1935 was accompanied by a massive advertising campaign to
establish the brand as Norwegian housewives‟ first choice laundry detergent.15
Persil was
passed by Blenda as the largest detergent brand before World War II. Lund (2008) points to
three strategies used by Lilleborg to overcome Persil and gain market leadership before World
War II.
Marketing Blenda in the 1930s, Lilleborg drove around the country in a car demonstrating
their new product for Norwegian housewives. It was necessary for the housewife to see how
much easier it was to clean clothes with the new product. The campaign was a success, and
the increase in demand for Blenda was largely attributed to this particular method of sales
(Jacobsen, 1976, p. 90).
In its advertising, Lilleborg used the fact that Blenda was a Norwegian product. The idea that
Norwegian industrial employment was threatened by international imports was one of the
causes for the so called „buy Norwegian‟ campaign. Both housewife organizations and the
minister of trade, Alfred Madsen, spoke in favor of buying Norwegian products.16
By buying
Norwegian detergents it was argued, housewives would support their husbands‟ employment
and thereby secure their own income. Additionally Lilleborg used price war and massive
advertising as a tool to capture market shares. Smaller producers, such as Goma, did not have
the financial muscle to compete with the market leader under these circumstances (Jensen,
1999, p. 41).
During the 1950s, direct advertising through product demonstrations became more important.
According to Lund, product demonstrations were a normal part of advertising in Norway
during the 1950s. Still, Lilleborg was unrivalled with regards to the scale and ambition of
their product demonstrations (Lund, 2008, p. 110). Throughout the decade several different
forms of demonstrations were used. In the major cities, inhabitants were invited for tea in
large halls where Lilleborg‟s products were demonstrated. Persil and Barnengen also used
product demonstrations to reach potential customers, but the market leader seemed to be more
original than their competitors both in content and the form of presentations. At some point
during the 1950s, Lilleborg changed from the stationary Blenda-tea presentations to the more
15
Lilleborg spent 250.000NOK in 1935 and 400.000 in 1939 on marketing and advertising for Blenda. (Lund,
2008, p. 80) In 2010 this amounts to approximately 8,25 MNOK , and 11,5MNOK confer
http://www.ssb.no/kpi/kpiregn.html 16
Housewife organization is my translation of the Norwegian term „husmorlag‟.
13
flexible Blenda-bus.17
By changing the form of presentations, the Oslo based company was
hoping to reach more housewives in a shorter space of time. During this period it was a major
point for Lilleborg to be first to introduce a detergent to housewives in a certain area. The idea
of using a bus in advertising, was thus to „hunt‟ for places where Lilleborg could be first to
give demonstrations. As a supplement to the tea-presentations, Lilleborg visited potential
customers in their homes to introduce their products and answer questions concerning
laundry. While the bus presentations were mostly used in rural areas, the goal of the tea-
demonstrations and home visits was to visit every home in the major cities.
During the early 1950s the idea that more products could help win a larger market share did
not seem to be present within laundry detergent companies. Most producers had one brand,
and focused their resources towards battling for market shares with other single brand
producers. Lilleborg answered new market threats by marketing their Blenda brand for all
purposes to all consumer groups.18
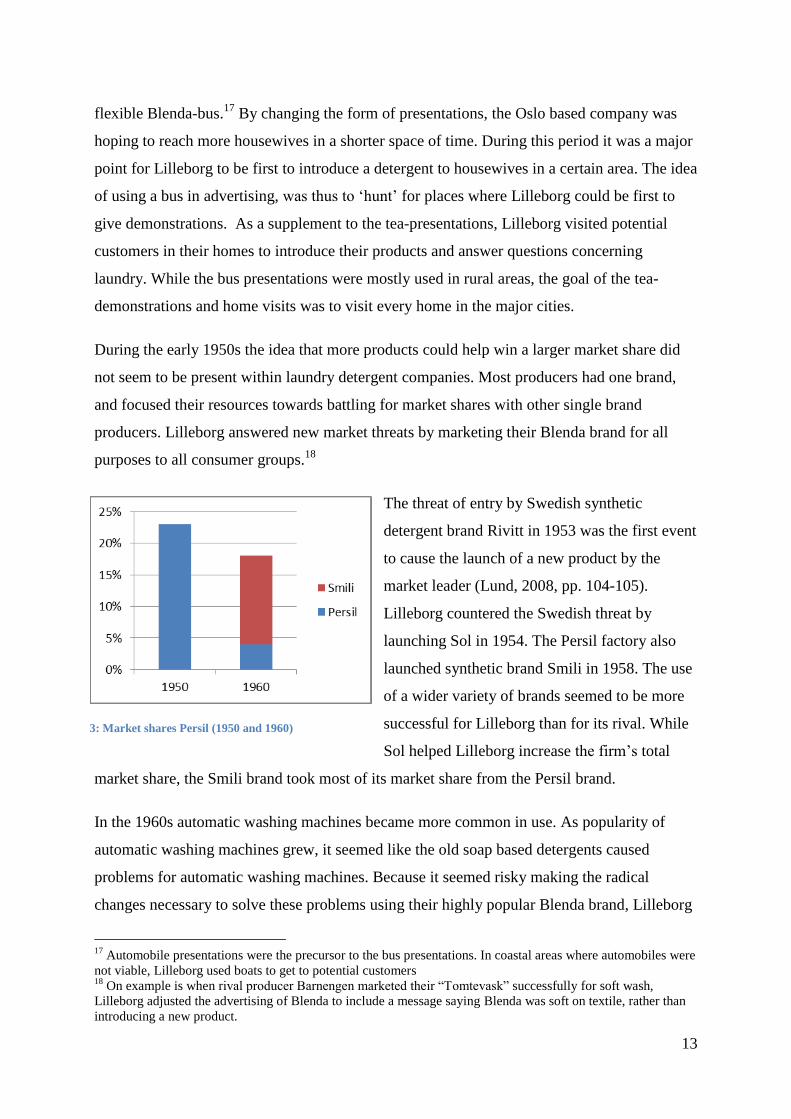
The threat of entry by Swedish synthetic
detergent brand Rivitt in 1953 was the first event
to cause the launch of a new product by the
market leader (Lund, 2008, pp. 104-105).
Lilleborg countered the Swedish threat by
launching Sol in 1954. The Persil factory also
launched synthetic brand Smili in 1958. The use
of a wider variety of brands seemed to be more
successful for Lilleborg than for its rival. While
Sol helped Lilleborg increase the firm‟s total
market share, the Smili brand took most of its market share from the Persil brand.
In the 1960s automatic washing machines became more common in use. As popularity of
automatic washing machines grew, it seemed like the old soap based detergents caused
problems for automatic washing machines. Because it seemed risky making the radical
changes necessary to solve these problems using their highly popular Blenda brand, Lilleborg
17
Automobile presentations were the precursor to the bus presentations. In coastal areas where automobiles were
not viable, Lilleborg used boats to get to potential customers 18
On example is when rival producer Barnengen marketed their “Tomtevask” successfully for soft wash,
Lilleborg adjusted the advertising of Blenda to include a message saying Blenda was soft on textile, rather than
introducing a new product.
3: Market shares Persil (1950 and 1960)

14
launched Unilever‟s Omo-brand as a specialized detergent for automatic washing machines.
Later Tomten launched the Dutch owned Bio-Tex brand specially designed for soaking.
During the 1960s several brands surfaced. Lilleborg gradually focused efforts on giving
different brands an identity directed at different kinds of consumers. Although products were
differentiated with respect to who was supposed to buy them, the housewife was still the main
target of all advertising.
The cost of introducing a new brand in the detergent industry is high and by the 1960s, the
European market was effectively saturated. As a consequence of the high cost of introducing
new brands, manufacturers spent their resources on improving existing brands rather than
introducing new ones. After the 1960s, few new brands were introduced while at the same
time, formulations of existing brands changed constantly (Jones, 2005).
2.2.2 Advertising Messages
In the 1930s, industry represented employment, growth and wealth this was reflected in
detergent advertising at the time. With the youth rebellion towards the end of the 1960s and
early 1970s this role changed and people became more aware of negative effects of large
industry. Advertising was hence given a less authoritarian role in communicating with its
audience. One example is the use of Lilleborg‟s company name in advertisement. During the
1930s the company name featured prominently in most ads, while it took a more withdrawn
role in the 1960s and 1970s (Larsen, 1990, p. 170).
Larsen argues that the goal of advertisement was to release consumers from the discomfort of
modern society. To solve these problems the advertiser need knowledge about the consumers‟
needs, frustrations and dreams. Lilleborg‟s advertisements do not only introduce the potential
consumer to a new good, but also communicate how to live in modern society by introducing
models of how beauty and youth may be achieved in an attempt to increase the consumers‟
self-esteem and gain the favor of others. In his conclusion, Larsen states “Advertisement is no
longer an authoritarian educator, but appear as a close friend giving us advice in the most
intimate parts of life” (Larsen, 1990, p. 173).19
Lund (2008) focus on how the housewife was the main target of Lilleborg‟s advertising in the
1950-1970-period. When advertising Blenda, Lilleborg wanted to make sure Blenda was
19
My translation
15
portrayed as the owners of the white wash technique. By using Blenda, your laundry will be
whiter than everyone else‟s, was the message. Furthermore, appliance of Blenda would able
the housewife to increase her status both within the family, and among other housewives.
While retaining their main message of the status involved in using Blenda, Lilleborg included
messages relating to the current market situation in their advertisement. 20
In the 1950s, Persil
advertised their Henko brand and Persil as two different brands used for different purposes.
Rather than introducing a new product, Lilleborg responded by stating Blenda could be used
for both purposes. Similarly, Barnengen launched a specialized detergent that was supposed
to be soft on textile. Lilleborg‟s response was by attaching a similar message to their Blenda
product. With this move, Lilleborg extended Blenda to be used in the segment for fine textile,
and at the same time making sure their competitor was not able to drain this market segment
unchallenged.
During the detergent war, Procter & Gamble used TV celebrity and journalist, Knut Bjørnsen,
in their advertising. After complaints from Lilleborg employees, P&G and Bjørnsen were
depicted negatively by news media because of Bjørnsen‟s role in endangering Norwegian
employment by working for an international competitor. The use of a male expert in
advertising detergents was also new. Lilleborg used female experts in an attempt to create an
atmosphere of housewives giving each other advice on laundry in their advertisement. Lund
(2008) argue that this may have had a negative impact on how Norwegian housewives viewed
P&G and their Tag brand.
20
This section is based on 102-104 in Lund (2008)

16
3 Theory
This chapter introduces a theoretical framework useful in understanding how laundry
detergent industries function. The first, and most extensive part, focus on the effect of
advertising and brand loyalty on market structure. Part 2 introduce a framework for analyzing
the life cycle of an industry. The third and final parts introduce a framework relevant for
understanding the strategies employed in detergent markets.
3.1 Advertising and Market Structure
In the following I will introduce three approaches to analyzing how advertising may affect
market structure. Economies of scale, long terms effect of advertising and brand loyalty. I will
also have a look at some empirical studies providing indications of how the different models
may be useful in explaining real world markets.
3.1.1 Product Differentiation
A firm chooses to differentiate its products from products sold by competitors to increase the
price of its products compared to other producers. If two products are homogenous, a small
change in price will reduce demand for the expensive good and shift demand to the
inexpensive good that poses largely the same characteristics. If two products are highly
differentiated, a slight increase in the price of one of the goods will affect demand for this
product only slightly since few consumers want to change their choice. The degree of
differentiation between two products is measured by their elasticity of substitution. Two
goods are closer substitutes the larger the magnitude of the elasticity of substitution between
the two goods.
Qualitatively there are two different types of differentiation. If products are horizontally
differentiated, all consumers agree on the qualitative ranking of the two goods, but the price
of the goods may be different and different consumers prefer different goods based on their
level of income. When goods are vertically differentiated there is no agreed upon ranking of
their quality, and consumers‟ ranking of the goods depends on preference. A characteristic
causing goods to be vertically differentiated is colors, that consumers rate differently based on
their preferences (Tirole, 1988, pp. 96-97).
17
In detergents markets, products are differentiated both vertically and horizontally. Different
brand products are vertically differentiated in that they occupy different niches in the product
market and are supposed to fill different consumer needs. Detergent products are horizontally
differentiated as well. Private label products are mostly positioned in the low quality, low
price segment of the market. Despite a general trend of private label products being
horizontally differentiated and brands vertically differentiated in the top end of the market,
this is a rough simplification.
Firms may use advertising to differentiate their products in several ways. Sørgard (1997)
divide the effect of advertising into three effects.
The strategic effect of advertising influences the prices a firm may set. By advertising for its
products, firms may increase consumers‟ willingness to pay for its products. This is the
strategic effect of advertising. The strategic effect operates when advertising is designed to
target consumers that already purchase a firm‟s product, by making them less sensitive to
price changes. Graphically this may be explained as a tilt in a firm‟s demand curve.
We say there is a direct effect of advertising when advertising stimulates demand for a firm‟s
product compared to its competitors. This may also be called a „stealing effect‟, where
advertising is used as a means of „stealing‟ market share from competitors – advertising
increases demand for the product of the advertising firm by reducing demand for products
sold by competitors. The direct effect will occur when advertising is directed at consumers of
other firms‟ products. Holding aggregate demand in the industry fixed, the demand curve
facing the firm advertising shifts up, while the opposite is the case for a firm that does not
advertise.
Advertising may also have a spillover effect, in that it affects the demand in the market as a
whole. In this case advertising increases demand for a firm‟s product without negatively
affecting demand for goods sold by competitors. This sort of advertising causes the industry
demand curve to shift, as opposed to the demand curve facing the firm in the case of a direct
effect.
18
3.1.2 Economies of Scale
Fixed costs may give rise to economies of scale, and hence affect market structure. What
determines the outcome is the size of the minimum efficient scale, the level of output that
minimizes average cost (Varian, 2006, p. 437). If demand is large relative to minimum
efficient scale, a competitive market is the likely result, while a minimum efficient scale large
relative to industry demand a monopoly is more likely. It is important to note that this
statement is relative. What matters is the scale relative to market size. For a given fixed cost,
fewer firms will be viable as the size of aggregate supply is reduced. A smaller market will
hence give rise to a more concentrated market structure.
Advertising and Economies of Scale
Martin (2010, p. 142), separate between three ways advertising may give rise to scale
economies.
1. The effectiveness of advertising may increase more than in proportion to the number
of advertising messages that are sent out. In this case the cost of effective advertising
decrease with the volume of advertising.
2. Advertising might have to reach a threshold level to have any effect at all – there is a
fixed cost level of advertising outlays necessary for advertising to have any effect at all.
3. The cost charged by sellers of advertising space might be lower for large scale
advertisers – as advertising outlays increase, the average cost decrease directly.
Kaldor (1950) argue that advertising in fact affect market structure by increasing the scale of
production and hence increase concentration. At the same time this depends on continued
advertising. Should advertising levels drop, concentration will again be reduced caused by the
fact that scale economies present in the industry are lowered. Other than the effect advertising
have on the scale of production, advertising shift demand curves.
Michael Spence (1980) explore this further. Due to the fact that advertising is designed to
influence demand and therefore prices, it cannot be discussed entirely in terms of economies
of scale or cost advantages in the normal sense. Yet scale economies, or advantages of size,
are clearly relevant in establishing entry barriers. However, demand and prices are affected by
advertising. The relevant measure of scale economies is thus to be found in the relation

19
between the firm‟s revenues and its costs per dollar of revenue, rather than in the relation
between costs and output in physical units (Spence, 1980, p. 494).
Advertising as an Endogenous Sunk Cost
Advertising may give rise to economies of scale in the same way as fixed costs in production.
Nonetheless, as mentioned above, there is a crucial difference. While we may say fixed costs
in production are determined exogenously as a consequence of the technology of production,
the level of advertising is a choice variable for the firm. In Sutton (1991) the endogeneity of
sunk costs such as advertising and research and development is studied.
While exogenously determined fixed costs will diminish in importance as market size
increase, increased market size will cause escalating levels of endogenous sunk cost outlays,
such as advertising, as firms compete for market shares. In a market dominated by exogenous
sunk costs concentration will be reduced infinitely as market size increase. Sutton found that
for markets where endogenous sunk costs are important, industry concentration will be
bounded away from zero as market size increase.
This has later led to a division of industries to type I and type II industries. Type I constitute
industries where exogenous sunk costs dominate. Type I firms deal in products with no or
slight horizontal differentiation. Type II industries on the other hand are characterized by a
high level of endogenous sunk cost outlays. Here, products may be differentiated both
horizontally and vertically (Martin 2010 p. 317).
3.1.3 Depreciable Advertising
When Unilever decided to enter the detergent market in the USA, they ran into difficulties. It
proved difficult to enter a market where strong brands were already present. Experience from
the detergent war in Norway in the late 1960s give an indication that P&G and Colgate might
have encountered a similar problem. Despite spending large amounts on advertising, P&G
and Colgate struggled to enter the market.
Martin (2010) argues that mature markets may be particularly difficult to penetrate, since
entrants must accumulate goodwill among consumers comparable to that of incumbents. If
advertising have effects that last over time, an incumbent might have accumulated a large

20
stock of goodwill. An entrant might have to accumulate goodwill for some time after entry
before demand is stimulated by advertising to the same extent as for an incumbent
To model how a firm that uses advertising may accumulate goodwill over time, we use the
following model presented by (Martin, 2010, pp. 426-427).
We assume goodwill is built up by advertising, but that the stock of goodwill depreciates over
time. represents the stock of goodwill inherited from the past. The stock of goodwill for a
firm advertising in period 1 and 2 is given by
( )
( ) ( ) ( )
The stock of goodwill in any given period is the part of goodwill inherited from the past that
is not depreciated. Goodwill is also increased by current advertising. The general expression
for goodwill in period t is given by
( ) ∑(( ) )
The quantity demanded in period t is a function of price and the stock of goodwill
( )
Profit is given by
( ) ( ) ( )
Where, c is constant marginal and average variable cost. F is fixed cost. is the cost of a
unit of advertising, and is advertising outlays in period t.
The value of the firm is given by the present-discounted sum of profits in all future periods.
∑( ) ( ) ( )

21
Advertising causes sales increases in all future periods. The optimal choice of advertising is
found where the price of one unit of advertising in the current period equals the discounted
and depreciated profit over all future periods from having an extra unit of goodwill in the
current period.
∑(
)
( )
is the change in quantity sold in period due to a marginal change in the amount of
goodwill in period .
The fact that advertising have long term effects means that the effect of advertising today is a
sum of all past advertising depreciated. Advertising today is naturally more effective than past
advertising. How effective depends on the rate of depreciation.
Advertising and Entry
For a potential entrant, quantity demanded will depend on its own price and accumulated
goodwill, in the same way as for the incumbent. In addition, demand for each firm‟s product
depends on the price set by the other. The quantity set for the incumbent and the entrant is
given by
(
) (
)
Since he has no accumulated goodwill, the entrant‟s goodwill in the first period is equal to his
advertising outlays. The incumbent will benefit more from accumulated goodwill since he has
already accumulated a significant stock. An entrant has no accumulated goodwill initially and
has to increase his stock through advertising over time.
The effectiveness of accumulated goodwill in deterring entry works differently in different
markets. In markets where the spillover effect or the strategic effect is dominant, advertising
and accumulated goodwill is less efficient in deterring entry. In markets where the direct
effect dominates, advertising may increase the cost of entry (Martin 2010:437).

22
Empirical Evidence on Long Term Effects of Advertising
If advertising is to have an effect on market structure through accumulated goodwill, as
mentioned above, advertising must have some sort of a long term effect. Clarke (1976) survey
a number of studies investigating possible long term effects of advertising, and conclude that
90 percent of the cumulative effect of advertising on sales occur within 3 to 9 months of the
advertisement. „The conclusion that advertising‟s effect on sales lasts for months rather than
years is strongly supported‟ Clarke (1976, p. 355) asserts.
He points out that most of the studies in his survey are done on mature industries. For the
results in most of the studies surveyed by Clarke, it seems sales in the previous period are the
most important factor deciding sales in the next period.
In „Advertising in consumer goods: durability, economies of scale and heterogeneity‟, L.G.
Thomas (1989) investigate the effect of advertising on sales in consumer goods industries
using a model similar to Schmalensee (1978b) as discussed below, and a depreciating
advertising model as the one above. Thomas (1989) uses four stylized facts about consumer
goods industries to find if depreciable advertising or brand loyalty, introduced below, is
important in determining demand.21
In real world consumer goods industries, best-selling brands advertise most heavily, and
advertising rises with sales toward long-run equilibrium (Thomas, 1989, p. 167).
Consequently, the depreciable advertising model is not consistent with observed
developments in consumer goods industries, Thomas argues. Despite not being consistent
with observations of consumer goods industries, observations of large advertising outlays by
newly introduced brands imply a secondary role for depreciable advertising.
Thomas finds that assuming a long term effect of advertising, as necessary in the depreciable
advertising model leads to results not consistent with his set of observations for consumer
goods industries. Homogeneous brand quality, an assumption necessary in depreciable
advertising model, results in increasing returns to scale in advertising. Increasing returns to
scale may be statistically rejected. Further on, it give rise to an unstable equilibrium that is not
consistent with observed developments in consumer goods markets (Thomas, 1989, p. 185).
21
1. There is large, persistent and generally stable heterogeneity in sales and advertising levels of various brands
within an industry. 2. Brands having larger sales are advertised more. 3. Brands having larger sales exhibit lower
ratios of advertising to sales. 4. Brands are advertised more, ceteris paribus, during a brief period immediately
after market introduction (Thomas, 1989, pp. 166-167).

23
By imposing the false restriction of brand homogeneity, advertising will serve as a proxy for
brand loyalty, who is suppressed. In this case, returns to quality and returns to advertising are
confused. This will lead to erroneous conclusions about the implications of advertising alone,
as the effects of brand loyalty are attributed to advertising (Thomas, 1989, p. 186).
Thomas estimated the depreciation rate for advertising on an annual basis to exceed 80
percent, while returns to scale from advertising are estimated to be decreasing (Thomas, 1989,
p. 187). Thomas thus concludes that the depreciable advertising model is not consistent
developments in real world consumer goods industries.
3.1.4 Brand Loyalty
Consumers don‟t usually have full information about the quality of a good. In determining the
quality of a good, a consumer may search for the best quality brand or purchase a brand to use
it and hence determine by experience which brand she prefer. This has led to the division of
goods into two different types; search goods, and experience goods.
According to Nelson (1970, p. 311), consumers‟ lack of information about the quality of
goods have profound effects on market structure for consumer goods. Where consumers have
to rely on their experience of trying a good, monopoly power will be higher than for search
goods. In a later paper, Nelson (1974) argued that advertising provides useful information
about product quality. He argues that misleading advertising cannot be effective for search
goods, while it can be for experience goods since consumers cannot verify the content of the
advertisement without purchasing the product.
High quality brands are more likely to be advertised more heavily, ceteris paribus, since the
value of a sale of a high quality brand is larger. This is because the consumer is more likely to
purchase the brand again. Because advertising is more effective for brands of high quality,
consumers may use advertising as a measure of brand quality, and they should hence buy the
most heavily advertised product. The logical content of advertising should hence not factor
into the consumer‟s considerations when choosing which product to buy (Thomas, 1989, pp.
175-176).
Schmalensee (1978b) develop a formal model for investigating experience goods. In his
model two opposing forces are central (Schmalensee, 1978b, p. 498).
24
1. High quality brands by definition enjoy high repeat-purchase probabilities. This
increases the present value of returns from advertising and, ceteris paribus, yields them
high market shares in equilibrium
2. High quality brands have high unit costs if the unit cost advantage enjoyed by low
quality sellers is larger than 0. This makes advertising less profitable for them and tends,
ceteris paribus, to raise their equilibrium shares.
Schmalensee argue that for industries with higher returns to scale in advertising, the second
effect is increased and may contribute to a situation where the second effect dominates the
first, and poorer brands receive larger market shares. In this perverse equilibrium consumers
behave as if they had read Nelson 1974 and purchase the brand most heavily advertised
(Schmalensee, 1978b, p. 486).
However, Schmalensee‟s model is based on strong assumptions on consumer behavior. He
points out consumers probably have better memories, and that qualities may be endogenously
determined by firms with different cost functions.
Testing the Brand Loyalty Model
In the study mentioned in chapter 3.1.3, Thomas (1989) also introduce a brand loyalty model
where each brand loses customers at a rate based on advertising levels and intrinsic brand
quality. Brands also lose customers that drop completely out of the market and may attract
completely new customers (Thomas, 1989, p. 179). In this model brands that are repurchased
more often will experience a higher present value of sales, because selling a good today might
make the consumer buy the product again at a later stage. If advertising can be used to induce
consumers to buy a product, producers of high quality products will have a larger incentive to
advertise because of the added benefit that making a consumer buy your product once may
result in a series of consecutive purchases. High quality brands will hence be advertised more
heavily, ceteris paribus. Due to these linkages among brand quality, brand loyalty and brand
advertising, consumers may use relative levels (and not the logical contents) of advertising as
signals of relative product quality (Thomas, 1989, pp. 175-176).
In the case of heterogeneous brand quality, where consumer repurchase goods based on past
consumption experience, a stable long run equilibrium exists. This is consistent with
observations made in consumer goods industries. From the starting point of zero sales, both

25
sales and the stock of advertising rise toward this equilibrium. Sales rise more rapidly than the
accumulated stock of advertising, leading to a falling ratio of advertising to sales over time,
consistent with observations. The level of advertising also rises over time, despite falling
advertising-sales ratios. This is consistent with observations of consumer goods markets.
Thomas‟s estimations are done in mature industries close to long run equilibrium. Therefore,
brand loyalty, not the short term effects associated with advertising accounts for most of sales.
The results of advertising effectiveness may thus be different in infant industries.
The Effect of Advertising on Brand Loyalty
Shum (2004) studies how advertising may be used to break down brand loyalty by reducing
switching costs in the breakfast-cereals market. His findings indicate that “an important effect
of advertising in the breakfast-cereals market is to encourage “switching” behavior at the
household level, which overcomes brand loyalty by persuading households to try brands they
have not purchased recently” (Shum, 2004, p. 264).
While brand loyalty may provide significant advantage to incumbents, advertising may be
effective in breaking down brand loyalty and hence making entry into markets with loyal
consumers easier for potential entrants. Shum thus argue that advertising may work to
facilitate entry so that more brands may exist in the market than would be feasible in the
absence of advertising.
In a related study, Ackerberg (2001) examine the effects of different advertising messages.
Experienced consumers are consumers that have tried a brand in the past, while inexperienced
refer to consumers that have not tried a brand. Ackerberg find that “advertising that provides
information on inherent brand characteristics should primarily affect inexperienced consumers
of a brand, while advertising that creates prestige or association should affect both
inexperienced and experienced consumers” (Ackerberg, 2001, p. 332).
26
3.2 The Dynamics of Market Structure
The equilibrium approach to analysis of market structure says that firms will enter and exit
the industry until each firm‟s profits are equal to zero. This theoretical way of modeling entry
and exit does not match the observed patterns of entry and exit in real world markets. Because
of the difference between observed entry and exit patterns and the traditional theoretical
explanation of entry and exit, a literature describing market structure in a dynamic context has
emerged (Martin, 2010, pp. 325-326).
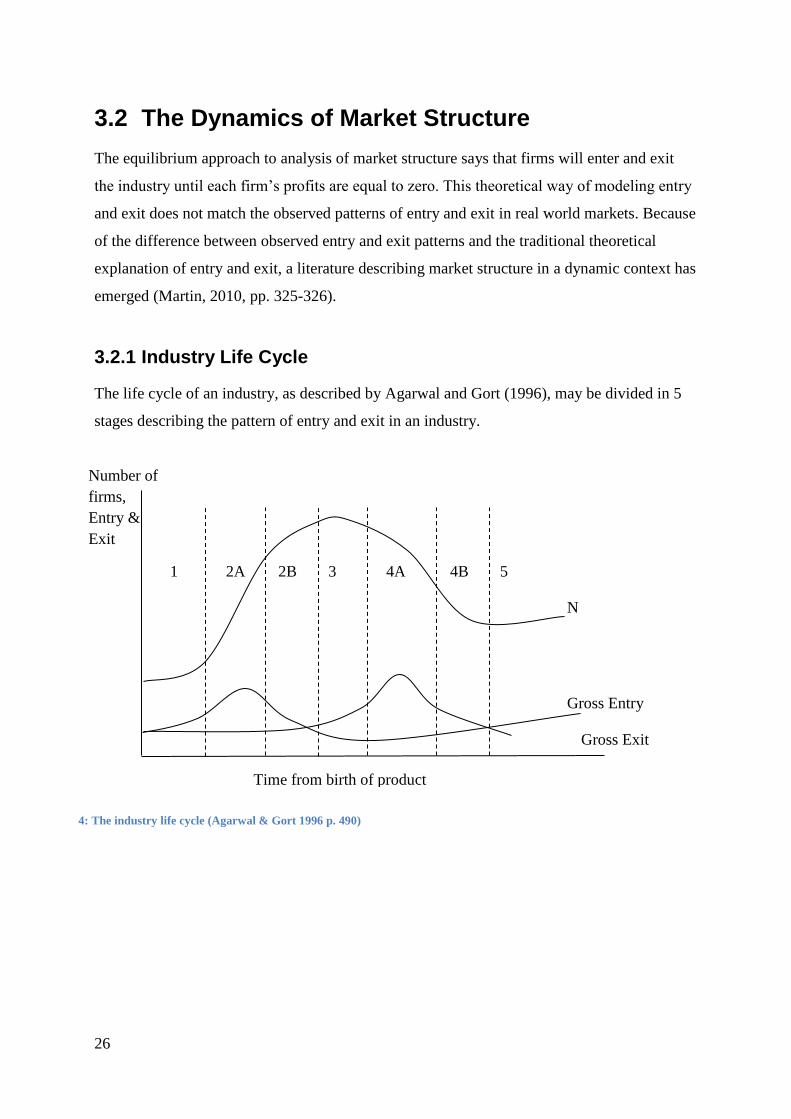
3.2.1 Industry Life Cycle
The life cycle of an industry, as described by Agarwal and Gort (1996), may be divided in 5
stages describing the pattern of entry and exit in an industry.
5 4B 4A 3 2B 2A 1
Number of
firms,
Entry &
Exit
Gross Entry
Gross Exit
N
Time from birth of product
4: The industry life cycle (Agarwal & Gort 1996 p. 490)
27
Net Entry
In stage 1 (the initial period) initial entrants may come from related industries, or enter the
industry through vertical integration. In stage 2 entry rates are higher, and may be subdivided
into an initial phase of accelerating entry, followed by a phase of decelerating entry. At this
stages firms experiment in design and product prices in an attempt to find consumer needs
and to discover their willingness to pay. Stage 3 is a transformational plateau in the number of
sellers. Unlike stage 2, stage 3 does not occur in all industries.
Net Exit
In stage 4, the industry experience net exit. Here the industry „settles down‟ on a dominant
design. In stage 4, innovative activity is shifted to improve productive efficiency. At this
point, the industry is characterized by more mechanized production and the development of
capital assets. The main production in the industry is centered in „the oligopolistic core‟ while
firms that are leading „the efficiency race‟ gain market share. Minor producers drop out of the
market.
The Mature Industry
In stage 5, the industry has matured and there is no longer a consistent trend in entry and exit
patterns. Firms in the oligopolistic core compete among themselves. In addition there exists a
small group of firms at the edge of the market. The composition of firms in the fringe changes
over time, but the group of firms in the oligopolistic core is fairly stable. Firms may (rarely)
move from the fringe to the core, but firms on the verge of making this move may find that
firms in the oligopolistic core apply entry deterring strategies in order to keep new entrants
out of the oligopolistic core.
Sunk Costs
The level of entry also depends on the level of the sunk cost. Larger sunk costs causes lower
net entry and also lower net exit from the industry. Entry involves a higher cost, and hence
fewer firms decide to enter the industry. Once a firm has entered the industry, the larger level
of cost that is sunk works to discourage exit.
28
3.3 Price Competition and Strategic Commitment
To analyze the strategies employed by Lilleborg in the period after the detergent war, it is
useful to look at theory explaining the effect of strategic investment. To fully understand the
implications of such investment, some insight into price competition is also necessary.
3.3.1 Price Competition
Price competition is usually modeled by using one of two models, developed by Antoine
Augustine Cournot and Joseph Bertrand respectively. Cournot and Bertrand competition is
usually depicted as competition in either quantities or prices. The latter case may yield a
competitive equilibrium even though there are only two firms in the industry, while the
former leads to less tough competition in the market with a lower produced quantity and
higher prices. The Cournot model is introduced formally in the appendix.
Tirole (1988, pp. 223-224) points out that the two models should not necessarily be depicted
as rival models, but two complementary approaches, each depicting industries with different
cost structures. The Bertrand case is a better approximation for industries with fairly flat
marginal cost curves while industries with fairly steep marginal cost curves are more
accurately modeled using the Cournot approach.
The fact that Bertrand competition may lead to a competitive equilibrium even when there are
only two firms indicate that the outcome in this model is more appropriate where there are
tough competition. The Cournot model may therefore be more appropriate in markets where
price competition are softened by such things as capacity constraints (or more accurately
choices of scale), product differentiation and repeated interaction between firms.
In Bertrand competition decision variables are strategic complements, and reaction curves are
upward sloping. In Cournot competition reaction curves are downward sloping and decision
variables are strategic substitutes.

29
3.3.2 Games of Commitment
A firm may choose to maximize its profits in the face of future potential entry by acting
strategically. A firm may then make an investment before the potential entrant makes his
decision to enter the market. For such a strategic move to be efficient it must be both
irreversible and observable for the potential entrant. A more formal introduction to this model
is provided in the appendix.
The effect of such an investment in the future period may be divided into two effects. The
effect investment has on the potential entrant‟s profits, and the effect it has on the
incumbent‟s future actions.
Entry Deterrence
Firms engaging in entry deterring behavior may want to make some investment with the goal
of reducing a potential entrant‟s profits down to zero and hence make him opt out of entering
the market.
How such a firm should invest to deter entry depends on the effect the investment have on the
profits of the potential entrant. If the effect is negative in that it reduces the potential entrant‟s
profits, the incumbent should invest more in order to deter entry.22
If investment increases the
entrants post entry profits, the incumbents should invest less to deter entry.
Accommodated Entry
In some cases it might not be feasible for the incumbent to deter entry. The incumbent still
have an incentive to act strategically in order to maximize its post entry profits. The actions
depend crucially on the form of competition prevailing in the given market.
If markets are characterized by Cournot competition, the decision for the firm should be the
same as in the entry deterrence case. An entry deterring strategy will also maximize profits in
the case of accommodated entry. This is because, in Cournot competition, decision variables
are strategic substitutes. If the incumbent choose a high quantity, it is in the entrant‟s interest
to choose to produce a low quantity.
22
„More‟ or „less‟ investment relates to a comparison between how the firm should invest compared to a
situation where strategic considerations are not a part of the incumbent‟s decision.

30
In the case of Bertrand competition, the entry deterring strategy and the accommodated entry
strategy are opposites. Since decision variables are strategic complements in Bertrand
competition, the entrant will choose to produce a high quantity if the incumbent chooses to
produce a high quantity. The optimal strategy for the accommodated entry case under
Bertrand competition is hence the opposite of what it would be if the firm was successful in
deterring entry.
3.3.3 Monopolization by Brand Proliferation
A firm that produces one good may increase their profits by differentiating their products
from products sold by competitors. In markets where firms produce several varieties of a
similar product, a dominant firm may also use a strategy called monopolization by brand
proliferation to maintain a strong position in the market. The idea is that the dominating firm
can introduce several variants to fill all possible niches that may develop in a market, and
hence deter potential entrants from entering profitable market niches. This was first studied by
Schmalensee (1978a) in the ready-to-eat cereals industry in the USA.
31
4 Explaining Market Structure
The following will take a closer look at the Norwegian laundry detergent market in the light
of theory introduced in chapter 3. In the first section I will discuss the industry life cycle of
the Norwegian detergent market. In this discussion I will attempt to find when Norwegian
detergent markets matured, and when they were in earlier stages of development.
The maturity of the industry in different stages of history will be important when I, in part 2
of this chapter, discuss the effectiveness of advertising at different stages in its development.
Differences in effectiveness of advertising over the life cycle of the industry will be used as a
major variable in understanding attempted entry into the industry.
I will also discuss how the timing of trade liberalization acted in concert with the
development of the industry over the life cycle. I will explain how this relationship may be
important in explaining current market structure, as well as how this framework may be used
to analyze similar consumer goods industries.
I will also have a look at how Lilleborg‟s strategies and environmental regulation (The STPP
ban) may have affected market structure. Finally I will have a brief look at current detergent
markets.
4.1 Maturity of Detergent Markets
A good first step in explaining market structure is by looking at entry and exit on the basis of
the industry life cycle model introduced in chapter 3.2.1. This model describes an industry
from infancy to maturity with regards to design of the specific good, how firms interact in the
market, and by data on entry and exit.
Detergent Design
As described in Chapter 2, washing powder became popular among housewives for doing
laundry in the 1930s. After the 1930s, housewives have mostly used powder detergents for
their laundry. The growing popularity of automatic washing machines in the 1960s did not
change the dominant detergent design significantly, and neither did the environmental
concerns in the 1970s and 1980s. Changes in the chemical composition of detergents were

32
radical, but housewives in the 1990s still used washing powder for their laundry. Although
washing powder is arguably the dominant design for laundry detergents, the emergence of
liquid detergent has been significant in the 1990s and 2000s. For the sake of an industry life
cycle analysis, we may take washing powder as the dominant detergent design even though
matters get more complicated as we approach the 2010s.
Industry Structure
From an industrial organization perspective the history of detergent markets in the late 1930s
and 1950s provide strong indications that a stable oligopolistic core of detergent producers
was developing. Competition between Lilleborg, the Persil factory and Tomten had definite
traits of oligopolistic competition as the firms acted and reacted to decisions made by the
others. Despite attempts from both Colgate and Procter & Gamble to enter the Norwegian
market, the oligopolistic core remained largely unchanged for 70 years. The only lasting
change occurred in 1967 when Lilleborg acquired the Persil factory and the oligopolistic core
changed to a duopoly consisting of two firms. Similar to the discussion about detergent above,
the situation seems to get more complicated as we approach present time. New entrants such
as P&G, private label products and other brands have made a significant impact in detergent
markets even though competition is duopolistic, and the core consists mainly of Lilleborg and
Sara Lee, while P&G may be on the verge of breaking into the duopolistic core of the
industry.
Entry and Exit
The development on industry entry and exit provide a similar development for Norwegian
detergent markets as that provided by industry life cycle theory. Figure 5 shows the
development of soap and detergent producing firms in Norway between 1909 and 1990, and
is constructed using data from Ragnhild Rein Bore & Tor Skoglund (2008), Statistics Norway
(1915) and Statistics Norway (1933 -1996) on the number of firms producing soap and
detergents in Norway.

33
The period before World War II
was characterized by high net
entry into the industry. Our data,
starting at 1827 show an
increasing trend in the number
of firms. After a peak in 1940,
the industry experienced net
exit, a trend that continue until
1994, which was the final year
Norwegian industrial statistics
counted soap and detergent producers as a separate group. The data on entry and exit seems to
be generally supported by the history of the industry as described in chapter 2, as well as
histories of individual companies that operated in the market (Lilleborg (1983), Jensen
(1999), Unger (1997)).
Based on industry life cycle theory, net exit occurs after the industry has found the dominant
design. The fact that net exit occurs after 1940 support the suggestion of washing powder as
the dominant detergent design.
A Note on the Data
The fact that the data used is from the amount of firms producing detergents rather than
selling detergents is a significant
weakness, excluding for example
imports from abroad. Despite this
weakness the history of the detergent
industry in Norway seems to indicate
that imports were significant only
after 1967. 23
Another weakness of the data is that
Statistics Norway did not always
23
Henkel is mentioned as one firm importing detergents before this time, but later established their own
production facilities in Norway, the Persil factory in Moss. The historical sources mentioned in this thesis
mention no other importers of detergents in Norway before 1967.
5: Firms producing soap and detergents (1827-1994)
6: Development of the number of firms including small
firms (red line) and excluding small firms (blue line) (1940-
1994)
0
10
20
30
40
50
60
19
40
19
44
19
48
19
52
19
56
19
60
19
64
19
68
19
72
19
76
19
80
19
84
19
88

34
count firms employing only one person after 1949, while data before 1949 contain no
breakdown of how many firms were „large‟ and how many were „small‟. Due to this, data
before 1949 include firms employing only 1 person, and data after this include only firm‟s
employing 5 or more people. This helps explain some, but not all, of the sudden drop in
producers after this point. Because small firms were not always counted after 1949, the count
for large firms is preferred to give a more complete illustration of the development over time.
In Figure 6 we see that the slope of the trend lines after the peak in 1940 is not significantly
different. The data provided above should therefore provide sufficient for discussing entry
and exit from a perspective of industry life cycle theory.
Industry Maturity
After finding a dominant design for laundry detergents in the mid-1930s, a mature industry
slowly evolved in Norwegian detergent markets. World War II interrupts the analysis of the
development from a perspective of competitive interaction, but the general trend in net exit is
persistent over time after 1940, as well as the dominant design. After markets normalized
following World War II, the market situation seems to have been fairly stable for 50 years,
with the notable exception of the detergent war, indicating a fairly mature industry after this
point.
4.2 Effectiveness of Advertising
In the following I will analyze the effectiveness of advertising at different points in the
industry life cycle. This will prove useful in determining why the market structure have
remained largely unchanged for the last 70 years, and in turn help explain current market
structure.
4.2.1 The Rise of Blenda
Below we will see why Lilleborg was successful in establishing Blenda as a brand in
competition with Persil in the late 1930s. At this point in the industry life cycle a dominant
design had yet to emerge, and the general trend was net entry to the industry. Advertising was
at this point highly effective in increasing demand. The effectiveness of advertising in
increasing demand was an important factor explaining why Blenda soon was established as
the major brand in the Norwegian detergent market.

35
Figure 7 shows the development of advertising expenditure at Lilleborg in the period between
1920 and 1935. The data is collected from Jacobsen (1976) and is adjusted for cost of living
for 1922. The sudden jump in advertising expenditure at the end of this period is due to the
launch of Blenda. Since Lilleborg‟s archives from this period are incomplete, I have not been
able to find data showing the development of sales for Blenda and Persil in the period
following the launch of Blenda. Despite this, we do know that Blenda, 4 years after the launch
in 1935 had a 70 percent share of the market for white wash. These developments indicate
that the growth of
Blenda may be
attributed to Lilleborg‟s
advertising at the time.
Since the laundry
detergent market yet
had to develop into a
mature state, the
studies by Thomas
(1989) and Clarke
(1976) ruling out long
term effects of
advertising does not the possibility that advertising may be important in determining market
structure. The mentioned studies take up the importance of advertising in mature industries.
As we have seen in chapter 4.1. the laundry detergent market was still in its infancy,
indicating a more significant role for advertising than in the mature industry case.
At the time Blenda was launched there was already a brand on the market. Despite of the fact
that there was an incumbent present in the market, Blenda was highly successful in entering
the market. Because of data restrictions, we may not with accuracy describe the effect of the
incumbent on entry, but several possible explanations of why Blenda was able to enter the
market arise
7: Lilleborg advertising (1920-1935)

36
Large Spillover Effects
Due washing powder still being a new product in Norway, many housewives had yet to try a
powder detergent. Because there was a large pool of consumers that had yet to try a detergent,
they had not developed any brand loyalties yet. Brand loyalties may have been associated
with the old ways of washing clothes. By using product demonstrations in their advertising,
Lilleborg effectively broke down any loyalties attached to the old ways of doing things. After
inducing housewives to try the new product, repurchase was most likely guaranteed based on
the superiority of powder detergent over soap.
Due to the data restrictions already mentioned we do not have exact numbers confirming the
potential for spillover effects in early detergent markets. The existence of such effects seem
obvious both from an intuitive point of view, and based on industry history.
Industry history introduced in chapter 2 tells how Persil and Lilleborg travelled around the
country introducing their powder detergent to housewives. This form of advertising was used
because the firms meant it was crucial to show how the new product functioned. Prevailing
until the 1960s the fact that the firms used this form of advertising indicates that they believed
there was a pool of housewives that needed to be introduced to powder detergent.
Due to the fact that powder detergent was a relatively new product, Persil might not have
established significant brand loyalties yet. Thus spillover effects might have been significant
enough for Blenda to capture a 70 percent market share without „stealing‟ market share from
Persil.
Breaking Persil’s Brand Loyalty
If Persil in fact had built up brand loyalties by the time Blenda entered the market in 1935,
Lillborg may have been efficient in breaking down Persil‟s position.
As indicated in Shum (2004), advertising may be used to break down brand loyalty and
induce trial purchases. Advertising may then be used to help induce entry into an industry.
The description provided of Blenda‟s advertising during this period in chapter two definitely
indicates that this might have been an effect of their advertising. Handing out samples, for
example, is a direct way of reducing consumers cost of trying a new brand of an experience
37
good. The „buy Norwegian‟ campaign might also have proved efficient, by playing on
economic nationalism prevailing at the time to induce housewives to switch brands.
Once convinced to try a new brand, the quality of the new good must convince the customer
that it is of superior quality to induce repurchases. Since Blenda had a 70 percent market
share it was obviously successful in inducing repurchases. This may strengthen the
impression that the view held by detergent manager Moe regarding Blenda‟s qualities were
shared by Norwegian housewives in the 1930s.
Although we are unable to confirm the above using data from 1930s detergent markets, the
history of the industry and previous research introduced in chapter 2 definitely seems to
confirm the view introduced here. As we have seen, it is also consistent with theory.
4.2.2 The Failure of Tag and Ajax
During the late 1960s Colgate and P&G attempted to enter Norwegian detergent markets
without success. In the following I will attempt to explain why they were unsuccessful.
In explaining why I will look at how, as opposed to the situation facing Blenda in 1935, Tag
and Ajax faced a market where spillover effects from advertising were less likely. Because the
industry had now matured, they were also facing brands with a strong base of loyal
customers. To enter the market they thus had to use advertising in breaking down brand
loyalty to induce trial purchases. After the initial trial purchase, the entrants needed to
convince consumers that the quality of their product was significant enough to make the
consumer buy the product again.
While the situation facing Blenda in 1935 allowed for relatively easy entry, I will argue that
the three conditions above all made entry into the Norwegian detergent market more costly in
1967. In addition to the above points comparing the situation in 1967 with 1935, I will discuss
the development of detergent prices and possible effects of several simultaneous entrants.

38
General Developments
Before diving into the analysis we start by establishing a general overview of the
developments during the detergent war. First, the entrants were mainly P&G and Colgate,
while the Dutch brand Bio-Tex was introduced earlier by Norwegian producer Tomten.
Estimates made by Lillborg indicate that a 10 percent market share was necessary for the
entrants to break-even. To reach this point, the entrants would either have to attract new
customers, or „steal‟ enough customers from incumbents to achieve a 10 percent market
share.
Figure 9 shows market shares for
Lilleborg‟s brands before and
during the detergent war.24
If the
goal of P&G and Colgate‟s
advertising was to break down
brand loyalty of Lilleborg‟s brands
they were successful to a certain
extent. Lilleborg‟s total market
share fell by approximately 15
percent during the detergent war.
Figure 10 decomposes Lilleborg‟s market shares before and during the detergent war. 25
The
jump in “other” brands after 1967 is due to Lilleborg‟s purchase of the Persil factory. For the
other brands, Omo and Coral are
fairly stable while Sol and
Blenda have a general downward
trend throughout the detergent
war. It thus seems that the
Entrants took their market shares
mostly from Blenda and Sol,
while Omo remained fairly
strong. Based on the above data,
24
Data on market shares collected from Lilleborg marketing plans (1965-1970) Lilleborg Museum Archives 25
Lilleborg Marketing plans 1965-1970, Lilleborg Museum Archives
8: Lilleborg market share (1964-1970)
9: Market shares Lilleborg brands (1964-1970)
0,00%
5,00%
10,00%
15,00%
20,00%
25,00%
30,00%
35,00%
40,00%
1964 1965 1966 1967 1968 1969 1970
Blenda
Sol
Omo
Coral
Other
50%
55%
60%
65%
70%
75%
80%
1964 1965 1966 1967 1968 1969 1970

39
we know that Lilleborg lost, on aggregate, approximately 15 percent market share during the
detergent war. This loss came mostly from Blenda and Sol, while Omo market shares
remained fairly stable. The decline in market share for Sol and Blenda was 14,4 and 15,6
respectively, a combined loss of 30 percent. The total market share for Lilleborg is thus
maintained at a relatively high level due to the purchase of the Persil factory in 1967.
In the following we will largely focus on Blenda, Omo and Sol in addition to the entrant
brands in an attempt to explain events and outcomes of the detergent war.
Lack of Spillover Effects
By inducing consumers that are not loyal to a brand to buy your product, spillover effects may
be a useful tool in making entry less costly.
For the detergent war and
the preceding period, data
shows that the total market
size in tons of laundry
detergent is relatively stable
(Figure 8).26
There is a
clear and relatively constant
upward trend, where the
only deviation is a slight
increase in 1967 followed
by a decrease the next year.
This may be attributed to consumers stocking up on detergents due to a sudden decline in
prices. Data about Lilleborg‟s advertising introduced below, clearly show an increase in
advertising expenditure by the market leader. As P&G and Colgate entered, they also
contributed to increase advertising outlays significantly. From this we may argue that the
relatively stable upward trend in detergent sales seems to be largely unaffected by advertising
outlays. Aggregate demand in the industry thus seems to be largely unaffected by total
advertising outlays, reducing the scope for spillover effects from advertising.
26
Figure 8 is constructed using sales and market share data collected from Lilleborg marketing plans (1965-
1970) from Lilleborg Museum Archives
10: Detergent sales (1964-1970)
8000
9000
10000
11000
12000
13000
14000
15000
16000
17000
1964 1965 1966 1967 1968 1969 1970
Ton
s o
f d
ete
rge
nt
sold
40
Furthermore, Lilleborg and Persil stopped their direct advertising during the early 1960
because they now meant most housewives had been introduced to powder detergent. At the
time of entry, P&G and Colgate were largely unable to attract customers that did not already
consume a powder detergent.
We may thus assume P&G and Colgate could not enjoy any spillover effects from their
advertising, and that they were unable to attract customers that had yet to be exposed to a
powder detergent. Thus, all sales had to come at the expense of an incumbent brand.
We will analyze the effectiveness of the entrants in stealing market shares in two steps below.
First we will discuss if they were able to induce trial purchases, before we analyze their
effectiveness in securing repurchases from consumers making the initial purchase.
Inducing Trial Purchases
Initial trial purchases relates to the effectiveness of a firm to induce consumers to try an
experience good. Since the consumer cannot know the quality of the good without purchasing
it, advertising is used as a tool to induce the initial purchase. Market research performed by
Lilleborg at the of Tag‟s test launch seems to indicate that the reason housewives bought Tag
was that the image of the product signaled effectiveness and modernity (Lund, 2008, p52).
The fact that housewives bought Tag based on perceived differences, not quality differences
may indicate that P&G was successful in inducing initial trial purchases for Tag.

41
Looking at relative advertising levels (figure 11) two points of interest arise.27
First, we see that advertising outlays for Tag and Ajax are significantly larger than for the
incumbent brands. From Shum (2004) we know that advertising may be used to break down
brand loyalty. This data strongly indicate that breaking down brand loyalty is more costly
than it is for an incumbent to maintain it. The large advertising outlays for Tag and Ajax
seems to have been successful in breaking down incumbent brand loyalty. On the other hand,
the large levels of advertising seem to have been successful in breaking down brand loyal
only for two of the three major brands.
This turns our attention to the
second point arising on the basis of
the above data. Relative advertising
levels among Lilleborg brands does
not seem to provide a reasonable
explanation for the decline of Sol
and Blenda compared to Omo. The
fall in market share for Blenda and
Sol may thus not be explained by
differences in advertising outlays
compared to Omo. The lower advertising outlay for Sol may indicate a drop for Sol compared
27
Lilleborg Marketing plans 1968, Lilleborg Museum Archives. Advertising outlays for Tag and Ajax are based
on Lilleborg estimates, and range from 8-10 MNOK and 4-5 MNOK.
0
1
2
3
4
5
6
7
8
9
10
Blenda Sol Omo Tag Ajax
Mill
ion
Kro
ne
r
11: Advertising 1967
0
1000
2000
3000
4000
5000
1964 1965 1966 1967 1968 1969 1970
Blenda
Sol
Omo
12: Advertising Blenda, Sol, Omo 1964-1970

42
to Omo. Looking at advertising levels for Lilleborg‟s major brands throughout the detergent
war (figure 12) we see that Blenda indeed was more heavily advertised than all the other
brands.28
Based on these data, two questions arise. Why did Omo‟s market share remain largely
unchanged despite relatively low advertising outlays compared to Blenda? Second, if the goal
of advertising is to break down brand loyalty, why is the fall in market share similar for Sol
and Blenda, when Blenda was advertised more heavily?
Sol‟s relative strength in comparison to the more heavily advertised Blenda may be explained
by looking at detergent prices. From Figure 13 we see that Sol was clearly horizontally
differentiated from the other major brands. While Blenda lost large market shares, large
advertising outlays might have prevented
the fall from being more significant. For
Sol, the fact that this brand was positioned
at the lower end of the market compared to
the other brands may explain why the drop
in market share was not more significant.
Despite being a lower quality brand than
Tag and Ajax, some of Sol‟s customers
remained loyal due to the fact that it was
cheaper.
Still, it remains to explain Sol and Blenda‟s decline relative to Omo. Despite being the most
heavily advertised among the incumbent brands, Blenda lost significant market share, while
Omo, with lower advertising outlays remained fairly unaffected by the massive advertising
outlays by the incumbents. To explain this we take one step further to analyze the effects of
brand quality.
28
Lilleborg Marketing plans 1965-1970, Lilleborg Museum Archives
50
52
54
56
58
60
62
64
66
1968 1969
Blenda
Sol
Omo
Tag
Ajax
13: Detergent prices for major brands 1968-1969
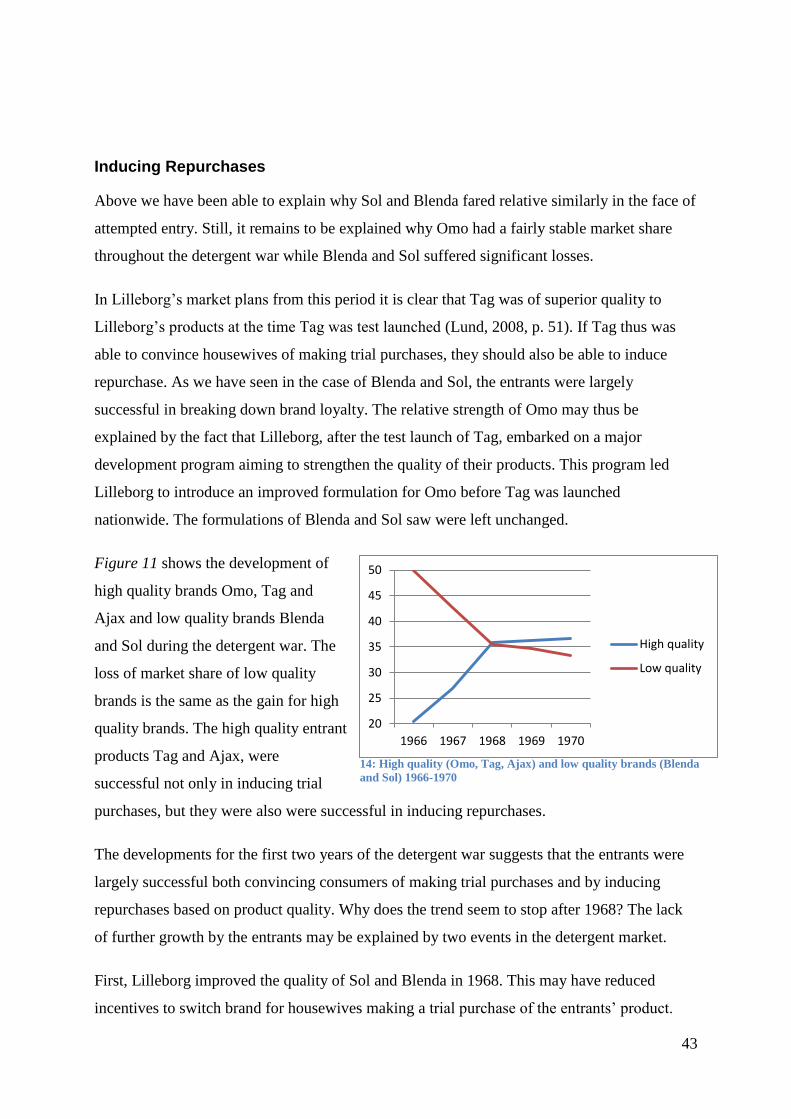
43
Inducing Repurchases
Above we have been able to explain why Sol and Blenda fared relative similarly in the face of
attempted entry. Still, it remains to be explained why Omo had a fairly stable market share
throughout the detergent war while Blenda and Sol suffered significant losses.
In Lilleborg‟s market plans from this period it is clear that Tag was of superior quality to
Lilleborg‟s products at the time Tag was test launched (Lund, 2008, p. 51). If Tag thus was
able to convince housewives of making trial purchases, they should also be able to induce
repurchase. As we have seen in the case of Blenda and Sol, the entrants were largely
successful in breaking down brand loyalty. The relative strength of Omo may thus be
explained by the fact that Lilleborg, after the test launch of Tag, embarked on a major
development program aiming to strengthen the quality of their products. This program led
Lilleborg to introduce an improved formulation for Omo before Tag was launched
nationwide. The formulations of Blenda and Sol saw were left unchanged.
Figure 11 shows the development of
high quality brands Omo, Tag and
Ajax and low quality brands Blenda
and Sol during the detergent war. The
loss of market share of low quality
brands is the same as the gain for high
quality brands. The high quality entrant
products Tag and Ajax, were
successful not only in inducing trial
purchases, but they were also were successful in inducing repurchases.
The developments for the first two years of the detergent war suggests that the entrants were
largely successful both convincing consumers of making trial purchases and by inducing
repurchases based on product quality. Why does the trend seem to stop after 1968? The lack
of further growth by the entrants may be explained by two events in the detergent market.
First, Lilleborg improved the quality of Sol and Blenda in 1968. This may have reduced
incentives to switch brand for housewives making a trial purchase of the entrants‟ product.
14: High quality (Omo, Tag, Ajax) and low quality brands (Blenda
and Sol) 1966-1970
20
25
30
35
40
45
50
1966 1967 1968 1969 1970
High quality
Low quality
44
When consumers of Blenda and Sol did not experience an increase in quality when trying the
new brand their incentives to switch brands were reduced. This in turn caused market share
for Sol and Blenda to stabilize.
Second, we know from Lilleborg‟s marketing plans at the time that the advertising outlays for
Tag and Ajax were significantly larger in 1967 and 1968 than in 1969 and 1970. As the
entrants‟ advertising outlays were reduced, they convinced less housewives of making trial
purchases. Persistent brand loyalties for incumbent brands were thus more important in
determining demand, and the entrants‟ growth was halted.
Tag and Ajax‟s lack of success in taking market share from similar quality products, such as
Omo and the improved versions of Blenda and Sol confirm the importance of product quality
in the laundry detergent market. Omo‟s strength, despite significantly lower advertising
outlays in comparison to Tag and Ajax, suggests that to break down brand loyalties of strong
incumbent products, an entrant has to offer a significant improvement in product quality. The
case of Omo suggests that advertising is largely ineffective to break down brand loyalty at all
for products of similar quality.
Blenda and Sol lost significant market share in the period where Tag and Ajax could provide
a significant improvement in product quality but only for a while. When the quality of Sol and
Blenda were improved and thus more similar to Tag and Ajax, the entrants‟ growth halted.
For Blenda advertising outlays may have contributed to restricting the loss in the period
where the entrant were able to provide an improved product, while being horizontally
differentiated was able to maintain some of Sol‟s market share despite offering a lower
quality detergent.
The Effect of Simultaneous Entry
Above we have seen that the growth of Tag and Ajax were halted in 1969, a factor that might
have contributed significantly to their failed attempt at entry. This is, however, not the full
story. Sol and Blenda lost approximately 30 percent of their market share from 1964- 1970.
For the point of view of the entrant this should prove more than enough to make entry
profitable, under the condition that a 10 percent market share was necessary to break even. In
the following we will analyze how the number of entrants might have proved a deciding
factor in deterring entry by P&G and Colgate. In addition to the international entrants, we will
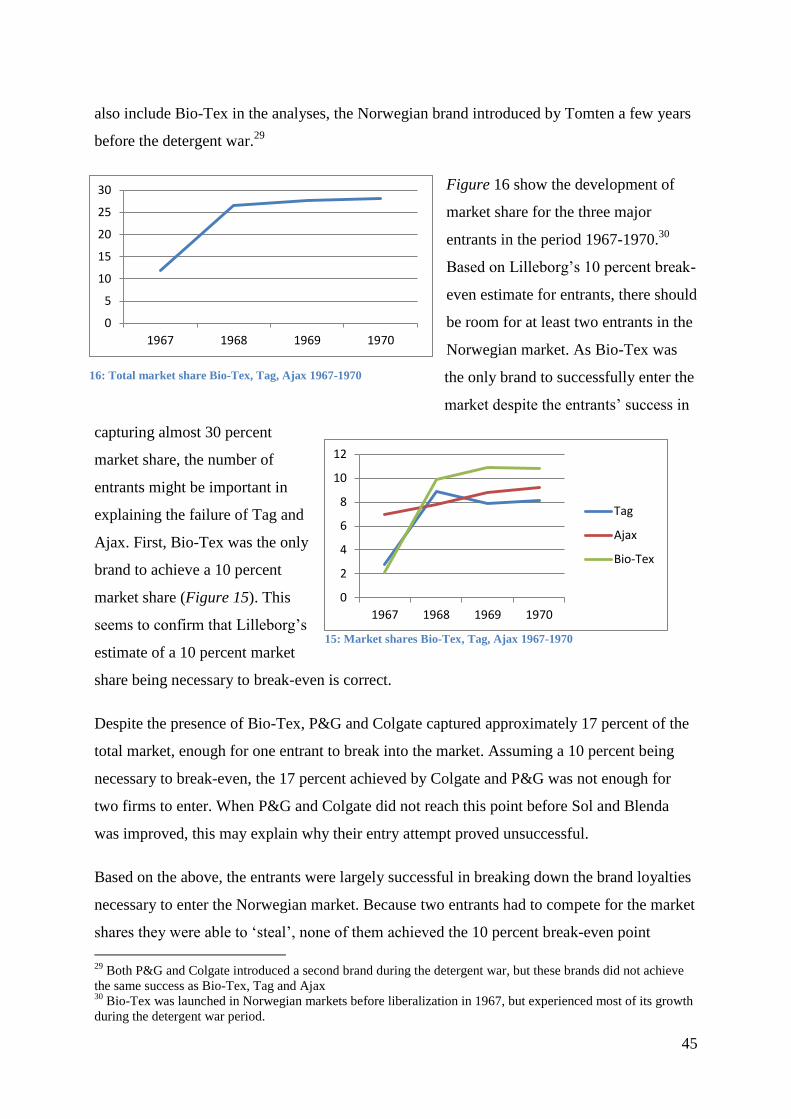
45
also include Bio-Tex in the analyses, the Norwegian brand introduced by Tomten a few years
before the detergent war.29
Figure 16 show the development of
market share for the three major
entrants in the period 1967-1970.30
Based on Lilleborg‟s 10 percent break-
even estimate for entrants, there should
be room for at least two entrants in the
Norwegian market. As Bio-Tex was
the only brand to successfully enter the
market despite the entrants‟ success in
capturing almost 30 percent
market share, the number of
entrants might be important in
explaining the failure of Tag and
Ajax. First, Bio-Tex was the only
brand to achieve a 10 percent
market share (Figure 15). This
seems to confirm that Lilleborg‟s
estimate of a 10 percent market
share being necessary to break-even is correct.
Despite the presence of Bio-Tex, P&G and Colgate captured approximately 17 percent of the
total market, enough for one entrant to break into the market. Assuming a 10 percent being
necessary to break-even, the 17 percent achieved by Colgate and P&G was not enough for
two firms to enter. When P&G and Colgate did not reach this point before Sol and Blenda
was improved, this may explain why their entry attempt proved unsuccessful.
Based on the above, the entrants were largely successful in breaking down the brand loyalties
necessary to enter the Norwegian market. Because two entrants had to compete for the market
shares they were able to „steal‟, none of them achieved the 10 percent break-even point
29
Both P&G and Colgate introduced a second brand during the detergent war, but these brands did not achieve
the same success as Bio-Tex, Tag and Ajax 30
Bio-Tex was launched in Norwegian markets before liberalization in 1967, but experienced most of its growth
during the detergent war period.
0
5
10
15
20
25
30
1967 1968 1969 1970
16: Total market share Bio-Tex, Tag, Ajax 1967-1970
15: Market shares Bio-Tex, Tag, Ajax 1967-1970
0
2
4
6
8
10
12
1967 1968 1969 1970
Tag
Ajax
Bio-Tex
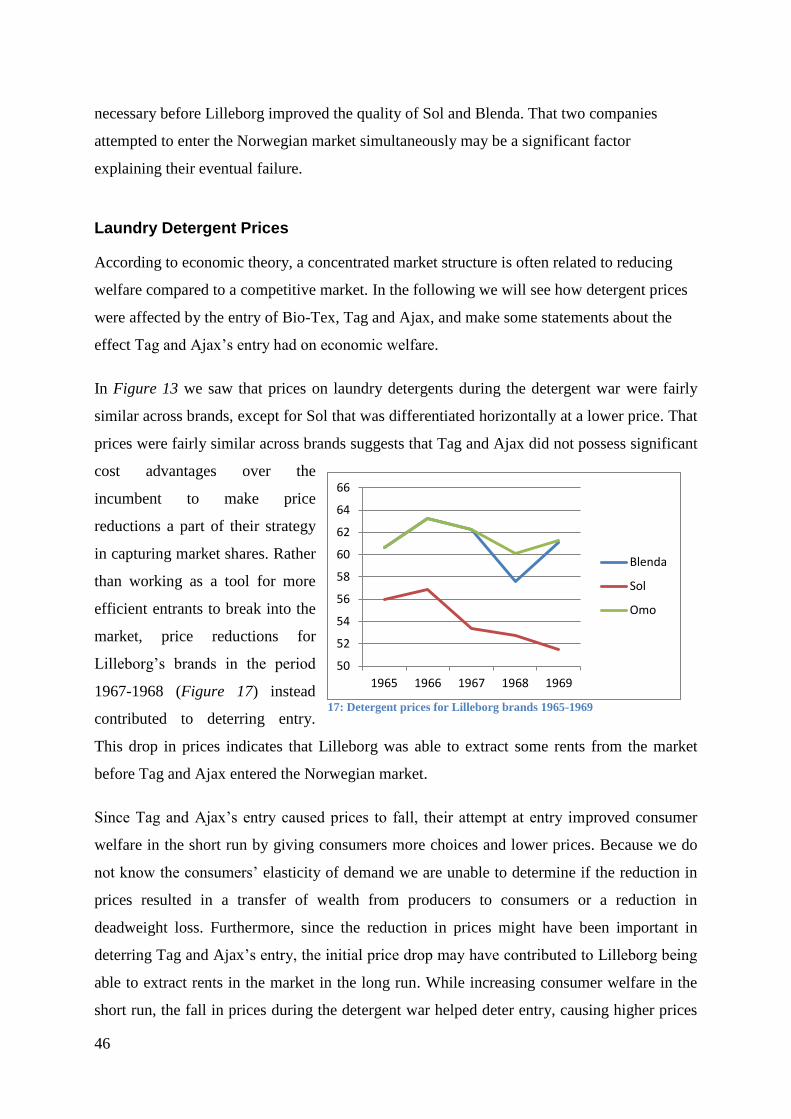
46
necessary before Lilleborg improved the quality of Sol and Blenda. That two companies
attempted to enter the Norwegian market simultaneously may be a significant factor
explaining their eventual failure.
Laundry Detergent Prices
According to economic theory, a concentrated market structure is often related to reducing
welfare compared to a competitive market. In the following we will see how detergent prices
were affected by the entry of Bio-Tex, Tag and Ajax, and make some statements about the
effect Tag and Ajax‟s entry had on economic welfare.
In Figure 13 we saw that prices on laundry detergents during the detergent war were fairly
similar across brands, except for Sol that was differentiated horizontally at a lower price. That
prices were fairly similar across brands suggests that Tag and Ajax did not possess significant
cost advantages over the
incumbent to make price
reductions a part of their strategy
in capturing market shares. Rather
than working as a tool for more
efficient entrants to break into the
market, price reductions for
Lilleborg‟s brands in the period
1967-1968 (Figure 17) instead
contributed to deterring entry.
This drop in prices indicates that Lilleborg was able to extract some rents from the market
before Tag and Ajax entered the Norwegian market.
Since Tag and Ajax‟s entry caused prices to fall, their attempt at entry improved consumer
welfare in the short run by giving consumers more choices and lower prices. Because we do
not know the consumers‟ elasticity of demand we are unable to determine if the reduction in
prices resulted in a transfer of wealth from producers to consumers or a reduction in
deadweight loss. Furthermore, since the reduction in prices might have been important in
deterring Tag and Ajax‟s entry, the initial price drop may have contributed to Lilleborg being
able to extract rents in the market in the long run. While increasing consumer welfare in the
short run, the fall in prices during the detergent war helped deter entry, causing higher prices
17: Detergent prices for Lilleborg brands 1965-1969
50
52
54
56
58
60
62
64
66
1965 1966 1967 1968 1969
Blenda
Sol
Omo

47
and reduced choice in the future. The negative long term effect thus cancels the positive effect
in the short run, indicating that the reduction in prices in fact was not positive for consumers.
A full analysis of the welfare effects of market structure in laundry detergent markets is
outside the scope of this study. Based on data for the detergent war and the preceding period,
it seems the unsuccessful entry attempt did not provide significant welfare improvements in
the long run, as it was used as a tool of deterring entry.
Summing Up the Detergent War
In the end, Tag and Ajax failed in gaining enough loyal customers to buy their products.
Above we have seen how the entrants were successful in breaking down brand loyalty and
inducing repurchases of their products. Because there were two entrants in the market at the
same time, they were not able to break down enough of incumbent brand loyalty to make
simultaneous entry plausible. Despite breaking down a significant part of incumbent brand
loyalty, their this lack of success may be explained either by their lack of success in tempting
consumers to buy their products, or their lack of success in inducing repurchases of their
brand once consumers were convinced to try it once. The former relates to the success of
advertising, while the latter relates to product quality. With regards to Omo the quality of the
incumbent product proved a significant factor in maintaining the brand‟s market share.
Despite significant losses for Blenda and Sol, large advertising outlays and horizontal
differentiation may have limited the losses for the incumbent, hence contributing to deterring
entry.
4.2.3 1935 and 1967 – A Comparison
The situation facing Blenda in 1935 stands in stark contrast to the situation facing Tag and
Ajax in 1967. Different circumstances in the detergent market at different points of industry
maturity are important in explaining Tag and Ajax‟s failure compared to Blenda‟s success.
Blenda‟s owners enjoyed significant spillover effects by introducing their detergent to
housewives in a market were no detergent yet was established. Tag and Ajax on the other
hand were facing a market where consumers had already established loyalty to a brand. All
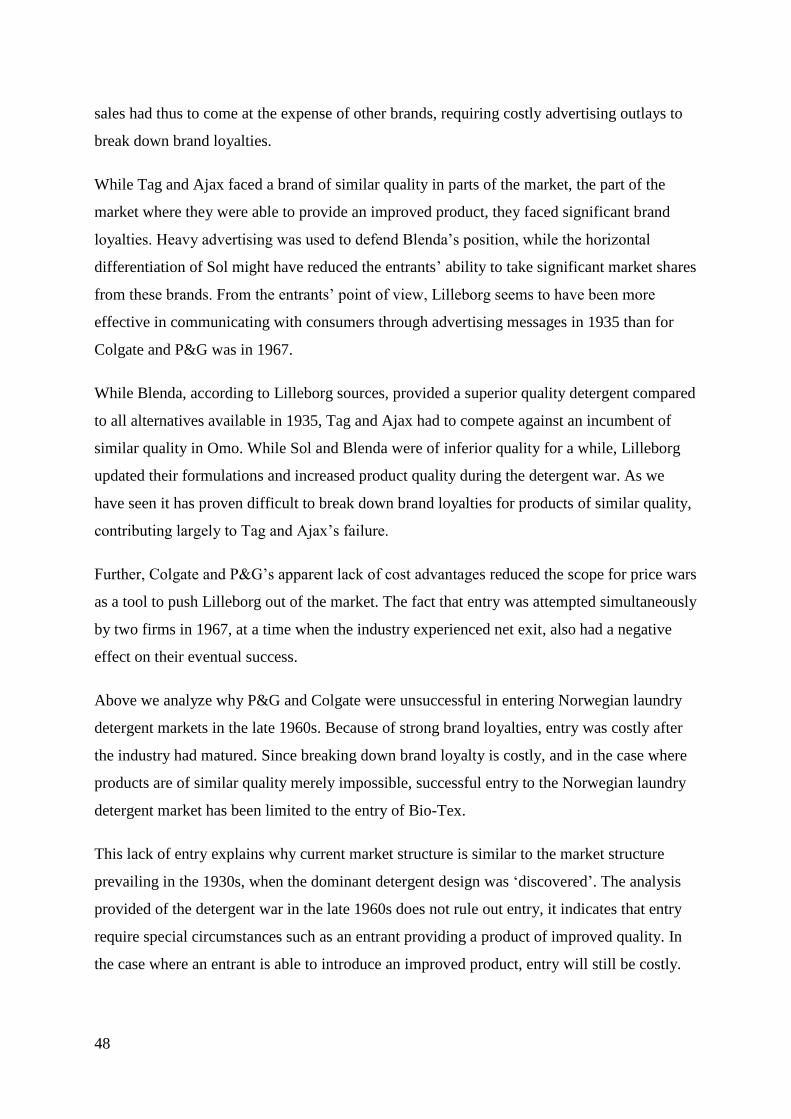
48
sales had thus to come at the expense of other brands, requiring costly advertising outlays to
break down brand loyalties.
While Tag and Ajax faced a brand of similar quality in parts of the market, the part of the
market where they were able to provide an improved product, they faced significant brand
loyalties. Heavy advertising was used to defend Blenda‟s position, while the horizontal
differentiation of Sol might have reduced the entrants‟ ability to take significant market shares
from these brands. From the entrants‟ point of view, Lilleborg seems to have been more
effective in communicating with consumers through advertising messages in 1935 than for
Colgate and P&G was in 1967.
While Blenda, according to Lilleborg sources, provided a superior quality detergent compared
to all alternatives available in 1935, Tag and Ajax had to compete against an incumbent of
similar quality in Omo. While Sol and Blenda were of inferior quality for a while, Lilleborg
updated their formulations and increased product quality during the detergent war. As we
have seen it has proven difficult to break down brand loyalties for products of similar quality,
contributing largely to Tag and Ajax‟s failure.
Further, Colgate and P&G‟s apparent lack of cost advantages reduced the scope for price wars
as a tool to push Lilleborg out of the market. The fact that entry was attempted simultaneously
by two firms in 1967, at a time when the industry experienced net exit, also had a negative
effect on their eventual success.
Above we analyze why P&G and Colgate were unsuccessful in entering Norwegian laundry
detergent markets in the late 1960s. Because of strong brand loyalties, entry was costly after
the industry had matured. Since breaking down brand loyalty is costly, and in the case where
products are of similar quality merely impossible, successful entry to the Norwegian laundry
detergent market has been limited to the entry of Bio-Tex.
This lack of entry explains why current market structure is similar to the market structure
prevailing in the 1930s, when the dominant detergent design was „discovered‟. The analysis
provided of the detergent war in the late 1960s does not rule out entry, it indicates that entry
require special circumstances such as an entrant providing a product of improved quality. In
the case where an entrant is able to introduce an improved product, entry will still be costly.

49
Despite offering a high quality product, successful entry is not at all certain, explaining why
entry into the Norwegian laundry detergent market has been so limited.
4.3 Brand Loyalty and Trade Liberalization
Above we have seen the effects industry maturity have on entry costs in the Norwegian
laundry detergent market. The increase in the cost of entry caused by significant brand
loyalties may make entry into mature industries prohibitively expensive.
Since entry into the Norwegian detergent market occurred following a wider liberalization of
trade, the above analysis may be relevant for explaining market structure in similar industries.
Generally, 2 conditions are necessary for a situation like the one occurring in the Norwegian
laundry detergent market to arise.
1. The goods sold in the industry must be experience goods, and brand loyalty must be
important in determining demand.
2. The industry must have matured before trade was liberalized, in this case 1967. The
entrant must thus not be able to provide an improvement on the dominant design.
In such industries, the market structure prevailing in the industry at its infancy is more likely
to prevail in current markets if:
1. There are no spillover effects from advertising in the industry hence market structure
is more likely to be unchanged in markets for necessities than for luxury goods.
2. Dominant product design has remained largely unchanged after liberalization.
The product may have changed, but the more often changes occurs, the more likely it is that a
potential entrant have been able to use the change in the dominant design to enter the market.
For the laundry detergent market, changes in product formulations occur relatively often, and
the real question with regards to changes in market structure relates to whether there have
been changes in the dominant design that have not immediately been filled by the incumbent.
As mentioned above, there were several industry specific causes explaining why entry into the
detergent market proved costly. The interrelationship between advertising effectiveness and
trade liberalization following the EFTA agreement might still be an interesting topic for

50
studying similar industries. Investigating market structure in industries that fit the above
description is outside the scope of this study.
4.4 Other Entry Barriers
After the detergent war, the dominant design and brand loyalties for Lilleborg was largely
stable. Still, the STPP ban and Lilleborg‟s brand proliferation strategy may be interesting to
analyze in the context of explaining current market structure.
Environmental Regulation
Imposing a ban on the use of STPP in detergents may effectively deter entry from all
producers that cannot produce a detergent without STPP. Norway was one of very few
countries that imposed such a ban in the 1980s. This may have been a significant barrier to
entry.
Among the big 4, Lilleborg‟s
ownership of the Persil brand and
close ties with Unilever reduced
potential competition in
Norwegian markets to Colgate
and P&G. Having already failed
to enter Norwegian markets in the
late 1960s, P&G and Colgate‟s
hunger for attempting entry in
Norwegian markets is likely to
have been low.
Among the big 4, environmental considerations were a part of Henkel‟s strategy. They were
hence the most aggressive in developing non-STPP detergents. Figure 13 taken from Morse et
al. (1995, p. 112) and shows the availability of non-STPP detergents in Western Europe. In
the early 1990s, approximately 70 percent of the population in Western Europe had access to
non-STPP detergent. The STPP ban is unlikely to provide a significant barrier to entry at this
point, since most detergent producers thus have a non-STPP brand available. Due to the
discussion above about product quality, it would be necessary to know the quality of STPP
18: STPP use in Western Europe
0%
10%
20%
30%
40%
50%
60%
70%
80%
90%
100%
Mar
ket
shar
e
STPP
Non-STPP
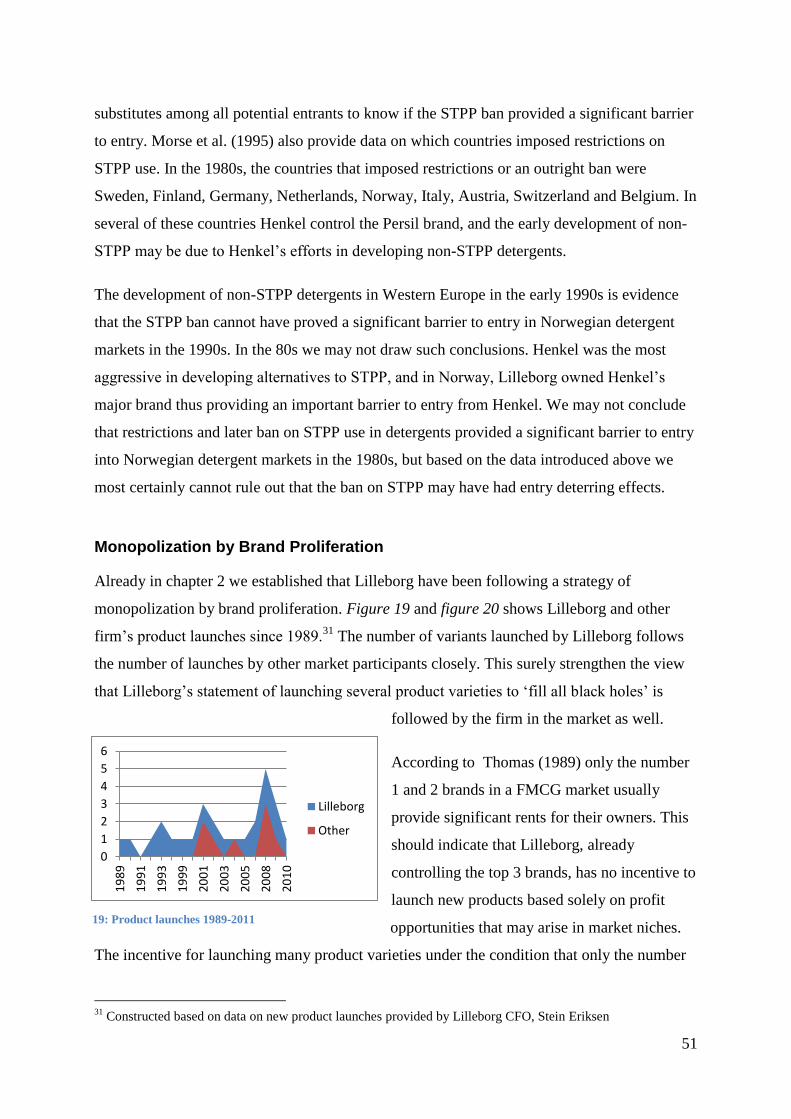
51
substitutes among all potential entrants to know if the STPP ban provided a significant barrier
to entry. Morse et al. (1995) also provide data on which countries imposed restrictions on
STPP use. In the 1980s, the countries that imposed restrictions or an outright ban were
Sweden, Finland, Germany, Netherlands, Norway, Italy, Austria, Switzerland and Belgium. In
several of these countries Henkel control the Persil brand, and the early development of non-
STPP may be due to Henkel‟s efforts in developing non-STPP detergents.
The development of non-STPP detergents in Western Europe in the early 1990s is evidence
that the STPP ban cannot have proved a significant barrier to entry in Norwegian detergent
markets in the 1990s. In the 80s we may not draw such conclusions. Henkel was the most
aggressive in developing alternatives to STPP, and in Norway, Lilleborg owned Henkel‟s
major brand thus providing an important barrier to entry from Henkel. We may not conclude
that restrictions and later ban on STPP use in detergents provided a significant barrier to entry
into Norwegian detergent markets in the 1980s, but based on the data introduced above we
most certainly cannot rule out that the ban on STPP may have had entry deterring effects.
Monopolization by Brand Proliferation
Already in chapter 2 we established that Lilleborg have been following a strategy of
monopolization by brand proliferation. Figure 19 and figure 20 shows Lilleborg and other
firm‟s product launches since 1989.31
The number of variants launched by Lilleborg follows
the number of launches by other market participants closely. This surely strengthen the view
that Lilleborg‟s statement of launching several product varieties to „fill all black holes‟ is
followed by the firm in the market as well.
According to Thomas (1989) only the number
1 and 2 brands in a FMCG market usually
provide significant rents for their owners. This
should indicate that Lilleborg, already
controlling the top 3 brands, has no incentive to
launch new products based solely on profit
opportunities that may arise in market niches.
The incentive for launching many product varieties under the condition that only the number
31
Constructed based on data on new product launches provided by Lilleborg CFO, Stein Eriksen
19: Product launches 1989-2011
0
1
2
3
4
5
6
19
89
19
91
19
93
19
99
20
01
20
03
20
05
20
08
20
10
Lilleborg
Other

52
1 and 2 brand is profitable should thus not be to increase profits, but rather to reduce the
probability of other firms taking over the number 1 and two positions by entering the market
through a profitable niche.
The most interesting part of analyzing such a strategy is whether or not it is profitable. Based
on the framework for analyzing strategic investment as an entry deterring strategy the
profitability of such a strategy depends on the
firm‟s reaction curves, and on the success of
the strategy. Lilleborg have clearly chosen a
strategy, where the major laundry detergent
producer, overinvest to deter entry, a so called
Top Dog Strategy. Such behavior should
indicate that the market leader either believes
decision variables to be strategic complements,
or that it will be able to deter entry.
Assume that only the number 1 and 2 brands are profitable in Norwegian laundry detergent
markets we may argue that the goal of a brand proliferation strategy is to reduce the
likelihood that a potential entrant is able to locate a niche that may grow enough so as to take
over the number 1 and 2 positions. If an entrant was to be successful in establishing itself as a
number 1 or 2 brand, the investment made in deterrence will not increase incumbent profits,
since only the number 1 and 2 brands are profitable. Decision variables are thus strategic
substitutes, indicating that Lilleborg in fact is convinced they will be able to deter entry.
Based on Lilleborg‟s current market position, successful entry deterrence seems plausible,
leading us to the analysis on current detergent markets.
4.5 Current Detergent Markets
The strategy employed by Lilleborg indicate that they are convinced they will be able to deter
potential entrants from taking over the number 1 and 2 positions in the Norwegian detergent
market. During the second detergent war, Omo‟s market share seems to be fairly stable, while
Blenda is losing significant market share. This is similar to the situation in the late 1960s and
may indicate that Blenda is not of the same quality as Omo and Ariel. Lilleborg‟s concern
should thus be with improving the quality of the number 2 product.
20: Product launches 1989-2011
0
5
10
15
20
25
30
Lilleborg Other

53
Figure 16, showing an excerpt from the market share figure introduced in chapter two
showing only Blenda and Ariel indicate the developments of the last few years and shows
how. If the trend continues we will see
Ariel take over Blenda‟s position as the
number two brand in Norway.
Concerning the welfare effects of such a
change, the last 10 years have definitely
provided consumers with more choices
in the detergent market. If the entry
during the second detergent war has had
the same effects on prices as it did in the
late 1960s, the entry occurring in
Norwegian detergent markets after 2000 will cause a transfer of wealth from detergent
producers to detergent consumers or a reduction in deadweight loss depending of the
consumers‟ elasticity of substitution.
-
5,0
10,0
15,0
20,0
25,0
30,0
2007 2008 2009 2010
Blenda
Ariel
21: Market shares Blenda and Ariel (2007-2010)
54
5 Conclusions
Laundry detergent is an experience good, meaning that consumer experience in using and
verifying the quality of the good is important in determining demand. This causes brand
loyalty to be important in determining final sales. We have seen that Lilleborg was able to
build up strong brand loyalties for their products after the launch of Blenda in 1935. As
laundry detergent settled down on a dominant product design, the industry slowly matured,
and several firms exited the detergent market. That Blenda, launched in 1935, and Omo,
launched in 1952, are still the two most sold laundry detergents in Norway is a good indicator
that their brand loyalties have been strong in the mature detergent market.
Because of these strong brand loyalties, entry into the Norwegian detergent market is costly.
This is especially the case after markets matured. We have seen that two major multinationals
have been deterred from entering the Norwegian laundry detergent market in the late 1960s.
Their lack of success may be explained by the fact that breaking down brand loyalties was
very expensive. Despite introducing products that provided an improvement in quality to
some of the incumbent brands, they were not able reach the break-even point.
For explaining current market structure, the general observation that entry into the mature
detergent market is expensive is important. The failed entry attempt by P&G and Colgate in
the late 1960s may thus have provided an important signal to potential entrants that this
market was impenetrable. Despite their failure, the attempt of Procter & Gamble and Colgate
was also a matter of circumstances surrounding this particular attempt of entry. The fact that
Lilleborg was quick to improve their Omo brand and later Sol and Blenda meant the potential
market available for the entrants was smaller. Since there were two entrants competing for a
limited share of the market may also be important in explaining their failed attempt at entry.
The evolution of the detergent industry as described by the development of entry and exit
patterns is important in explaining current market structure. Similarly, strong brand loyalties
persist, making entry into the industry costly. In the case of attempted entry into the
Norwegian detergent market, entry proved to be prohibitively costly, even for multinationals
like Colgate and P&G that no doubt had the financial muscle necessary to break in to the
Norwegian market had they been convinced it would prove to be profitable in the long term.

55
While strong brand loyalties may explain why entry has not occurred in mature detergent
markets, special circumstances surrounding the Norwegian market may explain why entry did
not occur in while the market was still developing. Tariffs on soap may have proved a barrier
to deterring entry by foreign companies before strong brand loyalties had been built up. Once
trade was liberalized, the brand loyalties associated with the market leader‟s brands proved
difficult to break down.
Despite strong brand loyalties, we have also seen that they may be broken down, and entry
may be possible if the entrant can provide an improvement in product quality over incumbent
brands. This explains why Tag and Ajax were close to breaking into Norwegian markets in
the late 1960s. Despite the observation that entry seems plausible in the case where a higher
quality product is provided, entry requires large advertising outlays. Because of this, entrants
may still find entry to be unprofitable despite offering a higher quality product.
Explaining current market structure is the main task of this thesis. In doing so, I have chosen
to analyze the history of detergent markets, and why entry has proved not to be successful in
the past. Since market structure is similar today as it was in the late 1930s, entry barriers
arising after this point in the history of the detergent market should provide most important
factor in explaining current market structure. The general conclusion is that strong brand
loyalties are the main reason why market structure today is largely unchanged for the last 80
years. It is also important to emphasize that it is possible to break down brand loyalty, as we
have seen in the case of the detergent war. To maintain its position it is thus important for the
incumbent to make sure the quality of their product high enough. If this is the case, entry is
not only costly, but as we have seen in the case of the detergent war, prohibitively costly.
Entry barriers arising after industry maturity in the Norwegian laundry detergent market is
found to be the main reason why market structure has been largely unchanged for the last 70
years. The initial market structure that developed in the industry before maturity is thus found
to be largely unchanged. With regards to explaining the market structure that developed in the
industry before maturity, available data indicate that Lilleborg‟s advertising is an important
factor. Due to lack of data available about the Norwegian laundry detergent market in the
1930s the certainty surrounding our conclusions about the infant industry is not the same as
for our analysis in the mature industry. Based on the available data we may be fairly certain
about why entrants were unable to enter the Norwegian detergent market after 1940. With
regards to explaining developments before maturity lack of data results in less certainty

56
surrounding the causes of why Lilleborg ended up being the number one producer of
detergent in the 1930s. Based on available data and the industry history, Lilleborg‟s launch of
Blenda in 1935 and the accompanying advertising campaign seems to be the main factor in
explaining the initial market structure that developed at the time before the industry found
their dominant design and evolved into a mature industry.
A more concentrated market structure is usually associated with reduced economic welfare.
This study has not focused on welfare analysis, but developments of price levels during the
attempted entry by Tag and Ajax indicate that Lilleborg have been able to extract some rents
from the market. Because we do not know the consumers‟ elasticity of demand we are unable
to conclude whether the reduction of prices is a mere transfer of wealth from consumers to
producers, or if there is deadweight loss associated with the higher prices charged.
When it comes to future developments in the Norwegian detergent market, the situation seems
more complicated. Based on the analysis above we know that consumers should expect high
quality laundry detergent in spite of the seemingly dominant position of the market leader.
High entry from private label and international brands the last few years indicates that a new
detergent war is being fought in the Norwegian laundry detergent market. Based on the
analysis of the history of the laundry detergent market provided above we do know that to be
successful, the entrants should offer a product providing improved quality over incumbent
brands. At the same time they should expect significant amounts of advertising outlays to
break down incumbent brand loyalty. If entrants are successful in these endeavors, times may
in fact be a-changing in the Norwegian laundry detergent market.

57

58
Sources
Literature
Ackerberg, Daniel A. (2001). Empirically Distinguishing Informative and Prestige Effects of
Advertising. The RAND Journal of Economics, 32(2), 316-333.
Agarwal, Rajshree, & Gort, Michael. (1996). The Evolution of Markets and Entry, Exit and
Survival of Firms. The Review of Economics and Statistics, 78(3), 489-498.
Clarke, Darral G. (1976). Econometric Measurement of the Duration of Advertising Effect on
Sales. Journal of Marketing Research, 13(4), 345-357.
Gordon, R. Foxall. (1999). The Substitutability of Brands. Managerial and Decision
Economics, 20(5), 241-257.
Jacobsen, Tove. (1976). Krise og markedsutvidende tiltak: en undersøkelse av krisens
virkninger på produsenters bruk av markedsutvidende tiltak i mellomkrigstiden. [T.
Jacobsen], Tromsø.
Jensen, Anders. (1999). Goma Fabrikker - Ello 100 år: Lilleborg AS Avd. Ello.
Jones, Geoffrey. (2005). Renewing Unilever: transformation and tradition. Oxford: Oxford
University Press.
Kaldor, Nicholas. (1950). The Economic Aspects of Advertising. The Review of Economic
Studies, 18(1), 1-27.
Larsen, Leif Ove. (1990). Ren, pen og moderne: sosialhistoriske perspektiver på reklame og
analyser av Denofa-Lilleborgs reklamefilmer 1927-1988 (Vol. nr 2, 1990). Oslo:
Rådet.
Lilleborg. (1968). Årsberetning og regnskap for A/S De-No-Fa for Lilleborg Fabrikker 1967
(Annual Report and Accounts, 1967), Lilleborg Museum Archives
Lilleborg. (1983). 150 år ved Akerselven (1983 ed., pp. 45). Oslo: A/S Denofa og Lilleborg
Fabrikker.
Lilleborg. (2009). Det rene eventyr - Lilleborg 175 år: Lilleborg AS.
Lund, Ellen Cathrine. (2008). Branding Blenda: Lilleborgs markedsføring overfor husmødre
1950-1970. nr. 351, Det humanistiske fakultet, Universitetet i Oslo, Oslo.
Martin, Stephen. (2010). Industrial organization in context. Oxford: Oxford University Press.
Morse, Gary K., Perry, Roger, & Lester, John N. (1995). The Impact of Sodium
Tripolyphosphate Substitution in Western Europe. Ambio, 24(2), 112-118.

59
Nelson, Phillip. (1970). Information and Consumer Behavior. The Journal of Political
Economy, 78(2), 311-329.
Nelson, Phillip. (1974). Advertising as Information. The Journal of Political Economy, 82(4),
729-754.
Sandvik, Pål Thonstad. (2010). Såpekrigen 1930-31 - Lilleborgsaken, venstrestaten og norsk
økonomisk nasjonalisme [The Soap War 1930-31]. Historisk Tidsskrift, 03, 25.
Sandvik, Pål Thonstad, & Storli, Espen. Encountering economic nationalism, Lever's, Van
den Bergh’s and Jürgen's expansion into Norway 1912-1935. Forthcoming
Schmalensee, Richard. (1978a). Entry Deterrence in the Ready-to-Eat Breakfast Cereal
Industry. The Bell Journal of Economics, 9(2), 305-327.
Schmalensee, Richard. (1978b). A Model of Advertising and Product Quality. The Journal of
Political Economy, 86(3), 485-503.
Shum, Matthew. (2004). Does Advertising Overcome Brand Loyalty? Evidence from the
Breakfast-Cereals Market. Journal of Economics & Management Strategy, 13(2), 241-
272. doi: 10.1111/j.1530-9134.2004.00010.x
Spence, A. Michael. (1980). Notes on Advertising, Economies of Scale, and Entry Barriers.
The Quarterly Journal of Economics, 95(3), 493-507.
Sutton, John. (1991). Sunk costs and market structure, price competition, advertising and the
evolution of concentration: The MIT Press.
Sørgard, Lars. (1997). Konkurransestrategi - Eksempler på anvendt mikroøkonomi (2 ed.):
Fagbokforlaget.
Thomas, Lacy Glenn. (1989). Advertising in Consumer Goods Industries: Durability,
Economies of Scale, and Heterogeneity. Journal of Law and Economics, 32(1), 163-
193.
Thoner, Kristoffer. (2006). Change management in Lilleborg, a Part of the degree Master of
Business Administration., University of Bath, Bath.
Tirole, Jean. (1988). The theory of industrial organization. Cambridge, Mass.: MIT Press.
Unger. (1997). Fra såpe til tensider og surfacanter, Unger Fabrikker A.S, gjennom 75 år
(1922-1997): Unger Fabrikker AS.
Varian, Hal. (2006). Intermediate microeconomics, a modern approach (7 ed.): W.W. Norton
& Company.
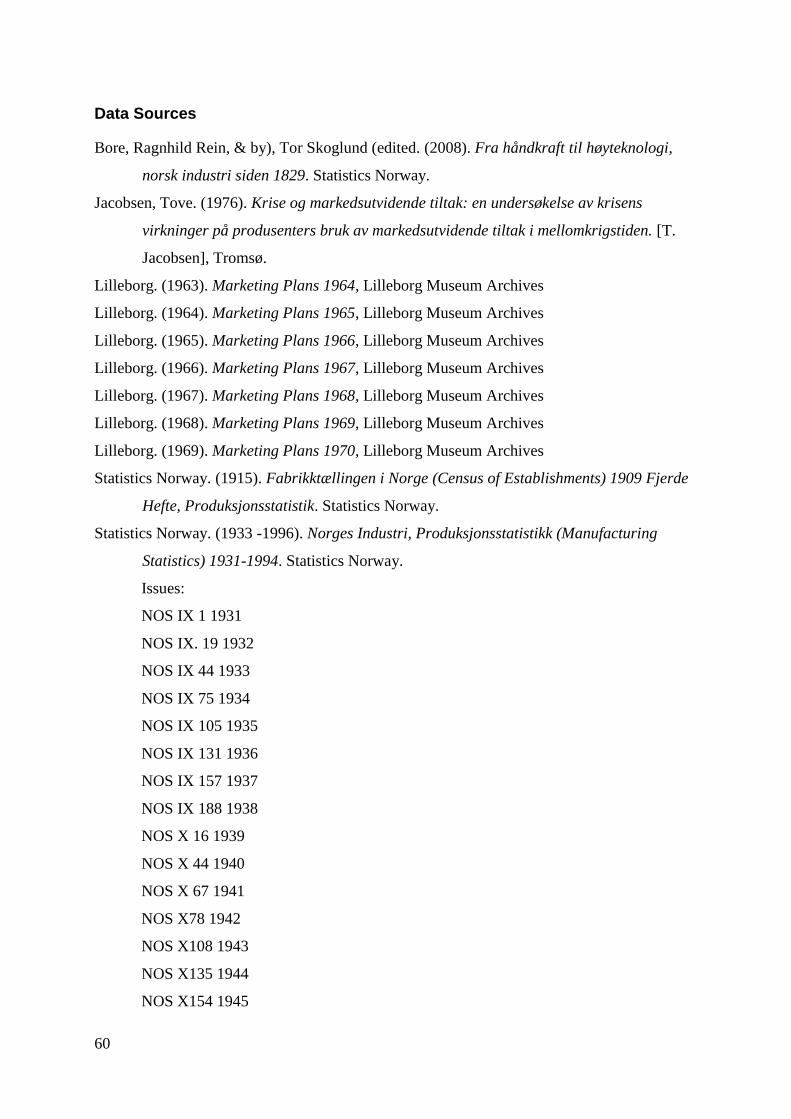
60
Data Sources
Bore, Ragnhild Rein, & by), Tor Skoglund (edited. (2008). Fra håndkraft til høyteknologi,
norsk industri siden 1829. Statistics Norway.
Jacobsen, Tove. (1976). Krise og markedsutvidende tiltak: en undersøkelse av krisens
virkninger på produsenters bruk av markedsutvidende tiltak i mellomkrigstiden. [T.
Jacobsen], Tromsø.
Lilleborg. (1963). Marketing Plans 1964, Lilleborg Museum Archives
Lilleborg. (1964). Marketing Plans 1965, Lilleborg Museum Archives
Lilleborg. (1965). Marketing Plans 1966, Lilleborg Museum Archives
Lilleborg. (1966). Marketing Plans 1967, Lilleborg Museum Archives
Lilleborg. (1967). Marketing Plans 1968, Lilleborg Museum Archives
Lilleborg. (1968). Marketing Plans 1969, Lilleborg Museum Archives
Lilleborg. (1969). Marketing Plans 1970, Lilleborg Museum Archives
Statistics Norway. (1915). Fabrikktællingen i Norge (Census of Establishments) 1909 Fjerde
Hefte, Produksjonsstatistik. Statistics Norway.
Statistics Norway. (1933 -1996). Norges Industri, Produksjonsstatistikk (Manufacturing
Statistics) 1931-1994. Statistics Norway.
Issues:
NOS IX 1 1931
NOS IX. 19 1932
NOS IX 44 1933
NOS IX 75 1934
NOS IX 105 1935
NOS IX 131 1936
NOS IX 157 1937
NOS IX 188 1938
NOS X 16 1939
NOS X 44 1940
NOS X 67 1941
NOS X78 1942
NOS X108 1943
NOS X135 1944
NOS X154 1945
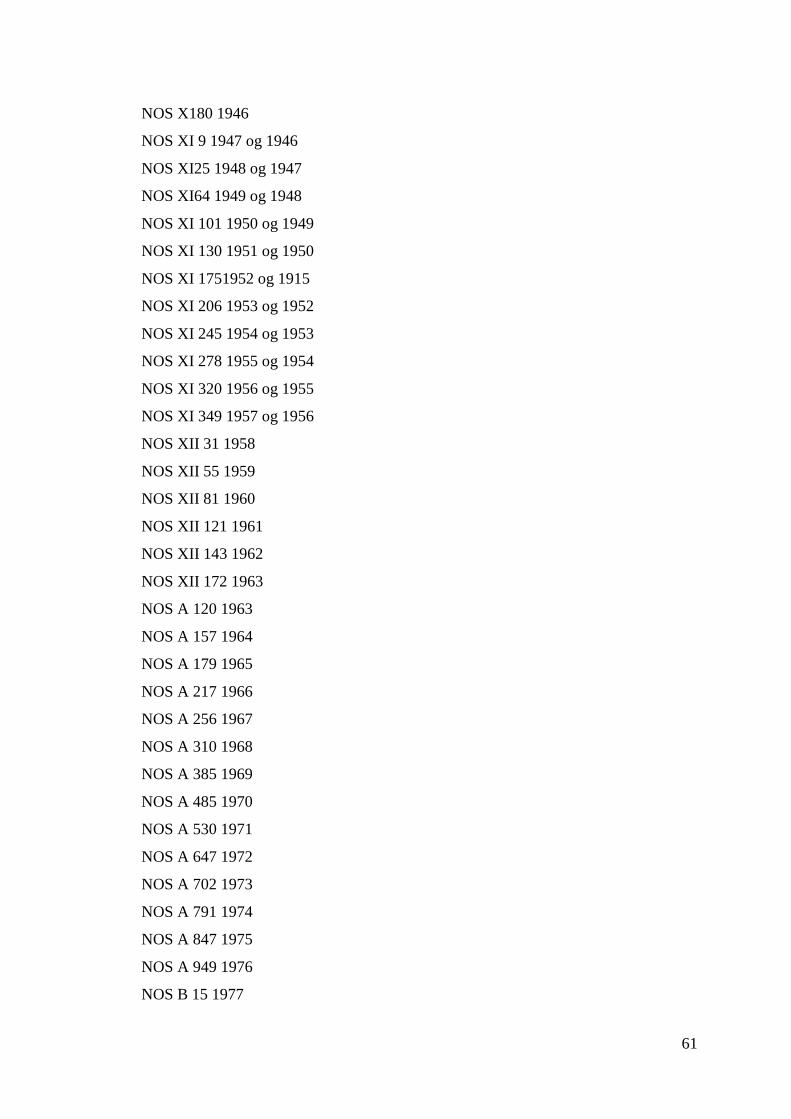
61
NOS X180 1946
NOS XI 9 1947 og 1946
NOS XI25 1948 og 1947
NOS XI64 1949 og 1948
NOS XI 101 1950 og 1949
NOS XI 130 1951 og 1950
NOS XI 1751952 og 1915
NOS XI 206 1953 og 1952
NOS XI 245 1954 og 1953
NOS XI 278 1955 og 1954
NOS XI 320 1956 og 1955
NOS XI 349 1957 og 1956
NOS XII 31 1958
NOS XII 55 1959
NOS XII 81 1960
NOS XII 121 1961
NOS XII 143 1962
NOS XII 172 1963
NOS A 120 1963
NOS A 157 1964
NOS A 179 1965
NOS A 217 1966
NOS A 256 1967
NOS A 310 1968
NOS A 385 1969
NOS A 485 1970
NOS A 530 1971
NOS A 647 1972
NOS A 702 1973
NOS A 791 1974
NOS A 847 1975
NOS A 949 1976
NOS B 15 1977

62
NOS B 98 1978
NOS B 194 1979
NOS B 273 1980
NOS B 384 1981
NOS B 456 1982
NOS B 538 1983
NOS B 597 1984
NOS B 673 1985
NOS B 755 1986
NOS B 836 1987
NOS B 914 1988
NOS B 989 1989
NOS C 36 1990
NOS C 89 1991
NOS C 162 1992
NOS C 253 1993
NOS C 327 1994.

63
Appendix
Appendix A – Cournot Competition
The simplest form of Cournot competition is the duopoly case in a one shot game, with
homogenous products as described by Sørgard 1997. The firm‟s decision variable, quantity of
production, is not known to other when they each make their production decision. The market
price is determined as a function of total quantity produced, given by
( )
and are quantities chosen by firm 1 and 2 respectively. Assuming constant marginal
cost, and zero fixed costs, the profit function for firm 1 is given by
( )
The market equilibrium is the situation where both firms choose their optimal level of
production, given the other firms level of production. Since the market price depends on the
firm‟s output decision, each firm will take into account the effect increased quantity will have
on the market price. Each firm will also take into account the production decision of the other
firms when making its production decision. Each firm‟s reaction function satisfies the first
order conditions of their profit functions,
Solving for Q1 we get firm 1s reaction function which is a function of the other firms
produced quantity.
( )
Similarly for firm 2:
( )

64
The relationship between the decision variables of the two firms is given by
The interpretation of this is that the larger quantity firm 1 chooses, the smaller quantity firm 2
should choose. We say the decision variables are strategic substitutes, in the respect that when
the opponents increase his decision variable we have incentive to lower ours.
The equilibrium is found by inserting firm 2‟s reaction function into firm 1‟s. This yields the
following expression
Solving for Q1
Cournot equilibrium
𝐴 𝐶
𝐵
𝐴 𝐶
𝐵
𝐴 𝐶
𝐵
𝐴 𝐶
𝐵
𝑄
𝑅 (𝑄 )
𝑄
𝑅 (𝑄 )
𝑄
𝑄

65
Appendix B – Games of Commitment
A firm‟s decision may be related to how it may maximize its present profits. Firms also care
about future profits, and may take action in a bid to maximize their expected profits in the
future. When a firm makes a decision so as to affect its own or its rival‟s future decisions, we
say that the firm is acting strategically.
Strategic commitment
In the following I will introduce model in an attempt to understand a firm‟s strategic behavior.
The starting point is a two stage game where investment is the firm‟s decision variable. The
model will attempt to understand how a dominant firm may use investment as a tool to
increase its future profits in the case where there is a potential entrant. The presentation will
follow Sørgard 1997‟s presentation of the strategic commitment model.
The two stage game
At stage 1, a firm will make an investment decision involving some sunk cost. At stage two in
the game, the firm will either continue to operate as a monopolist, or compete a la Bertrand or
Cournot. The presentation will follow Sørgard 1997.
Two stage game (Sørgard, 1997 p. 132)
For a firm‟s decision to have a long term strategic effect (an effect on potential entrant‟s
future behavior), the following two conditions must be met
1. The decision must be observable by the other firm
2. The decision must incur some credible change in the incumbent‟s future decisions
Stage 1
Investment decision
(Strategig commitment)
Stage 2
Price- or quantity competition
(Firms meet in the market)
66
The strategic effect of a decision by the firm may be categorized into an indirect and a direct
effect.
- The indirect effect works will change the way the incumbent are likely to act in the
future in the face of entry. An example is actions making price war a profitable
strategy for the incumbent in the case of entry. Through changing its own optimal
strategy in the face of entry the incumbent hopes to change the potential entrants‟
entry decision, or the entrants‟ behavior post entry.
- A strategic decision may also have a direct effect by changing potential entrant‟s
decisions directly. The direct effect may work in two different ways. The incumbent‟s
actions may:
1. Change the costs of the potential entrant.
2. Affect the market size the entrant faces.
When acting strategically, the firm will choose its strategy based on what it sees as the
ultimate goal of the strategy. There are two possible scenarios
1. The firm thinks it might be able to deter entry, and hence choose a strategy that will
reduce the potential entrants post entry profits to zero.
2. The firm is unable to prevent the firm from entering the industry. In this case it might
still be in the interest of the firm to act strategically to increase its own post entry
profits.
We will examine both strategies in the following.
Entry Deterrence
We are assuming a firm is able to deter entry by the potential incumbent by making an
investment involving a sunk cost K. K is observed by the other firm before the entry decision
is made at step two of the game. In step one of the game K is a decision variable for firm 1,
while and is the decision variable for the two firms in stage two of the game, should the
new firm decide to enter the industry. When the decision of x is made, K is known, so that
and are functions of K.
67
To deter entry, firm 1 has to choose K such that the post entry profits of firm 2 is equal to
zero. Firm 2‟s profit function will have the form:
( ( )
( ))
To find how firm 1 may choose K to make entry unprofitable for firm 2, we differentiate firm
2‟s profit function with respect to K.
The first expression
on the right hand side is the direct effect the incumbent‟s
investment. As mentioned above, the direct effect may change both costs and the market
size facing the potential entrant.
The second expression,
, measures the strategic effect. K changes the incumbent‟s
behavior in the second stage of the game. The indirect effect measures how this change in
behavior affects the potential entrants post entry profits.
Assuming firms choose the optimal level of their decision variable we may skip the third
part of the right hand side expression in our analysis, since this includes the marginal
change in the firm‟s decision variable, that under optimality necessarily have to equal 0.
The total effect on the entrant‟s profits depends on the sum of the direct effect and the indirect
effect.
The incumbent want to choose a level of K so that the entrant‟s profits are reduced to zero.
What this means for the actual choice of K, depends on qualitative effect the investment has
on the entrant.
If
, increased investment by the incumbent reduces profits for the entrant. In
this case the incumbent should invest more than he would do in the absence of
strategic considerations to deter entry by the potential entrant.

68
In this case where
the incumbent should invest less to deter entry, compared
to the situation where strategic considerations are not a part of the incumbents
decision making.
The above model describes how a firm should act in if its strategy is to reduce the potential
entrants post entry profits to 0. Still, it might be the case that the incumbent is not able to
reduce the entrant‟s profits to zero. In the next section we will discuss how a firm should act
in the case where it believes that it cannot deter entry.
Accommodated Entry
Even though an incumbent decides to let another firm enter a given market, it might be in the
incumbent‟s interest to behave strategically. Compared to the case where the incumbent
choose a strategy of deterrence, the goal of an accommodation strategy is not to push the
potential entrant‟s profits to zero, but rather to maximize the incumbent‟s post entry profits.
We continue by using the investment level K as the incumbent‟s decision variable.
Differentiating with respect to K we find how the incumbent‟s investment level affects its
own profits.
The first expression is the direct effect. That is, how much an investment will affect
the incumbent‟s fixed costs.
The second part of the expression is the strategic effect. The strategic effect will
determine if the firm should invest more or less, compared to a situation where
strategic considerations are absent.
Assuming the incumbent will make an optimal production decision, the third
expression on the right hand side will equal zero.
The aggregated effect is found by decomposing the second part of the expression on the right
hand side.

69
The first expression on the right hand side is the effect of the incumbent‟s profit in a
change in the entrant‟s decision variable.
The second part of the right hand side expression is the derivative of the entrants
reaction function, how the entrant‟s decision variable is affected by a change in the
incumbent‟s decision variable.
The last part of this expression is the effect of the investment on the entrant‟s behavior
in the second stage of the game.
Not considering the second part of the right hand side expression, the two parts remaining is
analogous to the strategic effect in the case of entry deterrence. In the case of entry
deterrence, the potential entrant is never present in the market, and hence we don‟t have to
take into account how firms would compete in the case of entry. In the case where entry takes
place, we have to take into account how competition in the market will take place post entry.
is the slope of the reaction curve. It the slope of reaction curves is negative (as in Cournot
competition), the strategy a firm should employ in the accommodated entry case is the same
as the strategy it should employ in the case of entry deterrence. In the case of Bertrand
competition with upward sloping reaction curves, the optimal strategy employed by the
incumbent is qualitatively different in the case of accommodated entry compared with entry
deterrence.
In Bertrand competition decision variables are strategic complements, and reaction curves are
upward sloping. In Cournot competition they are downward sloping and decision variables
are strategic substitutes.
When the market is characterized by Cournot competition, the strategy choice will not depend
whether or not the incumbent chooses a strategy of entry deterrence or accommodation. In
Cournot competition, the decision variables (quantities) are strategic substitutes. If the
incumbent choose to produce a large quantity to deter entry, the entrant should also produce a
low quantity if the strategy fails.

70
In the case of Bertrand competition, the firm‟s decision variables are strategic complements.
In this case the incumbent should choose opposite strategies if the firm choose an
accommodation-strategy compared to a deterrence-strategy.
Graphically, in Cournot competition, aggressive behavior will shift the incumbent‟s reaction
curve out while in Bertrand competition, investment will cause the incumbent‟s reaction
curve to shift inwards.