advertising to early trend propagators: evidence...
TRANSCRIPT
Advertising to Early Trend Propagators: Evidence fromTwitter
Anja Lambrecht, Catherine Tucker and Caroline Wiertz∗
December 1, 2015
Abstract
In the new digital economy, influencing and controlling the spread of informationis a key concern for firms. One potential way to achieve this is to target firm commu-nications to consumers who embrace and propagate the spread of new information onemerging and trending topics. However, little is known about whether early trend prop-agators are indeed responsive to firm-sponsored messages. To explore whether earlypropagators of trending topics respond to advertising messages, we use data from twofield tests conducted by a charity and an emerging fashion firm on the micro-bloggingservice Twitter. On Twitter, ‘promoted tweets’ allow advertisers to target individualsbased on the content of their recent postings. Every day, Twitter identifies which topicsare newly popular among Twitter users. In the field tests, a charity and a fashion firmtargeted ads at consumers who embraced a Twitter trend early on in its life-cycle byposting about it, and compared their behavior to that of consumers who only startedtalking about the same topic later on. Throughout both field tests, we consistentlyfind that individuals who started talking about new and trending topics early are lessresponsive to advertising than consumers who embraced trends later, suggesting thatit may be difficult to commercially exploit emerging topics online through advertising.
Keywords: Online Advertising, Targeting, Twitter, User-Generated Con-tent, Internet, ReactanceJEL Codes: L86, M37
∗Anja Lambrecht is an Assistant Professor at London Business School, London NW1 4SA, UK. Cather-ine Tucker is the Sloan Distinguished Professor of Marketing at MIT Sloan School of Management, MIT,Cambridge, MA 02139, USA. Caroline Wiertz is a Professor of Marketing at Cass Business School, City Uni-versity London, London EC1Y 8TZ, UK. This work was supported in part by the Marketing Science Instituteand the Deloitte Institute of Innovation and Entrepreneurship. We thank Kevin Curran, Prasad LakshmiVana, Haemi Shin, Vaidheesh Venkatram, Andrew Leung, and Mario Campana for excellent research assis-tance, and an anonymous charity, Tim Bissett, Nicolai Schuemann, Sean Keyes and Catherine Bennett forinvaluable help. We are grateful to participants at the 2014 Marketing Science conference, the 2014 SICSconference, the 2015 EMAC conference and the DIIE Research Symposium; seminar participants at theUniversity of California San Diego, the University of Cologne and ETH Zurich; and to Amit Bhattacharjee,Avi Goldfarb and Puneet Manchanda for their comments. All mistakes are ours alone.
1

1 Introduction
The digital economy is characterized by ever-faster information flows. This has two con-
sequences for consumers. First, information diffusion happens faster. Second, the sheer
quantity of information means that consumers’ attention is a scarce resource (Falkinger,
2008). Micro-blogging services like Twitter showcase these effects. Twitter is characterized
by fast-paced and short-lived information flows; new topics continually emerge and fade.
As advertising platforms, micro-blogging services have two unique features. First, they
allow advertisers to identify new topics that are gaining interest or ‘trending’ rapidly across
the platform (Du and Kamakura, 2012). Trending topics are increasingly displayed on social
media such as Twitter and Facebook, and on news sites, such as the BBC.1 Reflecting this
media attention, large brands such as L’Oreal and Marriott have recently brought content
marketers in-house to enable them to participate in rising trends quickly.2 Second, micro-
blogging services allow advertisers to identify users who propagate these newly trending
topics, and to target advertising specifically to them (Vaynerchuck, 2013).3 Marketers often
try to seed information about their product or service with such users, hoping they will
engage with it and spread it virally to their peers. It is commonly assumed that these users
can be influenced by marketing communications (Mahajan et al., 1990).
This research uses data from two field tests conducted on Twitter to explore whether early
propagators of new trends are indeed likely to engage with firm-sponsored messages. Our
first field test was conducted in conjunction with a large UK charity, that ran a campaign to
1http://www.bbc.co.uk/news/blogs/trending2http://digiday.com/brands/loreal-bringing-fast-twitch-content-house/. Note also the view
of the commercial director of That Lot, a company that specializes in writing for the Twitter feeds of largebrands: “A phrase I use a lot is ‘advertising at the speed of culture.’ Without doubt, topicality is theprevailing wind of social (especially on Twitter), and being on top of the latest trends is paramount.”
3For examples of firms attempting this, see http://www.slideshare.net/razorfishmarketing/
fluent-the-razorfish-social-influence-marketing-report, http://www.huffingtonpost.
com/jeff-cann/influencer-marketing_b_3786985.html and http://www.inkybee.com/
top-50-influencer-marketing-blogs.
2
create awareness of homelessness around Christmas. The second field test was conducted in
cooperation with a new, upcoming UK fashion label. For our purpose, the key feature of the
Twitter website is that it identifies and lists the ’top ten trends’, words or phrases featuring
frequently in tweets, in real time. These trends usually arise organically and unpredictably
from user conversations. In both field tests, the organization targeted ads to Twitter users
who had posted tweets containing phrases related to trending topics in the form of ’promoted
tweets’. Large brands like Pepsi and Asda have used similar approaches in their advertising,4
as has the New York Times’ website, where advertisers can choose to target individuals who
read stories currently trending on Twitter.5 The unique characteristic of our field tests it
that we target ads to users who post on a topic when it is listed by Twitter as ’trending’ and
are consequently ’early trend propagators’ as well as to users who post on the same topic on
a later day when it is no longer trending or as popular.
We draw on self-determination theory (Ryan and Deci, 2000; Deci and Ryan, 1980) to
explain why responsiveness to advertising may differ depending on whether the individual
is an ’early trend propagator.’ We suggest that early trend propagators are extrinsically
motivated by status rewards, an argument that relates to Stephen and Toubia (2013), who
distinguish between Twitter users’ intrinsic and image-related utility. On Twitter, users get
status rewards from providing content that leads them to receive acclaim from their followers.
Early trend propagators, more than late propagators, are concerned with self-presentation,
and use hashtagged trending discussions to conspicuously present themselves to the Twitter
publics as users who know about the latest trends. The rapid pace of Twitter is inherently
important (Arvidsson and Caliandro, 2015), and being on top of latest trends is one way to
signal sub-cultural capital on Twitter. Therefore, they will engage with and propagate con-
4See https://business.twitter.com/success-stories/pepsi-max and https://business.
twitter.com/success-stories/asda.5They call this approach ‘Sparking Stories’ - see http://www.psfk.com/2013/
02/ny-times-trending-twitter-ads.html and http://paidcontent.org/2013/02/19/
the-nyt-is-doing-something-smart-by-using-twitter-trends-to-target-ads
3
tent that may serve this purpose but have little reason to engage with advertising messages.
In a survey of Twitter users, we document that early trend propagators indeed have a higher
extrinsic motivation than others for posting on Twitter.
Our field tests support our theory. Throughout both field tests, engagement with the ads,
that is clicks on the promoted tweets or retweets of it, is lowest when targeting individuals
who embrace the trend when it first emerges and higher on following days. Our identification
is based on comparing the response to the same ad of individuals who tweet about the same
topic on different days. We explain this difference in advertising responsiveness by the
inherent differences in individuals that lead them to embrace trends at different points in
time. To address concerns that other differences not connected to the individual might
affect responsiveness to advertising, we conduct a battery of robustness checks that suggest
that indeed differences across individuals rather than an artifact of the Twitter advertising
algorithm lead to differences in response to the ad.
Our field tests also provide further support for this effect being driven by individual
differences. In our first test, we find that only early propagators of organic and non-firm
initiated trends are unresponsive to advertising. Early propagators of trends that were
initiated and sponsored by firms show no such pattern. In the second field test, we find that
when the product advertised is more likely to be relevant to consumers, based on the type of
trend they posted on, and the message conveys the image of a unique and less commercial
brand, early trend propagators are at least as likely as others to engage with the advertising
message. However, if the message is judged as being less unique but more commercial or
the product category less relevant to the consumer, then early trend propagators continue
to show lower engagement than consumers who post on later days. Taken together, these
results suggest that in fact early trend propagators are generally not willing to engage with
firm-sponsored messages, unless they see an opportunity to consume a message that may
allow them to raise their profile and gain the esteem of others.
4
This paper contributes to three streams of literature. The first is a growing literature on
sharing behavior on micro-blogging services. Some of this literature has examined the role of
Twitter data in improving the accuracy of forecasts of cultural, consumer and stock market
trends (Asur and Huberman, 2010; Goel et al., 2010; Bollen et al., 2011). Other research
has examined the motivation of Twitter users to post content and their responsiveness to
it. Stephen and Toubia (2013) show that Twitter users contribute content both for intrinsic
and image-related reasons. Watts and Dodds (2007) present an early model of potential
influential behavior in social networks. Subsequently, Bakshy et al. (2011) used Twitter user
data to model the effects of potential influencers in spreading a message, and find that the
size of an influencer’s network does not provide clear guidance on whom to compensate.
This echoes work by Cha et al. (2010) who provide evidence that a large number of Twitter
followers is not that predictive of influence on Twitter. Perhaps an explanation of this result
is Weng et al. (2010)’s finding that homophily explains followership among Twitter users.
While these studies provide insights into the role of network characteristics in spreading
messages, they do not shed light on the role of individual differences between users, and do
not address whether early trend propagators are likely to be receptive to advertising.
The second stream is a literature on advertising and targeting online. The early literature
on display advertising focused on the performance of non-targeted ads (Manchanda et al.,
2006), but more recent articles have evaluated the effectiveness of new forms of targeting,
including targeting based on search queries (Ghose and Yang, 2009; Rutz and Bucklin, 2011;
Athey and Ellison, 2011; Goldfarb and Tucker, 2011b), content (Goldfarb and Tucker, 2011a),
time (Sahni, 2011) and previous browsing behavior (Lambrecht and Tucker, 2013). To our
knowledge, no papers have evaluated whether firms benefit from targeting consumers who
embrace trends online. One constant theme of this literature is the tradeoff between reach
and effectiveness, as targeting improves effectiveness but also reduces reach. By contrast,
our paper suggests that this limitation of reach may extend further in the digital economy,
5
as attempts to target those who themselves might lead to reach are ineffective.
The third stream is a literature on the targeting of individuals within social networks.
Much of this work focuses on the interaction between the social graph and targeting strategies
(Kempe et al., 2003; Hinz et al., 2011; Stonedahl et al., 2010). A few studies examine
campaigns that were explicitly designed to go ‘viral.’ Toubia et al. (2009) present evidence
that a couponing campaign was more effective when transmitted using a ’viral’ strategy on
social media than when using more traditional offline methods. Chen et al. (2011) show
that social influence is most important in the beginning of a product’s life. Ryan and
Tucker (2012) model equilibrium outcomes of targeted seeding strategies on social networks.
Our work is perhaps most closely related to Gong et al. (2015), who find that tweets by
TV companies directly boost viewing but are less effective than retweets by influentials in
bringing new followers to the company. At the heart of these latter papers is the idea of
advertising to individuals who are key in spreading trends across a network. By contrast,
we focus on the type of individuals who embrace and propagate trends early on, and ask
whether firms can influence them through commercial messages. While our empirical setting
is Twitter, we focus on the response to advertising and not on how individuals interact in
social networks (Stephen and Toubia, 2010; Katona et al., 2011; Yoganarasimhan, 2012).
This paper also has insights for managers. Often, managers believe they should try to
spread organic word of mouth by identifying early trend propagators and influencers and
persuading them to adopt a message, as Pepsi, Asda and the NY Times have tried to do.
Indeed, Twitter presents a unique opportunity for marketers by allowing them to identify
such individuals. Our findings suggest, however, that this tactic may be more difficult to
achieve than previously presumed, since early trend propagators may not easily engage with
firm-sponsored messages.
Our paper is organized as follows. In section 2 we set up and define the idea of an ‘Early
Trend Propagator’ on Twitter from a theoretical perspective and provide data collected
6
through the Twitter API as well as survey data to support this. In Section 3 we describe the
empirical setting and in Sections 4 and 5 we describe our two field tests. Section 6 concludes.
2 Twitter Trends and Early Trend Propagators
2.1 Why are Trends and Early Trend Propagators Important for Marketers?
In the past, firms trying to broadcast communications were limited to purchasing ads (e.g.
on TV and print media) or using public relations to entice journalists to write about their
product. Now, digital and social media buzz allow firms to attract publicity by involving
consumers in spreading information on a large scale. At the same time, Twitter, the focus
of our field studies, allows users to unite conversations around topics through ’hashtags’. In
turn, these hashtags can be used to identify new and evolving trends or topics of conversation.
Twitter itself promotes and emphasizes the importance of these trends to users.
Figure 1 shows how the left-hand panel of the Twitter homepage presents the ’top trends.’
While the exact algorithm Twitter uses to identify trends is proprietary, ’top trends’ are
detected partly based on the frequency and momentum of hashtagged posts, allowing Twitter
to identify trends shortly after the topic becomes relevant to an unusually large audience.
Research in computer science suggests that it takes Twitter only hours to recognize new
trends (Chen et al., 2013; Kong et al., 2014). Trends on Twitter are short-lived: The top
trend on any day typically does not appear among the top ten trends on the following days;
in the period covered by our two field studies, the same top trend never appeared twice. As
these trends are ’information goods,’ their diffusion pattern is different in nature from the
pattern that the literature on early adopters, such as Rogers (1962), has focused on.
We define early trend propagators as individuals who have a predisposition to participate
in an online conversation on a topic that is about to or has just started ‘trending’ on social
media. Our definition presumes that they are active social media users and that attention
should be paid to the point in time at which they engage with a topic.
7
Early trend propagators play a pivotal role in disseminating information when it becomes
relevant to a large number of users. The number of early trend propagators is not necessarily
small - the mere fact that a topic is a trend means that its conversation volume is unusually
large. Reaching out to social media users who are responsible for participating in and
spreading these trends may be important to firms. Indeed, firms hope that these users
may consume or disseminate information about their brand or product in similar ways as
they consume and disseminate information on new topics or trends. As a result, firms
increasingly attempt to mesh a product with an emerging trend, a strategy broadly referred to
as ‘trendjacking’,6 by inserting their branded messages into social media conversations around
trending topics on Twitter. For example, the birth of Princess Charlotte in England sparked
a flurry of messages by advertisers promoting their brand around the hashtag #royalbaby.7
2.2 Motivation of Early Trend Propagators
We draw on self-determination theory to explain why early trend propagators are less re-
sponsive to firm-sponsored messages. We propose that being an early trend propagator is
an individual difference related to regulatory style, that is, what regulates that individual’s
actions and motivates their behavior, depending on situations and contextual factors (Deci
and Ryan, 1980; Ryan and Deci, 2000). We propose that early trend propagators have a
strong control orientation. As such, they are motivated by external rewards and a high de-
gree of ‘ego involvement’ (Ryan, 1982), that is they mostly perform acts in order to enhance
or maintain self-esteem and a feeling of worth (Deci and Ryan, 1985), rather than for the
intrinsic enjoyment of the activity as such. On Twitter, such feelings of worth are linked to
status rewards that stem from having an audience who values their postings. The number of
followers, likes, retweets, and so on are prominently displayed and send a strong signal about
the Twitter users’s social standing, triggering extrinsic motivation in those susceptible to it.
6http://www.toptensocialmedia.com/social-media-social-buzz/ten-emerging-social-media-marketing-trends-for-2014/7http://www.adweek.com/news/technology/here-are-top-10-branded-tweets-about-royal-baby-164496, http://www.
adweek.com/news/advertising-branding/how-nissan-beat-everyone-royal-baby-tweet-just-seven-minutes-160001
8
Our conceptualization of early trend propagators relates to research documenting that
social media users predominantly post content because they derive utility from status or
prestige associated with the activity and that desire to acquire a larger followership motivates
tweeting (Stephen and Toubia, 2013). As a result, in order to ensure that their postings are
indeed valued by their followers, early trend propagators are more likely to engage in Twitter
activities that help attain this goal, including carefully curating which content to engage
with and post, in order to signal attractiveness as a content provider. In a fast-moving
social network such as Twitter, new content on topics that are considered relevant by a
large number of people attracts the attention and potential acclaim of others. We propose
that early trend propagators attach particular importance to consuming and posting timely
information of interest to potential followers. Therefore, we add a timeliness dimension to
the concept of extrinsic motivation.
Due to the rapid pace of Twitter (Arvidsson and Caliandro, 2015), being on top of latest
trends is one way to signal sub-cultural capital. Since early trend propagators primarily
use Twitter to prove their relevancy to their followership and reap status rewards, they will
engage with content and propagate content that serves this purpose. This self-presentation
motive colors their entire behavior on Twitter and already affects how they read their Twitter
feed - early trend propagators are on the lookout for content that grabs their interest because
it might be relevant also to their followers. We know from communications and word-of-
mouth research that people engage in audience tuning (Berger, 2014; Higgins, 1992; Krauss
and Fussell, 1991) by tailoring what they share to the interests of the audience they are
communicating with, particularly when this audience is made salient (as is the case on
Twitter, where the number of followers of a Twitter user is displayed, as are their reactions to
the user’s posting behavior through likes, retweets, and so on). Targeted advertising content
generally does not fit the requirement of being perceived as interesting or relevant for followers
and therefore for the user. Consequently, engaging with such content is not perceived as
9
status-enhancing and unlikely to satisfy a user’s extrinsic self-presentation motive.
Despite firms’ hopes that early trend propagators may also engage with and propagate a
firm’s commercial message, this theory suggests that early trend propagators who are extrin-
sically motivated and derive status rewards from gathering and disseminating newsworthy
information may be even less interested in a commercial message that does not serve this
purpose. Early trend propagators would then be less likely to engage with a commercial
message. We propose that for early trend propagators, the ultimate goal of self-presentation
colors all types of behavior in the social network and affects the consumption of content, that
is, which content to view, read or click on, as much as actual posting behavior. Indeed, our
findings suggest that the motivation that prompts early trend propagators to disseminate
organic information on trends does not likewise motivate them to engage with firm-sponsored
message; though this effect can be moderated if advertisers take steps to make the adver-
tising message more unique and less commercial, and so more likely to serve the goal of
self-presentation.
2.3 Empirical Evidence on Early Trend Propagators
We collected data to provide evidence that early trend propagators are a distinct group on
Twitter. On six different days in September and October 2014, we identified the ten organic
trends listed on Twitter’s US website. We then used the Twitter streaming API to collect
information on individuals posting on these topics from this point onwards for the same day
and the six subsequent days.8 In total, we collected user information related to 4,124,761
tweets. The data include the number of accounts that follow a user who posted on Twitter
during the time the data was collected (’followers’), the number of accounts this user follows
(Twitter refers to these as ’friends’), the number of posts this Twitter user had made until
that point, and the date when they joined Twitter. We removed observations that are likely
8We identified trends on September 22 - 24, October 11, October 24 - 25. We count as the first day thefirst 24 hours after we identified the trends and started data collection.
10
to be spam (Antonakaki et al., 2015). Spam posts are normally made via Twitter’s API and
users do not log into the Twitter website, making them unlikely trend propagators.9
First, we test whether there is an identifiable set of users who are more likely to post on
a trend early than late. We correlate the number of posts users made on day 1, that is the
day a topic was trending, with the number of posts on days 2 - 7.10 We find a negative and
significant correlation (-0.407, p<0.001). To make sure the results are not biased by the fact
that 80.4% of users appear only once in the data, we exclude these individuals and find very
similar results (correlation of -0.455, p<0.001). These findings show that the propensity to
post on a trend early is negatively correlated with the propensity to post on trends later.
We then group all users into early and late trend propagators and compare the number
of posts on day 1 to the number of posts on any of the following days. Table 1 summarizes
the results for different definitions of early and late trend propagators, varying by whether to
include users with exactly 50% of their posts early/late and whether to exclude individuals
with only a single post. In all instances, early trend propagators are significantly more likely
to post on a trend on the day it emerged than on any later day and late trend propagators
are consistently more likely to post on a trend on a later day. Table 1 also demonstrates that
early trend propagators are an important proportion of those who post on trends, though
these numbers are of course conditional on having posted on a trending topic at all, and a
high enough number of Twitter users to be of interest to marketers.
Second, we compare the Twitter characteristics of early and late trend propagators. We
use different cutoffs, depending on whether ‘at least’ or ‘more than 50%’ of posts were on
the day the trend emerged or on later days. In Table 2, Panels (c) and (d), we compare early
9We identified and removed all accounts with more than five posts on a single trend on a single day ormore than 15 posts on the same trend during the seven-day window, in total 1,031,039 tweets. For ease ofanalysis, we also removed the 1.26% of tweets in the remaining sample that refer to more than one trend(38,918 observations). The remaining sample includes information related to 1,454,675 Twitter users.
10To not bias the results in favor of the hypothesis that early and late trend propagators are two distinctgroups, we count as a single observation if a user posted multiple times on the same day and trend.
11

trend propagators, with more than 50% of their posts made on the day trends emerged, to
late propagators with more than 50% of posts on subsequent days. We find no significant
differences in the number of followers (p=0.207). However, early trend propagators have
significantly more ‘friends’ (p<0.001), that is people they follow, and have posted more
tweets in the past (p<0.001), even though their accounts have been somewhat more recently
created (p<0.001).11
A key assumption underlying our conceptualization of early trend propagators is that
these users’ social media activities are mostly driven by an external motivation and a desire
for status rewards. To provide support for this assumption, we collected survey data from
251 US consumers recruited via Amazon’s Mechanical Turk. The survey adapted existing
scales to measure early engagement with trends (Goldsmith and Hofacker, 1991) and extrinsic
motivation (Kankanhalli et al., 2005). To measure intrinsic motivation, we took inspiration
from Mathwick and Rigdon (2004) and adapted the items to the Twitter context. All items
were evaluated with 5-point Likert scales (’strongly disagree’ to ’strongly agree’). In addition,
four items measured general Twitter involvement on a semantic differential scale, based on
Mathwick and Rigdon (2004). Finally, we presented respondents with seven strategies to
build a larger following, and asked them to pick their top three. All scales display good
psychometric properties (see Web Appendix for details).
Our results show that early engagement with trends significantly correlates with extrinsic
motivation (correlation 0.412, p<0.001), but not intrinsic motivation (correlation -0.043,
p=0.500). This result supports that early trend propagators care about the image they
project to their audience and are mostly motivated by status rewards rather than the inherent
enjoyment of tweeting. Furthermore, early engagement with trends significantly correlates
with general Twitter involvement (correlation 0.394, p<0.001), indicating that early trend
11We repeat the analysis including individuals who posted exactly 50% of their tweets early as early trendpropagators and find that the results are robust (Panels (a) and (d); p-values as follows: followers: p=0.728,friends: p<0.001, posts: p<0.001, days since account created: p<0.001.)
12

propagators generally pay close attention to their Twitter activity. Finally, the top three
strategies to attract followers on Twitter are to ‘post on trending topics or trending hashtags’
(n=156), ‘post on current topics that others care about’ (n=141); and ‘post frequently’
(n=120). These results confirm our assertion that posting on trending topics is valued by
Twitter users and leads to status rewards through acclaim from their followers. Given the
importance of status rewards to early trend propagators, it is not clear whether targeting
these users with a commercial message is indeed an effective marketing strategy for companies
looking to expand their reach on Twitter.
3 Empirical Setting
On Twitter, advertisers can target users in different ways, including based on a hashtag or
keyword mentioned in a post, interests or demographics (gender, geography). The focus of
our field studies is targeting individuals based on whether they used hashtags or keywords
that were listed as trending on Twitter in a post. In each study, we identify on multiple days
trends on the Twitter website and then target promoted tweets, that is advertising messages,
to users who use this trending hashtag or keyword in their post. We target these messages
to users on the day the hashtag or keyword was identified as a trend and on subsequent
days. In each field test, we use different alternative advertising messages and refer to each
targeting and message combination as a ‘campaign’. Table 3 summarizes the similarities and
differences across the two field tests which we will explain in the respective sections.
Twitter distinguishes between trends which emerge organically and ‘sponsored trends’
where a firm pays for a hashtagged term to be first on the list of trends as advertising,
independently of its appeal to users. As such, it does not reflect the popularity of the topic.
Figure 1 shows a sponsored trend. Here, Microsoft promotes its software and charitable
contributions. Below this sponsored trend are the organic trends of the day.
Targeting on Twitter is based on recency. This means that users are targeted by a
13
promoted tweet based on whether they used the targeted words or phrases in one of their
tweets within the last 24 hours.12 In theory, once the target audience that posted on this
topic within the past 24 hours is exhausted, Twitter extends this moving window backwards
to cover users who had posted on the topic at earlier dates. However, given the relatively
small size of the campaigns in our sample (on average 411 daily impressions per campaign
in field test 1 and 935 in field test 2), compared to the large size of conversations about the
top trends that were targeted (on average about 100,000 postings within the preceding 24
hours in both field tests 1 and 2), this seems unlikely to have happened.
On the day a topic is identified as a ‘top trend’ the advertising campaign targets early
trend propagators, and thereafter targets late propagators. The 24-hour targeting window
means that our approach includes as early trend propagators both users posting about the
trend before Twitter listed it as a top trend, and thus contributed to its origination, and
users propagating the trend immediately when it emerged. This behavior contrasts with
people tweeting about the topic on a following day. Therefore, the key variation in our data
is how early people started talking about this new (and popular) topic on Twitter.
After determining targeting criteria and message, an advertiser bids on impressions to
individual Twitter users by submitting a maximum price per engagement. In both studies
this maximum bid was £1.00. The auction mechanism used to allocate ad impressions
resembles a second-price auction where the bidder pays an amount similar to the second
highest price bid at the auction for that particular impression. The promoted tweet is then
displayed just once at or near the top of the user’s timeline.13
12Only users that access the Twitter website and not accounts that exclusively post through the TwitterAPI, such as spam accounts, are eligible targets for advertising through promoted tweets.
13https://business.twitter.com/help/what-are-promoted-tweets?lang=en&location=emea
14

4 Field Test 1: Charity
4.1 Campaign Setup
The field test was designed and implemented in December 2013 in cooperation with a large
UK charity. The aim was to attract publicity for their annual Christmas Appeal to help the
homeless. The test we report here was part of a larger experiment that also used a number
of message variations which are not the focus of our study (see Web Appendix for details).
For 19 days at the start of December 2013 at 8am, a person in London examined the
top trends on the website of Twitter UK.14 In selecting the new trend to be targeted on any
specific day, an exogenously determined procedure was implemented: On the first day, the
charity targeted the first trend independently of whether or not it was organic or sponsored.
On the second day, the charity targeted the first trend if that was organic but the second
trend if the first trend was sponsored. The third day followed the pattern of day one and
the fourth day the pattern of day two, and so on. We use this quasi-randomization between
targeting organic and sponsored trends to ensure we have a sufficient number of both types
of trends since this will later help shed light on the behavioral mechanism. The charity then
targeted advertising messages to individuals who had posted on these trends, the day the
trend emerged and for three subsequent days (Table 3). Additional data from topsy.com, a
website that tracks Twitter data and makes it searchable, documents that on average there
were close to 5600 postings containing a trend targeted by the charity within one hour and
more than 100,000 on-topic postings in the 24 hours before campaign launch.
The trends targeted covered a wide range, from pop culture, to music, to public affairs
(Table 4). This range indicates that organic Twitter trends indeed capture momentary spikes
of interest by a wide variety of users, rather than being exclusively driven by a specific sub-
group of users such as journalists. In addition, they illustrate why trends emerge suddenly.
14The individual was logged into their Twitter account. Due to the slight customization of trends to users,the individual recording the trends in study 2 logged out of their Twitter account.
15

For example, offering blessings upon the death of Nelson Mandela (#RIPNelsonMandela)
could only practically emerge as a trend on the day of his death. Similarly, the announce-
ment about Rebecca Black’s single (#RebeccaBlack) could only become a trend the day
it was announced, and people could only tweet about the Apollo Theatre’s collapsed roof
(#ApolloTheatre) after this incident had occurred.
Each trend was targeted by 16 wording variants for the sponsored tweet that we control
for but do not focus on in this research (see Web Appendix). Each campaign was set up
with a constant daily budget and a maximum bid per engagement of £1.
4.2 Data
To advertisers, Twitter reports daily campaign performance. As Table 5 summarizes, our
data contain a total of 1216 campaign-day observations (19 trends x 16 message variations x
4 days per campaign), with a mean of 414 daily impressions. This leads to a large number of
impressions and a sample size of over 2 million views. This large sample size is in line with
studies that document the need for large samples to precisely measure online advertising
effectiveness(Reiley and Lewis, 2009; Lewis et al., 2011) .
To protect user privacy, Twitter does not disclose details about users exposed to the
promoted messages, their social networks or number of followers. Twitter refers to any
measurable response to a promoted message as an ‘engagement.’ Here, a campaign-day has
on average 3.81 engagements. Engagements can be clicks (mostly on the ad or the charity’s
URL)15 or ‘retweets’.16 A ‘retweet’ occurs when a Twitter user deliberately rebroadcasts
the message to their followers. In our study, most engagements are clicks, with only 0.16
retweets per campaign day. Clicks are important since they signal a user’s interest in the
message and relate to brand awareness even if the message is not immediately disseminated.
15Twitter does not separate out these two types of actions in its reports to advertisers.16Twitter also reports the decision to ‘follow’ an advertiser’s account in order to receive future messages.
This metric is relevant for campaigns promoting a Twitter account rather than a message as was the case inour studies. Our campaigns attracted only 99 follows as a result. There were too few observations to obtainprecise results or to estimate the full complement of main and fixed effects in a regression analysis.
16
Retweets are a subset of behaviors that can result from clicks and generate further im-
pressions for free. Since users may also ’manually retweet’ a message by copying a tweet
and pasting it into their own tweet, which would be counted as a click but not a retweet,
Twitter may potentially underreport retweets. Because advertisers worry about both clicks
and retweets and since the number of retweets is potentially imprecise, the majority of our
analyses focuses on engagement as outcome variable, subsuming both clicks and retweets.
On average, the charity spent £1.64 per campaign-day, that is a cost per engagement of
£0.35 (around 50 cents). This reflects that the charity did not always pay its maximum bid
and a 20% increase in advertising spent granted to charities.
4.3 Model-Free Evidence
Figure 3 presents model-free evidence for our main finding. It reports the success rate of
each campaign, using engagements relative to the number of impressions by number of days
passed since the trend peaked. It shows that engagement is significantly lower when ads are
targeted at users who posted on a trend the day it emerged than on any of the following
days, and increases as days pass. On day 4, the rate is more than twice as high as on day 1.
Figures 4 and 5 show that this pattern holds when splitting the data into clicks and retweets.
Obviously, this analysis does not control for differences across trends or days. For ex-
ample, as Christmas approaches, responsiveness to charitable ads might increase. Likewise,
the model-free analysis equally weighs each campaign and day and so does not account for
different numbers of impressions across campaigns. We next use an econometric framework
to capture the effectiveness of promoted tweets when targeting early trend propagators.
4.4 Main Results
Our analysis exploits the fact that we have campaign-day level data of consumer responses
to a campaign targeted at a particular trend over multiple days. The analysis measures the
relative uplift of the campaign on subsequent days relative to the first day. Note that without
17
advertising there would likely have been no clicks or retweets, since the account used for the
experiment had few followers and little history of advertising or promotions.
The standardized design of the field test makes our empirical analysis relatively straight-
forward. Since our data is at the campaign-day level, we build our main empirical specifica-
tion at the individual level and then use aggregated estimation techniques to reflect the fact
that we only have campaign-day level data.
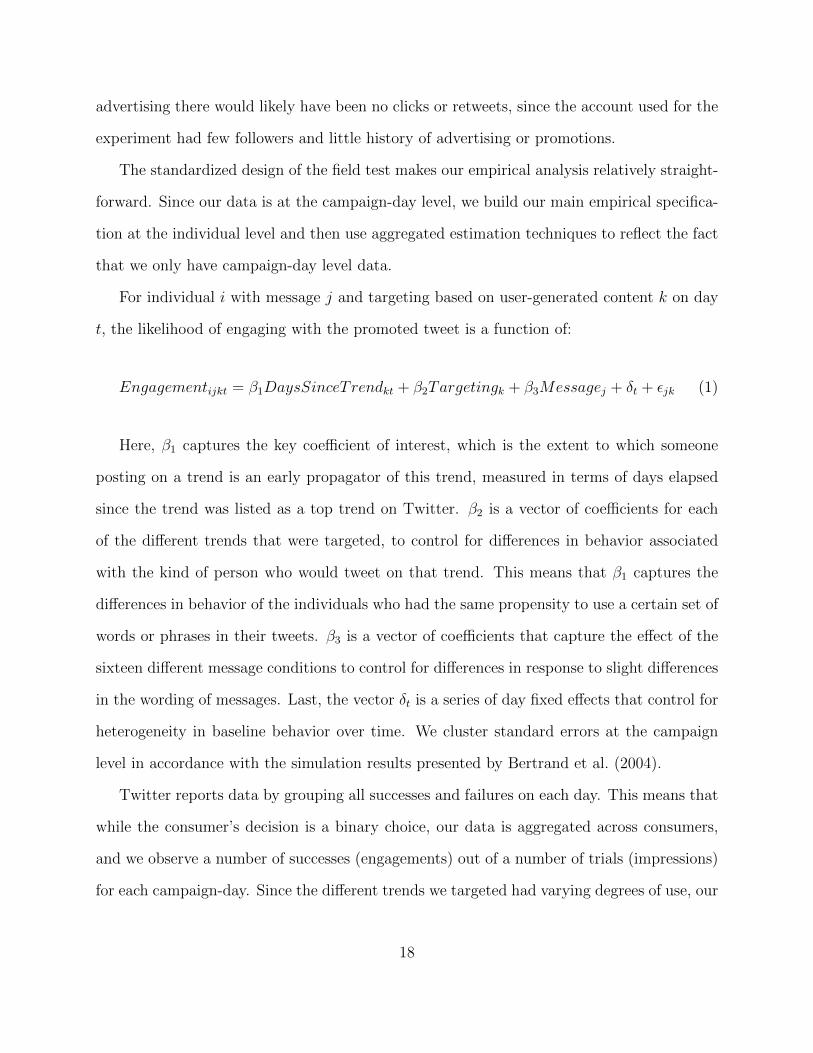
For individual i with message j and targeting based on user-generated content k on day
t, the likelihood of engaging with the promoted tweet is a function of:
Engagementijkt = β1DaysSinceTrendkt + β2Targetingk + β3Messagej + δt + εjk (1)
Here, β1 captures the key coefficient of interest, which is the extent to which someone
posting on a trend is an early propagator of this trend, measured in terms of days elapsed
since the trend was listed as a top trend on Twitter. β2 is a vector of coefficients for each
of the different trends that were targeted, to control for differences in behavior associated
with the kind of person who would tweet on that trend. This means that β1 captures the
differences in behavior of the individuals who had the same propensity to use a certain set of
words or phrases in their tweets. β3 is a vector of coefficients that capture the effect of the
sixteen different message conditions to control for differences in response to slight differences
in the wording of messages. Last, the vector δt is a series of day fixed effects that control for
heterogeneity in baseline behavior over time. We cluster standard errors at the campaign
level in accordance with the simulation results presented by Bertrand et al. (2004).
Twitter reports data by grouping all successes and failures on each day. This means that
while the consumer’s decision is a binary choice, our data is aggregated across consumers,
and we observe a number of successes (engagements) out of a number of trials (impressions)
for each campaign-day. Since the different trends we targeted had varying degrees of use, our
18
campaigns had different numbers of impressions. For example, there was one impression for
a campaign targeting #AirportCommission on days 1-3 but 3334 impressions for a campaign
targeting #Spoty on day three. Unlike other research using field tests for online advertising,
where in a straightforward ordinary least squares approach the click-through rate is the
dependent variable, we need to account for such differences in daily impressions. To see
why this is important, imagine two campaigns, one which received 100 impressions and the
other which received 10,000 impressions, where both received zero clicks. Simply using the
click-through rate as a dependent variable would effectively treat these instances as the same,
though they convey very different information. As a result, we estimate an aggregate logit
model using maximum likelihood (Flath and Leonard, 1979).
Note that aggregate discrete choice models need to account for both heterogeneity and en-
dogeneity (Chintagunta, 2001). Here, fixed effects account for heterogeneity across different
campaigns and days. We tackle the question of endogeneity by focusing on variation which
occurs within the set of individuals who embrace the same trend - we study the variation in
timing of when the Twitter user started posting about a particular trend.
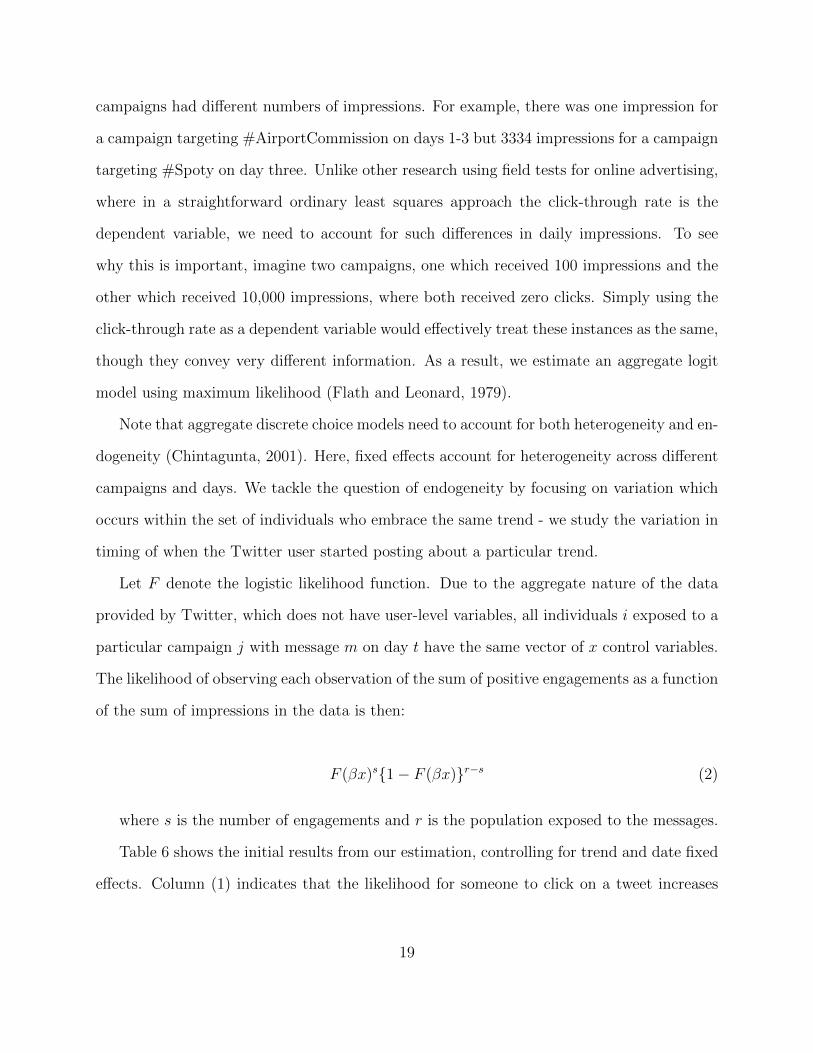
Let F denote the logistic likelihood function. Due to the aggregate nature of the data
provided by Twitter, which does not have user-level variables, all individuals i exposed to a
particular campaign j with message m on day t have the same vector of x control variables.
The likelihood of observing each observation of the sum of positive engagements as a function
of the sum of impressions in the data is then:
F (βx)s{1− F (βx)}r−s (2)
where s is the number of engagements and r is the population exposed to the messages.
Table 6 shows the initial results from our estimation, controlling for trend and date fixed
effects. Column (1) indicates that the likelihood for someone to click on a tweet increases
19

the more time has elapsed since the trend emerged. Put differently, early trend propagators,
that is users that are targeted on the day a trend emerges, are least inclined to engage with
a promoted tweet, and users that are targeted three days after a trend emerges are most
likely to engage with the promoted message. The effect holds when controlling for message
fixed effects in Column (2). Column (3) confirms the robustness of the effect when the
effectiveness of advertising varies by days passed since the trend emerged. This more flexible
specification means we do not force a linear time trend on responsiveness. Instead, we take
the behavior on day 4, the final day of the campaign and the day furthest from the trend
emerging, as a baseline. Therefore all estimates are relative to the slowest trend propagators
in our data. Since this specification echoes the non-linear increase in responsiveness over
time of Figure 3, we subsequently emphasize this more flexible functional form.
In sum, our empirical specification shows that early trend propagators are less likely to
respond to promoted messages than later propagators.
4.5 Robustness
We conduct a battery of robustness checks to make sure our results hold across different
controls, functional forms, samples and dependent variables. One first concern is that,
despite the use of the aggregate-logit model, our results could be driven by outliers because
on some days, campaigns had very few impressions. We re-estimate our model focusing only
on campaigns for which Twitter initially categorized the trend as having an above-average
number of tweets. Our findings are robust (Column (4), Table 6). Second, in Column (5)
we confirm that the results hold for an audience that conversed on a trend related to that
of the promoted tweet (#gooddeeds, #foodbankdebate). As these were spread out, we are
unable to identify day fixed effects and instead use week fixed effects. Still, the results hold.
Third, our results could reflect a competitive effect. If early trend propagators are more
attractive to advertisers and receive more sponsored ads, then our focal ads may be less
20
obvious or attract less attention. To investigate whether this drives our results, we control for
the average amount the charity spent per engagement. If competition is driving our results,
the charity would pay more on highly competitive days of a campaign due to the nature of
the auction for keywords and an increased spend would act as a proxy for competition for
that keyword. As Column (6) of Table 6 illustrates, our results hold.
Fourth, we check robustness to other functional forms to model the aggregate click and
impression data. The results are similar with maximum likelihood grouped estimation with
a probit functional form (Column (7)). As discussed by Flath and Leonard (1979), one
can estimate a logit on aggregate data using maximum likelihood or weighted least squares.
Though their evidence tends to favor the maximum likelihood approach we focus on, we
checked robustness to weighted least squares. Again, the results are similar (Column (8)).
Our results in Table 6 focus on engagement as independent variable, the key outcome
variable for Twitter since it determines how much an advertiser is charged for a promoted
tweet. Table 7 displays the results separately for clicks and retweets for both the linear
and non-parametric specification of the key explanatory variable. The results hold when the
dependent variable captures only clicks (Columns (1) and (3)). In line with our previous
results, early trend propagators appear to have less interest in exploring and pursuing it
than later trend propagators. Additionally, early trend propagators are less likely than later
propagators to retweet a promoted message to their social network (Columns (2) and (4)).
21
To provide some evidence for the possible behavioral mechanism, we compare the behav-
ior of users who embraced organic trends and those who embraced sponsored trends. This
comparison is possible because of the quasi-randomized algorithm that the charity used in
deciding whether to target a sponsored or organic trend. While early propagators of spon-
sored trends, similarly to early propagators of organic trends, post on topics the day these
topics are listed as trends, sponsored trends are typically not newsworthy items and their
listing does not relate to their popularity. The fact that these users engage with content that
is unlikely to yield status rewards, suggests that early propagators of sponsored trends are
less focused on self-presentation and a distinct group of individuals from early propagators
of organic trends. As a result, we do not expect to find a negative response to advertising
messages among early propagators of sponsored trends. Rather, the fact that they have
already shown an interest in advertising by propagating a sponsored trend, suggests that
they may be more open to commercial messages.
In Table 8, Column (1) reports the results for sponsored trends and Column (2) for
organic trends.17 A comparison across the two columns indicates that early propagators of
organic trends indeed respond negatively to promoted messages. By contrast, Twitter users
who embraced firm-sponsored trends early on do not show this pattern. The result confirms
that our effect is related to individual-level characteristics of early propagators of organic
trends and not a mechanical reflection of the way that Twitter uses advertising. It suggests
that there is a key distinction between Twitter users who engage with firm-sponsored trends
or messages, and those who use Twitter to embrace organic trends.
Overall, Study 1 demonstrates that early trend propagators are less likely to engage with
promoted tweets than individuals who post on the same trend later. However, a number of
potential concerns remain. First, it is possible that the results are specific to the charitable
17We stratify rather than add an interaction term, due to the difficulty of interpreting interaction termsin non-linear models (Ai and Norton, 2003).
22

context. For example, if early trend propagators care particularly about themselves rather
than about others, this may explain their low response to messages about helping the home-
less. An additional concern is that early trend propagators might not have engaged with the
message mainly because the charity and the topic of homelessness did not feel relevant to
them. While it is encouraging to see that our results hold for the subset of trends related
to charitable actions, it would be reassuring to find that our results continue to hold for an
advertiser that targets trends more closely related to their own product offering. To alleviate
these concerns, we conduct a second field test in cooperation with a commercial brand.
5 Field Test 2: Fashion Firm
We aim to replicate our results for a non-charitable enterprise where the advertised product
category is more closely related to the targeted trend. Many trends on Twitter are related
to pop culture, TV and music. Leading consumer goods brands focus on such topics in their
Twitter campaigns. For example, PepsiCo partnered with Beyonce for a Twitter campaign.
Fashion brands seem to have similar aims, so in our second field study, we partner with a
relatively new, up and coming UK fashion label.
5.1 Campaign Setup
The field test was carried out in the US over 26 days in June and July 2014 jointly with
a small UK-based fashion label unknown in the US, but which delivers internationally and
thus could sell products to US consumers. The aim of the Twitter advertising campaign was
to attract attention to the fashion label’s website.
The set up was similar to that in field test 1, with the exception that we target not only
the first but all ten trends listed (see Table 3). Over a period of 20 days, we identify every
day at 9 am Eastern Summer Time the ten trends listed on Twitter. The fashion firm then
targets advertising to consumers posting on any of these trends for seven successive days.
As before, trends vary considerably from day to day. Out of a total of 200 trends, only
23
nine appeared more than once.18 Three independent raters blind to the study’s hypothesis
classified all trends into whether they related to pop culture (including TV or music, such as
BET Awards, The Walking Dead, #FinallyA5sosAlbum), meaning that the ad by the fashion
firm was more likely to be broadly related to these topics, or not (including trends about sport
events, politics or weather events such as #BrazilvsGermany, Gaza, #HurricaneArthur).
Our data include 77 related and 123 unrelated trends.
We additionally identify and target sponsored trends. Since trends displayed on Twitter
can vary very slightly depending on the individual logged in, we logged out of Twitter to
collect sponsored trends. As a result, no sponsored trends were displayed. To identify
sponsored trends, we separately logged into a US Twitter account. Sponsored trends are not
displayed to an individual user every day - presumably to not ‘spam’ them with advertising.
During the time period of our data there were nine sponsored trends.
We also target, over the entire period of the experiment, advertising messages to Twitter
users who use the hashtag or keyword ’#shopping’ or ’shopping’ in their post. This gives us
a baseline of Twitter usage to allow us to control for time trends that relate to the intensity
of Twitter usage by users who are broadly interested in the category.
If indeed early trend propagators respond more negatively because they are extrinsically
motivated and have less reason to respond to content that does not further their goal of self-
presentation, then a message that is framed as more unique may more successfully engage
them. This is because a more unique message would be more likely to attract the interest
of others and so to enhance the user’s self-presentation. Similarly, a message that is framed
as less commercial would be more likely to signal greater sub-cultural capital. To test for
this, we used two different advertising messages, phrased within the limits of what the
firm considered appropriate. The first message is designed to convey the image of a more
unique brand (’Discover an original Brixton-based fashion brand: [brand name] - where
18These were across a range of topics (e.g.,#GOT7COMEBACK, 4th of July, Israel, Starbucks).
24
crazy is the new normal [URL]’). The second message is designed to convey the image of a
more commercial firm (’Discover a new global fashion brand: [brand name] - where crazy
is the new normal [URL]’). We tested these messages with a sample of 196 US participants
at Amazon’s Mechanical Turk and find that the ’Brixton’-message indeed ranks higher on
being unique (3.22 vs. 2.71, p<0.001) and is perceived as less commercial (3.02 vs. 3.63,
p<0.001) (see Web Appendix for details). We likewise tested whether participants felt the
message captured their attention or was surprising and found neither of these variables to
be significantly different.
In sum, we target users posting on a total of 200 organic trends (10 trends identified on
each of 20 days), 9 sponsored trends and ’shopping’, each with two different messages. This
makes for a total of 420 campaigns. All trend-based campaigns run over 7 days whereas the
campaigns targeting ’shopping’ run continuously throughout the 26 days of the field study.
All campaigns had the same daily budget. The maximum bid per engagement was £1.
Table 9 summarizes basic descriptives. The campaigns had an average of 935.35 impressions
and 8.40 engagements per day, the great majority of which were clicks. The firm did not
always pay its maximum bid and the average cost per engagement was GBP 0.92.
5.2 Model-Free Evidence
Figure 6 presents initial model-free evidence for our main finding, focusing on data from
campaigns targeted towards users who posted on a top ten trend. It reports the success
rate of each campaign, as measured by the number of engagements relative to the number of
impressions, by how many days have passed since the trend peaked on Twitter. It illustrates
that the engagement rate consistently increases over the first four days of a campaign, in
line with our results from field test 1, after which it levels off. This pattern is similar when
splitting up the data by clicks and retweets in Figures 7 and 8.
25

5.3 Main Results
Columns (1) to (3) of Table 10 focus on data for users who posted on one of the top ten
trends on any day in our data. Column (1) shows that users are more likely to engage with
a tweet as days elapse since the trend emerged. Column (2) confirms that the results hold
when controlling for a message fixed effect and spend per engagement. In Column (3) we
instead allow the effectiveness of advertising to vary by days elapsed, using engagement on
the day the trend emerged as a baseline, and find advertising effectiveness increases, though
the pattern does not fully reflect the monotonic trend as in field test 1.
5.4 Robustness
Columns (1) to (3) use as a baseline, engagement on the last day of a campaign. In Column
(4) we use as an alternative baseline the engagement of campaigns that target ’shopping’
on any day in our data. As explained earlier, the idea of this baseline is that by targeting
campaigns towards people whose tweet contains the phrase ’shopping’ we can control for
changes over time in posting behavior which may provide an alternative explanation. The
results hold. They indicate that early trend propagators are less responsive to firm-sponsored
messages than individuals who post on generic topics, such as ‘shopping,’ while individuals
who embrace trends later on respond similarly to individuals who post on generic topics.
Column (5) reports the results for sponsored trends only. Similar to field test 1, we do not
find an increase in engagement over time as we target users who post on sponsored trends.
One concern is that some other difference between sponsored and organic trends, such as
whether it is easy to foresee they would arise or whether they are more easily understood
out of context, is driving the effect. To ensure that this is not the case, we had all trends
rated by ease of comprehension or the degree to which such a trend was easy to foresee. We
stratify the results across these variables and find that the results hold.
Next, to rule out that the results are an artifact of variation in the number of postings
26

on a trend over time, we use data we collected on a daily level on the size of each trend
on Twitter as measured by the number of postings within the past 24 hours on topsy.com.
Column (1) in Table 11 illustrates that the results are robust to the inclusion of this variable.
Similarly, the results might be specific to the position in which the trend was displayed
on Twitter. Columns (2) and (3) in Table 11 show that the results continue to hold if we
separately look at trends that were in positions 1 to 5 on the day they emerged, versus in
positions 6 to 10. Importantly, the pattern is more pronounced for the top trends and the
first four days, which closely reflects our findings of field test 1.
As before, we check whether the results are robust to separating out clicks and retweets
in the dependent variable. Table 12 shows that the main pattern holds: Clicks and retweets
are lowest on the day a trend emerged, relative to later days.
5.5 Mechanism
We analyze the variation in message content and trend category, which are the two di-
mensions in the design of the field test that may shed light on the behavioral mechanism.
We stratify the data by whether the message referred to a more unique/less commercial
brand (’original Brixton-based’) or a less unique/more commercial firm (’new global’) and
by whether the trend is more or less relevant to consumers interested in fashion.
A comparison of Columns (1)-(4) in Table 13 suggests that independently, neither the
phrasing of the advertising message as more or less unique nor the closeness of the trend to
fashion influence the effect considerably, as the effect holds across all stratifications.
We then investigate how early trend propagators only respond to firm-sponsored content
if the message is both more unique/less commercial and advertises a product category that is
closely related to the targeted trend and thus more relevant to them. We focus on trends that
are broadly related to fashion and stratify the data by message type. Column (5) indicates
that the previous results do not hold when a message that refers to an ’original Brixton-based’
27
fashion brand is targeted to users who posted on related trends. Instead, in this instance
targeting early trend propagators is similarly effective as targeting users on the two days after
the trend emerged, and more effective than targeting users who post at even a later point
in time. By contrast, Column (6) demonstrates that when the advertising message refers to
a ’new global’ fashion brand, the previously established pattern still holds: Targeting early
trend propagators is least effective. The fact that the variation in the advertising message
leads to a different response by early trend propagators also suggests that inattention is an
unlikely explanation of the effect we observe: If early trend propagators simply never read
promoted tweets, then changing the phrasing should not affect their response.
To sum up, the results of field test 2 suggest that while advertising to early trend propa-
gators is mostly not effective, it can - under a very restrictive set of conditions - be similarly
effective as advertising to users who post on a trend later on: First, the product category
advertised must be related to the trend the targeted users are posting on, and so be of
likely interest to early trend propagators. Second, the advertising message should be more
unique and less commercial to be of likely interest to others, and so to enhance a a user’s
self-presentation and signal greater sub-cultural capital. This is in line with our theory that
early trend propagators differ in that they have a control orientation and so are extrinsically
motivated and seek status rewards from their Twitter activities. Only messages that are
both relevant and unique help them build the sub-cultural social capital required to receive
acclaim from their followers.
The results of field test 2 confirm the empirical findings from field test 1 along several
dimensions. Field test 2 demonstrates that the results hold outside the charitable context,
for different types of advertising messages, and even for related trends – unless the trends
are related and the advertising message is more unique and less commercial. Likewise, the
results hold both in the UK and in the US.
We see our findings as providing additional suggestive evidence for a behavioral mecha-
28
nism. Our initial survey suggests that early trend propagators are different in latent charac-
teristics from those who post on trends later and the very robust behavior we find across two
field studies is consistent with our theory. Together, this evidence suggests that indeed the
mechanism is specific to the group of users who propagate organic trends early on, relative to
all others. However, we acknowledge that we cannot conclusively rule out that the difference
in responsiveness instead comes from posting on a trend early rather than later.
6 Conclusion
Online marketing, and micro-blogging services such as Twitter, have made it possible to tar-
get a large number of individual consumers in a timely manner based on their self-expressed
interest in a topic. Reaching out to early trend propagators is becoming an increasingly pop-
ular marketing practice as marketing managers hope they will help spread the word about
their products or brands. While interest-based social media platforms like Twitter open
up the possibility to target individuals who propagate trends early on with advertising mes-
sages, it is unclear whether doing so is effective. Using data from two field tests conducted on
Twitter with a charity and a fashion label, we examine the effectiveness of promoted tweets,
that is advertising messages sent to Twitter users, in engaging early trend propagators.
In our field tests, we identify each day the trending topics and target advertising to
individuals who post on these trends that day and the following days. Consistently across
both field tests, we find that early trend propagators (i.e., Twitter users who post on the
trend the day it emerged) are significantly less likely to respond positively to the ad than
users who post on the trend during the following days. Several robustness checks, including
controlling for the amount spent per engagement, the size of a campaign, the size of a trend
and whether a trend was among the top five trends, show that our results hold.
We draw on self-determination theory (Deci and Ryan, 1980; Ryan and Deci, 2000)
to explain why early trend propagators are not very responsive to advertising messages.
29
We suggest that early trend propagators, as opposed to later propagators, have a control
orientation and so are motivated extrinsically through status rewards they get from their
posts being valued by their followers. They are therefore concerned with self-presentation,
and use hashtagged trending discussions to present themselves to the Twitter publics as
users who are knowledgable about the latest trends. Because of the rapid pace of Twitter,
being on top of latest trends is one way to signal sub-cultural capital. Since early trend
propagators use Twitter to feel that their posts receive are useful and receive acclaim from
their followers, they will engage with content and propagate content that serves this purpose.
As such, they have little motivation to engage with messages by advertisers.
Our two field tests provide support that this is indeed the case. First, throughout both
field tests, we do not find a negative effect of targeting individuals who post on commercially
sponsored trends and who consequently seem generally open to firm-sponsored messages.
Second, our second study illustrates that early trend propagators are similarly responsive
to advertising messages as others if the advertising message is considered as more unique
and as less commercial, that is a type of content that is more likely to further their goal of
self-presentation. Importantly, early trend propagators are still less responsive to advertising
if only one of these conditions is met.
Our results have important implications for firms. First, many guidelines for sparking
contagion speak of the advantages of encouraging early trend propagators to spread word of
mouth, but our results suggest that this might be difficult to achieve via advertising. Second,
our results suggest that early trend propagators who are willing to adopt a commercial trend
respond differently to advertising than early propagators of organic trends. Engaging the
former group through advertising is likely to be more successful, but may be less attractive for
a firm simply because these individuals are less likely to be seen by their peers as spreaders of
organic trends. Third, our results have implications for the future of advertising on micro-
blogging sites. It is tempting to think that what makes sites such as Twitter distinctive
30
from alternative advertising platforms is the fact that they originate trends and relay timely
information, but our results suggest that these features are likely to distinguish them as
useful advertising platforms only under a limited set of conditions.
There are limitations to our research. First, our empirical focus is on the micro-blogging
site Twitter. While Twitter is an increasingly important medium and an attractive plat-
form for us to study because of its increasing importance in the identification of trends, we
recognize that it allows a very specific kind of ad format and that the results may not fully
generalize to other formats. Second, we use data from two empirical tests conducted by a
charity in the UK and by a fashion firm in the US. This gives us confidence that our results
hold across product categories. However, it is still possible that there are yet undiscovered
ways by which targeting early trend propagators may be successful in other product domains.
Third, while our data provide evidence leading us to suggest the difference in motivation for
Twitter use as a behavioral mechanism, we are unable to directly measure and test for this
effect. Notwithstanding these limitations, we believe that our results offer a first insight into
the challenges that firms may face when trying to use online behavior to identify early trend
propagators to target advertising messages.
References
Ai, C. and E. C. Norton (2003, July). Interaction terms in logit and probit models. EconomicsLetters 80 (1), 123–129.
Antonakaki, D., I. Polakis, E. Athanasopoulos, S. Ioannidis, and P. Fragopoulou (2015). Thinkbefore rt: An experimental study of abusing Twitter trends. In L. M. Aiello and D. McFarland(Eds.), Social Informatics, Volume 8852 of Lecture Notes in Computer Science, pp. 402–413.Springer International Publishing.
Arvidsson, A. and A. Caliandro (2015). Brand public. Journal of Consumer Research, forthcoming.
Asur, S. and B. A. Huberman (2010). Predicting the future with social media. In Web Intelligenceand Intelligent Agent Technology (WI-IAT), 2010 IEEE/WIC/ACM International Conferenceon, Volume 1, pp. 492–499. IEEE.
Athey, S. and G. Ellison (2011). Position auctions with consumer search. The Quarterly Journalof Economics 126 (3), 1213–1270.
31
Bakshy, E., J. M. Hofman, W. A. Mason, and D. J. Watts (2011). Everyone’s an influencer:Quantifying influence on Twitter. In Proceedings of the fourth ACM international conference onWeb search and data mining, WSDM ’11, New York, NY, USA, pp. 65–74. ACM.
Berger, J. (2014). Word of mouth and interpersonal communication: A review and directions forfuture research. Journal of Consumer Psychology 24 (4), 586–607.
Bertrand, M., E. Duflo, and S. Mullainathan (2004). How much should we trust differences-in-differences estimates? The Quarterly Journal of Economics 119 (1), 249–275.
Bollen, J., H. Mao, and X. Zeng (2011). Twitter mood predicts the stock market. Journal ofComputational Science 2 (1), 1–8.
Cha, M., H. Haddadi, F. Benevenuto, and P. K. Gummadi (2010). Measuring user influence inTwitter: The million follower fallacy. In W. W. Cohen and S. Gosling (Eds.), ICWSM. TheAAAI Press.
Chen, G. H., S. Nikolov, and D. Shah (2013). A latent source model for nonparametric time seriesclassification. In Advances in Neural Information Processing Systems, pp. 1088–1096.
Chen, Y., Q. Wang, and J. Xie (2011). Online social interactions: A natural experiment on wordof mouth versus observational learning. Journal of Marketing Research 48 (2), 238–254.
Chintagunta, P. K. (2001, December). Endogeneity and heterogeneity in a probit demand model:Estimation using aggregate data. Marketing Science 20 (4), 442–456.
Deci, E. L. and R. M. Ryan (1980). The empirical exploration of intrinsic motivational processes.Advances in experimental social psychology 13 (2), 39–80.
Deci, E. L. and R. M. Ryan (1985). The general causality orientations scale: Self-determination inpersonality. Journal of research in personality 19 (2), 109–134.
Du, R. Y. and W. A. Kamakura (2012). Quantitative trendspotting. Journal of Marketing Re-search 49 (4), 514–536.
Falkinger, J. (2008). Limited attention as a scarce resource in information-rich economies*. TheEconomic Journal 118 (532), 1596–1620.
Flath, D. and E. W. Leonard (1979). A comparison of two logit models in the analysis of qualitativemarketing data. Journal of Marketing Research 16 (4), pp. 533–538.
Ghose, A. and S. Yang (2009). An empirical analysis of search engine advertising: Sponsored searchin electronic markets. Management Science 55 (10), 1605–1622.
Goel, S., J. M. Hofman, S. Lahaie, D. M. Pennock, and D. J. Watts (2010). Predicting consumerbehavior with web search. Proceedings of the National Academy of Sciences 107 (41), 17486–17490.
Goldfarb, A. and C. Tucker (2011a, May). Online display advertising: Targeting and obtrusiveness.Marketing Science 30, 389–404.
32
Goldfarb, A. and C. Tucker (2011b). Search engine advertising: Channel substitution when pricingads to context. Management Science 57 (3), 458–470.
Goldsmith, R. E. and C. F. Hofacker (1991). Measuring consumer innovativeness. Journal of theAcademy of Marketing Science 19 (3), 209–221.
Gong, S., J. Zhang, P. Zhao, and X. Jiang (2015). Tweets and sales. Available at SSRN 2461370 .
Higgins, E. T. (1992). Achieving ’shared reality’ in the communication game: Social action thatcreates meaning. Journal of Language and Social Psychology 11, 11–31.
Hinz, O., B. Skiera, C. Barrot, and J. U. Becker (2011). Seeding strategies for viral marketing: anempirical comparison. Journal of Marketing 75 (6), 55–71.
Kankanhalli, A., B. C. Tan, and K.-K. Wei (2005). Contributing knowledge to electronic knowledgerepositories: an empirical investigation. MIS Quarterly , 113–143.
Katona, Z., P. P. Zubcsek, and M. Sarvary (2011). Network effects and personal influences: Thediffusion of an online social network. Journal of Marketing Research 48 (3), 425–443.
Kempe, D., J. Kleinberg, and E. Tardos (2003). Maximizing the spread of influence through a socialnetwork. In Proceedings of the ninth ACM SIGKDD international conference on Knowledgediscovery and data mining, pp. 137–146. ACM.
Kong, S., Q. Mei, L. Feng, and Z. Zhao (2014). Real-time predicting bursting hashtags on twitter.In Web-Age Information Management, pp. 268–271. Springer.
Krauss, R. M. and S. R. Fussell (1991). Perspective-taking in communication: Representations ofothers’ knowledge in reference. Social Cogniition 9, 2–24.
Lambrecht, A. and C. Tucker (2013). When does retargeting work? Information specificity inonline advertising. Journal of Marketing Research 50 (5), 561–576.
Lewis, R. A., J. Rao, and D. Reiley (2011). Here, there, everywhere: Correlated online behaviors canlead to overestimates of the effects of advertising. In International World Wide Web Conference.
Mahajan, V., E. Muller, and F. M. Bass (1990). New product diffusion models in marketing: Areview and directions for research. The Journal of Marketing , 1–26.
Manchanda, P., J.-P. Dube, K. Y. Goh, and P. K. Chintagunta (2006). The effect of banneradvertising on internet purchasing. Journal of Marketing Research 43 (1), 98 – 108.
Mathwick, C. and E. Rigdon (2004). Play, flow, and the online search experience. Journal ofconsumer research 31 (2), 324–332.
Reiley, D. and R. Lewis (2009). Retail advertising works! Measuring the effects of advertising onsales via a controlled experiment on Yahoo!”. Working Paper, Yahoo! Research.
Rogers, E. (1962). Diffusion of innovations. New York,: Free Press.
33
Rutz, O. J. and R. E. Bucklin (2011). From Generic to Branded: A Model of Spillover Dynamicsin Paid Search Advertising. Journal of Marketing Research 48 (1), 87–102.
Ryan, R. M. (1982). Control and information in the intrapersonal sphere: An extension of cognitiveevaluation theory. Journal of personality and social psychology 43 (3), 450.
Ryan, R. M. and E. L. Deci (2000). Intrinsic and extrinsic motivations: Classic definitions and newdirections. Contemporary educational psychology 25 (1), 54–67.
Ryan, S. and C. Tucker (2012). Heterogeneity and the dynamics of technology adoption. Quanti-tative Marketing and Economics 10 (1).
Sahni, N. (2011). Effect of temporal spacing between advertising exposures: Evidence from anonline field experiment. Mimeo, Stanford .
Stephen, A. T. and O. Toubia (2010). Deriving Value from Social Commerce Networks. Journal ofMarketing Research 47 (2), 215–228.
Stephen, A. T. and O. Toubia (2013). Intrinsic vs. image-related utility in social media: Why dopeople contribute content to Twitter? Marketing Science 32 (3), 368–392.
Stonedahl, F., W. Rand, and U. Wilensky (2010). Evolving viral marketing strategies. In Pro-ceedings of the 12th annual conference on Genetic and evolutionary computation, pp. 1195–1202.ACM.
Toubia, O., A. T. Stephen, and A. Freud (2009). Viral Marketing: A Large-Scale Field Experiment.Mimeo, INSEAD .
Vaynerchuck, G. (2013). How to master the 4 big social-media platforms. Inc. Magazine.
Watts, D. J. and P. S. Dodds (2007). Influentials, networks, and public opinion formation. Journalof Consumer Research 34, 441–458.
Weng, J., E.-P. Lim, J. Jiang, and Q. He (2010). Twitterrank: finding topic-sensitive influentialtwitterers. In Proceedings of the third ACM international conference on Web search and datamining, pp. 261–270. ACM.
Yoganarasimhan, H. (2012). Impact of social network structure on content propagation: A studyusing YouTube data. Quantitative Marketing and Economics 10 (1), 111–150.
34
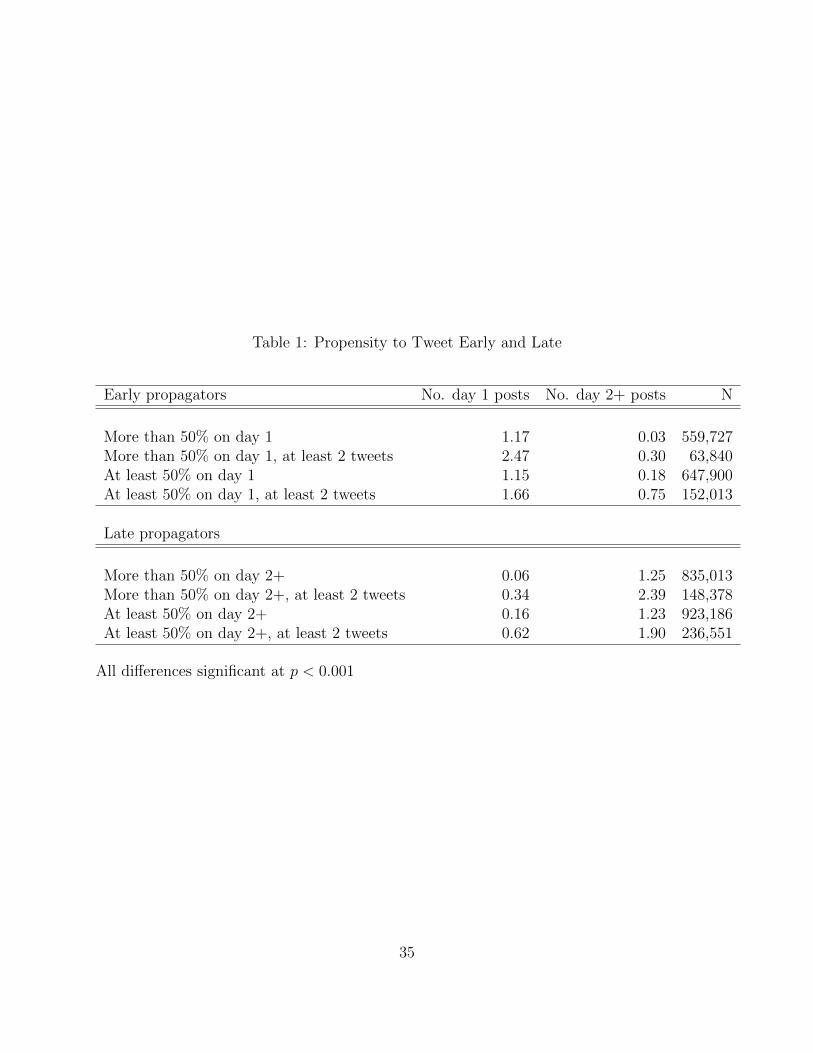
Table 1: Propensity to Tweet Early and Late
Early propagators No. day 1 posts No. day 2+ posts N
More than 50% on day 1 1.17 0.03 559,727More than 50% on day 1, at least 2 tweets 2.47 0.30 63,840At least 50% on day 1 1.15 0.18 647,900At least 50% on day 1, at least 2 tweets 1.66 0.75 152,013
Late propagators
More than 50% on day 2+ 0.06 1.25 835,013More than 50% on day 2+, at least 2 tweets 0.34 2.39 148,378At least 50% on day 2+ 0.16 1.23 923,186At least 50% on day 2+, at least 2 tweets 0.62 1.90 236,551
All differences significant at p < 0.001
35
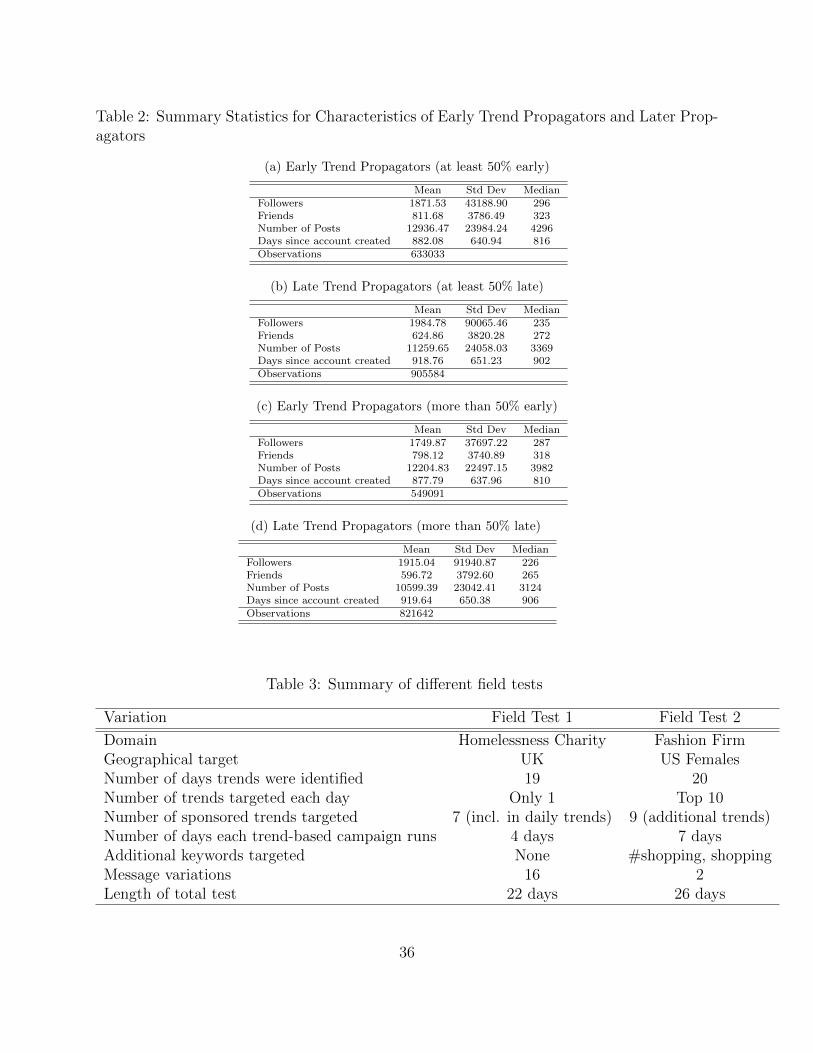
Table 2: Summary Statistics for Characteristics of Early Trend Propagators and Later Prop-agators
(a) Early Trend Propagators (at least 50% early)
Mean Std Dev MedianFollowers 1871.53 43188.90 296Friends 811.68 3786.49 323Number of Posts 12936.47 23984.24 4296Days since account created 882.08 640.94 816Observations 633033
(b) Late Trend Propagators (at least 50% late)
Mean Std Dev MedianFollowers 1984.78 90065.46 235Friends 624.86 3820.28 272Number of Posts 11259.65 24058.03 3369Days since account created 918.76 651.23 902Observations 905584
(c) Early Trend Propagators (more than 50% early)
Mean Std Dev MedianFollowers 1749.87 37697.22 287Friends 798.12 3740.89 318Number of Posts 12204.83 22497.15 3982Days since account created 877.79 637.96 810Observations 549091
(d) Late Trend Propagators (more than 50% late)
Mean Std Dev MedianFollowers 1915.04 91940.87 226Friends 596.72 3792.60 265Number of Posts 10599.39 23042.41 3124Days since account created 919.64 650.38 906Observations 821642
Table 3: Summary of different field tests
Variation Field Test 1 Field Test 2
Domain Homelessness Charity Fashion FirmGeographical target UK US FemalesNumber of days trends were identified 19 20Number of trends targeted each day Only 1 Top 10Number of sponsored trends targeted 7 (incl. in daily trends) 9 (additional trends)Number of days each trend-based campaign runs 4 days 7 daysAdditional keywords targeted None #shopping, shoppingMessage variations 16 2Length of total test 22 days 26 days
36

Table 4: Top Trends on Twitter by Day, Study 1
Day Trend Type
1. #Gooddeeds Sponsored2. #TheTribez Organic3. #WreckTheHalls Sponsored4. #RIPNelsonMandela Organic5. #ProjectUpgrade Sponsored6. #RebeccaBlack Organic7. #MPs Organic8. #RAW Organic9. #Rewind2013 Sponsored10. #PopATrace Organic11. #ExtinctionDay Sponsored12. #Cook Organic13. #ScherzingHair Sponsored14. #Spoty Organic15. #AirportsCommission Organic16. #Foodbankdebate Organic17. #TryYourGearOn Sponsored18. #ApolloTheatre Organic19. #HasJustineLandedYet Organic
Table 5: Summary Statistics per Campaign, Study 1
Mean Std Dev Min MaxDaily impressions 413.66 544.50 0 3850Daily engagements 3.81 4.70 0 26Daily retweets 0.16 0.52 0 6Daily clicks 3.56 4.37 0 26Daily spend 1.64 1.73 0 8Cost per Engagement 0.35 0.18 0 1Observations 1216
37
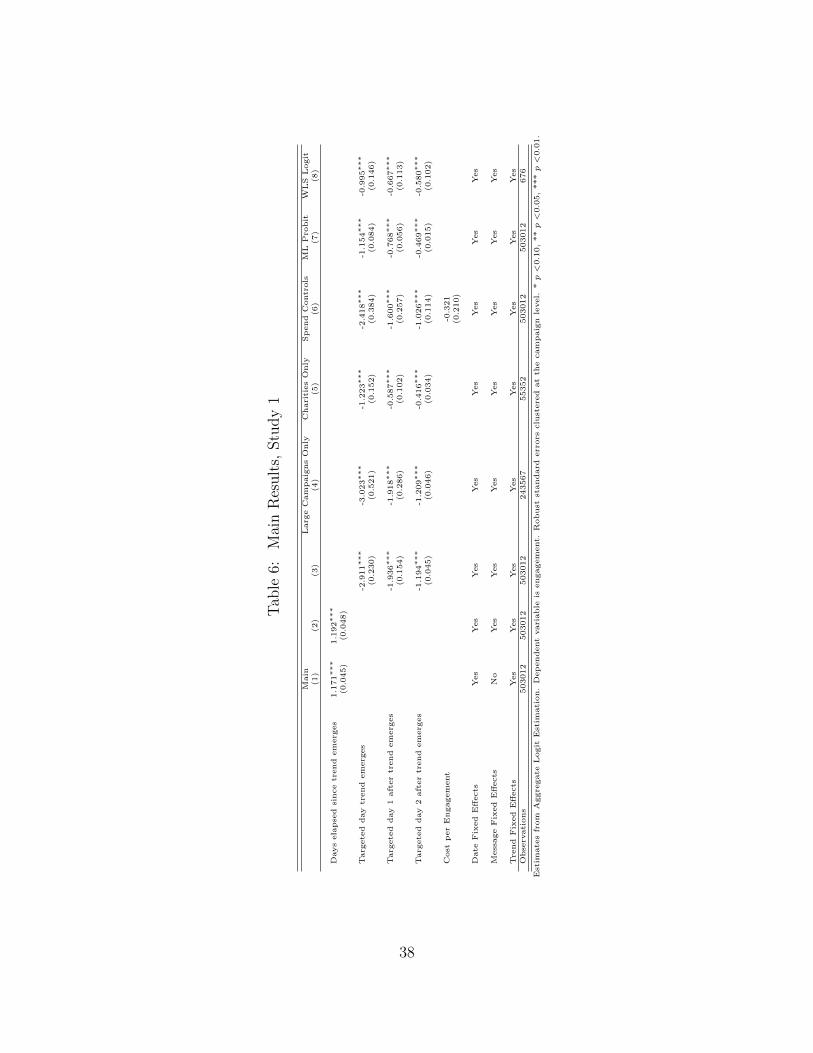
Tab
le6:
Mai
nR
esult
s,Stu
dy
1
Main
Larg
eC
am
paig
ns
Only
Chari
ties
Only
Sp
end
Contr
ols
ML
Pro
bit
WL
SL
ogit
(1)
(2)
(3)
(4)
(5)
(6)
(7)
(8)
Days
ela
pse
dsi
nce
trend
em
erg
es
1.1
71∗∗∗
1.1
92∗∗∗
(0.0
45)
(0.0
48)
Targ
ete
dday
trend
em
erg
es
-2.9
11∗∗∗
-3.0
23∗∗∗
-1.2
23∗∗∗
-2.4
18∗∗∗
-1.1
54∗∗∗
-0.9
95∗∗∗
(0.2
30)
(0.5
21)
(0.1
52)
(0.3
84)
(0.0
84)
(0.1
46)
Targ
ete
dday
1aft
er
trend
em
erg
es
-1.9
36∗∗∗
-1.9
18∗∗∗
-0.5
87∗∗∗
-1.6
00∗∗∗
-0.7
68∗∗∗
-0.6
67∗∗∗
(0.1
54)
(0.2
86)
(0.1
02)
(0.2
57)
(0.0
56)
(0.1
13)
Targ
ete
dday
2aft
er
trend
em
erg
es
-1.1
94∗∗∗
-1.2
09∗∗∗
-0.4
16∗∗∗
-1.0
26∗∗∗
-0.4
69∗∗∗
-0.5
80∗∗∗
(0.0
45)
(0.0
46)
(0.0
34)
(0.1
14)
(0.0
15)
(0.1
02)
Cost
per
Engagem
ent
-0.3
21
(0.2
10)
Date
Fix
ed
Eff
ects
Yes
Yes
Yes
Yes
Yes
Yes
Yes
Yes
Mess
age
Fix
ed
Eff
ects
No
Yes
Yes
Yes
Yes
Yes
Yes
Yes
Tre
nd
Fix
ed
Eff
ects
Yes
Yes
Yes
Yes
Yes
Yes
Yes
Yes
Obse
rvati
ons
503012
503012
503012
243567
55352
503012
503012
676
Est
imate
sfr
om
Aggre
gate
Logit
Est
imati
on.
Dep
endent
vari
able
isengagem
ent.
Robust
standard
err
ors
clu
stere
dat
the
cam
paig
nle
vel.
*p<
0.1
0,
**
p<
0.0
5,
***
p<
0.0
1.
38

Table 7: Alternative Dependent Variables, Study 1
(1) (2) (3) (4)Daily clicks Daily retweets Daily clicks Daily retweets
Days elapsed since trend emerges 1.239∗∗∗ 1.456∗∗∗
(0.033) (0.422)
Targeted day trend emerges -3.133∗∗∗ -4.781∗∗∗
(0.211) (1.428)
Targeted day 1 after trend emerges -2.076∗∗∗ -3.795∗∗∗
(0.143) (1.039)
Targeted day 2 after trend emerges -1.240∗∗∗ -2.143∗∗∗
(0.031) (0.672)
Date Fixed Effects Yes Yes Yes Yes
Message Fixed Effects Yes Yes Yes Yes
Trend Fixed Effects Yes Yes Yes YesObservations 503012 501291 503012 501291
Estimates from aggregate logit estimation. Dependent variable as shown. Robust standard errors clustered at the campaignlevel. * p <0.10, ** p <0.05, *** p <0.01.
Table 8: Exploring Different Explanations, Study 1
(1) (2)Sponsored Trend Non-Sponsored Trend
Targeted day trend emerges 0.224 -2.811∗∗∗
(0.149) (0.221)
Targeted day 1 after trend emerges 1.244∗∗∗ -1.804∗∗∗
(0.130) (0.136)
Targeted day 2 after trend emerges -1.050∗∗∗ -1.196∗∗∗
(0.165) (0.045)
Date Fixed Effects Yes Yes
Message Fixed Effects Yes Yes
Trend Fixed Effects Yes YesObservations 135966 366931
Estimates from aggregate logit estimation. Dependent variable is engagements. Robust standard errors clustered at thecampaign level. * p <0.10, ** p <0.05, *** p <0.01.
Table 9: Summary Statistics per Campaign, Study 2
Mean Std Dev Min MaxDaily impressions 935.35 796.89 0 8481Daily engagements 8.40 6.62 0 66Daily retweets 0.53 0.95 0 8Daily clicks 8.04 6.31 0 64Daily spend 6.59 3.95 0 27Cost per Engagement 0.92 0.33 0 2Observations 2978
39
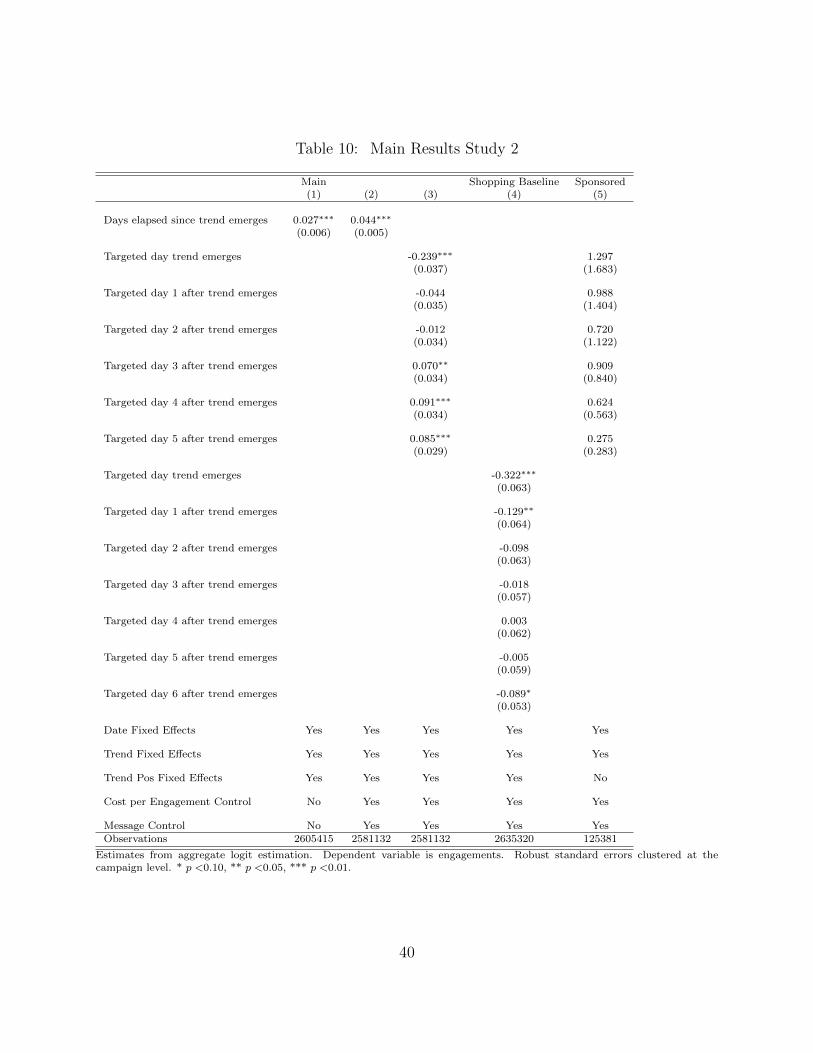
Table 10: Main Results Study 2
Main Shopping Baseline Sponsored(1) (2) (3) (4) (5)
Days elapsed since trend emerges 0.027∗∗∗ 0.044∗∗∗
(0.006) (0.005)
Targeted day trend emerges -0.239∗∗∗ 1.297(0.037) (1.683)
Targeted day 1 after trend emerges -0.044 0.988(0.035) (1.404)
Targeted day 2 after trend emerges -0.012 0.720(0.034) (1.122)
Targeted day 3 after trend emerges 0.070∗∗ 0.909(0.034) (0.840)
Targeted day 4 after trend emerges 0.091∗∗∗ 0.624(0.034) (0.563)
Targeted day 5 after trend emerges 0.085∗∗∗ 0.275(0.029) (0.283)
Targeted day trend emerges -0.322∗∗∗
(0.063)
Targeted day 1 after trend emerges -0.129∗∗
(0.064)
Targeted day 2 after trend emerges -0.098(0.063)
Targeted day 3 after trend emerges -0.018(0.057)
Targeted day 4 after trend emerges 0.003(0.062)
Targeted day 5 after trend emerges -0.005(0.059)
Targeted day 6 after trend emerges -0.089∗
(0.053)
Date Fixed Effects Yes Yes Yes Yes Yes
Trend Fixed Effects Yes Yes Yes Yes Yes
Trend Pos Fixed Effects Yes Yes Yes Yes No
Cost per Engagement Control No Yes Yes Yes Yes
Message Control No Yes Yes Yes YesObservations 2605415 2581132 2581132 2635320 125381
Estimates from aggregate logit estimation. Dependent variable is engagements. Robust standard errors clustered at thecampaign level. * p <0.10, ** p <0.05, *** p <0.01.
40

Table 11: Robustness, Study 2
Control for Trend Size Top Trends Bottom Trends(1) (2) (3)
Targeted day trend emerges -0.239∗∗∗ -0.388∗∗∗ -0.215∗∗∗
(0.039) (0.066) (0.047)
Targeted day 1 after trend emerges -0.044 -0.195∗∗∗ -0.015(0.036) (0.064) (0.041)
Targeted day 2 after trend emerges -0.012 -0.125∗∗ 0.007(0.035) (0.060) (0.041)
Targeted day 3 after trend emerges 0.070∗∗ -0.015 0.081∗∗
(0.034) (0.059) (0.041)
Targeted day 4 after trend emerges 0.091∗∗∗ 0.019 0.101∗∗
(0.034) (0.061) (0.041)
Targeted day 5 after trend emerges 0.085∗∗∗ -0.011 0.114∗∗∗
(0.030) (0.054) (0.033)
Trend size -0.000(0.000)
Date Fixed Effects Yes Yes Yes
Trend Fixed Effects Yes Yes Yes
Trend Pos Fixed Effects Yes Yes Yes
Cost per Engagement Control Yes Yes Yes
Message Control Yes Yes YesObservations 2581132 774464 1806668
Estimates from aggregate logit estimation. Dependent variable is engagements. Robust standard errors clustered at thecampaign level. * p <0.10, ** p <0.05, *** p <0.01.
41
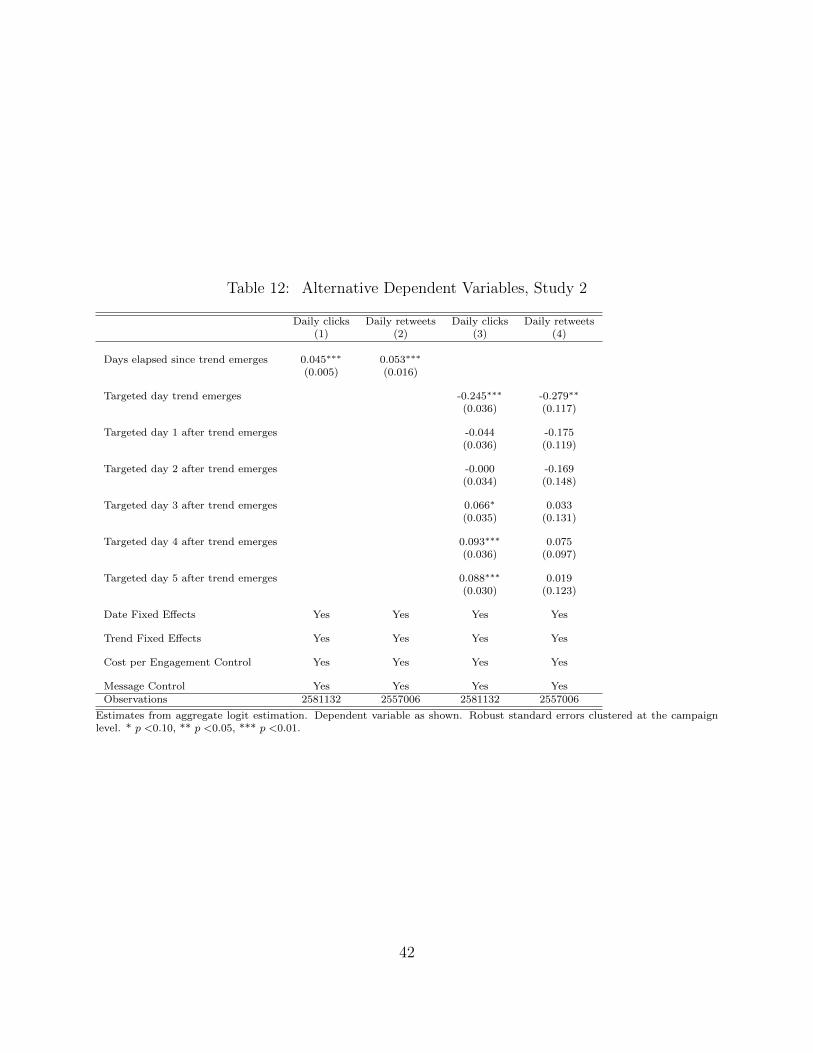
Table 12: Alternative Dependent Variables, Study 2
Daily clicks Daily retweets Daily clicks Daily retweets(1) (2) (3) (4)
Days elapsed since trend emerges 0.045∗∗∗ 0.053∗∗∗
(0.005) (0.016)
Targeted day trend emerges -0.245∗∗∗ -0.279∗∗
(0.036) (0.117)
Targeted day 1 after trend emerges -0.044 -0.175(0.036) (0.119)
Targeted day 2 after trend emerges -0.000 -0.169(0.034) (0.148)
Targeted day 3 after trend emerges 0.066∗ 0.033(0.035) (0.131)
Targeted day 4 after trend emerges 0.093∗∗∗ 0.075(0.036) (0.097)
Targeted day 5 after trend emerges 0.088∗∗∗ 0.019(0.030) (0.123)
Date Fixed Effects Yes Yes Yes Yes
Trend Fixed Effects Yes Yes Yes Yes
Cost per Engagement Control Yes Yes Yes Yes
Message Control Yes Yes Yes YesObservations 2581132 2557006 2581132 2557006
Estimates from aggregate logit estimation. Dependent variable as shown. Robust standard errors clustered at the campaignlevel. * p <0.10, ** p <0.05, *** p <0.01.
42
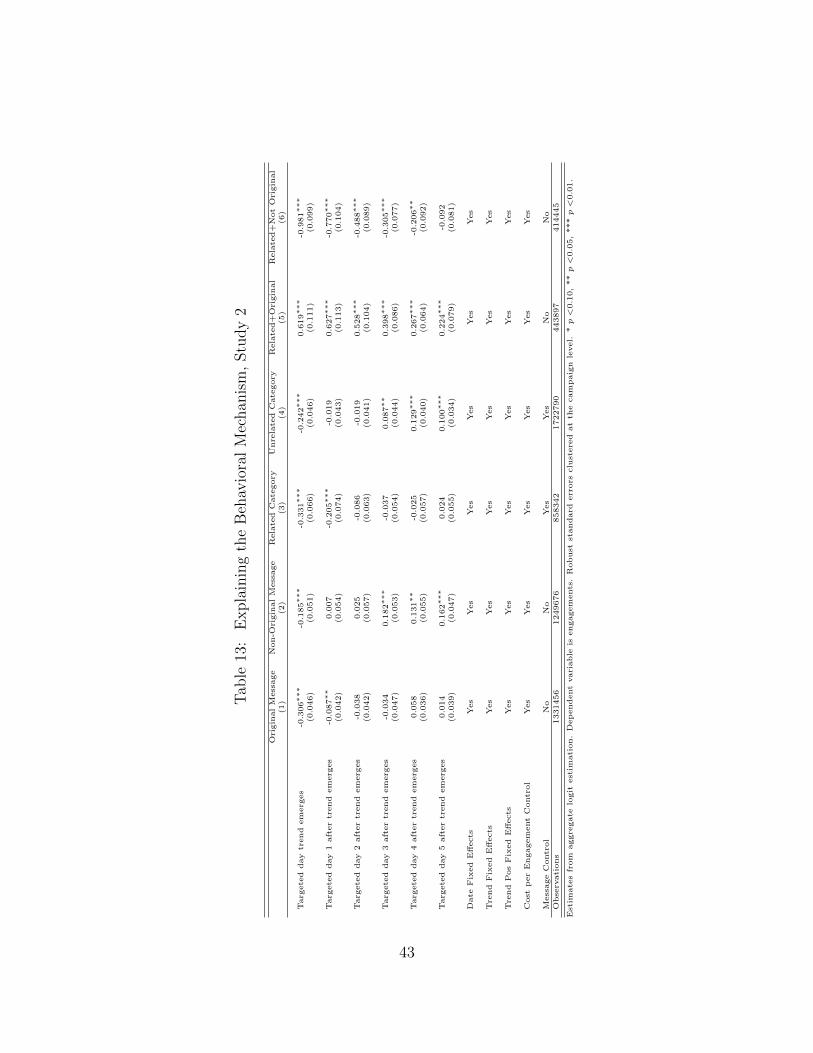
Tab
le13
:E
xpla
inin
gth
eB
ehav
iora
lM
echan
ism
,Stu
dy
2
Ori
gin
al
Mess
age
Non-O
rigin
al
Mess
age
Rela
ted
Cate
gory
Unre
late
dC
ate
gory
Rela
ted+
Ori
gin
al
Rela
ted+
Not
Ori
gin
al
(1)
(2)
(3)
(4)
(5)
(6)
Targ
ete
dday
trend
em
erg
es
-0.3
06∗∗∗
-0.1
85∗∗∗
-0.3
31∗∗∗
-0.2
42∗∗∗
0.6
19∗∗∗
-0.9
81∗∗∗
(0.0
46)
(0.0
51)
(0.0
66)
(0.0
46)
(0.1
11)
(0.0
99)
Targ
ete
dday
1aft
er
trend
em
erg
es
-0.0
87∗∗
0.0
07
-0.2
05∗∗∗
-0.0
19
0.6
27∗∗∗
-0.7
70∗∗∗
(0.0
42)
(0.0
54)
(0.0
74)
(0.0
43)
(0.1
13)
(0.1
04)
Targ
ete
dday
2aft
er
trend
em
erg
es
-0.0
38
0.0
25
-0.0
86
-0.0
19
0.5
28∗∗∗
-0.4
88∗∗∗
(0.0
42)
(0.0
57)
(0.0
63)
(0.0
41)
(0.1
04)
(0.0
89)
Targ
ete
dday
3aft
er
trend
em
erg
es
-0.0
34
0.1
82∗∗∗
-0.0
37
0.0
87∗∗
0.3
98∗∗∗
-0.3
05∗∗∗
(0.0
47)
(0.0
53)
(0.0
54)
(0.0
44)
(0.0
86)
(0.0
77)
Targ
ete
dday
4aft
er
trend
em
erg
es
0.0
58
0.1
31∗∗
-0.0
25
0.1
29∗∗∗
0.2
67∗∗∗
-0.2
06∗∗
(0.0
36)
(0.0
55)
(0.0
57)
(0.0
40)
(0.0
64)
(0.0
92)
Targ
ete
dday
5aft
er
trend
em
erg
es
0.0
14
0.1
62∗∗∗
0.0
24
0.1
00∗∗∗
0.2
24∗∗∗
-0.0
92
(0.0
39)
(0.0
47)
(0.0
55)
(0.0
34)
(0.0
79)
(0.0
81)
Date
Fix
ed
Eff
ects
Yes
Yes
Yes
Yes
Yes
Yes
Tre
nd
Fix
ed
Eff
ects
Yes
Yes
Yes
Yes
Yes
Yes
Tre
nd
Pos
Fix
ed
Eff
ects
Yes
Yes
Yes
Yes
Yes
Yes
Cost
per
Engagem
ent
Contr
ol
Yes
Yes
Yes
Yes
Yes
Yes
Mess
age
Contr
ol
No
No
Yes
Yes
No
No
Obse
rvati
ons
1331456
1249676
858342
1722790
443897
414445
Est
imate
sfr
om
aggre
gate
logit
est
imati
on.
Dep
endent
vari
able
isengagem
ents
.R
obust
standard
err
ors
clu
stere
dat
the
cam
paig
nle
vel.
*p<
0.1
0,
**
p<
0.0
5,
***
p<
0.0
1.
43
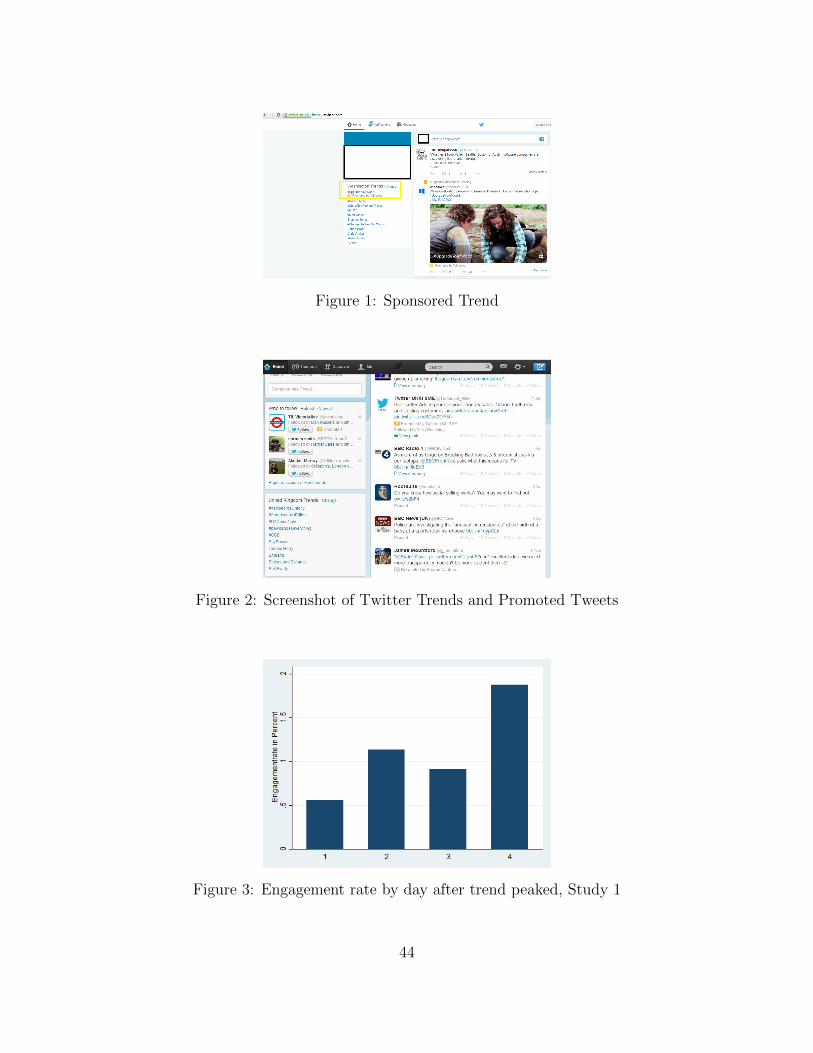
Figure 1: Sponsored Trend
Figure 2: Screenshot of Twitter Trends and Promoted Tweets
Figure 3: Engagement rate by day after trend peaked, Study 1
44
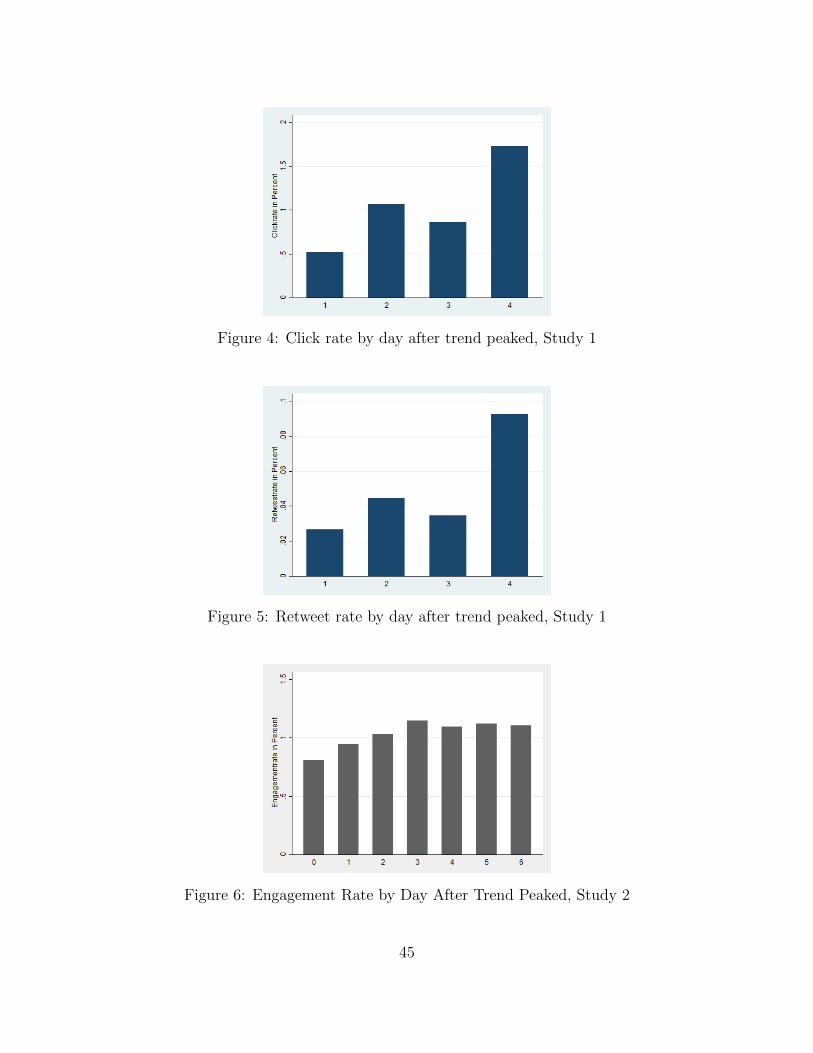
Figure 4: Click rate by day after trend peaked, Study 1
Figure 5: Retweet rate by day after trend peaked, Study 1
Figure 6: Engagement Rate by Day After Trend Peaked, Study 2
45
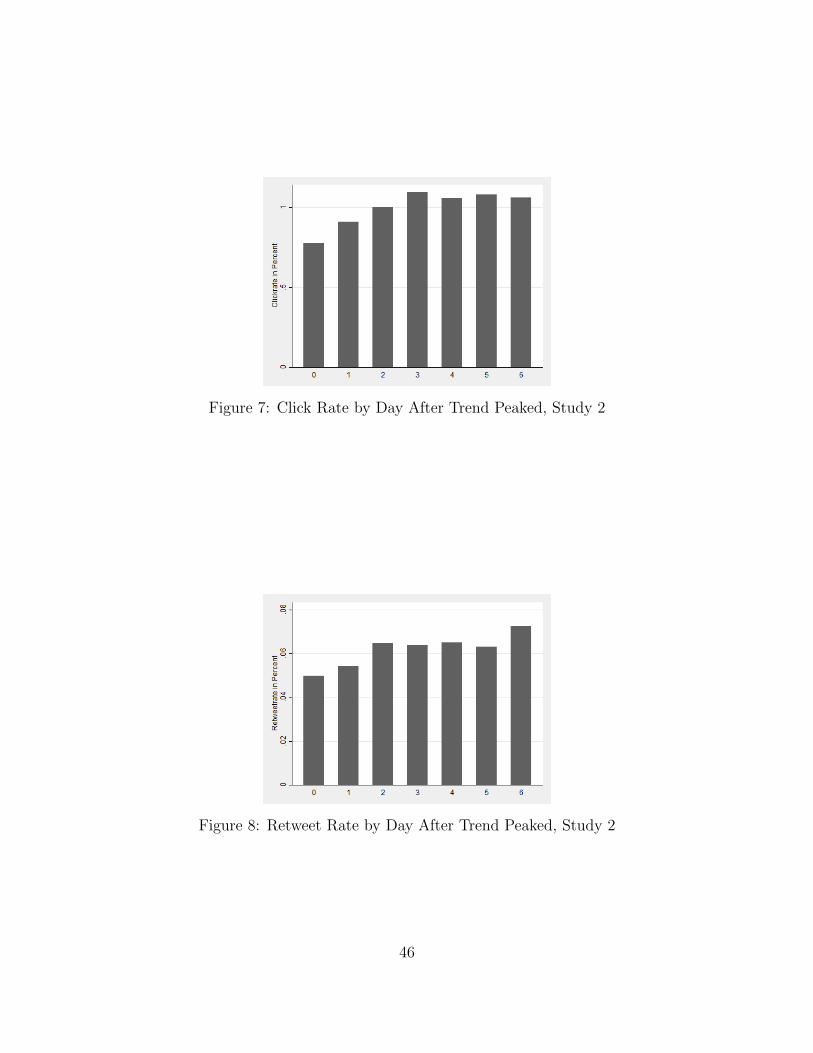
Figure 7: Click Rate by Day After Trend Peaked, Study 2
Figure 8: Retweet Rate by Day After Trend Peaked, Study 2
46
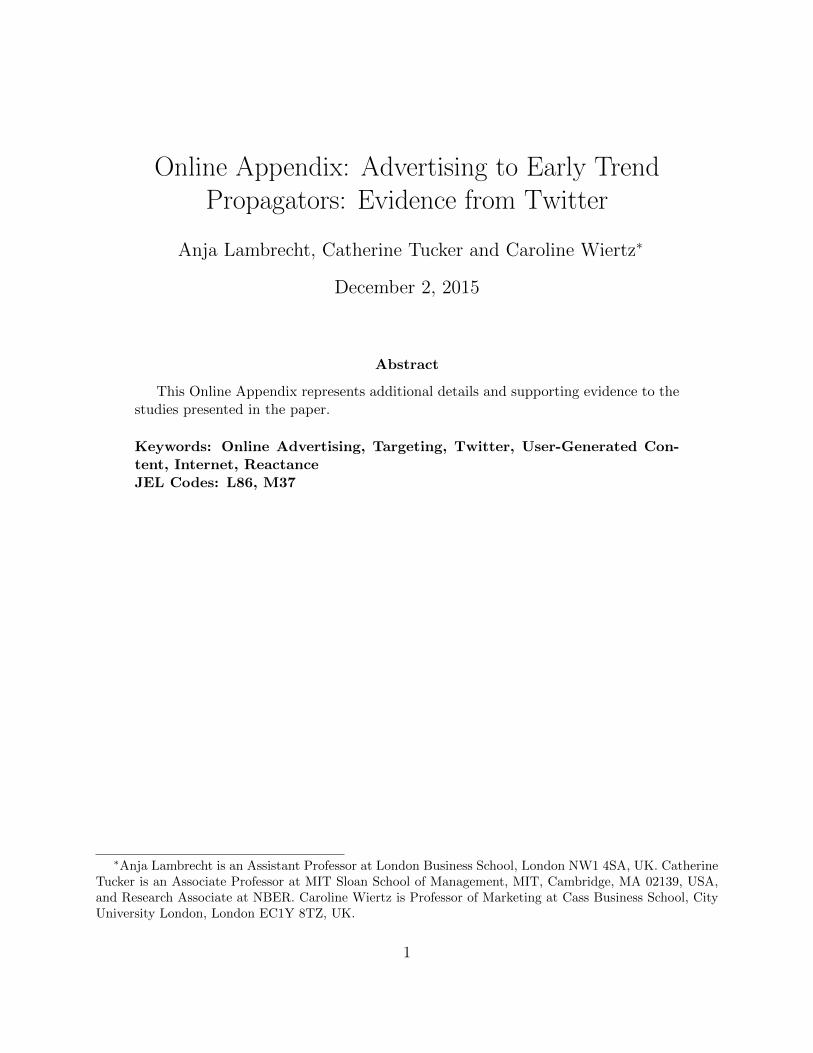
Online Appendix: Advertising to Early TrendPropagators: Evidence from Twitter
Anja Lambrecht, Catherine Tucker and Caroline Wiertz∗
December 2, 2015
Abstract
This Online Appendix represents additional details and supporting evidence to thestudies presented in the paper.
Keywords: Online Advertising, Targeting, Twitter, User-Generated Con-tent, Internet, ReactanceJEL Codes: L86, M37
∗Anja Lambrecht is an Assistant Professor at London Business School, London NW1 4SA, UK. CatherineTucker is an Associate Professor at MIT Sloan School of Management, MIT, Cambridge, MA 02139, USA,and Research Associate at NBER. Caroline Wiertz is Professor of Marketing at Cass Business School, CityUniversity London, London EC1Y 8TZ, UK.
1
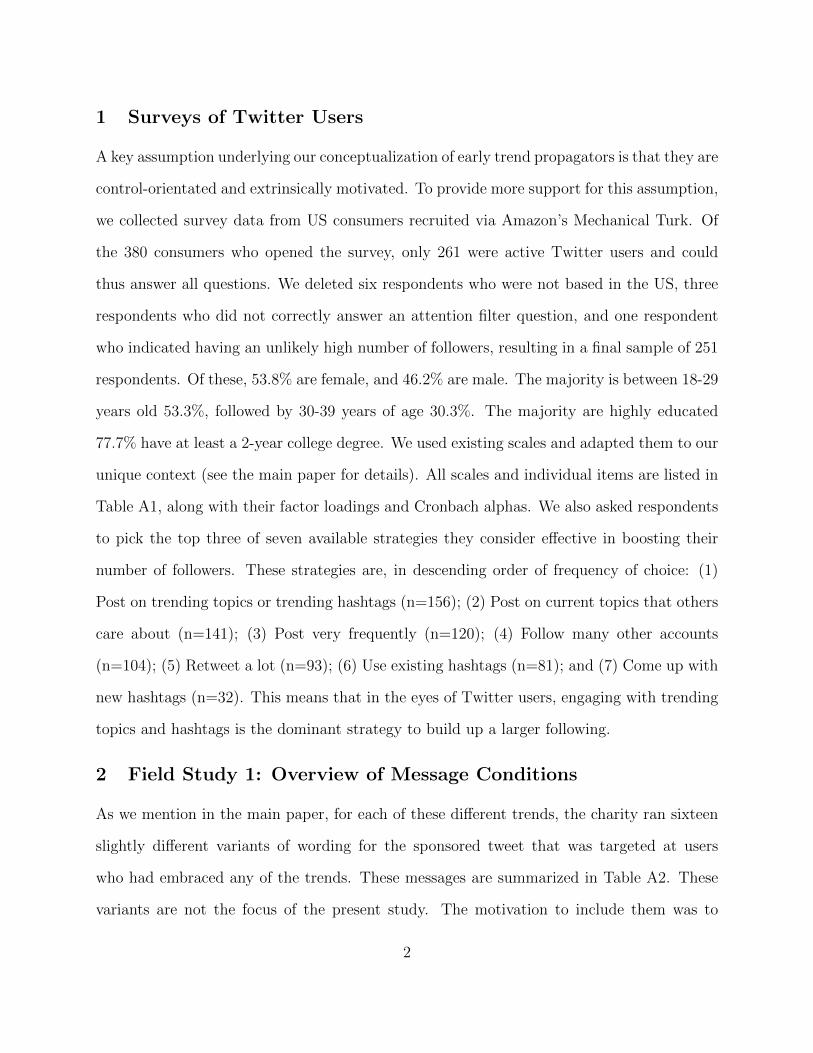
1 Surveys of Twitter Users
A key assumption underlying our conceptualization of early trend propagators is that they are
control-orientated and extrinsically motivated. To provide more support for this assumption,
we collected survey data from US consumers recruited via Amazon’s Mechanical Turk. Of
the 380 consumers who opened the survey, only 261 were active Twitter users and could
thus answer all questions. We deleted six respondents who were not based in the US, three
respondents who did not correctly answer an attention filter question, and one respondent
who indicated having an unlikely high number of followers, resulting in a final sample of 251
respondents. Of these, 53.8% are female, and 46.2% are male. The majority is between 18-29
years old 53.3%, followed by 30-39 years of age 30.3%. The majority are highly educated
77.7% have at least a 2-year college degree. We used existing scales and adapted them to our
unique context (see the main paper for details). All scales and individual items are listed in
Table A1, along with their factor loadings and Cronbach alphas. We also asked respondents
to pick the top three of seven available strategies they consider effective in boosting their
number of followers. These strategies are, in descending order of frequency of choice: (1)
Post on trending topics or trending hashtags (n=156); (2) Post on current topics that others
care about (n=141); (3) Post very frequently (n=120); (4) Follow many other accounts
(n=104); (5) Retweet a lot (n=93); (6) Use existing hashtags (n=81); and (7) Come up with
new hashtags (n=32). This means that in the eyes of Twitter users, engaging with trending
topics and hashtags is the dominant strategy to build up a larger following.
2 Field Study 1: Overview of Message Conditions
As we mention in the main paper, for each of these different trends, the charity ran sixteen
slightly different variants of wording for the sponsored tweet that was targeted at users
who had embraced any of the trends. These messages are summarized in Table A2. These
variants are not the focus of the present study. The motivation to include them was to
2
explore responsiveness on Twitter to different types of advertising messages. They constitute
attempts at finding the optimal way of phrasing an advertising message for the charity and
should be thought of as reflecting the existing body of knowledge about non-profit marketing.
Variation on whether or not there was an identifiable victim mentioned in the tweet is
based on research that has demonstrated that people are more likely to respond to an identi-
fiable victim than a statistical victim (Jenni and Loewenstein, 1997; Small and Loewenstein,
2003). Similarly, whether to emphasize the self or others stems from the marketing literature
which has on balance found a benefit to emphasizing others (Brunel and Nelson, 2000; Fisher
et al., 2008). Whether the call to action emphasized collecting information about the charity
or proceeding to donate builds on recent insights about customizing advertising messages
to fit a consumer’s stage in their decision process (Lambrecht and Tucker, 2013). In Tables
A3 and A4 below we summarize these results. Lastly, there was a distinction between vari-
ants that used the prefix ‘Today’ to increase timeliness of the tweet and variants that did
not. Timeliness is particularly relevant on Twitter because of the recency of the messages
broadcasted there (Liu et al., 2013).
3 Field Study 2: Testing of Message Variations
We tested the two messages (’Discover an original Brixton-based fashion brand: [brand
name] - where crazy is the new normal [URL]’ and ’Discover a new global fashion brand:
[brand name] - where crazy is the new normal [URL]’) with a sample of 196 US participants
at Amazon’s Mechanical Turk. We find that the message referring to Brixton indeed ranks
significantly higher in uniqueness, measured using items adapted from a product coolness
scale by Sundar et al. (2014) (3.22 vs. 2.71, p<0.001). It is also perceived as as less
commercial (3.02 vs. 3.63, p<0.001).
To measure uniqueness, we measured agreement with the following statements ’This
brand makes people who use it different from other people.’ (3.21 vs. 2.65 p<0.001), ’If I
3

bought clothes from this brand, it would make me stand apart from others.’ (3.20 vs. 2.72,
p<0.001), ’This brand helps people who buy it stand apart from the crowd.’ (3.28 vs. 2.77,
p<0.001), ’People who buy clothes from this brand are unique.’ (3.18 vs. 2.70, p<0.001).
Note that we likewise tested whether participants felt the message captured their atten-
tion or was surprising and found neither of these variables to be significantly different.
4
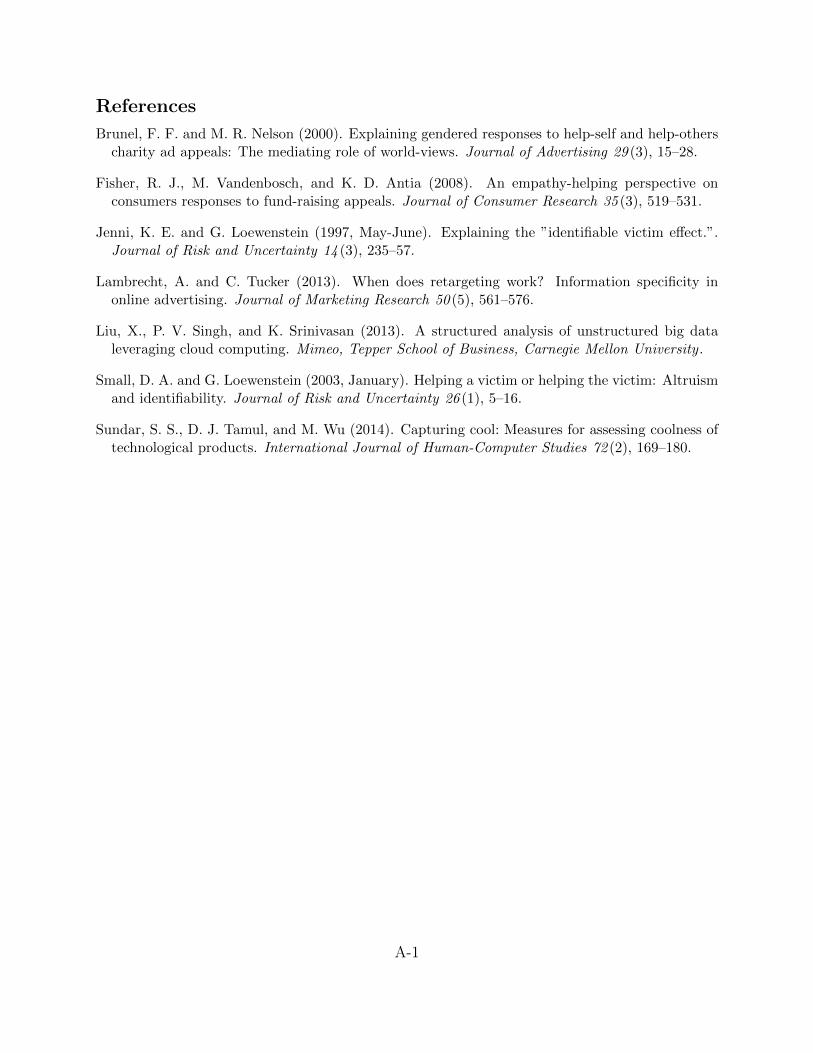
References
Brunel, F. F. and M. R. Nelson (2000). Explaining gendered responses to help-self and help-otherscharity ad appeals: The mediating role of world-views. Journal of Advertising 29 (3), 15–28.
Fisher, R. J., M. Vandenbosch, and K. D. Antia (2008). An empathy-helping perspective onconsumers responses to fund-raising appeals. Journal of Consumer Research 35 (3), 519–531.
Jenni, K. E. and G. Loewenstein (1997, May-June). Explaining the ”identifiable victim effect.”.Journal of Risk and Uncertainty 14 (3), 235–57.
Lambrecht, A. and C. Tucker (2013). When does retargeting work? Information specificity inonline advertising. Journal of Marketing Research 50 (5), 561–576.
Liu, X., P. V. Singh, and K. Srinivasan (2013). A structured analysis of unstructured big dataleveraging cloud computing. Mimeo, Tepper School of Business, Carnegie Mellon University .
Small, D. A. and G. Loewenstein (2003, January). Helping a victim or helping the victim: Altruismand identifiability. Journal of Risk and Uncertainty 26 (1), 5–16.
Sundar, S. S., D. J. Tamul, and M. Wu (2014). Capturing cool: Measures for assessing coolness oftechnological products. International Journal of Human-Computer Studies 72 (2), 169–180.
A-1
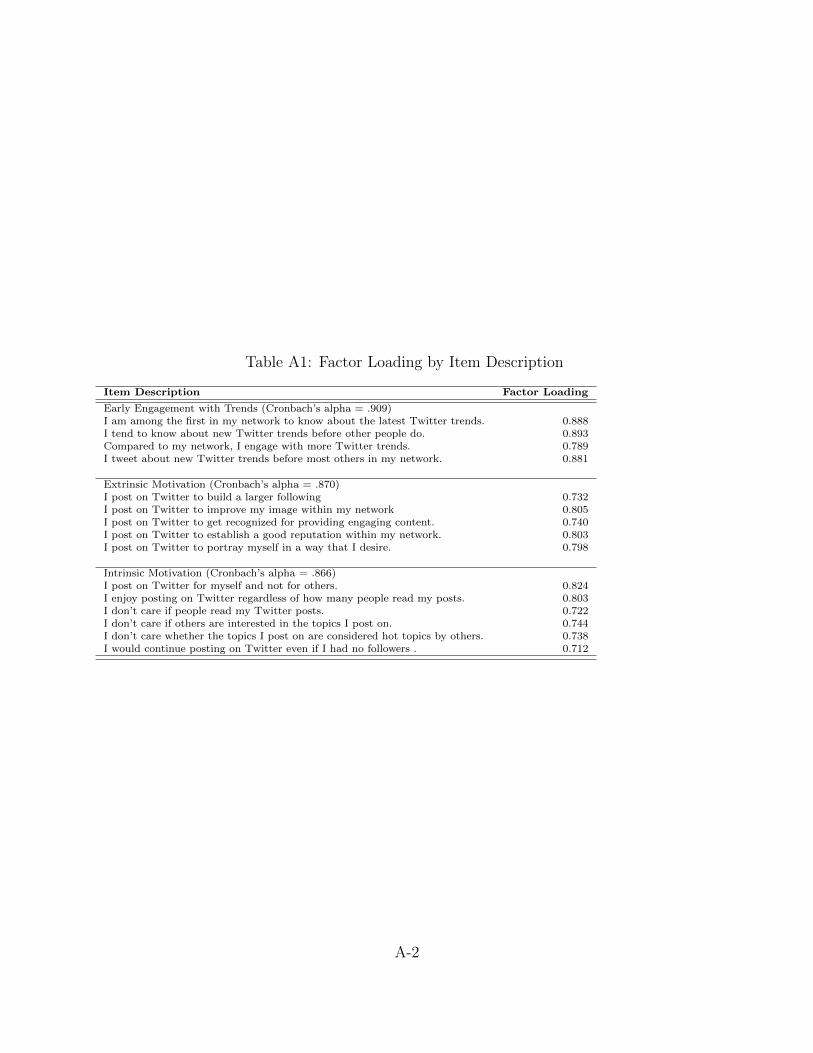
Table A1: Factor Loading by Item Description
Item Description Factor Loading
Early Engagement with Trends (Cronbach’s alpha = .909)I am among the first in my network to know about the latest Twitter trends. 0.888I tend to know about new Twitter trends before other people do. 0.893Compared to my network, I engage with more Twitter trends. 0.789I tweet about new Twitter trends before most others in my network. 0.881
Extrinsic Motivation (Cronbach’s alpha = .870)I post on Twitter to build a larger following 0.732I post on Twitter to improve my image within my network 0.805I post on Twitter to get recognized for providing engaging content. 0.740I post on Twitter to establish a good reputation within my network. 0.803I post on Twitter to portray myself in a way that I desire. 0.798
Intrinsic Motivation (Cronbach’s alpha = .866)I post on Twitter for myself and not for others. 0.824I enjoy posting on Twitter regardless of how many people read my posts. 0.803I don’t care if people read my Twitter posts. 0.722I don’t care if others are interested in the topics I post on. 0.744I don’t care whether the topics I post on are considered hot topics by others. 0.738I would continue posting on Twitter even if I had no followers . 0.712
A-2
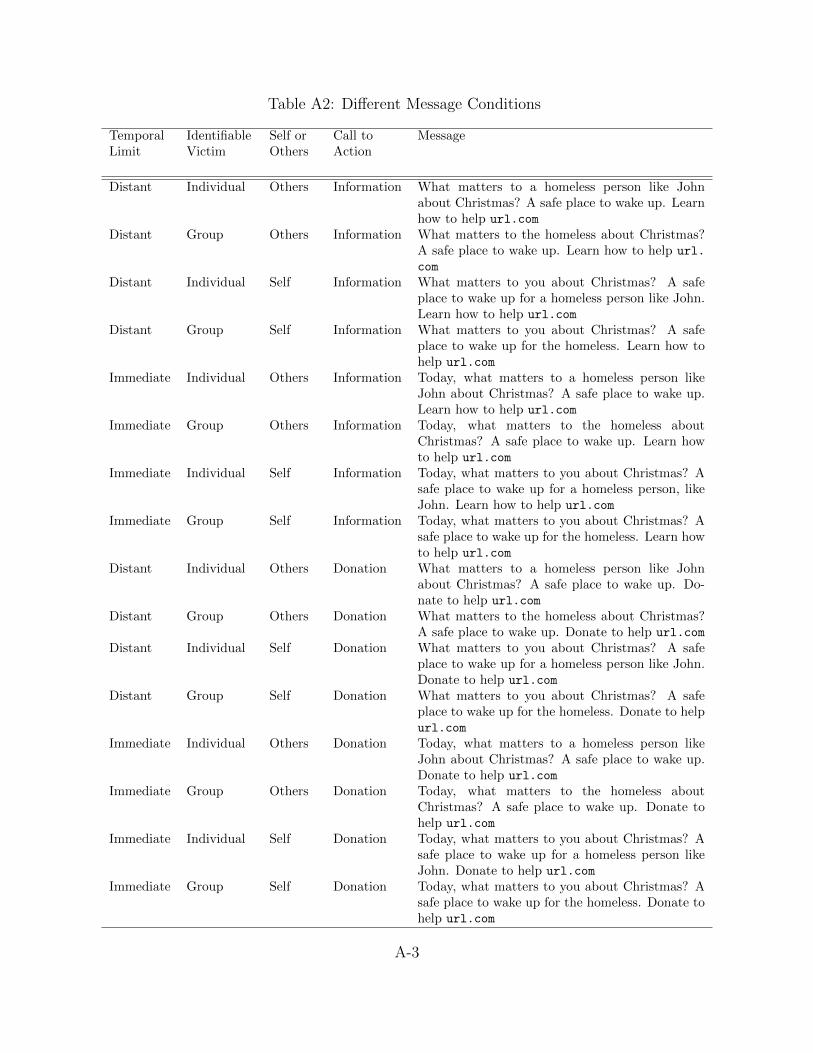
Table A2: Different Message Conditions
TemporalLimit
IdentifiableVictim
Self orOthers
Call toAction
Message
Distant Individual Others Information What matters to a homeless person like Johnabout Christmas? A safe place to wake up. Learnhow to help url.com
Distant Group Others Information What matters to the homeless about Christmas?A safe place to wake up. Learn how to help url.
com
Distant Individual Self Information What matters to you about Christmas? A safeplace to wake up for a homeless person like John.Learn how to help url.com
Distant Group Self Information What matters to you about Christmas? A safeplace to wake up for the homeless. Learn how tohelp url.com
Immediate Individual Others Information Today, what matters to a homeless person likeJohn about Christmas? A safe place to wake up.Learn how to help url.com
Immediate Group Others Information Today, what matters to the homeless aboutChristmas? A safe place to wake up. Learn howto help url.com
Immediate Individual Self Information Today, what matters to you about Christmas? Asafe place to wake up for a homeless person, likeJohn. Learn how to help url.com
Immediate Group Self Information Today, what matters to you about Christmas? Asafe place to wake up for the homeless. Learn howto help url.com
Distant Individual Others Donation What matters to a homeless person like Johnabout Christmas? A safe place to wake up. Do-nate to help url.com
Distant Group Others Donation What matters to the homeless about Christmas?A safe place to wake up. Donate to help url.com
Distant Individual Self Donation What matters to you about Christmas? A safeplace to wake up for a homeless person like John.Donate to help url.com
Distant Group Self Donation What matters to you about Christmas? A safeplace to wake up for the homeless. Donate to helpurl.com
Immediate Individual Others Donation Today, what matters to a homeless person likeJohn about Christmas? A safe place to wake up.Donate to help url.com
Immediate Group Others Donation Today, what matters to the homeless aboutChristmas? A safe place to wake up. Donate tohelp url.com
Immediate Individual Self Donation Today, what matters to you about Christmas? Asafe place to wake up for a homeless person likeJohn. Donate to help url.com
Immediate Group Self Donation Today, what matters to you about Christmas? Asafe place to wake up for the homeless. Donate tohelp url.com
A-3
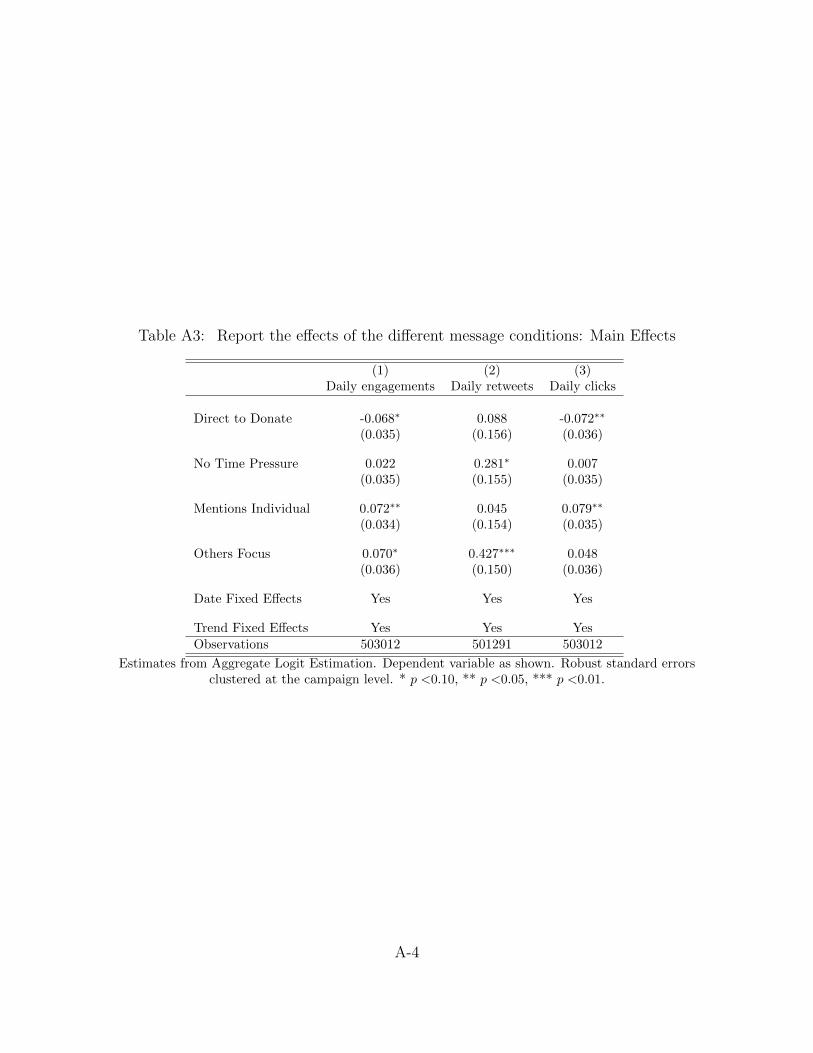
Table A3: Report the effects of the different message conditions: Main Effects
(1) (2) (3)Daily engagements Daily retweets Daily clicks
Direct to Donate -0.068∗ 0.088 -0.072∗∗
(0.035) (0.156) (0.036)
No Time Pressure 0.022 0.281∗ 0.007(0.035) (0.155) (0.035)
Mentions Individual 0.072∗∗ 0.045 0.079∗∗
(0.034) (0.154) (0.035)
Others Focus 0.070∗ 0.427∗∗∗ 0.048(0.036) (0.150) (0.036)
Date Fixed Effects Yes Yes Yes
Trend Fixed Effects Yes Yes YesObservations 503012 501291 503012
Estimates from Aggregate Logit Estimation. Dependent variable as shown. Robust standard errorsclustered at the campaign level. * p <0.10, ** p <0.05, *** p <0.01.
A-4
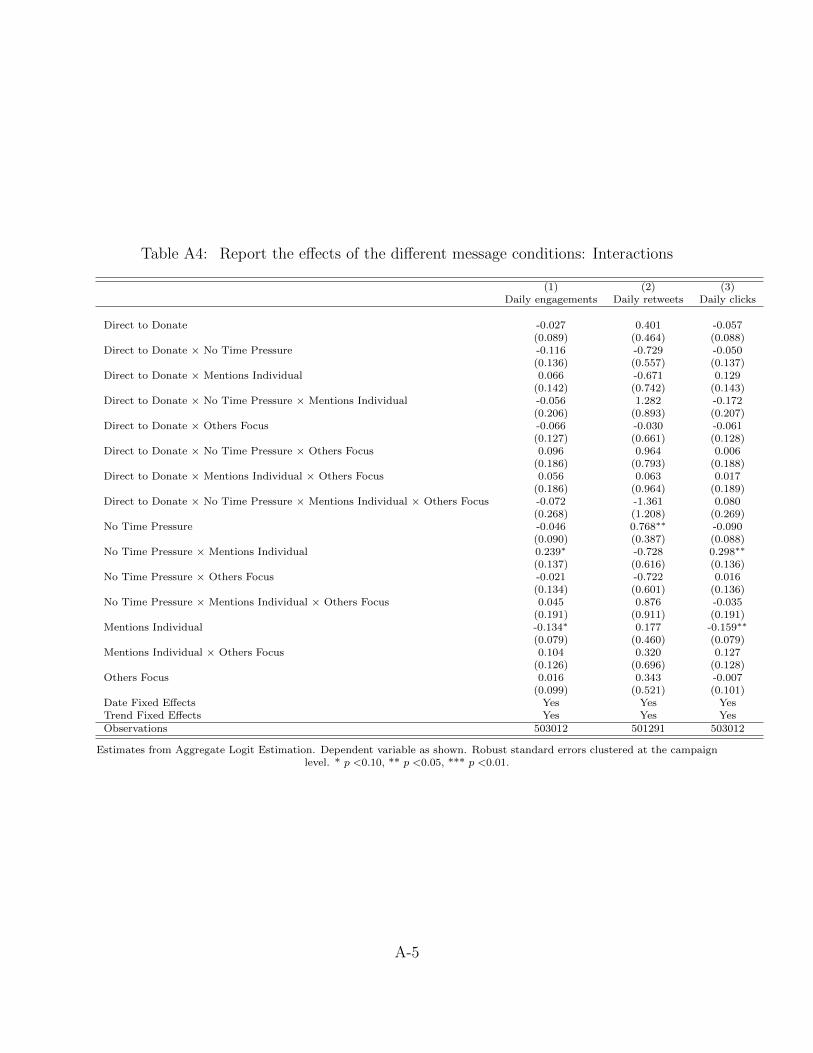
Table A4: Report the effects of the different message conditions: Interactions
(1) (2) (3)Daily engagements Daily retweets Daily clicks
Direct to Donate -0.027 0.401 -0.057(0.089) (0.464) (0.088)
Direct to Donate × No Time Pressure -0.116 -0.729 -0.050(0.136) (0.557) (0.137)
Direct to Donate × Mentions Individual 0.066 -0.671 0.129(0.142) (0.742) (0.143)
Direct to Donate × No Time Pressure × Mentions Individual -0.056 1.282 -0.172(0.206) (0.893) (0.207)
Direct to Donate × Others Focus -0.066 -0.030 -0.061(0.127) (0.661) (0.128)
Direct to Donate × No Time Pressure × Others Focus 0.096 0.964 0.006(0.186) (0.793) (0.188)
Direct to Donate × Mentions Individual × Others Focus 0.056 0.063 0.017(0.186) (0.964) (0.189)
Direct to Donate × No Time Pressure × Mentions Individual × Others Focus -0.072 -1.361 0.080(0.268) (1.208) (0.269)
No Time Pressure -0.046 0.768∗∗ -0.090(0.090) (0.387) (0.088)
No Time Pressure × Mentions Individual 0.239∗ -0.728 0.298∗∗
(0.137) (0.616) (0.136)No Time Pressure × Others Focus -0.021 -0.722 0.016
(0.134) (0.601) (0.136)No Time Pressure × Mentions Individual × Others Focus 0.045 0.876 -0.035
(0.191) (0.911) (0.191)Mentions Individual -0.134∗ 0.177 -0.159∗∗
(0.079) (0.460) (0.079)Mentions Individual × Others Focus 0.104 0.320 0.127
(0.126) (0.696) (0.128)Others Focus 0.016 0.343 -0.007
(0.099) (0.521) (0.101)Date Fixed Effects Yes Yes YesTrend Fixed Effects Yes Yes YesObservations 503012 501291 503012
Estimates from Aggregate Logit Estimation. Dependent variable as shown. Robust standard errors clustered at the campaignlevel. * p <0.10, ** p <0.05, *** p <0.01.
A-5