advocate aurora health, inc. and its affiliates and
TRANSCRIPT

Document Dated as of March 27, 2019
Advocate Aurora Health, Inc. and its Affiliates
and Subsidiaries Consolidated Financial Statements and Supplementary Information
As of and for the Period Ended December 31, 2018

1
ADVOCATE AURORA HEALTH, INC. AND ITS AFFILIATES AND SUBSIDIARIES
TABLE OF CONTENTS
REPORT OF INDEPENDENT AUDITORS 2
FINANCIAL INFORMATION:
Consolidated Balance Sheet 4 - 5
Consolidated Statement of Operations and Changes in Net Assets 6 - 7
Consolidated Statement of Cash Flows 8
Notes to Consolidated Financial Statements 9 - 45
SUPPLEMENTARY INFORMATION
Report of Independent Auditors on Supplementary Information 46
Consolidating Balance Sheet 47 - 48
Consolidating Statements of Operations 49

2
Report of Independent Auditors
The Board of Directors
Advocate Aurora Health, Inc. and its Affiliates and Subsidiaries
We have audited the accompanying consolidated financial statements of Advocate Aurora Health Care, Inc. and
its Affiliates and Subsidiaries, which comprise the consolidated balance sheet as of December 31, 2018, and the
related consolidated statements of operations and changes in net assets, and cash flows for the period from
April 1, 2018 through December 31, 2018, and the related notes to the consolidated financial statements.
Management’s Responsibility for the Financial Statements
Management is responsible for the preparation and fair presentation of these financial statements in
conformity with U.S. generally accepted accounting principles; this includes the design, implementation and
maintenance of internal control relevant to the preparation and fair presentation of financial statements that
are free of material misstatement, whether due to fraud or error.
Auditor’s Responsibility
Our responsibility is to express an opinion on these financial statements based on our audit. We conducted our
audit in accordance with auditing standards generally accepted in the United States. Those standards require
that we plan and perform the audit to obtain reasonable assurance about whether the financial statements are
free of material misstatement.
An audit involves performing procedures to obtain audit evidence about the amounts and disclosures in the
financial statements. The procedures selected depend on the auditor’s judgment, including the assessment of
the risks of material misstatement of the financial statements, whether due to fraud or error. In making those
risk assessments, the auditor considers internal control relevant to the entity’s preparation and fair
presentation of the financial statements in order to design audit procedures that are appropriate in the
circumstances, but not for the purpose of expressing an opinion on the effectiveness of the entity’s internal
control. Accordingly, we express no such opinion. An audit also includes evaluating the appropriateness of
accounting policies used and the reasonableness of significant accounting estimates made by management, as
well as evaluating the overall presentation of the financial statements.
We believe that the audit evidence we have obtained is sufficient and appropriate to provide a basis for our
audit opinion.
A member firm of Ernst & Young Global Limited
Ernst & Young LLP 155 North Wacker Drive Chicago, IL 60606-1787
Tel: +1 312 879 2000 Fax: +1 312 879 4000 ey.com

3
Opinion
In our opinion, the financial statements referred to above present fairly, in all material respects, the
consolidated financial position of Advocate Aurora Health Care, Inc. and its Affiliates and Subsidiaries at
December 31, 2018, and the consolidated results of their operations and their cash flows for the period from
April 1, 2018 through December 31, 2018, in conformity with U.S. generally accepted accounting principles.
March 27, 2019
A member firm of Ernst & Young Global Limited

4
ADVOCATE AURORA HEALTH, INC. AND ITS AFFILIATES AND SUBSIDIARIES
CONSOLIDATED BALANCE SHEET
(dollars in thousands)
December 31,
2018
Assets Current assets:
Cash and cash equivalents $ 584,887 Assets limited as to use 106,244 Patient accounts receivable 1,486,260 Other current assets 512,556 Third-party payors receivables 17,793 Collateral proceeds under securities lending program 18,869
Total current assets 2,726,609
Asset limited as to use:
Internally designated for capital and other 6,941,646 Held for self-insurance 632,372 Donor restricted 119,759 Investments under securities lending program 18,310
Total assets limited as to use 7,712,087
Property and equipment, net 5,626,475 Other assets:
Intangible assets and goodwill, net 89,329 Investments in unconsolidated entities 202,331 Reinsurance receivable 60,741 Other noncurrent assets 315,217
Total other assets 667,618
Total assets $ 16,732,789

5
ADVOCATE AURORA HEALTH, INC. AND ITS AFFILIATES AND SUBSIDIARIES
CONSOLIDATED BALANCE SHEET
(dollars in thousands)
December 31,
2018
Liabilities and net assets Current liabilities:
Current portion of long-term debt $ 49,927 Long-term debt subject to short-term financing arrangements 162,025 Accounts payable and accrued liabilities 1,671,124 Third-party payors payables 303,633 Current portion of accrued insurance and claim costs 122,361 Collateral under securities lending program 18,869
Total current liabilities 2,327,939
Noncurrent liabilities:
Long-term debt, less current portion 2,796,906 Accrued insurance and claims cost, less current portion 593,296 Accrued losses subject to insurance recovery 60,741 Obligations under swap agreements 65,376 Other noncurrent liabilities 645,554
Total noncurrent liabilities 4,161,873
Total liabilities 6,489,812
Net assets:
Without donor restrictions: Controlling interest 9,900,718 Noncontrolling interest in subsidiaries 118,468
Total net assets without donor restrictions 10,019,186
With donor restrictions 223,791
Total net assets 10,242,977
Total liabilities and net assets $ 16,732,789
See accompanying notes to consolidated financial statements.

6
ADVOCATE AURORA HEALTH, INC. AND ITS AFFILIATES AND SUBSIDIARIES
CONSOLIDATED STATEMENT OF OPERATIONS AND CHANGES IN NET ASSETS (dollars in thousands)
Nine Months Ended
December 31, 2018
Revenue: Patient service revenue $ 7,533,468 Capitation revenue 1,035,995 Other revenue 643,943
Total revenue 9,213,406
Expenses:
Salaries, wages and benefits 4,993,014 Supplies and purchased services 2,233,107 Contract medical services 478,393 Depreciation and amortization 410,790 Interest 81,385 Other 602,668
Total expenses 8,799,357
Operating income before nonrecurring expenses 414,049
Nonrecurring expenses 55,182
Operating income 358,867
Nonoperating loss:
Investment loss, net (258,118 ) Loss on debt refinancing (29,859 ) Change in fair value of interest rate swaps 993 Other nonoperating income, net 646
Total nonoperating loss, net (286,338 )
Excess of revenue over expenses 72,529 Less noncontrolling interest (34,383 )
Excess of revenue over expenses – attributable to controlling interest $ 38,146
7
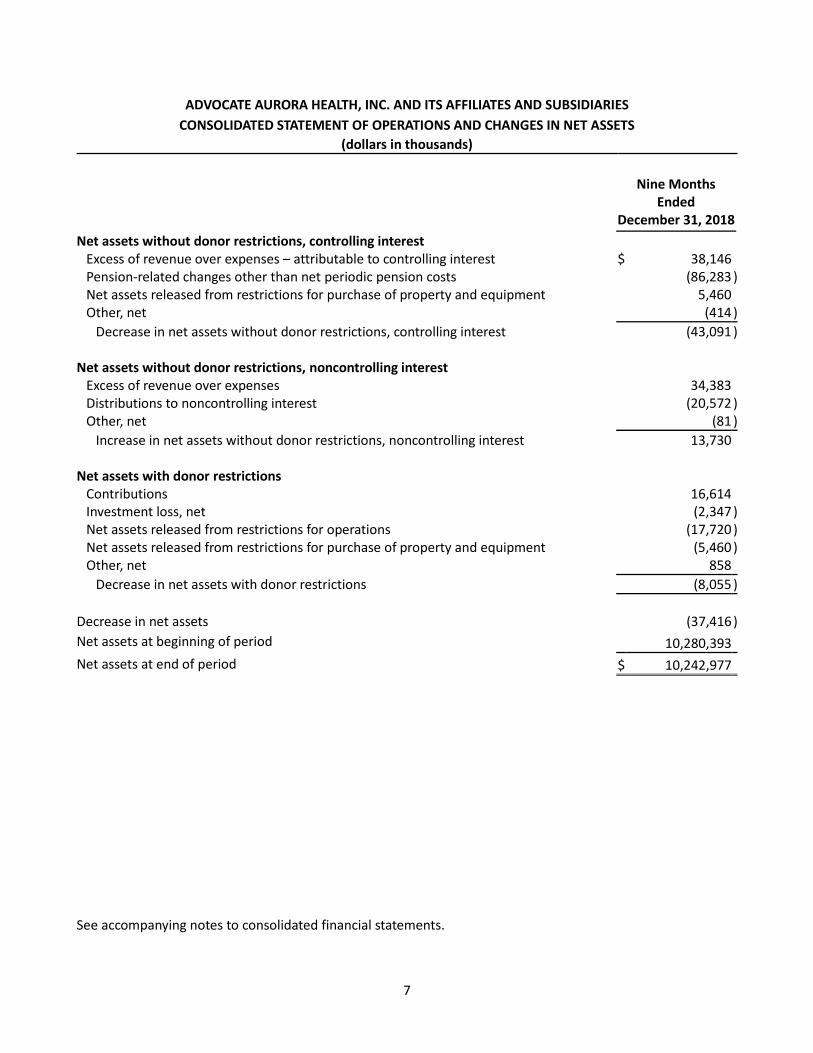
ADVOCATE AURORA HEALTH, INC. AND ITS AFFILIATES AND SUBSIDIARIES
CONSOLIDATED STATEMENT OF OPERATIONS AND CHANGES IN NET ASSETS
(dollars in thousands)
Nine Months Ended
December 31, 2018
Net assets without donor restrictions, controlling interest Excess of revenue over expenses – attributable to controlling interest $ 38,146 Pension-related changes other than net periodic pension costs (86,283 ) Net assets released from restrictions for purchase of property and equipment 5,460 Other, net (414 )
Decrease in net assets without donor restrictions, controlling interest (43,091 ) Net assets without donor restrictions, noncontrolling interest
Excess of revenue over expenses 34,383 Distributions to noncontrolling interest (20,572 ) Other, net (81 )
Increase in net assets without donor restrictions, noncontrolling interest 13,730 Net assets with donor restrictions
Contributions 16,614 Investment loss, net (2,347 ) Net assets released from restrictions for operations (17,720 ) Net assets released from restrictions for purchase of property and equipment (5,460 ) Other, net 858
Decrease in net assets with donor restrictions (8,055 )
Decrease in net assets (37,416 )
Net assets at beginning of period 10,280,393
Net assets at end of period $ 10,242,977
See accompanying notes to consolidated financial statements.

8
ADVOCATE AURORA HEALTH, INC. AND ITS AFFILIATES AND SUBSIDIARIES
CONSOLIDATED STATEMENT OF CASH FLOWS
(dollars in thousands)
Nine Months Ended
December 31, 2018
Cash flows from operating activities Decrease in net assets $ (37,416 ) Adjustments to reconcile change in net assets to net cash provided by operating
activities: Depreciation, amortization and accretion 404,012 Loss on debt refinancing 29,859 Gain on sale of property and equipment (3,853 ) Change in fair value of swap agreements (993 ) Pension-related changes other than net periodic pension cost 86,283 Restricted contributions and gains on investments, net
of assets released from restrictions used for operations (11,304 ) Distribution to noncontrolling interest 33,101
Changes in operating assets and liabilities: Trading securities, net 348,851 Accounts receivable, net (15,547 ) Accounts payable and accrued liabilities 141,680 Third-party payors receivable and payable, net (14,993 ) Other assets and liabilities, net (79,962 )
Net cash provided by operating activities 879,718
Cash flows from investing activities Capital expenditures (552,933 ) Proceeds from sale of property and equipment 7,626 Sales of investments designated as non-trading, net 10,093 Investments in unconsolidated entities, net (3,100 ) Other 3,118
Net cash used in investing activities (535,196 )
Cash flows from financing activities Proceeds from long-term debt 1,226,853 Repayments of long-term debt and other obligations (1,371,174 ) Distribution to noncontrolling interest (33,101 ) Proceeds from restricted contributions and gains on investments 9,682
Net cash used in financing activities (167,740 )
Net increase in cash and cash equivalents 176,782
Cash and cash equivalents at beginning of period 408,105
Cash and cash equivalents at end of period $ 584,887
See accompanying notes to consolidated financial statements.

9
ADVOCATE AURORA HEALTH, INC. AND ITS AFFILIATES AND SUBSIDIARIES
NOTES TO CONSOLIDATED FINANCIAL STATEMENTS
FOR THE PERIOD ENDED DECEMBER 31, 2018
(Dollars in thousands)
1. ORGANIZATION AND BASIS OF PRESENTATION
Description of Business
On April 1, 2018, Advocate Aurora Health, Inc., a Delaware nonprofit corporation (the Parent Corporation)
became the sole corporate member of Advocate Health Care Network, an Illinois not-for-profit corporation
(Advocate) and Aurora Health Care, Inc., a Wisconsin nonstock not-for-profit corporation (Aurora) (the
Affiliation). The Parent Corporation, Advocate and Aurora and their controlled subsidiaries and affiliates are
collectively referred to herein as the “System.” The System was formed to further the parties’ common and
unifying charitable health care mission to promote and improve the quality and expand the scope and
accessibility of affordable health care and health care-related services for the communities they serve.
The System is comprised of various not-for-profit and for-profit entities, the primary activities of which are
the delivery of health care services and the provision of goods and services ancillary thereto.
The System provides a continuum of care through its 25 acute care hospitals, an integrated children’s
hospital, psychiatric hospital, primary and specialty physician services, outpatient centers, physician office
buildings, pharmacies, behavioral health care, rehabilitation and home health and hospice care in northern
and central Illinois and eastern Wisconsin.
Principles of Consolidation
Included in the System’s consolidated financial statements are all of its wholly owned or controlled
subsidiaries and affiliates. All significant intercompany transactions have been eliminated in consolidation.
2. SUMMARY OF SIGNIFICANT ACCOUNTING POLICIES
Use of Estimates
The preparation of consolidated financial statements in conformity with accounting principles generally
accepted in the United States requires management to make estimates, assumptions and judgments that
affect the reported amounts of assets, liabilities and notes to the consolidated financial statements at the
date of the consolidated financial statements. Estimates also affect the reported amounts of revenues and
expenses during the reporting period. Although estimates are considered to be fairly stated at the time
made, actual results could differ materially from those estimates.

10
Cash Equivalents
The System considers all highly liquid investments with a maturity of three months or less when purchased
to be cash equivalents.
Investments
The System has designated substantially all of its investments as trading. Investments in debt and equity
securities with readily determinable fair values are measured at fair value using quoted market prices or
otherwise observable inputs. Investments in private equity limited partnerships and derivative products
(hedge funds) are reported at fair value using net asset value as a practical expedient. Commingled funds
are carried at fair value based on other observable inputs. Investment income or loss (including realized
gains and losses, interest, dividends and unrealized gains and losses) is included in the nonoperating section
of the consolidated statement of operations and changes in net assets unless the income or loss is restricted
by donor or law or is related to assets designated for self-insurance programs. Investment income on self-
insurance trust funds is reported in other revenue. Investment income that is restricted by donor or law is
reported as a change in net assets with donor restrictions.
Assets Limited as to Use
Assets limited as to use consist of investments set aside by the System for future capital improvements and
certain medical education and other health care programs. The System retains control of these investments
and may, at its discretion, subsequently use them for other purposes. Additionally, assets limited as to use
include investments held by trustees or in trust under debt agreements, self-insurance trusts, assets held in
reinsurance trust accounts and donor-restricted funds.
Patient Service Revenue and Accounts Receivable
Patient service revenue is reported at the amount that reflects the consideration to which the System
expects to be entitled in exchange for providing patient care. These amounts are due from patients, third-
party payors (including managed care payors and government programs) and others and includes variable
consideration for retroactive revenue adjustments due to settlement of audits, reviews and investigations.
Generally, patients and third-party payors are billed within days after the services are performed or shortly
after discharge. Revenue is recognized as performance obligations are satisfied. Provisions for third-party
payor settlements and adjustments are estimated in the period the related services are provided and
adjusted in future periods as additional information becomes available and final settlements are
determined.
As the System’s performance obligations relate to contracts with a duration of less than one year, the System
has applied the optional exemption provided in the guidance and, therefore, is not required to disclose the
aggregate amount of the transaction price allocated to performance obligations that are unsatisfied or
partially unsatisfied at the end of the reporting period. The unsatisfied or partially unsatisfied performance

11
obligations referred to above are primarily related to inpatient acute care services at the end of the
reporting period. The performance obligations for these contracts are generally completed when the
patients are discharged, which generally occurs within days or weeks of the end of the reporting period.
As provided for under the guidance, the System does not adjust the promised amount of consideration from
patients and third-party payers for the effects of a significant financing component due to the expectation
that the period between the time the service is provided to a patient and the time that the patient or a
third-party payer pays for that service will be one year or less.
The System has entered into payment arrangements with patients that allow for payments over a term in
excess of one year. The System has evaluated historical collections in excess of one year and current market
interest rates to determine whether a significant financing component exists which would require an
adjustment to the promised amount of consideration from patients and third-party payors. The System has
determined that the impact of implicit financing arrangements for payment agreements in excess of one
year is insignificant to the consolidated statement of operations and changes in net assets.
The System does not incur significant incremental costs in obtaining contracts with patients. As permitted
in the guidance, any costs which are incurred are expensed in the period of occurrence, as the amortization
period of any asset that the System would have recognized is one year or less in duration.
Laws and regulations governing the Medicare and Medicaid programs are complex and subject to
interpretation. As a result, there is a possibility that recorded estimates will change by a material amount.
Inventories
Inventories, consisting primarily of medical supplies, pharmaceuticals and durable medical equipment, are
stated at the lower of cost (first-in, first-out) or market. Retail pharmaceutical inventories are stated at
replacement cost.
Reinsurance Receivables
Reinsurance receivables are recognized in a manner consistent with the liabilities relating to the underlying
reinsured contracts.
Intangible Assets and Goodwill, Net
Goodwill of $65,862 is included in intangible assets and goodwill, net in the accompanying consolidated
balance sheet. Goodwill is not amortized and is evaluated for impairment at least annually. Intangible assets
with expected useful lives are amortized over that period.

12
Asset Impairment
The System considers whether indicators of impairment are present and performs the necessary tests to
determine if the carrying value of an asset is appropriate. Impairment write-downs are recognized in the
statement of operations and changes in net assets as a component of operating expense at the time the
impairment is identified.
Property and Equipment, Net
Property and equipment are reported at cost or, if donated, at fair value at the date of the gift. Costs of
computer software developed or obtained for internal use, including external and internal direct costs of
materials and labor directly associated with internal-use software development projects, are capitalized and
included in property and equipment. Internal labor and interest expense incurred during the period of
construction of significant capital projects is capitalized as a component of the costs of the asset.
Property and equipment capitalized under capital leases are recorded at the net present value of future
minimum lease payments and are amortized on the straight-line method over the lessor of the related lease
term or the estimated useful life of the asset. Amortization of property and equipment under capital leases
is included in the accompanying consolidated statement of operations and changes in net assets in
depreciation and amortization expense.
Property and equipment assets are depreciated on the straight-line method over a period ranging from 3
years to 80 years.
Investments in Unconsolidated Entities
Investments in unconsolidated entities are accounted for using the cost or equity method. The System
applies the equity method of accounting for investments in unconsolidated entities when its ownership or
membership interest is 50% or less and the System has the ability to exercise significant influence over the
operating and financial policies of the investee. All other unconsolidated entities are accounted for using
the cost method. The income (loss) on health-related unconsolidated entities is included in other operating
revenue in the accompanying consolidated statement of operations and changes in net assets. Nonhealth-
related unconsolidated entities are included within other nonoperating income, net.
Derivative Financial Instruments
The System has entered into transactions to manage its interest rate, credit and market risks. Derivative
instruments, including exchange-traded and over-the-counter derivative contracts and interest rate swaps,
are recorded as either assets or liabilities at fair value. Subsequent changes in a derivatives fair value are
recognized in nonoperating loss.
13
Bond Issuance Costs, Discounts and Premiums
Bond issuance costs, discounts and premiums are amortized over the term of the bonds using the effective
interest method and are included in long-term debt in the consolidated balance sheet.
General and Professional Liability Risks
The provision for self-insured general and professional liability claims includes estimates of the ultimate
costs for both reported claims and claims incurred but not reported. The System measures the cost of its
unfunded obligations under such programs based upon actuarial calculations and records a liability on a
discounted basis.
Net Assets With Donor Restrictions
Net assets with donor restrictions are those assets whose use by the System has been limited by donors to
a specific time period or purpose, or consist of gifts with corpus values that have been restricted by donors
to be maintained in perpetuity. Net assets with donor restrictions are used in accordance with the donor’s
wishes primarily to purchase property and equipment, to fund medical education or to fund health
programs.
Assets released from restrictions to fund purchases of property and equipment are reported in the
consolidated statement of operations and changes in net assets as increases to net assets without donor
restrictions. Those assets released from restriction for operating purposes are reported in the consolidated
statement of operations and changes in net assets as other revenue. When restricted, earnings are recorded
as net assets with donor restrictions until amounts are expended in accordance with the donor's
specifications.
Other Nonoperating Income, Net
Revenues and expenses from delivering health care services and the provision of goods and services
ancillary thereto are reported in operations. Income and losses that arise from transactions that are
peripheral or incidental to the System’s main purpose are included in other nonoperating income, net.
Other nonoperating income, net primarily consists of impairment charges that are not related to delivering
health care services, fund-raising expenses, contributions to charitable organizations, income taxes and the
net non-service components of the periodic benefit income on the System’s pension plans.
Excess of Revenues Over Expenses and Changes in Net Assets
The consolidated statement of operations and changes in net assets includes the excess of revenues over
expenses as the performance indicator. Changes in net assets without donor restrictions, which are
excluded from excess of revenues over expenses, primarily include contributions of long-lived assets
(including assets acquired using contributions, which by donor restriction were to be used for the purposes

14
of acquiring such assets), pension-related changes other than net periodic pension costs and distributions
to noncontrolling interests.
Nonrecurring Expenses
The System has incurred salary, purchased services and other expenses in connection with the Affiliation
and the implementation of an electronic medical records system. As a result, these costs were recorded as
nonrecurring in the consolidated statement of operations and changes in net assets.
Accounting Pronouncements Adopted
In August 2016, the Financial Accounting Standards Board (FASB) issued Accounting Standards Update (ASU)
2016-14, Presentation of Financial Statements of Not-for-Profit Entities. The guidance requires net assets to
be categorized either as net assets with donor restrictions or net assets without donor restrictions rather
than the previous three classes of net assets. The guidance also requires additional quantitative and
qualitative disclosures related to liquidity and financial performance, as well as disclosure of expenses by
their natural and functional classifications. The System adopted this guidance for annual reporting as of
December 31, 2018.
Accounting Pronouncements Not Yet Adopted
In August 2018, the FASB issued ASU 2018-15, Intangibles–Goodwill and Other-Internal-Use Software
(Subtopic 350-40): Customer’s Accounting for Implementation Costs Incurred in a Cloud Computing
Arrangement That Is a Contract. This guidance requires an entity in a hosting arrangement that is a service
contract to follow the guidance in Subtopic 350-40 to determine which implementation costs to capitalize
as an asset and which costs to expense as incurred. Also, this guidance requires the entity to expense the
capitalized implementation costs of a hosting arrangement that is a service contract over the term of the
hosting arrangement. Further, the guidance requires the entity to present the expense related to the
capitalized implementation costs in the same line item in the consolidated statement of operations and
changes in net assets as the fees associated with the hosting element (service) of the arrangement and
classify payments for capitalized implementation costs in the consolidated statement of cash flows in the
same manner as payments made for fees associated with the hosting element. The entity is also required
to present the capitalized implementation costs in the consolidated balance sheet in the same line item that
a prepayment for the fees of the associated hosting arrangement would be presented. This guidance is
effective for the fiscal years and interim periods within those fiscal years beginning after December 15,
2020, early adoption is permitted. The System early adopted this guidance effective January 1, 2019, on a
prospective basis.
In June 2018, the FASB issued ASU 2018-08, Clarifying the Scope and the Accounting Guidance for
Contributions Received and Contributions Made. This guidance clarifies whether a transfer of assets is a
contribution or an exchange transaction and further clarifies how an entity determines whether a resource
provider is participating in an exchange transaction by evaluating whether the resource provider is receiving

15
commensurate value in return for the resources transferred. This standard was effective for the System
beginning January 1, 2019, on a modified prospective basis. This guidance did not have a material impact
on the System’s consolidated statement of operations and changes in net assets.
In November 2016, the FASB issued ASU 2016-18, Restricted Cash. This guidance will require restricted cash
and restricted cash equivalents to be included with cash and cash equivalents when reconciling the
beginning of period and end of period total amounts shown on the consolidated statement of cash flows.
This guidance is effective for the fiscal years and interim periods within those fiscal years beginning after
December 15, 2018. The System adopted this standard effective January 1, 2019. This guidance did not have
a material impact on the System’s consolidated statement of cash flows.
In August 2016, the FASB issued ASU 2016-15, Classification of Certain Cash Receipts and Cash Payments,
which amends guidance in Accounting Standards Codification (ASC) 230 on the classification of certain cash
receipts and payments in the statement of cash flows. This standard is effective for the System beginning
January 1, 2019. This guidance did not have a material impact on the System’s consolidated statement of
cash flows, with the primary change being the movement of certain distributions from equity method
investees from cash used in investing activities to cash flows from operations.
In February 2016, the FASB issued ASU 2016-02, Leases. This guidance introduces a lessee model that brings
most leases on to the balance sheet. The standard also aligns certain of the underlying principles of the new
lessor model with those in ASU 2014-09, the new revenue recognition standard. This standard was effective
for the System effective January 1, 2019, and was adopted using a modified retrospective approach.
The System recorded a right of use asset and right of use liability of approximately $425,000 due to the
adoption of this standard. This guidance did not have a material impact on the System’s consolidated
statement of operations and changes in net assets.
3. COMMUNITY BENEFIT
Community Benefit
The System provides health care services without charge to patients who meet the criteria of its charity care
policies. Charity care services are not reported as patient service revenue because payment is not
anticipated while the related costs to provide the health care are included in operating expenses. Charity
care is provided to patients who meet the criteria established under the applicable financial assistance
policy. Qualifying patients can receive up to 100% discounts from charges and extended payments plans.
The System’s cost of providing charity care for the nine months ended December 31, 2018, as determined
using total cost to charge ratios, was $101,192.
In addition to the provision of charity care, the System provides significant financial support to its
communities to sustain and improve health care services.

16
These activities include:
• The unreimbursed cost of providing care to patients covered by the Medicare and Medicaid programs.
• The cost of providing services, which are not self-sustaining, for which patient service revenues are less
than the costs required to provide the services. Such services benefit uninsured and low-income
patients, as well as the broader community, but are not expected to be financially self-supporting.
• Other community benefits include the unreimbursed costs of community benefits programs and
services for the general community, not solely for those demonstrating financial need, including the
unreimbursed cost of medical education, health education, immunizations for children, support groups,
health screenings and fairs.
4. REVENUE AND RECEIVABLES
Patient Service Revenue
Patient service revenue is reported at the amount that reflects the consideration to which the System
expects to be entitled in exchange for providing patient care. These amounts are due from patients, third-
party payors (including managed care payors and government programs) and others and include variable
consideration for retroactive revenue adjustments due to settlement of audits, reviews and investigations.
Generally, patients and third-party payors are billed shortly after discharge. Revenue is recognized as
performance obligations are satisfied.
Performance obligations are identified based on the nature of the services provided. Revenue associated
with performance obligations satisfied over time is recognized based on actual charges incurred in relation
to total expected (or actual) charges. Performance obligations satisfied over time relate to patients receiving
inpatient acute care services. The System measures the performance obligation from admission into the
hospital to the point when there are no further services required for the patient, which is generally the time
of discharge. For outpatient services, the performance obligation is satisfied as the patient simultaneously
receives and consumes the benefits provided as the services are performed. In the case of these outpatient
services, recognition of the obligation over time yields the same result as recognizing the obligation at a
point in time. Management believes this method provides a faithful depiction of the transfer of services
over the term of performance obligations based on the inputs needed to satisfy the obligations.
The System uses a portfolio approach to account for categories of patient contracts as a collective group
rather than recognizing revenue on an individual contract basis. The portfolios consist of major payor classes
for inpatient revenue and major payor classes and types of services provided for outpatient revenue. Based
on the historical collection trends and other analysis, the System believes that revenue recognized by
utilizing the portfolio approach approximates the revenue that would have been recognized if an individual
contract approach were used.

17
The System determines the transaction price, which involves significant estimates and judgment, based on
standard charges for goods and services provided, reduced by explicit and implicit price concessions,
including contractual adjustments provided to third-party payors, discounts provided to uninsured and
underinsured patients in accordance with policy and/or implicit price concessions based on the historical
collection experience of patient accounts. The System determines the transaction price associated with
services provided to patients who have third-party payor coverage based on reimbursement terms per
contractual agreements, discount policies and historical experience. For uninsured (and underinsured in the
case of Advocate) patients who do not qualify for charity care, the System determines the transaction price
associated with services on the basis of charges reduced by implicit price concessions. Implicit price
concessions included in the estimate of the transaction price are based on historical collection experience
for applicable patient portfolios. Patients who meet the System’s criteria for free care “charity” are provided
care without charge; such amounts are not reported as revenue. Subsequent changes to the estimate of
the transaction price are generally recorded as adjustments to patient service revenue in the period of the
change. Settlements with third-party payors for retroactive adjustments due to audits, reviews or
investigations are considered variable consideration and are included in the determination of the estimated
transaction price for providing patient care using the most likely outcome method. These settlements are
estimated based on the terms of the payment agreements with the payor, correspondence from the payor
and historical settlement activity, including an assessment to ensure that it is probable that a significant
reversal in the amount of cumulative revenue recognized will not occur when the uncertainty associated
with the retroactive adjustment is subsequently resolved. Estimated settlements are adjusted in future
periods as new information becomes available or as years are settled or are no longer subject to such audits,
reviews and investigations.
For the nine months ended December 31, 2018, changes in the System’s estimates of implicit price
concessions, discounts and contractual adjustments or other reductions to expected payments for
performance obligations in prior years were not significant.
In certain instances, the System does receive payment in advance of the services provided and would
consider these amounts to represent contract liabilities. Contract liabilities at December 31, 2018 were not
significant.
Currently, the state of Illinois utilizes supplemental reimbursement programs to supplement reimbursement
to providers to offset a portion of the cost of providing care to Medicaid and indigent patients. These
programs are designed with input from the Centers for Medicare and Medicaid Services and are funded
with a combination of state and federal resources, including assessments levied on the providers. Under
these supplemental programs, the System recognizes revenue and related expenses in the period in which
amounts are estimable and collection is reasonably assured. Reimbursement under these programs is
reflected in patient service revenue and the assessment is reflected in other expense in the consolidated
statement of operations and changes in net assets. For the nine months ended December 31, 2018, patient
service revenue includes $197,614 related to this program and expenses include $124,898 of tax assessment
fees.

18
The state of Wisconsin assesses a fee or tax on patient service revenue. The revenues from this assessment
are used to increase payments made to hospitals for services provided to Medicaid and other medically
indigent patients. The System’s patient service revenue reflects this increase in payment for services to
Medicaid and other medically indigent patients and hospital tax assessment expense reflects the fees
assessed by the state. For the nine months ended December 31, 2018, patient service revenue includes
$79,600, related to this program, and other expenses include $73,800 of tax assessment fees.
The System has filed formal appeals relating to the settlement of certain prior-year Medicare cost reports.
The outcome of these appeals cannot be determined at this time.
Management has determined that the nature, amount, timing, and uncertainty of revenue and cash flows
are affected by the payors geographical location, the line of business that renders services to patients and
the timing of when revenue is recognized and billed. The composition of patient service revenue by payor
for the nine months ended December 31, 2018, is as follows:
Managed care $ 4,232,627 56 % Medicare 2,269,578 30 Medicaid – Wisconsin 299,951 4 Medicaid – Illinois 529,780 7 Self-pay and other 201,532 3
$ 7,533,468 100 %
Deductibles, copayments and coinsurance under third-party payment programs which are the patient's
responsibility are included within the primary payor category in the table above.
The composition of patient service revenue by service line and state for the nine months ended
December 31, 2018, is as follows:
Wisconsin Illinois
Patient Service
Revenue Percent of
Total
Hospital $ 2,679,106 $ 2,927,812 $ 5,606,918 75 % Clinic 1,235,242 433,896 1,669,138 22 Home Health 88,529 79,310 167,839 2 Other 22,898 66,675 89,573 1 Total $ 4,025,775 $ 3,507,693 $ 7,533,468 100 %
Capitation Revenue
The System has agreements with various managed care organizations under which the System provides or
arranges for medical care to members of the organizations in return for a monthly payment per member.
Revenue is earned each month as a result of agreeing to provide or arrange for their medical care.
Substantially all of the System’s capitation revenue is generated in Illinois.
19
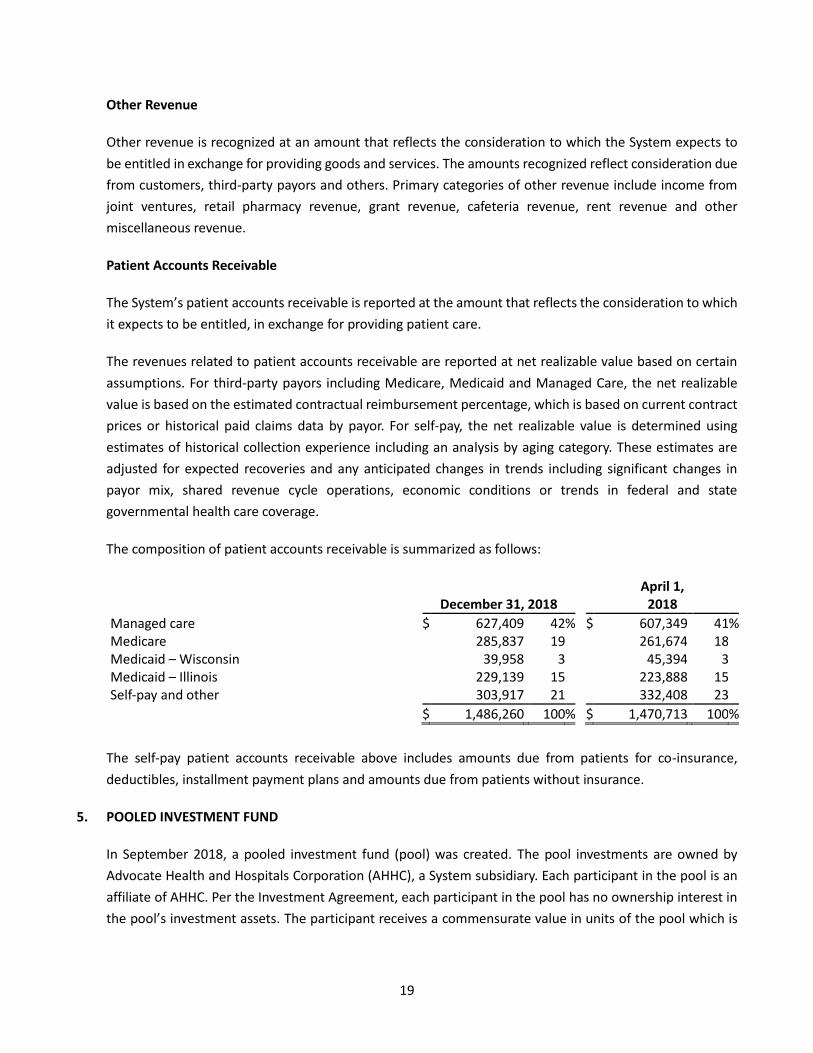
Other Revenue
Other revenue is recognized at an amount that reflects the consideration to which the System expects to
be entitled in exchange for providing goods and services. The amounts recognized reflect consideration due
from customers, third-party payors and others. Primary categories of other revenue include income from
joint ventures, retail pharmacy revenue, grant revenue, cafeteria revenue, rent revenue and other
miscellaneous revenue.
Patient Accounts Receivable
The System’s patient accounts receivable is reported at the amount that reflects the consideration to which
it expects to be entitled, in exchange for providing patient care.
The revenues related to patient accounts receivable are reported at net realizable value based on certain
assumptions. For third-party payors including Medicare, Medicaid and Managed Care, the net realizable
value is based on the estimated contractual reimbursement percentage, which is based on current contract
prices or historical paid claims data by payor. For self-pay, the net realizable value is determined using
estimates of historical collection experience including an analysis by aging category. These estimates are
adjusted for expected recoveries and any anticipated changes in trends including significant changes in
payor mix, shared revenue cycle operations, economic conditions or trends in federal and state
governmental health care coverage.
The composition of patient accounts receivable is summarized as follows:
December 31, 2018 April 1,
2018
Managed care $ 627,409 42 % $ 607,349 41 % Medicare 285,837 19 261,674 18 Medicaid – Wisconsin 39,958 3 45,394 3 Medicaid – Illinois 229,139 15 223,888 15 Self-pay and other 303,917 21 332,408 23
$ 1,486,260 100 % $ 1,470,713 100 %
The self-pay patient accounts receivable above includes amounts due from patients for co-insurance,
deductibles, installment payment plans and amounts due from patients without insurance.
5. POOLED INVESTMENT FUND
In September 2018, a pooled investment fund (pool) was created. The pool investments are owned by
Advocate Health and Hospitals Corporation (AHHC), a System subsidiary. Each participant in the pool is an
affiliate of AHHC. Per the Investment Agreement, each participant in the pool has no ownership interest in
the pool’s investment assets. The participant receives a commensurate value in units of the pool which is

20
adjusted each month to the current market value. If redemption is sought under the terms of the
agreement, the participant is only entitled to receive the fair market value of its units in cash.
At December 31, 2018, the total value of the pool investments is $7,483,361. The pool invests in a diversified
portfolio of investments, including alternative investments, such as real asset funds, hedge funds and
private equity limited partnerships. Collectively, these funds have liquidity terms ranging from daily to
annual with notice periods typically ranging from 1 to 90 days. Due to redemption restrictions, investments
in certain of these funds, whose fair value was approximately $3,685,071 at December 31, 2018, cannot
currently be redeemed for periods ranging from one to eleven years. However, the potential for the pool to
sell its interest in these funds in a secondary market prior to the end of the fund term does exist, for prices
at or other than the then carrying value.
At December 31, 2018, the System had additional commitments to fund alternative investments, including
recallable distributions of $1,043,005 over the next seven years.
In the normal course of operations and within established investment policy guidelines, the System may
enter into various exchange-traded and over-the-counter derivative contracts for trading purposes,
including futures, options and forward contracts. These instruments are used primarily to maintain the
System’s strategic asset allocation. These instruments require the System to deposit cash collateral with the
broker or custodian. At December 31, 2018, the collateral provided was $44,560. At December 31, 2018,
the notional value of the derivatives in long positions was $190,305 and those in a short position was
$(129,391).
By using derivative financial instruments, the System exposes itself to credit risk and market risk. Credit risk
is the failure of the counterparty to perform under the terms of the derivative contracts. When the fair value
of a derivative contract is positive, the counterparty owes the System, which creates credit risk for the
System. When the fair value of a derivative contract is negative, the System owes the counterparty, and
therefore, it does not possess credit risk. The System minimizes the credit risk in derivative instruments by
entering into transactions that may require the counterparty to post collateral for the benefit of the System
based on the credit rating of the counterparty and the fair value of the derivative contract. Market risk is
the adverse effect on the value of a financial instrument that results from a change in the underlying
reference security. The market risk associated with market changes is managed by establishing and
monitoring parameters that limit the types and degree of market risk that may be undertaken.
Receivables and payables for investment trades not settled are presented with other current assets and
accounts payable and accrued liabilities. Unsettled sales resulted in receivables due from brokers of $37,699
at December 31, 2018. Unsettled purchases resulted in payables of $13,494 at December 31, 2018.

21
6. CASH AND CASH EQUIVALENTS AND INVESTMENTS (including assets limited as to use)
Investments (including assets limited as to use) and other financial instruments at December 31, 2018, are
summarized as follows:
Assets limited as to use:
Internally designated for capital and other $ 6,941,646
Held for self-insurance 738,616
Donor restricted 119,759
Investments under securities lending program 18,310
7,818,331
Other financial instruments:
Cash and cash equivalents 584,887
$ 8,403,218
The composition and carrying value of assets limited as to use, investments and cash and cash equivalents
at December 31, 2018, are set forth in the following table:
Cash and short-term investments $ 807,549
Corporate bonds and other debt securities 577,406
United states governmental obligations 609,160
Non-governmental fixed-income obligations 26,328
Bond and other debt security funds 578,088
Hedge funds 2,593,506
Private equity limited partnerships 1,113,544
Equity securities 1,164,533
Equity funds 933,104
$ 8,403,218
Investment returns for assets limited as to use and cash and cash equivalents are comprised of the following
for the nine months ended December 31, 2018:
Interest income and dividends $ 55,944
Income from alternative investments 19,556
Net realized gains 156,757
Net unrealized losses (474,189 )
Total $ (241,932 )

22
Investment returns are included in the consolidated statement of operations and changes in net assets as
follows for the nine months ended December 31, 2018:
Other revenue $ 18,533
Investment loss, net (258,118 )
Net assets with donor restrictions (2,347 )
Total $ (241,932 )
As part of the management of the investment portfolio, the System has entered into an arrangement
whereby securities owned by the System are loaned primarily to brokers and investment banks. The loans
are arranged through a bank. Borrowers are required to post collateral for securities borrowed equal to no
less than 102% of the value of the security on a daily basis, at a minimum. The bank is responsible for
reviewing the creditworthiness of the borrowers. The System has also entered into an arrangement
whereby the bank is responsible for the risk of borrower bankruptcy and default. At December 31, 2018,
the System loaned $18,310 in securities and accepted collateral for these loans in the amount $18,869,
which represents cash and governmental securities and are included in current liabilities and current assets,
respectively, in the accompanying consolidated balance sheet.
7. FAIR VALUE
The System accounts for certain assets and liabilities at fair value and categorizes assets and liabilities
measured at fair value in the consolidated financial statements based upon whether the inputs used to
determine their fair values are observable or unobservable. Observable inputs are inputs which are based
on market data obtained from sources independent of the reporting entity. Unobservable inputs are inputs
that reflect the reporting entity’s own assumptions about pricing the asset or liability, based on the best
information available under the circumstances.
The fair value of all assets and liabilities recognized or disclosed at fair value is classified based on the lowest
level of significant inputs. Assets and liabilities that are measured at fair value are disclosed and classified
in one of three categories. Category inputs are defined as follows:
Level 1 — Quoted prices (unadjusted) in active markets for identical assets or liabilities on the reporting
date.
Level 2 — Inputs other than quoted market prices included in Level 1 that are observable for the asset or
liability, either directly or indirectly. If the asset or liability has a specified (contractual) term, a Level 2 input
must be observable for substantially the full term of the asset or liability.
Level 3 — Inputs that are unobservable for the asset or liability for which there is little or no market data.
23
The following section describes the valuation methodologies used by the System to measure financial assets
and liabilities at fair value. In general, where applicable, the System uses quoted prices in active markets for
identical assets and liabilities to determine fair value. This pricing methodology applies to Level 1
investments such as domestic and international equities, exchange-traded funds and agency securities.
If quoted prices in active markets for identical assets and liabilities are not available to determine fair value,
then quoted prices for similar assets and liabilities or inputs other than quoted prices that are observable
either directly or indirectly are used. These investments are included in Level 2 and consist primarily of
corporate notes and bonds, foreign government bonds, mortgage-backed securities, fixed-income
securities, including fixed-income government obligations, commercial paper and certain agency, United
States and international equities, which are not traded on an active exchange. The fair value for the
obligations under swap agreements included in Level 2 is estimated using industry standard valuation
models. These models project future cash flows and discount the future amounts to a present value using
market-based observable inputs, including interest rate curves. The fair values of the obligation under swap
agreements include adjustments related to the System’s credit risk.
Investments owned by the System are exposed to various kinds and levels of risk. Equity securities and
equity funds expose the entity to market risk, performance risk and liquidity risk for both domestic and
international investments. Market risk is the risk associated with major movements of the equity markets.
Performance risk is that risk associated with a company’s operating performance. Fixed-income securities
and fixed-income mutual funds expose the System to interest rate risk, credit risk and liquidity risk. As
interest rates change, the value of many fixed-income securities is affected, including those with fixed
interest rates. Credit risk is the risk that the obligor of the security will not fulfill its obligations. Liquidity risk
is affected by the willingness of market participants to buy and sell particular securities. Liquidity risk tends
to be higher for equities related to small capitalization companies and certain alternative investments. Due
to the volatility in the capital markets, there is a reasonable possibility of subsequent changes in fair value
resulting in additional gains and losses in the near term.
The carrying values of cash and cash equivalents, accounts receivable and payable, other current assets and
accrued liabilities are reasonable estimates of their fair values due to the short-term nature of these
financial instruments.

24
The fair values of financial assets and liabilities that are measured at fair value on a recurring basis at
December 31, 2018, are as follows:
December 31, 2018
Quoted Prices in Active
Markets for Identical
Assets (Level 1)
Other Significant Observable
Inputs (Level 2)
Significant Unobservable
Inputs (Level 3)
Assets
Investments
Cash and short-term investments $ 807,549 $ 430,889 $ 376,660 $ —
Corporate bonds and other debt securities 577,406 — 577,406 —
United States government obligations 609,160 — 609,160 —
Bond and other debt security funds 578,088 102,552 475,536 —
Non-government fixed-income obligations 26,328 — 26,328 —
Equity securities 1,164,533 1,164,533 — —
Equity funds 933,104 185,247 747,857 —
4,696,168 $ 1,883,221 $ 2,812,947 —
Investments at net asset value
Hedge funds 2,593,506
Private equity limited partnerships 1,113,544
Total investments $ 8,403,218
Collateral proceeds received under
securities lending program $ 18,869 $ 18,869
Liabilities
Obligations under swap agreements $ (65,376 ) $ (65,376 )
Obligations to return capital under
securities lending program $ (18,869 ) $ (18,869 )

25
8. PROPERTY AND EQUIPMENT, NET
The components of property and equipment at December 31, 2018, are summarized as follows:
Land and improvements $ 473,862 Buildings and fixed equipment 7,102,622 Movable equipment and computer software 2,956,722 Construction-in-progress 306,531
Total property and equipment 10,839,737
Accumulated depreciation and amortization (5,213,262 )
Property and equipment, net $ 5,626,475
Property and equipment include net assets under capitalized leases and other financing arrangements
totaling $157,452 (gross of $232,971, accumulated amortization of $75,519) at December 31, 2018.
For the nine months ending December 31, 2018, depreciation expense was $409,950.
9. INVESTMENTS IN UNCONSOLIDATED ENTITIES
The System has a 49% interest in Bay Area Medical Center (BAMC), a 99-bed general acute care hospital
located in Marinette, Wisconsin. The System’s investment in BAMC is accounted for under the equity
method of accounting and is presented within investments in unconsolidated entities in the accompanying
consolidated balance sheet. The System’s investment in BAMC at December 31, 2018, was $26,547. In
January 2019, the System entered into an agreement to acquire the remaining 51% interest in BAMC. See
additional discussion of this transaction in Note 21. SUBSEQUENT EVENTS.
The System has a 27% interest in Aurora Bay Area Medical Group (ABAMG), which provides inpatient,
outpatient and other necessary professional medical services in Marinette, Wisconsin and its surrounding
communities. BAMC owns the remaining 73% of ABAMG. The System’s investment in ABAMG is accounted
for under the equity method and is presented within investments in unconsolidated entities in the
accompanying consolidated balance sheet. The System leases employees and buildings to ABAMG and
recognized $12,888 of other revenue for the nine months ended December 31, 2018, under these leasing
agreements. The System made additional capital contributions to ABAMG of $4,361 during the nine months
ended December 31, 2018. The System’s investment in ABAMG was $703 at December 31, 2018.
In connection with the acquisition of a medical center, the System acquired an interest in the net assets of
the Masonic Family Health Foundation (MFHF), an independent organization, under the terms of an asset
purchase agreement (the Agreement). The use of substantially all MFHF’s net assets are designated to
support the operations and/or capital needs of one of the System’s medical facilities. Additionally, 90% of
MFHF’s investment yield, net of expenses, on substantially all MFHF’s investments is designated for the

26
support of one of the System’s medical facilities. MFHF must pay the System, annually, 90% of the
investment yield or an agreed-upon percentage of the beginning of the year net assets.
The interest in the net assets of MFHF amounted to $81,865 at December 31, 2018, and is presented within
investments in unconsolidated entities in the accompanying consolidated balance sheet. The System’s
interest in the investment income is reflected in the consolidated statement of operations and changes in
net assets and amounted to $(4,270) for the nine months ended December 31, 2018. There were no cash
distributions received by the System from MFHF under terms of the Agreement during the nine months
ended December 31, 2018. In addition, MFHF made $354 in contributions to the System for program
support during the nine months ended December 31, 2018.
At December 31, 2018, the System had a 49.5% ownership interest in RML Health Providers, L.P. (RML) that
is accounted for on an equity basis. RML is an Illinois, not-for-profit limited partnership that operates a 115-
bed licensed long-term acute care hospital in Hinsdale, Illinois, and 86-bed licensed long-term acute care
hospital in Chicago, Illinois. The System’s investment in RML was $33,883 at December 31, 2018, and is
presented within investments in unconsolidated entities in the accompanying consolidated balance sheet.
RML leases the Chicago, Illinois, facility from the System. The lease has a fixed term through June 30, 2020,
with a five-year renewal term remaining executable at the option of RML. The System recorded rental
income of $847 for the nine months ended December 31, 2018.
The summarized financial position and results of operations for significant entities accounted for under the
equity method as of and for the periods ended December 31, 2018, is as follows:
BAMC ABAMG RML MFHF
Total assets $ 232,239 $ 4,898 $ 125,087 $ 85,533
Total liabilities 106,444 2,294 56,994 3,440
Equity 125,795 2,604 68,093 82,093
Total revenue 80,715 17,091 83,208 (3,075 )
Net income (loss) 13,478 (14,942 ) 11,400 (5,265 )
10. LONG-TERM DEBT
Long-term debt, net of unamortized original issue discount or premium and unamortized deferred bond
issuance costs, consisted of the following at December 31, 2018:
Revenue bonds and revenue refunding bonds:
Series 2003A (weighted average rate of 1.38% during the nine-month period ended December 31, 2018), principal payable in varying annual installments through November 2022; interest based on prevailing market conditions at time of remarketing $ 10,153

27
Series 2003C (weighted average rate of 1.60% during the nine-month period ended December 31, 2018), principal payable in varying annual installments through November 2022; interest based on prevailing market conditions at time of remarketing 10,169
Series 2008A (weighted average rate of 5.00% during the nine-month period ended December 31, 2018), principal payable in varying annual installments through November 2030; interest based on prevailing market conditions at time of remarketing 123,078
Series 2008C (weighted average rate of 1.43% during the nine-month period ended December 31, 2018), principal payable in varying annual installments through November 2038; interest based on prevailing market conditions at time of remarketing 320,718
Series 2010D, 5.00%, principal payable in annual installments through April 2019 15,014
Series 2011A, 4.00% to 5.00%, principal payable in annual installments through April 2041 32,378
Series 2011B (weighted average rate of 1.78% during the nine-month period ended December 31, 2018), principal payable in varying annual installments through April 2051, subject to a put provision that provides for a cumulative seven-month notice and remarketing period; interest tied to a market index plus a spread 69,274
Series 2011C (weighted average rate of 2.31% during the nine-month period ended December 31, 2018), principal payable in varying annual installments through April 2049, subject to a put provision on September 3, 2024; interest tied to a market index plus a spread 49,722
Series 2011D (weighted average rate of 2.31% during the nine-month period ended December 31, 2018), principal payable in varying annual installments through April 2049, subject to a put provision on September 3, 2024; interest tied to a market index plus a spread 49,722
Series 2012, 4.00% to 5.00%, principal payable in varying annual installments through June 2047 147,826
Series 2013A, 5.00%, principal payable in varying annual installments through June 2031 93,356
Series 2014, 4.00% to 5.00%, principal payable in varying annual installments through August 2038 330,682
Series 2015, 4.13% to 5.00%, principal payable in varying annual installments through May 2045 102,705
Series 2015B, 4.00% to 5.00%, principal payable in varying annual installments through May 2044 72,428
Series 2018A, 4.00% to 5.00%, principal payable in varying annual installments through August 2044 106,345
Series 2018B (weighted average rate of 5.00% during the period August 16, 2018 through December 31, 2018), principal payable in varying annual installments through August 2054; interest based on prevailing market conditions at time of remarketing 211,196

28
Series 2018C (weighted average rate of 2.09% during the period August 16,2018 through December 31, 2018), principal payable in varying annual installments through August 2054; interest tied to a market index plus a spread 198,182
1,942,948
Taxable bonds:
Taxable Bond Series 2018, 3.83% to 4.27%, principal payable in varying annual installments through August 2048 709,392
709,392
Capital lease obligations and financing arrangements 241,677
Taxable Term Loan, (weighted average rate of 2.61% during the nine-month period ended December 31, 2018), principal payable in varying annual installments through September 2024 114,841
3,008,858
Less amounts classified as current:
Current portion of long-term debt (49,927 )
Long-term debt subject to short-term financing arrangements (162,025 )
(211,952 )
$ 2,796,906
Maturities of long-term debt, capital leases, and sinking fund requirements, assuming remarketing of the
variable rate demand revenue refunding bonds, for the five years ending December 31, 2023, are as follows:
2019 – $49,927; 2020 – $53,631; 2021 – $53,333; 2022 – $56,603; and 2023 – $58,164.
The System’s outstanding bonds are secured by obligations issued under the Second Amended and Restated
Master Trust Indenture dated as of August 1, 2018, as the same may be amended from time to time,
between Advocate Aurora Health, Inc., the other affiliates identified therein as the Members of the
Obligated Group and U.S. Bank National Association, as master trustee (the System Master Indenture).
Under the terms of the bond indentures and other arrangements, various amounts are to be on deposit
with trustees, and certain specified payments are required for bond redemption and interest payments. The
System Master Indenture and other debt agreements, including a bank credit agreement, also place
restrictions on the System and require the System to maintain certain financial ratios.
The System’s unsecured variable rate revenue bonds, Series 2008A-3 of $42,795 and Series 2011B of
$70,000, while subject to a long-term amortization period, may be put to the System at the option of the
bondholders in connection with certain remarketing dates. To the extent that bondholders may, under the
terms of the debt, put their bonds within 12 months after December 31, 2018, the principal amount of such

29
bonds has been classified as a current obligation in the accompanying consolidated balance sheet.
Management believes the likelihood of a material amount of bonds being put to the System is remote.
However, to address this possibility, the System has taken steps to provide various sources of liquidity,
including assessing alternate sources of financing, including lines of credit and/or net assets without donor
restrictions as a source of self-liquidity.
The System has standby bond purchase agreements with banks to provide liquidity support for substantially
all of the Series 2008C Bonds. In the event of a failed remarketing of the supported Series 2008C Bond upon
its tender by an existing holder and subject to compliance with the terms of the standby bond purchase
agreement, the standby bank would provide the funds for the purchase of such tendered bonds, and the
System would be obligated to repay the bank for the funds it provided for such bond purchase (if such bond
is not subsequently remarketed), with the first installment of such repayment commencing on the date one
year and one day after the bank purchases the bond. As of December 31, 2018, there were no bank-
purchased bonds outstanding. To the extent that the standby bond purchase agreement expiration date is
within 12 months after December 31, 2018, the principal amount of such bonds has been classified as a
current obligation in the accompanying consolidated balance sheet. The standby bond purchase
agreements expire as follows: $49,829 in August 2019; $129,456 in August 2020; and $145,919 in August
2021.
In August 2018, the Wisconsin Health and Educational Facilities Authority (WHEFA), for the benefit of the
System, issued its Revenue Bonds, Series 2018ABC, in the amount of $487,895 and the System issued
Taxable Bonds, Series 2018 in the amount of $714,500. The proceeds of the Series 2018ABC Bonds and the
Series 2018 Taxable Bonds were used to refund certain WHEFA Bonds previously issued for the benefit of
Aurora, refinance Aurora’s taxable bonds, the drawn portion of an Aurora line of credit and to pay certain
financing costs. In connection with this transaction, the System recognized a loss on refinancing in the
amount of $29,859.
The System maintains an interest rate swap program on certain of its variable rate debt as described in Note
11. INTEREST RATE SWAP PROGRAM.
The System's interest paid, net of capitalized interest, amounted to $80,559 for the nine months ended
December 31, 2018. The System capitalized interest of $1,207 for the nine months ended December 31,
2018.
At December 31, 2018, the System had lines of credit with banks aggregating to $585,000. These lines of
credit provide for various interest rates and payment terms and expire as follows: $100,000 in December
2019, $275,000 in August 2020, $50,000 in September 2020 and $160,000 in August 2021. These lines of
credit may be used to redeem bonded indebtedness, to pay costs related to such redemptions, for capital
expenditures or for general working capital purposes. At December 31, 2018, under a line of credit there
were three letters of credit issued totaling $40,947. At December 31, 2018, no amounts were outstanding
on these lines or letters of credit.

30
11. INTEREST RATE SWAP PROGRAM
The System has interest rate-related derivative instruments to manage exposure of its variable rate debt
instruments. By using derivative financial instruments to manage the risk of changes in interest rates, the
System exposes itself to credit risk and market risk. Credit risk is the failure of the counterparty to perform
under the terms of the derivative contracts. When the fair value of a derivative contract is positive, the
counterparty owes the System, which creates credit risk for the System. When the fair value of a derivative
contract is negative, the System owes the counterparty, and therefore, it does not possess credit risk. The
System minimizes the credit risk in derivative instruments by entering into transactions that may require
the counterparty to post collateral for the benefit of the System based on the credit rating of the
counterparty and the fair value of the derivative contract. Market risk is the adverse effect on the value of
a financial instrument that results from a change in interest rates. The market risk associated with interest
rate changes is managed by establishing and monitoring parameters that limit the types and degree of
market risk that may be undertaken. The System also mitigates risk through periodic reviews of its derivative
positions in the context of its total blended cost of capital.
At December 31, 2018, the System maintains an interest rate swap program on its Series 2008C variable
rate demand revenue bonds. These bonds expose the System to variability in interest payments due to
changes in interest rates. The System believes that it is prudent to limit the variability of its interest
payments. To meet this objective and to take advantage of low interest rates, the System entered into
various interest rate swap agreements to manage fluctuations in cash flows resulting from interest rate risk.
These swaps convert the variable rate cash flow exposure on the variable rate demand revenue bonds to
synthetically fixed cash flows. The notional amount under each interest rate swap agreement is reduced
over the term of the respective agreement to correspond with reductions in the principal outstanding under
various bond series. The following is a summary of the outstanding positions under these interest rate swap
agreements at December 31, 2018:
Bond Series Notional Amount Maturity Date Rate Received Rate Paid
2008C-1 $ 129,900 November 1, 2038 61.7% of LIBOR + 26 bps 3.605 %
2008C-2 108,425 November 1, 2038 61.7% of LIBOR + 26 bps 3.605 %
2008C-3 88,000 November 1, 2038 61.7% of LIBOR + 26 bps 3.605 %
The swaps are not designated as hedging instruments, and therefore, hedge accounting has not been
applied. As such, unrealized changes in fair value of the swaps are classified as changes in fair value of
interest rate swaps in the consolidated statement of operations and changes in net assets. The net cash
settlement payments, representing the realized changes in fair value of the swaps, are included as interest
expense in the consolidated statement of operations and changes in net assets.
The fair value of the interest rate swap agreements was a liability of $65,376 and no collateral was posted
under these swap agreements at December 31, 2018.

31
Amounts recorded in the consolidated statement of operations and changes in net assets for the swap
agreements for the nine months ended December 31, 2018, are as follows:
Net cash payments on interest rate swap agreements (interest expense) $ 4,850
Change in fair value of interest rate swaps $ 993
The interest rate swap instruments contain provisions that require the System to maintain an investment
grade credit rating on its tax-exempt bonds from certain major credit rating agencies. If the System’s tax-
exempt bonds were to fall below investment grade on the valuation date, it would be in violation of these
provisions and the counterparty to the derivative instruments could request immediate payment or demand
immediate and ongoing full overnight collateralization on derivative instruments in net liability positions.
12. RETIREMENT PLANS
The System maintains various employee retirement benefit plans available to qualifying employees and
retirees.
Advocate maintains defined benefit pension plans that cover substantially all its employees. The
consolidated balance sheet contains an other noncurrent liability related to the Advocate Health Care
Network Pension Plan (Advocate Plan) totaling $45,570 at December 31, 2018. In addition, the consolidated
balance sheet contains an other noncurrent asset related to the Condell Health Network Retirement Plan
(Condell Plan) of $1,424 at December 31, 2018. The Condell Plan was frozen effective January 1, 2008, to
new participants and participants ceased to accrue additional pension benefits. During the nine months
ended December 31, 2018, no contributions were made to the Advocate or Condell Plans.
The consolidated balance sheet contains an other noncurrent liability related to the Aurora defined benefit
pension plan (Aurora Plan) of $104,979 at December 31, 2018. The Aurora Plan covers substantially all of
its employees, hired before January 1, 2013, with at least 1,000 hours of work in a calendar year. The Aurora
Plan was frozen on December 31, 2012. During the nine months ended December 31, 2018, cash
contributions of $22,200 were made to the Aurora Plan.

32
A summary of changes in the plan assets, projected benefit obligation and the resulting funded status of
the plans for the nine months ended December 31, 2018, is as follows:
Advocate Condell Aurora Total
Change in plan assets:
Plan assets at fair value at beginning of period $ 1,008,843 $ 66,731 $ 1,511,225 $ 2,586,799
Actual return on plan assets (23,256 ) (3,956 ) (119,447 ) (146,659 )
Employer contributions — — 22,200 22,200
Benefits paid (56,222 ) (4,545 ) (86,612 ) (147,379 )
Plan assets at fair value at end of period $ 929,365 $ 58,230 $ 1,327,366 $ 2,314,961
Change in projected benefit obligation:
Projected benefit obligation at beginning of period $ 960,935 $ 70,993 $ 1,622,605 $ 2,654,533
Service cost 41,279 — — 41,279
Interest cost 26,332 1,877 45,375 73,584
Actuarial loss (gain) 2,611 (11,520 ) (149,023 ) (157,932 )
Benefits paid (56,222 ) (4,544 ) (86,612 ) (147,378 )
Projected benefit obligation at end of period $ 974,935 $ 56,806 $ 1,432,345 $ 2,464,086
Plan assets (less) greater than projected benefit obligation $ (45,570 ) $ 1,424 $ (104,979 ) $ (149,125 )
Accumulated benefit obligation at end of period $ 907,526 $ 56,806 $ 1,432,345 $ 2,396,677
The Condell Plan paid lump sums totaling $3,854 in 2018. The amount in 2018 was greater than the sum of
the Condell Plan’s service cost and interest cost resulting in a settlement charge in the amount of $787.
Pension plan expense (income) included in the consolidated statement of operations and changes in net
assets is as follows for the nine months ended December 31, 2018:
Advocate Condell Aurora Total
Service cost $ 41,279 $ — $ — $ 41,279
Interest cost 26,332 1,877 45,375 73,584
Expected return on plan assets (49,884 ) (2,124 ) (57,426 ) (109,434 )
Amortization of:
Actuarial loss 3,974 1,259 8,816 14,049
Prior service cost (2,987 ) — 2 (2,985 )
Settlement/curtailment — 787 — 787
Net pension expense (income) $ 18,714 $ 1,799 $ (3,233 ) $ 17,280
The components of net periodic benefit costs other than the service cost component are included in other
nonoperating income, net in the consolidated statement of operations and changes in net assets.
33
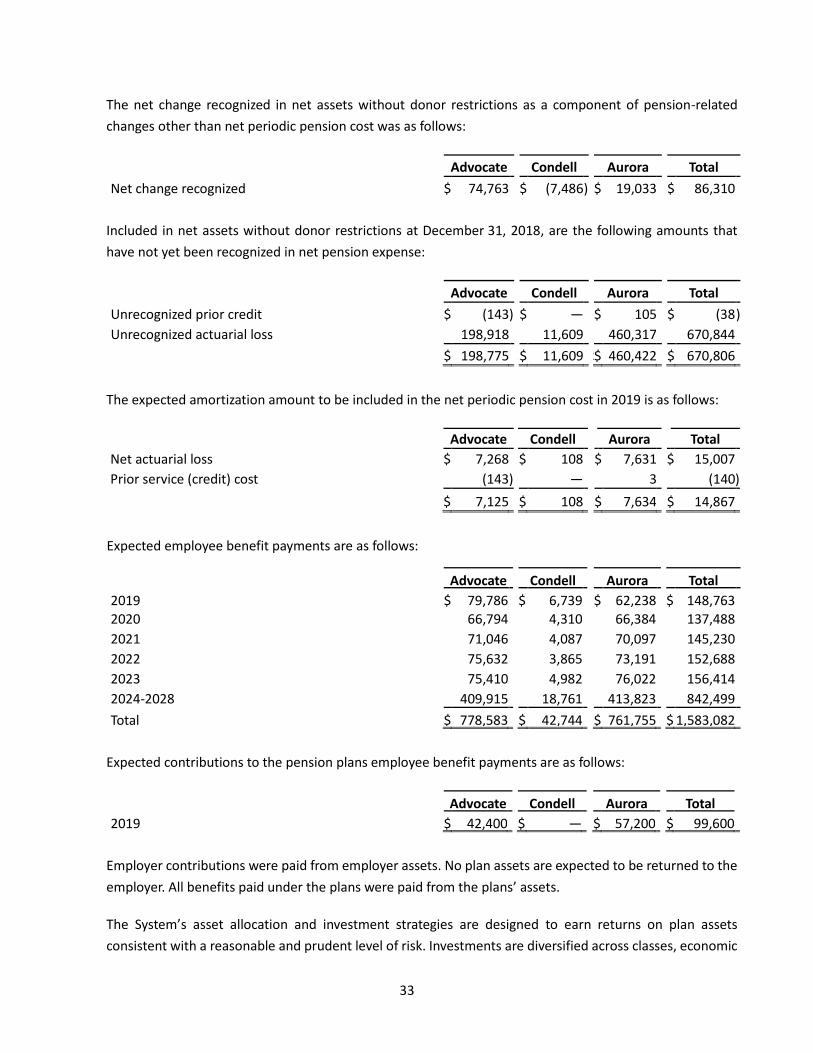
The net change recognized in net assets without donor restrictions as a component of pension-related
changes other than net periodic pension cost was as follows:
Advocate Condell Aurora Total
Net change recognized $ 74,763 $ (7,486 ) $ 19,033 $ 86,310
Included in net assets without donor restrictions at December 31, 2018, are the following amounts that
have not yet been recognized in net pension expense:
Advocate Condell Aurora Total
Unrecognized prior credit $ (143 ) $ — $ 105 $ (38 )
Unrecognized actuarial loss 198,918 11,609 460,317 670,844
$ 198,775 $ $ 11,609 $ $ 460,422 $ 670,806
The expected amortization amount to be included in the net periodic pension cost in 2019 is as follows:
Advocate Condell Aurora Total
Net actuarial loss $ 7,268 $ 108 $ 7,631 $ 15,007
Prior service (credit) cost (143 ) — 3 (140 )
$ 7,125 $ 108 $ 7,634 $ 14,867
Expected employee benefit payments are as follows:
Advocate Condell Aurora Total
2019 $ 79,786 $ 6,739 $ 62,238 $ 148,763
2020 66,794 4,310 66,384 137,488
2021 71,046 4,087 70,097 145,230
2022 75,632 3,865 73,191 152,688
2023 75,410 4,982 76,022 156,414
2024-2028 409,915 18,761 413,823 842,499
Total $ 778,583 $ 42,744 $ 761,755 $ 1,583,082
Expected contributions to the pension plans employee benefit payments are as follows:
Advocate Condell Aurora Total
2019 $ 42,400 $ — $ 57,200 $ 99,600
Employer contributions were paid from employer assets. No plan assets are expected to be returned to the
employer. All benefits paid under the plans were paid from the plans’ assets.
The System’s asset allocation and investment strategies are designed to earn returns on plan assets
consistent with a reasonable and prudent level of risk. Investments are diversified across classes, economic

34
sectors and manager style to minimize the risk of loss. The System utilizes investment managers specializing
in each asset category and, where appropriate, provides the investment manager with specific guidelines
that include allowable and/or prohibited investment types. The System regularly monitors manager
performance and compliance with investment guidelines.
The System’s target and actual pension asset allocations for the plans at December 31, 2018, are as follows:
Asset Category – Advocate Plan Target Actual
Domestic and international equity securities 35 % 34 %
Alternative investments 45 46
Cash and fixed-income securities 20 20
100 % 100 %
Asset Category – Condell Plan Target Actual
Domestic and international equity securities 15 % 15 %
Cash and fixed-income securities 85 85
100 % 100 %
Asset Category – Aurora Plan Target Actual
Domestic and international equity securities 33 % 33 %
Real estate 3 3
Cash and fixed-income securities 64 64
100 % 100 %
At December 31, 2018, the Advocate Plan had commitments to fund private equity limited partnerships,
including recallable distributions of $107,305 over the next six years.
In the normal course of operations and within established investment policy guidelines, the Advocate Plan
may enter into various exchange-traded and over-the-counter derivative contracts for trading purposes,
including futures, options and forward contracts. These instruments are used primarily to maintain the
Advocate Plan’s strategic asset allocation. These instruments require the Advocate Plan to deposit cash
collateral with the broker or custodian.
At December 31, 2018, the collateral provided was as follows:
Advocate Aurora Total
Collateral provided $ 6,239 $ 10,357 $ 16,596
Notional value – long position 45,061 65,053 110,114
Notional value – short position (2,610 ) (46,656 ) (49,266 )
35
By using derivative financial instruments, the System exposes itself to credit risk and market risk. Credit risk
is the failure of the counterparty to perform under the terms of the derivative contracts. When the fair value
of a derivative contract is positive, the counterparty owes the System, which creates credit risk for the
System. When the fair value of a derivative contract is negative, the System owes the counterparty, and
therefore, it does not possess credit risk. The System minimizes the credit risk in derivative instruments by
entering into transactions that may require the counterparty to post collateral for the benefit of the System
based on the credit rating of the counterparty and the fair value of the derivative contract. Market risk is
the adverse effect on the value of a financial instrument that results from a change in the underlying
reference security. The market risk associated with market changes is managed by establishing and
monitoring parameters that limit the types and degree of market risk that may be undertaken.
Receivables and payables for investment trades not settled are presented within Advocate Plan assets.
Unsettled sales resulted in receivables due from brokers of $4,105 at December 31, 2018. Unsettled
purchases resulted in payables of $9,825 at December 31, 2018.
Receivables and payables for investment trades not settled are presented within Aurora Plan assets.
Unsettled sales resulted in receivables due from brokers of $1,360 at December 31, 2018. Unsettled
purchases resulted in payables of $3,174 at December 31, 2018.
Fair value methodologies for Level 1 and Level 2 are consistent with the inputs described in Note 4. Real
estate commingled funds for which an active market exists are included in Level 2. The System opted to use
the net asset value per share, or its equivalent, as a practical expedient for fair value of the plans’ interest
in hedge funds, private equity limited partnerships and real estate commingled funds for which there is not
an active market. There is inherent uncertainty in such valuations and the estimated fair values may differ
from the values that would have been used had a ready market for these investments existed. Private equity
limited partnerships and real estate commingled funds typically have finite lives ranging from five to ten
years, at the end of which all invested capital is returned. For hedge funds, the typical lockup period is one
year, after which invested capital can be redeemed on a quarterly basis with at least 30 days’ but no more
than 90 days’ notice. The plans’ investment assets are exposed to the same kinds and levels of risk as
described in Note 7.

36
The following are the plans’ financial instruments at December 31, 2018, measured at fair value on a
recurring basis by the valuation hierarchy defined in Note 7 FAIR VALUE:
Description
Quoted Prices
in Active Markets
for Identical
Assets (Level 1)
Other Significant Observable
Inputs (Level 2)
Significant Unobservable
Inputs (Level 3)
Cash and short-term investments $ 86,131 $ 36,453 $ 49,678 $ —
Corporate bonds and other debt securities 647,429 — 647,429 —
United States government obligations 221,420 — 221,420 —
Non-government fixed-income obligations 571 — 571 —
Bond and other debt security funds 176,550 97,562 78,988 —
Equity securities 229,057 229,057 — —
Equity funds 398,881 248,639 150,242 —
Real estate funds 19,302 2,516 16,786 —
Assets at net asset value:
Hedge funds 264,726
Private equity limited partnerships and real
estate funds 270,894
Total $ 2,314,961
Assumptions used to determine benefit obligations at December 31, 2018, are as follows:
Discount rate – Advocate and Condell Plans 4.38 %
Discount rate – Aurora Plan 4.48 %
Assumed rate of return on assets – Advocate Plan 7.00 %
Assumed rate of return on assets – Condell Plan 4.25 %
Assumed rate of return on assets – Aurora Plan 5.50 %
Weighted average rate of increase in future compensation (age-based table) –
Advocate Plan 3.77 %

37
Assumptions used to determine net pension expense are as follows:
Discount rate – Advocate and Condell Plans 3.60 %
Discount rate – Aurora Plan 3.79 %
Assumed rate of return on assets – Advocate Plan 7.00 %
Assumed rate of return on assets – Condell Plan 5.00 %
Assumed rate of return on assets – Aurora Plan 5.50 %
Weighted average rate of increase in future compensation (age-based table) –
Advocate Plan 3.61 %
The assumed rate of return on Advocate and Condell Plans assets is based on historical and projected rates
of return for asset classes in which the portfolio is invested. The expected return for each asset class was
then weighted based on the target asset allocation to develop the overall expected rate of return on assets
for the portfolio. The Aurora Plan’s expected long-term rate of return is based on the asset allocation of the
total portfolio considering capital return assumptions from various sources.
The 2018 mortality assumption for the Advocate and Condell Plans was the RP-2014 no-collar adjustment
with improvements projected generationally using Scale MP-2018. The 2018 mortality assumption for the
Aurora Plan was the RP-2014 100% white-collar adjustment with improvements projected generationally
using Scale MP-2018.
In addition to these plans, the System sponsors various defined contribution plans for its employees.
Contributions to these plans, which are included in salaries, wages and benefits expense in the consolidated
statement of operations and changes in net assets, were $140,381 for the nine months ended December 31,
2018.
13. NET ASSETS WITH DONOR RESTRICTIONS
Net assets with donor restrictions are available for the following purposes at December 31, 2018:
Purchases of property and equipment $ 22,767
Medical education and other health care programs 201,024
$ 223,791
14. FUNCTIONAL OPERATING EXPENSES
Operating expenses directly attributable to a specific functional area of the System are reported as expenses
of those functional areas. Expenses other than interest expense are directly allocated to functional
departments at the time they are incurred. Interest expense that relates to debt financing is allocated based
on the use of the related funds. General and administrative expenses primarily include legal, finance,

38
purchasing and human resources. A majority of fundraising costs are reported as other nonoperating items,
net in the consolidated statement of operations and changes in net assets.
Functional operating expenses for the nine months ended December 31, 2018, are as follows:
Health Care
Services General and
Administrative Consolidated
Salaries, wages and benefits $ 4,634,289 $ 381,527 $ 5,015,816
Supplies and purchased services 2,037,979 223,058 2,261,037
Contract medical services 478,393 — 478,393
Depreciation and amortization 346,655 64,380 411,035
Interest 81,385 — 81,385
Other 293,970 312,903 606,873
Total operating expenses $ 7,872,671 $ 981,868 $ 8,854,539
15. LIQUIDITY
The System maintains a policy of structuring its financial assets to be available as its general expenditures,
liabilities and other obligations come due. In addition, as part of its liquidity management, the System
invests cash in excess of daily requirements in various investments.
As more fully described in Note 10. LONG-TERM DEBT, the System had lines of credit with banks aggregating
to $585,000. These lines of credit may be used to redeem bonded indebtedness, to pay costs related to
such redemptions, for capital expenditures or for general working capital purposes.

39
The System’s financial assets available within one year of the consolidated balance sheet date for general
expenditures are as follows:
Current assets:
Cash and cash equivalents $ 584,887
Assets limited as to use 106,244
Patient accounts receivable 1,486,260
Third-party payors receivables 17,793
Collateral proceeds under securities lending program 18,869
Total current assets 2,214,053
Asset limited as to use:
Internally designated for capital and other 6,941,646
Held for self-insurance 632,372
Donor restricted 119,759
Investments under securities lending program 18,310
Total assets limited as to use 7,712,087
Total financial assets $ 9,926,140
Less:
Amounts unavailable for general expenditures:
Private equity $ (1,113,544 )
Hedge funds (343,603 )
Total amounts unavailable for general expenditure (1,457,147 )
Amounts unavailable to management without approval:
Held for self-insurance (738,616 )
Donor restricted (119,759 )
Investments under securities lending program (18,310 )
Total amounts unavailable to management without approval (876,685 )
Total financial assets available to management for general expenditure within one year $ 7,592,308
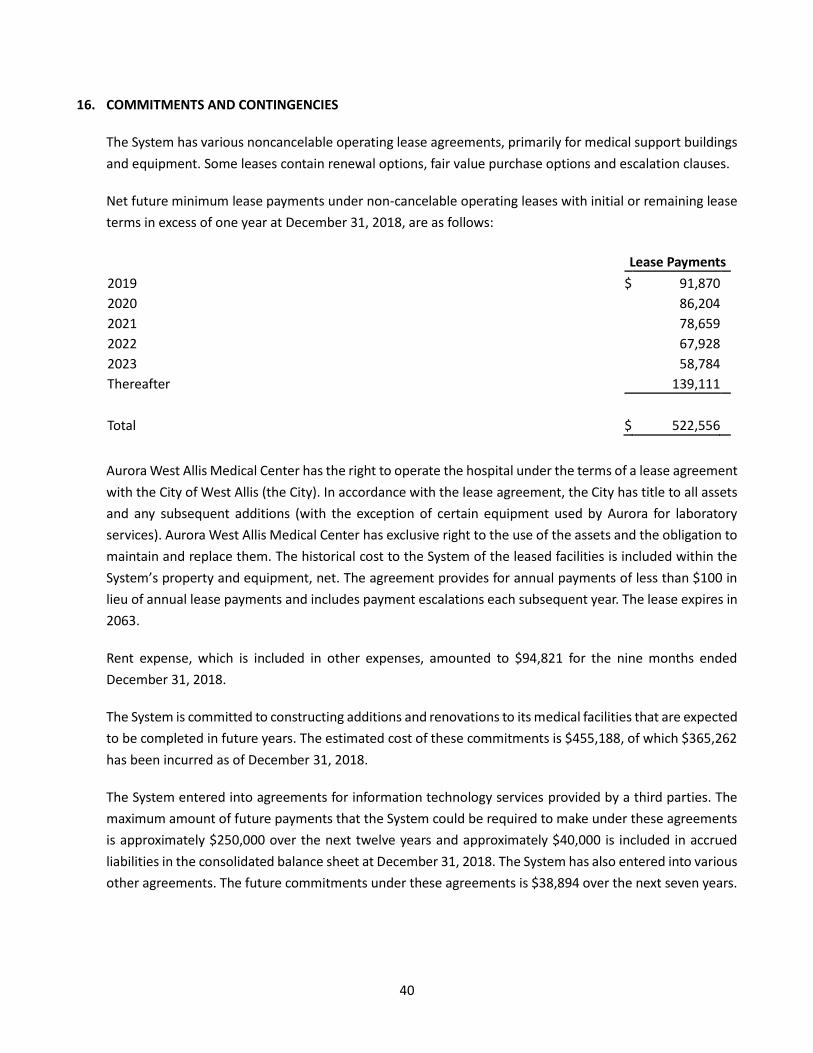
40
16. COMMITMENTS AND CONTINGENCIES
The System has various noncancelable operating lease agreements, primarily for medical support buildings
and equipment. Some leases contain renewal options, fair value purchase options and escalation clauses.
Net future minimum lease payments under non-cancelable operating leases with initial or remaining lease
terms in excess of one year at December 31, 2018, are as follows:
Lease Payments
2019 $ 91,870
2020 86,204
2021 78,659
2022 67,928
2023 58,784
Thereafter 139,111
Total $ 522,556
Aurora West Allis Medical Center has the right to operate the hospital under the terms of a lease agreement
with the City of West Allis (the City). In accordance with the lease agreement, the City has title to all assets
and any subsequent additions (with the exception of certain equipment used by Aurora for laboratory
services). Aurora West Allis Medical Center has exclusive right to the use of the assets and the obligation to
maintain and replace them. The historical cost to the System of the leased facilities is included within the
System’s property and equipment, net. The agreement provides for annual payments of less than $100 in
lieu of annual lease payments and includes payment escalations each subsequent year. The lease expires in
2063.
Rent expense, which is included in other expenses, amounted to $94,821 for the nine months ended
December 31, 2018.
The System is committed to constructing additions and renovations to its medical facilities that are expected
to be completed in future years. The estimated cost of these commitments is $455,188, of which $365,262
has been incurred as of December 31, 2018.
The System entered into agreements for information technology services provided by a third parties. The
maximum amount of future payments that the System could be required to make under these agreements
is approximately $250,000 over the next twelve years and approximately $40,000 is included in accrued
liabilities in the consolidated balance sheet at December 31, 2018. The System has also entered into various
other agreements. The future commitments under these agreements is $38,894 over the next seven years.

41
17. GENERAL AND PROFESSIONAL LIABILITY RISKS
The System is self-insured for substantially all general and professional liability risks. The self-insurance
programs combine various levels of self-insured retention with excess commercial insurance coverage.
Aurora’s hospitals, clinics, surgery centers, physicians and certified registered nurse anesthetist providers
that provide health care in Wisconsin are qualified health care providers that are fully covered for losses in
excess of statutory limits through mandatory participation in the State of Wisconsin Injured Patients and
Families Compensation Fund. In addition, various umbrella insurance policies have been purchased to
provide coverage in excess of the self-insured limits. Revocable trust funds, administered by a trustee and a
captive insurance company, have been established for the self-insurance programs. Actuarial consultants
have been retained to determine the estimated cost of claims, as well as to determine the amount to fund
into the irrevocable trust and captive insurance company.
The estimated cost of claims is actuarially determined based on past experience, as well as other
considerations, including the nature of each claim or incident and relevant trend factors. Accrued insurance
liabilities and contributions to the trust were determined using a discount rate of 3.00% as of December 31,
2018. Total accrued insurance liabilities would have been $76,620 greater at December 31, 2018, had these
liabilities not been discounted.
The System entities are defendants in certain litigation related to professional and general liability risks, and
other matters. Although the outcome of the litigations cannot be determined with certainty, management
believes, after consultation with legal counsel, that the ultimate resolution of the litigations will not have a
material adverse effect on the System’s operations or financial condition.
18. LEGAL, REGULATORY AND OTHER CONTINGENCIES
Laws and regulations governing the Medicare and Medicaid programs are extremely complex and subject
to interpretation. During the last few years, due to nationwide investigations by governmental agencies,
various health care organizations have received requests for information and notices regarding alleged
noncompliance with those laws and regulations, which, in some instances, have resulted in organizations
entering into significant settlement agreements. Compliance with such laws and regulations may also be
subject to future government review and interpretation, as well as significant regulatory action, including
fines, penalties, exclusion from the Medicare and Medicaid programs and revocation of federal or state tax-
exempt status. Moreover, the System expects that the level of review and audit to which it and other health
care providers are subject will increase.
Various federal and state agencies have initiated investigations, which are in various stages of discovery,
relating to reimbursement, billing practices and other matters of the System. There can be no assurance
that regulatory authorities will not challenge the System’s compliance with these laws and regulations, and

42
it is not possible to determine the impact, if any, such claims or penalties would have on the System. To
foster compliance with applicable laws and regulations, the System maintains a compliance program
designed to detect and correct potential violations of laws and regulations related to its programs.
19. INCOME TAXES AND TAX STATUS
The affiliates and subsidiaries of the System are primarily tax-exempt organizations under Internal Revenue
Code Section 501(c)(3) and their related income is exempt from federal income tax. Accordingly, no income
taxes are provided for the majority of the income in the accompanying consolidated financial statements
for these entities. Unrelated business income is generated by certain of these entities through the provision
of services or other activities not directly related to the provision of patient care.
At December 31, 2018, the System had $40,338 of federal and $60,481 of state net operating loss
carryforward with unutilized amounts expiring between 2021 and 2037.
The System calculated income taxes for its taxable subsidiaries and affiliates. Taxable income differs from
pretax book income primarily due to certain income and deductions for tax purposes being recorded in the
consolidated financial statements in different periods. Deferred income tax assets and liabilities are
recorded for the tax effect of these differences using enacted tax rates for the years in which the differences
are expected to reverse.
In assessing the realizability of deferred tax assets, management considers whether it is more likely that not
that some portion or all of the deferred tax assets will not be realized. The ultimate realization of deferred
tax assets is dependent on the generation of future taxable income during the periods in which those
temporary differences become deductible.
At December 31, 2018, the System had deferred tax assets of $34,812, including $13,167 related to net
operating loss carryforwards. These deferred tax assets are partially offset by a valuation allowance of
$12,748, which was recorded due to the uncertainty regarding the use of the deferred tax assets.
Provisions for federal, state and deferred income taxes of $(3,480) for the nine months ended December 31,
2018, are included in other nonoperating income, net in the consolidated statement of operations and
changes in net assets.
20. AFFILIATION
On April 1, 2018, Advocate Aurora Health, Inc. became the sole corporate member of Advocate Health Care
Network and Aurora Health Care, Inc. The System was formed in furtherance of the parties’ common and
unifying charitable health care mission to promote and improve the quality and expand the scope and
accessibility of affordable health care and health care-related services for the communities they serve.
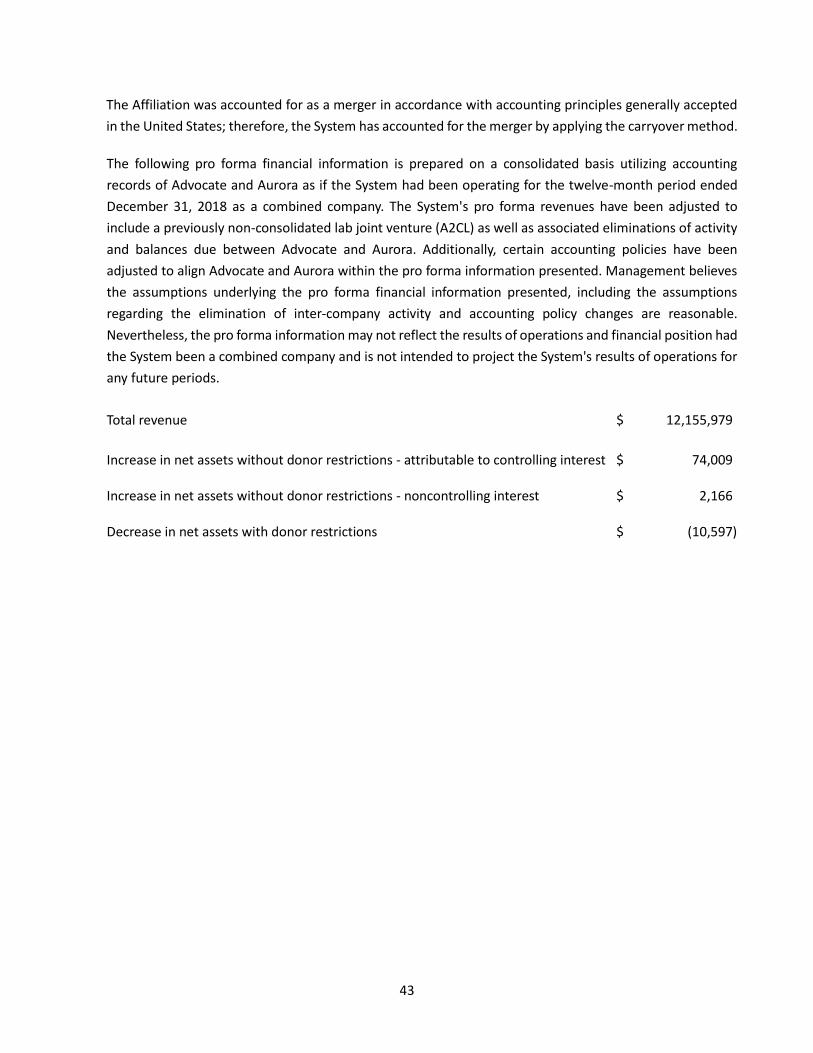
43
The Affiliation was accounted for as a merger in accordance with accounting principles generally accepted
in the United States; therefore, the System has accounted for the merger by applying the carryover method.
The following pro forma financial information is prepared on a consolidated basis utilizing accounting
records of Advocate and Aurora as if the System had been operating for the twelve-month period ended
December 31, 2018 as a combined company. The System's pro forma revenues have been adjusted to
include a previously non-consolidated lab joint venture (A2CL) as well as associated eliminations of activity
and balances due between Advocate and Aurora. Additionally, certain accounting policies have been
adjusted to align Advocate and Aurora within the pro forma information presented. Management believes
the assumptions underlying the pro forma financial information presented, including the assumptions
regarding the elimination of inter-company activity and accounting policy changes are reasonable.
Nevertheless, the pro forma information may not reflect the results of operations and financial position had
the System been a combined company and is not intended to project the System's results of operations for
any future periods.
Total revenue $ 12,155,979
Increase in net assets without donor restrictions - attributable to controlling interest $ 74,009
Increase in net assets without donor restrictions - noncontrolling interest $ 2,166
Decrease in net assets with donor restrictions $ (10,597 )

44
ADVOCATE AURORA HEALTH, INC. AND ITS AFFILIATES AND SUBSIDIARIES
PROFORMA CONSOLIDATED BALANCE SHEET
(dollars in thousands)
April 1, 2018
Aurora Advocate A2CL Eliminations Consolidated
ASSETS
CURRENT ASSETS:
Cash and cash equivalents $ 171,402 $ 235,425 $ 1,278 $ — $ 408,105
Assets limited as to use 4,523 104,543 — — 109,066
Patient accounts receivable 744,668 726,045 — — 1,470,713
Other current assets 193,669 348,921 12,317 (21,510 ) 533,397
Total current assets 1,114,262 1,414,934 13,595 (21,510 ) 2,521,281
Assets limited as to use 1,737,381 6,187,437 — — 7,924,818
Property and equipment, net 2,445,763 2,987,734 — — 5,433,497
Total other assets 273,788 498,605 1,579 (10,075 ) 763,897
TOTAL $ 5,571,194 $ 11,088,710 $ 15,174 $ (31,585 ) $ 16,643,493
LIABILITIES AND NET ASSETS
CURRENT LIABILITIES:
Current portion of long term-debt $ 136,239 $ 120,901 $ — $ — $ 257,140
Accounts payable and accrued liabilities 623,687 829,635 18,127 (21,510 ) 1,449,939
Other current liabilities 31,653 425,468 — — 457,121
Total current liabilities 791,579 1,376,004 18,127 (21,510 ) 2,164,200
NONCURRENT LIABILITES:
Long-term debt, less current portion 1,266,070 1,539,105 — — 2,805,175
Accrued Insurance and claims costs, less current portion 27,381 636,856 — — 664,237
Other long-term liabilities 382,919 359,597 — (13,028 ) 729,488
Total noncurrent liabilities 1,676,370 2,535,558 — (13,028 ) 4,198,900
Total liabilities 2,467,949 3,911,562 18,127 (34,538 ) 6,363,100
NET ASSETS:
Without donor restrictions:
Controlling interest 2,934,281 7,009,528 (2,953 ) 2,953 9,943,809
Noncontrolling interest in subsidiaries 104,168 570 — — 104,738
Total net assets without donor restrictions 3,038,449 7,010,098 (2,953 ) 2,953 10,048,547
Net assets with donor restrictions 64,796 167,050 — — 231,846
Total net assets 3,103,245 7,177,148 (2,953 ) 2,953 10,280,393
TOTAL $ 5,571,194 $ 11,088,710 $ 15,174 $ (31,585 ) $ 16,643,493

45
21. SUBSEQUENT EVENTS
In January 2019, Advocate Aurora Health, Inc., entered into a definitive agreement to acquire the remaining
51% interest in BAMC in exchange for a donation to a foundation to benefit BAMC. Upon completion of the
transaction, BAMC and ABAMG will be fully consolidated within the consolidated financial statements of
Aurora. This transaction is expected to close on April 1, 2019 pending regulatory approval. As of the issuance
date of this report, management is unable to estimate the impact of this transaction to the consolidated
financial statements.
On March 5, 2019, the System issued commercial paper in the amount of $50,000. The proceeds of the
commercial paper were used to redeem the Series 2008C-2A bonds of $49,230 plus accrued interest, and
certain costs related to the issuance of the commercial paper. The remaining proceeds were used for general
corporate purposes. The standby bond purchase agreement related to the Series 2008C-2A bonds was
canceled effective March 5, 2019.
The System evaluated events and transactions subsequent to December 31, 2018 through March 27, 2019,
the date of financial statement issuance.
****

46
Supplementary Information

46
Report of Independent Auditors on Supplementary Information
The Board of Directors
Advocate Aurora Health, Inc. and its Affiliates and Subsidiaries
Our audit was conducted for the purpose of forming an opinion on the consolidated financial statements as a
whole. The accompanying consolidating balance sheet and consolidating statement of operations are
presented for purposes of additional analysis and are not a required part of the financial statements. Such
information is the responsibility of management and was derived from and relates directly to the underlying
accounting and other records used to prepare the financial statements. The information has been subjected to
the auditing procedures applied in the audit of the consolidated financial statements and certain additional
procedures, including comparing and reconciling such information directly to the underlying accounting and
other records used to prepare the financial statements or to the financial statements themselves, and other
additional procedures in accordance with auditing standards generally accepted in the United States. In our
opinion, the information is fairly stated, in all material respects, in relation to the financial statements as a
whole.
March 27, 2019
A member firm of Ernst & Young Global Limited
Ernst & Young LLP 155 North Wacker Drive Chicago, IL 60606-1787
Tel: +1 312 879 2000 Fax: +1 312 879 4000 ey.com

47
ADVOCATE AURORA HEALTH, INC AND ITS AFFILIATES AND SUBSIDIARIES CONSOLIDATING BALANCE SHEET
December 31, 2018
Credit Noncredit Assets Group Group Eliminations Consolidated
Current assets: Cash and cash equivalents $ 220,354 $ 377,503 $ (12,970) $ 584,887 Assets limited as to use 102,003 4,241 – 106,244 Patient accounts receivable 1,275,630 210,630 – 1,486,260 Other current assets 436,189 116,691 (40,324) 512,556 Third-party payors receivables 17,165 628 – 17,793 Receivable from affiliate 75,953 226,679 (302,632) – Collateral proceeds received under securities
lending program 18,869 – – 18,869
Total current assets 2,146,163 936,372 (355,926) 2,726,609 Assets limited as to use:
Internally designated for capital and other 6,902,505 39,141 – 6,941,646 Held for self-insurance 585,605 46,767 – 632,372 Donor restricted 61,239 58,520 – 119,759 Investments under securities lending program 18,310 – – 18,310
Total assets limited as to use 7,567,659 144,428 – 7,712,087 Note receivable from affiliate 74,023 – (74,023) – Property and equipment, net 5,088,044 530,144 8,287 5,626,475 Other assets:
Intangible asset and goodwill, net 56,740 34,030 (1,441) 89,329 Investment in subsidiaries/affiliates 266,519 – (266,519) – Investments in unconsolidated entities 201,948 25,107 (24,724) 202,331 Reinsurance receivable 60,741 – – 60,741 Other noncurrent assets 592,025 37,190 (313,998) 315,217
Total other assets 1,177,973 96,327 (606,682) 667,618
Total assets $ 16,053,862 $ 1,707,271 $ (1,028,344) $ 16,732,789

48
ADVOCATE AURORA HEALTH, INC AND ITS AFFILIATES AND SUBSIDIARIES CONSOLIDATING BALANCE SHEET
December 31, 2018
Credit Noncredit Liabilities and net assets Group Group Eliminations Consolidated
Current liabilities: Current portion of long-term debt $ 48,558 $ 21,035 $ (19,666) $ 49,927 Long-term debt subject to short-term financing arrangements 162,025 – – 162,025 Accounts payable and accrued liabilities 1,391,277 304,710 (24,863 1,671,124 Third-party payors payables 301,444 2,189 – 303,633 Current portion of accrued insurance and
claims costs 117,815 4,546 – 122,361 Accounts payable to affiliate 226,830 75,06 (301,892) – Collateral under securities lending program 18,869 – – 18,869
Total current liabilities 2,266,818 407,542 (346,421) 2,327,939 Noncurrent liabilities:
Long-term debt, less current portion 2,789,699 99,172 (91,965) 2,796,906 Accrued insurance and claims cost, less current
portion 558,859 34,437 – 593,296 Accrued losses subject to reinsurance recovery 60,741 – – 60,741 Obligations under swap agreements 65,376 – – 65,376 Due to affiliate 178,109 (104,086) (74,023) – Other noncurrent liabilities 618,118 28,320 (884) 645,554
Total noncurrent liabilities 4,270,902 57,843 (166,872) 4,161,873
Total liabilities 6,537,720 465,385 (513,293) 6,489,812 Net assets:
Without donor restrictions: Controlling interest 9,146,236 1,140,677 (386,195) 9,900,718 Noncontrolling interest in subsidiaries 37 2,308 116,123 118,468
Total net assets without donor restrictions 9,146,273 1,142,985 (270,072) 10,019,186
With donor restrictions 369,869 87,099 (233,177) 223,791 Common stock – 1,863 (1,863) – Additional paid-in capital – 84,672 (84,672) – Retained (deficit) earnings/partnership losses – (74,733) 74,733 –
Total net assets 9,516,142 1,241,886 (515,051) 10,242,977
Total liabilities and net assets $ 16,053,862 $ 1,707,271 $ (1,028,344) $ 16,732,789

49
ADVOCATE AURORA HEALTH, INC AND ITS AFFILIATES AND SUBSIDIARIES CONSOLIDATING STATEMENT OF OPERATIONS
Nine Months Ended December 31, 2018 Credit Noncredit
Group Group Eliminations Consolidated
Revenue: Patient service revenue $ 6,609,409 $ 1,210,444 $ $(286,385) $ 7,533,468 Capitation revenue 479,970 570,112 (14,087) 1,035,995 Other revenue 433,244 521,400 (310,701) 643,943
Total revenue 7,522,623 2,301,956 (611,173) 9,213,406 Expenses:
Salaries, wages and benefits 4,253,713 763,311 (24,010) 4,993,014 Supplies and purchased services 1,912,984 423,576 (103,453) 2,233,107 Contract medical services 188,767 631,580 (341,954) 478,393 Depreciation and amortization 374,296 38,216 (1,722) 410,790 Interest 79,303 5,748 (3,666) 81,385 Other 353,156 344,509 (94,997) 602,668
Total expenses 7,162,219 2,206,940 (569,802) 8,799,357 Operating income (loss) before nonrecurring
expenses 360,404 95,016 (41,371) 414,049 Nonrecurring expenses 55,182 – – 55,182
Operating income (loss) 305,222 95,016 (41,371) 358,867 Nonoperating income (loss) Investment loss, net (253,683) (4,435) – (258,118) Loss on debt refinancing (29,859) – – (29,859) Change in fair value of interest rate swaps 993 – – 993 Other nonoperating income, net 4,809 (4,163) – 646
Total nonoperating loss, net (277,740) (8,598) – (286,338) Excess of revenue over expenses 27,482 86,418 (41,371) 72,529 Less noncontrolling interest (610) (355) (33,418) (34,383) Excess of revenue over expenses - attributable to
controlling interest $ 26,872 $ 86,063 $ (74,789) $ 38,146