aecgreviewreport - department of healthfile/aecgreviewreport.docx · web viewtable 3.1.7proportion...
TRANSCRIPT

MBS Review
AMBULATORY ELECTROCARDIOGRAPHY
FINAL REPORT
May 2016

May 2016
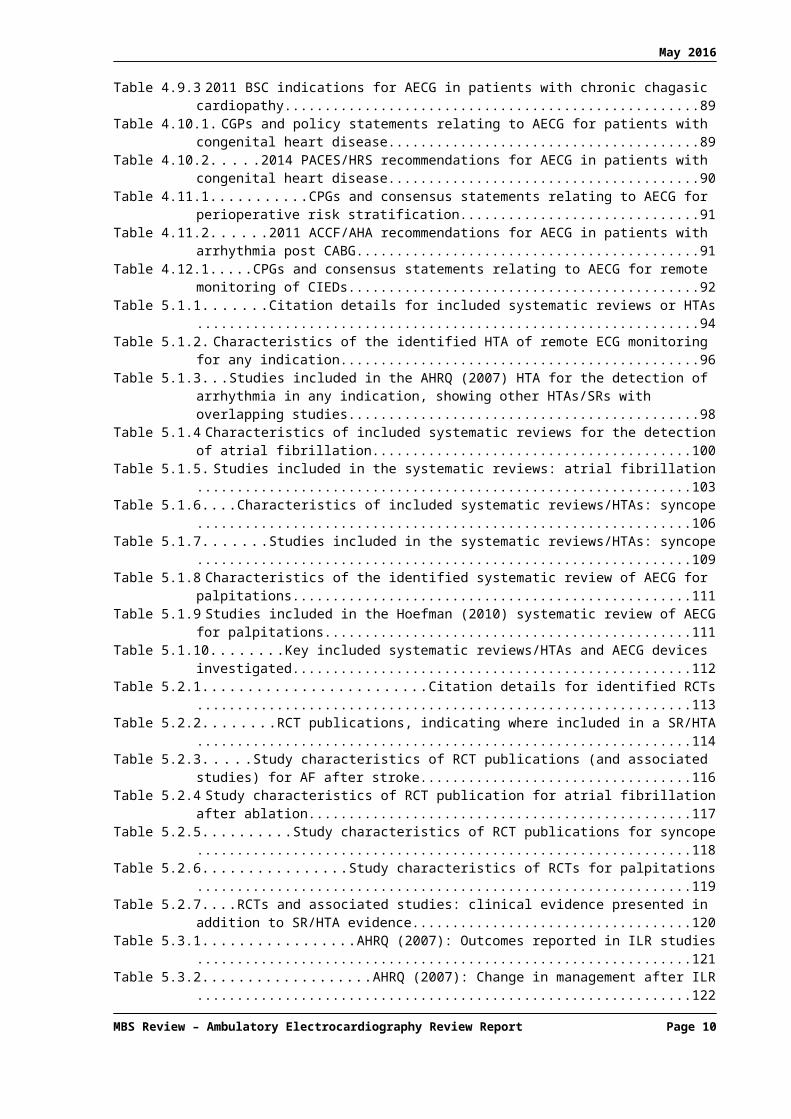
ContentsABBREVIATIONS...............................................................................................................................12
EXECUTIVE SUMMARY..................................................................................................................15DESCRIPTION OF AMBULATORY ELECTROCARDIOGRAPHY.....................................................................15PURPOSE OF THE REVIEW.......................................................................................................................15REVIEW METHODOLOGY.........................................................................................................................16STAKEHOLDER CONSULTATION...............................................................................................................16SUMMARY OF FINDINGS..........................................................................................................................16
CURRENT USAGE OF AECG IN AUSTRALIA..................................................................................16CLINICAL GUIDANCE ON AECG...................................................................................................18EVIDENCE FOR THE EFFECTIVENESS AND SAFETY OF AECG.......................................................22EVIDENCE FOR THE COST-EFFECTIVENESS OF AECG...................................................................32
CONCLUSIONS.........................................................................................................................................33
1 BACKGROUND ON AECG MONITORING.........................................................................341.1 DESCRIPTION OF AECG................................................................................................................34
1.1.1 MONITORING DEVICES........................................................................................................341.1.2 INDICATIONS FOR AECG MONITORING..............................................................................35
1.2 DESCRIPTION OF THE SERVICES UNDER REVIEW...........................................................................361.2.1 MBS ITEMS FOR AECG DEVICES.......................................................................................36
1.3 PURPOSE OF THE REVIEW.............................................................................................................371.4 CLINICAL DECISION PATHWAY......................................................................................................38
2 REVIEW METHODOLOGY...................................................................................................392.1 SECONDARY DATA ANALYSIS.......................................................................................................39
2.1.1 THE RESEARCH QUESTIONS FOR THE MBS ANALYSIS........................................................392.1.2 METHOD FOR ANALYSIS OF MBS DATA.............................................................................39
2.2 GUIDELINE CONCORDANCE...........................................................................................................402.2.1 THE RESEARCH QUESTIONS FOR THE GUIDELINE CONCORDANCE ANALYSIS......................402.2.2 METHODS FOR GUIDELINE CONCORDANCE ANALYSIS........................................................40
2.3 PICO CRITERIA FOR CLINICAL AND ECONOMIC LITERATURE SEARCHES......................................412.4 SYSTEMATIC LITERATURE REVIEW FOR CLINICAL EVIDENCE.......................................................43
2.4.1 THE RESEARCH QUESTIONS FOR THE CLINICAL EVIDENCE REVIEW....................................432.4.2 METHODS FOR THE CLINICAL EVIDENCE REVIEW...............................................................43
2.5 SYSTEMATIC LITERATURE REVIEW FOR ECONOMIC EVIDENCE.....................................................462.5.1 SEARCH STRATEGY.............................................................................................................46
3 SECONDARY DATA ANALYSIS...........................................................................................483.1 MBS SERVICES AND EXPENDITURE FOR AECG...........................................................................48
3.1.1 TEMPORAL TRENDS.............................................................................................................483.1.2 GEOGRAPHIC TRENDS.........................................................................................................493.1.3 PATIENT CHARACTERISTICS................................................................................................563.1.4 FREQUENCY OF MULTIPLE SERVICES PER PATIENT.............................................................603.1.5 PROVIDER CHARACTERISTICS.............................................................................................64
4 REVIEW OF GUIDELINES RELEVANT TO AECG..........................................................694.1 AMBULATORY ELECTROCARDIOGRAPHY......................................................................................69
4.1.1 CSANZ 2012......................................................................................................................694.1.2 BRITISH COLUMBIA 2013...................................................................................................704.1.3 EHRA 2009........................................................................................................................72
MBS Review – Ambulatory Electrocardiography Review Report Page 2

May 2016
4.2 ATRIAL FIBRILLATION...................................................................................................................734.2.1 AF IN ANY POPULATION.....................................................................................................744.2.2 POST-STROKE AF................................................................................................................764.2.3 POST-ABLATION AF............................................................................................................77
4.3 SYNCOPE.......................................................................................................................................784.4 PALPITATIONS...............................................................................................................................824.5 POST-MI ARRHYTHMIAS...............................................................................................................834.6 VENTRICULAR ARRHYTHMIAS......................................................................................................84
4.6.1 VENTRICULAR ARRHYTHMIA..............................................................................................844.6.2 IDIOPATHIC VENTRICULAR TACHYCARDIA (IN CHILDREN).................................................854.6.3 CATECHOLAMINERGIC POLYMORPHIC VENTRICULAR TACHYCARDIA................................86
4.7 HEART FAILURE............................................................................................................................864.8 VALVULAR HEART DISEASE..........................................................................................................874.9 OTHER CARDIOMYOPATHIES.........................................................................................................88
4.9.1 ARRHYTHMIA IN HYPERTROPHIC CARDIOMYOPATHY.........................................................884.9.2 BRACHYCARDIA CAUSED BY SICK SINUS SYNDROME.........................................................894.9.3 CHAGAS’ HEART DISEASE...................................................................................................89
4.10 OTHER CONGENITAL DISEASE.......................................................................................................904.10.1CONGENITAL HEART DISEASE.............................................................................................904.10.2DUCHENNE OR BECKER MUSCULAR DYSTROPHY...............................................................91
4.11 PERIOPERATIVE MONITORING.......................................................................................................914.12 REMOTE MONITORING OF PATIENTS WITH CIEDS........................................................................93
5 REVIEW OF THE CLINICAL EVIDENCE FOR AECG....................................................955.1 EVIDENCE BASE: SYSTEMATIC REVIEWS AND HTAS....................................................................95
5.1.1 DETECTION OF ARRHYTHMIA FOR ANY INDICATION...........................................................965.1.2 DETECTION OF ATRIAL FIBRILLATION..............................................................................1005.1.3 EVALUATION OF SYNCOPE................................................................................................1065.1.4 EVALUATION OF PALPITATIONS........................................................................................1125.1.5 KEY SYSTEMATIC REVIEWS/HTAS AND AECG DEVICES INVESTIGATED.........................113
5.2 EVIDENCE BASE: RCTS...............................................................................................................1145.2.1 RCTS FOR ATRIAL FIBRILLATION.....................................................................................1175.2.2 RCTS FOR ATRIAL FIBRILLATION AFTER ABLATION.........................................................1185.2.3 RCTS FOR SYNCOPE.........................................................................................................1195.2.4 RCTS FOR PALPITATIONS.................................................................................................1205.2.5 SUMMARY OF RCT EVIDENCE BASE.................................................................................121
5.3 EFFECTIVENESS AND SAFETY OF AECG FOR DIAGNOSIS...........................................................1215.3.1 DETECTION OF ARRHYTHMIA FOR ANY INDICATION.........................................................1225.3.2 DETECTION OF ATRIAL FIBRILLATION..............................................................................1315.3.3 EVALUATION OF SYNCOPE................................................................................................1515.3.4 EVALUATION OF PALPITATIONS........................................................................................177
6 REVIEW OF THE ECONOMIC EVIDENCE FOR AECG...............................................1816.1 STUDIES RELEVANT TO THE ECONOMIC EVALUATION OF AECG...............................................1816.2 COST-UTILITY ANALYSES............................................................................................................182
6.2.1 MEDICAL SERVICES ADVISORY COMMITTEE (2003)........................................................1866.2.2 WESTBY (2010)................................................................................................................1886.2.3 DAVIS (2012)....................................................................................................................1966.2.4 DAVIS (2013)....................................................................................................................1966.2.5 LEVIN (2015)....................................................................................................................1986.2.6 MAYER (2013)..................................................................................................................1996.2.7 KAMEL (2010)..................................................................................................................201
6.3 COST-EFFECTIVENESS ANALYSES...............................................................................................2036.4 COSTING STUDIES.......................................................................................................................210
MBS Review – Ambulatory Electrocardiography Review Report Page 3

May 2016
7 FINDINGS AND CONCLUSIONS........................................................................................2147.1 DRIVERS OF GROWTH IN AECG MONITORING IN AUSTRALIA....................................................2147.2 SUMMARY OF FINDINGS FROM THE REVIEW OF GUIDELINES......................................................215
7.2.1 FOR WHAT CLINICAL INDICATIONS IS AECG RECOMMENDED?.......................................2157.2.2 FOR WHAT CLINICAL INDICATIONS IS ONE DURATION OF AECG MONITORING
RECOMMENDED OVER ANOTHER (I.E. SHORT TERM VS MEDIUM TERM, ETC.)?.................2247.2.3 FOR WHAT CLINICAL INDICATIONS IS ONE MECHANISM OF TRIGGERING EVENT RECORDING
(I.E. INTERMITTENT RECORDING) RECOMMENDED OVER ANOTHER?................................2247.2.4 ARE THE DESCRIPTORS FOR THE MBS ITEM NUMBERS/SERVICES UNDER REVIEW
CONSISTENT WITH EVIDENCE-BASED (OR IN THE ABSENCE OF EVIDENCE, CONSENSUS-BASED) RECOMMENDATIONS PROVIDED IN RELEVANT CLINICAL PRACTICE GUIDELINES?
2247.3 EVIDENCE FOR THE EFFECTIVENESS AND SAFETY OF AECG.....................................................226
7.3.1 DETECTION OF ARRHYTHMIA FOR ANY INDICATION.........................................................2277.3.2 DETECTION OF AF AFTER STROKE....................................................................................2307.3.3 DETECTION OF AF AFTER ABLATION................................................................................2387.3.4 EVALUATION OF SYNCOPE................................................................................................2387.3.5 EVALUATION OF SYNCOPE PATIENTS FOR PACING THERAPY............................................2487.3.6 EVALUATION OF PALPITATIONS........................................................................................248
7.4 EVIDENCE FOR THE COST-EFFECTIVENESS OF AECG.................................................................2507.4.1 WHAT IS THE PUBLISHED EVIDENCE FOR THE COST IMPLICATIONS AND COST-
EFFECTIVENESS OF AECG MONITORING OF ANY DURATION COMPARED WITH NO AECG MONITORING?...................................................................................................................250
7.4.2 WHAT IS THE PUBLISHED EVIDENCE FOR THE COST IMPLICATIONS AND COST-EFFECTIVENESS OF AECG MONITORING OF ONE DURATION COMPARED WITH AECG MONITORING OF A DIFFERENT DURATION?.......................................................................251
7.4.3 WHAT IS THE PUBLISHED EVIDENCE FOR THE COST IMPLICATIONS AND COST-EFFECTIVENESS OF AUTO-TRIGGERED AECG MONITORING COMPARED WITH PATIENT-TRIGGERED AECG MONITORING OF THE SAME DURATION?............................................252
7.5 CONCLUSIONS.............................................................................................................................252
APPENDIX 1: REFERENCES.........................................................................................................254
APPENDIX 2: REVIEW WORKING GROUP MEMBERS.........................................................260
APPENDIX 3: MBS ITEMS RELEVANT TO AECG SERVICES..............................................261A-3.1 MBS ITEMS RELEVANT TO AECG..............................................................................................261A-3.2 MBS DATA ANALYSIS................................................................................................................264
APPENDIX 4: LITERATURE SEARCH........................................................................................265A-4.1 CLINICAL EVIDENCE SEARCH......................................................................................................265
APPENDIX 5: EVIDENCE HIERARCHY.....................................................................................271
APPENDIX 6: AMSTAR QUALITY ASSESSMENT....................................................................272
APPENDIX 7: ACC/AHA 1999 GUIDELINE ON AECG.............................................................275
APPENDIX 8: CLINICAL FEATURES AND RISK STRATIFICATION AS DEFINED BY THE 2009 ESC GUIDELINE...........................................................................................279
APPENDIX 9: CLINICAL PRACTICE GUIDELINE LEVELS OF EVIDENCE AND RECOMMENDATION GRADES..........................................................................................281
A-9.1 ACCF/AHA................................................................................................................................281A-9.2 HSFC..........................................................................................................................................282
MBS Review – Ambulatory Electrocardiography Review Report Page 4

May 2016
A-9.3 CCS............................................................................................................................................282A-9.4 NICE...........................................................................................................................................282A-9.5 ESC.............................................................................................................................................282A-9.6 ESO............................................................................................................................................283A-9.7 BSC............................................................................................................................................283
APPENDIX 10: RISK ASSESSMENT STUDIES...........................................................................285A-10.1 SYSTEMATIC REVIEWS OF AECG FOR RISK ASSESSMENT........................................................285A-10.2 SUMMARIES OF RISK ASSESSMENT SYSTEMATIC REVIEWS.......................................................286
A-10.2.1 T-WAVE ALTERNANS FOR CARDIAC RISK STRATIFICATION....................................286A-10.2.2 POST-MI RISK STRATIFICATION..............................................................................287A-10.2.3 VENTRICULAR DYSFUNCTION RISK ASSESSMENT...................................................289A-10.2.4 CHAGAS DISEASE....................................................................................................290A-10.2.5 PERIOPERATIVE CARDIAC RISK ASSESSMENT FOR MAJOR VASCULAR SURGERY....291
MBS Review – Ambulatory Electrocardiography Review Report Page 5

May 2016
TABLE OF TABLES
Table 1.1.1 Major indications for the use of AECG.........................................................................................33Table 1.2.1 AECG devices and relevant MBS items........................................................................................34Table 2.2.1 Summary of the process used to identify relevant clinical practice guidelines.............................40Table 2.3.1 PICO criteria for the Review of AECG monitoring.......................................................................41Table 2.4.1 Databases searched – clinical evidence..........................................................................................43Table 2.4.2 Summary of the process used to identify relevant systematic reviews and HTAs........................43Table 2.5.1 Summary of the process used to identify relevant economic analyses..........................................46Table 3.1.1 Total services for AECG MBS items, 2010-11 to 2014-15...........................................................48Table 3.1.2 Total benefits paid for AECG MBS items, 2010-11 to 2014-15...................................................48Table 3.1.3 Services per capita by state/territory for MBS items relevant to AECG, 2014-15........................49Table 3.1.4 Proportion of services for Item 11708 by regional status, 2010-11 to 2014-15............................50Table 3.1.5 Proportion of services for Item 11709 by regional status, 2010-11 to 2014-15............................51Table 3.1.6 Proportion of services for Item 11710 by regional status, 2010-11 to 2014-15............................52Table 3.1.7 Proportion of services for Item 11711 by regional status, 2010-11 to 2014-15............................53Table 3.1.8 Proportion of services for Item 38285 by regional status, 2010-11 to 2014-15............................54Table 3.1.9 Proportion of services for Item 11722 by regional status, 2010-11 to 2014-15............................55Table 3.1.10 Number of patients with multiple services per year for Item 11708, 2010-11 to 2014-15............59Table 3.1.11 Number of patients by number of services per year for Item 11708, 2010-11 to 2014-15............59Table 3.1.12 Number of patients with multiple services per year for Item 11709, 2010-11 to 2014-15............60Table 3.1.13 Number of patients by number of services per year for Item 11709, 2010-11 to 2014-15............60Table 3.1.14 Number of patients with multiple services per year for Item 11710, 2010-11 to 2014-15............61Table 3.1.15 Number of patients by number of services per year for Item 11710, 2010-11 to 2014-15............61Table 3.1.16 Number of patients with multiple services per year for Item 11711, 2010-11 to 2014-15............61Table 3.1.17 Number of patients by number of services per year for Item 11711, 2010-11 to 2014-15............62Table 3.1.18 Number of patients with multiple services per year for Item 38285, 2010-11 to 2014-15............62Table 3.1.19 Number of patients by number of services per year for Item 38285, 2010-11 to 2014-15............62Table 3.1.20 Number of patients with multiple services per year for Item 11722, 2010-11 to 2014-15............63Table 3.1.21 Number of patients by number of services per year for Item 11722, 2010-11 to 2014-15............63Table 4.1.1 Australian and international CPGs and consensus statements relating to AECG general
use..................................................................................................................................................68Table 4.1.2 2013 BCMA – appropriateness of cardiac monitoring device per patient characteristics.............70Table 4.2.1 CPGs and consensus statements relating to AECG in patients with AF or suspected AF.............72Table 4.2.2 Recommendations for the use of AECG in the evaluation of patients with AF............................74Table 4.2.3 2015 HSFC, 2014 AHA/ASA, and 2008 ESO recommendations for the use of AECG in
the evaluation of patients with TIA or stroke.................................................................................76Table 4.3.1 CPGs and consensus statements relating to AECG in patients with TLoC/syncope.....................77Table 4.3.2 2010 NICE recommendations for the use of AECG in patients with syncope..............................78Table 4.3.3 2009 ESC and EHRA recommendations for AECG in patients with syncope..............................79Table 4.4.1 Consensus and position statements relating to AECG in patients with palpitations......................81Table 4.4.2 2009 EHRA recommendations for AECG in patients with undocumented palpitations...............82Table 4.4.3 2011 EHRA indications for AECG in patients with palpitations..................................................82Table 4.5.1 CPGs relating to AECG in patients who have experienced MI.....................................................83Table 4.6.1 CPGs and consensus statements relating to AECG in patients with arrhythmias..........................83Table 4.6.2 2015 ESC and 2006 ACC/AHA/ESC recommendations for AECG in patients with
ventricular arrhythmia....................................................................................................................84Table 4.6.3 2013 PACES/HRS recommendations for AECG in the evaluation of children with
ventricular arrhythmia and a structurally normal heart..................................................................85Table 4.7.1 CPG relating to AECG in patients with heart failure.....................................................................85Table 4.7.2 2013 CCS recommendations for the use of AECG in children with heart failure.........................86Table 4.8.1 CPG relating to AECG for patients with valvular heart disease....................................................86Table 4.9.1 CPGs relating to AECG for patients with other cardiomyopathies...............................................87Table 4.9.2 2011 ACCF/AHA recommendations for the use of AECG in patients with HCM.......................88Table 4.9.3 2011 BSC indications for AECG in patients with chronic chagasic cardiopathy..........................89Table 4.10.1 CGPs and policy statements relating to AECG for patients with congenital heart disease...........89Table 4.10.2 2014 PACES/HRS recommendations for AECG in patients with congenital heart disease..........90Table 4.11.1 CPGs and consensus statements relating to AECG for perioperative risk stratification...............91Table 4.11.2 2011 ACCF/AHA recommendations for AECG in patients with arrhythmia post CABG............91
MBS Review – Ambulatory Electrocardiography Review Report Page 6

May 2016
Table 4.12.1 CPGs and consensus statements relating to AECG for remote monitoring of CIEDs...................92Table 5.1.1 Citation details for included systematic reviews or HTAs.............................................................94Table 5.1.2 Characteristics of the identified HTA of remote ECG monitoring for any indication...................96Table 5.1.3 Studies included in the AHRQ (2007) HTA for the detection of arrhythmia in any
indication, showing other HTAs/SRs with overlapping studies....................................................98Table 5.1.4 Characteristics of included systematic reviews for the detection of atrial fibrillation.................100Table 5.1.5 Studies included in the systematic reviews: atrial fibrillation.....................................................103Table 5.1.6 Characteristics of included systematic reviews/HTAs: syncope.................................................106Table 5.1.7 Studies included in the systematic reviews/HTAs: syncope........................................................109Table 5.1.8 Characteristics of the identified systematic review of AECG for palpitations............................111Table 5.1.9 Studies included in the Hoefman (2010) systematic review of AECG for palpitations..............111Table 5.1.10 Key included systematic reviews/HTAs and AECG devices investigated..................................112Table 5.2.1 Citation details for identified RCTs.............................................................................................113Table 5.2.2 RCT publications, indicating where included in a SR/HTA........................................................114Table 5.2.3 Study characteristics of RCT publications (and associated studies) for AF after stroke.............116Table 5.2.4 Study characteristics of RCT publication for atrial fibrillation after ablation.............................117Table 5.2.5 Study characteristics of RCT publications for syncope...............................................................118Table 5.2.6 Study characteristics of RCTs for palpitations.............................................................................119Table 5.2.7 RCTs and associated studies: clinical evidence presented in addition to SR/HTA evidence......120Table 5.3.1 AHRQ (2007): Outcomes reported in ILR studies......................................................................121Table 5.3.2 AHRQ (2007): Change in management after ILR.......................................................................122Table 5.3.3 AHRQ (2007): Syncopal episodes after ILR tests.......................................................................123Table 5.3.4 AHRQ (2007): Mortality after ILR tests......................................................................................124Table 5.3.5 AHRQ (2007): Outcomes reported in ELR studies.....................................................................124Table 5.3.6 AHRQ (2007): Change in management after ELR......................................................................125Table 5.3.7 Characteristics of RCTs comparing AECG devices....................................................................127Table 5.3.8 AHRQ (2007): Change in disease management after AECG monitoring...................................128Table 5.3.9 AHRQ (2007): Patient flow and resolution of syncope after AECG-guided treatment..............129Table 5.3.10 Sposato (2015): Time to start of monitoring and duration of monitoring for different
groups...........................................................................................................................................131Table 5.3.11 Sposato (2015): Characteristics and findings of included studies...............................................132Table 5.3.12 Sposato (2015): Pooled estimates of diagnostic yield for different monitoring groups..............133Table 5.3.13 Sposato (2015): Cumulative proportion of total diagnoses..........................................................138Table 5.3.14 Afzal (2015): Characteristics and findings of included studies...................................................140Table 5.3.15 Findings of the CRYSTAL AF RCT and recently published analyses........................................145Table 5.3.16 Findings of the EMBRACE RCT................................................................................................147Table 5.3.17 Westby (2010): Population groups for AECG studies.................................................................153Table 5.3.18 Time to first syncope (suspected arrhythmic cause)....................................................................157Table 5.3.19 Westby (2010): Time to first syncope, suspected neurally mediated syncope............................160Table 5.3.20 Westby (2010): Time to first syncope (unexplained syncope after secondary tests)...................166Table 5.3.21 Westby (2010): Descriptive statistics summarising results of observational AECG studies
and RCT cohorts..........................................................................................................................167Table 5.3.22 Westby (2010): Summary statistics for deaths and adverse events, by population and
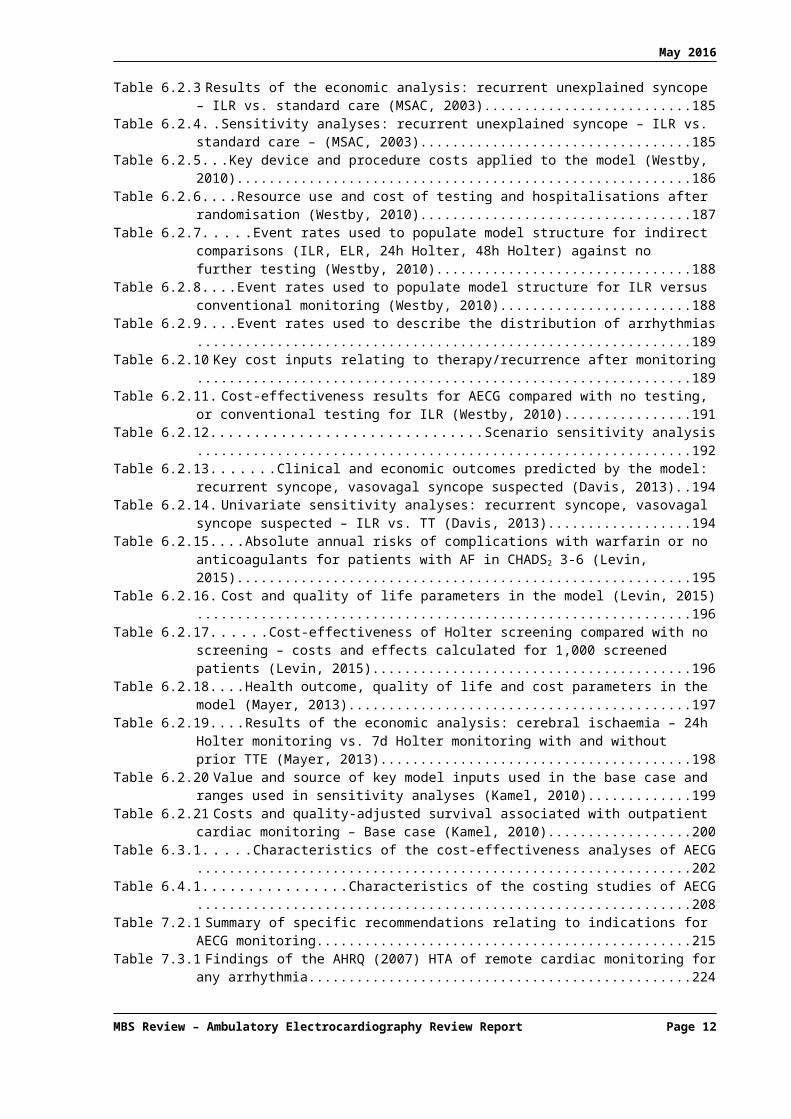
device...........................................................................................................................................172Table 5.3.23 Hoefman (2010): Findings of comparative studies and studies with subgroup comparisons......177Table 5.3.24 Hoefman (2010): Findings of non-comparative studies...............................................................178Table 6.1.1 Listing of all included economic studies......................................................................................179Table 6.2.1 Characteristics of included cost-utility analyses of AECG..........................................................181Table 6.2.2 Key inputs used in the model (MSAC, 2003)..............................................................................184Table 6.2.3 Results of the economic analysis: recurrent unexplained syncope – ILR vs. standard care
(MSAC, 2003)..............................................................................................................................185Table 6.2.4 Sensitivity analyses: recurrent unexplained syncope – ILR vs. standard care – (MSAC,
2003)............................................................................................................................................185Table 6.2.5 Key device and procedure costs applied to the model (Westby, 2010).......................................186Table 6.2.6 Resource use and cost of testing and hospitalisations after randomisation (Westby, 2010)........187Table 6.2.7 Event rates used to populate model structure for indirect comparisons (ILR, ELR, 24h
Holter, 48h Holter) against no further testing (Westby, 2010)....................................................188Table 6.2.8 Event rates used to populate model structure for ILR versus conventional monitoring
(Westby, 2010).............................................................................................................................188Table 6.2.9 Event rates used to describe the distribution of arrhythmias.......................................................189Table 6.2.10 Key cost inputs relating to therapy/recurrence after monitoring.................................................189
MBS Review – Ambulatory Electrocardiography Review Report Page 7

May 2016
Table 6.2.11 Cost-effectiveness results for AECG compared with no testing, or conventional testing for ILR (Westby, 2010).....................................................................................................................191
Table 6.2.12 Scenario sensitivity analysis........................................................................................................192Table 6.2.13 Clinical and economic outcomes predicted by the model: recurrent syncope, vasovagal
syncope suspected (Davis, 2013).................................................................................................194Table 6.2.14 Univariate sensitivity analyses: recurrent syncope, vasovagal syncope suspected – ILR vs.
TT (Davis, 2013)..........................................................................................................................194Table 6.2.15 Absolute annual risks of complications with warfarin or no anticoagulants for patients
with AF in CHADS2 3-6 (Levin, 2015).......................................................................................195Table 6.2.16 Cost and quality of life parameters in the model (Levin, 2015)..................................................196Table 6.2.17 Cost-effectiveness of Holter screening compared with no screening – costs and effects
calculated for 1,000 screened patients (Levin, 2015)..................................................................196Table 6.2.18 Health outcome, quality of life and cost parameters in the model (Mayer, 2013).......................197Table 6.2.19 Results of the economic analysis: cerebral ischaemia – 24h Holter monitoring vs. 7d
Holter monitoring with and without prior TTE (Mayer, 2013)...................................................198Table 6.2.20 Value and source of key model inputs used in the base case and ranges used in sensitivity
analyses (Kamel, 2010)................................................................................................................199Table 6.2.21 Costs and quality-adjusted survival associated with outpatient cardiac monitoring – Base
case (Kamel, 2010).......................................................................................................................200Table 6.3.1 Characteristics of the cost-effectiveness analyses of AECG.......................................................202Table 6.4.1 Characteristics of the costing studies of AECG...........................................................................208Table 7.2.1 Summary of specific recommendations relating to indications for AECG monitoring...............215Table 7.3.1 Findings of the AHRQ (2007) HTA of remote cardiac monitoring for any arrhythmia..............224Table 7.3.2 Findings of the systematic review by Sposato (2015) for detection of post-IS/TIA AF.............227Table 7.3.3 Findings of the SR by Afzal (2015) for the detection of post-cryptogenic stroke AF.................228Table 7.3.4 Findings of the CRYSTAL AF RCT and associated studies.......................................................229Table 7.3.5 Findings of the EMBRACE RCT................................................................................................231Table 7.3.6 Conclusions from evidence for AECG for the detection of AF after stroke................................232Table 7.3.7 Findings of the Westby (2010) SR for suspected arrhythmic syncope for two main
diagnostic yield outcomes and change in patient management...................................................235Table 7.3.8 Findings of the Westby (2010) SR for suspected neurally mediated syncope.............................236Table 7.3.9 Findings of the Westby (2010) SR for unexplained syncope after initial tests............................237Table 7.3.10 Findings of the Westby (2010) SR for unexplained syncope after secondary tests for two
main diagnostic yield outcomes and change in patient management..........................................238Table 7.3.11 Findings of additional AECG RCTs for syncope........................................................................240Table 7.3.12 Conclusions from evidence for AECG for the evaluation of syncope.........................................242Table 7.3.13 Conclusions from evidence for AECG for the evaluation of palpitations: diagnostic yield........245
Table A-2.1 Members of the RWG for the MBS Review of AECG................................................................256Table A-3.1 MBS item descriptors and fees relevant to AECG.......................................................................257Table A-3.2 Explanatory Notes relating to MBS items for AECG..................................................................258Table A-3.3 Item number, descriptor and schedule fee start dates for MBS item numbers............................259Table A-3.4 Growth in AECG services............................................................................................................260Table A-3.5 Number of AECG services by state/territory, 2014-15................................................................260Table A-4.1 EMBASE search strategy for clinical studies (systematic reviews), economic studies and
guidelines.....................................................................................................................................261Table A-4.2 Medline search strategy for clinical studies (systematic reviews), economic studies and
guidelines.....................................................................................................................................263Table A-4.3 PubMed search strategy for systematic reviews of clinical studies.............................................265Table A-4.4 Cochrane Library search strategy for HTAs and economic evaluations......................................266Table A-5.1 Designations of levels of evidence for interventional and diagnostic accuracy studies..............267Table A-6.1 The AMSTAR measurement tool for assessing the methodological quality of SRs...................268Table A-6.2 AMSTAR scores of included systematic reviews........................................................................270Table A-7.1 1999 ACC/AHA indications where AECG is considered to be useful........................................271Table A-7.2 1999 ACC/AHA indications for which AECG may be useful....................................................272Table A-7.3 1999 ACC/AHA indications where the usefulness of AECG is less well established................272Table A-7.4 1999 ACC/AHA indications for which AECG is not considered useful.....................................273Table A-8.1 2009 ESC clinical features that can suggest a diagnosis of syncope on initial evaluation..........275Table A-8.2 2009 ESC risk stratification.........................................................................................................276Table A-9.1 American College of Cardiology Foundation/American Heart Association (ACCF/AHA)
Classification of recommendations and Level of evidence..........................................................277
MBS Review – Ambulatory Electrocardiography Review Report Page 8

May 2016
Table A-9.2 American College of Cardiology/American Heart Association (ACC/AHA) Classes of recommendation...........................................................................................................................277
Table A-9.3 Heart and Stroke Foundation of Canada (HSFC) Levels of evidence.........................................278Table A-9.4 Canadian Cardiovascular Society (CCS) Strength of recommendations and Quality of
evidence classifications................................................................................................................278Table A-9.5 National Institute for Health and Care Excellence (NICE) classification of the evidence
based on GRADE.........................................................................................................................278Table A-9.6 The European Society of Cardiology (ESC) and the European Heart Rhythm Association
(EHRA) Classes of recommendations and Level of evidence.....................................................279Table A-9.7 European Stroke Organisation (ESO) Strength of recommendations and Quality of
evidence........................................................................................................................................279Table A-9.8 Brazilian Society of Cardiology (BSC) Class of recommendations and Level of evidence........279Table A-10.1 Citation details for systematic reviews or HTAs investigating AECG for risk assessment........281Table A-10.2 Results of meta-analysis of AECG-based TWA studies (Quan, 2014).......................................282Table A-10.3 Comparison of tests for predicting major arrhythmic events (Bailey, 2001)...............................284Table A-10.4 Summary of clinical characteristics and sensitivity and specificity of studies included in
MA...............................................................................................................................................287
MBS Review – Ambulatory Electrocardiography Review Report Page 9
May 2016
TABLE OF FIGURES
Figure 1.4.1 Clinical decision pathway for patients with palpitations or undiagnosed syncope........................37Figure 3.1.1 Number of services for Item 11708, by regional status, 2010-11 to 2014-15...............................50Figure 3.1.2 Number of services for Item 11709, by regional status, 2010-11 to 2014-15...............................51Figure 3.1.3 Number of services for Item 11710, by regional status, 2010-11 to 2014-15...............................52Figure 3.1.4 Number of services for Item 11711, by regional status, 2010-11 to 2014-15...............................53Figure 3.1.5 Number of services for Item 38285, by regional status, 2010-11 to 2014-15...............................54Figure 3.1.6 Number of services for Item 11722, by regional status, 2010-11 to 2014-15...............................55Figure 3.1.7 Total services for MBS item 11708 by age group and gender, 2014-15.......................................56Figure 3.1.8 Total services for MBS item 11709 by age group and gender, 2014-15.......................................56Figure 3.1.9 Total services for MBS item 11710 by age group and gender, 2014-15.......................................57Figure 3.1.10 Total services for MBS item 11711 by age group and gender, 2014-15.......................................57Figure 3.1.11 Total services for MBS item 38285 by age group and gender, 2014-15.......................................58Figure 3.1.12 Total services for MBS item 11722 by age group and gender, 2014-15.......................................58Figure 3.1.13 Number of services for Item 11708 by specialty of service provider, 2010-11 to 2014-15..........64Figure 3.1.14 Number of services for Item 11709 by specialty of service provider, 2010-11 to 2014-15..........65Figure 3.1.15 Number of services for Item 11710 by specialty of service provider, 2010-11 to 2014-15..........65Figure 3.1.16 Number of services for Item 11711 by specialty of service provider, 2010-11 to 2014-15..........66Figure 3.1.17 Number of services for Item 38285 by specialty of service provider, 2010-11 to 2014-15..........66Figure 3.1.18 Number of services for Item 11722 by specialty of service provider, 2010-11 to 2014-15..........67Figure 5.3.1 Sposato (2015): Patients diagnosed with AF during in-hospital Holter (part of Phase 2)...........134Figure 5.3.2 Sposato (2015): Patients diagnosed with AF during outpatient Holter (Phase 3)........................135Figure 5.3.3 Sposato (2015): Patients diagnosed with AF using MCT, ELR or ILR (Phase 4).......................136Figure 5.3.4 Sposato (2015): Days to detection of post-stroke AF with MCT and ILR, adjusted for age,
sex and time to initiation of monitoring.......................................................................................137Figure 5.3.5 Sposato (2015): Sequential cardiac monitoring model showing probability of progression
from one phase to the next...........................................................................................................138Figure 5.3.6 Meta-analysis of RCTs of AF detection post cryptogenic stroke................................................141Figure 5.3.7 Kapa (2013): Proportion of patients in each study arm taking antiarrhythmic drugs..................149Figure 5.3.8 Westby (2010): Diagnostic yield (diagnoses achieved) for ILR versus conventional testing.....151Figure 5.3.9 Westby (2010): Diagnostic yield for undiagnosed patients who crossed over to other
strategy.........................................................................................................................................151Figure 5.3.10 Westby (2010): Diagnostic yield for ELR versus 48h Holter monitoring...................................152Figure 5.3.11 Westby (2010): Proportion of patients with no syncope during monitoring (suspected
arrhythmic cause).........................................................................................................................155Figure 5.3.12 Westby (2010): Proportion of patients with syncope, no arrhythmia (suspected arrhythmic
cause)............................................................................................................................................155Figure 5.3.13 Westby (2010): Proportion of patients with arrhythmia during syncope (suspected
arrhythmic cause).........................................................................................................................156Figure 5.3.14 Westby (2010): Proportion of patients with arrhythmia, no syncope (suspected arrhythmic
cause)............................................................................................................................................156Figure 5.3.15 Westby (2010): Number of patients started on therapy (suspected arrhythmic cause)................157Figure 5.3.16 Westby (2010): 24h Holter versus 48h Holter: proportion of arrhythmic events detected
(suspected arrhythmic cause).......................................................................................................158Figure 5.3.17 Westby (2010): Proportion of patients with no syncope during monitoring (suspected
NMS)............................................................................................................................................158Figure 5.3.18 Westby (2010): Proportion of patients with syncope, no arrhythmia (suspected NMS).............159Figure 5.3.19 Westby (2010): Proportion of patients with arrhythmia during syncope (suspected NMS)........159Figure 5.3.20 Westby (2010): Proportion of patients with arrhythmia, no syncope (suspected NMS).............159Figure 5.3.21 Westby (2010): Number of patients started on therapy (suspected NMS)..................................159Figure 5.3.22 Westby (2010): Proportion of patients with no syncope during monitoring (unexplained
after initial tests)...........................................................................................................................160Figure 5.3.23 Westby (2010): Proportion of patients with syncope, no arrhythmia (unexplained after
initial tests)...................................................................................................................................161Figure 5.3.24 Westby (2010): Proportion of patients with arrhythmia during syncope (unexplained after
initial tests)...................................................................................................................................161Figure 5.3.25 Westby (2010): Proportion of patients with arrhythmia, no syncope (unexplained after
initial tests)...................................................................................................................................161
MBS Review – Ambulatory Electrocardiography Review Report Page 10

May 2016
Figure 5.3.26 Westby (2010): Proportion of patients with arrhythmias recorded after Holter monitoring for 24h vs 48h vs 72h (unexplained after initial tests).................................................................162
Figure 5.3.27 Westby (2010): Proportion of patients with no syncope during monitoring (unexplained syncope after secondary tests)......................................................................................................163
Figure 5.3.28 Westby (2010): Proportion of patients with syncope, no arrhythmia (unexplained syncope after secondary tests)....................................................................................................................164
Figure 5.3.29 Westby (2010): Proportion of patients with arrhythmia during syncope (unexplained syncope after secondary tests)......................................................................................................165
Figure 5.3.30 Proportion of patients with arrhythmia, no syncope (unexplained syncope after secondary tests).............................................................................................................................................165
Figure 5.3.31 Westby (2010): Number of patients started on therapy (unexplained syncope after secondary tests)............................................................................................................................166
Figure 5.3.32 Westby (2010): Arrhythmia during syncope, AT/PT vs PT for ILRs..........................................170Figure 5.3.33 Westby (2010): Arrhythmia with no syncope: AT/PT vs PT for ILRs........................................170Figure 5.3.34 Westby (2010): Diagnostic test accuracy of ILR to direct pacing vs symptom-free after
pacing...........................................................................................................................................172Figure 5.3.35 Time to ECG diagnosis...............................................................................................................174
MBS Review – Ambulatory Electrocardiography Review Report Page 11
May 2016
ABBREVIATIONS
Acronym DescriptionAAD Antiarrhythmic drugsAAP American Academy of PaediatricsACC American College of CardiologyACCF American College of Cardiology FoundationACP American College of PhysiciansAF Atrial fibrillationAHA American Heart AssociationAHRQ Agency for Healthcare Research and QualityAECG Ambulatory electrocardiographyAMSTAR Assessment of Multiple Systematic ReviewsAPB Atrial premature beatsARTG Australian Register of Therapeutic GoodsARVC Arrhythmogenic right ventricular cardiomyopathyASA American Society of AnesthesiologistsASA American Stroke AssociationAT Auto triggeredBBB Bundle branch blockBCMA British Columbia Medical AssociationBP Blood pressureBSC Brazilian Society of CardiologyCABG Coronary artery bypass graftCAD Coronary artery diseaseCAD Canadian dollarCCS Canadian Cardiovascular SocietyCDP Conventional diagnostic pathwayCEA Cost-effectiveness analysisCHADS Congestive heart failure, Hypertension, Age, Diabetes, prior StrokeCI Confidence intervalCIED Cardiovascular implantable electronic deviceCM CardiomyopathyCMFM Comprehensive Management Framework for the Medicare Benefits ScheduleCPG Clinical practice guidelineCPI Consumer price indexCPVT Catecholaminergic polymorphic ventricular tachycardiaCSANZ Cardiac Society of Australia and New ZealandCSM Carotid sinus massageCT Computed tomographyCUA Cost-utility analysisDRG Diagnosis-related groupECAS European Cardiac Arrhythmia SocietyECG ElectrocardiogramED Emergency departmentEHRA European Heart Rhythm AssociationELR External loop recorder (event loop recorder)EPS Electrophysiological studiesEQ-5D EuroQoL-5 dimensionsESC European Society of CardiologyESO European Stroke OrganisationHCM Hypertrophic cardiomyopathyHF Heart failureHR Hazard ratioHRG Healthcare Resource GroupHRQoL Health-related quality of lifeHRS Heart Rhythm SocietyHRV Heart rate variabilityHSFC Heart and Stroke Foundation of Canada
MBS Review – Ambulatory Electrocardiography Review Report Page 12

May 2016
Acronym DescriptionHTA Health Technology AssessmentICD Implantable cardioverter-defibrillatorICER Incremental cost-effectiveness ratioICM Implantable cardiac monitorILR Implantable loop recorderIPE In-person evaluationIQR Interquartile rangeIS Ischaemic strokeIS/TIA Ischaemic stroke/transient ischaemic attackITT Intention-to-treatIVT Idiopathic ventricular tachycardiaLBBB Left bundle branch blockLOE Level of evidenceLOS Length of stayLVSD Left ventricular systolic dysfunctionMA Meta-analysisMBS Medicare Benefits ScheduleMCOT Mobile cardiac outpatient telemetryMCT Mobile cardiac telemetryMI Myocardial infarctionMRI Magnetic resonance imagingNHFA National Heart Foundation of AustraliaNHMD National Hospital Morbidity DatabaseNHMRC National Health and Medical Research CouncilNHS National Health ServiceNICE National Institute for Health and Care ExcellenceNM Neurally mediatedNMS Neurally mediated syncopeNPV Negative predictive valueNZMA New Zealand Medical AssociationOAC Oral anticoagulantOAT Organised atrial tachyarrhythmiasOH Orthostatic hypotensionPACES Paediatric and Congenital Electrophysiology SocietyPAF Paroxysmal atrial fibrillationPBS Pharmaceutical Benefits SchemePICO Population, Intervention, Comparator, OutcomePICTURE Place of Reveal In the Care pathway and Treatment of patients with Unexplained Recurrent SyncopePNHS Portuguese National Health ServiceQALY Quality-adjusted life-yearQoL Quality of lifeRBBB Right bundle branch blockRCT Randomised controlled trialRM Remote monitoringPT Patient triggeredRV Right ventricularRWG Review Working GroupSAQ Seattle Angina QuestionnaireSCD Sudden cardiac deathSEK Swedish KronaSHD Structural heart diseaseSIGN Scottish Intercollegiate Guidelines NetworkSTEMI ST-segment elevation myocardial infarctionSR Systematic reviewTGA Therapeutic Goods AdministrationTIA Transient ischaemic attackTLoC Transient loss of consciousnessTT Tilt tableTTE Transthoracic echocardiographyTTM Trans-telephonic monitoring
MBS Review – Ambulatory Electrocardiography Review Report Page 13

May 2016
Acronym DescriptionTWA T-wave alternansUK United KingdomUS United StatesUSD US DollarVAS Visual analog scaleVT Ventricular tachycardia
MBS Review – Ambulatory Electrocardiography Review Report Page 14

May 2016
EXECUTIVE SUMMARY
The vast majority of Medicare Benefits Schedule (MBS) items are longstanding, with only a small proportion of services funded having undergone formal evidence-based assessment. MBS Reviews seek to ensure the Schedule reflects current clinical practice and contemporary evidence.
This Report presents the collection and analysis of evidence to inform assessment of the existing MBS items for ambulatory electrocardiography (AECG) to ensure the items reflect contemporary evidence, improve health outcomes for patients and represent value for money. The Report was prepared by HealthConsult Pty Ltd. and was commissioned by the Department of Health.
Description of ambulatory electrocardiography
An AECG monitor is a portable device for monitoring various electrical activities of the cardiovascular system. It allows extended recording of heart activity for observing occasional or transient cardiac arrhythmias, which would be difficult to identify in a shorter period of time, such as during a standard ECG.
The devices used to monitor ECG in ambulatory patients fall into two broad categories based on the type of data they record. Continuous recording devices (such as the Holter monitor) record all ECG data from a patient over a short time frame (short-term AECG; typically 24 hours). Event-recording devices only record events of interest rather than a continuous stream of data. These devices, known collectively as event monitors, can therefore be used to monitor patients over a longer period of time than Holters.
External event monitors can be worn for up to 4 weeks, providing medium-term AECG. These include event recorders (ERs), event loop recorders (ELRs) and mobile cardiac telemetry devices (MCTs, also known as real-time continuous monitoring devices). Internal event monitors are implanted devices (implantable loop recorders; ILRs) and can monitor for many months or years (long-term AECG). The looping function of ELRs, ILRs and MCT devices allows recording to start a few seconds prior to the event, when triggered by the patient or, in some cases, auto activated based on a programmed algorithm.
AECG is currently used for a variety of conditions and indications where infrequent arrhythmia is suspected or requires characterisation or monitoring. The most common use is for the assessment of patients with cardiac palpitations and unexplained syncope. However, as event-recording technologies capable of reliable auto activation over longer time periods become more widely available in Australia, new indications are likely to emerge.
Purpose of the Review
The MBS Review of AECG was initiated as a result of a significant increase in MBS utilisation of AECG services over the past five years. Further details are provided in Section 3 of this Review, which explores the potential drivers of growth. To address the concern that patients may be undergoing unnecessary investigation with AECG monitoring, the published evidence was reviewed to identify clinical presentations for which AECG monitoring provides benefit and is cost-effective.
MBS Review – Ambulatory Electrocardiography Review Report Page 15

May 2016
The services in scope of this Review involve the analysis, interpretation and reporting of AECG recordings (MBS items 11708, 11709, 11710, 11711, 11722) and implantation of a loop recorder (MBS item 38285). The current descriptors and Schedule fees for these items are provided in Appendix 3. The services relate to the following AECG devices:
Continuous recording devices for short-term monitoring (typically 24 hours)o Holter monitors (Item 11709)o Other continuous monitors (Item 11708)
External event recorders for medium-term monitoring (a few days to a month)o Patient-activated ELRs (Item 11710)o Patient-activated ERs (Item 11711)
ILRs for long-term monitoring (several months to years)o ILRs – implantation procedure (Item 38285)o ILRs – analysis and reporting (Item 11722)
Review methodology
The review methodology (detailed in Section 2) comprised the following components: consulting with key stakeholders; developing a review protocol that outlined the detailed review methodology (including the key clinical/research questions); analysing MBS data to determine current usage of AECG services in Australia; determining concordance of the MBS services with Australian and international guidelines; conducting a systematic literature review and appraisal of the clinical and economic evidence for AECG; and undertaking an assessment and analysis of the evidence to draw conclusions in relation to the clinical/research questions.
Stakeholder consultation
Stakeholder engagement is a pivotal part of the MBS Review process, particularly as feedback helps inform the final Review Report. During the review process, stakeholders were informed of the intention of the review of AECG, and were given the opportunity to comment on the Review scope, the proposed methodology, and the draft Review Report. Relevant documents were released for public consultation and stakeholder comments were considered and incorporated prior to finalisation of the protocol and report. As part of the MBS Review process, the Department established a Review Working Group (RWG). The RWG comprises nominated experts to provide clinical input and ensure the Review reflects current Australian practice. Appendix 2 outlines the RWG members for this Review.
Summary of findings
Current usage of AECG in Australia
As shown in Table ES.1, the usage of each of the six MBS items for AECG monitoring has been increasing over time. In order to investigate whether this growth can be attributed to an increase in the number of services per patient per year (for example, to cover extended monitoring periods), the frequency of AECG services per patient was analysed. No material changes were observed in the proportion of patients receiving multiple services per year for Holter monitoring (approximately 8% per year) or for monitoring using external or implantable event recorders.
However, there has been a substantial increase in the proportion of patients receiving multiple (two or more) services per year for Item 11708 (40% in 2014-15, up from 19% in 2010-11),
MBS Review – Ambulatory Electrocardiography Review Report Page 16

May 2016
which has contributed to a sudden and marked increase in the number of claims for this item. According to expert advice, Item 11708 (for continuous recording not using a Holter) is possibly being used for services relating to MCT devices, such as V-Patch. These devices do not produce a continuous record of the patient’s full ECG, but are event recorders, continuously primed to upload brief ECG recordings to a remote diagnostic monitoring laboratory at the time the event occurs, rather than at the end of the monitoring period.
Table ES.1 Use of AECG MBS items, 2010-11 to 2014-15
MBS item Data 2010-11 2011-12 2012-13 2013-14 2014-15 5-year growth
11708Other continuousrecording
No. of services 2,383 3,780 5,039 5,883 6,216 161%
No. of patients 1,591 2,380 3,071 3,477 3,507 120%
Benefits paid $243,452 $389,800 $527,299 $614,080 $649,412 167%
11709Holter
No. of services 177,200 202,825 221,634 249,109 277,643 57%
No. of patients 164,203 188,532 204,874 227,549 249,729 52%
Benefits paid $24,290,178
$28,354,289
$31,554,808
$35,732,921
$39,795,143
64%
11710ELR
No. of services 3,812 4,045 4,122 4,333 4,308 13%
No. of patients 3,683 4,000 3,926 4,159 4,267 15.9%
Benefits paid $168,442 $181,718 $189,431 $201,032 $199,735 19%
11711ER
No. of services 555 648 819 823 813 46%
No. of patients 542 670 785 781 789 46%
Benefits paid $13,667 $15,988 $21,229 $21,640 $21,622 58%
38285ILR (insertion)
No. of services 576 654 772 987 1,944 238%
No. of patients 570 655 766 1,079 1,944 241%
Benefits paid $74,443 $84,980 $103,379 $133,581 $262,258 252%
11722ILR
No. of services 2,408 2,876 3,655 4,662 7,076 194%
No. of patients 1,218 1,576 2,032 2,502 3,841 215%
Benefits paid $68,833 $84,188 $108,336 $139,547 $212,526 209%Source: Medicare Australia. Accessed 8 March 2016Note: These data are determined by the date the service was processed, not the date the service was provided by Medicare Australia.Abbreviations: AECG, ambulatory electrocardiography, ELR, event loop recorder; ER, event recorder; ILR, implantable loop recorder; MBS, Medicare Benefits Schedule.
In order to explore whether the observed increase in AECG services is due to greater dispersion of the technologies into regional Australia, MBS data were analysed by patient remoteness area. Between 2010-11 and 2014-15, there was no substantial change in the proportion of patients from various regional and remote areas receiving services for Items 11709, 11710, 11711, 38285 and 11722, with patients in major cities accounting for more than 70% of services. However, for Item 11708, there has been a marked change in the proportion of patients from inner and outer regional Australia receiving the service. In 2014-15, patients in regional areas accounted for approximately one third of all services for Item 11708.
In terms of the health professionals providing AECG monitoring services, the substantial growth of Holter monitor services appears to be driven by an increase in use by cardiologists, rather than increased use by GPs. However, interpretation of these data are hampered by the fact that pathologists also dispense Holter monitors on behalf of other healthcare professionals (including GPs). The number of Holter services provided by pathology specialists increased by 69% over the past five years, and in 2014-15 they accounted for 27% of services for Item
MBS Review – Ambulatory Electrocardiography Review Report Page 17

May 2016
11709. In comparison, almost half of Holter monitoring services are provided by cardiologists, whereas less than 5% are provided directly by GPs.
GPs provided only a small proportion of services relating to monitoring using external or implantable event recorders and therefore the marked growth of these services is driven by cardiologists. There has been substantial growth in the number of services for Item 11708 provided by both cardiologists and GPs. GPs accounted for 13% of services in 2010-11, rising to 27% in 2014-15.
In summary, the increase in services for Item 11708 can be partly attributed to increased use by GPs, increased dispersion of the technology into regional Australia, and an increase in the frequency of services per patient (which may indicate repeat services to cover longer-term monitoring). In contrast, the observed increase in services for monitoring using Holters or external or implantable event recorders is not explained by these factors. It is possible that the observed growth may be due to an increase in the accessibility of AECG monitors overall or to increasing use of the service for emerging indications.
Clinical guidance on AECG
The search identified 41 clinical practice guidelines (CPGs), consensus and position statements relating to AECG monitoring. Three CPGs provide guidance relating to the general use of AECG and are not restricted to any particular indication. Twnenty-nine documents provide guidance on the use of AECG for specific clinical indications. Section 3 summarises the key advice provided in each of the guidelines and position statements.
For what clinical indications is AECG recommended?The most current Australian guideline on AECG monitoring was published by the Cardiac Society of Australia and New Zealand (CSANZ) in 2012. It is based on two American guidelines on AECG published in 1993 and 1999, and contains no formal recommendations or clear links to the clinical evidence.
According to the CSANZ guideline, the major indications for AECG are: patients in whom the probable mechanism of palpitations is not clear from clinical
history; and patients with syncope or presyncope in whom bradycardia or tachycardia is suspected.
The CSANZ guideline states that AECG may also be indicated for: patients with pacemakers, in whom pacemaker malfunction is suspected; risk assessment post myocardial infarction (MI); or follow up of drug therapy for arrhythmias.
Formal recommendations relating to indications for AECG monitoring are collated in Section 7 (Table 7.2.120) from the 29 guidance documents for specific clinical indications. The recommendations, together with the class of recommendation and level of evidence (where reported), are categorised according to indication and duration of AECG monitoring. Table ES.2 provides a list of these indications, by duration of monitoring/device.
Several guidelines and position statements also mentioned other indications for AECG monitoring (mainly short-and medium term), but did not develop formal recommendations. These indications included:
follow up after an atrial fibrillation (AF) ablation procedure;
MBS Review – Ambulatory Electrocardiography Review Report Page 18

May 2016
diagnosis of catecholaminergic polymorphic ventricular tachycardia, particularly in children who are not able to perform exercise testing;
diagnosis of sick sinus syndrome; and investigation of cardiac dysfunction in patients with Duchenne or Becker muscular
dystrophy.
MBS Review – Ambulatory Electrocardiography Review Report Page 19

May 2016
Table ES.2 Indications for AECG, by monitoring duration and device type, derived from recommendations in clinical practice guidelines and position statementsShort-term monitoring
Continuous recorders (Holter)Medium-term monitoring
ELRs and ERsLong-term monitoring
ILRs patients with a suspected cardiac arrhythmic cause of syncope patients with a suspected cardiac arrhythmic cause of syncope patients with a suspected cardiac arrhythmic cause of syncope patients with unexplained syncope patients with unexplained syncope patients with unexplained syncope patients who have experienced ischaemic stroke or TIA, when
arrhythmias are suspected and no other causes are found, in potential candidates for oral anticoagulant therapy
patients with recurrent (pre)syncopes of suspected arrhythmic origin and absence of high-risk criteria that require immediate hospitalisation or intensive evaluation
early phase evaluation in patients with recurrent syncope of uncertain origin who have absence of high-risk criteria that require immediate hospitalisation or intensive evaluation
patients with suspected paroxysmal AF undetected by standard ECG recording
patients with suspected paroxysmal AF undetected by standard ECG recording
assessment of bradycardia before embarking on cardiac pacing in patients with suspected or certain reflex (neutrally mediated) syncope presenting with frequent or traumatic syncopal episodes
assessment of the efficacy of treatment in patients treated with rhythm control
detection of AF after ischaemic stroke or TIA with no other apparent cause
severe infrequent palpitations associated with haemodynamic compromise, when all the other examinations prove inconclusive
assessment of rate control or bradycardia in patients with AF treated with rate control
selected older patients with an acute, nonlacunar, embolic stroke of undetermined source, in potential candidates for oral anticoagulant therapy
palpitations in non-compliant patients without haemodynamic compromise when a clinically significant arrhythmic cause is likely or must be ruled out
patients with recurrent palpitations, undocumented by conventional ECG techniques
patients with recurrent palpitations, undocumented by conventional ECG techniques
patients with congenital heart disease where the index of suspicion for a malignant arrhythmia is high (e.g. syncope) but a symptom–rhythm correlation cannot be established by conventional testing
patients with congenital heart disease when there is a need to clarify or exclude an arrhythmia diagnosis, correlate arrhythmias with symptoms, evaluate risk, or determine appropriate therapy
patients with congenital heart disease to establish whether or not sporadic symptoms are caused by transient arrhythmias
assessment of arrhythmias and prognostic stratification of patients with chronic chagasic cardiopathy
initial evaluation of patients with hypertrophic cardiomyopathy to detect ventricular tachycardia and identify patients who may be candidates for ICD therapy
initial assessment of Chagas’ heart disease in patients with altered resting ECG
adults with hypertrophic cardiomyopathy to assess for asymptomatic paroxysmal AF/atrial flutter
initial evaluation of asymptomatic adolescent and young adult patients with tricuspid regurgitation
patients with hypertrophic cardiomyopathy who develop palpitations or light-headedness
infants and children with previously documented frequent ventricular ectopy, and when continued ectopy is confirmed or strongly suspected
infants and children suspected of having ventricular arrhythmiasAbbreviation: AECG, ambulatory electrocardiography; AF, atrial fibrillation; ECG, electrocardiogram; ELR, event loop recorder; ER, event recorder; ICD, implantable cardioverter-defibrillator; ILR, implantable loop recorder; TIA, transient ischaemic attack.
MBS Review – Ambulatory Electrocardiography Review Report Page 20
May 2016
For what clinical indications is one duration of AECG monitoring recommended over another?CPGs emphasise that the choice of monitoring technique in different clinical situations should be determined by the patient’s history, clinical characteristics and nature of symptoms, but it is primarily driven by the frequency of symptoms. In general:
Holter monitoring (24-48 hours) is indicated in patients who have very frequent symptoms (symptoms that occur daily or at least once per week), or are unable to use other AECG monitoring devices. If the initial Holter monitoring is inconclusive due to low frequency of symptoms, a repeated Holter monitoring may not be appropriate and second-line investigations should be considered.
ERs or ELRs are recommended for patients with recurrent symptoms that occur weekly or at least once a month. External event recording is generally not recommended for more than 3–4 weeks due to poor patient compliance.
ILRs are useful for patients with infrequent symptoms (monthly to yearly) when all the other examinations prove inconclusive, and for non-compliant patients when a clinically significant arrhythmic cause is likely or must be ruled out.
For what clinical indications is one mechanism of triggering event recording (i.e. intermittent recording) recommended over another?There were no clear recommendations relating to the mechanism of triggering recording; however, general guidance suggests that the use of patient-activated ERs for the detection of arrhythmias may be inappropriate in patients experiencing sudden asymptomatic syncope due to the inability of the patient to activate the ER prior to fainting. Patient-activated ERs and patient-activated ELRs may also miss the detection of transient asymptomatic arrhythmias.
ERs and ELRs are generally considered to be more useful for palpitations (with weekly recurrence) than for syncope evaluation. However, patient-activated devices are useful only when symptoms (e.g. palpitations) last long enough to allow the patient to activate the recorder, and non-looping ERs have the disadvantage that arrhythmic triggers are not revealed.
Are the descriptors for the MBS item numbers/services under review consistent with evidence-based recommendations provided in clinical practice guidelines?The descriptors for the short-term and medium-term monitoring devices (Items 11708, 11709, 11710, and 11711) do not provide any details of the intended target population for AECG monitoring, nor restrict the use of AECG monitoring to any particular clinical indication.
In contrast, the descriptors for MBS items 38285 and 11722, which are for ILRs, restrict use of these devices to the diagnosis of patients with recurrent unexplained syncope where: a diagnosis has not been achieved through all other available cardiac investigations; a neurogenic cause is not suspected; and it has been determined that the patient does not have structural heart disease associated with a high risk of sudden cardiac death. According to Explanatory Note T8.62 for Item 38285, the term ‘recurrent’ refers to more than one episode of syncope, where events occur at intervals of one week or longer.
Although the descriptors and Explanatory Notes relating to Items 38285 and 11722 are largely consistent with evidence-based CPGs, there are several other indications for ILR recommended in international CPGs (see Table ES.2).
MBS Reviews – Ambulatory Electrocardiography Review Report Page 21

May 2016
The Explanatory Note for Item 38285 lists the other available cardiac investigations that must be undertaken prior to implantation of a loop recorder. The list of prior tests includes either continuous ECG recording or AECG monitoring (MBS items 11708-11711), and an upright tilt table (TT) test (MBS item 11724). Several guidelines from Europe and the United States have raised concerns about the utility of TT testing in the diagnostic workup of patients with recurrent unexplained syncope due to poor correlation between the responses of TT testing and ECG observation at the time of spontaneous syncope (the reference standard). The National Institute for Health and Care Excellence (NICE, 2010) guideline for the management of transient loss of consciousness (TLoC) specifically recommends against TT testing as a first-line investigation for a person with unexplained syncope or a suspected cardiac arrhythmic cause of syncope.
The descriptors for two MBS items for continuous recording (Items 11708 and 11709) specify an ECG is recorded for a period of 12 hours or more. Where a recording is analysed and reported on, and a decision is made to undertake a further period of recording, the second episode is regarded as a separate service. There is no upper limit for recording duration and no limit on the number of services that may be claimed within a specified time period. CPGs generally recommend 24-hour Holter, although some also suggest that 48-hour Holter may be appropriate (e.g. for frequent syncope). If Item 11708 is being claimed for MCT devices, such as V-Patch, it may provide monitoring for a week or more.1
The two MBS items for external event recording (Items 11710 and 11711) specify a patient is monitored over a period of 12 hours or more, with no further guidance on an appropriate monitoring period. However, the descriptors for Items 11710 and 11711 specify that the benefits are payable once in any four-week period. External event recorders are not recommended for more than three to four weeks’ use due to poor patient compliance.
The Explanatory Note relating to Item 38285 states that benefits are payable only once per day, which is appropriate for implantation of a loop recorder. There is no limit of the frequency of benefits payable for ILR monitoring using Item 11722. The battery life of an ILR is two years or more.
The descriptors for Items 11710 and 11711 restrict the use of these items to patient-activated devices. There is no mention of whether the devices can also be auto triggered, so the use of Item 11710 can presumably extend to devices that are auto plus patient triggered. Clinical guidelines advise that the use of patient-activated external event recorders for the detection of arrhythmias may be inappropriate in patients experiencing sudden asymptomatic syncope (due to the inability of the patient to activate the device prior to fainting) and for detection of transient asymptomatic arrhythmias.
The descriptors and Explanatory Note relating to Items 38285 and 11722 do not specify the mechanism of triggering. ILRs may be patient triggered or auto plus patient triggered. The NICE (2010) guideline on the management of TLoC recommends that patients are offered an implantable event recorder that has both patient-activated and automatic detection modes.
Evidence for the effectiveness and safety of AECG
The literature search for systematic reviews and health technology assessments (HTAs) of AECG identified 13 eligible publications, which are assessed in Section 5. One HTA commissioned by the Agency for Healthcare Research and Quality (AHRQ) investigated remote cardiac monitoring in any population. The remaining systematic reviews investigated 1 V-Patch is designed to be worn for up to seven days without changing the patch or recharging the batteries.
MBS Reviews – Ambulatory Electrocardiography Review Report Page 22

May 2016
AECG for detection of AF, the diagnosis of syncope, or patients with palpitations. As the systematic reviews/HTAs are no longer current for some indications and do not include all indications for which AECG can be used, an additional literature search for randomised controlled trials (RCTs) was performed to identify any high-level evidence for patient-relevant outcomes not included in a systematic review. Four additional RCTs were identified in the following populations: AF after cryptogenic stroke; post-ablation AF; syncope; and syncope with bundle branch block.
The downstream utility of a diagnostic technology needs to evaluate whether diagnosis actually leads to a change in clinical management and, ideally, the Review should evaluate whether the diagnosis ultimately leads to improved patient-relevent outcomes. However, most studies in the field address the question of diagnostic yield, and rarely report downstream, patient-relevant outcomes. Therefore the question of effectiveness is largely addressed in the current Review in respect of diagnostic yield.
The bulk of AECG studies are non-comparative, and even where comparative evidence was available, systematic reviews would typically use cohort data to derive diagnostic yield summary statistics across all study types for a particular device or group of devices. Therefore, the comparative effectiveness of AECG is primarily addressed using low-level, non-comparative evidence.
The evidence was not well-suited to address the question of the relative effectiveness of AECG versus no AECG, as few studies included patients that had no prior AECG. However, prior monitoring frequently consisted of AECG from a shorter monitoring period. The comparison most readily afforded by the available evidence, therefore, is AECG versus no further monitoring, with the caveat that prior monitoring history is not necessarily consistent across all studies. With regard to the effectiveness of one duration of AECG compared to another, comparisons are also often confounded by heterogeneity of prior AECG monitoring, and conclusions must be considered in light of these limitations.
Detection of arrhythmia for any indicationDespite the age of the review and the extensive overlap with other key reviews, the AHRQ (2007) HTA was included in the current Review due to the focus on outcomes downstream from diagnosis.
Table ES.3 presents the findings from the AHRQ (2007) HTA with reference to the clinical questions of the current Review. The HTA included only medium- and long-term AECG devices as the index test (although Holter was included as a comparator). Monitoring with these devices was referred to collectively as remote cardiac monitoring.
Table ES.3 Findings of the AHRQ (2007) HTA of remote cardiac monitoring for any arrhythmiaClinical question by outcome
Population
Evidence base Findings Conclusions
Q1. AECG vs no further AECG
Change in management
Long-term AECG
ILR vs no further AECG
Unexplained syncope
Pooled odds ratio of change in management from 11 studies using comparator of 1 RCT as assumed rate for control group.
Moderate quality on average; moderate strength of evidence.
Direction of effect in favour of ILR, even in sensitivity analyses that increase control rate from 7.1% to 20%.
ILR superior to no ILR (conventional assessment).
Syncopal episode recurrence
Long-term AECG Proportions with syncope Conflicting findings; 1 high-quality RCT Insufficient evidence.
MBS Reviews – Ambulatory Electrocardiography Review Report Page 23

May 2016
Clinical question by outcome
Population
Evidence base Findings Conclusions
ILR vs no further AECG
Unexplained syncope
recurrence from 2 RCTs (1 high quality, 1 low quality and 2 case series (moderate quality).
found no difference between ILR and no ILR, the other found ILR superior but groups not actually randomised. One case series showed a significant reduction before/after test.
Mortality
Long-term AECG
ILR vs no further AECG
Unexplained syncope
Mortality rate from two RCTs (1 high quality, 1 low quality) and 1 moderate-quality case series.
No difference detected in high-quality RCT. Comparative data not available for other studies.
Insufficient evidence.
QoL
Long-term AECG
ILR vs no further AECG
Unexplained syncope
QoL assessments from 1 high-quality RCT.
6 months: no difference for either SF-12 or general well-being VAS.
12 months: general well-being VAS favours ILR, but small effect size.
Insufficient evidence.
Q2. Duration vs duration
Change in management
Medium-term vs long-term AECG
ER vs ILR
Palpitations
Proportions of ECG-guided treatment change from 1 moderate-quality RCT.
% with treatment change: 2/24 vs 19/26; p = 0.0002, favouring ILR, but study too small and imbalanced at baseline to allow conclusion.
Insufficient evidence for ER vs ILR.
Medium-term vs long-term AECG
ELR vs ILRSyncope
Proportions of ECG-guided treatment change from 1 moderate-quality RCT.
% with treatment change: 1/30 vs 14/30; p = 0.0001, favouring ILR, but study too small and imbalanced at baseline to allow conclusion.
Insufficient evidence for ELR vs ILR in change in management.
Syncopal episode recurrence
Medium-term vs long-term AECG
ELR vs ILR
Syncope
Proportions with syncope recurrence from 1 moderate-quality RCT.
1/1 vs 13/14 after first phase, 0/0 vs 7/8 in crossover phase, but authors note spontaneous resolution not captured equally for two tests (and is small and imbalanced at baseline).
Insufficient evidence for ELR vs ILR.
Q 3. Patient vs patient/auto triggeredChange in management
Medium-term AECG: PT vs AT/PT
MCT vs ELR
(80% of ELRs were PT-only)
Severe palpitations (<once /24h)
Proportions of ECG-guided treatment change and detection of clinically significant arrhythmias (presumably those requiring change in treatment) from 1 moderate-quality RCT.
% with treatment change: 55/134 vs 19/132; p < 0.05, favouring MCT.Significant difference, favouring MCT, in detection of clinically significant arrhythmias.
MCT (AT/PT) superior to ELR (PT).
Abbreviations: AECG, ambulatory electrocardiography; AT, auto triggered; ELR, event loop recorder; ER, event recorder; ILR, implantable loop recorder; MCT, mobile cardiac telemetry; mgmt., management; PT, patient triggered; QoL, quality of life; RCT, randomised controlled trial; SF-12, 12-item Short Form Health Survey; VAS, visual analog scale
Overall, the evidence was insufficient to allow conclusions about the impact of remote cardiac monitoring on any patient-relevant outcomes. However, evidence was identified that certain remote cardiac monitoring devices do lead to changes in patient management:
Patients with unexplained syncope are more likely to undergo a change in management when using ILR monitoring than when using conventional assessment (i.e. Holter monitoring and/or TT testing): moderate strength of evidence (based on 11 studies of moderate quality, on average).
Patients with severe palpitations less than once per 24 hours are more likely to undergo a change in disease management when using MCT (auto and patient activated) than when using patient-activated ELR: weak strength of evidence (one high-quality multicentre trial).
The evidence was insufficient to evaluate the effect of other remote monitoring devices (auto-activated ELRs and ERs) on change in disease management.
MBS Reviews – Ambulatory Electrocardiography Review Report Page 24

May 2016
For the purposes of the current Review, the evidence presented in AHRQ (2007) shows a difference in change in management for patients with unexplained syncope using long-term AECG compared to short-term AECG, favouring ILR. It also found a difference in change in management for patients with severe palpitations using MCT compared to patient-activated ELR, favouring the auto-activated MCT. Change in patient management is a surrogate outcome; the assumption is that any change has a positive impact on the patient.
Detection of AF after strokeTwo key systematic reviews with overlapping populations were included for this indication, one for non-haemorrhagic ischaemic stroke/transient ischaemic attack (IS/TIA) of any cause (Sposato et al, 2015) and the other for cryptogenic IS/TIA (Afzal et al, 2015). The findings of the key systematic reviews and largest RCTs (EMBRACE, N=572; and CRYSTAL AF, N=441) are summarised in Table ES.4. The majority of patients in studies of ELR, MCT or ILR had cryptogenic stroke.
Based on RCT evidence in cryptogenic stroke, ELR is superior to Holter monitoring (EMBRACE), and ILR is superior to no further monitoring (conventional follow up, consisting of Holter in 12% of patients over 12 months; CRYSTAL AF).
Diagnostic yield of ILR from pooled estimates and RCT cohorts are in agreement, typically 13-16%, with the exception of the pooled estimate of 23.3% from Afzal (2015). The only evidence that ILR may be superior to medium-term AECG is from a statistical comparison of this pooled estimate of 23.3% with that for ELR/MCT/96-hour Holter (Afzal, 2015), and from simulated cohorts based on a post hoc analysis of CRYSTAL AF. The only evidence that ILR may be superior to short-term AECG is from the same post hoc, simulated cohorts.
Overall, the evidence suggests that for patients with cryptogenic stroke, long-term AECG is superior to no further AECG, and medium-term AECG is superior to short-term AECG.
Detection of AF after ablationOne small pilot RCT provided evidence that after 6 months of concurrent monitoring in 38 post-ablation patients, ILR detected more AF than conventional monitoring (30-day ELR plus other tests; p = 0.002). After a further 6 months of monitoring with either ILR (N = 20) or conventional monitoring (N = 18), no difference was seen in AF detection. However, antiarrhythmic drugs were stopped in more patients in the ILR group than the ELR group over the entire study period (p = 0.04). The authors suggested that more comprehensive monitoring via ILR may provide greater confidence than less extensive monitoring that AF ablation was successful and the drugs could be stopped.
MBS Reviews – Ambulatory Electrocardiography Review Report Page 25

May 2016
Table ES.4 Conclusions from evidence for AECG for the detection of AF after strokeClinical questionComparison
Sposato (2015)IS/TIA a
Afzal (2015)Cryptogenic stroke
CRYSTAL AF RCTCryptogenic stroke
EMBRACE RCTCryptogenic stroke
Concordance/conclusion
Q1. AECG vs no further AECG
Short-term AECG vs no further AECG
AF % [95% CI] pooled
10.7 [5.6, 17.2]
N/A N/A AF (≥30 s) %
Holter, 24h: 3.2%
A range of diagnostic yields are reported for a range of Holter monitoring strategies, which, in light of the variation in populations, prior monitoring and study designs, may not be inconsistent.
Medium-term AECG vs no further AECG
AF % [95% CI] pooled
MCT 15.3 [5.3, 29.3]ELR 16.2 [9.3, 24.6]
At least 65% CS patients
AF % [95% CI] pooled
ELR/MCT/96h13.6 [7.91, 19.32]
N/A AF (≥30 s) %
ELR: 16.1%
Similar diagnostic yields are reported for medium-term AECG. The diagnostic yield of medium-term AECG may be similar in cryptogenic stroke and populations enriched for cryptogenic stroke (65-70% selected), based on 1 RCT and pooled estimates across all study designs.
Long-term AECG vs no further AECG
AF % [95% CI]: pooled
ILR 16.9 [10.3, 24.9]
Monitoring duration ranged from 180 days to 870 days
All patients had CS..
AF % [95% CI] pooled
ILR 23.3 [13.83, 32.29]
Monitoring duration ranged from 229 days to > 30 months
ILR vs conventional follow up
AF % for ILR group b
6 months 8.612 months 13.136 months 19.0
AF detected HR [95% CI]6 mth 6.4 [1.9, 21.7]12 mth 7.3 [2.6, 20.8]36 mth 8.8 [3.5, 22.2]p < 0.001 for each, favouring ILR
Difference Tx % [95% CI]
12 mth 8.8 [2.8, 14.8]p < 0.001 for all time points, favouring ILR
N/A Based on 1 RCT, ILR is superior to conventional follow up (where Holter is used in 12% of patients by 12 months, and most patients receive no ECG), for the detection of AF in patients with cryptogenic stroke.
A range of diagnostic yields are reported for ILR, which, in light of the heterogeneity in population and study design, may not be inconsistent.Diagnostic yield with ILR may be higher for cryptogenic stroke than unselected IS/TIA, based on pooled estimates across all study designs, but the pooled estimate for cryptogenic stroke is not in agreement with that from 1 RCT.
Q2. Duration vs duration
Short-term vs medium-term AECG
N/A N/A N/A Difference in AF (≥30 s) % [95% CI]ELR vs Holter, 24h12.9 [8.0, 17.6] p<0.001
Difference Tx % [95% CI]ELR vs Holter, 24hAnticoagulants started7.5 [1.6, 13.3] p = 0.01Antiplatelets started-8.6 [-14.6, -2.5] p = 0.006
ELR is superior to 24-hour Holter monitoring for both detection of AF and change in patient management, based on 1 RCT of patients with cryptogenic stroke.
Short-term/no AECG vs medium/long-term AECG
N/A AF detected: OR [95% CI]
N/A N/A ILR/ELR/MCT is superior to limited Holter monitoring for the detection of AF in patients with cryptogenic stroke, based on a meta-analysis of three RCTs.
MBS Reviews – Ambulatory Electrocardiography Review Report Page 26

May 2016
Clinical questionComparison
Sposato (2015)IS/TIA a
Afzal (2015)Cryptogenic stroke
CRYSTAL AF RCTCryptogenic stroke
EMBRACE RCTCryptogenic stroke
Concordance/conclusion
ILR/ELR/MCT vs Holter/no AECG4.54 [2.92, 7.06]
favouring ILR/ELR/MCT
Limited Holter monitoring consisted of 24-hour Holter monitoring in one RCT, and Holter use at the discretion of the investigator in the other two RCTs.
Short-term vs long-term AECG
N/A N/A Sensitivity & NPV
ILR (reference test) vs various simulated short-term monitoring periodsp<0.001 for all comparisons.
N/A ILR is superior to Holter for the detection of AF after cryptogenic stroke, based on simulated short-term monitoring.
Medium-term vs long-term AECG
AF % [95% CI]
MCT vs ILR15.3 [5.3, 29.3] vs16.9 [10.3, 24.9]p > 0.05
ELR vs ILR16.2 [9.3, 24.6] vs16.9 [10.3, 24.9]p > 0.05
AF % [95% CI]
ELR/MCT/96h Holter vs ILR
13.6% [7.91, 19.32] vs23.3% [13.83, 32.29]
p < 0.05 favouring ILR
Sensitivity & NPV
ILR (reference test) vs various simulated medium-term monitoring periods
p<0.001 for all comparisons.
N/A Based on pooled estimates across all study designs, there is conflicting evidence on the relative effectiveness of ILR and medium-term AECG for the detection of AF.a
One study of simulated medium-term monitoring based on an RCT suggests ILR is superior to medium-term AECG for AF detection.
Abbreviations: AECG, ambulatory electrocardiography; AF, atrial fibrillation; APBs, atrial premature beats; CI, confidence interval; CS, cryptogenic stroke;ECG electrocardiography; ELR, event loop recorder; h, hour; HR, hazard ratio; ILR, implantable loop recorder; IS, ischaemic stroke; MCT, mobile cardiac telemetry; mth, months; N/A, not applicable; NPV, negative predictive value; OR, odds ratio; RCT, randomised controlled trial; s, seconds; TIA, transient ischaemic attack; TX, treatmenta While the Sposato (2015) systematic review did not select for cryptogenic stroke patients, the majority of patients in the medium- and long-term AECG studies had cryptogenic stroke.b Simple proportions of randomised groups, calculated post hoc (i.e. not the Kaplan-Meier proportions reported in the CRYSTAL AF publications.
MBS Reviews – Ambulatory Electrocardiography Review Report Page 27

May 2016
Evaluation of syncopeThe key review for syncope is the HTA by Westby et al (2010) that supports the NICE clinical guidance for TLoC. The Westby HTA includes 37 AECG studies that provide single group/case series evidence, and three RCTs: Farwell et al (2006); Krahn et al (2001a); and Rockx et al (2005). Section 5 also presents the evidence from the update to this HTA (NICE, 2012) and three recent RCTs identified in the literature search: EaSyAS II; FRESH; and a trial by Da Costa et al (2013).
The findings of the key systematic reviews and RCTs for diagnosing the cause of syncope are summarised in Table ES.5. The majority of studies were in patients with unexplained syncope after secondary tests, with a large number in patients with a suspected arrhythmic syncope.
ILR was found to be superior to conventional follow up including limited shorter-term AECG in three RCTs. In two of these studies, the amount of Holter monitoring was not reported, and in the other, ELR or Holter were used in no more than 38% of patients, preventing direct comparison of monitoring durations.
Based on RCT evidence, ELR appears to be superior to 48-hour Holter and ILR is superior to ELR plus other tests. However, it should be noted that the ELR diagnostic yields vary in these RCTs: 63% in the former, but only 20%2 in the latter (including those patients diagnosed with other tests). This suggests very different study protocols were used or different patient populations were included. In fact, the ‘ELR plus other tests’ cohort was not included in the summary statistics for ELR by Westby (2010), possibly due to the potential confounding of the other tests. No direct comparisons of ELR and ILR were identified.
Across study designs, ELR and ILR have a similar range of diagnostic yields in the unexplained syncope population (32-78% for ELR, 34-87% for ILR), and values for the other populations fall within these ranges. The range for Holter monitoring falls below these (8-24% across all populations).
Overall, it can be concluded that both medium-term AECG and long-term AECG have higher diagnostic yields than short-term AECG, but the evidence is insufficient regarding the relative effectiveness of medium-term AECG and long-term AECG for patients with syncope.
Evaluation of syncope patients for pacing therapyThe Westby (2010) review found one case series study (Brignole, 2006) in patients with suspected neurally mediated syncope on initial assessment that found ILR-directed pacing resulted in longer times to second syncope and a lower overall burden of syncope compared with non-specific therapy. Statistical analyses were performed on differences between these groups and found to be significant. However, allocation to these groups was by investigator selection (not randomised), and the criteria for group allocation were not described. Therefore, the authors of the current Review suggest such analyses must be interpreted with caution. Nonetheless, between-group differences were large.
2 Of the six patients diagnosed in the ELR plus other tests group, only one was diagnosed using ELR. If all six patients had been diagnosed with ELR, ILR would remain superior to ELR in this study.
MBS Reviews – Ambulatory Electrocardiography Review Report Page 28

May 2016
Table ES.5 Conclusions from evidence for AECG for the evaluation of syncopeClinical question Suspected arrhythmic cause Suspected neurally mediated syncope Unexplained syncope Conclusions
Q1. AECG vs no further AECG
Short-term AECG vs no further AECG
Diagnostic yield % (syncope + ECG)24h Holter: 16% (1 case series)48h Holter: 8% to 13% (2 case series)
Change in management48h Holter: 13% (1 case series)
Diagnostic yield % (syncope + ECG)48h Holter: 20% (1 case series)
Change in managementHolter: 3% (1 case series)
Diagnostic yield % (syncope + ECG)48h Holter: 24% (1 RCT)
Change in management24h Holter: 43% (1 case series)
Diagnostic yields ranging from 8% to 24% are reported for various Holter monitoring strategies. In light of the variation in syncope populations, this may not be inconsistent.
Change in management varied greatly between two populations, but the evidence base is limited to two case series.
Medium-term AECG vs no further AECG
Diagnostic yield % (syncope + ECG)ELR: 69% (1 RCT)
No evidence identified. Diagnostic yield % (syncope + ECG)ELR: 32% to 78% (1 RCT, 3 case series, median 44%)
Change in managementELR: 18% (1 case series)
A wide range of values for diagnostic yields with ELR are reported, from 32% to 78%, with the lowest and highest yield in the same patient population group (unexplained syncope).
These 5 studies represent the entire evidence base for ELR in syncope (the RCTs are discussed further in Question 2).
Long-term AECG vs no further AECG
Diagnostic yield % (syncope + ECG)ILR: 40% to 68% (4 case series, median 50%)
Change in managementILR: 22% to 44%
Diagnostic yield % (syncope + ECG)ILR: 34% to 48% (3 case series, median 36%)
Change in managementIRL: 14% to 28% (3 case series, median 14%)
Diagnostic yield % (syncope + ECG)ILR: 34% to 87% (2 RCTs, 12 case series, median 56%)
ILR: 30-32% (Patient registry N = 570)
Change in managementILR: 12% to 49% (1 RCT, 12 case series, median 28%)
For ILR, diagnostic yields range from 34% to 87%, and change in management from 12% to 49%. For both outcomes, the lowest and highest values are found in the same patient population group (unexplained syncope). This population group includes the greatest number of studies.
Q2. Duration vs duration
Short-term vs medium-term AECG
No evidence identified. No evidence identified. Diagnostic yield % (syncope + ECG)
48h Holter ELR24% (12/51) 63% (31/49)
RR 2.69 [1.57, 4.61]
Based on one RCT, ELR is superior to 48h Holter in the unexplained syncope population.
Short-term/no AECG vs long-term AECG
No evidence identified. No evidence identified. Diagnostic yield % (diagnoses made)
1 RCT:Conventional ILR(AECG NR)1.6% (1/61) 44% (29/66)
1 RCT:Conventional ILR(AECG NR)5.1% (2/39) 46% (18/39)p <0.001
Based on two RCTs, ILR is superior to limited short-term AECG for diagnosing the cause of syncope in the unexplained syncope population.
MBS Reviews – Ambulatory Electrocardiography Review Report Page 29

May 2016
Clinical question Suspected arrhythmic cause Suspected neurally mediated syncope Unexplained syncope Conclusions
Short-term, medium-term or no AECG vs long-term AECG
No evidence identified. No evidence identified. Diagnostic yield % (syncope + ECG)
Limited Holter/ELR ILR7.1% (7/98) 42%(43/103)HR 6.53 [3.73, 11.4]
Based on one RCT, ILR is superior to conventional testing, including short- or medium-term AECG in some patients, in the unexplained syncope population.
Medium-term AECG (+ other tests) vs long-term AECG
No evidence identified. No evidence identified. Diagnostic yield % (syncope+arrhythmia)
1 RCT:ELR (+ other tests) ILR
20% (6/30) 47% (14/30)RR 2.33 [1.04, 5.25]
Significant arrhythmias %
1 RCT:Repeated 7-day Holter ILR
11% (4/37) 37% (15/41)p = 0.02
Based on one small RCT, ILR is superior to ELR plus other tests (and therefore ELR alone) for diagnosing patients with unexplained syncope.
Based on one small RCT, ILR is superior to repeated 7-day Holter monitoring for finding significant arrhythmias in the unexplained syncope population.
Q3. Patient triggered vs patient/auto triggered
Long-term, patient-triggered AECG vs long-term, auto/patient-triggered AECG
No evidence identified. No evidence identified. Diagnostic yield % (syncope+arrhythmia)Patient-triggered ILRs (7 studies) vs auto/patient triggered ILRs (7 studies): no difference observed on visual inspection of plots.
Based on limited evidence, there may be no difference in the ILR capture of arrhythmia-syncope correlations between devices with or without an auto-trigger capacity.
Abbreviations: AECG, ambulatory electrocardiography; CI, confidence interval; ECG, electrocardiogram; ELR, event loop recorder, HR, hazard ratio; ILR, implantable loop recorder; incl., including; NR, not reported; RCT, randomised controlled trial; RR, risk ratioNote Syncope + ECG refers to the outcome of ‘syncope during monitoring’ (i.e. inverse of the ‘no syncope during ECG’ outcome reported by Westby, 2010).
MBS Reviews – Ambulatory Electrocardiography Review Report Page 30

May 2016
Evaluation of palpitationsA total of 28 studies (16 comparative and 12 non-comparative) are included in the Hoefman (2010) systematic review of AECG for patients with palpitations. Of the 16 comparative studies, five are RCTs: Giada et al (2007); Rothman et al (2007); Scalvini et al (2005); Hoefman et al (2005); and Kinlay et al (1996). Most studies investigated ELR (or ER) and/or Holter; only two studies investigated ILR. The study findings were not combined in a meta-analysis, due to either clinical or methodological heterogeneity.
The key findings of the Hoefman (2010) review are summarised in Table ES.6. Overall, the evidence supports the conclusion that medium-term AECG is superior to short-term AECG, and long-term AECG is superior to medium-term AECG in the diagnosis of patients with palpitations. There is evidence that the addition of an auto-trigger feature to medium-term devices increases the diagnostic yield when used in addition to a patient-trigger feature.
Table ES.6 Conclusions from evidence for AECG for the evaluation of palpitations: diagnostic yieldClinical question Evidence base
PopulationFindings Conclusions
Q1. AECG vs no further AECG
Medium-term AECG
1 study (N = 244)
Palpitations or dizziness
ELR usual care (not described)67% 27% p <0.05
Based on 1 study, more diagnoses are made using ELR compared to usual care.
1 study (N = 91)
Palpitations, (pre)syncope, dizziness
ER ECG (non-ambulatory)
37% 10%
Based on 1 study, more diagnoses are made using ER than non-ambulatory ECG.
Q2. Duration vs duration
Short-term vs medium-term AECG
2 RCTs, 3 studies (N = 603)
Palpitations
Median (range)Holter ER31% (12, 48) 62% (48, 67)
Based on two RCTs and 3 studies, more diagnoses are made using ER than Holter in patients with palpitations.
Medium-term vs long-term AECG
1 RCT (N = 50)
Palpitations
ER ILR21% 73% p<0.05
Based on 1 RCT, ILR is superior to ER in patients with palpitations.
Q3. Patient vs patient/auto triggered
Medium-term AECG: PT vs AT/PT
1 registry (N = 1200) and 3 studies (N = 262)
Palpitations, syncope, (plus dizziness in two studies). Registry NR.
Median (range)ELR (PT) ELR (PT/AT)32% (22, 67) 67% (39, 80)
Based on 4 comparative studies, auto-triggered ELRs yield more diagnoses than patient-triggered devices.
1 RCT (N = 266)
Palpitations or (pre)syncope
MCT (AT/PT) ELR (80% PT)(AT/PT) (80% PT)88% 75% p = 0.008
Subgroup analysis (N = 50)MCT ELR(AT/PT) (AT)88% 46% p = 0.002
In contrast to the above findings, a subgroup analysis of one RCT found a lower yield with the auto-triggered ELRs compared to the entire ELR cohort (80% patient-triggered ELR), suggesting patient-triggered ELRs have a greater diagnostic yield in this population than auto-triggered ELRs.
1 study (N = 122)
Palpitations, (pre)syncope and patients requiring therapy evaluation
MCT (PT) MCT (AT)No prior additional Dxarrhythmia 78% 6%Prior arrhythmia 47% 26%
Based on one retrospective record review, auto-triggered MCTs provide more diagnoses than patient-triggered MCTs, in patients with or without a prior diagnosis of arrhythmia.
Long-term AECG: PT vs AT/PT
1 study (N = 50)
Palpitations or (pre) syncope
Diagnostic yieldILR (PT) ILR (AT -additional Dx)16% 0%
One study found patient-triggered ILR diagnosed more patients with palpitations, syncope or pre, syncope than auto-triggered ILR.
Abbreviations: AECG, ambulatory electrocardiography; AT, auto triggered; Dx, diagnoses ECG, electrocardiogram; ELR, event loop recorder, ER, event recorder; ILR, implantable loop recorder; MCT, mobile cardiac telemetry; NR, not reported; PT, patient triggered; RCT, randomised controlled trial.
MBS Reviews – Ambulatory Electrocardiography Review Report
May 2016
Evidence for the cost-effectiveness of AECG
The systematic literature review identified seven cost-utility analyses, 10 cost-effectiveness analyses and five costing studies that were relevant to this Review. The published economic evidence largely related to the use of AECG for two major indications: monitoring in patients with recurrent, unexplained syncope; and screening for AF in patients who have suffered from a recent stroke. The summary below focuses on the key cost-utility analyses. A formal modelled economic evaluation of AECG was not within the scope of this Review.
AECG monitoring of any duration compared with no AECG monitoringA 2003 Assessment Report for the Medical Services Advisory Committee (MSAC application 1061) found ILR to be cost-effective at a cost of $45,000 per QALY compared with standard care (i.e. no further ECG monitoring in the majority of patients) in patients with unexplained recurrent syncope. After reviewing the clinical and economic evidence, MSAC recommended that public funding should be supported for the use of ILR in patients with recurrent syncope who have undergone appropriate prior investigations (Items 11722 and 38285 were added in 2004).
In a similar population, Westby et al (2010) assessed the cost-effectiveness of several AECG technologies (24-hour Holter, 48-hour Holter, ELR and ILR) compared with no further testing from the perspective of the National Health Service (NHS) in the United Kingdom. The economic evaluation found that all of the AECG technologies had a very high likelihood (88% to 100%) of being cost-effective at a threshold of £20,000 per QALY. On the basis of the Westby (2010) analysis, NICE accepted that the use of ILR in patients with infrequent episodes of suspected arrhythmic or unexplained syncope is cost-effective and recommended its use in this population.
Westby et al (2010) also undertook an economic evaluation of testing strategies using TT testing, AECG or sequences of these tests in patients with recurrent episodes of suspected vasovagal syncope in whom pacemaker therapy is being considered. TT testing alone was found to be the most cost-effective strategy to direct pacing therapy. The NICE guideline subsequently recommended the use of TT testing in this population because it considers it to be a more cost-effective use of NHS resources than alternative strategies which include ILR monitoring.
A cost-utility analysis from a societal perspective in Sweden found that 24-hour Holter monitoring to detect ‘silent’ AF in patients with recent ischaemic stroke was associated with slightly fewer strokes and small gains in life-years and QALYs compared with no screening (Levin et al, 2015). However, the incremental cost per QALY of 24-hour Holter monitoring was relatively high at approximately €33,500. In a separate analysis, 24-hour Holter monitoring was shown to have lower sensitivity and higher costs than handheld ERs in patients being screened for AF after recent IS/TIA.
Based on a cost-utility analysis from a societal perspective in the United States, Kamel et al (2010) found that outpatient cardiac monitoring (using an auto-triggered ELR) is cost-effective compared with standard care (i.e. aspirin with no outpatient monitoring) for the detection of AF in patients with recent ischaemic stroke (US$13,000 per QALY); however, the authors emphasised that the optimal duration of monitoring is unclear.
MBS Reviews – Ambulatory Electrocardiography Review Report
May 2016
AECG monitoring of one duration compared with AECG monitoring of a different durationWestby et al (2010) found long-term monitoring with ILR to have a low likelihood (24%) of being cost-effective compared with shorter-term conventional monitoring at a threshold of £20,000 per QALY, but a higher likelihood (72%) at a threshold of £30,000 per QALY. In this comparison, conventional monitoring included both Holter monitoring and ELR, based on RCT evidence.
Mayer et al (2013) conducted a cost-utility analysis from a third-party payers’ perspective in Germany to assess the difference between short-term monitoring (24-hour Holter) and medium-term monitoring (7-day Holter) in patients with cerebral ischaemia undergoing screening for AF. The base case analysis and a wide range of sensitivity analyses found that short-term (24-hour) Holter monitoring was dominated by medium-term (7-day) Holter monitoring, due to higher lifelong costs and lower QALYs.
Auto-triggered AECG monitoring compared with patient-triggered AECG monitoringNo relevant economic studies were identified.
Conclusions
The increase in services for MBS item 11708 can be partly attributed to increased use by GPs, increased dispersion of the technology into regional Australia, and an increase in the frequency of services per patient (which may indicate repeat services to cover longer-term monitoring). The increase in services for other AECG items are not explained by these factors.
AECG monitoring is recommended in CPGs for investigation of a large range of presentations and indications. The choice of monitoring technique in different clinical situations should be determined by the patient’s history, clinical characteristics, nature and frequency of symptoms.
The descriptors for MBS items 11708, 11709, 11710 and 11711 do not specify the intended target population for AECG monitoring, or the duration of AECG monitoring (other than 12 hours or more).
CPGs recommend broader use of ILRs than is currently permitted by the item descriptor and Explanatory Note for Item 38285.
Comparative effectiveness of AECG is primarily addressed using low-level, non-comparative evidence. The most commonly reported outcome is diagnostic yield; only a minority of studies reported intermediate outcomes (e.g. change in patient management) or longer-term patient-relevant outcomes.
The clinical evidence suggests that: for the detection of AF after cryptogenic stroke, long-term AECG is superior to
no further AECG, and medium-term AECG is superior to short-term AECG; for the evaluation of palpitations, medium-term AECG is superior to short-
term AECG, and long-term AECG is superior to medium-term AECG; for the evaluation of syncope, medium-term AECG and long-term AECG have
higher diagnostic yields than short-term AECG, but the evidence is insufficient regarding the relative yields for medium-term and long-term AECG.
MBS Reviews – Ambulatory Electrocardiography Review Report
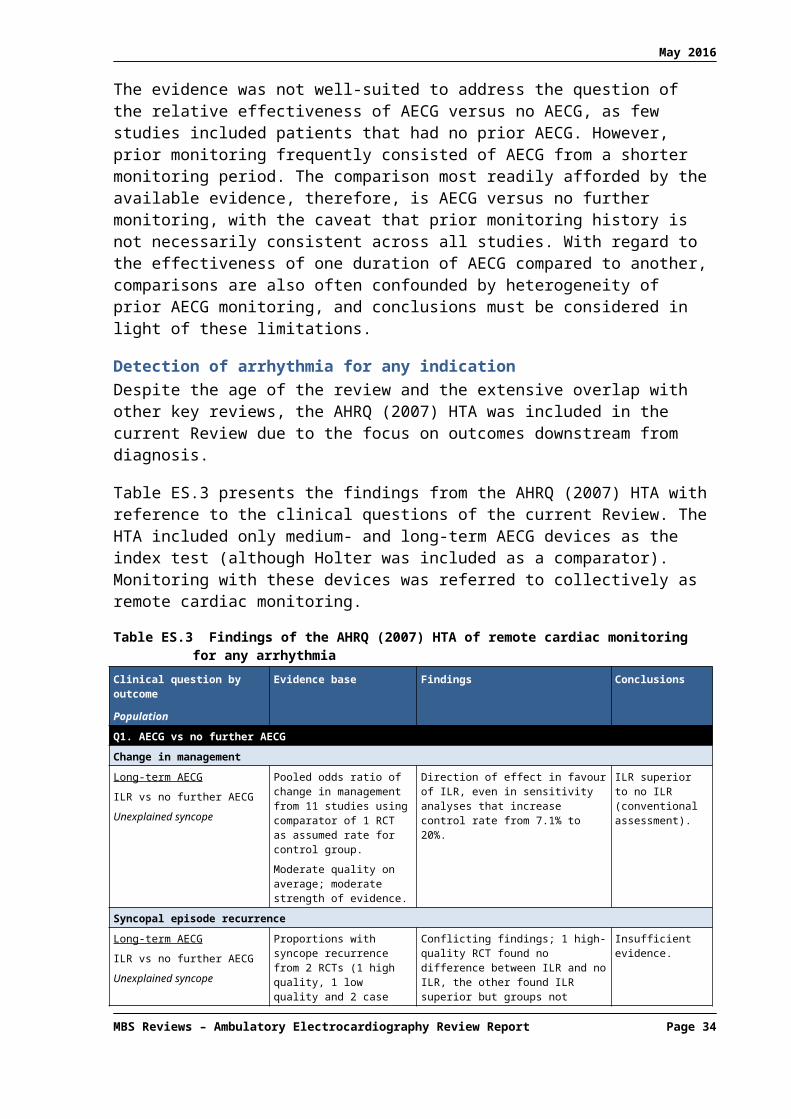
May 2016
1 BACKGROUND ON AECG MONITORING
1.1 Description of AECG
An ambulatory electrocardiography (AECG) monitor is a portable device for monitoring various electrical activities of the cardiovascular system. Arrhythmias are a group of conditions in which the electrical activity of the heart is irregular, or is faster or slower than normal. AECG monitors allow extended electrocardiogram (ECG) recording of heart activity for observing occasional or transient cardiac arrhythmias, which would be difficult to identify in a shorter period of time, such as during a standard ECG.
1.1.1 Monitoring devices
The ECG devices used in ambulatory patients fall into two broad categories based on the type of data they record: continuous ECG recording and event recording.
Continuous recording (Holter monitors)The Holter monitor is the original AECG device. Other continuous recording devices are available but not frequently used.1 These monitors record all ECG data from a patient for analysis by a physician after the unit is returned to the clinic/office. Holter monitors used in Australia typically record for no more than 24 hours and provide full disclosure ECG data.3
Event recordingEvent recorders do not make a permanent recording unless triggered by either the patient or, in some devices, automatically by a programmable arrhythmia detection algorithm. This reduces the amount of ECG data recorded, allowing patients to be monitored over a longer period of time than with a Holter.
Event recorders fall into various categories depending on:
(1) whether they are worn externally or implanted (subcutaneously);
(2) the trigger for data recording:
a. the patient, or
b. an algorithm within the device
(3) the means of data transfer:
a. uploaded actively by patient or collected at the end of the investigative period or
b. uploaded automatically (using mobile telecommunications – telemetry).
Wearable or handheld event recorders (ERs) were originally designed to initiate recording once triggered by the patient. Looping devices were then developed that continuously monitor rhythm data, keeping a small amount in memory, which allowed a recording to start up to a few minutes prior to the triggering event (event loop recorders; ELR). Automatic activation by detection algorithms was subsequently introduced, to allow detection of events that are symptomless or that patients are unable to trigger themselves (e.g. some syncope events).
3 Expert advice from the Review Working Group.
MBS Review – Ambulatory Electrocardiography Review Report Page 34

May 2016
Data from ERs and ELRs are collected at the end of the investigative period, or periodically uploaded by the patient.
Mobile cardiac telemetry (MCT) devices use telemetry to upload ECG data in real time, and have recently become available in Australia (e.g. V-Patch4). These devices are sometimes referred to as real-time continuous monitoring. Like ELRs, a looping mechanism continuously monitors rhythm data and records discrete events (patient or auto triggered), but telemetry is used to immediately upload the recordings to a remote diagnostic monitoring laboratory. The uploaded data may be monitored by attending technicians immediately or within hours of transmission, or it may be retained for later batch analysis by the physician.
Implantable loop recorders (ILRs) are internal event recorders that are implanted subcutaneously, usually in the left pectoral region. Like ELRs and MCTs, they use a looping mechanism to continuously monitor heart rhythm, and recordings are triggered by either the patient or auto triggered by the device on detection of an arrhythmia. The convenience of these devices allows much longer periods of monitoring than with either ELRs or MCTs, extending many months, or even years. Data are uploaded periodically at the physician’s office or, for some devices, uploaded over the phone by the patient.
1.1.2 Indications for AECG monitoring
AECG is used for a variety of conditions and indications where infrequent arrhythmia is suspected or requires characterisation or monitoring. Arrhythmias may be the underlying cause of clinical presentations such as syncope (transient loss of consciousness; TLoC) and dyspnoea (sudden or severe shortness of breath). The major clinical indications for AECG monitoring are shown in Table 1.1.1.
Table 1.1.1 Major indications for the use of AECG
Indication/condition/presentation
Cardiac palpitations
Unexplained syncope or dizzy turns
Congenital abnormalities associated with sudden cardiac death or re-entry tachyarrhythmias
Detection of intermittent atrial fibrillation/flutter
Evaluation of frequent ectopic activity
Congestive cardiomyopathy
Evaluation of ventricular tachyarrhythmias
Chest pain thought to be associated with palpitations
Evaluation of implanted pacemaker or cardioverter-defibrillator function in symptomatic patients
Slow heart rhythms or evidence of evolving heart blockSource: Review Working Group for AECG.Abbreviation: AECG, ambulatory electrocardiography.
In the Australian context, the use of AECG for some indications is established, while other indications are emerging. The most common use of AECG monitoring has long been the assessment of patients with cardiac palpitations and unexplained syncope. In some cases, AECG will confirm that a patient’s symptoms, such as benign palpitations, are not clinically relevant, which can provide reassurance to anxious patients. In other cases, such as in patients who experience syncope, AECG may confirm a cardiac cause for the fainting. Treatment options for these patients can include medication or the implantation of a pacemaker or cardioverter-defibrillator to address the arrhythmia and prevent further syncopal episodes. In 4 V-Patch was listed on the Australian Register of Therapeutic Goods (ARTG) in July 2010.
MBS Review – Ambulatory Electrocardiography Review Report Page 35

May 2016
cases where AECG rules out arrhythmia as a cause of syncope, alternative causes (such as epilepsy or psychogenic causes) can then be explored.
One emerging indication for AECG is identifying arrhythmias in patients with a family history of sudden cardiac death (SCD). Identification of pre‐symptomatic disease presents the opportunity for a risk assessment and preventative treatment, whereas confirmation of the absence of the same disease leads to appropriate reassurance.
Another potentially significant emerging indication is the detection of asymptomatic atrial fibrillation (AF) in post-ischaemic stroke patients. Patients with AF and a history of stroke carry a higher risk of subsequent stroke (Cerebral Embolism Task Force, 1989; Stroke Risk in Atrial Fibrillation Working Group, 2007). If AF is detected using prolonged AECG, these high-risk patients may receive prophylaxis with oral anticoagulants, which have been shown to significantly reduce the risk of secondary stroke (Ntaios et al, 2012; EAFT Study Group, 1993).
Likewise, the relatively recent discovery of increased risk of paroxysmal AF in cryptogenic stroke patients has resulted in increased monitoring of these patients overseas, and it is possible that Australian physicians will also shift, or may already be shifting, towards more aggressive monitoring strategies in this population. As event-recording technologies capable of reliable auto-triggered monitoring over longer time periods become more widely available in Australia, this strategy will become increasingly feasible.
1.2 Description of the services under review
1.2.1 MBS items for AECG devices
Table 1.2.2 shows the Medicare Benefits Schedule (MBS) items that are included in the scope of this MBS Review (see Appendix 3 for item descriptors and fees). They include items relating to continuous and event-recording devices (including implantable devices).
Table 1.2.2 AECG devices and relevant MBS items
Device Period of recording
Trigger Data upload Relevant MBS item
Continuous recording device (e.g. early Holter devices without full disclosure)
Up to 24 hours Continuous On return of device to clinic
11708
Continuous recording device (Holter devices with full disclosure)
Up to 24 hours Continuous On return of device to clinic5
11709
ELR Pre/post event Largely patient triggered but some devices are auto triggered
Periodically by patientORtelemetry
11710
ER During the event
Patient triggered Periodically by patient 11711
Real-time cardiac telemetry (e.g. V-Patch)
Pre/post event Auto triggered (can also be patient triggered)
Telemetry 117086
ILR Pre/post event Auto triggered Telemetry 38285 and 117227
5 Holter monitors have been developed with the capacity to upload data over the internet at the end of the day. These devices are not available in Australia. It is not clear whether the data is full disclosure or abbreviated.
6 This MBS item was originally created for the early Holter monitors that did not have full disclosure capacity. According to expert advice, services using V-Patch are provided using this item number.
7 MBS item 38285 is for the implantation of the recording device. MBS item 11722 is for data processing, analysis and report writing.
MBS Review – Ambulatory Electrocardiography Review Report Page 36

May 2016
Device Period of recording
Trigger Data upload Relevant MBS item
(can also be patient triggered)
Source: Medicare Australia, February 2016.Abbreviations: AECG, ambulatory electrocardiography, ELR, external/event loop recorder; ER, event recorder; ILR, implantable loop recorder; MBS, Medicare Benefits Schedule.
There are two MBS items for devices that record data continuously for up to 24 hours: 11708 and 11709. The latter is specifically for the use of a Holter monitor with full disclosure capacity (earlier versions of continuous recording monitors did not have this capacity).
There are two MBS items for event recording with external event monitors: 11710 and 11711. Both are for patient-activated devices, with item 11710 specifying loop recorder capacity, allowing the recording of a short period of data prior to activation (the earlier event recorders did not use looping). There are no MBS items specific for ELRs that are auto triggered, but monitoring services using these devices are likely to be claimed using item 11710.8
According to expert advice, Item 11708 (for continuous recording not using a Holter) is possibly being used for services relating to MCT devices, such as V-Patch. 9 As described earlier, these devices do not continuously record the patient’s full ECG but are event recorders continuously primed to upload brief recordings to a remote diagnostic monitoring laboratory at the time it occurs, rather than at the end of the monitoring period.
Two MBS items relate to implantable devices, one for the implantation procedure (Item 38285) and one for retrieval and analysis of data and report writing (Item 11722).
1.3 Purpose of the Review
The MBS Review of AECG has been initiated as a result of a significant increase in MBS utilisation of AECG services over the past five years. Further details are provided in Section 3 of this Review, which explores the potential drivers of growth.
To address the concern that patients may be undergoing unnecessary investigation with AECG monitoring, the published evidence will be reviewed to identify clinical presentations for which AECG monitoring provides benefit and is cost-effective. The Review will also consider which indications are appropriate for the following durations of monitoring (indicative durations shown):
short-term monitoring (days); medium-term monitoring (weeks); and long-term monitoring (months).
The relative effectiveness of patient-triggered versus auto-triggered data recording will also be investigated for medium- and long-term monitoring.
1.4 Clinical decision pathway
As there are a number of indications for which AECG is used, there is no single clinical management algorithm that captures all patients receiving this test. AECG is a very early diagnostic intervention and clinical management pathways will vary considerably depending on whether it is being used to make or exclude a diagnosis, or to monitor treatment. The 8 Expert advice from the Review Working Group (RWG) for AECG.9 Expert advice from the RWG. V-Patch was listed on the Australian Register of Therapeutic Goods (ARTG) in July 2010.
MBS Review – Ambulatory Electrocardiography Review Report Page 37

May 2016
findings from AECG monitoring may impact directly on treatment decisions or result in further diagnostic testing.
AECG is commonly used in patients presenting with either palpitations or unexplained syncope. Figure 1.4.1 shows a simplified clinical decision pathway illustrating the selection of AECG MBS items for these two groups of patients.10 The frequency of symptoms dictates the length of monitoring required and, therefore, the choice of device.
Twenty-four-hour Holter monitoring is occasionally extended to two and rarely three consecutive days. Clinical experience within the Review Working Group (RWG) indicated that there is very rarely a difference in the reporting between a single and two-day monitoring. The Review will present any evidence to show that monitoring for greater than one day is beneficial.
Figure 1.4.1 Clinical decision pathway for patients with palpitations or undiagnosed syncope
Source: Based on McLellan (2011).a ILRs are not reimbursed on the MBS for palpitations (MBS item 38285 applies to patients with syncope, see Appendix 3).
10 Based on information published in the July 2011 issue of Australian Family Physician, the official publication of the Royal Australian College of General Practitioners (RACGP).
MBS Review – Ambulatory Electrocardiography Review Report Page 38

May 2016
2 REVIEW METHODOLOGY
The Review methodology involved an analysis of secondary data (e.g. MBS claims), a guideline concordance analysis and a systematic literature review for clinical and economic evidence. This section presents the clinical research questions and the methodology for each of these Review components.
2.1 Secondary data analysis
Data from Medicare Australia were analysed to determine current usage of AECG services and explore drivers of growth in the number of services.
2.1.1 The research questions for the MBS analysis
MBS data were analysed by patient gender, age group, patterns of use and discipline of provider requesting the test for the six relevant MBS items (see Appendix 3 for item descriptors). In particular, the MBS data were examined to address the following questions:
(1) What is the profile of claiming relating to MBS items for AECG (items 11708, 11709, 11710, 11711, 38285, and 11722)?
a. Are there any temporal or geographic trends associated with usage of these items?
b. What are the characteristics of patients undergoing AECG (e.g. gender, age)?
c. Are the MBS claims data consistent with trends in the incidence/prevalence of conditions/diseases being addressed by the service?
d. How are the MBS items for AECG being claimed, in terms of frequency in individual patients?
e. What is the profile of specialties providing AECG monitoring services?
f. What is the profile of service provision for AECG monitoring? Are AECG monitoring services provided by a large number of providers on few occasions or a small number of providers on many occasions?
(2) What are the likely drivers of growth in the use of MBS items for AECG?
a. Do any changes in usage trends suggest a reason for the substantial increase in the volume of services for MBS item 11709?
b. Do any changes in usage trends suggest a reason for the large percentage increase in services for MBS items 11708 or 11711?
2.1.2 Method for analysis of MBS data
MBS data relates to private medical services (provided in or out of hospital), where the services are provided to patients regardless of whether or not they have private health cover.
MBS data were analysed by patient gender, age group, patterns of use and discipline of provider requesting the test. Services per capita were also analysed.
Results of the analysis of the MBS data is presented in Section 3.
MBS Review – Ambulatory Electrocardiography Review Report Page 39
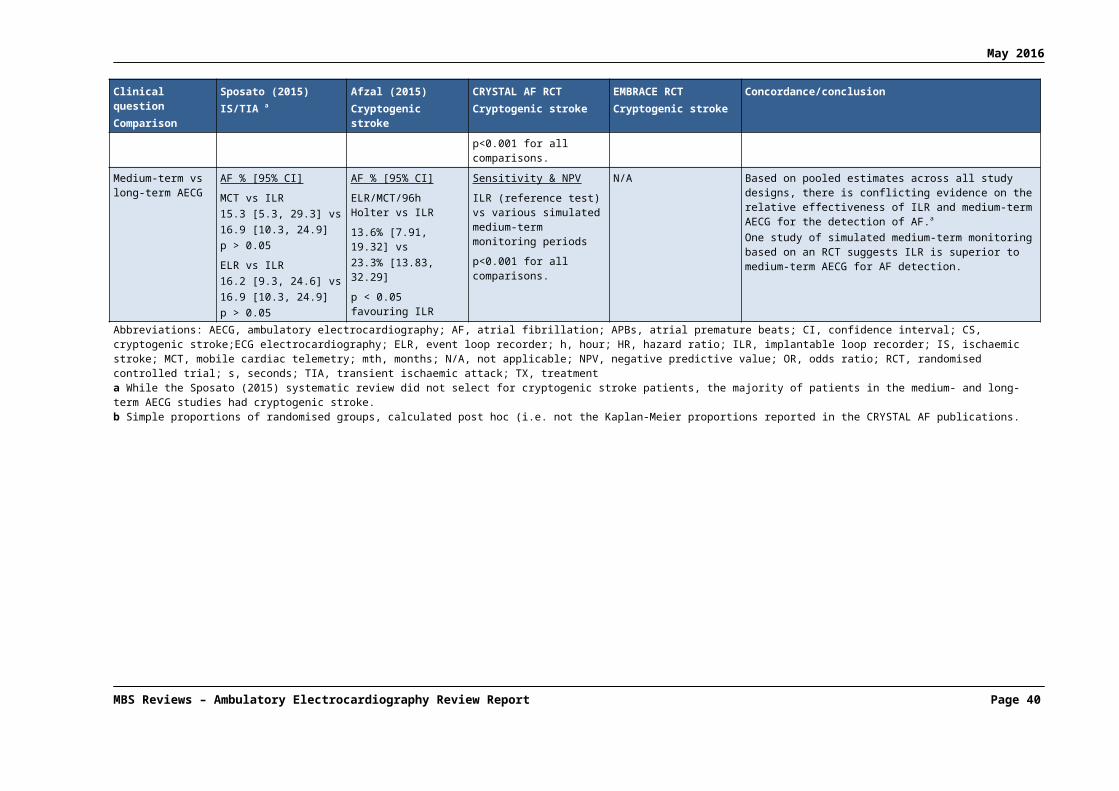
May 2016
2.2 Guideline concordance
Analysis of the six relevant MBS item numbers was undertaken relative to ‘best practice’ as recommended in relevant Australian clinical practice guidelines (CPGs) or guidelines in comparable health systems overseas.
2.2.1 The research questions for the guideline concordance analysis
The clinical/research questions to be addressed as part of the Review using guideline concordance are as follows:
(1) For what clinical indications is AECG recommended?
(2) For what clinical indications is one duration of AECG monitoring recommended over another (i.e. short term vs medium term, etc.)?
(3) For what clinical indications is one mechanism of triggering event recording (i.e. intermittent recording) recommended over another?
(4) Are the descriptors for the MBS item numbers/services under review consistent with evidence-based (or in the absence of evidence, consensus-based) recommendations provided in relevant clinical practice guidelines?
2.2.2 Methods for guideline concordance analysis
Searches of EMBASE, Medline and PubMed were conducted on 19 January 2016 to identify published CPGs relating to AECG. The search strategies for EMBASE, Medline and PubMed are shown in Appendix 4. Searches of guideline databases and relevant discipline websites were undertaken on 7 January 2016. The searches included the following websites:
Guidelines International Network (G-I-N); Agency for Healthcare Research and Quality (AHRQ) National Guidelines
Clearinghouse; National Health and Medical Research Council (NHMRC) Australian Clinical Practice
Guidelines Portal; National Institute for Health and Care Excellence (NICE); Scottish Intercollegiate Guidelines Network (SIGN); Canadian Agency for Drugs and Technologies in Health (CADTH); National Heart Foundation; and Cardiac Society of Australia and New Zealand (CSANZ).
Eligibility criteriaThe literature search outlined above identified 832 citations, and an additional 75 citations were identified by guideline databases’ searching. The following exclusion criteria were applied:
Wrong publication type – excludes narrative reviews, other study types and other publication types including letters, editorials and commentaries.
Wrong intervention – excludes CPGs and consensus that do not provide guidance relating to AECG.
Wrong population – excludes CPGs and consensus that provide guidance relating to AECG in healthy patients (i.e. population screening) or in critical care patients (ambulance or inpatient telemetry), and those relating to specialist training in AECG.
MBS Review – Ambulatory Electrocardiography Review Report Page 40

May 2016
The process used to determine the final list of included CPGs is presented in Table 2.2.3. Fourty-three Australian and international guidance relating to AECG were identified for inclusion, and presented in Section 4 of the Review.
Table 2.2.3 Summary of the process used to identify relevant clinical practice guidelinesDescription EMBASE, Medline and
PubMedWebsites and guideline
databasesTotal citations 832 75
Duplicates within and across sets removed 202 -
Unique citations screened 630 -
Excluded at title/abstract reviewWrong populationWrong interventionWrong publication type
Total citations excluded at title/abstract review
-33273248554
-
Citations screened at full text review 76 -
Excluded at full text reviewWrong populationWrong interventionWrong publication type
Total citations excluded at full text review
-180
1937
-
Included citations from database searches 39 75
Duplicates removed 32
Total included clinical practice guidelines 43
2.3 PICO criteria for clinical and economic literature searches
The Population, Intervention, Comparator, Outcome (PICO) criteria are used to develop well-defined questions for each review. This involves focusing the questions on the following four elements:
the target population for the intervention; the intervention being considered; the comparator for the existing MBS service; and the outcomes that are most relevant to assess safety and effectiveness.
The PICO criteria have been developed on the basis of information provided in the literature, as well as clinical advice, and are shown in Table 2.3.4. These criteria will be applied when selecting literature for the Review.
Table 2.3.4 PICO criteria for the Review of AECG monitoring
Population Intervention Comparators OutcomesPatients with suspected arrhythmia
AECG monitoring with either event (i.e. intermittent) or continuous recording, and with duration of monitoring either: Short term, using devices
such as the Holter monitorOR
Medium term, using devices such as event loop recordersa or real-time
No AECG monitoringOR
Monitoring using a device from an alternative monitoring period
OR Monitoring using a device
from the same monitoring period but using different triggers for recording
Immediate outcomes diagnostic yield/ detection
ratec
time to diagnosisIntermediate outcomes change in patient
managementPatient-oriented outcomesBenefits survival recurrence of
MBS Review – Ambulatory Electrocardiography Review Report Page 41
May 2016
Population Intervention Comparators Outcomescontinuous event monitorsb
OR Long term, using an
implantable loop recorder
symptoms/episodes (e.g. syncope)
quality of lifeHarms complications (due to
implantation) adverse events (e.g. skin
irritation)Cost implications cost cost-effectiveness
Abbreviations: AECG, ambulatory electrocardiography; PICO, Population, Intervention, Comparator, Outcome.a Patient-activated and auto-triggered event loop recorders to be reported separately where specified.b Mobile cardiac telemetry devices.c The proportion of patients with a positive result as defined by the study (e.g. correlation of symptoms with cardiac event, recording of cardiac event, etc.).
Studies investigating AECG for any patient population with suspected arrhythmia will be included. General population screening will be out of scope of this Review.
The relevant interventions are devices that monitor the electrical activity of a patient’s heart while ambulatory, and permanently record data either continuously or during an event. Short-term monitoring is usually 12-24 hours (although can be longer) and uses Holter monitors or similar continuous recording devices. Medium-term monitoring is typically of a few days duration up to 30 days, and uses ELRs (auto triggered and/or patient triggered) or non-looping ERs which are sometimes handheld and always patient activated. The more recently available MCT devices (also referred to as real-time continuous monitoring) are purported to be feasible for monitoring beyond 30 days. Long-term monitoring is typically many months in duration and uses ILRs that record data only during an event and can be auto triggered and/or patient triggered.
Cardiac implantable electronic devices, such as implantable cardiac defibrillators, may also capture ECG data, but are out of scope for this Review. Similarly, studies of telemedicine, where AECG is monitored in addition to other vital signs (e.g. blood pressure), are out of scope due to confounding. Studies monitoring patients while en route to hospital were excluded, as were studies using inpatient telemetry systems.
The PICO criteria encompass a number of possible comparisons. Studies of any type of AECG monitoring compared to no AECG monitoring are eligible, as are studies that directly compare devices with different monitoring durations (short- , medium- or long-term monitoring). Studies that compare AECG of similar monitoring duration but with different triggers for the recording of data (e.g. patient-triggered versus auto-triggered recording) are also eligible. Studies comparing devices with the same monitoring duration and the same trigger for recording (e.g. different brands of patient-triggered ELRs) are out of scope.
The focus of the evidence review is to determine the clinical utility of AECG monitoring, which would ideally be assessed through studies that report the impact of AECG on patient-relevant health outcomes, such as survival or change in symptoms/episodes (depending on the clinical indication/condition). Where patient-relevant health outcomes are not reported, the intermediate outcome of change in patient management (treatment and/or further clinical evaluation) takes on greater significance. However, in the absence of direct evidence, a linked evidence approach (which includes an assessment of treatment effectiveness) is considered out of scope for practical reasons given the broad nature of the Review, and immediate outcomes such as diagnostic yield/arrhythmia detection rate or time to diagnosis are reported.MBS Review – Ambulatory Electrocardiography Review Report Page 42

May 2016
2.4 Systematic literature review for clinical evidence
2.4.1 The research questions for the clinical evidence review
The research questions to be addressed as part of the review of the clinical evidence include:
(1) What is the evidence of effectiveness and safety of AECG monitoring of any duration compared with no AECG monitoring?
(2) What is the evidence of effectiveness and safety of AECG monitoring of one duration (short, medium, or long term) compared with AECG monitoring of a different duration (short, medium, or long term)?
(3) What is the evidence of effectiveness and safety of auto-triggered AECG monitoring compared with patient-triggered AECG monitoring of the same duration (either medium or long term)?
As described above in Section 2.3, the eligible population includes patients undergoing AECG monitoring for suspected arrhythmia using Holters, ELRs, ERs, MCTs, or ILRs. Studies in healthy individuals or for general population screening are out of scope, as are studies investigating inpatient telemetry systems or implanted electronic devices such as cardiac defibrillators and pacemakers (which sometimes record ECG data).
2.4.2 Methods for the clinical evidence review
The following section outlines the methods used to identify relevant studies for the review of clinical evidence. This includes a description of the literature search strategy and the criteria used to define the inclusion/exclusion of studies.
Search strategy for systematic review/HTA evidenceA comprehensive search of peer-reviewed scientific literature was conducted to identify studies published from 1999 onwards that address the PICO criteria outlined in Table 2.3.4. For practical reasons, given the broad scope of the Review, the search of electronic databases was undertaken hierarchically to firstly identify original research papers describing systematic reviews and meta-analyses. As shown in Table 2.4.5, the databases searched were EMBASE, Medline, PubMed and the Cochrane Library.
The specific search terms used to identify relevant literature are outlined in Appendix 4. A comprehensive search strategy was developed for each database to identify the various types of AECG devices. Search filters were then applied to identify systematic reviews, meta-analyses and HTAs (see Appendix 4).
Table 2.4.5 Databases searched – clinical evidence
Database Search periodEMBASE (Ovid SP) 1 January 1999 to 19 January 2016
Medline (Ovid SP; Daily and 1946 to present) 1 January 1999 to 19 January 2016
PubMed 1 January 1999 to 02 February 2016
The Cochrane Library (includes Cochrane Database of Systematic Reviews, Database of Abstracts of Reviews of Effects, Health Technology Assessments)
1 January 1999 to 03 February 2016
MBS Review – Ambulatory Electrocardiography Review Report Page 43

May 2016
Eligibility criteria for systematic reviews/HTAsThe literature search outlined above identified 891 citations to which the following exclusion criteria were applied:
Not a systematic review/HTA – excludes narrative reviews, other study types and other publication types including letters, editorials and commentaries.
Wrong intervention – excludes studies that do not assess AECG. Wrong population – excludes studies that assess AECG in healthy patients (i.e.
population screening) or in critical care patients (ambulance or inpatient telemetry). Wrong outcomes – excludes studies that do not assess one of the outcomes outlined in
Section 2.3. Not in English – excludes studies not published in English that do not include at least
some information (e.g. a summary) in English. Superseded – excludes systematic reviews/HTAs that have been updated.
The exclusion of citations from the literature searches is presented in Table 2.4.6. No comparator restrictions were imposed during the eligibility screening.
Table 2.4.6 Summary of the process used to identify relevant systematic reviews and HTAsDescription EMBASE, Medline
and PubMedCochrane Library
technology assessments
Cochrane Library reviews (Cochrane
and other)Total citations 743a 25 286
Duplicates within sets removed 163 0 0
Unique citations screened 580 25 286
Excluded at title/abstract reviewWrong populationWrong interventionWrong outcomesWrong study or publication typeProtocolNot in EnglishSuperseded
Total citations excluded at title/abstract review
332014
2591
170
515
01003011
15
127900100
281
Citations screened at full text review 65 10 5
Excluded at full text reviewWrong populationWrong interventionWrong outcomesRisk assessment outcomesWrong study or publication typeSuperseded/obsolete
Total citations excluded at full text review
21847
250
56
0500229
0300104
Included citations from database searches 9 1 1
Combined systematic review and HTA searches 10
Duplicates removed 0
Added from guideline search 1
Added from economics search 1
Added from hand searching 1
Total included citations 13
MBS Review – Ambulatory Electrocardiography Review Report Page 44

May 2016
Abbreviations: HTA, health technology assessment.a 377 citations from EMBASE, an additional 79 from Medline, 287 from PubMed.
A total of ten relevant systematic reviews/health technology assessments (HTAs) were identified from this search, and an additional three citations were identified during the other literature searches in this Review or hand searching, making a total of 13 included studies. The quality of the included systematic reviews was assessed using the AMSTAR measurement tool and is shown in Appendix 6. The quality assessment was performed by a single reviewer and checked by a second reviewer.
Seven systematic reviews/HTAs reporting the use of AECG for risk assessment were also identified, but excluded as they do not report PICO outcomes. These studies are listed in Appendix 6.
Search strategy for primary studiesA literature search in the databases Medline and EMBASE was performed in February 2016 to identify randomised controlled trials (RCTs) involving AECG, in order to (i) corroborate the evidence identified in the systematic reviews/HTAs; and (ii) identify any studies published since the relevant systematic review time period. The search strategy described above was repeated, but using an RCT search string filter (see Appendix 4). Therefore, as for the search for systematic reviews and HTAs, this search did not restrict citations by indication, and all RCTs for AECG devices would be captured.
The search for primary studies was restricted to RCTs for pragmatic reasons. As mentioned in Section 2.3, the focus of the evidence review is to determine the clinical utility of AECG monitoring, which would ideally be assessed through studies that report the impact of AECG on patient-relevant health outcomes, such as survival or change in symptoms/episodes (depending on the clinical indication/condition). Where patient-relevant health outcomes are not reported, the intermediate outcome of change in patient management (treatment and/or further clinical evaluation) take on greater significance. RCTs are less prone to bias and provide the best evidence for the comparative safety and effectiveness of AECG monitoring.
Eligibility criteria for RCT evidenceThe literature search outlined above identified 1,952 citations to which the following exclusion criteria were applied:
Not an RCT – excluded non-randomised comparative studies, other study types and other publication types including letters, editorials and commentaries.
Wrong intervention – excludes studies that do not assess AECG. Wrong population – excludes studies that assess AECG in healthy patients (i.e.
population screening) or in critical care patients (ambulance or inpatient telemetry). Wrong outcomes – excludes studies that do not assess relevant outcomes. Not in English – excludes studies not published in English that do not include at least
some information (e.g. a summary) in English.
As for systematic review/HTA studies, no comparator restrictions were imposed during the eligibility screening.
A total of 21 publications relating to RCTs of AECG monitoring were identified from this search, and an additional two citations were identified by hand searching, making a total of 23 included RCT publications. Eight of these publications were not included in key systematic reviews/HTAs already identified for the current Review.
MBS Review – Ambulatory Electrocardiography Review Report Page 45

May 2016
2.5 Systematic literature review for economic evidence
The research questions to be addressed as part of the review of the published economic evidence include:
(1) What is the published evidence for the cost implications and cost-effectiveness of AECG monitoring of any duration compared with no AECG monitoring?
(2) What is the published evidence for the cost implications and cost-effectiveness of AECG monitoring of one duration (short-, medium-, or long term) compared with AECG monitoring of a different duration (short-, medium-, or long term)?
(3) What is the published evidence for the cost implications and cost-effectiveness of auto-triggered AECG monitoring compared with patient-triggered AECG monitoring of the same duration (either medium- or long term)?
As described above in Section 2.3, the eligible population includes any patients (not healthy individuals or general population screening) in which AECG monitoring is undertaken for suspected arrhythmia. Devices such as Holter monitors, ELRs, MCT devices, and ILRs are in scope. Out-of-scope studies included those investigating implanted electronic devices such as cardiac defibrillators and pacemakers (which sometimes record ECG data), studies monitoring patients while en route to hospital, and studies of ambulatory patients in hospital using inpatient telemetry systems.
2.5.1 Search strategy
The following section outlines the methods used to identify relevant studies for the review of economic evidence. This includes a description of the literature search strategy and the criteria used to define the inclusion/exclusion of studies.
The specific search terms used to identify relevant literature are outlined in Appendix 4. The search was restricted from 1999 to the search date (19 January 2016) and was conducted in the EMBASE and Medline databases. For each database, a search strategy was developed based on AECG devices which was then filtered to identify cost-effectiveness or costing studies.
Eligibility criteria for studiesThe literature search outlined above identified 961 citations, and an additional three citations were identified by hand searching. The following exclusion criteria were applied:
Not a costing or cost-effectiveness study – excludes narrative reviews, other study types and other publication types including letters, editorials and commentaries.
Wrong intervention – excludes studies that do not assess AECG. Wrong population – excludes studies that assess AECG in healthy patients (i.e.
population screening) or in critical care patients (ambulance or inpatient telemetry). Wrong outcomes – excludes studies that do not assess one of the outcomes outlined in
Section 2.3. Not in English – excludes systematic reviews not published in English that do not
include at least some information (e.g. a summary) in English.
No comparator restrictions were imposed during the eligibility screening. The exclusion of citations from the searches is presented in Table 2.5.7. Twenty-two relevant economic publications were identified for inclusion in the Review.
MBS Review – Ambulatory Electrocardiography Review Report Page 46

May 2016
Table 2.5.7 Summary of the process used to identify relevant economic analysesDescription EMBASE and Medline
databasesCochrane Library
economic evaluationsTotal citations 919a 42
Duplicates within set removed 73 1
Unique citations screened 846 41
Excluded at title/abstract reviewWrong populationWrong interventionWrong outcomesWrong study or publication typeNot in English
Total citations excluded at title/abstract review
3331124391
786
12801030
Citations screened at full text review 60 11
Excluded at full text reviewWrong populationWrong interventionWrong outcomesWrong study or publication type
Total citations excluded at full text review
0198
1437
00000
Included citations from database searches 19 11
Citations identified by hand searching 3 –
Combined searches 33
Duplicates removed 11
Total included citations 22a 820 citations from EMBASE and an additional 99 from Medline
MBS Review – Ambulatory Electrocardiography Review Report Page 47

May 2016
3 SECONDARY DATA ANALYSIS
This section presents an analysis of the available secondary data that describes the current use of AECG in Australia. It focuses on the six MBS items that relate to AECG. Two of these items (11708 and 11709) are intended for continuous recording, and two items (11710 and 11711) are intended for event recording. Item 38285 is for the procedure involving the insertion of an ILR and Item 11722 is intended for ILR monitoring. The full item descriptors and Schedule fees for the six in-scope MBS items are provided in Appendix 3.
3.1 MBS services and expenditure for AECG
3.1.1 Temporal trends
Total number of services for AECG itemsTable 3.1.8 shows the total services for each of the six relevant MBS items from 2010-11 to 2014-15. Appendix 3.2 shows one-year, five-year and 10-year growth for each item.
MBS item 11709 for continuous ECG recording with a Holter monitor is the most commonly used item, with over 277,000 services in 2014-15. The number of services for Item 11709 increased by 57% from 2010-11 to 2014-15.
Item 11708, which is for other continuous recording services, accounts for only a small proportion of all AECG services; however, this service grew by 161% from 2010-11 to 2014-15. Prior to 2008-09, services for Item 11708 were largely in decline (data not shown). This item was originally created for early Holter-style monitors, which have since been replaced by Holters with superimposition and full disclosure (claimed using Item 11709). The observed increase in services for Item 11708 since 2010-11 may be associated with the introduction of V-Patch to the Australian market.11
The four items for external and implantable event recording (11710, 11711, 38285 and 11722) accounted for only a small proportion of all AECG services in 2014-15. In recent years there has been a plateau in the use of Items 11710 and 11711 (for ERs and ELRs) at the same time that the number of insertion procedures for ILRs (Item 38285) more than doubled.
The vast majority of services for Items 11709, 11710, 11711, 11722 and 38285 are provided out of hospital. In contrast, a growing proportion of services for Item 11708 are provided in hospital (see Appendix 3), which may reflect increased use of non-Holter continuous recording devices in this setting, or the use of MCT devices (e.g. for perioperative monitoring or risk assessment).
11 The V-Patch device was listed on the Australian Register of Therapeutic Goods (ARTG) in July 2010.
MBS Review – Ambulatory Electrocardiography Review Report Page 48

May 2016
Table 3.1.8 Total services for AECG MBS items, 2010-11 to 2014-15
MBS item Device type 2010-11 2011-12 2012-13 2013-14 2014-15 % of total AECG 2014-15
5-year growth
11708 Other continuous recording
2,383 3,780 5,039 5,883 6,216 2.1% 161%
11709 Holter 177,200 202,825 221,634 249,109 277,643 93.2% 57%
11710 ELR 3,812 4,045 4,122 4,333 4,308 1.4% 13%
11711 ER 555 648 819 823 813 0.3% 46%
38285 ILR (insertion) 576 654 772 987 1,944 0.7% 238%
11722 ILR 2,408 2,876 3,655 4,662 7,076 2.4% 194%
Total - 186,934 214,828 236,041 265,797 298,000 100% -Source: Medicare Australia. Accessed 8 March 2016Note: These data are determined by the date the service was processed, not the date the service was provided by Medicare Australia.Abbreviations: AECG, ambulatory electrocardiography; ECG, electrocardiography; ELR, event loop recorder; ER, event recorder; ILR, implantable loop recorder; MBS, Medicare Benefits Schedule.
Total benefits paid for AECG itemsTable 3.1.9 shows the total benefits paid for each of the six relevant MBS items from 2010-11 to 2014-15. Between 2010-11 and 2014-15, Item 11709 accounted for approximately 97% of total expenditure on AECG services. The five-year growth in expenditure is greater than the five-year growth in services for each of the AECG items; however, the MBS fee for all six items increased annually from November 2009 until the most recent fee increase in November 2012.
Table 3.1.9 Total benefits paid for AECG MBS items, 2010-11 to 2014-15
MBS item
Device type 2010-11 2011-12 2012-13 2013-14 2014-15 % of total
AECG 2014-15
5-year growth
11708 Other continuous recording
$243,452 $389,800 $527,299 $614,080 $649,412 1.6% 167%
11709 Holter $24,290,178 $28,354,289 $31,554,808 $35,732,921 $39,795,143 96.7% 64%
11710 ELR $168,442 $181,718 $189,431 $201,032 $199,735 0.5% 19%
11711 ER $13,667 $15,988 $21,229 $21,640 $21,622 0.1% 58%
38285 ILR (insertion) $74,443 $84,980 $103,379 $133,581 $262,258 0.6% 252%
11722 ILR $68,833 $84,188 $108,336 $139,547 $212,526 0.5% 209%
Total - $24,859,015 $29,110,963 $32,504,482 $36,842,801 $41,140,697 100% -Source: Medicare Australia. Accessed 8 March 2016.Note: These data are determined by the date the service was processed, not the date the service was provided by Medicare Australia.Abbreviations: AECG, ambulatory electrocardiography, ECG, electrocardiography; ELR, event loop recorder; ER, event recorder; ILR, implantable loop recorder; MBS, Medicare Benefits Schedule.
3.1.2 Geographic trends
The following analyses were based on the address (at the time of claiming) of the patient to whom the service was rendered.
Services per capita by state/territoryTable 3.1.10 shows the number of services per capita in each state and territory for the six relevant MBS items in the most recent financial year for which data were available (July 2014 to June 2015). The highest per capita usage of Item 11708 was in New South Wales (NSW) and Queensland (47 and 33 per 100,000 population, respectively). There were no services for
MBS Review – Ambulatory Electrocardiography Review Report Page 49

May 2016
Item 11708 in Tasmania in 2014-15, and very low usage in the Northern Territory (NT) and Western Australia (WA) (see Appendix 3.2 for the total number of services per state/territory).
Services for Item 11709 (Holter) varies across states almost two-fold, with Victoria and NSW having the highest number of services per capita (over 1,300 services per 100,000 population), and WA the lowest (655 services per 100,000 population).
In contrast, the number of services per capita for MBS item 11710 (ELR monitoring) was highest for WA and Tasmania, and lowest for the Australian Capital Territory (ACT) and NSW. MBS item 11711 (ER monitoring) was highest for Queensland and WA, with very low usage per capita in South Australia (SA) and the NT.
In 2014-15, the number of services per capita for MBS item 38285 (ILR insertion procedure) and Item 11722 (ILR monitoring) was highest in SA (17 per 100,000 population and 86 per 100,000 population, respectively). ILR is used infrequently in the NT.
Table 3.1.10 Services per capita by state/territory for MBS items relevant to AECG, 2014-15
MBS item Device type NSW VIC QLD SA WA TAS ACT NT Total
11708 Other continuous recording
47 13 33 6 3 0 9 1 26
11709 Holter 1,316 1,323 1,048 1,042 665 831 1,046 927 1,156
11710 ELR 9 14 20 19 47 36 2 14 18
11711 ER 2 2 7 0 5 2 2 0 3
38285 ILR (insertion) 7 6 7 17 12 9 9 1 8
11722 ILR 23 25 31 86 22 32 14 1 29Source: Department of Human Services, Medicare Australia Statistics. Accessed 8 March 2016.Note: These data are determined by the date the service was processed by Medicare Australia, not the date the service was provided. Services per capita (i.e. per 100,000 population) are calculated by dividing the number of services processed in a month by the number of people enrolled in Medicare at the end of that month.Abbreviations: AECG, ambulatory electrocardiography, ECG, electrocardiography; ELR, event loop recorder; ER, event recorder; ILR, implantable loop recorder; MBS, Medicare Benefits Schedule.
Dissemination of services to regional areas
MBS items for continuous recordingThe regional distribution of patients claiming Item 11708 is shown in Figure 3.1.2 and Table 3.1.11. Over the past five years, the number of services for Item 11708 increased substantially in major cities (91%), inner regional Australia (376%), and outer regional Australia (568%). The proportion of patients receiving this service from inner and outer regional Australia has also increased over time, with patients in regional areas now accounting for approximately one third of all services for Item 11708 (as shown in Table 3.1.11).
MBS Review – Ambulatory Electrocardiography Review Report Page 50
May 2016
Figure 3.1.2 Number of services for Item 11708, by regional status, 2010-11 to 2014-15
Source: Department of Health, Medical Benefits Division, Medicare Financing & Listing Branch, MBS Analytics Section. Data received 10 March 2016.Note: These data are determined by the date the service was provided.
Table 3.1.11 Proportion of services for Item 11708 by regional status, 2010-11 to 2014-15
Region 2010-11 2011-12 2012-13 2013-14 2014-15
Major Cities of Australia 82.5% 75.4% 69.7% 59.1% 64.9%
Inner Regional Australia 13.3% 16.9% 21.7% 27.4% 26.1%
Outer Regional Australia 2.9% 6.9% 7.9% 12.4% 7.9%
Remote Australia 0.8% 0.2% 0.6% 0.8% 0.9%
Very Remote Australia 0.5% 0.5% 0.1% 0.2% 0.1%
Unknown 0.0% 0.1% 0.0% 0.1% 0.1%
Total 100.0% 100.0% 100.0% 100.0% 100.0%Source: Department of Health, Medical Benefits Division, Medicare Financing & Listing Branch, MBS Analytics Section. Data received 10 March 2016.Note: These data are determined by the date the service was provided.
The regional distribution of patients claiming Item 11709 is shown in Figure 3.1.3 and Table 3.1.12. The number of services for Item 11709 increased in major cities, inner, and outer regional Australia (50%, 35%, and 66%, respectively) from 2010-11 to 2014-15. However, there has been no change over time in the proportion of patients from various regional areas receiving a Holter monitor, with services to patients in major cities accounting for approximately 71% of all services for Item 11709 (as shown in Table 3.1.12). Therefore, the observed growth in Holter monitor usage is not attributed to a change in regional uptake of this service.
MBS Review – Ambulatory Electrocardiography Review Report Page 51

May 2016
Figure 3.1.3 Number of services for Item 11709, by regional status, 2010-11 to 2014-15
Source: Department of Health, Medical Benefits Division, Medicare Financing & Listing Branch, MBS Analytics Section. Data received 10 March 2016.Note: These data are determined by the date the service was provided.
Table 3.1.12 Proportion of services for Item 11709 by regional status, 2010-11 to 2014-15
Region 2010-11 2011-12 2012-13 2013-14 2014-15
Major Cities of Australia 71.0% 70.7% 71.4% 71.9% 71.5%
Inner Regional Australia 20.2% 20.2% 19.4% 18.5% 18.4%
Outer Regional Australia 8.1% 8.3% 8.5% 8.7% 9.0%
Remote Australia 0.5% 0.5% 0.5% 0.6% 0.7%
Very Remote Australia 0.2% 0.2% 0.2% 0.2% 0.4%
Total 100.0% 100.0% 100.0% 100.0% 100.0%Source: Department of Health, Medical Benefits Division, Medicare Financing & Listing Branch, MBS Analytics Section. Data received 10 March 2016.Note: These data are determined by the date the service was provided.
MBS items for external event recordingThe regional distribution of patients claiming Item 11710 is shown in Figure 3.1.4 and Table 3.1.13. The number of services for Item 11710 increased slightly from 2010-11 to 2014-15 in major cities and outer regional Australia (27% and 24%, respectively) and has decreased in inner regional Australia (22%). This corresponded to a small increase over time in the proportion of patients from major cities and outer regional areas receiving this service, with patients in major cities accounting for approximately 74% of all services for Item 11710 in 2014-15 (as shown in Table 3.1.13).
MBS Review – Ambulatory Electrocardiography Review Report Page 52

May 2016
Figure 3.1.4 Number of services for Item 11710, by regional status, 2010-11 to 2014-15
Source: Department of Health, Medical Benefits Division, Medicare Financing & Listing Branch, MBS Analytics Section. Data received 10 March 2016.Note: These data are determined by the date the service was provided.
Table 3.1.13 Proportion of services for Item 11710 by regional status, 2010-11 to 2014-15
Region 2010-11 2011-12 2012-13 2013-14 2014-15
Major Cities of Australia 67.2% 70.4% 70.0% 70.6% 73.8%
Inner Regional Australia 23.0% 20.8% 19.7% 18.2% 15.6%
Outer Regional Australia 8.9% 8.0% 9.2% 10.1% 9.5%
Remote Australia 0.8% 0.5% 0.9% 0.9% 0.7%
Very Remote Australia 0.1% 0.4% 0.3% 0.2% 0.4%
Total 100.0% 100.0% 100.0% 100.0% 100.0%Source: Department of Health, Medical Benefits Division, Medicare Financing & Listing Branch, MBS Analytics Section. Data received 10 March 2016.Note: These data are determined by the date the service was provided.
The regional distribution of patients claiming Item 11711 is shown in Figure 3.1.5 and Table 3.1.14. From 2010-11 to 2014-15, the number of services to patients in major cities and outer regional Australia increased by 44% and 170%, respectively. However, patients in regional and remote areas accounted for less than 20% of all services in 2014-15 (as shown in Table 3.1.14).
MBS Review – Ambulatory Electrocardiography Review Report Page 53

May 2016
Figure 3.1.5 Number of services for Item 11711, by regional status, 2010-11 to 2014-15
Source: Department of Health, Medical Benefits Division, Medicare Financing & Listing Branch, MBS Analytics Section. Data received 10 March 2016.Note: These data are determined by the date the service was provided.
Table 3.1.14 Proportion of services for Item 11711 by regional status, 2010-11 to 2014-15
Region 2010-11 2011-12 2012-13 2013-14 2014-15
Major Cities of Australia 82.4% 87.4% 84.6% 78.4% 80.1%
Inner Regional Australia 12.1% 7.6% 8.3% 9.5% 9.4%
Outer Regional Australia 5.0% 3.9% 6.3% 10.5% 9.0%
Remote Australia 0.0% 0.6% 0.6% 1.2% 0.8%
Very Remote Australia 0.6% 0.6% 0.2% 0.4% 0.7%
Total 100.0% 100.0% 100.0% 100.0% 100.0%Source: Department of Health, Medical Benefits Division, Medicare Financing & Listing Branch, MBS Analytics Section. Data received 10 March 2016.Note: These data are determined by the date the service was provided.
MBS items for implantable event recordingThe regional distribution of patients claiming Item 38285 for ILR insertion is shown in Figure3.1.6 and Table 3.1.15. From 2010-11 to 2014-15, the number of services for Item 38285 increased substantially in major cities (235%), inner regional (202%), and outer regional Australia (294%). However, there have been no material changes over time in the proportion of patients from various areas receiving this service, with patients in major cities accounting for approximately 75% of all services for Item 38285 (as shown in Table 3.1.15). Similar trends are seen for the associated service of long-term monitoring with Item 11722 (Figure 3.1.7 and Table 3.1.16).
MBS Review – Ambulatory Electrocardiography Review Report Page 54

May 2016
Figure 3.1.6 Number of services for Item 38285, by regional status, 2010-11 to 2014-15
Source: Department of Health, Medical Benefits Division, Medicare Financing & Listing Branch, MBS Analytics Section. Data received 10 March 2016.Note: These data are determined by the date the service was provided.
Table 3.1.15 Proportion of services for Item 38285 by regional status, 2010-11 to 2014-15
Region 2010-11 2011-12 2012-13 2013-14 2014-15
Major Cities of Australia 75.1% 75.5% 75.7% 76.0% 75.3%
Inner Regional Australia 17.0% 15.6% 15.0% 15.1% 15.4%
Outer Regional Australia 6.6% 7.7% 7.7% 7.3% 7.8%
Remote Australia 0.9% 0.8% 1.2% 1.5% 1.3%
Very Remote Australia 0.3% 0.2% 0.4% 0.1% 0.2%
Unknown 0.0% 0.2% 0.0% 0.0% 0.1%
Total 100.0% 100.0% 100.0% 100.0% 100.0%Source: Department of Health, Medical Benefits Division, Medicare Financing & Listing Branch, MBS Analytics Section. Data received 10 March 2016.Note: These data are determined by the date the service was provided.
MBS Review – Ambulatory Electrocardiography Review Report Page 55

May 2016
Figure 3.1.7 Number of services for Item 11722, by regional status, 2010-11 to 2014-15
Source: Department of Health, Medical Benefits Division, Medicare Financing & Listing Branch, MBS Analytics Section. Data received 10 March 2016.Note: These data are determined by the date the service was provided.
Table 3.1.16 Proportion of services for Item 11722 by regional status, 2010-11 to 2014-15
Region 2010-11 2011-12 2012-13 2013-14 2014-15
Major Cities of Australia 67.5% 69.5% 73.4% 72.8% 73.9%
Inner Regional Australia 21.4% 21.5% 17.6% 17.9% 17.3%
Outer Regional Australia 10.1% 7.7% 7.8% 7.8% 7.5%
Remote Australia 0.7% 1.0% 1.1% 1.4% 1.1%
Very Remote Australia 0.3% 0.2% 0.2% 0.1% 0.2%
Unknown 0.0% 0.0% 0.0% 0.0% 0.0%
Total 100.0% 100.0% 100.0% 100.0% 100.0%Source: Department of Health, Medical Benefits Division, Medicare Financing & Listing Branch, MBS Analytics Section. Data received 10 March 2016.Note: These data are determined by the date the service was provided.
3.1.3 Patient characteristics
Age and genderThere have been no substantial changes in the gender and age distribution of the six AECG items over the past five years, with the exception of a small shift in services for Item 11708 (for continuous recording other than Holter) towards higher usage in the elderly adults (between 65 and 74 years old) and lower usage in the younger age groups (15 to 34 years).
The following data analyses are therefore restricted to the most recent financial year for which data were available (July 2014 to June 2015).
MBS items for continuous recordingFigure 3.1.8 and Figure 3.1.9 show the age and gender distribution of services for Item 11708 for continuous ECG recording (not including a Holter monitor) and Item 11709 for the use of a Holter monitor. For both items, females accounted for slightly more than half of the services (55% and 57%, respectively), with limited usage (1-2%) observed in patients across both genders aged <15 years.
MBS Review – Ambulatory Electrocardiography Review Report Page 56

May 2016
Figure 3.1.8 Total services for MBS item 11708 by age group and gender, 2014-15
Source: Department of Human Services, Medicare Australia Statistics. Accessed 8 March 2016.Note: These data are determined by the date the service was processed by Medicare Australia, not the date the service was provided.Abbreviations: MBS, Medicare Benefits Schedule.
Figure 3.1.9 Total services for MBS item 11709 by age group and gender, 2014-15
Source: Department of Human Services, Medicare Australia Statistics. Accessed 8 March 2016.Note: These data are determined by the date the service was processed by Medicare Australia, not the date the service was provided.Abbreviations: MBS, Medicare Benefits Schedule.
MBS items for external event recordingFigure 3.1.10 and Figure 3.1.11 show the age and gender distribution of services for Item 11710 (ELR monitoring) and Item 11711 (ER monitoring). For both items, females accounted for nearly two thirds of services (63% and 66%, respectively), with limited usage observed in patients across both genders aged <5 years, and in those aged 85 years and older. In contrast
MBS Review – Ambulatory Electrocardiography Review Report Page 57

May 2016
to MBS item 11710, Item 11711 (ER monitoring) is infrequently used in patients aged 5-14 years.
Figure 3.1.10 Total services for MBS item 11710 by age group and gender, 2014-15
Source: Department of Human Services, Medicare Australia Statistics. Accessed 8 March 2016.Note: These data are determined by the date the service was processed by Medicare Australia, not the date the service was provided.Abbreviations: MBS, Medicare Benefits Schedule.
Figure 3.1.11 Total services for MBS item 11711 by age group and gender, 2014-15
Source: Department of Human Services, Medicare Australia Statistics. Accessed 8 March 2016.Note: These data are determined by the date the service was processed by Medicare Australia, not the date the service was provided.Abbreviations: MBS, Medicare Benefits Schedule.
MBS items for implantable event recordingFigure 3.1.12 shows the age and gender distribution of services for Item 38285 relating to the insertion of an ILR in patients with recurrent unexplained syncope. Females accounted for nearly half (52%) of the services. Females and males aged between 45 and 84 years accounted for 81% of total services, with limited usage (0.6%) observed in patients across both genders
MBS Review – Ambulatory Electrocardiography Review Report Page 58

May 2016
aged <15 years. The demographics of services for MBS item 11722 (ILR monitoring services), are similar to those of Item 38285 (see Figure 3.1.13).
Figure 3.1.12 Total services for MBS item 38285 by age group and gender, 2014-15
Source: Department of Human Services, Medicare Australia Statistics. Accessed 8 March 2016.Note: These data are determined by the date the service was processed by Medicare Australia, not the date the service was provided.Abbreviations: MBS, Medicare Benefits Schedule.
Figure 3.1.13 Total services for MBS item 11722 by age group and gender, 2014-15
Source: Department of Human Services, Medicare Australia Statistics. Accessed 8 March 2016.Note: These data are determined by the date the service was processed by Medicare Australia, not the date the service was provided.Abbreviations: MBS, Medicare Benefits Schedule.
MBS Review – Ambulatory Electrocardiography Review Report Page 59
May 2016
3.1.4 Frequency of multiple services per patient
Data are shown for the number of services received per patient per financial year. These data do not reflect the temporal proximity of services, so multiple services may be due to consecutive services to extend the period of a single monitoring episode, or may be due to more frequent, separate monitoring episodes throughout the year.
MBS items for continuous recordingTable 3.1.17 presents the number of patients claiming Item 11708 over the past five years, together with the number of patients receiving one or multiple services each year. The proportion of patients receiving multiple services (two or more) per year for Item 11708 increased from 19% to 40% from 2010-11 to 2014-15. Table 3.1.18 shows the frequency distribution for multiple services; the increase is largely due to an increasing number of patients receiving two services in a financial year. However, in 2014-15, there were 44 patients who received six or more services in the 12-month period, with one patient receiving 20 services.
This growth in multiple services per patient coincides with the introduction of V-Patch to Australia in 2010, and is consistent with the proposed use of Item 11708 for V-Patch services, as this MCT service could potentially result in repeat claims for Item 11708 for extended periods of monitoring.
Table 3.1.17 Number of patients with multiple services per year for Item 11708, 2010-11 to 2014-15
2010-11 2011-12 2012-13 2013-14 2014-15% increase 2010-
11 to 2014-15
Total no. of patients 1,591 2,380 3,071 3,477 3,507 120%
No. of patients with single service
1,290 1,666 1,990 2,139 2,095 62%
No. of patients with multiple services (2 or more)
301 714 1,081 1,338 1,412 369%
% of patients receiving a single service
81.1% 70.0% 64.8% 61.5% 59.7% -
% of patients receiving multiple services
18.9% 30.0% 35.2% 38.5% 40.3% -
Source: Department of Health, Medical Benefits Division, Medicare Financing & Listing Branch, MBS Analytics Section. Data received 10 March 2016.Note: These data are determined by the date the service was provided.
Table 3.1.18 Number of patients by number of services per year for Item 11708, 2010-11 to 2014-15
Services per year 2010-11 2011-12 2012-13 2013-14 2014-151 1,290 1,666 1,990 2,139 2,095
2 107 401 730 857 947
3 27 100 107 167 152
4 21 61 59 100 104
5 133 124 135 146 165
6 3 10 16 24 10
7 1 4 14 13 12
8 - 1 9 2 7
9 3 5 4 6 5
10 3 1 4 7 8
11 - 2 1 6 1
12 2 2 1 5 -
MBS Review – Ambulatory Electrocardiography Review Report Page 60

May 2016
Services per year 2010-11 2011-12 2012-13 2013-14 2014-1513 - 3 - 3 -
18 1 - - 1 -
19 - - 1 - -
20 - - - 1 1Source: Department of Health, Medical Benefits Division, Medicare Financing & Listing Branch, MBS Analytics Section. Data received 10 March 2016.Note: These data are determined by the date the service was provided.
Table 3.1.19 shows the number of patients claiming Item 11709 over the past five years. The growth in the number of patients with multiple claims (two or more) per year is greater than the growth in the number of patients with single claims (87% vs 50%, respectively). However, the proportion of patients with multiple services remained relatively constant over the past five years, constituting just 8% of patients in 2014-15 (although this equates to over 20,000 patients). Table 3.1.20 shows the frequency distribution for multiple services, showing that the majority of patients received three or fewer services for Item 11709 in any financial year. However, in 2014-15, there were 21 patients who received 20 or more services in the 12-month period, with one patient receiving 57 services for Holter monitoring.
Table 3.1.19 Number of patients with multiple services per year for Item 11709, 2010-11 to 2014-15
2010-11 2011-12 2012-13 2013-14 2014-15% increase 2010-
11 to 2014-15
Total no. of patients 164,203 188,532 204,874 227,549 249,729 52%
No. of patients with single service
153,169 175,452 190,143 209,919 229,097 50%
No. of patients with multiple services (2 or more)
11,034 13,080 14,731 17,630 20,632 87%
% of patients receiving a single service
93.3% 93.1% 92.8% 92.3% 91.7% -
% of patients receiving multiple services
6.7% 6.9% 7.2% 7.7% 8.3% -
Source: Department of Health, Medical Benefits Division, Medicare Financing & Listing Branch, MBS Analytics Section. Data received 10 March 2016.Note: These data are determined by the date the service was provided.
Table 3.1.20 Number of patients by number of services per year for Item 11709, 2010-11 to 2014-15
Services per year 2010-11 2011-12 2012-13 2013-14 2014-151 153,169 175,452 190,143 209,919 229,097
2 9,641 11,386 12,840 15,135 17,396
3 1,143 1,401 1,515 1,975 2,339
4 206 219 299 367 469
5 32 51 66 77 134
6 7 14 3 32 70
7 3 7 4 14 55
8 2 2 2 9 34
9 - - - 8 27
10 - - 1 1 24
11 - - 1 1 17
12 - - - 5 11
13 - - - 2 6
18 - - - - 7
MBS Review – Ambulatory Electrocardiography Review Report Page 61

May 2016
Services per year 2010-11 2011-12 2012-13 2013-14 2014-1519 - - - - 9
20 - - - 2 5Source: Department of Health, Medical Benefits Division, Medicare Financing & Listing Branch, MBS Analytics Section. Data received 10 March 2016.Note: These data are determined by the date the service was provided.
MBS items for external event recordingTable 3.1.21 presents the number of patients claiming Item 11710 (ELR) over the past five years. The proportion of patients receiving multiple services per year has remained constant at around 2%. Table 3.1.22 shows the frequency distribution for multiple services for Item 11710, showing that very few patients received more than two services in any given year. The highest number of services per patient was six, occurring in 2011-12 in only one patient.
Table 3.1.21 Number of patients with multiple services per year for Item 11710, 2010-11 to 2014-15
2010-11 2011-12 2012-13 2013-14 2014-15% increase 2010-
11 to 2014-15
Total no. of patients 3,683 4,000 3,926 4,159 4,267 15.9%
No. of patients with single service
3,598 3,902 3,840 4,058 4,179 16.1%
No. of patients with multiple services (2 or more)
85 98 86 101 88 3.5%
% of patients receiving a single service
97.7% 97.6% 97.8% 97.6% 97.9% -
% of patients receiving multiple services
2.3% 2.5% 2.2% 2.4% 2.1% -
Source: Department of Health, Medical Benefits Division, Medicare Financing & Listing Branch, MBS Analytics Section. Data received 10 March 2016.Note: These data are determined by the date the service was provided.
Table 3.1.22 Number of patients by number of services per year for Item 11710, 2010-11 to 2014-15
Services per year 2010-11 2011-12 2012-13 2013-14 2014-151 3,598 3,902 3,840 4,058 4,179
2 79 90 80 95 83
3 5 7 6 6 5
4 1 - - - -
5 - - - - -
6 - 1 - - -Source: Department of Health, Medical Benefits Division, Medicare Financing & Listing Branch, MBS Analytics Section. Data received 10 March 2016.Note: These data are determined by the date the service was provided.
Table 3.1.23 presents the number of patients claiming Item 11711 over the past five years. The proportion of patients receiving multiple services for Item 11711 has remained low over the five-year period (less than 3% of patients). Table 3.1.24 shows the frequency distribution for multiple services for Item 11711. Very few patients had more than two services within a financial year. The maximum number of services in 2014-15 was five (one patient).
Table 3.1.23 Number of patients with multiple services per year for Item 11711, 2010-11 to 2014-15
2010-11 2011-12 2012-13 2013-14 2014-15% increase 2010-
11 to 2014-15
Total no. of patients 542 670 785 781 789 45.6%
No. of patients with single 532 657 764 761 778 46.2%
MBS Review – Ambulatory Electrocardiography Review Report Page 62

May 2016
2010-11 2011-12 2012-13 2013-14 2014-15% increase 2010-
11 to 2014-15
service
No. of patients with multiple services (2 or more)
10 13 21 20 11 10.0%
% of patients receiving a single service
98.2% 98.1% 97.3% 97.4% 98.6% -
% of patients receiving multiple services
1.8% 1.9% 2.7% 2.6% 1.4% -
Source: Department of Health, Medical Benefits Division, Medicare Financing & Listing Branch, MBS Analytics Section. Data received 10 March 2016.Note: These data are determined by the date the service was provided.
Table 3.1.24 Number of patients by number of services per year for Item 11711, 2010-11 to 2014-15
Services per year 2010-11 2011-12 2012-13 2013-14 2014-151 532 657 764 761 778
2 9 13 21 15 10
3 1 - - 4 -
4 - - - - -
5 - - - - 1
8 - - - 1 -Source: Department of Health, Medical Benefits Division, Medicare Financing & Listing Branch, MBS Analytics Section. Data received 10 March 2016.Note: These data are determined by the date the service was provided.
MBS items for implantable event recordingTable 3.1.25 presents the number of patients claiming Item 38285 (ILR insertion) over the past five years. The number of patients receiving multiple ILR insertion procedures per year is very low, ranging from five to 13 patients in any given year. Presumably repeat insertion would be for complications or device malfunction. Table 3.1.26 shows the frequency distribution for multiple services for Item 38285. One patient received 10 services in 2011-12 (presumably this is coded incorrectly).
Table 3.1.25 Number of patients with multiple services per year for Item 38285, 2010-11 to 2014-15
2010-11 2011-12 2012-13 2013-14 2014-15% increase 2010-
11 to 2014-15
Total no. of patients 570 655 766 1,079 1,944 241.1%
No. of patients with single service
565 647 757 1073 1931 241.8%
No. of patients with multiple services (2 or more)
5 8 9 6 13 160.0%
% of patients receiving multiple services
0.9% 1.2% 1.2% 0.6% 0.7% -
% of patients receiving a single service
99.1% 98.8% 98.8% 99.4% 99.3% -
Source: Department of Health, Medical Benefits Division, Medicare Financing & Listing Branch, MBS Analytics Section. Data received 10 March 2016.Note: These data are determined by the date the service was provided.
Table 3.1.26 Number of patients by number of services per year for Item 38285, 2010-11 to 2014-15
Services per patient 2010-11 2011-12 2012-13 2013-14 2014-15
1 565 647 757 1,073 1,931
MBS Review – Ambulatory Electrocardiography Review Report Page 63

May 2016
Services per patient 2010-11 2011-12 2012-13 2013-14 2014-15
2 5 7 9 6 13
10 - 1 - - -Source: Department of Health, Medical Benefits Division, Medicare Financing & Listing Branch, MBS Analytics Section. Data received 10 March 2016.Note: These data are determined by the date the service was provided.
Table 3.1.27 presents the number of patients claiming Item 11722 over the past five years. The proportion of patients receiving multiple services for Item 11722 remained relatively constant from 2010-11 to 2014-15, with just under half of all patients receiving a single service per year and just over half receiving two or more services per year. Table 3.1.28 shows the frequency distribution for single and multiple services for Item 11722. In 2014-15, there were ten patients who received more than six services; the highest number of services per patient in 2014-15 was nine services (in two patients).
Table 3.1.27 Number of patients with multiple services per year for Item 11722, 2010-11 to 2014-15
2010-11 2011-12 2012-13 2013-14 2014-15% increase 2010-
11 to 2014-15
Total no. of patients 1,218 1,576 2,032 2,502 3,841 215.4%
No. of patients with single service
533 765 1062 1177 1826 242.6%
No. of patients with multiple services (2 or more)
685 811 970 1,325 2,015 194.2%
% of patients receiving a single service
43.8% 48.5% 52.3% 47.0% 47.5% -
% of patients receiving multiple services
56.2% 51.5% 47.7% 53.0% 52.5% -
Source: Department of Health, Medical Benefits Division, Medicare Financing & Listing Branch, MBS Analytics Section. Data received 10 March 2016.Note: These data are determined by the date the service was provided.
Table 3.1.28 Number of patients by number of services per year for Item 11722, 2010-11 to 2014-15
Services per patient 2010-11 2011-12 2012-13 2013-14 2014-151 533 765 1,062 1,177 1,826
2 352 465 556 776 1,216
3 199 210 250 350 500
4 100 90 120 143 216
5 28 37 31 37 54
6 4 6 9 12 19
7 1 3 4 5 7
8 - - - 1 1
9 1 - - 1 2Source: Department of Health, Medical Benefits Division, Medicare Financing & Listing Branch, MBS Analytics Section. Data received 10 March 2016.Note: These data are determined by the date the service was provided.
3.1.5 Provider characteristics
The following analyses were based on MBS data provided for all six MBS items by major specialty of the service provider. Note that the data for Item 11709, in particular, must be interpreted in light of the fact that pathologists are recorded as service providers as they
MBS Review – Ambulatory Electrocardiography Review Report Page 64

May 2016
dispense Holter monitors on behalf of other healthcare professionals (including GPs and specialists).
MBS items for continuous recordingFigure 3.1.14 shows the number of services for MBS item 11708 over the past five years, with emphasis on the four highest provider types in 2014-15. From 2010-11 to 2013-14, the number of services provided by cardiologists increased substantially (174%) and this specialty remained the most frequent provider type (accounting for approximately 50% of services requested). Similarly, the number of services provided by GPs also increased substantially during the same time period (by 455%). Importantly, there was a substantial increase in the proportion of services provided by GPs over the past five years, increasing from 13% of services in 2010-11 to 27% of services in 2014-15.
Figure 3.1.14 Number of services for Item 11708 by specialty of service provider, 2010-11 to 2014-15
Source: Department of Health, Medical Benefits Division, Medicare Financing & Listing Branch, MBS Analytics Section. Data received 10 March 2016.Note: These data are determined by the date the service was provided.General Practitioner category compiled data from the following: GP trainee, vocationally registered GPs (non-referred attendances and procedural) and non-vocationally registered GPs (non-referred attendances).
Figure 3.1.15 shows the number of services of MBS item 11709 over the past five years by the three most frequent provider types in 2014-15, as well as for GPs. In 2010-11, cardiologists provided 51% of services, whereas GPs provided only 4% of services. By 2014-15, the number of services provided by cardiologists increased by 73% (making up 56% of services), while GP services decreased by approximately 8%, thus constituting only 2.4% of total services. Therefore, the substantial growth of services using Item 11709 appears to have been driven mainly by increased use by cardiologists. However, it is important to note that pathology specialists dispense Holter monitors on behalf of other specialty groups and provided nearly 27% of services in 2014-15, with a 69% growth over the past five years.
MBS Review – Ambulatory Electrocardiography Review Report Page 65

May 2016
Figure 3.1.15 Number of services for Item 11709 by specialty of service provider, 2010-11 to 2014-15
Source: Department of Health, Medical Benefits Division, Medicare Financing & Listing Branch, MBS Analytics Section. Data received 10 March 2016.Note: These data are determined by the date the service was provided.General Practitioner category compiled data from the following: GP trainee, vocationally registered GPs (non-referred attendances and procedural) and non-vocationally registered GPs (non-referred attendances).
MBS items for external event recordingFigure 3.1.16 shows the number of services over the past five years for Item 11710 by specialty. In 2010-11, cardiologists provided 72% of services, whereas GPs provided only 5%. By 2014-15, the proportion of services provided by GPs remained relatively low (approximately 6% of services).
Figure 3.1.16 Number of services for Item 11710 by specialty of service provider, 2010-11 to 2014-15
Source: Department of Health, Medical Benefits Division, Medicare Financing & Listing Branch, MBS Analytics Section. Data received 10 March 2016.Note: These data are determined by the date the service was provided.General Practitioner category compiled data from the following: GP trainee, vocationally registered GPs (anaesthesia, obstetrics, non-referred attendances and procedural) and non-vocationally registered GPs (diagnostic imaging, non-referred attendances, procedural).
Figure 3.1.17 shows the number of services over the past five years for Item 11711 by specialty. In 2014-15, cardiologists remained the most frequent provider type (nearly 86% of
MBS Review – Ambulatory Electrocardiography Review Report Page 66

May 2016
total services, vs 8% for GPs). The number of services provided by cardiologists increased by 69% from 2010-11 to 2014-15.
Figure 3.1.17 Number of services for Item 11711 by specialty of service provider, 2010-11 to 2014-15
Source: Department of Health, Medical Benefits Division, Medicare Financing & Listing Branch, MBS Analytics Section. Data received 10 March 2016.Note: These data are determined by the date the service was provided.General Practitioner category compiled data from the following: GP trainee, vocationally registered GPs (acupuncture, anaesthesia, non-referred attendances) and non-vocationally registered GPs (non-referred attendances, procedural).
MBS items for implantable event recordingFigure 3.1.18 shows the number of services over the past five years for Item 38285 (insertion of an ILR) by specialty. In 2014-15, the majority of services were undertaken by cardiologists (91% of total services), with internal medicine specialists and cardio-thoracic surgeons making up most of the remaining services (6.8% and 1.3%, respectively). The number of services provided by cardiologists increased substantially by 276% over the past five years. A similar trend was seen for Item 11722 for ILR monitoring.
Figure 3.1.18 Number of services for Item 38285 by specialty of service provider, 2010-11 to 2014-15
Source: Department of Health, Medical Benefits Division, Medicare Financing & Listing Branch, MBS Analytics Section. Data received 10 March 2016.Note: These data are determined by the date the service was provided.
MBS Review – Ambulatory Electrocardiography Review Report Page 67

May 2016
Figure 3.1.19 Number of services for Item 11722 by specialty of service provider, 2010-11 to 2014-15
Source: Department of Health, Medical Benefits Division, Medicare Financing & Listing Branch, MBS Analytics Section. Data received 10 March 2016.Note: These data are determined by the date the service was provided.
MBS Review – Ambulatory Electrocardiography Review Report Page 68

May 2016
4 REVIEW OF GUIDELINES RELEVANT TO AECG
This section presents the results of the review of evidence-based CPGs relating to AECG monitoring. For completeness, consensus documents and position statements have also been included. Due to the large number of clinical guidance documents identified, only those from peak bodies have been included. Clinical guidance published prior to 2005 was not eligible for inclusion.
Two CPGs (CSANZ 2012 and British Columbia 2013) and one position paper (EHRA 2009) provide guidance relating to the general use of AECG and are not restricted to any particular indication. The recommendations from these CPGs are summarised in Section 4.1.
An additional 29 CPGs/consensus statements were identified that provide guidance on the use of AECG for specific clinical indications: ten relate to AF, three relate to syncope, one relates to palpitations, two for patients with MI, four for ventricular arrhythmias, two for heart failure, one for valvular heart disease, three for other cardiomyopathies and three for other congenital diseases (the EHRA 2009 Position Paper also provides specific recommendations for syncope and for palpitations).
A further nine citations were identified for broad population groups; six consensus statements/position papers for remote monitoring of cardiovascular implantable electronic devices (CIEDs), and three guidelines for the use of AECG in perioperative management. The recommendations from all guidelines are summarised in Sections 4.1 to 4.12.
4.1 Ambulatory electrocardiography
Two CPGs, one from Australia and one from Canada, and one European Position Paper were identified with general recommendations for the use of AECG across a number of indications (see Table 4.1.29).
Table 4.1.29 Australian and international CPGs and consensus statements relating to AECG general use
ID Title of guideline Affiliation MethodBCMA2013
Ambulatory ECG monitoring (Holter monitor and other devices)
British Columbia Medical Association (BCMA)
BCMA uses a standardised evidence review process that prioritises the use of existing systematic reviews. Recommendations are referenced, where appropriate, but not graded.
CSANZ2012
Guidelines for ambulatory electrocardiographic monitoring
The Cardiac Society of Australia and New Zealand (CSANZ)
Guidance based on the 1999 ACC/AHA guidelines (Crawford et al, 1999) and the 1993 AHA/ACC/ACP statement on clinical competence in AECG (Knoebel et al, 1993). No formal recommendations.
EHRA2009
Indications for the use of diagnostic implantable and external ECG loop recorders
European Heart Rhythm Association (EHRA); European Society of Cardiology (ESC)
Based on comprehensive review and evaluation of the available evidence. Level of evidence and strength of recommendations were graded according to pre-defined criteria (as indicated in Appendix 9).
Abbreviations: AECG, ambulatory electrocardiography; CPGs, clinical practice guidelines.
4.1.1 CSANZ 2012
The most current Australian guideline on AECG monitoring was published by the Cardiac Society of Australia and New Zealand (CSANZ) in 2012. It is based on American guidance published by the American Heart Association (AHA), the American College of Physicians
MBS Review – Ambulatory Electrocardiography Review Report Page 69

May 2016
(ACP), and the American College of Cardiology (ACC) (Crawford et al, 1999; Knoebel et al, 1993). A summary of the 1999 ACC/AHA guidelines for ambulatory electrocardiography (Crawford et al, 1999) is included in Appendix 7 of the Report. The CSANZ guideline contains no formal recommendations or clear links to the clinical evidence.
According to the CSANZ guidelines, AECG monitoring should “complement clinical examination and should not be used as an alternative to careful history taking and clinical observation”. The guidelines state that “it is inappropriate to request AECG monitoring prior to careful evaluation by a clinician experienced in the pitfalls and benefits of such monitoring”.
The following guidance is provided in relation to indications for AECG monitoring.
Major indications are: patients in whom the probable mechanism of palpitations is not clear from
clinical history; and patients with syncope or presyncope in whom bradycardia or tachycardia is
suspected. AECG may also be indicated for:
patients with pacemakers, in whom pacemaker malfunction is suspected; risk assessment post myocardial infarction (MI); or follow up of drug therapy for arrhythmias.
AECG is not the preferred tool for the assessment of patients with suspected myocardial ischaemia, which is generally better assessed by some sort of graduated stress. Nevertheless, the guidelines claim that AECG monitoring may be useful in assessing the frequency and severity of episodes of silent ischaemia.
4.1.2 British Columbia 2013
The Canadian guideline published by the British Columbia Medical Association (BCMA) in 2013 provides guidance on the use of AECG monitors (Holters and other devices) to detect arrhythmias in adults aged ≥19 years. Recommendations are provided, but they are not graded or clearly linked to the evidence.
The BCMA guideline states that choice of device depends on the type and frequency of patient’s symptom(s), the ability of the patient (e.g. to activate a device while having symptoms, to fill out a diary), and the accessibility of the device (see Table 4.1.30). The key recommendations from this guideline are:
AECG monitoring should only be ordered after a thorough clinical evaluation, risk assessment, and baseline ECG have been completed.
Use of Holter monitoring should be limited to: investigating a patient with frequent symptoms, assessing the risk of a patient in a special population (see below), or monitoring a patient’s response to therapy.
If the initial Holter monitoring is inconclusive due to low frequency of symptoms, a repeated Holter monitoring may not be appropriate and second-line investigations should be considered.
MBS Review – Ambulatory Electrocardiography Review Report Page 70

May 2016
According to the guideline, the main indications for AECG monitoring include detection and characterisation of arrhythmias to:
attempt to correlate a possible arrhythmia with patient symptoms (e.g. palpitations; syncope, near syncope or episodic dizziness; and/or other cardiac symptoms (such as shortness of breath, chest pain, episodic fatigue, or diaphoresis);
determine the risk of the arrhythmia in the individual clinical setting (e.g. patients prior to discharge from hospital after a MI);
detect, assess and manage AF; or monitor the efficacy of pharmaceutical therapy (e.g. antiarrhythmic therapy).
The guideline also recommends the use of AECG in patients with conditions that may require documentation of an arrhythmia. This includes:
structural heart disease (e.g. post MI, cardiomyopathy, valvular disease); primary electrical heart disease (e.g. sick sinus syndrome, cardiac conduction disease,
Wolff-Parkinson-White syndrome (WPW)); family history of sudden death or arrhythmia; or subjective complaints of symptoms.
The guideline recommends against the use of AECG in: patients requiring an emergency assessment without delay (e.g. patients at immediate risk
of life-threatening arrhythmia, injury or sudden death, or arrhythmia causing ischaemic chest pain, and pulmonary oedema); or
patients with symptoms such as chest pain, which may be due solely to coronary artery disease (CAD).
Table 4.1.30 2013 BCMA – appropriateness of cardiac monitoring device per patient characteristics
Device Frequency of symptoms Device characteristics Duration of test Yielda
Holtermonitoring
Daily (mainlypalpitations)
External device worn constantly, with continuous tape recording which is retrieved and interpreted once the device is returned.
Only suitable for patients with symptoms occurring within the monitoring period, or when establishing risk/response to therapy.
24 hoursb Syncope<20%Arrhythmia~35%
Event recordersc Weekly to monthly External device worn intermittently, stores data when activated by patient during an event.
Not suitable when investigating syncope since a patient cannot activate it if suddenly unconscious.
Up to a month Arrhythmia~60%
External looprecordersc
Weekly to monthly External device worn constantly, with memory loop recording capability. The data is stored before and after the patient activates the device. There is also a built-in automatic trigger algorithm that allows the device to store data for asymptomatic arrhythmias.
Suitable as a first-line investigation for patients suspected with an arrhythmic cause for syncope.
Up to a month Syncope~25-40%
MBS Review – Ambulatory Electrocardiography Review Report Page 71

May 2016
Device Frequency of symptoms Device characteristics Duration of test Yielda
Implantableloop recordersc
Less than monthly Device is subcutaneously implanted, with a loop memory recording that stores data once it is manually activated by the patient or activated automatically.
Suitable for patients with spontaneous symptoms with recurrent unexplained syncope.
Up to 3 years Syncope~70%Arrhythmia~70%
Source: BC guidelines (2013), p. 2Abbreviations: BCMA, British Columbia Medical Association.a Diagnostic yields are only approximate since they are dependent on many variables.b In some circumstances, the duration of a Holter monitoring can be extended. However, the diagnostic yield of an extended time or repeat test is low.c These tests are usually arranged in consultation with a specialist.
4.1.3 EHRA 2009
The European Heart Rhythm Association published an evidence-based position paper (EHRA, 2009) on the indications for the use of diagnostic implantable and external ECG loop recorders (ILRs and ELRs). Indications were classified as either ‘established’:
TLoC (syncope), and undocumented palpitations;
or ‘non-established’:
management of AF, and risk stratification (for post-MI and inherited cardiomyopathies).
The use of AECG to detect ‘silent’ AF in post-stroke patients was not discussed in this Position Paper, which was published prior to the completion of large RCTs on the detection of AF after stroke.12
While recommendations were provided for the established indications, the Task Force was unable to give formal recommendations for non-established indications due to a lack of trial-based evidence. The recommendations for syncope and palpitations are reported in the following sections for guideline recommendations for the respective indications, while a brief overview of the findings for the non-established indications is presented here.
According to the Position Paper, evaluation of the efficacy of rhythm control therapy is one of the main reasons for AF detection. Periodic use of wearable devices significantly under-detects AF due to the unpredictable nature of recurrences and, by comparison, long-term monitoring with ILRs increases the detection of AF. The Position Paper mentioned that based on the available evidence at the time (up to 2009), the clinical relevance of loop recorders to guide medical and device therapy in AF has yet to be demonstrated.
Discussion of post-MI risk stratification using ILR was restricted to a large observational study.13 Clinically significant arrhythmias were found in a substantial proportion of patients with depressed left ventricular ejection fraction (LVEF) after acute MI, most of which were asymptomatic. Intermittent high-degree AV block was also associated with an increased risk of cardiac mortality during the 2-year follow up. The Position Paper concluded that while ILRs are useful tools for clinical research and epidemiology of cardiac arrhythmias, the
12 The only mention of post-stroke patients was with respect to the CRYSTAL AF RCT, which was yet to be completed at the time of this position paper.
13 Cardiac Arrhythmias and Risk Stratification after Acute Myocardial Infarction (CARISMA) study.
MBS Review – Ambulatory Electrocardiography Review Report Page 72

May 2016
clinical usefulness of ILR to guide medical and device therapy in patients surviving MI has yet to be demonstrated.
A potential role for ILRs in risk stratification of patients with inherited cardiomyopathies was discussed in the EHRA (2009) Position Paper. While there is no clinical evidence for this indication, expert opinion considered there is a role for ILR in the correlation between symptoms and suspected ventricular tachyarrhythmia in selected high-risk patients affected by Brugada ECG pattern, long or short QT, hypertrophic cardiomyopathy, and arrhythmogenic right ventricular dysplasia.
4.2 Atrial fibrillation
Table 4.2.31 lists the CPGs and consensus documents that refer to AECG in the evaluation and management of patients with AF.
Table 4.2.31 CPGs and consensus statements relating to AECG in patients with AF or suspected AF
ID Title of guideline Affiliation Method
AF in any populationAHA/ACC/HRS2014
2014 AHA/ACC/HRS Guideline for the management of patients with atrial fibrillation (Executive summary)
American College of Cardiology (ACC); American Heart Association (AHA); Heart Rhythm Society (HRS); Society of Thoracic Surgeons (STS)
Based on a systematic literature review and ranking of the evidence supporting the recommendation using a pre-defined classification process (refer to Appendix 9).
NICE (CG180)2014 (update of 2006 CG36)
Atrial fibrillation: management
National Institute for Health and Care Excellence (NICE)
Based on systematic literature review. GRADE was used to assess quality of the evidence (refer to Appendix 9).
CCS2014
2014 Focused update of the Canadian Cardiovascular Society guidelines for the management of atrial fibrillation
Canadian Cardiovascular Society (CCS)
Based on consensus following evaluation of best available evidence. Quality of the evidence was assessed using GRADE (refer to Appendix 9).
ESC2010
2010 Guidelines for the management of atrial fibrillation. The Task Force for the management of atrial fibrillation of the European Society of Cardiology
European Society of Cardiology (ESC); European Heart Rhythm Association (EHRA); European Association for Cardio-Thoracic Surgery (EACTS)
Based on comprehensive review and evaluation of published evidence. Level of evidence and strength of recommendations were graded according to pre-defined criteria (refer to Appendix 9).
Post-stroke AFHSFC2015
Canadian stroke best practice recommendations: Hyperacute stroke care guidelines, update 2015
Heart and Stroke Foundation of Canada (HSFC); Canadian Stroke Best Practices Advisory Committee
Based on systematic literature review. Levels of evidence were graded according to pre-defined criteria (refer to Appendix 9).
AHA/ASA2014
Guidelines for the prevention of stroke in patients with stroke and transient ischemic attack: A guideline for healthcare professionals from the American HeartAssociation/American Stroke Association
American Heart Association (AHA); American Stroke Association (ASA)
Based on comprehensive literature. The evidence is appraised according to pre-defined criteria (refer to Appendix 9).
ESO2008
Guidelines for management of ischaemic stroke and transient ischaemic attack 2008
The European Stroke Organization (ESO)
Based on systematic literature searches to identify published clinical evidence relevant to the review questions. GRADE was used to assess quality of the evidence (refer to Appendix 9).
MBS Review – Ambulatory Electrocardiography Review Report Page 73

May 2016
ID Title of guideline Affiliation MethodAF ablationNHFA2013
National Heart Foundation of Australia consensus statement on catheter ablation as a therapy for atrial fibrillation
National Heart Foundation of Australia (NHFA)
Based on consensus and expert opinion.
HRS/EHRA/ ECAS2012
2012 HRS/EHRA/ECAS Expert consensus statement on catheter and surgical ablation of atrial fibrillation: recommendations for patient selection, procedural techniques, patient management and follow up, definitions, endpoints, and research trial design
Heart Rhythm Society (HRS); European Heart Rhythm Association (EHRA); European Cardiac Arrhythmia Society (ECAS)
Based on consensus and expert opinion. Evidence was reviewed and ranked according to pre-defined criteria (as indicated in Appendix 9).
Venice Chart 2012
Venice Chart international consensus document on atrial fibrillation ablation: 2011 update
Severala Based on international consensus and expert opinion.
Abbreviations: AECG, ambulatory electrocardiography; AF, atrial fibrillation; CPGs, clinical practice guidelines.a The ‘Venice Chart’ is a synthesis of the consensus reached by world-recognised experts in the field, originally assembled by the organisers of Venice Arrhythmias 2007, an International Workshop that takes place every two years in Italy.
4.2.1 AF in any population
Table 4.2.32 presents the key recommendations on the use of AECG in the initial evaluation and management (including post-AF therapy or rate control therapy) of patients with AF.
The 2014 AHA/ACC/ Heart Rhythm Society (HRS) guideline for the management of patients with AF has no specific recommendations that relate to AECG; however, the guideline mentions Holter monitoring or event monitoring as an additional test if diagnosis of the type of arrhythmia is in question, or as a means of evaluating rate control.
The 2014 NICE guideline on the management of AF (Clinical guideline CG180) recommends that a 24-Holter monitor should be performed in patients with daily paroxysms; however it is less useful in patients who get paroxysms at intervals of more than 24 hours. In the latter category of patients, event ECGs (including trans-telephonic monitors (‘cardiomemos’) and some implanted systems) are commonly used to detect/diagnose AF (refer to Table 4.2.32).
The 2014 focused update of the Canadian Cardiovascular Society (CCS) guidelines for the management of AF provides two recommendations relating to AECG for the detection of AF in patients with stroke. The guideline also contains a practical tip stating that “the yield of monitoring for AF detection depends on many factors including the type and duration of monitoring, patient adherence to monitoring, patient age and other characteristics. The presence of frequent atrial premature beats during a 24-hour Holter recording is a strong independent predictor of AF in this population”.
This guideline also commented that trials of prolonged monitoring for AF detection lack long-term outcomes (e.g. stroke, mortality), for which they were not powered. They note the minimum clinically significant duration of AF is uncertain and that considerable debate exists among the committee members regarding the clinical significance and therapeutic implications of very brief, subclinical AF. They also state that the optimal device and monitoring duration has not been established.
MBS Review – Ambulatory Electrocardiography Review Report Page 74
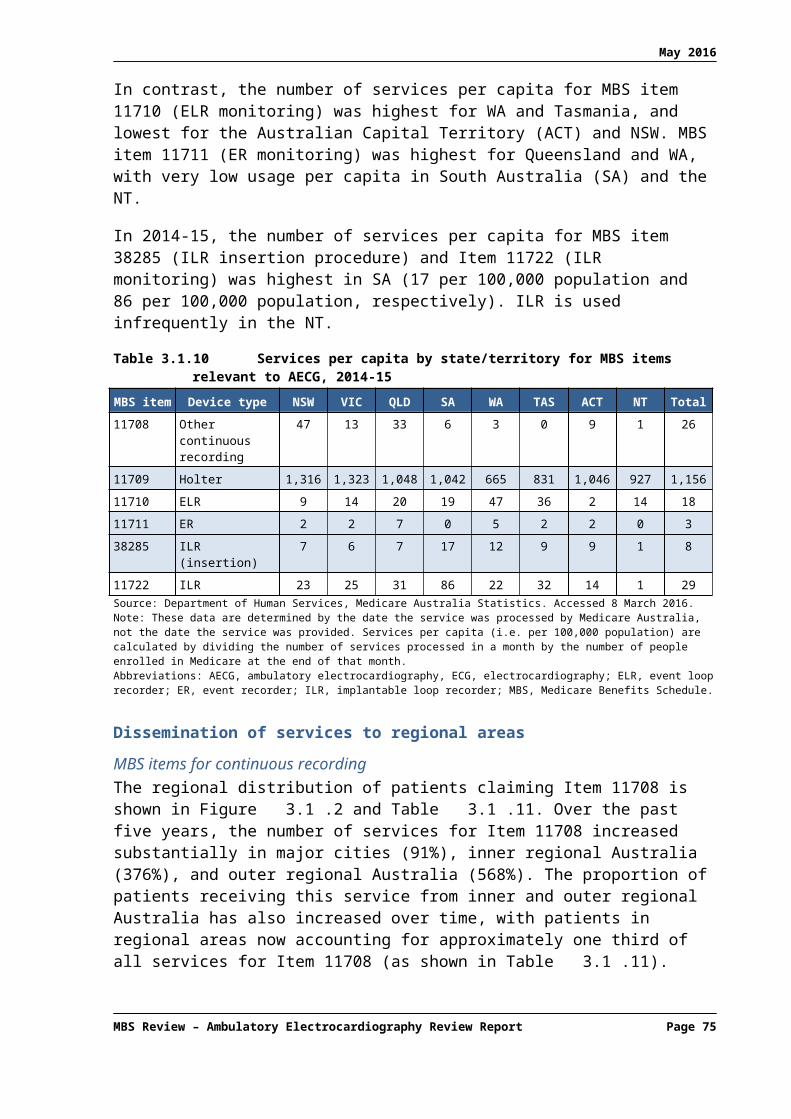
May 2016
The 2010 ESC guideline on the management of AF (ESC, 2010) provides recommendations on the use of AECG monitoring in the evaluation and management of AF (see Table 4.2.32). According to the guideline, in patients with suspected (but undiagnosed) AF, a 12-lead ECG is recommended as the first step to establish the diagnosis. Clinical symptoms such as palpitations or dyspnoea should trigger ECG monitoring to demonstrate AF, or to correlate symptoms with the underlying rhythm. Thus, the guideline states that “monitoring using Holter recordings or external event recorders should be considered when arrhythmia or therapy-related symptoms are suspected”. More intense and prolonged monitoring is justified in highly symptomatic patients, patients with recurrent syncope, and patients with a potential indication for anticoagulation (especially after cryptogenic stroke). In selected patients, implantation of a leadless AF monitoring device may be considered to establish the diagnosis.
Table 4.2.32 also includes ESC’s recommendations on monitoring in previously diagnosed AF. When arrhythmia- or therapy-related symptoms are suspected, monitoring using Holter recordings or external event recorders should be considered. In patients with rhythm or rate control treatment and without further arrhythmia- or therapy-related symptoms, a 12-lead ECG should be recorded at regular intervals. Prior to an ablation procedure all patients should undergo a 12-lead ECG and/or Holter recording to demonstrate the nature of the arrhythmia.
Table 4.2.32 Recommendations for the use of AECG in the evaluation of patients with AF
Guideline Recommendations Class of recommendation
LOE
NICE 2014 In patients with suspected paroxysmal AF undetected by standard ECG recording: a 24-hour ambulatory ECG monitor should be used in those
with suspected asymptomatic episodes or symptomatic episodes less than 24 hours apart
an event recorder ECG should be used in those with symptomatic episodes more than 24 hours apart.
- -
CCS 2014 For patients being investigated for an acute embolic ischemic stroke or TIA, we recommend at least 24 hours of ECG monitoring to identify paroxysmal AF in potential candidates for OAC therapy.
Strong Recommendation
Moderate quality
For selected older patients with an acute, nonlacunar, embolic stroke of undetermined source for which AF is suspected but unproven, additional ambulatory monitoring (beyond 24 hours) for AF detection is suggested, where available, if it is likely that oral anticoagulant therapy would be prescribed if prolonged AF is detected (there are currently insufficient data to indicate what the minimum AF duration should be for oral anticoagulant to be instituted, and expert opinion varies widely).
Conditional Recommendation
Moderate quality
MBS Review – Ambulatory Electrocardiography Review Report Page 75

May 2016
Guideline Recommendations Class of recommendation
LOE
ESC 2010 In patients with suspected symptomatic AF, additional ECG monitoring should be considered in order to document the arrhythmia.
IIa B
Additional ECG monitoring should be considered for detection of ‘silent’ AF in patients who may have sustained an AF-related complication.
IIa B
In patients with AF treated with rate control, Holter ECG monitoring should be considered for assessment of rate control or bradycardia.
IIa C
In patients treated with rhythm control, repeated ECG monitoring may be considered to assess the efficacy of treatment.
IIb B
It is reasonable to adopt a stricter rate control strategy when symptoms persist or tachycardiomyopathy occurs, despite lenient rate control: resting heartrate <80 bpm and heart rate during moderate exercise <110 bpm. After achieving the strict heart rate target, a 24 h Holter monitor is recommended to assess safety.
IIb B
Source: NICE (2014), p10; CCS (2014), p. 1119; ESC (2010), p. 2380. Refer to Appendix 9 for definitions of the Class of recommendation and Level of evidence.Abbreviations: AF, atrial fibrillation; bpm, beats per minute; CCS, Canadian Cardiovascular Society; ECG, electrocardiogram; ESC, European Society of Cardiology; LOE, level of evidence; NICE, National Institute for Health and Care Excellence.; OAC, oral anticoagulation therapy; TIA, transient ischaemic attack.
4.2.2 Post-stroke AF
The 2015 annual update of the Canadian hyperacute stroke care guidelines (HSFC, 2015) includes the following recommendation; for patients with transient ischaemic attack (TIA) who are not being considered for acute thrombolytic or endovascular therapy, but a cardioembolic mechanism is suspected and initial ECG (24 or 48-hour monitoring) does not show AF, the use of prolonged monitoring, up to 30 days, is recommended (see Table 4.2.33). No reference to specific AECG devices is made.
The 2014 AHA/ASA guideline for the prevention of stroke in patients with stroke and TIA recommends prolonged rhythm monitoring for approximately 30 days within six months of the index event for the detection of AF in patients with IS/TIA and no other apparent cause (Table 4.2.33). No reference to specific AECG devices is made.
The European Stroke Organization (ESO) published guidelines for the management of ischaemic stroke and TIA in 2008, which included recommendations for Holter monitoring (Table 4.2.33). The guideline acknowledges that based on the available evidence at the time, it was unclear whether continuous ECG recording at the bedside is equivalent to Holter monitoring for the detection of AF in acute stroke patients. However, it considered Holter monitoring superior to routine ECG for the detection of AF in patients anticipated to have thromboembolic stroke with sinus rhythm, but not necessarily for detection of new AF in a stroke unit setting. They also stated that extended duration of monitoring and prolonged event loop recording14 may improve detection rates.
14 Event loop recording may technically include ILR as they are also looping recorders of events. However, specific devices were not mentioned in these guidelines.
MBS Review – Ambulatory Electrocardiography Review Report Page 76

May 2016
Table 4.2.33 2015 HSFC, 2014 AHA/ASA, and 2008 ESO recommendations for the use of AECG in the evaluation of patients with TIA or stroke
Guideline Recommendations Class of recommendation
LOE
HSFC2015
For patients with TIA who are not being considered for acute thrombolytic or endovascular therapy: in cases where the ECG or initial cardiac rhythm (e.g. 24- or 48-hour ECG) does not show atrial fibrillation but a cardioembolic mechanism is suspected, prolonged ECG monitoring, up to 30 days duration, is recommended in selected patients for detection of paroxysmal AF.
- B
AHA/ASA2014
For patients who have experienced an acute ischaemic stroke or TIA with no other apparent cause, prolonged rhythm monitoring (≈30 days) for AF is reasonable within 6 months of the index event.
IIa C
ESO2008
It is recommended that for stroke and TIA patients seen after the acute phase, 24-hour Holter ECG monitoring should be performed when arrhythmias are suspected and no other causes of stroke are found.
I A
Source: HSFC (2015), p. 928-929; AHA/ASA (2014), p. 2190; ESO (2008), pp. 26-27. Refer to Appendix 9 for definitions of the Class of recommendation and Level of evidence.Abbreviations: AECG, ambulatory electrocardiography; AF, atrial fibrillation; AHA/ASA, American Heart Association/American Stroke Association; ECG, electrocardiogram; ESO, European Stroke Organisation; HSFC, Heart and Stroke Foundation of Canada; LOE, Level of evidence; TIA, transient ischaemic attack.
4.2.3 Post-ablation AF
The position statement issued by the National Heart Foundation of Australia (NHFA) on catheter ablation as a therapy for AF (NHFA, 2013) emphasises that the follow up to an AF ablation procedure should include clinical evaluation every three to six months with a 24-hour Holter monitor, and further evaluation using Holter, event or ECG monitoring if symptoms arise.
The 2012 HRS/EHRA/ECAS expert consensus statement on catheter and surgical ablation of AF states that either continuous or non-continuous ECG monitoring tools may be used for arrhythmia monitoring in patients who are to undergo catheter ablation procedures for AF, as well as during post-procedure follow up. The choice of AECG monitoring method depends on individual need and consequence of arrhythmia detection. More intensive monitoring is associated with a greater likelihood of detecting both symptomatic and asymptomatic AF. Identification of patients with AF and assessment of AF burden with periodic use of wearable devices has been shown to depend on a patient’s actual AF burden and improves with an increasing frequency or duration of monitoring. Conversely, the more complex and longer the method of wearable-device monitoring that is used, the lower the patient compliance.
According to the consensus statement, ECGs should be obtained at all follow-up visits post-AF ablation procedure. Monitoring to assess the efficacy of catheter ablation is typically delayed for at least three months following the ablation because early recurrences of AF are common during this period. More intense monitoring should be mainly driven by the clinical impact of AF detection (e.g. strict monitoring is necessary in patients with thromboembolic risk factors for determining the adequate anticoagulation approach). Frequent ECG recording using a manually activated event recorder and counselling patients to take their pulse to monitor for irregularity may serve as initial screening tools for asymptomatic AF episodes. A one- to seven-day Holter monitor is considered to be an effective way to identify frequent asymptomatic recurrences of AF. A less frequent AF may be identified using a four-week auto-trigger ELR, MCT, or ILR. However, the consensus statement does not indicate how the
MBS Review – Ambulatory Electrocardiography Review Report Page 77

May 2016
available monitoring options can be used in the management of patients post ablation, specifically whether or not to discontinue anticoagulation therapy.
The Venice Chart International Consensus Document on AF ablation (2011 update) (Raviele et al, 2012) strongly recommends monitoring with one of the different AECG devices in order to assess the correspondence between symptoms and arrhythmia and to discover asymptomatic episodes of AF. The document states that, “The accuracy of estimating AF burden depends chiefly upon the duration of ECG recording. Many laboratories use a clinical definition of successful ablation to mean the absence of symptomatic tachycardia, as well as the absence of documented AF during periodic follow-up visits, as well as on periodic 24–48-hour Holter recordings, typically at 1, 3, and 6 months after the ablation. An ER may be used to evaluate symptoms not elucidated by the above tests. However, extending the duration of Holter tracings to 7 days has been shown to enhance the sensitivity of detecting recurrent AF”. The consensus document also suggests that periodic or daily recurrent arrhythmias can be monitored using trans-telephonic ECG recordings supplemented by ECG transmission during symptomatic episodes. The Consensus Document notes that ILRs may provide the most accurate measurement of AF burden possible but only in a limited patient population.
4.3 Syncope
Table 4.3.34 lists the CPGs and consensus documents that refer to AECG in the evaluation and management of patients with TLoC, including cardiogenic syncope.
Table 4.3.34 CPGs and consensus statements relating to AECG in patients with TLoC/syncope
ID Title of guideline Affiliation MethodNICE (CG109)2010Evidence Update 2012
Transient loss of consciousness (‘blackouts’) management in adults and young people.NICE Clinical Guidelines, No. 109
National Institute for Health and Care Excellence (NICE)
Based on systematic literature searches to identify published clinical evidence relevant to the review questions. GRADE was used to assess the quality of evidence (refer to Appendix 9).
ESC2009
Guidelines for the diagnosis and management of syncope (version 2009)
European Society of Cardiology (ESC); European Heart Rhythm Association (EHRA); Heart Failure Association (HFA); and Heart Rhythm Society (HRS)
Based on comprehensive review and evaluation of published evidence. Levels of evidence and strength of recommendations were graded according to pre-defined criteria (refer to Appendix 9).
EHRA2009
Indications for the use of diagnostic implantable and external ECG loop recorders
European Heart Rhythm Association (EHRA); European Society of Cardiology (ESC)
Based on comprehensive review and evaluation of the available evidence. Level of evidence and strength of recommendation were graded according to pre-defined criteria (as indicated in Appendix 9).
AHA/ACCF scientific statement2006
AHA/ACCF scientific statement on the evaluation of syncope
American Heart Association (AHA); American College of Cardiology Foundation (ACCF); Heart Rhythm Society (HRS); endorsed by the American Autonomic Society (AAS)
Based on consensus and expert opinion.
Abbreviations: AECG, ambulatory electrocardiography; CPGs, clinical practice guidelines; TLoC, transient loss of consciousness.
In 2010, NICE produced guidelines on the assessment, diagnosis and management of adults and young people (aged 16 and older) with TLoC (NICE CG109). The guideline recommends that people with a suspected cardiac arrhythmic cause of syncope are offered AECG as a first-line specialist cardiovascular investigation. Recording heart rate and rhythm behaviour at the time of an episode of TLoC allows confident diagnosis. Competent expert interpretation is
MBS Review – Ambulatory Electrocardiography Review Report Page 78

May 2016
also needed to assess the relevance of abnormal heart rate and rhythm behaviour recorded at a time when the person has no symptoms.
According to the guideline, the type of AECG monitoring offered should be chosen on the basis of the person’s history and the frequency of TLoC. For people who have TLoC at least several times a week, Holter monitoring (up to 48 hours if necessary) should be considered. An ELR should be used if no further TLoC occurs during the monitoring period, as it provides extended monitoring with the facility for the patient to indicate when a symptomatic event has occurred. For intermittent TLoC that occurs every one to two weeks, an ELR is appropriate. If the person experiences further TLoC outside the period of ELR monitoring, an implantable event recorder is deemed to be more appropriate. For all people with unexplained syncope (including after negative carotid sinus massage test in those for whom this is appropriate), AECG should be considered. The guideline did not provide recommendations relating to MCT.
The NICE guideline does not recommend TT testing as a first-line investigation for a person with a suspected cardiac arrhythmic cause of syncope, a diagnosis of vasovagal syncope on initial assessment, or with unexplained TLoC. However, TT testing should be considered in patients with suspected vasovagal syncope who have recurrent episodes that adversely affect their quality of life or represent a high risk for injury, to assess whether the syncope is accompanied by a severe cardioinhibitory response (usually asystole).
A 2012 Evidence Update of this guideline presented a summary of new evidence relating to implantable event recorders; however the new data remains consistent with the recommendations in the 2010 guideline. The Evidence Update acknowledges emerging evidence of effective use of implantable event recorders with wireless technology, allowing remote ECG interpretation.
Table 4.3.35 2010 NICE recommendations for the use of AECG in patients with syncopeRecommendationsAECGFor people with a suspected cardiac arrhythmic cause of syncope, offer an ambulatory ECG and do not offer a tilt test as a first-line investigation. The type of ambulatory ECG offered should be chosen on the basis of the person’s history (and, in particular, frequency) of TLoC. For people who have:
TLoC at least several times a week, offer Holter monitoring (up to 48 hours if necessary). If no further TLoC occurs during the monitoring period, offer an external event recorder that provides continuous recording with the facility for the patient to indicate when a symptomatic event has occurred.
TLoC every 1–2 weeks, offer an external event recorder. If the person experiences further TLoC outside the period of external event recording, offer an implantable event recorder.
TLoC infrequently (less than once every 2 weeks), offer an implantable event recorder. A Holter monitor should not usually be offered unless there is evidence of a conduction abnormality on the 12-lead ECG.
For all people with unexplained syncope (including after negative carotid sinus massage test in those for whom this is appropriate), offer ambulatory ECG (see recommendation above). Do not offer a tilt test before the ambulatory ECG.
Implantable event recorderWhen offering a person an implantable event recorder, provide one that has both patient-activated and automatic detection modes. Instruct the person and their family and/or carer how to operate the device. Advise the person that they should have prompt follow up (data interrogation of the device) after they have any further TLoC.Source: NICE (2010), pp. 21-22Abbreviations: AECG, ambulatory electrocardiogram; ECG, electrocardiogram; NICE, National Institute for Health and Care Excellence; TLoC, transient loss of consciousness.
MBS Review – Ambulatory Electrocardiography Review Report Page 79

May 2016
The 2009 ESC guideline provides evidence-based recommendations on the diagnosis and management of syncope15 (ESC, 2009). The 2009 EHRA Position Paper on indications for the use of diagnostic implantable and external ECG loop recorders (EHRA, 2009) includes key points and recommendations for the diagnosis of syncope (this Position Paper also includes recommendations for undocumented palpitations (Section 4.4), and a review of non-established indications (Section 4.1.3)).
Similar recommendations were provided by ESC 2009 and EHRA 2009 on the use of Holter monitoring, ILRs and ELRs in the syncope population. Both suggest Holter monitoring as the initial strategy in patients with clinical or ECG features of arrhythmic syncope and very frequent syncopes or presyncopes (see Table 4.3.36). Recommendations were also provided on the appropriate use of ILRs and ELRs in patients with syncope.
According to the EHRA Position Paper, ILR was initially used as last resort in the evaluation of syncope after all investigations were negative. However, several studies have shown a poor correlation between the responses of TT testing, adenosine triphosphate test and electrophysiological study, and the ECG observation at the time of spontaneous syncope (the reference standard), which raises concerns about their real utility in the diagnostic workup. Given the limited diagnostic value of short-term ECG monitoring, several investigators proposed an early usage of the ILR soon in an initial phase of the diagnostic workup. The Position Paper cites several studies that have shown that early ILR implantation can be safely performed in the initial phase of the diagnostic evaluation, provided that patients at risk of life-threatening events are carefully excluded.
Table 4.3.36 2009 ESC and EHRA recommendations for AECG in patients with syncopeGuideline Recommendations Class of
recommendation
LOE
Indications for immediate in-hospital and Holter monitoringESC 2009 ECG monitoring is indicated in patients who have clinical or ECG features
suggesting arrhythmic syncope (see Appendix 8). The duration (and technology) of monitoring should be selected according to the risk and the predicted recurrence rate of syncope:
I B
Immediate in-hospital monitoring (in bed or telemetric) is indicated in high-risk patients (see Appendix 8)
I C
Holter monitoring is indicated in patients who have very frequent syncope or presyncope (≥1 per week)
I B
Indications for ILRs and ELRs in patients with syncopeESC 2009EHRA 2009
ILR is indicated in: An early phase of evaluation in patients with recurrent syncope of uncertain
origin who have absence of high-risk criteria that require immediate hospitalisation or intensive evaluation (see Appendix 8), and a high likelihood of recurrence within battery longevity of the device
I ESC: BEHRA: A
High-risk patients in whom a comprehensive evaluation did not demonstrate a cause of syncope or lead to a specific treatment
I B
ILR may be indicated to assess the contribution of bradycardia before embarking on cardiac pacing in patients with suspected or certain reflex (neutrally mediated) syncope presenting with frequent or traumatic syncopal episodes.
IIa B
EHRA 2009 ILR may be indicated in patients with TLoC of uncertain syncopal origina in order to definitely exclude an arrhythmic mechanism.
IIb C
ESC 2009 ELRs should be considered in patients who have an inter-symptom interval ≤4 weeks.
IIa B
15 The 2009 ESC guideline defined syncope to be a “TLoC due to transient global cerebral hypoperfusion characterised by rapid onset, short duration, and spontaneous complete recovery”. Therefore, syncope is encompassed within a larger framework of TLoC.
MBS Review – Ambulatory Electrocardiography Review Report Page 80

May 2016
Guideline Recommendations Class of recommendation
LOE
EHRA 2009 ELRs may be indicated in patients with recurrent (pre)syncopes who have: inter-symptom interval of 4 weeks, and suspicion of arrhythmic origin and absence of high-risk criteria that require immediate hospitalisation or intensive
evaluation.
IIa B
Diagnostic criteriaESC 2009EHRA 2009
ECG monitoring (ILR and ELR findings) is diagnostic when a correlation between syncope and an arrhythmia (brady- or tachyarrhythmia) is detected.
I B
In the absence of such correlation (i.e. between symptoms and ECG monitoring), ECG monitoring is diagnostic when periods of Mobitz II or III degree AV block or a ventricular pause >3 sec (with the possible exception of young trained persons, during sleep, medicated patients, or rate-controlled atria; fibrillation), or rapid prolonged (i.e. ≥160 bpm for >32 bpm) paroxysmal atrial or VT are detected. The absence of arrhythmia during syncope excludes arrhythmic syncope.
I C
EHRA 2009 ILR and ELR findings exclude an arrhythmic cause when there is no correlation between syncope and rhythm variation.
I B
ECG documentation (ILR and ELR findings) of presyncope without any relevant arrhythmia is not an accurate surrogate for syncope.
III C
ECG documentation of asymptomatic arrhythmias (other than those listed above) are not an accurate surrogate for syncope.
III C
ECG documentation of sinus bradycardia (in the absence of syncope) is not an accurate surrogate for syncope.
III C
Source: ESC (2009), p. 2650; EHRA (2009), p. 680. Refer to Appendix 9 for definitions of the Class of recommendation and Level of evidence.Abbreviations: AV, atrioventricular; bpm, beat per minute; ECG, electrocardiogram; EHRA, European Heart Rhythm Association; ELR, external loop recorder; ESC, European Society of Cardiology; ILR, implantable loop recorder; LOE, level of evidence; SVT, supraventricular tachycardia; VT, ventricular tachycardia. a Indications of ILR other than syncope, ESC guideline (2009) made no recommendations for this indication.
The 2009 ESC guideline also provides recommendations on the use of TT testing in the initial evaluation of syncope. The guideline states that the main indication for TT testing has been to confirm the diagnosis of reflex (neutral) syncope in patients in whom this diagnosis was suspected but not confirmed by initial evaluation. TT testing is usually not needed in patients whose reflex syncope is already diagnosed by clinical history, and in patients with single or rare syncope, unless special circumstances exist (e.g. injury, occupational implications).
In 2006, the AHA/ACCF published a scientific statement on the evaluation of syncope. The Statement reviewed evidence for diagnostic approaches to syncope, however no specific recommendations were provided. The Statement considers AECG appropriate in patients with syncope who have had a ‘normal’ evaluation (with no underlying heart disease) where the diagnosis remains uncertain. The type and duration of AECG monitoring is dictated by the frequency of symptoms. The statement suggests that a 24-48 hour Holter monitor is appropriate for episodes that occur at least every day, and monitoring with an ELR (for 30 to 60 days) is ideal for episodes that occur at least once a month. An ILR allows the correlation of symptoms with the cardiac rhythm in patients in whom the symptoms are infrequent (AHA/ACCF, 2006).
In relation to TT testing, concerns are raised in the Statement about the reliability and diagnostic utility of the test. The Statement claims that it may be more important to rule out other causes of syncope than it is to perform a TT test, since the risk of recurrent syncope in a patient with a normal cardiac evaluation and syncope is similar regardless of whether the TT test is positive or negative.
MBS Review – Ambulatory Electrocardiography Review Report Page 81
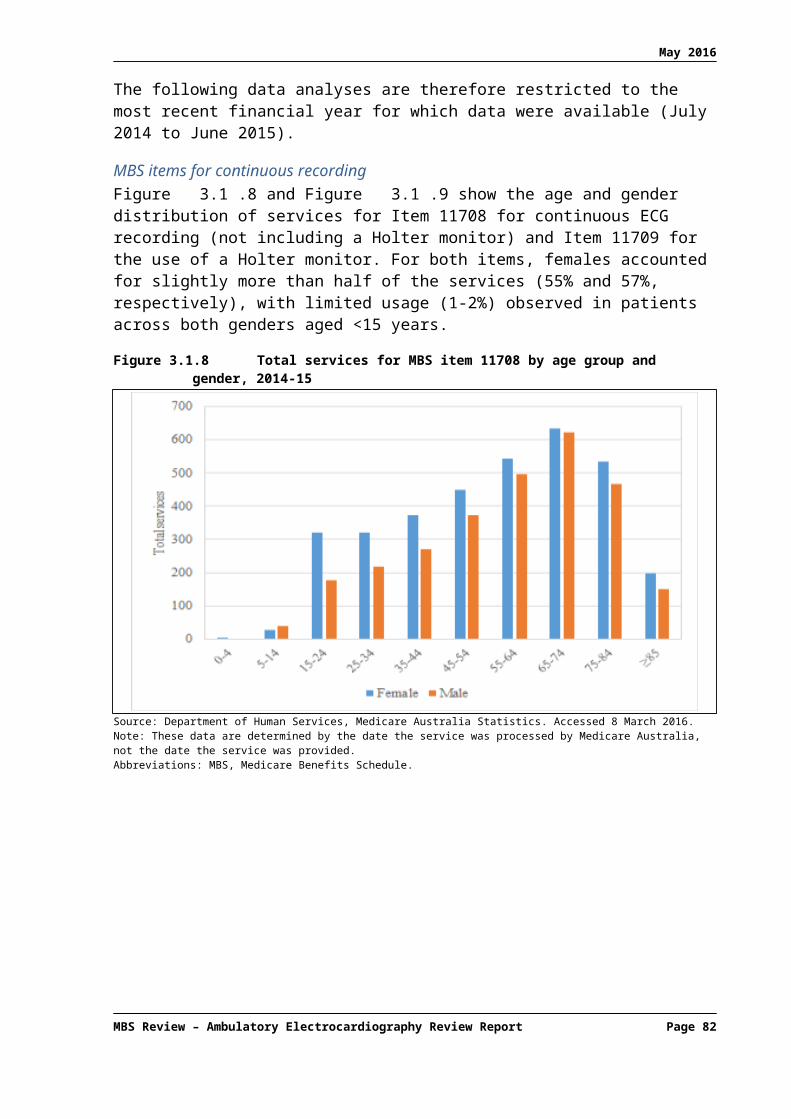
May 2016
4.4 Palpitations
Table 4.4.37 lists the consensus and position statements that refer to the use of AECG in patients with palpitations.
Table 4.4.37 Consensus and position statements relating to AECG in patients with palpitations
ID Title of guideline Affiliation MethodEHRA position paper2011
Management of patients with palpitations: a position paper from the European Heart Rhythm Association
European Heart Rhythm Association (EHRA); European Society of Cardiology (ESC)
Based on expert advice.
EHRA2009
Indications for the use of diagnostic implantable and external ECG loop recorders
European Heart Rhythm Association (EHRA); European Society of Cardiology (ESC)
Based on comprehensive review and evaluation of the available evidence. Level of evidence and strength of recommendations were graded according to pre-defined criteria (as indicated in Appendix 9).
Abbreviations: AECG, ambulatory electrocardiography.
The 2009 EHRA Position Paper on indications for the use of diagnostic implantable and external ECG loop recorders includes key points and recommendations for the use of ELRs and ILRs in the diagnosis of undocumented palpitations (see Table 4.4.38). This Position Paper also includes recommendations for syncope (Section 4.3) and a review of non-established indications (Section 4.1.3).
According to the Position Paper, ELRs are much more useful for palpitations than for syncope evaluation. Patients with weekly recurrence of palpitations represent the ideal candidates. ERs that are positioned or activated by the patient immediately after symptom onset are useful only when symptoms last long enough to allow the patient to activate the recorder. The Position Paper claims that in clinical studies in patients with at least weekly recurrence of palpitations, ELRs as well as ERs show superior diagnostic value to that of conventional Holter monitoring. Due to their invasive nature and cost, ILRs are less frequently indicated for palpitations but may be implanted when all other test results are inconclusive in patients with infrequent (less than monthly) palpitations associated with haemodynamic impairment.
Table 4.4.38 2009 EHRA recommendations for AECG in patients with undocumented palpitations
Guideline Recommendations Class of recommendation
LOE
EHRA 2009 ELRs are indicated in patients with recurrent palpitations, undocumented by conventional ECG techniques, who have: inter-symptom interval <4 weeks and absence of high-risk criteria (see Appendix 8), which require immediate hospitalisation or intensive evaluation.
I B
ILRs may be indicated in selected cases with severe infrequent symptoms when ELRs and other ECG monitoring systems fail to document the underlying cause.
IIa B
ILR and ELR findings are diagnostic when a correlation between palpitation and an arrhythmia is detected.
I B
ILR and ELR findings exclude an arrhythmic cause when there is no correlation between palpitation and rhythm variation.
I B
Source: EHRA (2009), p. 682. Refer to Appendix 9 for definitions of the Class of recommendation and Level of evidence.Abbreviations: ECG, electrocardiogram; EHRA, European Heart Rhythm Association; ELR, external loop recorder; ILR, implantable loop recorder; LOE, level of evidence.
In 2011, EHRA published a Position Paper focusing exclusively on the management of patients with palpitations. The indications for each type of AECG monitoring device are
MBS Review – Ambulatory Electrocardiography Review Report Page 82

May 2016
presented in Table 4.4.39. ILRs are to be used in selected patients with severe and infrequent palpitations (inter-symptom interval > 4 weeks) and when all other investigations, including external AECG monitoring, prove to be negative.
Table 4.4.39 2011 EHRA indications for AECG in patients with palpitations
Device Advantages Limitations IndicationsHolter monitoring
Low cost; possibility to record asymptomatic arrhythmias
Monitoring limited to 24 h to 7 days; size may prevent activities that may trigger the arrhythmias; patients often fail to complete adequately the clinical diary upon which the correlation between symptoms and the arrhythmias recorded is based
From daily to weekly palpitations; patients who are unable to use other ambulatory ECG monitoring devices
Event recorders Low cost; easy to use Monitoring cannot be carried out for more than 3–4 weeks; very brief arrhythmias are not recorded; arrhythmic triggers are not revealed; poor ECG records
From weekly to monthly, fairly long-lasting palpitations not accompanied by haemodynamic impairment; compliant patients
External looprecorders/MCOT
Retrospective and prospective ECG records; possibility to record asymptomatic arrhythmias automatically
Monitoring cannot be carried out for more than 3–4 weeks; continual maintenance is required; devices are uncomfortable; quite poor ECG records
From weekly to monthly, short-lasting palpitations associated to haemodynamic impairment; very compliant patients
Implantable looprecorders
Retrospective and prospective ECG records; quite good ECG records; monitoring capability up to 36 months; possibility to record asymptomatic arrhythmias automatically
Invasiveness; risk of local complications at the implantation site; higher cost; limited memory and specificity
From monthly to yearly palpitations associated with haemodynamic compromise; when all the other examinations prove inconclusive; non-compliant patients without haemodynamic compromise when a clinically significant arrhythmic cause is likely or must be ruled out
Source: EHRA (2011), Table 9, p. 930Abbreviations: ECG, electrocardiogram; EHRA, European Heart Rhythm Association; MCOT, mobile cardiac outpatient telemetry.
4.5 Post-MI arrhythmias
Table 4.5.40 shows the two identified guidelines that mention AECG for patients who have experienced MI.16 The New Zealand branch of the CSANZ produced guidelines on the management of patients with ST-elevation myocardial infarction (STEMI). The guideline recommends against the use of routine Holter monitoring in this population (Class III; LOE: C). No other AECG is discussed in this guideline.
The 2012 ESC guidelines for the management of acute MI in patients presenting with ST-segment elevation provided no specific recommendations in relation to AECG. However, the guideline states that “ECG monitoring for arrhythmias and ST-segment deviations should be continued for at least 24 hours after symptom onset in all STEMI patients. When a patient leaves the coronary care unit, monitoring may be continued by telemetry”.
Table 4.5.40 CPGs relating to AECG in patients who have experienced MI
ID Title of guideline Affiliation MethodNZMA2013
ST-elevation myocardial infarction: New Zealand management guidelines, 2013
New Zealand Medical Association (NZMA)
Based on evidence from clinical trials. The evidence is graded and the recommendations are patient focused.
ESC ESC guidelines for the European Society of Based on comprehensive review and
16 As only two guidelines for MI were identified, an informal search was performed for other guidelines (STEMI and non-STEMI) and reviewed for recommendations regarding AECG; none discussed AECG.
MBS Review – Ambulatory Electrocardiography Review Report Page 83

May 2016
ID Title of guideline Affiliation Method2012 management of acute
myocardial infarction in patients presenting with ST-segment elevation
Cardiology (ESC) evaluation of published evidence. Levels of evidence and strength of recommendations are graded according to pre-defined criteria (refer to Appendix 9).
Abbreviations: AECG, ambulatory electrocardiography; CPGs, clinical practice guidelines; MI, myocardial infarction.
4.6 Ventricular arrhythmias
Table 4.6.41 lists the four included CPGs and consensus documents that refer to AECG in the evaluation and management of patients with arrhythmias.
Table 4.6.41 CPGs and consensus statements relating to AECG in patients with arrhythmias
ID Title of guideline Affiliation MethodESC2015 (ESC update of the 2006 ACC/AHA/ESC guideline)
2015 ESC guidelines for the management of patients with ventricular arrhythmias and the prevention of sudden cardiac death
European Society of Cardiology (ESC); endorsed by the Association for European Paediatric and Congenital Cardiology (AEPC)
Based on comprehensive review and evaluation of published evidence. Levels of evidence and the strength of recommendations were graded according to pre-defined criteria (refer to Appendix 9).
ACC/AHA/ESC2006
2006 ACC/AHA/ESC guidelines for management of patients with ventricular arrhythmias and the prevention of sudden cardiac death
American College of Cardiology (ACC); American Heart Association (AHA); European Society of Cardiology (ESC)
As above
PACES/HRS2013
PACES/HRS expert consensus statement on the evaluation and management of ventricular arrhythmias in the child with a structurally normal heart
Paediatric and Congenital Electrophysiology Society (PACES); Heart Rhythm Society (HRS)
Based on consensus and expert opinion. Level of evidence and strength of recommendations were graded according to pre-defined criteria (refer to Appendix 9).
CSANZ2011
Guidelines for the diagnosis and management of catecholaminergic polymorphic ventricular tachycardia
Cardiac Society of Australia and New Zealand (CSANZ)
Not clearly stated
Abbreviations: AECG, ambulatory electrocardiography; CPGs, clinical practice guidelines; ECG electrocardiogram.
4.6.1 Ventricular arrhythmia
The 2015 ESC guideline for the management of ventricular arrhythmias and the prevention of SCD provides recommendations on the use of AECG in the evaluation and management of patients with ventricular arrhythmias (see Table 4.6.42). This is the European update to the 2006 ACC/AHA/ESC guidelines for management of patients with ventricular arrhythmias and the prevention of SCD.
According to the 2015 guideline, ambulatory recording techniques can aid in relating symptoms to the presence of the arrhythmia. A 24- to 48-hour continuous Holter recording is appropriate whenever the arrhythmia is known or suspected to occur at least once a day. For sporadic episodes producing palpitations, dizziness, or syncope, conventional ERs are more useful because they can record over extended periods of time. ILRs that continuously monitor the heart rhythm and record events over a timeframe measured in years may be very useful in diagnosing serious tachyarrhythmias and bradyarrhythmias in patients with life-threatening symptoms such as syncope. The guideline also states that silent myocardial ischaemic episodes may also be detected by AECG. Table 4.6.42 presents the 2015 ESC recommendations for the use of AECG in the evaluation of patients with ventricular arrhythmia.
MBS Review – Ambulatory Electrocardiography Review Report Page 84

May 2016
Table 4.6.42 2015 ESC and 2006 ACC/AHA/ESC recommendations for AECG in patients with ventricular arrhythmia
Guideline Recommendations Class of recommendation
LOE
ESC 2015 Ambulatory ECG is recommended to detect and diagnose arrhythmias. Twelve-lead ambulatory ECG is recommended to evaluate QT-interval changes or ST changes.
I A
Cardiac event recorders are recommended when symptoms are sporadic to establish whether they are caused by transient arrhythmias.
I B
Implantable loop recorders are recommended when symptoms, e.g. syncope, are sporadic and suspected to be related to arrhythmias and when a symptom–rhythm correlation cannot be established by conventional diagnostic techniques.
I B
ACC/AHA/ESC 2006
Ambulatory ECG is indicated when there is a need to clarify the diagnosis by detecting arrhythmias, QT-interval changes, T-wave alternans, or ST changes, to evaluate risk, or to judge therapy.
I A
Event monitors are indicated when symptoms are sporadic to establish whether or not they are caused by transient arrhythmias.
I B
Implantable recorders are useful in patients with sporadic symptoms suspected to be related to arrhythmias such as syncope when a symptom-rhythm correlation cannot be established by conventional diagnostic techniques.
I B
Source: ESC (2015), p. 11; ACC/AHA/ESC (2006), p. 1073. Refer to Appendix 9 for definitions of the Class of recommendation and Level of evidence.Abbreviations: ACC, American College of Cardiology; AECG, ambulatory electrocardiography; AHA, American Heart Association; ECG, electrocardiogram; ESC, European Society of Cardiology; LOE, level of evidence.
4.6.2 Idiopathic ventricular tachycardia (in children)
The 2013 PACES/HRS expert consensus statement considers the use of AECG in the evaluation of ventricular arrhythmia in children with a structurally normal heart. According to the consensus statement, Holter monitoring is extensively used in the evaluation of paediatric patients with idiopathic ventricular tachycardia (IVT) and a structurally normal heart. They state that while home telemetry monitoring17 is being increasingly used for arrhythmia surveillance, there is little evidence to support its use in the paediatric population. They consider monitoring with event recorders (medium-term and long-term AECG) to be useful in evaluating sporadic episodes and correlating them with symptoms, and while ILR has been shown to be efficacious in children, especially when a serious arrhythmia is suspected, and that, in practice, ambulatory monitoring with wearable devices can, in most cases, provide data similar to those offered by an ILR.
Table 4.6.43 2013 PACES/HRS recommendations for AECG in the evaluation of children with ventricular arrhythmia and a structurally normal heart
Guideline Recommendations Class of recommendation
LOE
PACES/HRS 2013
Infants and children suspected of having ventricular arrhythmias should have a 12-lead ECG, echocardiography, 24-hour ambulatory ECG monitoring, and a detailed personal and family history.
I C
For infants and children with previously documented frequent ventricular ectopy, and when continued ectopy is confirmed or strongly suspected, follow-up 24-hour ambulatory ECG monitoring is recommended.
I C
Source: PACES/HRS (2013), p. e69. Refer to Appendix 9 for definitions of the Class of recommendation and Level of evidenceAbbreviations: AECG, ambulatory electrocardiography; ECG, electrocardiogram; HRS, Heart Rhythm Society; LOE, level of evidence; PACES, Paediatric and Congenital Electrophysiology Society.
17 Home telemetry monitoring is not described.
MBS Review – Ambulatory Electrocardiography Review Report Page 85

May 2016
4.6.3 Catecholaminergic polymorphic ventricular tachycardia
Catecholaminergic polymorphic ventricular tachycardia (CPVT) is a congenital condition affecting electrical impulses of the heart and is triggered by physical or emotional stress in patients with structurally normal hearts and normal resting ECGs (CSANZ, 2011). The 2011 CSANZ guideline for the diagnosis and management of CPVT states that AECG is part of the clinical diagnosis, in addition to family history and response to exercise or catecholamine infusion. AECG is particularly useful in children presenting with CPVT who are not able to perform exercise testing, where Holter ECG and ‘event recorders’ (ERs/ELRs) might be of additional help to detect the typical ECG findings during exercise or emotional stress. No specific recommendations on AECG monitoring were provided.
4.7 Heart failure
Two guidelines for patients with heart failure discussed AECG (Table 4.7.44).
Table 4.7.44 CPG relating to AECG in patients with heart failure
ID Title of guideline Affiliation MethodCCS2013
Presentation, diagnosis, and medical management of heart failure in children: Canadian Cardiovascular Society Guidelines
Canadian Cardiovascular Society (CCS)
Based on consensus following the evaluation of best available evidence using GRADE (refer to Appendix 9).
ESC2012
ESC guidelines for the diagnosis and treatment of acute and chronic heart failure 2012
European Society of Cardiology (ESC); Heart Failure Association (HFA)
Based on comprehensive review and evaluation of published evidence. Levels of evidence and strength of recommendations are graded according to pre-defined criteria (refer to Appendix 9).
Abbreviations: AECG, ambulatory electrocardiography; CPGs, clinical practice guidelines; MI, myocardial infarction.
Heart failure in children is primarily due to cardiomyopathies or congenital heart diseases. The 2013 CCS guideline on the presentation, diagnosis, and medical management of heart failure in children suggests that AECG monitoring appears to have some value in risk stratification of sudden death in heart failure resulting from primary cardiomyopathy. Recommendations relating to the use of AECG monitoring in paediatric patients with heart failure resulting from cardiomyopathy are presented in Table 4.7.45.
The 2012 ESC guideline for the diagnosis and treatment of acute chronic heart failure, addressing adult disease, provides no specific recommendations in relation to AECG. However, the guideline considers AECG monitoring to be “valuable in the assessment of patients with symptoms suggestive of an arrhythmia or bradycardia (e.g. palpitations or syncope) and in monitoring ventricular rate control in patients with AF. AECG is useful for identifying the type, frequency, and duration of atrial and ventricular arrhythmias, silent episodes of ischaemia and bradycardia, and conduction disturbances, which may cause or exacerbate heart failure”.
Table 4.7.45 2013 CCS recommendations for the use of AECG in children with heart failure
Guideline Recommendations Strength/Class of recommendation
Quality /Level of evidence
CCS 2013 All patients should have 12-lead ECG performed at the time of presentation with HF, to exclude features of congenital or ischemic heart disease, arrhythmia and pre-excitation.
Strong Moderate
Holter/ambulatory ECG monitoring is not indicated as a primary diagnostic test in HF, unless HCM, arrhythmogenic RV CM, or tachycardia-induced CM is the suspected cause.
Conditional Low
MBS Review – Ambulatory Electrocardiography Review Report Page 86

May 2016
Guideline Recommendations Strength/Class of recommendation
Quality /Level of evidence
Holter/ambulatory ECG monitoring might be indicated during chronic follow up, particularly in higher arrhythmia risk groups, including patients with primary restrictive CM or HCM, with tachycardia-induced CM, or those who are taking antiarrhythmic therapy.
Conditional Low
Source: CCS (2013), p.1540. Refer to Appendix 9 for definitions of the Strength/Class of recommendation and quality/Level of evidence.Abbreviations: AECG, ambulatory electrocardiography; AF, atrial fibrillation; CCS, Canadian Cardiovascular Society; CM, cardiomyopathy; ECG, electrocardiogram; HCM, hypertrophic cardiomyopathy; HF, heart failure; ICD, implantable cardioverter-defibrillator; MI, myocardial infarction; RV, right ventricular; VT, ventricular tachycardia.
4.8 Valvular heart disease
Table 4.8.46 shows the single CPGs identified that discusses AECG for patients with valvular heart disease.
Table 4.8.46 CPG relating to AECG for patients with valvular heart disease
ID Title of guideline Affiliation MethodACC/AHA2006
ACC/AHA 2006 guidelines for the management of patients with valvular heart disease
American College of Cardiology (ACC); American Heart Association (AHA); Society of Cardiovascular Anesthesiologists (SCA)
Based on an extensive evidence review, and ranking of the evidence supporting the recommendation using a pre-defined classification process (refer to Appendix 9)
Abbreviations: AECG, ambulatory electrocardiography; CPGs, clinical practice guidelines
Valvular heart disease is usually an acquired condition, although the cause in adolescents and young adults is predominantly congenital. The 2006 ACC/AHA guideline for the management of patients with valvular heart disease provides a single recommendation on the use of Holter monitoring. According to the guideline, “Holter monitoring may be considered for the initial evaluation of asymptomatic adolescent and young adult patients with tricuspid regurgitation18, and serially every one to three years (Class of recommendation: IIb; Level of Evidence: C)”. They comment that AECG monitoring (Holter or event recorder) to detect paroxysmal AF is indicated in patients with palpitations and mitral stenosis. It may also be useful for documenting arrhythmias in patients with recurrent palpitations and mitral valve prolapse, although most of these are not life threatening, and often no symptom-arrhythmia correlation is identified.
4.9 Other cardiomyopathies
The guidelines that discuss AECG for patients with cardiomyopathies not discussed in earlier sections are shown in Table 4.9.47.
18 Tricuspid regurgitation is a disorder in which the heart's tricuspid valve does not close tight enough. This problem causes blood to flow backward into the right atrium when the right ventricle contracts.
MBS Review – Ambulatory Electrocardiography Review Report Page 87

May 2016
Table 4.9.47 CPGs relating to AECG for patients with other cardiomyopathies
ID Title of guideline Affiliation MethodACCF/AHA2011
2011 ACCF/AHA guideline for the diagnosis and treatment of hypertrophic cardiomyopathy
American College of Cardiology Foundation (ACCF); American Heart Association (AHA); American Association for Thoracic Surgery (AATS), American Society of Echocardiography (ASE); American Society of Nuclear Cardiology (ASNC); Heart Failure Society of America (HFSA); Heart Rhythm Society (HRS); Society for Cardiovascular Angiography and Interventions (SCAI); Society of Thoracic Surgeons (STS)
Based on an extensive evidence review, and ranking of evidence supporting the recommendations using a pre-defined classification process (refer to Appendix 9).
NICE (TA324)2014
Dual-chamber pacemakers for symptomatic bradycardia due to sick sinus syndrome without atrioventricular block
National Institute for Health and Care Excellence (NCE)
Based on systematic literature searches to identify all published clinical evidence relevant to the review questions. GRADE was used to assess quality of the evidence (refer to Appendix 9).
BSC2011
Latin American guideline for the diagnosis and treatment of Chagas’ heart disease
Brazilian Society of Cardiology (Sociedade Brasileira de Cardiologia (BSC)
Based on a comprehensive literature review, and ranking of the evidence supporting the recommendation using pre-defined criteria (refer to Appendix 9).
Abbreviations: AECG, ambulatory electrocardiography; CPGs, clinical practice guidelines
4.9.1 Arrhythmia in hypertrophic cardiomyopathy
The 2011 ACCF/AHA guideline for the diagnosis and treatment of hypertrophic cardiomyopathy (HCM) provides recommendations for the use of AECG monitoring for the initial clinical evaluation of patients with HCM to detect arrhythmias (presented in Table 4.9.48). The guideline considers performing serial AECG monitoring on an annual basis or every two years to be reasonable in patients who are stable and do not manifest arrhythmias on baseline 12-lead ECG and Holter monitoring, and who do not have ICDs. The guideline states that the yield of AECG monitoring for detection of AF or atrial flutter in patients who were previously asymptomatic without arrhythmias is unknown. Further, the guideline considers AECG monitoring for detection of ventricular tachyarrhythmias to be important in risk stratification of asymptomatic or symptomatic patients with HCM because episodes of non-sustained ventricular tachycardia identify patients at significantly higher risk of subsequent SCD.
Table 4.9.48 2011 ACCF/AHA recommendations for the use of AECG in patients with HCM
Guideline Recommendations Class of recommendation
LOE
ACCF/AHA2011
Twenty-four–hour ambulatory (Holter) electrocardiographic monitoring is recommended in the initial evaluation of patients with HCM to detect ventricular tachycardia (VT) and identify patients who may be candidates for ICD therapy.
I B
Twenty-four–hour ambulatory (Holter) electrocardiographic monitoring or event recording is recommended in patients with HCM who develop palpitations or light-headedness.
I B
A repeat ECG is recommended for patients with HCM when there is worsening of symptoms.
I C
MBS Review – Ambulatory Electrocardiography Review Report Page 88

May 2016
Guideline Recommendations Class of recommendation
LOE
Twenty-four–hour ambulatory (Holter) electrocardiographic monitoring, repeated every one to two years, is reasonable in patients with HCM who have no previous evidence of VT to identify patients who may be candidates for ICD therapy.
IIa C
Twenty-four–hour ambulatory (Holter) electrocardiographic monitoring might be considered in adults with HCM to assess for asymptomatic paroxysmal AF/atrial flutter.
IIb C
SCD risk stratificationAll patients with HCM should undergo comprehensive SCD risk stratification at initial evaluation to determine the presence of the following:Documented non-sustained ventricular tachycardia (NSVT) defined as three or more beats at greater than or equal to 120 bpm on ambulatory (Holter) ECG.
I B
Source: ACCF/AHA (2011), pp. e793-794. Refer to Appendix 9 for definitions of the Class of recommendation and Level of evidence.Abbreviations: ACCF/AHA, American College of Cardiology Foundation/American Heart Association; AECG, ambulatory electrocardiography; AF, atrial fibrillation; bpm, beat per minute; CM, cardiomyopathy; ECG, electrocardiogram; HCM, hypertrophic cardiomyopathy; HF, heart failure; ICD, implantable cardioverter-defibrillator; LOE, Level of evidence; NSVT, non-sustained ventricular tachycardia; SCD, sudden cardiac death; VT, ventricular tachycardia.
4.9.2 Brachycardia caused by sick sinus syndrome
Sick sinus syndrome is a condition in which the heart receives abnormal electric impulses due irreversible dysfunction of the sinus node. Guidance relating to dual-chamber pacemakers for symptomatic bradycardia due to sick sinus syndrome19 without atrioventricular block, published by NICE in 2014 (TA324), recommends that Holter monitoring (for 24 to 48 hours) or event recorders20 may be used to diagnose sick sinus syndrome because abnormalities may be intermittent, and also because symptoms are usually non-specific and observed in other disorders.
4.9.3 Chagas’ heart disease
In 2011, the Brazilian Society of Cardiology (Sociedade Brasileira de Cardiologia) published the Latin American guideline for the diagnosis and treatment of Chagas’ heart disease (Andrade et al, 2011). Patients with this condition, mainly those with ECG changes, regional or global ventricular dysfunction and heart failure, usually have a high density of ventricular arrhythmias. The guideline states that Holter monitoring should be considered in patients with resting ECG changes at the initial assessment and later whenever warranted by the symptoms. However, the guideline also advises that Holter monitoring should be performed regardless of symptoms, because it can identify complex arrhythmias, impacting on the treatment and prognosis (Table 4.9.49). According to the guideline, Holter monitoring is indicated to assess the chagasic patient with syncope for bradyarrhythmias or ventricular tachyarrhythmias, which may coexist in the same patient.
Table 4.9.49 2011 BSC indications for AECG in patients with chronic chagasic cardiopathy
Recommendations Class of recommendation
LOE
Holter monitoring is indicated in the initial assessment of patients with altered resting ECG.
IIa C
Holter monitoring is indicated for the assessment of arrhythmias and prognostic stratification of patients with chronic chagasic cardiopathy.
I C
19 Sick sinus syndrome, also known as sinus node disease or sinus node dysfunction, is a primary electrical heart disease characterised by the presence of arrhythmias caused by an irreversible dysfunction of the sinus node.
20 Not defined, so likely to include ERs, ELRs (ILR not mentioned).
MBS Review – Ambulatory Electrocardiography Review Report Page 89
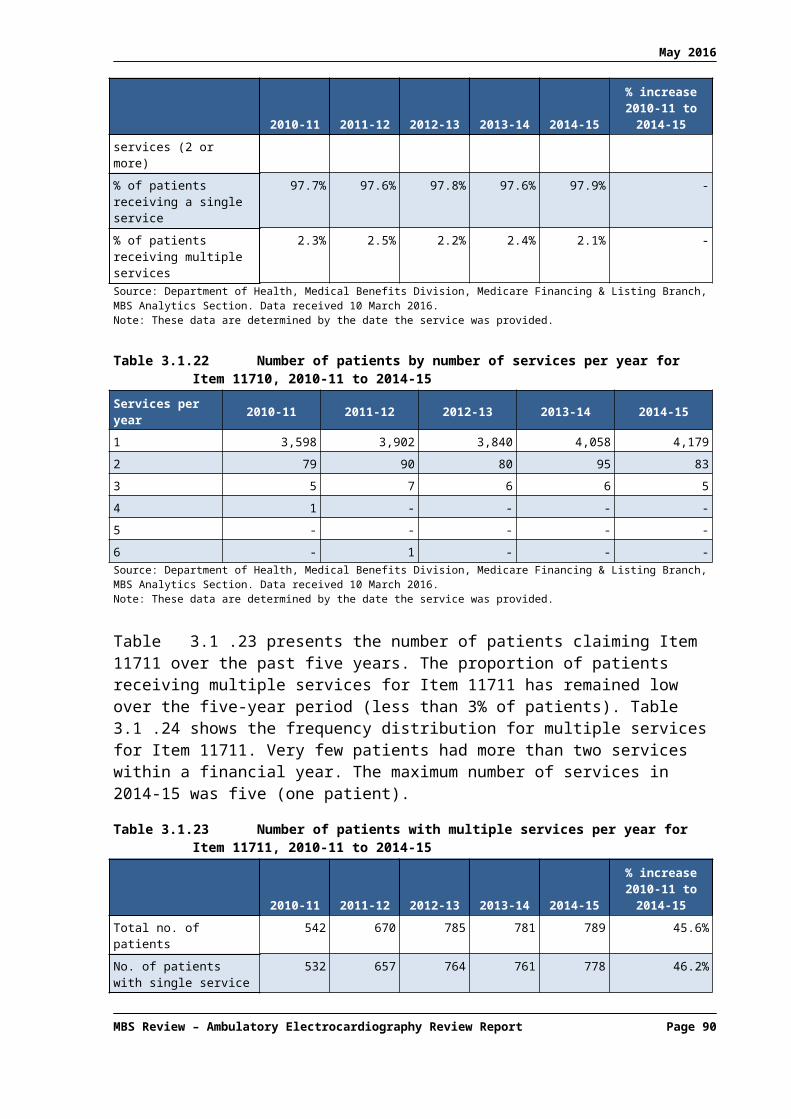
May 2016
Recommendations Class of recommendation
LOE
Patients with chronic chagasic cardiopathy with high density of ventricular arrhythmia, particularly those with electrocardiographic abnormalities, regional or global ventricular dysfunction, and HF, Holter monitoring should be performed independently of symptoms, because it can identify complex arrhythmias, impacting on the treatment and prognosis.
IIa B
Source: BSC (2011), Table 1, p. 436, p. 439. Refer to Appendix 9 for definitions of the Class of recommendation and Level of evidence.Abbreviations: AECG, ambulatory electrocardiography; BSC, Brazilian Society of Cardiology; ECG, electrocardiogram; HF, heart failure; LOE, level of evidence.
4.10 Other congenital disease
The guidelines and policy statements that discuss AECG for patients with congenital diseases not discussed in earlier sections are shown in Table 4.10.50. Two are guidelines for adults with congenital heart disease and one is a policy statement for patients with Duchenne or Becker muscular dystrophy.
Table 4.10.50 CGPs and policy statements relating to AECG for patients with congenital heart disease
ID Title of guideline Affiliation MethodPACES/HRS2014
PACES/HRS expert consensus statement on the recognition and management of arrhythmias in adult congenital heart disease
Pediatric and Congenital Electrophysiology Society (PACES); Heart Rhythm Society (HRS)
Based on literature review, consensus, and expert opinion. Levels of evidence and strength of recommendations are graded according to pre-defined classification process (refer to Appendix 9).
ESC2010
ESC guidelines for the management of grown-up congenital heart disease (new version 2010)
European Society of Cardiology (ESC); endorsed by the Association for European Paediatric Cardiology (AEPC)
Based on comprehensive literature review and evaluation of the evidence. Levels of evidence and strength of recommendations are graded according to pre-defined classification process (refer to Appendix 9).
AAP2005
Cardiovascular health supervision for individuals affected by Duchenne or Becker Muscular Dystrophy (policy statement)
American Academy of Paediatrics (AAP)
Not clearly stated but appears to be based on consensus and expert opinion. Recommendations are not graded.
Abbreviations: AECG, ambulatory electrocardiography; CPGs, clinical practice guidelines
4.10.1Congenital heart disease
The 2014 PACES/HRS expert consensus statement on the recognition and management of arrhythmias in adult congenital heart disease considers the use of AECG in symptomatic patients with congenital heart disease. The recommendations relating to the use of Holter monitoring and loop recorders (i.e. ELRs and ILRs) provided by the guideline are presented in Table 4.10.51.
Table 4.10.51 2014 PACES/HRS recommendations for AECG in patients with congenital heart diseaseGuideline Recommendations Class of
recommendationLOE
Evaluation and diagnosis of arrhythmia in symptomatic adults with congenital heart disease – Noninvasive evaluationPACES/HRS2014
Ambulatory ECG monitoring is indicated when there is a need to clarify or exclude an arrhythmia diagnosis, correlate arrhythmias with symptoms, evaluate risk, or determine appropriate therapy.
I B
MBS Review – Ambulatory Electrocardiography Review Report Page 90

May 2016
Guideline Recommendations Class of recommendation
LOE
Cardiac event loop recorders are indicated to establish whether or not sporadic symptoms are caused by transient arrhythmias.
I C
ILRs are useful in cases where the index of suspicion for a malignant arrhythmia is high (e.g., syncope) but a symptom–rhythm correlation cannot be established by conventional noninvasive techniques or invasive electrophysiologic testing.
I B
Surveillance testing for arrhythmias in asymptomatic adults with congenital heart diseasePACES/HRS2014
Periodic Holter monitoring can be beneficial as part of routine follow up in adults with transposition of the great arteries and atrial switch surgery, Fontan palliation, and in patients with tetralogy of Fallot over 35 years of age.
IIa B
Source: PACES/HRS (2014), p. e113, p. e115. Refer to Appendix 9 for definitions of the Class of recommendation and Level of evidence.Abbreviations: AECG, ambulatory electrocardiography; ECG, electrocardiogram; ILR, implantable loop recorder; LOE, level of evidence; PACES/HRS, Paediatric and Congenital Electrophysiology Society/Heart Rhythm Society.
The 2010 ESC guidelines for the management of grown-up congenital heart disease (GUCH) consider Holter monitoring and ‘event recorders’ (ERs/ELRs) to be important in the diagnostic workup and the evaluation of arrhythmias in GUCH patients. According to the guideline, Holter monitoring is considered part of the workup that leads to the early identification and establishment of the diagnosis of Marfan syndrome. Holter monitoring should be performed in symptomatic patients, as ventricular arrhythmias, conduction disturbances, and SCD occur. In patients who had undergone surgical repair for tetralogy of Fallot, Holter monitoring and event recorders (as well as EPS) are required for selected patients (i.e. high risk, investigated for suspected or clinical arrhythmia, and/or patients evaluated for right ventricular outflow tract reoperation). Similarly, in the diagnostic workup of the transposition of the great arteries and the congenitally corrected transposition of the great arteries, Holter monitoring and event recorders are required for selected patients (high risk, investigated for suspected or clinical arrhythmia).
4.10.2Duchenne or Becker muscular dystrophy
In 2005, the American Academy of Paediatrics published a policy statement to provide recommendations for optimal cardiovascular evaluation by health care specialists caring for individuals with Duchenne or Becker muscular dystrophy (AAP, 2005). According to the policy statement, “abnormalities of cardiac rhythm should be promptly investigated and treated. Periodic Holter monitoring should be considered for patients with demonstrated cardiac dysfunction”.
4.11 Perioperative monitoring
Table 4.11.52 lists the guidelines and consensus statements that refer to the use of AECG for perioperative monitoring or risk stratification.
Table 4.11.52 CPGs and consensus statements relating to AECG for perioperative risk stratification
ID Title of guideline Affiliation MethodACCF/AHA2011
2011 ACCF/AHA guideline for coronary artery bypass graft surgery
American College of Cardiology Foundation (ACCF); American Heart Association (AHA); American Association for Thoracic Surgery (AATS); Society of Cardiovascular Anesthesiologists (SCA); Society of Thoracic Surgeons (STS)
Based on a systematic review of the literature, and ranking of the evidence supporting recommendations using a pre-defined classification process (refer to Appendix 9).
MBS Review – Ambulatory Electrocardiography Review Report Page 91

May 2016
ID Title of guideline Affiliation MethodBSC2011
Guidelines for perioperative evaluation (II)
Brazilian Society of Cardiology (Sociedade Brasileira de Cardiologia (BSC)
Based on a comprehensive literature review, and ranking of the evidence supporting recommendations using pre-defined criteria (refer to Appendix 9).
ACCF/AHA2010
2010 ACCF/AHA/AATS/ ACR/ASA/SCA/SCAI/SIR/ STS/SVM guidelines for the diagnosis and management of patients with thoracic aortic disease
American College of Cardiology Foundation (ACCF); American Heart Association (AHA); American Association for Thoracic Surgery (AATS); American College of Radiology (ACR); American Stroke Association (ASA); Society of Cardiovascular Anesthesiologists (SCA); Society for Cardiovascular Angiography and Interventions (SCAI); Society of Interventional Radiology (SIR); Society of Thoracic Surgeons (STS); Society for Vascular Medicine (SVM)
Based on a systematic review of the literature, and ranking of the evidence supporting recommendations using a pre-defined classification process (refer to Appendix 9).
Abbreviations: AECG, ambulatory electrocardiography; CPG, clinical practice guideline.
The 2011 ACCF/AHA guideline for coronary artery bypass graft (CABG) surgery recommends that continuous telemetric monitoring of cardiac rate and rhythm is performed for 48 to 72 hours after surgery in all patients because of the high incidence of post-CABG AF, which most often occurs two and four days after surgery. In addition, other arrhythmias and conduction abnormalities may occur in patients with ischaemia because of incomplete revascularisation or in those undergoing concurrent valve replacement (see Table 4.11.53).
Table 4.11.53 2011 ACCF/AHA recommendations for AECG in patients with arrhythmia post CABG
Guideline Recommendations Class of recommendation
LOE
ACCF/AHA 2011
Continuous monitoring of the electrocardiogram for arrhythmias should be performed for at least 48 hours in all patients after CABG.
I B
Continuous ST-segment monitoring for detection of ischemia is reasonable in the intraoperative period for patients undergoing CABG.
IIa B
Continuous ST-segment monitoring for detection of ischemia may be considered in the early postoperative period after CABG.
IIb B
Source: ACCF/AHA (2011), p. e684. Refer to Appendix 9 for definitions of the Class of recommendation and Level of evidence.Abbreviations: ACCF/AHA, American College of Cardiology Foundation/American Heart Association; AECG, ambulatory electrocardiography; CABG, coronary artery bypass graft; ECG, electrocardiogram; LOE, level of evidence.
The 2011 guidelines by the Brazilian Society of Cardiology (BSC, 2011) discuss the use of Holter monitoring in perioperative evaluation; however no specific recommendations were provided. According to the guideline, “continuous Holter monitoring is used to assess the presence and complexity of atrial and ventricular arrhythmias, in addition to identifying dynamic changes in ST consistent with myocardial ischaemia. In preoperative evaluation, its use is rarely useful, since patients with suspected ischaemic heart disease will be preferentially evaluated by other methods and those suspected of severe and/or symptomatic arrhythmias possibly would have done it previously. The main application of Holter in the perioperative context relates to the monitoring of possible ischaemic events that occur both in the perioperative and, mainly, in the postoperative period; it should be used in intermediate- or high-risk patients for ischaemic events”.
The 2010 ACCF/AHA guidelines for the diagnosis and management of patients with thoracic aortic disease considers the use of a 24-hour Holter monitor as part of the preoperative evaluation for open surgical and endovascular thoracic aortic repairs (in addition to pulmonary function tests, cardiac catheterisation, aortography, carotid artery screening, brain
MBS Review – Ambulatory Electrocardiography Review Report Page 92

May 2016
imaging, echocardiography, and neurocognitive testing) to be reasonable to quantitate the patient’s comorbid states and develop a risk profile (Class of recommendation, IIa; LOE: C).
4.12 Remote monitoring of patients with CIEDs
The six identified Australian and international consensus and position statements on remote monitoring of CIEDs (e.g. pacemaker and cardio-defibrillator) are shown in Table 4.12.54. These devices are traditionally interrogated onsite when patients return for a physician consultation. However, technology has evolved to allow the remote transmission of data for the purposes of clinically monitoring the patient and for evaluating the function of the device. The HRS 2015 consensus statement makes the distinction between remote interrogation, where practically all information obtained during an in-office device check-up is obtained remotely, and remote monitoring, which involves automated transmission of data based on pre-specified alerts related to device functionality and clinical events.
Evaluation of implanted pacemaker or cardioverter-defibrillator function in symptomatic patients was identified by the RWG as a major indication for AECG (see Table 1.1.1 of the current Review). However, none of these guidelines discuss the use of AECG devices such as ILRs for the evaluation of CIEDs, and all transmitted data arises from the CIED devices. In September 2015, four new MBS items were added to the Medicare Benefits Schedule for remote monitoring of pacemakers and implantable cardiac debribrillators (including resynchromisation defibrillators) (Items 11719, 11720, 11725 and 11726).
Table 4.12.54 CPGs and consensus statements relating to AECG for remote monitoring of CIEDs
ID Title of guideline Affiliation MethodHRS2015
HRS expert consensus statement on remote interrogation and monitoring for cardiovascular implantable electronic devices
Heart Rhythm Society (HRS); developed in collaboration with and endorsed by the American College of Cardiology (ACC); Pediatric and Congenital Electrophysiology Society (PACES); American Heart Association (AHA); Asia Pacific Heart Rhythm Society (APHRS); European Heart Rhythm Association (EHRA); Latin American Society of Cardiac Pacing and Electro- physiology (Sociedad Latinoamericana de Estimulación Cardíaca y Electrofisiología (SOLAECE)
Based on a comprehensive literature review. Evidence was appraised according to pre-defined criteria (as indicated in Appendix 9)
CSANZ2013
Position statement on remote monitoring of cardiac implantable electrical devices
The Cardiac Society of Australia and New Zealand (CSANZ)
Based on international guidelines (2012 ACCF/AHA/HRS and 2012 ISHNE/EHRA)
ISHNE/EHRA2012
ISHNE/EHRA expert consensus on remote monitoring of cardiovascular implantable electronic devices (CIEDs)
International Society of Holter and Noninvasive Electrocardiology; European Heart Rhythm Association (EHRA)
Based on a literature review and consensus
EHRA/HRS2012
2012 EHRA/HRS expert consensus statement on cardiac resynchronization therapy in heart failure: implant and follow-up recommendations and management
European Heart Rhythm Association (EHRA); Heart Rhythm Society (HRS); European Society of Cardiology (ESC)
Based on consensus and expert opinion
NVVC2012(de Cock et al)
Remote monitoring and follow up of cardiovascular implantable electronic devices in the Netherlands: an expert consensus report of the Netherlands Society of Cardiology
Netherlands Society of Cardiology (Nederlandse Vereniging voor Cardiologie, NVVC)
Based on consensus
MBS Review – Ambulatory Electrocardiography Review Report Page 93

May 2016
ID Title of guideline Affiliation MethodASA/HRS2011
Practice Advisory for the perioperative management of patients with cardiac implantable electronic devices: Pacemakers and implantable cardioverter-defibrillators: An updated report by the American Society of Anesthesiologists Task Force on perioperative management of patients with cardiac implantable electronic devices
American Society of Anesthesiologists (ASA); Heart Rhythm Society (HRS)
Based on consensus and expert opinion
Abbreviations: AECG, ambulatory electrocardiography; CIED, cardiovascular implantable electronic device; CPGs, clinical practice guidelines.
MBS Review – Ambulatory Electrocardiography Review Report Page 94

May 2016
5 REVIEW OF THE CLINICAL EVIDENCE FOR AECG
This section presents the results of the systematic literature review on AECG in relation to the clinical research questions. Sections 5.1 and 5.2 present a description of the identified evidence base, while Section 5.3 presents the results of the identified studies.
5.1 Evidence base: systematic reviews and HTAs
The literature search for systematic reviews and HTAs of AECG identified 13 eligible publications, which are listed in Table 5.1.55. One HTA commissioned by the AHRQ investigated remote cardiac monitoring in any population. The remaining systematic reviews investigated AECG for detection of AF, the diagnosis of syncope, or patients with palpitations. The characteristics of these studies are summarised in this section and the results are reported in Section 5.3.
As mentioned in Section 2.4.2, seven systematic reviews investigating the use of AECG to stratify the risk of major events in cardiac patients were excluded during screening as they do not report PICO outcomes. These citations are listed in Appendix 10.
Table 5.1.55 Citation details for included systematic reviews or HTAsNo. Ref ID Study type Citation
Any suspected arrhythmia1 AHRQ (2007) HTA Remote Cardiac Monitoring. A Systematic Review. Technology Assessment
Report, Rockville (MD): Agency for Healthcare Research and Quality (US); 2007.21
AF in any population2 Harris (2012) SR Harris, K., D. Edwards, et al. (2012). "How can we best detect atrial
fibrillation?" J R Coll Physicians Edinb 42 Suppl 18: 5-22.
AF post IS/TIA3 Sposato (2015) SR & MA Sposato, L. A., L. E. Cipriano, et al. (2015). "Diagnosis of atrial fibrillation
after stroke and transient ischaemic attack: a systematic review and meta-analysis." Lancet Neurol 14(4): 377-387.
4 Kishore (2014) SR & MA Kishore, A., A. Vail, et al. (2014). "Detection of atrial fibrillation after ischemic stroke or transient ischemic attack: a systematic review and meta-analysis." Stroke 45(2): 520-526.
5 Liao (2007) SR & MA Liao, J., Z. Khalid, et al. (2007). "Noninvasive cardiac monitoring for detecting paroxysmal atrial fibrillation or flutter after acute ischemic stroke: a systematic review." Stroke 38(11): 2935-2940.
6 Bell (2000) SR Bell, C. and M. Kapral (2000). "Use of ambulatory electrocardiography for the detection of paroxysmal atrial fibrillation in patients with stroke. Canadian Task Force on Preventive Health Care." Can J Neurol Sci 27(1): 25-31.
AF post cryptogenic stroke7 Afzal (2015) SR & MA Afzal, M. R., S. Gunda, et al. (2015). "Role of Outpatient Cardiac Rhythm
Monitoring in Cryptogenic Stroke: A Systematic Review and Meta-Analysis." Pacing Clin Electrophysiol 38(10): 1236-1245.
Syncope8 Mappilakkandy
(2013)SR Mappilakkandy, R. and I. Edwards (2013). "Update on syncope in the older
person - A clinical review." Reviews in Clinical Gerontology 23(1): 15-31.
9 NICE (2012) Update of Westby (2010)
NICE (2012). "Transient loss of consciousness - Evidence Update March 2012." NHS Evidence. Available on the NICE website .
21 This HTA has been archived and is provided by AHRQ for reference only as the information may be out of date.
MBS Review – Ambulatory Electrocardiography Review Report Page 95

May 2016
No. Ref ID Study type CitationSyncope
10 Westby (2010) HTA, supporting guideline
Westby M, Davis S, Bullock I, Miller P, Cooper P , Turnbull N, Beal R, Braine M, Fear J, Goodwin M, Grünewald R, Jelen P Pawelec J, Petkar S, Pitcher D, Pottle A, Rogers G, Swann G (2010). Transient loss of consciousness (‘blackouts’) management in adults and young people. London: National Clinical Guideline Centre for Acute and Chronic Conditions, Royal College of Physicians.
11 Parry (2010) SR Parry, S. W. and M. P. Tan (2010). "An approach to the evaluation and management of syncope in adults." BMJ (Online) 340(7744): 468-473.
12 MSAC (2003) Assessment Report
MSAC (2003). "Implantation of insertable loop recorder for the diagnosis of recurrent unexplained syncope." Medical Services Advisory Committee (MSAC) Department of Health and Ageing, Australia Available from the Department of Health website .
Palpitations13 Hoefman (2010) SR Hoefman, E., P. J. Bindels, et al. (2010). "Efficacy of diagnostic tools for
detecting cardiac arrhythmias: systematic literature search." Neth Heart J 18(11): 543-551.
Abbreviations: AECG, ambulatory electrocardiography; AF, atrial fibrillation; AHRQ, Agency for HealthCare and Research Quality; CADTH, Canadian Agency for Drugs and Technologies in Health; HTA, health technology assessment; IS, ischaemic stroke; ; MA, meta-analysis; MSAC, Medical Services Advisory Committee; NICE, National Institute for Health and Care Excellence; SR, systematic review; TIA, transient ischaemic attack
In addition to the above-included citations, two HTAs of AECG by Hayes Inc. (ILR: Hayes Inc., 2016; mobile cardiac outpatient telemetry, Hayes Inc., 2011) were identified, but as they are not publicly available,22 they have not been included in this Review. Similarly, two abstracts in the Database of Abstracts of Reviews of Effects (DARE) were retrieved that summarise horizon scanning reviews of ILR for syncope, but the original reviews, by the National Horizon Scanning Centre in Birmingham, are no longer available online, and the DARE reviews include a timeliness warning (publish dates 2002 and 2004). Therefore these HTAs were not included in this Review. Two systematic review protocols were also retrieved (Solbiati (2015)23 and Angelis (2015)24).
5.1.1 Detection of arrhythmia for any indication
The AHRQ (2007) HTA investigated remote cardiac monitoring in a broad population (any patients with suspected arrhythmia), using ELR (or non-looping event monitors: ER), ILR or remote continuous attended monitoring (the latter is referred to in the current Review as MCT). Assessment of Holter monitoring was out of scope. The characteristics of the AHRQ (2007) HTA are shown in Table 5.1.56.
The AHRQ notes that this HTA has been archived and is provided for reference only as the information may be out of date (the literature searches were conducted in 2007). However, it has been included in the current Review because it is the only systematic review that focuses on the device, rather than the indication, which provides the opportunity for comparisons not always presented in other systematic reviews. Furthermore, the focus of the HTA was on longer-term outcomes, such as change in management and improvements in symptoms or quality of life. In contrast to all other HTAs and systematic reviews, outcomes related to diagnostic performance were out of scope.
22 May be purchased online for $USD 7,000 (ILR: Hayes Inc., 2016) and $USD 1,500 (MCOT: CardioNet ambulatory ECG monitor, CardioNet Inc.: Hayes Inc., 2011).
23 A Cochrane protocol with the title: Implantable loop recorder versus conventional diagnostic workup for unexplained recurrent syncope.
24 Protocol from the Canadian Agency for Drugs and Technologies in Health (CADTH) with the title: Monitoring for atrial fibrillation in discharged stroke and transient ischemic attack patients.
MBS Review – Ambulatory Electrocardiography Review Report Page 96

May 2016
There is extensive overlap between the AHRQ (2007) HTA and the other identified reviews/HTAs. For example, 11 of the 14 included syncope studies are also included in the key HTA for syncope (Westby, 2010). However, given the focus on more patient-relevant outcomes, the results are reproduced here. Furthermore, the focus of this HTA is on the device, rather than the indication, which provides the opportunity for comparisons not presented in Westby (2010).
Table 5.1.56 Characteristics of the identified HTA of remote ECG monitoring for any indication
Ref IDTypeQuality a
Included studies Population Device comparison
Monitoring periods
Outcomes
AHRQ (2007)HTA
7/11
Included: 17 (5 RCTs, 1 non-randomised comparative study and 11 case series)for the two key questions relevant to the current Review)
Any patients with suspected arrhythmia b
ER, ELR, MCT, ILR vs usual care or vs one of the other devices
Medium term
Long term
Change in management Improvements in:
- Palpitations- Syncopal episodes- TIA and non-fatal stroke- Dizziness or heart failure- Angina or MI- Mortality- QoL
Abbreviations: ECG, electrocardiographic; ELR, event loop recorder; ER, event recorder; ILR, implantable loop recorder; MCT, mobile cardiac telemetry; MI, myocardial infarction; QoL, quality of life; RCT, randomised controlled trial; TIA, transient ischaemic attacka Quality assessed using AMSTAR: see Appendix 6 for details.b For case series, only studies of patients with previous Holter or (for syncope) TT testing were included.
Seven questions were asked in the AHRQ (2007) HTA, of which two are relevant to this current Review:
Question 3: Is management changed based on information obtained from remote cardiac monitoring using any of the identified categories of devices and do these changes lead to improvements in the following outcomes in ambulatory patients (or a subgroup of ambulatory patients)?
palpitations syncopal episodes TIAs and non-fatal stroke dizziness and other pre-syncopal symptoms dyspnoea angina or MI mortality quality of life.
For this question, case series studies that reported patients who underwent remote monitoring without previous Holter or TT testing were not included in the analysis as these patients were considered unrepresentative of the target population for remote monitoring devices, which would be reserved for patients undiagnosed after conventional tests. Studies with at least 12 months of follow up were tabled but not included in analyses. Change-in-management outcomes with less than 12-months follow up were included in analyses, as they can occur well under 12 months.
Question 4: Of the patient outcomes for which improvements have been demonstrated, do any categories of devices lead to greater improvement in these outcomes in ambulatory patients (or a subgroup of ambulatory patients) compared to any other category of devices?
MBS Review – Ambulatory Electrocardiography Review Report Page 97

May 2016
For this question, only controlled studies were included (not studies that compare two devices in the same patients, as clinical outcomes cannot be compared).
Seventeen studies were identified that address Question 3.25 Three comparative studies were identified that address Question 4, and these are also included in the group of studies addressing Question 3. Therefore a total of 17 studies relevant to the current Review were included and analysed by AHRQ (2007). All but one of these studies are included in other HTAs or systematic reviews in the current Review (as indicated in Table 5.1.57). The majority of studies are in patients with syncope, almost exclusively unexplained syncope.
25 An additional three studies were identified but not analysed as they did not assess patients with conventional tests prior to performing remote monitoring: Schickendantz (2006); Joshi (2005); Shimetani (2005).
MBS Review – Ambulatory Electrocardiography Review Report Page 98

May 2016
Table 5.1.57 Studies included in the AHRQ (2007) HTA for the detection of arrhythmia in any indication, showing other HTAs/SRs with overlapping studiesRef ID Quality a Design Population Device Comparator Afzal
(2015)Sposato (2015)
Kishore (2014)
Mappi-lakkandy (2013)
Harris (2012)
Hoefman (2010)
Westby (2010)
Liao (2007)
MSAC (2003)
AFJabaudon (2004) 6.8 (Low) case series AF: IS/TIA ELR
(AT/PT)Holter, 24 h b
PalpitationsGiada (2007) 8.2 (Moderate) RCT c palpitations ILR conventional tests d
Kinlay (1996) 6.6 (Low) RCT e palpitations ER Holter
SyncopeBrignole (2006) 6.4 (Low) non-random
comparativesuspected NM syncope ILR (AT/PT) ILR-based Tx vs
no specific Tx
Deharo (2006) 7.5 (Moderate) case series suspected NM syncope ILR (AT/PT) –
Farwell (2006) 8.5 (High) RCT unexplained syncope ILR (AT/PT) conventional tests
Inamdar (2006) f 5.0 (Low) case series unexplained syncope ILR –Brignole (2005) 7.5 (Moderate) case series unexplained syncope ILR (AT/PT) –
Lombardi (2005) 7.0 (Low) case series unexplained syncope ILR (AT/PT) –
Krahn (2004) 7.0 (Low) case series unexplained syncope ILR (AT/PT) –
Armstrong (2003) 5.9 (Low) case series suspected cardiovascular syncope or falls
ILR –
Ermis (2003) 6.8 (Low) case series unexplained syncope ILR (AT/PT) –
Krahn (2001a) 9.1 (Moderate) RCT c unexplained syncope ILR (PT) conventional tests g
Krahn (2001b) 7.5 (Moderate) case series unexplained syncope ILR (PT) –
Nierop (2000) 8.4 (Moderate) case series unexplained syncope ILR (PT) –
Krahn (1998) 8.4 (Moderate) case series unexplained syncope ILR (PT) –
Palpitations/syncopeRothman (2007) 8.8 (High) RCT (pre-)syncope or severe
palpitations, suspected arrhythmic cause
MCT ELR
Abbreviations: AF, atrial fibrillation; AT, auto triggered; ELR, event loop recorder; ER, event recorder; HTA, health technology assessment; ILR, implantable loop recorder; IS ischaemic stroke; MCT, mobile cardiac telemetry; NM, neurally mediated; PT, patient triggered; RCT, randomised controlled trial; SR, systematic review; TIA, transient ischaemic attack, Tx, treatment.Note: There was no overlap of studies between AHRQ (2007) and the Bell (2000) or Parry (2010) systematic reviews or the NICE (2012) update of the Westby (2010) HTA.a ECRI quality rating systems from the ECRI Institute.b Two tests performed in same group of patients, but Holter results not in scope for AHRQ (2007).c The individual arms of Giada (2007) and Krahn (2001a) were quality assessed as single-arm studies.d Conventional tests includes ER: AHRQ (2007) described this as ELR, but there is no mention of looping for the event recorder device in Gaida (2007).e RCT, but comparator is out of scope for AHRQ (2007), so the in-scope arm was treated as a case series.f This study is unique to AHRQ (2007).g Conventional tests includes ELR..
MBS Review – Ambulatory Electrocardiography Review Report Page 99

May 2016
5.1.2 Detection of atrial fibrillation
The literature search identified six systematic reviews that examined AECG for the detection of AF (Table 5.1.58). The main outcome for each of these reviews is diagnostic yield (variously referred to in these reviews as diagnostic or detection rate), and three reviews present a meta-analysis of this outcome (Sposato, 2015; Kishore, 2014; Afzal, 2015).
Harris (2012) investigated various methods, from pulse palpation to AECG, in any population with suspected AF. Results are reported for each study individually, without synthesis, and examples from each of the three monitoring periods of interest to the current Review are represented; short, medium and long term. The other four reviews are of specific populations. Sposato (2015), Kishore (2014) and Liao (2007) reviewed patients with IS/TIA, and categorised devices into short term or medium/long term. Bell (2000) included studies of IS/TIA and investigated post-test treatment outcomes. Afzal (2015) is a review of cryptogenic stroke (ischaemic stroke of unknown cause), comparing medium-term and long-term devices.
MBS Review – Ambulatory Electrocardiography Review Report

May 2016
Table 5.1.58 Characteristics of included systematic reviews for the detection of atrial fibrillation
Ref IDTypeQuality a
Search date
Included studies Inclusion criteria Devices Monitoring periods
Outcomes
Any suspected AF
Harris (2012)SR
2/10
NR AECG studies: 22(1 RCT, 5 non-randomised comparative studies, 16 case series)Total studies: NR
This review used studies cited in NICE 2006 guidance for AF b supplemented by a systematic search from 2006 using a simple search string for AF, ECG or cardiovascular diagnostic techniques.c
Eligible devices: any AECG, non-ambulatory ECG or other methodsDevices reported:Holter, ELR, ER, ILR
Short term Medium term Long term
Diagnostic yield- % newly detected AF
IS/TIA
Sposato (2015)SR & MA
8/11
Jun 2014
AECG studies: 44(4 RCTs, 8 non-randomised comparative studies, 32 case series)Total studies: 50
IS/TIA confirmed with neuroimaging ruling out haemorrhage.RCTs or prospective/ retrospective cohort studies (conference abstracts excluded).
Eligible devices: hospital admissionECG, serial ECG, continuous inpatient ECG, continuous inpatient cardiac telemetry, Holter monitoring, MCT, ELR, and ILR.d
Categories reported:Four phases: 1. Admission ECG 2. Inpatient ECG (incl. Holter) 3. 1st ambulatory (Holter) 4. 2nd ambulatory (MCT, ELR, and ILR)
Short term Medium/long
term
Diagnostic yield- % newly diagnosed AF
Kishore (2014)SR & MA
7/11
Jan 2013
AECG studies: 27(1 RCT, 6 non-randomised comparative studies, 20 case series)Total studies: 32
IS/TIA patients with a min. 12 hours monitoring (haemorrhagic stroke excluded).RCTs or prospective observational studies (conference abstract included).
Eligible devices: any cardiac monitoring >12hCategories reported:1. Inpatient continuous recording 2. 24 h Holter 3. >24 hours (Holter, ELR, MCT, ILR)
Short term Medium/ and
long term
Diagnostic yield- % newly detected AF Subgroup analyses:
selected vs unselected patients e
Liao (2007)SR4/11
May 2006
AECG studies: 5(3 non-randomised comparative studies, 2 case series)Total studies: 5
Consecutive IS/TIA patients with a min. 12 hours noninvasive monitoring.RCTs or prospective cohort studies.
Eligible devices: any noninvasiveDevices reported:Holter, ELR
Short term Medium term
Diagnostic yield- % newly detected AF
Bell (2000)SR
0/10
Jun 1999
AECG studies: 7(1 non-randomised comparative study, 5 case series, 1 unclear design f
Total studies: NR
Stroke or TIA, consecutive patients with initial ECG stating presence or absence of AF.No study design criteria.
Eligible devices: continuous electrocardiographyDevices reported:Not specified beyond ambulatory ECG
NR Diagnostic yield- % newly diagnosed AF Effectiveness of
anticoagulation
MBS Review – Ambulatory Electrocardiography Review Report Page 101
May 2016
Ref IDTypeQuality a
Search date
Included studies Inclusion criteria Devices Monitoring periods
Outcomes
Crypto-genic
Afzal (2015)SR & MA
6/11
Dec 2014
AECG studies: 16(3 RCTs, 4 non-randomised comparative studies, 9 case series)Total studies: 16
Adults ≥18 years of age with cryptogenic stroke or TIA who underwent complete evaluation to rule out other causes of stroke.Studies with at least 10 patients.
Eligible devices: wearable device or ILRDevices reported:Holter (4 days), ELR, MCT, ILR
Medium term Long term
Diagnostic yield- % newly detected AF- Odds ratio of finding
AF with prolonged monitoring
Abbreviations: AECG, ambulatory electrocardiography; AF, atrial fibrillation; ER, event recorder; ELR, event loop recorder; h hour; ILR, implantable loop recorder; incl., including; IS, ischaemic stroke; LVH, left ventricular hypertrophy; MA, meta-analysis; MCT, mobile cardiac telemetry; min, minimum; NICE, National Institute of Health and Care Excellence; NR, not reported; PAF, paroxysmal atrial fibrillation; SR, systematic review; SVT, supraventricular tachycardia; TIA, transient ischaemic attacka Quality assessed using AMSTAR: see Appendix 6 for details.b This guidance (NCCC, 2006) was underpinned by a systematic search to address the following question: In patients with suspected intermittent AF, how effective is ambulatory ECG rather than event ECG in diagnosing AF? Four studies were identified, of which three are included in Harris (2012).c Seven studies prior to 2006 were also included that were not in NCCC (2006). Not sure whether search prior to 2006 was also performed, or whether earlier studies were non-systematically identified and included.d Non-looping event recorders are not included in the Sposato (2015) review.e Based on stroke pathogenesis (e.g. cryptogenic), age, or pre-screening for AF.f Publication not in English.
MBS Review – Ambulatory Electrocardiography Review Report Page 102
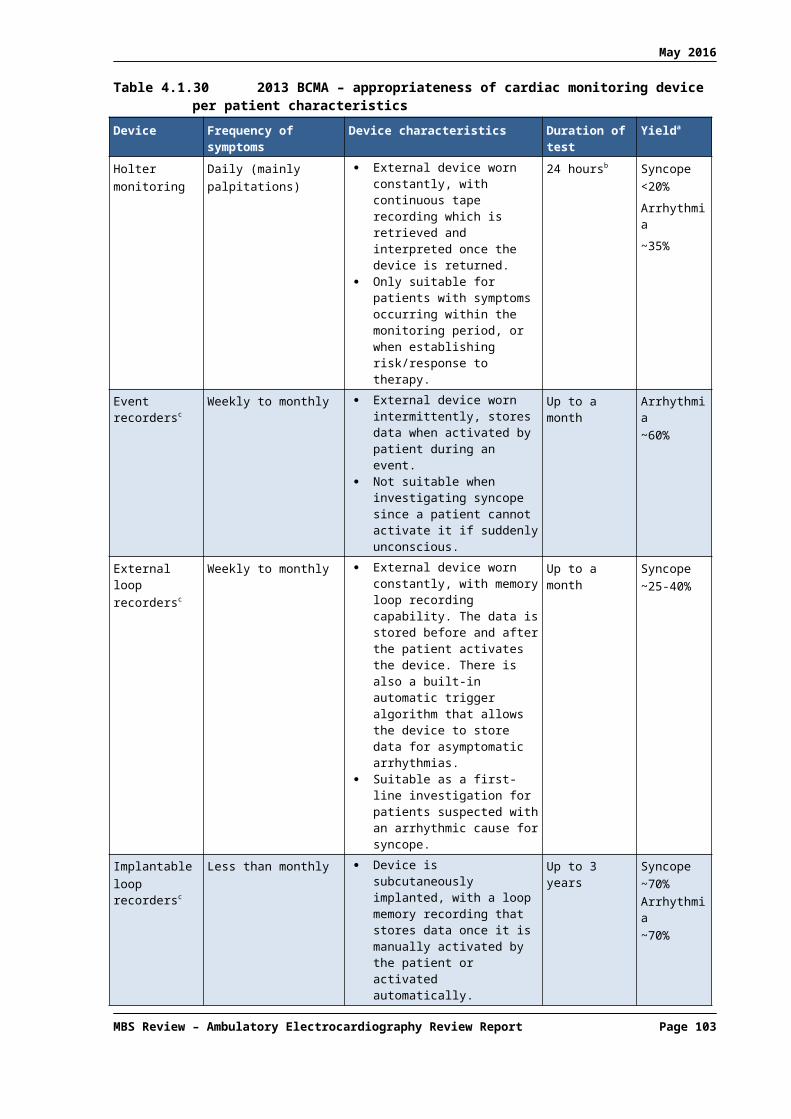
May 2016
Studies included in the systematic reviews for atrial fibrillationThe studies that are included in each of the six systematic reviews are shown in Table 5.1.59. Of the four systematic reviews of AF after IS/TIA, Liao (2007) and Bell (2000) are considerably older than Sposato (2015) and Kishore (2014), with search dates at least seven years prior to the other two reviews. Liao (2007) includes a total of only five studies, of which only one26 is not included in Sposato (2015). Therefore, Liao (2007) will not be considered further in the current Review. Of the seven studies in Bell (2000), four are not included in the other reviews. However, since three of those were published prior to 1982 and another is confounded with reporting of any arrhythmias, the Bell (2000) systematic review will not be discussed further in the current Review.
The literature search dates for the remaining two reviews of AF in the post-stroke population, Sposato (2015) and Kishore (2014), differ by only six months. Between them, a total of 58 unique AECG studies are included. However, only 13 studies are common to both. This is somewhat explained by differing inclusion criteria; for example, Kishore (2014) excluded retrospective studies while Sposato (2015) excluded conference abstracts (see Table 5.1.58). Sposato (2015) included eight studies published after the Kishore (2014) literature search date, including two RCTs and two comparative studies of different devices in the same patients. Therefore Sposato (2015) was selected as the key review for AF after IS/TIA.
The systematic review by Afzal and colleagues (Afzal, 2015), examined AECG for the detection of AF in the specific population of cryptogenic stroke. Sposato (2015) included almost all the same studies (15 of the 16 studies), but did not report results separately for cryptogenic stroke. Therefore, in the current Review, Afzal (2015) is used as the key review for the detection of AF in cryptogenic stroke.
Harris (2012) included AF detection studies without restriction of patient population (suspected AF in any patients). However, this broadening of scope resulted in the inclusion of only two additional studies that were not in post-stroke/TIA patients, and as these studies are included in the key systematic review for palpitations (Hoefman, 2010), Harris (2012) was not selected as a key systematic review for the current Review.
In summary, the two key systematic reviews and HTAs for AF are:
Sposato (2015) and Kishore (2014) for AF after IS/TIA; and Afzal (2015) for AF after cryptogenic stroke.
26 Rem (1985)
MBS Review – Ambulatory Electrocardiography Review Report Page 103
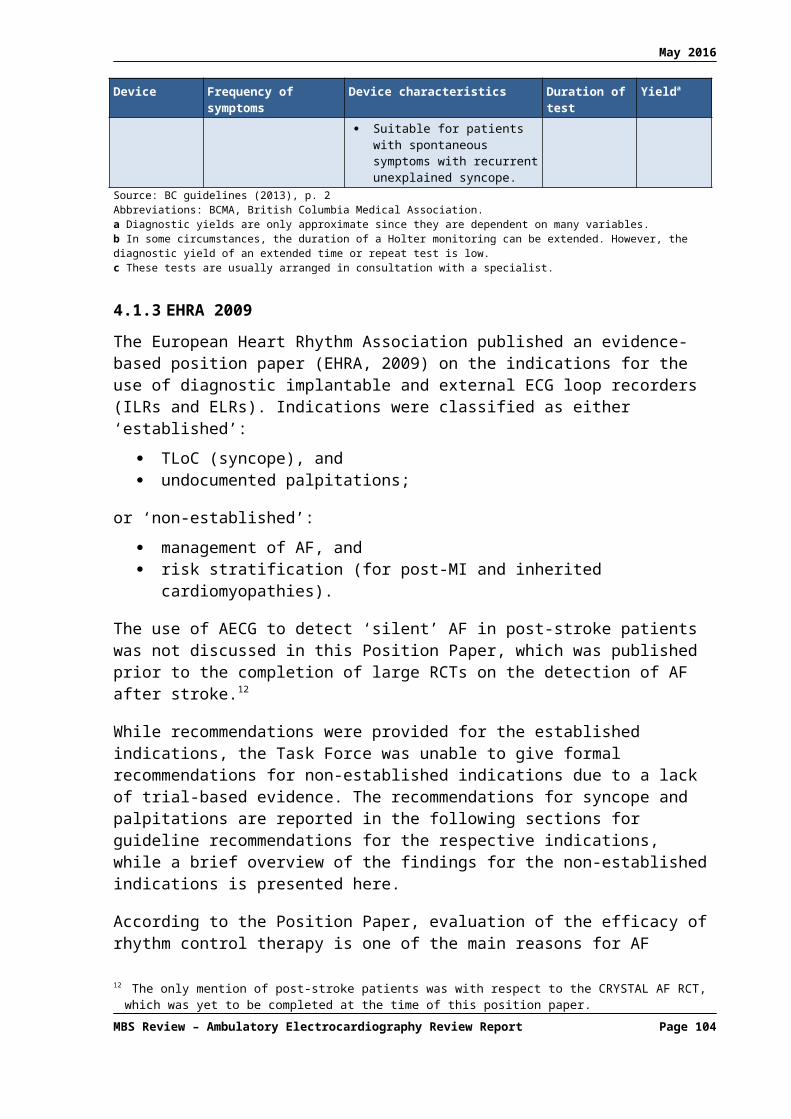
May 2016
Table 5.1.59 Studies included in the systematic reviews: atrial fibrillationRef ID Devices
Population:Harris (2012)
AnySposato (2015)
IS/TIAKishore (2014)
IS/TIALiao (2007)
IS/TIABell (2000)Stroke/TIA
Afzal (2015)Cryptogenic
RCTs Search date: NR Jun 2014 Jan 2013 May 2006 Jan 1999 Dec 2014Gladstone (2014) ELR vs Holter, 24h Sanna (2014) ILR vs usual care ECG (not specified) Higgins (2013), pragmatic ELR vs usual follow up (inpatient) [2012 abstract] Kamel (2013) MCT vs usual care (no monitoring)
Kinlay (1996), crossover ER, patient triggered vs Holter *
Comparative studiesManina (2014) Holter, 24h vs 7 days Grond (2013) Holter, 24h vs 72h
Ritter (2013) Holter, 24h vs 7 days vs ILR Sobocinski (2012) Holter, 24h vs ER, patient triggered
Stahrenberg (2010) Holter, 24h vs 48h vs 7 days Wallmann (2007) Holter, 24h vs ELR, 7 days Reiffel (2005), registry ELR with vs without auto trigger vs Holter, 24h *
Jabaudon (2004) Holter, 24h vs ELR (auto/ patient trigger), 7 days Barthelemy (2003) Holter, 24h vs ELR, 70h Schuchert (1999) Holter, 24h vs 72h Non-comparative studiesFlint (2012), registry ELR Christensen (2014) ILR [2012 abstract] Fonseca (2014) Holter, 24h
Thakkar (2014) Holter
Wohlfahrt (2014) Holter, 7 days
Beaulieu-Boire (2013) Holter, 24h
Cotter (2013) ILR Etgen (2013) ILR Merce (2013) ILR Miller (2013) MCT
Rabinstein (2013) MCT Roj-Martinez (2013) ILR
Suissa (2013) Holter, 24h
Yodogawa (2013) Holter, 24h
Atmuri (2012) Holter
Callero (2012) Holter
Dogan (2012) Holter, 24h
Doliwa (2012) ER
Gumbinger (2012) Holter
Kral (2012) Holter
Lazzaro (2012) Holter, 24h
MBS Review – Ambulatory Electrocardiography Review Report Page 104

May 2016
Ref ID DevicesPopulation:
Harris (2012)Any
Sposato (2015)IS/TIA
Kishore (2014)IS/TIA
Liao (2007)IS/TIA
Bell (2000)Stroke/TIA
Afzal (2015)Cryptogenic
Non-comparative studiesMartinez-Sanchez (2012) Holter (and other?)
Rizos (2012) Holter Sandin (2012) ILR
Shibazaki (2012) Holter
Simova (2012) Noninvasive
Bhatt (2011) MCT
Dangayach (2011) Holter, 48h Peiro/Piero (2011) ILR
Alhadramy (2010) Holter, 22.6h Dion (2010) ILR Gaillard (2010) ELR?
Rizos (2010) Holter Elijovich (2009) ELR Kar (2009) Noninvasive
Schaer (2009) Holter
Yu (2009) Holter Douen (2008) Holter Tayal (2008) ELR Tagawa (2007) Holter Gunalp (2006) Holter Schaer (2004) Holter
Shafqat (2004) Holter Vandenbroucke (2004) Holter, 24h
Hornig (1996) Holter
Kessler (1995) AECG
Richardt (1989) Not in English, not specified in SR
Koudstaal (1986) Holter
Rem (1985) Holter
Mikolich (1981) Not specified (dynamic ECG recordings)
Tonet (1981) Holter
Britton (1979) Holter, 24h
Norris (1978) Not specified (continuous ECG)
Abbreviations: ELR, event loop recorder; ER, event recorder; h, hour; ILR, implantable loop recorder; IS, ischaemic stroke; MCT, mobile cardiac telemetry; RCT, randomised controlled trial; SR, systematic review; TIA, transient ischaemic attack. indicates study exclusive to only one of the included systematic reviews. * Indicates studies exclusive among AF systematic reviews but included in a systematic review for palpitations.Italics indicates conference abstract or poster.
MBS Review – Ambulatory Electrocardiography Review Report Page 105

May 2016
5.1.3 Evaluation of syncope
As listed in Table 5.1.55, the literature search identified five eligible publications relevant to the evaluation of syncope: two systematic reviews (Mappilakkandy, 2013; Parry, 2010), one Assessment Report by the Medical Services Advisory Committee (MSAC 2003) and one HTA and subsequent Evidence Update (Westby, 2010; NICE, 2012). The key characteristics of these studies are summarised in Table 5.1.60.
The NICE HTA (Westby, 2010) is part of the NICE Clinical Guidance, Transient loss of consciousness (‘blackouts’) management in adults and young people, (CG109) and consists of multiple clinical evidence reviews of investigations for syncope, including AECG (also TT testing, carotid sinus massage and exercise testing). Two of the clinical evidence reviews within Westby (2010) are relevant to the current Review:
AECG following initial assessment for people with (i) a suspected arrhythmic cause of syncope; (ii) with unexplained syncope; or (iii) with suspected neurally mediated syncope.
People with suspected neurally mediated syncope after initial assessment – accuracy of TT testing, ambulatory ECG and carotid sinus massage to direct pacing therapy.
As one review focused on the use of AECG for diagnosis and the other on the use of AECG to direct pacing therapy, they are discussed separately in the current Review (referred to as Westby, 2010 and Westby, 2010-Pacing).
MBS Review – Ambulatory Electrocardiography Review Report Page 106

May 2016
Table 5.1.60 Characteristics of included systematic reviews/HTAs: syncopeRef IDType, Quality a
Search date
Included studies Inclusion criteria Devices Monitoring periods
Outcomes
Mappilakkandy (2013)
SR
1/10
NR AECG studies: 6 plus one guideline b (1 RCT, 2 non-comparative studies, 3 case series)
Total studies: NR
Syncope in the older person. Inclusion criteria not specified. Eligible devices: not specified
Devices reported:Holter, ELR, ILR (ILR discussed but no PICO outcomes reported)
Short term Medium
term Long term
Diagnostic yield Symptom/rhythm correlation Successful activation
NICE (2012)
Evidence Update of Westby (2010) HTA
2/10
Oct 2011 AECG studies: 2 case series
Total studies: NR
See Westby (2010) Eligible devices: Holter, ELR, ILR (not telemetry)
Devices reported:ILR
Long term See Westby (2010)
Westby (2010)
HTA underpinning NICE Clinical Guideline CG109
9/11
Nov 2009 AECG studies: 52 (4 RCTs, 2 non-randomised comparative studies, 34 case series, plus 12 retrospective studies excluded prior to data extraction)
Total studies: 52
Those in whom a cardiac arrhythmia is a suspected, but not a definitive, cause of TLoC after initial assessment (12-lead ECG normal or any identified abnormality not likely to be the cause of TLoC). This would include patients with structural heart disease or a past history of arrhythmias, but who do not have any resting ECG abnormalities at the time of measurement (post TLoC). Also, those in whom there is a history of recurrent syncope which remains unexplained after the initial assessment.
Eligible devices: Holter, ELR, ILR (telemetry excluded i.e. MCT)c
Devices reported:Holter, ELR, ILR
Short term Medium
term Long term
No TLoC during AECG No arrhythmia during TLoC Arrhythmia recorded during TLoC Arrhythmia recorded not during syncope No ECG recorded during TLoC (e.g.
technology failed) Proportion of patients started on therapy Time to first recurrence Proportion of all arrhythmias found that
are bradyarrhythmias Adverse events Deaths
Westby (2010-Pacing)
HTA underpinning NICE Clinical Guideline CG109
9/11
Nov 2009 AECG studies: 1 non-randomised comparative study
Total studies relating to pacing: 3
Adults in secondary care with TLoC in whom neurally mediated syncope is suspected after the initial assessment (patient history and eye witness accounts, physical examination including upright and supine BP and 12-lead ECG). No clear alternative diagnosis based on patient history or physical examination. Inadequate response to first-line therapy (patient education, mediation review).d
Eligible devices: Holter, ELR, ILR (telemetry excluded)(also eligible: tilt table test or carotid sinus massage)
Devices reported: ILR (for AECG)
Long term Symptom recurrence after pacing
Parry (2010)
SR
1/10
NR AECG studies: 2 (1 RCT, 1 non-randomised comparative study)
Total studies: NR
Patients with syncope. Inclusion criteria not specified. Eligible devices: NR
Devices reported:Holter, ELR
Short term Medium
term
Diagnostic yield Symptom/rhythm correlation
MBS Review – Ambulatory Electrocardiography Review Report Page 107

May 2016
Ref IDType, Quality a
Search date
Included studies Inclusion criteria Devices Monitoring periods
Outcomes
MSAC (2003)
Assessment Report
7/10
Jun 2003 AECG studies: 18 (1 RCT, 1 costing study of included RCT, 15 case series plus one retrospective study excluded prior to data extraction)
Total studies: 18
Unexplained syncope after initial medical history, physical examination, blood pressure measurement (supine and erect) surface ECG testing, and other tests (according to potential indication e.g. Holter monitor, echocardiography), and suspected of having arrhythmia cause or unexplained recurrent syncope (events occurring more than one week apart). Excludes patients suspected of having a neurogenic cause of syncope, or underlying structural heart disease associated with a high risk of sudden cardiac death.
Eligible devices: ILR
Devices reported:ILR
Long term Diagnostic characteristics Patient outcomes [treatments] following
ILR implant
Abbreviations: AECG, ambulatory electrocardiography; AF, atrial fibrillation; CR, clinical review; ECG, electrocardiography; ER, event recorder; ELR, event loop recorder; HTA, health technology assessment; ILR, implantable loop recorder; MCT, mobile cardiac telemetry; MSAC, Medical Services Advisory Committee; NICE, National Institute of Health and Care Excellence; NR, not reported; PICO, population, intervention, comparator, outcome; SR, systematic review; TLoC, transient loss of consciousness.a Quality assessed using AMSTAR: see Appendix 6 for details.b Moya (2009)c Telemetry is out of scope of the NICE CG109 guideline for which this HTA was developed.d Subgroups (1) above 65 years (2) below 65 years were also specified but no data reported for these subgroups.
MBS Review – Ambulatory Electrocardiography Review Report Page 108

May 2016
Studies included in the systematic reviews/HTAsTable 5.1.61 lists the studies included in the systematic reviews and HTAs for syncope. A total of 63 studies are included across all publications; four RCTs, three non-randomised comparative studies, and 56 case series/single-arm studies (including one ILR registry and one post hoc analysis of a large observational study of ELR). In some of the case series studies, patients were given more than one test and the results were compared.
Westby (2010) included the majority of these studies (52), including each of the four RCTs.27 However, as telemetry was out of scope for the Westby (2010) review, the comparison of ELR and MCT (Rothman, 2007) was treated as a single-arm study of ELR. Given the high quality (AMSTAR score 9/11) and extensive scope of the NICE HTA, the two relevant reviews of clinical evidence within this HTA were selected as the key reviews for syncope (referred to as Westby, 2010 and Westby, 2010-Pacing, as described above). The update of the NICE HTA in 2012 identified an additional two studies relevant to the diagnosis of syncope, and these are also discussed in the current Review.
Given the availability of prospective studies, Westby (2010) excluded the 12 retrospective studies prior to data extraction on the basis of low quality (risk of bias), leaving 40 studies from which the results are reported (studies excluded prior to analysis are indicated in Table 5.1.61. The authors of Westby (2010) noted that overall, the other studies were of acceptable quality for non-randomised studies, with the exception of Brignole (2005), which was deemed to have risk of bias as only one third of patients with unexplained syncope were given an ILR.
The 2003 MSAC Assessment Report of ILRs was prepared by independent evaluators to inform MSAC decisions regarding Medicare funding for this service (Reveal Plus®, Medtronic Australasia Pty Ltd). Eighteen studies were included, 10 of which are also in Westby (2010). Although published earlier than the key reviews, this HTA will also be briefly discussed in the current Review due to the high relevance of past decisions by MSAC regarding long-term AECG.
Mappilakkandy (2013) and Parry (2010) are very low-quality reviews (AMSTAR score 1/10; stylistically resembling general reviews rather than systematic reviews), with neither publication reporting the literature search date. Mappilakkandy (2013) includes only six original studies of AECG and reports PICO outcomes for only three of those. Similarly, Parry (2010) includes only two AECG studies. These reviews are not discussed further in the current Review.
27 Data from the Sivakumaran (2003) RCT were extracted and combined with data from the cost-effectiveness study based on this RCT (Rockx, 2005) but was not listed separately as an included study by Westby (2010-CR).
MBS Review – Ambulatory Electrocardiography Review Report Page 109

May 2016
Table 5.1.61 Studies included in the systematic reviews/HTAs: syncopeStudy ID Study design Devices Mappilakkandy (2013) NICE (2012) Westby (2010) Parry (2010) MSAC (2003)a
Randomised studiesRothman (2007) RCT (only ELR group extracted) ELR vs MCT b Farwell (2006) RCT ILR (AT/PT) vs routine tests Sivakumaran (2003)/Rockx (2005) RCT Holter, 48 h vs ELR c Krahn (2001a) RCT ILR vs routine (incl. ELR) Non-randomised comparative studiesFarwell (2004b) prospective cohort, retrospective control ILR, other tests Krahn (2000) retrospective record review ELR (PT) vs Holter, 24h
Boudoulas (1979) design NR d (only Holter group extracted) Holter, 24 h vs treadmill Non-comparativeEdvardsson (2011) registry e ILR (Reveal) Arrocha (2010) case series ILR Kabra (2009) case series ILR Pierre (2008) case series ILR (AT/PT) Pierre (2008) case series ILR (AT/PT) Schernthaner (2008) case series ILR Kuhne (2007) case series Holter, 24h Brignole (2006) f case series g ILR (AT/PT) Deharo (2006) case series ILR (AT/PT) Arya (2005) case series Holter, 48 h Brignole (2005) case series ILR (AT/PT) Garcia-Civera (2005) case series ILR (PT) Lombardi (2005) case series ILR (AT/PT) Sarasin (2005) case series Holter, 24 h Boersma (2004) case series ILR (AT/PT) Brembilla-Perrot (2004a) case series Holter, 24 h Brembilla-Perrot (2004b) case series Holter, 24 h Gula (2004) h post hoc analysis of COLAPS i ELR Krahn (2004) case series ILR (AT/PT) Armstrong (2003) case series ILR Donateo (2003) case series ILR (PT) Ermis (2003) case series ILR (AT/PT) Fitchet (2003) case series Holter, 48 h Garcia-Civera (2003) case series ILR (PT) Mason (2003) case series ILR Schuchert (2003) case series ELR Ashby (2002) case series ILR
MBS Review – Ambulatory Electrocardiography Review Report Page 110

May 2016
Study ID Study design Devices Mappilakkandy (2013) NICE (2012) Westby (2010) Parry (2010) MSAC (2003)a
Bloemers (2002) case series ILR Non-comparativeBrignole (2002) case series ILR (AT/PT) Krahn (2002) case series ILR (PT) Menozzi (2002) case series ILR (PT) Brembilla-Perrot (2001) case series Holter, 24 h Brignole (2001) case series ILR (PT) Krahn (2001b) case series ILR (PT) Mieszczanska (2001) case series ILR Moya (2001) case series ILR (PT) Sarasin (2001) case series Holter, 24h, ELR Nierop (2000) case series ILR (PT) Seidl (2000) case series ILR (PT) Krahn (1999) case series ILR (PT) Morrison (1999) case series Holter Porterfield (1999) case series ELR Krahn (1998) case series ILR (PT) Fogel (1997) case series ELR (PT) or handheld recorder Krahn (1995) case series ILR Aronow (1993) case series AECG, 24 h (Avionics) Comolli (1993) case series Holter, 24 h Kapoor (1991) case series Holter, 72 h Cumbee (1990) case series ELR Linzer (1990) case series ELR Saxon (1990) case series Holter, 24 h Ringqvist (1989) case series 48 h non-Holter Gibson (1984) case series Holter, 24 h Boudoulas (1983) case series Holter, 24 h Lacroix (1981) case series Holter, 24 h Zeldis (1980) case series Holter, 24 h
MBS Review – Ambulatory Electrocardiography Review Report Page 111

May 2016
Abbreviations: AT, auto triggered; CE, cost-effectiveness; ELR, event loop recorder; ILR, implantable loop recorder; MCT, mobile cardiac telemetry; PT, patient triggered; RCT, randomised controlled trial; SR, systematic review. Identified as eligible by Westby (2010) but subsequently excluded from analysis based on low quality (all retrospective studies) and availability of higher quality non-comparative and comparative studies.a The MSAC (2003) Assessment Report also contained a cost-effectiveness study (Krahn, 2003) based on the Krahn (2001a) RCT.b The Rothman (2007) RCT compared ELR with MCT, but appears only in Westby (2010), for which MCT is out of scope, and the data from the ELR group only was extracted.c Data from Sivakumaran (2003) RCT were combined with data from the cost-effectiveness study based on this RCT (Rockx, 2005) but was not listed separately as an included study by Westby (2010).d Study design not reported in abstract, full text not retrieved.e PICTURE (Place of Reveal In the Care pathway and Treatment of patients with Unexplained Recurrent Syncope) registry, for Reveal ILR (Medtronic Inc.)f Brignole (2006) is included in the systematic review within Westby (2010) for the diagnosis of syncope, plus it is the single study included in Westby (2010-Pacing).g Phase I of this study is a case series (ILR diagnosis); in Phase II patients were allocated to receive either ILR-guided treatment or non-specific treatment (non-randomised comparative Phase).h The purpose of Gula (2004) was to determine the optimal duration of ELR monitoring for presyncope or syncope and to identify factors that predict failure to activate the device effectively.i Comparison Of Loop Recorders Against Holter in Patients with Syncope (COLAPS) trial, is a prospective study comparing diagnostic utility of ELRs and Holter monitors for syncope.
MBS Review – Ambulatory Electrocardiography Review Report Page 112

May 2016
5.1.4 Evaluation of palpitations
Hoefman (2010) investigated the efficacy of AECG for the evaluation of patients with palpitations, and is the only systematic review of AECG identified for this population. Table 5.1.62 shows the characteristics of this systematic review. While interventional implanted devices such as pacemakers and cardiofibrillators, which can also monitor ECG, were listed as technologies included in the identified studies, no data were reported for these devices, and all 28 included studies were of AECG devices in scope for the current Review. The literature search date (March 2007) precedes by a substantial period of time the publication date for this systematic review (November 2010).
Table 5.1.62 Characteristics of the identified systematic review of AECG for palpitations
Ref IDType, Quality a
Search date
Included studies Inclusion criteria
Devices Monitoring periods
Outcomes
Hoefman (2010)SR5/11
Mar 2007
AECG studies: 28 (5 RCTs, 10 non-randomised comparative studies, 13 case series)Total studies: 28
Studies of AECG in outpatients with palpitations.No study design restrictions.
Holter ER (trans-
telephonic) ELR (PT or AT/PT) MCT ILR pacemakers or
cardiodefibrillators b
Short term Medium
term Long term
Diagnostic yield (detected arrhythmias, relevant arrhythmias)
Change in management
Abbreviations: AECG, ambulatory ECG; AT, auto triggered; ER, event recorder; ELR, event loop recorder; ILR, implantable loop recorder; MCT, mobile cardiac telemetry; PT, patient triggered.a Quality assessed using AMSTAR: see Appendix 6 for details.b While these devices are listed as among those identified in included studies, no studies using this device category were listed or discussed.
The studies included in Hoefman (2010) are shown in Table 5.1.63. Only five of the 28 studies are also included in other systematic reviews or HTAs for other populations in this current Review. The majority of studies investigate ELR or ER.
Table 5.1.63 Studies included in the Hoefman (2010) systematic review of AECG for palpitations Ref ID Study design Device AHRQ
(2007)
Any indicatio
n
Harris (2012)
AF in any populatio
n
Westby (2010)
Syncope
Giada (2007) RCT ILR vs conventional follow up (incl.ER) Olson (2007) retrospective MCTRothman (2007) RCT MCT vs ELR Hoefman (2005) RCT ELR (PT) vs usual careReiffel (2005) registry, retrospective ELR (PT or PT/AT) vs Holter Scalvini (2005) RCT ER vs HolterMartinez (2004) prospective ELR (PT vs AT)Ng (2004) retrospective ILR (AT)Balmelli (2003) prospective ELR (PT vs AT)Wu (2003) retrospective ELR (PT)Roche (2002) prospective ELR (PT vs AT)Schuchert (2002) prospective ERSummerton (2001) prospective ELR (PT)McClennen (2000) retrospective HolterZimetbaum (1998) prospective ELR (PT)Fogel (1997) prospective ELR (PT) or ER Kinlay (1996) RCT - crossover ER vs Holter Shanit (1996) prospective ERKus (1995) prospective ELR (PT) vs HolterWu (1995) retrospective ER vs Holter a
Assayag (1992) retrospective ERSafe (1990) prospective ER
MBS Review – Ambulatory Electrocardiography Review Report Page 113

May 2016
Ref ID Study design Device AHRQ (2007)
Any indicatio
n
Harris (2012)
AF in any populatio
n
Westby (2010)
Syncope
Rana (1989) retrospective HolterBrown (1987) retrospective ELR (PT)Klootwijk (1986) prospective ELR (PT) vs HolterVisser (1984) prospective ELR (PT) vs HolterErikson (1980) retrospective HolterGrodman (1979) prospective ELR (PT) vs HolterAbbreviations: AECG, ambulatory ECG; AT, automatically triggered; ER, event recorder; ELR, event loop recorder; ILR, implantable loop recorder; MCT, mobile cardiac telemetry; PT, patient triggered.a Classified in Hoefman (2010) as ELR vs ECG but the intervention is trans-telephonic monitoring (TTM), or ER, and the comparator, described as ambulatory ECG, is presumably Holter.
5.1.5 Key systematic reviews/HTAs and AECG devices investigated
The key systematic reviews and HTAs for the current Review are shown in Table 5.1.64. There are five key publications for five indications, one focused update of an HTA, and an MSAC Assessment Report from 2003, which is briefly discussed.
Table 5.1.64 Key included systematic reviews/HTAs and AECG devices investigated
Ref ID Study typeQuality a
Short-term devices Medium-term devices
Long-term devices
Any suspected arrhythmiaAHRQ (2007) HTA
7/11– ELR or ER
MCTILR
AF post IS/TIASposato (2015) SR & MA
8/11Holter ELR (ER excluded)
MCTILR
AF post cryptogenic strokeAfzal (2015) SR & MA
6/11Holter (4 days) ELR
MCTILR
SyncopeWestby (2010) and update (NICE, 2012)
HTA9/11 & 2/10 respectively
Holter ELR(MCT excluded)
ILR
MSAC (2003) Assessment Report7/10
– – ILR
PalpitationsHoefman (2010) SR
5/11Holter ELR or ER
MCTILR
Abbreviations: AECG, ambulatory electrocardiography; ELR, event loop recorder; ER, event recorder; ILR, implantable loop recorder; MCT, mobile cardiac telemetry.– indicates device category was out of scope.a Quality assessed using AMSTAR: see Appendix 6 for details.
The findings from these key systematic reviews are presented in Section 5.3.
5.2 Evidence base: RCTs
The systematic reviews for AECG described in the above section does not include all indications for which AECG can be used. Furthermore, the key systematic reviews/HTAs are no longer current for some indications (e.g. palpitations and syncope), particularly in light of the rapid technological changes that have occurred in these devices in recent years. Therefore,
MBS Review – Ambulatory Electrocardiography Review Report Page 114
May 2016
an additional literature search for RCTs was performed to identify any high-level evidence for patient-relevant outcomes not included in a systematic review, or published subsequent to the identified systematic reviews.
As described in Section 2.4.2, a broad literature search was undertaken to identify any RCTs of any AECG devices in any population. Table 5.2.65 lists 23 identified publications relating to RCTs; 21 identified by the literature search, one found by hand searching (Sulke, 2015), and one included in a systematic review that was published prior to the 1999 date limit for the RCT literature search (Kinlay, 1996). Citations are shown by indication. Two studies were in populations not included in the key systematic reviews – post-ablation AF (Kapa, 2013) and syncope with bundle branch block (Da Costa, 2013) – although these are subpopulations of included populations (detection of AF and diagnosis of syncope).
Table 5.2.65 Citation details for identified RCTsRef ID Citation
AF in cryptogenic stroke
Brachmann (2016) Brachmann, J., C. A. Morillo, et al. (2016). "Uncovering atrial fibrillation beyond short-term monitoring in cryptogenic stroke patients: Three-year results from the cryptogenic stroke and underlying atrial fibrillation trial." Circulation: Arrhythmia and Electrophysiology 9 (1) DOI: 10.1161/CIRCEP.115.003333.
Thijs (2016) Thijs, V. N., J. Brachmann, et al. (2016). "Predictors for atrial fibrillation detection after cryptogenic stroke: Results from CRYSTAL AF." Neurology 86 (3): 261-269.
Choe (2015) Choe, W. C., R. S. Passman, et al. (2015). "A Comparison of Atrial Fibrillation Monitoring Strategies After Cryptogenic Stroke (from the Cryptogenic Stroke and Underlying AF Trial)." American Journal of Cardiology 116(6): 889-893.
Gladstone (2015) Gladstone, D. J., P. Dorian, et al. (2015). "Atrial premature beats predict atrial fibrillation in cryptogenic stroke: results from the EMBRACE trial." Stroke 46(4): 936-941.
Gladstone (2014) Gladstone, D. J., M. Spring, et al. (2014). "Atrial fibrillation in patients with cryptogenic stroke." New England Journal of Medicine 370 (26): 2467-2477.
Sanna (2014) Sanna, T., H. C. Diener, et al. (2014). "Cryptogenic stroke and underlying atrial fibrillation." New England Journal of Medicine 370 (26): 2478-2486.
Higgins (2013) Higgins, P., P. W. MacFarlane, et al. (2013). "Noninvasive cardiac event monitoring to detect atrial fibrillation after ischemic stroke: A randomized, controlled trial." Stroke 44 (9): 2525-2531.
Kamel (2013) Kamel, H., B. B. Navi, et al. (2013). "Pilot randomized trial of outpatient cardiac monitoring after cryptogenic stroke." Stroke 44 (2): 528-530.
Post-ablation AF
Kapa (2013) Kapa, S., A. E. Epstein, et al. (2013). "Assessing arrhythmia burden after catheter ablation of atrial fibrillation using an implantable loop recorder: The abacus study." Journal of Cardiovascular Electrophysiology 24 (8): 875-881.
Syncope
Sulke (2015) Sulke, N., C. Sugihara, et al. (2015). "The benefit of a remotely monitored implantable loop recorder as a first line investigation in unexplained syncope: the EaSyAS II trial." Europace.
Podoleanu (2014) Podoleanu, C., A. DaCosta, et al. (2014). "Early use of an implantable loop recorder in syncope evaluation: A randomized study in the context of the French healthcare system (FRESH study)." Archives of Cardiovascular Diseases 107 (10): 546-552.
Farwell (2006) Farwell, D. J., N. Freemantle, et al. (2006). "The clinical impact of implantable loop recorders in patients with syncope." European Heart Journal 27 (3): 351-356.
Rockx (2005) Rockx, M. A., J. S. Hoch, et al. (2005). "Is ambulatory monitoring for "community-acquired" syncope economically attractive? A cost-effectiveness analysis of a randomized trial of external loop recorders versus Holter monitoring." American Heart Journal 150 (5): 1065.e1061-1065.e1065. doi:10.1016/j.ahj.2005.08.003
Farwell (2004a) Farwell, D. J., N. Freemantle, et al. (2004). "Use of implantable loop recorders in the diagnosis and management of syncope." European Heart Journal 25 (14): 1257-1263.
Krahn (2003) Krahn, A. D., G. J. Klein, et al. (2003). "Cost implications of testing strategy in patients with syncope: Randomized assessment of syncope trial." Journal of the American College of Cardiology 42 (3): 495-501.
Sivakumaran (2003) Sivakumaran, S., A. D. Krahn, et al. (2003). "A prospective randomized comparison of loop recorders versus Holter monitors in patients with syncope or presyncope." American Journal of Medicine 115 (1): 1-5.
Krahn (2001a) Krahn, A. D., G. J. Klein, et al. (2001). "Randomized assessment of syncope trial: Conventional diagnostic testing versus a prolonged monitoring strategy." Circulation 104 (1): 46-51.
MBS Review – Ambulatory Electrocardiography Review Report Page 115

May 2016
Ref ID Citation
Syncope and BBB
Da Costa (2013)28 Da Costa, A., P. Defaye, et al. (2013). "Clinical impact of the implantable loop recorder in patients with isolated syncope, bundle branch block and negative workup: A randomized multicentre prospective study." Archives of Cardiovascular Diseases 106 (3): 146-154.
Palpitations
Giada (2007) Giada, F., M. Gulizia, et al. (2007). "Recurrent Unexplained Palpitations (RUP) Study. Comparison of Implantable Loop Recorder Versus Conventional Diagnostic Strategy." Journal of the American College of Cardiology 49 (19): 1951-1956.
Scalvini (2005) Scalvini, S., E. Zanelli, et al. (2005). "Cardiac event recording yields more diagnoses than 24-hour Holter monitoring in patients with palpitations." Journal of Telemedicine and Telecare 11 (SUPPL. 1): 14-16.
Kinlay (1996) a Kinlay, S., J. W. Leitch, et al. (1996). "Cardiac event recorders yield more diagnoses and are more cost-effective than 48-hour Holter monitoring in patients with palpitations. A controlled clinical trial." Ann Intern Med 124(1 Pt 1): 16-20.
Palpitations or (pre-) syncope
Rothman (2007) Rothman, S. A., J. C. Laughlin, et al. (2007). "The diagnosis of cardiac arrhythmias: A prospective multi-center randomized study comparing mobile cardiac outpatient telemetry versus standard loop event monitoring." Journal of Cardiovascular Electrophysiology 18 (3): 241-247.
Hoefman (2005) Hoefman, E., H. C. P. M. van Weert, et al. (2005). "Diagnostic yield of patient-activated loop recorders for detecting heart rhythm abnormalities in general practice: A randomised clinical trial." Family Practice 22 (5): 478-484.
Abbreviations: AF, atrial fibrillation; BBB, bundle branch blocka This study was not found in the literature search, which was limited to publications from 1999 onwards, as it is published in 1996. It is added to this list as it was an RCT identified in the systematic reviews.
Table 5.2.66 lists the 23 included publications grouped by trial, distinguishing between original RCT publications and subsequent follow-up studies or post hoc analyses. Eight publications were not included in the identified systematic reviews: four original RCTs and four studies associated with RCTs (publications of additional data and post hoc analyses). As discussed above, two of these RCTs are in novel subpopulations (Kapa, 2013; Da Costa, 2013). The other two RCTs are in patients with syncope (Sulke, 2015; Podoleanu, 2014). The four publications of additional data and post hoc analyses were from trials already included in the key systematic reviews: one from the EMBRACE trial (Gladstone, 2015) and three from the CRYSTAL AF trial (Choe, 2015; Brachmann, 2016; Thijs, 2016).
Table 5.2.66 RCT publications, indicating where included in a SR/HTA
Ref ID for RCT primary publication: Trial nameAssociated publications
Included in key systematic review/HTA
Novel study or publication?
Comparison
AF in cryptogenic strokeGladstone (2014) EMBRACE Sposato (2015)
Afzal (2015)ELR vs Holter
Gladstone (2015) –
Sanna (2014) CRYSTAL AF Sposato (2015)Afzal (2015)
ILR vs conventional follow up
Choe (2015) –
Brachmann (2016) –
Thijs (2016) –
Higgins (2013) Sposato (2015)Afzal (2015)29
ELR vs conventional follow up
Kamel (2013) CMACS Sposato (2015) MCT vs conventional follow upPost-ablation AFKapa (2013) ABACUS – ILR vs conventional follow up
28 Patients with isolated syncope, bundle branch block and a negative workup.29 This RCT did not specify that patients had cryptogenic stroke; however, brain imaging was done, and this study was
included in the systematic review of cryptogenic stroke by Afzal (2015).
MBS Review – Ambulatory Electrocardiography Review Report Page 116

May 2016
Ref ID for RCT primary publication: Trial nameAssociated publications
Included in key systematic review/HTA
Novel study or publication?
Comparison
SyncopeSulke (2015) EaSyAS II – ILR vs conventional follow upPodoleanu (2014) FRESH – ILR vs conventional follow upFarwell (2004a) EaSyAs Westby (2010)
AHRQ (2007)ILR vs conventional follow up (incl. ELR)
Farwell (2006) Westby (2010)AHRQ (2007)
Sivakumaran (2003) Westby (2010) a Holter vs ELRRockx (2005) Westby (2010)Krahn (2001a) Westby (2010)
AHRQ (2007)MSAC (2003)
ILR vs conventional follow up (incl. ELR)
Krahn (2003) MSAC (2003)Syncope and BBBDa Costa (2013) b – ILR vs conventional follow up (incl. 7-
day Holter at each of 10 follow-up visits)PalpitationsGiada (2007) AHRQ (2007)
Hoefman (2010)ILR vs conventional follow up (incl. ER)
Scalvini (2005) Hoefman (2010) ER vs HolterKinlay (1996) AHRQ (2007)
Hoefman (2010)ER vs Holter
Palpitations or (pre-)syncopeRothman (2007)(palpitations or syncope)
AHRQ (2007)Hoefman (2010)Westby (2010)
MCT vs ELR
Hoefman (2005)(palpitations or presyncope)
Hoefman (2010) ELR vs conventional follow up
Abbreviations: AF, atrial fibrillation; BBB, bundle branch block; ELR, event loop recorder; ER, event recorder; HTA, health technology assessment; ILR, implantable loop recorder; MCT, mobile cardiac telemetry; RCT, randomised controlled trial; SR, systematic review.a While this study is not listed as included in Westby (2010-CR), data from Sivakumaran (2003) is combined with that from the subsequent publication by Rockx (2005), and is attributed in Westby (2010-CR) to Rockx (2005).b Patients with isolated syncope, bundle branch block and a negative workup.c Trans-telephonic.
The characteristics of the RCT evidence for AECG (including study design and outcomes) are summarised below, for each indication. The results of those RCTs not documented in a systematic review/HTA are reported in Section 5.3 (also see for a list of the studies with reported results and the relevant sections).
5.2.1 RCTs for atrial fibrillation
Table 5.2.67 shows the characteristics of the eight publications of four trials detecting AF in the post-stroke patient population. Four of these publications (of four trials) have been captured by the systematic reviews/HTAs that have already been identified in Section 5.1.2 and listed in Table 5.1.59. Four recent publications contained updates from the EMBRACE and CRYSTAL AF trials, reporting results in later years, sensitivity/negative predictive value (NPV), or baseline variables as potential predictors of AF.
MBS Review – Ambulatory Electrocardiography Review Report Page 117

May 2016
Table 5.2.67 Study characteristics of RCT publications (and associated studies) for AF after strokeRef IDTrial name
DesignRandomised (N)
Population Comparison
Monitoring periods
Outcomes
RCTs in SRsGladstone (2014)EMBRACEPrimary publication
RCT, open label with blinded adjudication, multicentreN = 572
AF after cryptogenic stroke
ELR vs Holter, 24 h
Medium term vs short term
Detection of AF or flutter lasting ≥30 s within 90 days of randomisation in patients for whom the AF status could be assessed
AF ≥30 s after any monitoring duration AF ≥2.5 min after any monitoring
duration AF of any duration after any monitoring
duration Oral anticoagulation use at 90 days Switch from antiplatelet to
anticoagulant therapy at 90 days.
Sanna (2014)CRYSTAL AFPrimary publication
RCT, open label, multicentreN = 441
AF after cryptogenic stroke
ILR vs conventional follow up
Long term vs usual care
Time to first detection of AF (>30 s) within 6 months
Time to first detection of AF (>30 s) within 12 and 36 months
Recurrent stroke or TIA Change in oral anticoagulant use.
Higgins (2013)Primary publication
RCT, open label, 2 centresN = 100
AF after ischaemic stroke
ELR vs conventional follow up
Medium term vs short term
Detection of AF at 14 days Detection of AF at 90 days AF-thromboembolic prophylaxis-
related anticoagulation at 14 and 90 days.
Kamel (2013)CMACSPrimary publication
RCT, open label, assume single centre (pilot study)N = 40
AF after cryptogenic stroke
ELR vs conventional follow up
Medium term vs short term
Feasibility outcomes for pilot study: Enrolment of 40 patients in 2 years Completion of assigned monitoring in
≥70% of patients Full follow up for ≥ 90% of patients.
New publicationsBrachmann (2016)CRYSTAL AF
Additional data and post hoc analysis
AF after cryptogenic stroke
ILR vs conventional follow up
Long term vs usual care
Outcomes as for Sanna (2014) plus: Change in management Recurrence of stroke Additional time points for primary
outcome Duration of AF episodes Predictor analysis of AF for basic
demographic and disease-status variables.
Thijs (2016)CRYSTAL AF
Post hoc analysis
AF after cryptogenic stroke
ILR vs conventional follow up
Long term vs usual care
Outcomes as for Sanna (2014).Authors assessed predictors of AF within the ILR group.
Choe (2015)CRYSTAL AF
Post hoc analysis
AF after cryptogenic stroke
ILR vs conventional follow up
Long term vs usual care
Outcomes as for Sanna (2014).Authors assessed the sensitivity and NPV of various simulated durations and periodicities of external monitoring strategies for AF detection in a population with cryptogenic stroke.
Gladstone (2015)EMBRACE
Post hoc analysis
AF after cryptogenic stroke
ELR vs Holter, 24 h
Medium term vs short term
Outcomes as for Gladstone (2014).2015 update contains an assessment of baseline variables associated with subsequent AF detection.
Abbreviations: AF, atrial fibrillation; ELR, external loop recorder; ECG, electrocardiogram; h, hours; ILR, implantable loop recorder; min, minutes; NPV, negative predictive value; RCT, randomised controlled trial; s, seconds.
MBS Review – Ambulatory Electrocardiography Review Report Page 118

May 2016
5.2.2 RCTs for atrial fibrillation after ablation
Table 5.2.68 shows the RCTs that assessed AECG in the AF ablation patient population. This study was not captured by the systematic reviews/HTAs that have already been identified in Section 5.1.2 (for AF) and listed in Table 5.1.59.
Table 5.2.68 Study characteristics of RCT publication for atrial fibrillation after ablationRef IDTrial name
Design Population
Comparison Monitoring periods
Outcomes
Kapa (2013)ABACUSPrimary publication
RCT, blinded adjudication, single centreN = 44
AF after ablation
ILR vs conventional therapy
Long term vs usual care
Arrhythmia recurrences (AF and/or OATs) over 1 year post ablation
Actionable events including:1. Initiation/withdrawal of antiarrhythmic drugs or
AVN blocking agents2. Cardioversion3. Discontinuation/reinitiation of anticoagulation4. Observations prompting repeat
ablation/implantation of pacemaker and/or implantable cardioverter-defibrillator.
Abbreviations: AF, atrial fibrillation; AVN, atrioventricular nodal; ILR, implantable loop recorder; OATs, organised atrial tachyarrhythmias; RCT, randomised controlled trial.
There were two phases in this study, comprising consecutive six-month periods. At the beginning of the first six months, all subjects received an ILR immediately after the completion of ablation. All study subjects also received a trans-telephonic monitor (TTM) unit. All decisions during the initial six months phase were based solely on conventional management. At the beginning of the second six months, subjects were randomised 1:1 to ILR (transmission of data every 31 days) or conventional management (twice daily 1-minute pulse rate assessment, and one TTM recording for 30 days at month 11).
5.2.3 RCTs for syncope
Table 5.2.69 shows the characteristics of the nine publications (of six RCTs) in the syncope patient population. Six of these publications, reporting on three RCTs, have been captured by the systematic reviews/HTAs that have already been identified in Section 5.1.3 and listed in Table 5.1.61. Three additional RCTs were published after the systematic reviews/HTAs, comparing ILR with conventional therapy in patients with syncope.
A further RCT (Rothman, 2007) includes patients with either syncope or palpitations. Since the majority of patients had palpitations and the majority did not have syncope, this trial is not included in this section (see RCTs for palpitations).
Table 5.2.69 Study characteristics of RCT publications for syncope
Ref IDTrial name
Design Population Comparison Monitoring periods
Outcomes
RCTs in SRsFarwell (2004a)EaSyAsPrimary publication
RCT, open label, single centreN = 201
Recurrent syncope
ILR (AT/PT) vs routine tests
Long term vs usual care
Outcomes at 6-month follow up: Time to ECG diagnosis Time to first recurrence of
syncope following study induction
Time to second recurrence of syncope following study induction
Time to the introduction of ECG-guided therapy
QoL (SF-12 questionnaire and VAS)
MBS Review – Ambulatory Electrocardiography Review Report Page 119

May 2016
Ref IDTrial name
Design Population Comparison Monitoring periods
Outcomes
Farwell (2006)EaSyAS
Extension study
As above As above As above Outcomes listed above for EaSyAs RCT, at 18 months
Sivakumaran (2003)Primary publication
RCT, open labelN = 100
Syncope or presyncope
ELR vs Holter, 48 h
Medium term vs short term
Confirmation or exclusion of arrhythmia as a cause of syncope
Probability of obtaining a symptom-rhythm correlation
Rockx (2005) CEA of Sivakumaran (2003)
As above As above As above CEA
Krahn (2001a)Primary publication
RCT, open label, single centreN = 60
Syncope ILR vs routine testing (including ELR)
Long term vs usual care
Diagnosis, defined as obtaining a symptom-rhythm correlation in patients during syncope or presyncope that resembled the symptoms before enrolment
Krahn (2003) CEA of Krahn (2001a)
As above As above As above CEA
New RCTsSulke (2015)EaSyAS II
RCT open label, factorial assignmentN = 246
Syncope ILR vs conventional therapy
Long term vs usual care
Time to ECG diagnosis Detection of intermittent
bradycardia requiring pacing Reduced recurrent syncope
Podoleanu (2014)FRESH
RCT open label, multicentreN = 78
Syncope ILR vs conventional therapy
Long term vs usual care
Certain cause of syncope (diagnostic yield)
Hospital LOS Advanced cardiological
testing QoL Healthcare-related costs30
Da Costa (2013) RCT open label, multicentreN = 78
Syncope with BBB
ILR vs conventional therapy
Long term vs usual care
Time to occurrence of arrhythmic events leading to pacemaker or defibrillator implantation
Predictors of AV blockAbbreviations: AT, auto triggered; AV, atrioventricular; BBB, bundle branch block; CEA, cost-effectiveness analysis; ECG, electrocardiography; ELR, external loop recorder; ILR, implantable loop recorder; LOS, length of stay; MCT, mobile cardiac telemetry; PT, patient triggered; QoL, quality of life; RCT, randomised controlled trial; SF-12 questionnaire, 12-item Short Form Health Survey; SR, systematic review; VAS, visual analog scale.
5.2.4 RCTs for palpitations
Table 5.2.70 shows the characteristics of the five RCTs for AECG in patients with palpitations. Each of these was documented by a systematic review (as indicated in Table 5.2.66), so will not be presented as individual RCTs outside their assessment by the key systematic reviews/HTAs.
Table 5.2.70 Study characteristics of RCTs for palpitations
Ref IDTrial name
Design Population Comparison Monitoring periods
Outcomes
RCTs in SRsRothman (2007)Primary publication
RCT, open label, multicentreN = 305
Syncope, presyncope, or severe palpitations
MCT vs ELR Medium term vs medium term
Confirmation or exclusion of a probable arrhythmic cause of symptoms
30 May be inferred from LOS and testing rates rather than costing data.
MBS Review – Ambulatory Electrocardiography Review Report Page 120
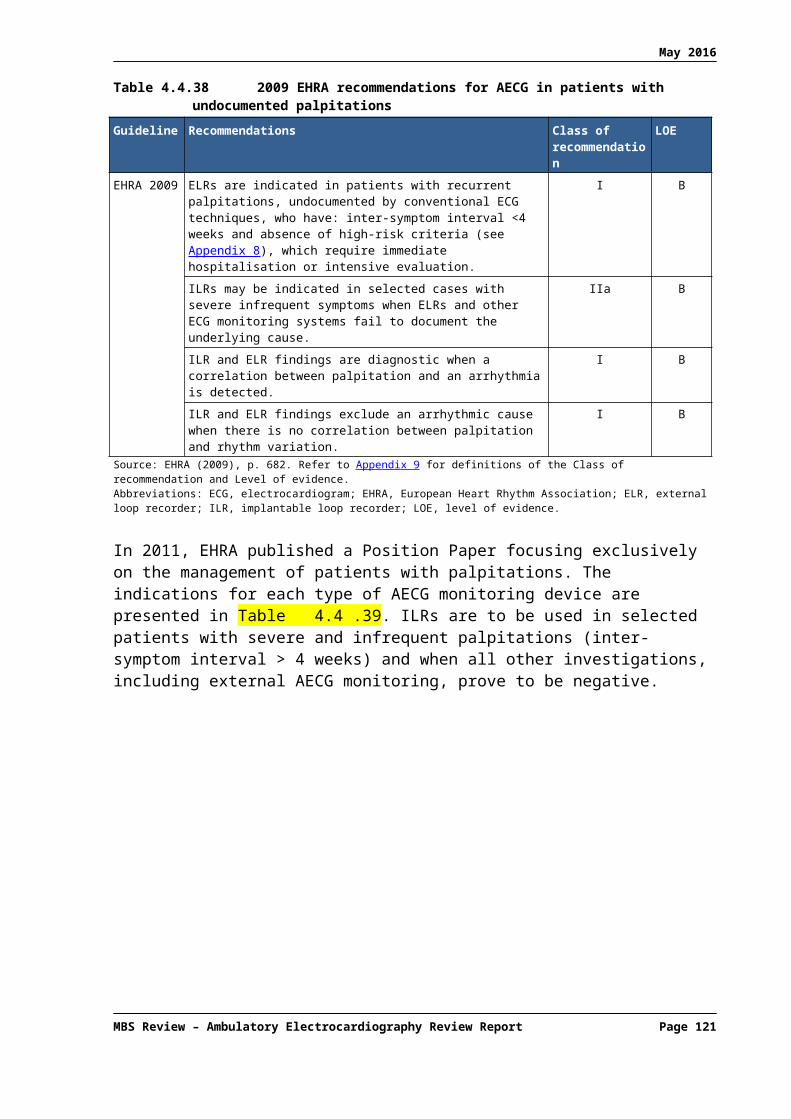
May 2016
Ref IDTrial name
Design Population Comparison Monitoring periods
Outcomes
Giada (2007)Primary publication
RCT, open label, multicentre, optional crossoverN = 50
Palpitations ILR vs conventional testing (incl. ER)
Medium term vs long term
Diagnostic yield CEA
Hoefman (2005)Primary publication
RCT, open label, single centre/multiple GPsN = 244
Patients presenting to GP with a new episode of palpitations and/or light-headedness
ELR vs usual care
Short term vs medium term
Number of explained episodes after 6 months
Frequency of (relevant) cardiac diagnoses
Proportion of patients (1) unable to activate recorder during symptoms; (2) activation failed; or (3) inadequate recording quality to make a diagnosis
Scalvini (2005)Primary publication
RCT, open label, single centreN = 310
Palpitations ER (trans-telephonic) vs Holter, 24h
Short term vs medium term
Diagnostic yield Costs
Kinlay (1996)Primary publication
RCT, open label, single centre, crossoverN = 43
Palpitations ER vs Holter, 48h
Short term vs medium term
Recordings during symptoms Clinically significant
arrhythmia Costs: CEA
Abbreviations: CEA, cost-effectiveness analysis; ELR, event loop recorder; ER, event recorder; ILR, implantable loop recorder; MCT, mobile cardiac telemetry; RCT, randomised controlled trial
5.2.5 Summary of RCT evidence base
The intention of the authors of the current Review was to discuss in detail the results of only those RCTs not included in the identified systematic reviews. However, the EMBRACE and CRYSTAL AF RCTs were not described in any detail nor presented individually as comparative studies in the key systematic reviews. In order to make sense of the subsequent data from these trials, it was decided to provide a brief overview of the findings of the original RCTs. Therefore, a total of ten publications of RCTs and associated studies will be discussed ().
MBS Review – Ambulatory Electrocardiography Review Report Page 121
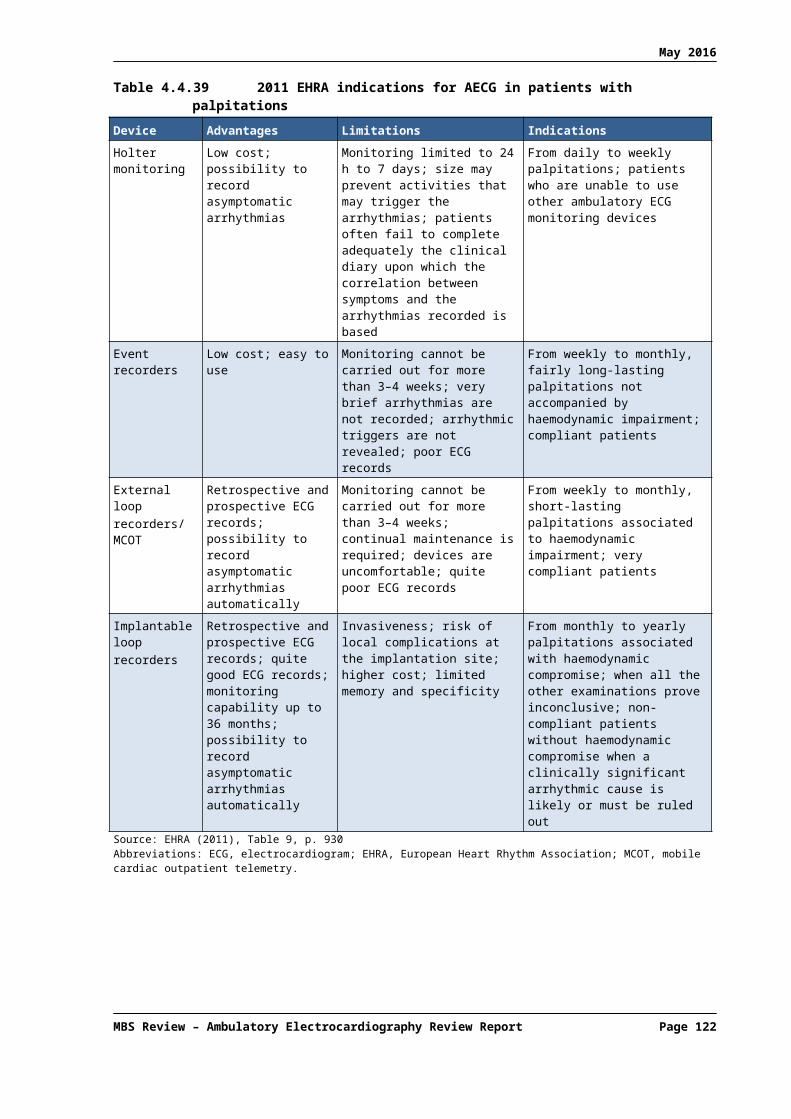
May 2016
Table 5.2.71 RCTs and associated studies: clinical evidence presented in addition to SR/HTA evidence
Trial name Ref ID Study design In a SR? TypeAF after strokeEMBRACE Gladstone (2014) RCT (N = 572) Yes Primary publication
Gladstone (2015) Post hoc analysis No Predictors of AF
CRYSTAL AF Sanna (2014) RCT (N = 441) Yes Primary publication
Choe (2015) Post hoc analysis No Simulation of short-term and medium-term monitoring strategies
Brachmann (2016) Additional data No New outcome reported (change in management)
Thijs (2016) Post hoc analysis No Predictors of AF
Post-ablation AFABACUS Kapa (2013) RCT (N = 44) No Primary publication
SyncopeEaSyAS II Sulke (2015) RCT (N = 246) No Primary publication
FRESH Podoleanu (2014) RCT (N = 78) No Primary publication
– Da Costa (2013)31 RCT (N = 78) No Primary publicationAbbreviations: AF, atrial fibrillation; HTA, health technology assessment; RCT, randomised controlled trial; SR, systematic review.
5.3 Effectiveness and safety of AECG for diagnosis
Standard 12-lead ECG may be considered the gold standard for short-term monitoring, but is not feasible for longer-term monitoring. As the duration of monitoring would be expected to impact on the yield of paroxysmal events, no reference standard is available for most uses of ambulatory devices, and studies of AECG typically report diagnostic yield without reference to a standard.
While the majority of primary studies of AECG are case series investigating the yield of a single test, many compare the yield of more than one test, sometimes sequentially in the same patient group. A small number of randomised studies have been published, mostly comparing ambulatory tests with non-ambulatory methods. Given that diagnostic yield is usually the only outcome reported in these studies, and some compare two devices in the same patient group, randomisation is not as relevant to these studies as would be the case if longer-term, patient-oriented outcomes were being investigated. Almost all the systematic reviews of AECG report or analyse the results of the relevant arms of included studies, grouped by device or device category, regardless of original study design, with cohorts from higher-level studies (RCTs) treated no differently to those from lower level studies (comparative cohorts and case series).
5.3.1 Detection of arrhythmia for any indication
Question 3 from AHRQ (2007)Results reported here address Question 3 posed by the AHRQ (2007) HTA:
Is management changed based on information obtained from remote cardiac monitoring using any of the identified categories of devices and do these changes lead to improvements in the following outcomes in ambulatory patients (or a subgroup of ambulatory patients)?
palpitations syncopal episodes
31 Patients with isolated syncope, bundle branch block and a negative workup.
MBS Review – Ambulatory Electrocardiography Review Report Page 122

May 2016
TIAs and non-fatal stroke dizziness and other pre-syncopal symptoms dyspnoea angina or MI mortality quality of life.
Findings are reported by device type, and then by outcome.
Findings for implantable loop recordersTable 5.3.72 shows the relevant outcomes from 14 ILR studies. The authors rated the quality of studies using the 11-question evaluation tool for non-comparative studies from the ECRI Institute.32 The highest quality rating attributable to non-comparative studies is moderate, regardless of rating score. The two comparative studies with a ‘conventional testing only’ control group (Brignole, 2006 and Farwell, 2006) were quality rated using the 25-question ECRI tool for comparative studies.33
Table 5.3.72 AHRQ (2007): Outcomes reported in ILR studiesRef ID Quality a Design Population N b Change in
managementSyncope
recurrenceMortality QoL
PalpitationsGiada (2007) 8.2 (Moderate) RCT arm c palpitations 26 d
SyncopeBrignole (2006) 6.4 (Low) non-random
comparativesuspected NM syncope 53
Deharo (2006) 7.5 (Moderate) case series suspected NM syncope 25 e
Farwell (2006) 8.5 (High) RCT unexplained syncope 103 Inamdar (2006) 5.0 (Low) case series unexplained syncope 100 Brignole (2005) 7.5 (Moderate) case series unexplained syncope 103 Lombardi (2005)
7.0 (Low) case series unexplained syncope 34
Krahn (2004) 7.0 (Low) case series unexplained syncope 60 Armstrong (2003)
5.9 (Low) case series suspected cardiovascular syncope or falls
15
Ermis (2003) 6.8 (Low) case series unexplained syncope 50 Krahn (2001a) 9.1 (Moderate) RCT arm c unexplained syncope 30 Krahn (2001b) 7.5 (Moderate) case series unexplained syncope 85 Nierop (2000) 8.4 (Moderate) case series unexplained syncope 35 Krahn (1998) 8.4 (Moderate) case series unexplained syncope 24 Abbreviations: ILR, implantable loop recorder; NM, neurally mediated; QoL, quality of life; RCT, randomised controlled trial.a ECRI quality rating system for non-comparative studies, from the ECRI Institute (the highest quality rating attributable to non-comparative studies is moderate, regardless of rating score). Scores are shown for the outcome ‘change in disease management’.b N reports number of patients monitored with ILR (for Brignole (2006) N = number with ILR-guided treatment).c N reports the number of patients in the ILR arm of these RCTs comparing ILR with conventional testing (including ELR). These arms were quality rated as non-comparative studies for the purpose of analysis of this outcome.d Deharo (2006) used ILR to characterise arrhythmias in patients diagnosed with vasovagal syncope with a tilt table test, in order to select appropriate treatment options, so was omitted from the synthesis.e The population in Giada (2007) was different (palpitations) to all other studies, so was omitted from the synthesis. Not included in synthesis.
Change in disease managementEleven ILR studies reported change in disease management and were included in a synthesis of results for this outcome. One of these was the Farwell (2006) RCT, in which 7.1% of patients in the no-ILR control group underwent change in management. This rate was used as 32 For the Giada (2007) and Krahn (2001a) RCTs, the relevant arms were assessed separately as non-comparative studies,
and scores may differ from those derived when these studies are assessed as RCTs using the ECRI institute 25-question tool for comparative studies.
33 The Giada (2007) and Krahn (2001a) RCTs control groups included ELR, and so were not considered here as comparative studies: instead, these RCTs are reviewed by AHRQ (2007) for Question 4, which compares device types.
MBS Review – Ambulatory Electrocardiography Review Report Page 123

May 2016
the assumed rate for the control groups for the other ten studies in a meta-analysis to obtain a summary odds ratio (OR) for change in management. This synthesis was not intended to provide a quantitative estimate, but to allow a conclusion regarding the direction of effect.
The results of the meta-analysis are not graphically depicted in AHRQ (2007)34 but the random effects meta-analysis summary result was an OR of 7.1 [95% CI: 4.9, 10.3] (i.e. more than seven times more likely to change management after ILR than after conventional tests). Multiple sensitivity analyses were performed as shown in Table 5.3.73, and all calculated ORs were still in favour of ILR. While the estimate appears most sensitive to the assumed baseline control rate of change in management – an increase from 7.1% to 20% decreases the OR to 2.2 [1.7, 2.9] – this scenario continues strongly to favour ILR.
The authors concluded that a ‘significantly’ larger number of patients with unexplained syncope undergo changes in disease management with ILR monitoring than with conventional arrhythmia assessment. The median quality of the studies in this analysis is moderate (median 7.5, range 5.0 to 8.4), and the authors note the sensitivity analyses support the robustness of the findings, and that the strength of evidence supporting this conclusion is moderate.
Table 5.3.73 AHRQ (2007): Change in management after ILR
Ref ID No. of patients
No. in control group
% patients with management
change after ILR
% patients with management
change: control
Impact on OR [95% CI] of removal of study from MA
Base case 7.1 [4.9, 10.3]Farwell (2006) 103 98 41.7 7.1 6.8 [4.5, 10.3]Inamdar (2006) 100 – 45 – 6.6 [4.4, 9.9]Brignole (2005) 103 – 36.9 – 7.0 [4.6, 10.8]Lombardi (2005) 34 – 32.4 – 7.2 [4.8, 10.7]Krahn (2004) 60 – 35 – 7.1 [4.7, 10.8]Armstrong (2003) 15 – 20 – 7.3 [5.0, 10.7]Ermis (2003) 50 – 32 – 7.22 [4.8, 10.9]Krahn (2001a) 30 – 46.7 – 6.9 [4.7, 10.2]Krahn (2001b) 85 – 15.3 – 8.3 [5.7, 12.0]Nierop (2000) 35 – 22.9 – 7.4 [5.0, 10.9]Krahn (1998) 24 – 75 – 6.7 [4.7, 9.5]
Additional sensitivity analyses:2006 studies removed a 6.2 [3.9, 9.8]20% control rate b 2.2 [1.7, 2.9]
Source: AHRQ (2007), Table 7, p61, and Appendix E, Table E-711, p170Abbreviations: CI, confidence interval; ILR, implantable loop recorder; MA, meta-analysis; OR, odds ratio.a Cumulative meta-analysis with the two most recent studies (Inamdar, 2006; Farwell, 2006) removed.b Random effects meta-analysis imputing a control group for each single-arm study with a baseline rate of change in treatment of 20%.
Syncopal episodesFour studies reported this outcome, using different measures (Table 5.3.74). Due to these different outcome measures, the findings of these studies were not combined. In the high-quality RCT (Farwell, 2006), no significant difference was found between groups in the proportion of patients with recurrence of syncope after testing, and while there was a significant difference for time to recurrence of syncope (p = 0.04), the authors noted that the sample size in this single-centre study was not large enough to allow a conclusion.
In Phase II of the Brignole (2006) study, patients with an ILR-documented syncope were allocated to receive either ILR-based therapy or no specific therapy. This allocation was not 34 The text refers to Figure 3 but no such figure is included.
MBS Review – Ambulatory Electrocardiography Review Report Page 124

May 2016
random and, as the authors pointed out, showed evidence of selection bias (patients with asystole were predominantly selected for the ILR-based therapy). Although a statistically significant difference between groups after ILR testing is reported, statistical comparison of non-randomised groups should be interpreted with caution.
The remaining evidence is from case series, and the authors of AHRQ (2007) concluded that the evidence is insufficient to allow a conclusion regarding the effect of ILR, with associated ILR-guided treatment changes, on syncopal episodes.
Table 5.3.74 AHRQ (2007): Syncopal episodes after ILR tests
Outcome Farwell (2006)ILR(n = 103, 98)
Brignole (2006)(n = 53, 50)
Krahn (2001a)(n = 60)
Nierop (2000)(n = 35)
% patients with syncope recurrence [after monitoring/testing phase]
ILR: 15.5Control: 23.5 a
p = 0.21
ILR: 11.3Control: 34 b
p = 0.008
– –
% patients with presyncope recurrence [after monitoring/testing phase]
– ILR: 7.5Control : 16p = 0.23
– –
Time to recurrence of syncope [after monitoring/testing phase]
% NR0.04 (favouring ILR)
– – –
Number of patients with resolution of syncope [post ILR]
– – 13/14 patients with post-ILR diagnosis c
–
Mean syncope rate (for 17/35 with 1-year follow up)
– – – 1 y before ILR: 4.8 ±2.41 y after ILR: 1.3 ±0.7p = 0.01
Source: AHRQ (2007) Appendix E, Table E-8, p168Abbreviations: ILR, implantable loop recorder; NR, not reported; y, year.a Control group received routine tests: some but not all received ELR.b Control group received no specific treatment rather than ILR-directed treatment.c Study does not report corresponding number for undiagnosed patients i.e. spontaneous resolution.
MortalityThree studies reported mortality after at least one-year follow up: one RCT and two case series (Table 5.3.75). The authors noted that the between-group differences in the RCT were not statistically significant for this outcome, and that the case series did not distinguish between deaths in the diagnosed population and the undiagnosed population. Therefore, the evidence was insufficient to allow a conclusion regarding mortality.
Table 5.3.75 AHRQ (2007): Mortality after ILR tests
Study Cohort Mortality, n/N (%) p-valueFarwell (2006) ILR
Control8/103 (7.8)9/98 (9.2) a
0.8
Brignole (2005) ILR 4/103 (3.9) NA
Krahn (2001b) ILR 3/85 (3.6) b NASource: AHRQ (2007) Appendix E, Table E-9, p169Abbreviations: ILR, implantable loop recorder; NA, not applicable.a Control group received routine tests: some but not all received ELR.b Proportion calculated post hoc: reported as 2.9% (3/103) in AHRQ (2007), but this study included 85 patients.
MBS Review – Ambulatory Electrocardiography Review Report Page 125

May 2016
Quality of lifeOne high-quality study (Farwell, 2006) reported quality-of-life data using two instruments: the 12-item Short Form Health Survey (SF-12 questionnaire), and a visual analog scale (VAS) to capture general well-being. There was no difference between groups for either instrument at 6 or 12 months, but at the 18-month follow up a statistically significant difference was observed for the general well-being VAS (p = 0.03). The authors concluded that in light of the inconsistent results for this outcome, the lack of blinding of providers in this single-centre study, and the small effect size for the one statistically significant difference, the evidence is insufficient to allow a conclusion.
Findings for event loop recordersTable 5.3.76 shows the four ELR studies that report relevant outcomes, and the outcomes reported by each.
Table 5.3.76 AHRQ (2007): Outcomes reported in ELR studiesRef ID Quality a Design Population N Change in
managementSyncope recurrence
AFJabaudon (2004) 6.8 (Low) case series AF: IS/TIA 132 PalpitationsGiada (2007) 8.2 (Moderate) RCT arm palpitations 24 SyncopeKrahn (2001a) 9.1 (Moderate) RCT arm unexplained syncope 30 Palpitations/ syncopeRothman (2007) 8.2 (Moderate) RCT arm (pre-)syncope or severe
palpitations, suspected arrhythmic cause
132
Abbreviations: AF, atrial fibrillation; ELR, event loop recorder; IS, ischaemic stroke; RCT, randomised controlled trial; TIA, transient ischaemic attack.a ECRI quality rating systems from the ECRI Institute.
Change in disease managementFour studies reported this outcome – three of which are the ELR arms from RCTs comparing ELR with other remote monitoring devices. Given the range of populations investigated it was considered inappropriate to combine data: the heterogeneity between studies precludes the imputation of a control rate of management change, and only one study had a potentially large effect size (Rothman, 2007), assuming a hypothetical control group rate of close to zero. The authors concluded the evidence was insufficient to determine whether ELR monitoring can lead to a change in disease management in patients who have already undergone conventional assessment.
Table 5.3.77 AHRQ (2007): Change in management after ELR
Study Change in management, n/N (%)Jabaudon (2004) 5/132 (3.8)
Giada (2007) 2/24 (8.3)
Krahn (2001a) 1/30 (3.3)
Rothman (2007) 19/132 (14.6)Source: AHRQ (2007), Appendix E, Table E-7, p162Abbreviations: ELR, event loop recorder.
Syncopal episodesOnly Krahn (2001a) reported resolution of syncope. Among the six out of 30 patients diagnosed with the conventional strategy (including ELR), all had resolution of syncope. Only four of these had actual management change following diagnosis. The rate of resolution was
MBS Review – Ambulatory Electrocardiography Review Report Page 126

May 2016
not reported in the population undiagnosed after ELR. The authors concluded there is insufficient evidence to determine whether ELR is associated with a reduction in syncopal episodes.
Findings for event recorders (post-event recorders)Only one study investigated non-looping, post-event recorders, or ERs. Kinlay (1996) is an Australian randomised crossover study comparing Holter monitoring and ER in a selection of eligible patients attending the John Hunter Hospital cardiovascular unit. The ER arm of this study was rated by the authors to be of moderate quality (score 7.5 using the 11-question ECRI tool for non-comparative studies).
Of 45 patients with palpitations, eight underwent change in management based on clinically significant arrhythmia detected after three months of ER monitoring. The authors concluded the evidence for this device is insufficient to allow a conclusion for this outcome. No other outcomes of relevance were reported by this study.
Findings for mobile cardiac telemetryOne study (Rothman, 2007) reported change in disease management after MCT. In this RCT, MCT was compared to monitoring with ELR, mostly patient activated. This comparison of two medium-term monitoring devices is in scope for the current Review as the MCT devices are auto activated but 80% of patients in the ELR arm of this study used patient-activated devices (this study is discussed further in the results for Question 4, below).
To address Question 3, the ELR arm of the study is assumed to be a conservative estimate of the rate that would have been observed with conventional assessment, for the purposes of comparing with the rate for MCT. The authors note that this is a high-quality multicentre study with few limitations: outcome assessors were blinded, and the percentage of dropouts due to non-compliance was low (quality rating 8.8 using 25-question ECRI tool for comparative studies).
MCT detected roughly three times more clinically significant arrhythmias (requiring treatment) than ELR (largely patient activated; 41% vs 14.4% respectively) over 25 days. This difference was statistically significant (p ≤0.001). The authors stated the evidence is sufficient to conclude that MCT real-time monitoring leads to a change in disease management in significantly more patients than does conventional assessment. The strength of this evidence, however, is weak, since it is derived from a single study.
No other relevant outcomes were reported by this study.
Question 3 – summary of resultsQuestion 3 addresses the effectiveness of remote cardiac monitoring on change in management compared to conventional assessment. The results summarised below are presented in terms of this comparison. Conventional assessment is not a consistently defined intervention, and in some instances includes remote cardiac monitoring (e.g. ELR) or Holter monitoring. The following statements were made in summary of the evidence reported above regarding change of management and other outcomes after remote cardiac monitoring:
Patients with unexplained syncope are more likely to undergo a change in disease management when using ILR monitoring or real-time continuous attended monitoring [MCT] than with conventional assessment.
MBS Review – Ambulatory Electrocardiography Review Report Page 127

May 2016
Patients with severe palpitations occurring less than once per 24 hours are also more likely to undergo a change in disease management when using real-time continuous attended monitoring [MCT] than with conventional assessment.
The strength of evidence is moderate for ILR (based on 11 studies, average quality moderate), and weak for real-time continuous attended monitoring [MCT] (based on one high-quality multicentre trial).
Evidence of the effect of other remote monitoring devices (ELRs and post-event recorders) on change in disease management is insufficient, due to small numbers of studies identified and numerous quality flaws.
For the same reasons, the evidence is insufficient to determine whether any class of remote cardiac monitoring devices are associated with better clinical outcomes than conventional monitoring.
Question 4 from AHRQ (2007)Results reported here address Question 4 posed by the AHRQ (2007) HTA:
Of the patient outcomes for which improvements have been demonstrated, do any categories of devices lead to greater improvement in these outcomes in ambulatory patients (or a subgroup of ambulatory patients) compared to any other category of devices?
Included RCTsThree RCTs were identified that compare different types of AECG devices (Table 5.3.78). Two are moderate-quality, single-centre studies comparing ILR with conventional testing, including ELR, while one is a high quality, multicentre study that compares MCT with ELR. The MCT versus ELR comparison would be out of scope, except 80% of the ELR devices were patient activated only while the MCT device could be activated automatically. Therefore this RCT can be considered a comparison of devices with or without automatic activation, and is thereby in scope.
Various cohorts from these studies have been extracted and discussed in the prior section relating to Question 3 from AHRQ (2007). The quality ratings shown in Table 5.3.78 are derived using the 25-question quality evaluation tool for comparative studies.35
The ILR device used in Giada (2007) could be patient activated or automatically activated while in Krahn (2001a) they were patient activated only. The ER device used in Giada (2007) appeared to be patient activated only, and while this is not specified in Krahn (2001a), it is likely the ELRs were also patient activated. In Rothman (2007), only 16% of patients used automatically activated ELRs, which were available at only two of the 15 study sites. The MCT device has automatic and patient activation.
Among these trials there is heterogeneity of indication (syncope, palpitations, or a mixture of both) and patient characteristics (see Table 5.3.78). As a consequence of this heterogeneity, the study findings were not combined, but reported individually.
35 Prior section assessed separate arms of these studies using the 11-question tool for non-comparative studies. As a result, these studies have different quality scores here than quoted in prior sections.
MBS Review – Ambulatory Electrocardiography Review Report Page 128

May 2016
Table 5.3.78 Characteristics of RCTs comparing AECG devicesRef IDQuality a
Comparison N Age: (mean ±SD)
% female
Duration of symptoms b
% with heart disease
Type of heart disease Relevant outcomes reported
Palpitations c
Giada (2007)
7.0 (Moderate)
ILR
vs
ER d + EPS
26
24
51 ±18
43 ±17
54
79
44 (15, 100)
30 (15, 66)
42
25
Structural heart disease: valvular heart disease ischaemic heart disease dilated cardiomyopathy
change in management
SyncopeKrahn (2001a)
7.8 (Moderate)
ILR
vs
ELR + tilt table + EPS
30
30
68 ±14
64 ±14
37
53
6.6 ±12.1
8.7 ±26.6
43
33
ILR ELRischaemic heart disease: 30 17
valvular heart disease: 3 17
cardiomyopathy: 10 0
change in management
syncope recurrence
Palpitations/ syncope e
Rothman (2007)
8.8 (High)
MCT (AT/PT)
vs
ELR f (PT)
134
132
57 ±16
55 ±16
63
69
NR 84
83
coronary artery disease hypertension previous MI congestive heart failure pacemaker
change in management
Source: AHRQ (2007) Appendix F, Table F-2, p172Abbreviations: AECG, ambulatory electrocardiography; AT, auto triggered; ELR, event loop recorder; EPS, electrophysiological study; ER, event recorder; ILR, implantable loop recorder; MCT, mobile cardiac telemetry; NR, not reported; PT, patient triggered; RCT, randomised controlled trial; SD, standard deviation.a ECRI quality rating systems from the ECRI Institute.b Giada (2007) reported median months (interquartile range); Krahn (2001a) reported mean years (±standard deviation).c Suspected to be cardiac-related.d AHRQ (2007) reports the comparator includes ELR, but original study publication reports an ER, with no mention of looping capacity.e Percentage of indications in MCT/ELR groups, respectively: palpitations, 78/84; syncope, 17/15; presyncope, 37/31.f 80% of patients used ELR devices that were patient activated only.
Change in disease managementAll three trials report change in disease management, although in the case of Rothman (2007) therapies are not discussed, and the AHRQ (2007) authors have equated clinically significant arrhythmias with arrhythmias leading to treatment decisions. As shown in Table 5.3.79, all patients that received a diagnosis in Giada (2007) and Krahn (2001a) went on to receive treatment as a consequence of identifying the arrhythmia. However, in Rothman (2007), the diagnostic yield includes patients with an exclusionary diagnosis (confirmed arrhythmia is not the cause of symptoms). Presumably these patients will not receive AECG-directed treatment, hence the difference between patients diagnosed and patients with clinically significant arrhythmias.
Table 5.3.79 AHRQ (2007): Change in disease management after AECG monitoringRef ID Comparison
(n)Duration of monitoring
n/N (%) receiving
diagnosis a
n/N (%) with ECG-guided treatment changep-value for between-group difference
Types of treatment change
Giada (2007) ILR (26)
ER (24) b
321 ±235 days
40 ±25 days
19/26 (73)
2/24 (8.3)
19/26 (73)
2/24 (8.3)
p = 0.0002
ILRpacemaker 3antiarrhythmic drugs 8ablation 4anxiolytic therapy 4
ERablation 1antiarrhythmic therapy 1
Krahn (2001a) ILR (30)
ELR (30)
12 months
2 to 4 weeks
14/30 (46.7)
1/30 (3.3)
14/30 (46.7)
1/30 (3.3)
p = 0.0001
ILRpacemaker 10antiarrhythmic drugs 1dietary intervention 3
ELRpacemaker 1
Rothman (2007)
MCT (AT/PT) (134)
≥ 25 days 117/134 (87.3) 55/134 (41.4) NRClinically significant arrhythmias in Rothman (2007) are reported in
MBS Review – Ambulatory Electrocardiography Review Report Page 129

May 2016
Ref ID Comparison (n)
Duration of monitoring
n/N (%) receiving
diagnosis a
n/N (%) with ECG-guided treatment changep-value for between-group difference
Types of treatment change
ELR (PT) c (132)
98/132 (74.2)
includes exclusionary
diagnoses
19/132 (14.6)
(statistically significant difference)
AHRQ (2007) as % with ECG-guided treatment change (assumed clinically significant arrhythmias would be treated).
Rothman (2007) syncope/ presyncope patients only
MCT (AT/PT)(n = NR)
ELR (PT) c
(n = NR)
NR NR 51.6
15.7
p-value NR
NR
Source: AHRQ (2007), Appendix E, Table E-7 p 162 and Appendix F, Table F-4, p176. p-values derived from AHRQ (2007), p69Abbreviations: AECG, ambulatory electrocardiography; AT, auto triggered; ELR, event loop recorder; EPS, electrophysiological study; ILR, implantable loop recorder; MCT, mobile cardiac telemetry; NR, not reported; PT, patient triggereda For Giada (2007) and Krahn (2001a), diagnosis by ELR excludes those made by EPS.b AHRQ (2007) reports the comparator includes ELR, but original study publication reports an event recorder (ER), with no mention of looping capacity.c 80% of patients used ELR devices that were patient activated only.
For this outcome, there are statistically significant differences between groups in each of these studies. The between-group differences are most pronounced in the studies comparing ILR with conventional testing (including ELR). However, the authors point out that these are moderate quality, small studies without blinded outcome assessors, and with between-group differences in baseline patient characteristics; as such, the evidence is insufficient to allow a conclusion in patients with unexplained syncope or palpitations monitored with ILR versus ELR. Due to the multicentre study of MCT versus ELR being larger, the evidence is considered sufficient to conclude that MCT does lead to change in disease management in significantly more patients than do patient-activated ELRs, but the strength of the evidence supporting this conclusion is weak.
As 16% of patients in the ELR group of Rothman (2007) had auto-triggered ELR devices, a post hoc analysis was performed, but no difference was found between ELRs that are patient triggered or those that are automatically activated. However, the authors point out that this was a post hoc analysis, and the overall conclusion cannot be generalised to automatically activated ELRs.
Reduction in syncopeKrahn (2001a) is the only one of the RCTs to report this outcome, having continued to follow patients after diagnosis for a further 19.3 ±8.9 months. This study included a crossover36 period, during which patients not diagnosed with one device could chose to use the other device. Table 5.3.80 shows the flow of patients through the study, including patients diagnosed and patients with resolved syncope after diagnosis and treatment.
ILR monitoring diagnosed 14 patients in Phase 1 and a further eight during the crossover phase. Of these 22, syncope resolved in 13 from the first phase and seven from the crossover phase. ELR monitoring diagnosed one patient in Phase 1 only, and syncope resolved in this patient. A further six patients were diagnosed with TT tests or electrophysiological studies within the conventional tests arm of the study, and symptoms resolved for all these patients.
36 Results of crossover stage excluded from results reported in prior section for ‘change in disease management’.
MBS Review – Ambulatory Electrocardiography Review Report Page 130

May 2016
The AHRQ (2007) authors note that due to incomplete patient crossover in this study, an analysis of syncope resolution should focus only on patients who did not cross over to another testing regimen. They note that syncope can resolve spontaneously, so in order to assess the true impact of ILR- or ELR-guided treatment on syncope resolution, the baseline rate of resolution in undiagnosed patients should be taken into account. If the length of follow up did not differ between arms, spontaneous resolution could be ignored as it would be expected to be the same in both arms. However, as patients not diagnosed with conventional testing after two to four weeks could proceed to ILR monitoring, longer-term spontaneous resolution rates in the ELR arm are not captured. The authors of the current Review considered that while this is a flaw in the study design for the purpose of making a comparative assessment of syncope resolution after AECG, perhaps the biggest limitation of this analysis is the low number of diagnoses made with ELR (one patient).
The AHRQ (2007) authors consider this outcome comparison to be compromised by the study design. They state a lack of an adequate control group means that the evidence is insufficient to allow a conclusion for this outcome.
Table 5.3.80 AHRQ (2007): Patient flow and resolution of syncope after AECG-guided treatment
Description Phase 1 CrossoverILR Conventional
tests aILR after
conventional tests
Conventional tests after
ILR
Patients in Phase 1/proceed to Phase 2 30 30 6 21
Diagnosed with ILR, or ELR excluding tilt and EPS 14 1 8 0
Syncope resolved (excluding tilt and EPS) 13 1 7 0
Remained in follow up with ILR 3 0 8 0
Completed Phase 1/2, undiagnosed 13 24 5 5
Proceeded to crossover 6 21 – –Source: AHRQ (2007) Appendix E, Table E-7, p164-5; Krahn (2001a) original study.Abbreviations: AECG, ambulatory electrocardiography; ELR, event loop recorder; EPS, electrophysiological study; ILR, implantable loop recorder.a Conventional tests included ELR, tilt table tests and EPS. Diagnoses with tilt table and EPS not shown in this table.
No other relevant outcomes were reported for the three RCTs comparing AECG devices.
Question 4 – summary of resultsThe following statements were made in summary of the evidence reported above regarding the comparative evidence for different types of AECG monitors:
Two studies comparing ILR and ELR plus other tests found statistically significantly more patients with a change in disease management in the ILR group.
Limitations of these studies include baseline differences in patient characteristics and a lack of blinding of outcome assessors. Studies could not be combined due to different patient populations.
The evidence is insufficient to allow a conclusion regarding the relative benefits of ILRs and ELRs in patients with unexplained syncope or palpitations.
One high-quality study comparing MCT (AT/PT) with ELR (mostly PT) found statistically significantly more patients with a change in disease management in the MCT group.
The evidence is sufficient to conclude that MCT leads to a change in disease management in significantly more patients than do patient-activated ELRs in patients with palpitations or syncope. The strength of the evidence is weak.
MBS Review – Ambulatory Electrocardiography Review Report Page 131

May 2016
This conclusion cannot be extended to automatically activated ELRs, which were under-represented in the study.
SafetySafety outcomes were not reported in this HTA, with the exception of mortality, which was reported as a downstream outcome for ILR in Question 3 from AHRQ (2007).
5.3.2 Detection of atrial fibrillation
The key reviews for AF after stroke (Sposato, 2015) and AF after cryptogenic stroke (Afzal, 2015) are summarised below.
AF after stroke: Sposato (2015)Sposato (2015) investigated any type of ECG for detection of AF in patients with confirmed non-haemorrhagic IS/TIA, including patients with cryptogenic stroke, and no prior AF diagnosis. Up to 40% of strokes are cryptogenic (Sacco, 1989) and, by some estimates, AF may be present in up to 30% of cryptogenic stroke cases (Glozter, 2015). Some cohorts in this systematic review are exclusively cryptogenic, some are mixed, while the cryptogenic status of others is not specified. The authors note that cohorts enriched for cryptogenic stroke may have higher rates of AF detection than unselected post-stroke populations (Sposato, 2015).
A total of 50 studies were identified, including some comparative studies (four of which were RCTs), but mostly non-comparative observational studies. The authors did not analyse the RCT evidence as independent, comparative studies. Instead, they pooled cohort data from all studies, regardless of study design. A total of 48 AECG cohorts were extracted and classified into the following monitoring phases and subgroups:
In-hospital phases
Phase 1. Emergency room ECG: admission ECG
Phase 2. Inpatient ECG: serial electrocardiography continuous inpatient ECG continuous inpatient cardiac telemetry inpatient Holter
Ambulatory phases
Phase 3. Short-term AECG: outpatient Holter
Phase 4. Medium- to long-term AECG: MCT ELR ILR
Phase 1 monitoring is out of scope of the current Review, as are all the Phase 2 monitoring except inpatient Holter monitoring. However, in-hospital monitoring needs to be considered in light of the setting: patients may not be particularly ambulatory if they are in hospital, so the results should be interpreted in light of potential differences in inpatient and outpatient Holter populations.
MBS Review – Ambulatory Electrocardiography Review Report Page 132

May 2016
Risk of bias of included studiesA risk-of-bias assessment was performed for each included study. Funnel plots for each of the diagnostic device groups showed substantial asymmetry, suggesting potential publication bias in this area of research. Six domains of potential bias were assessed for each of the 50 included studies: around half had a risk of selection bias (46%) or non-disclosed funding sources (52%) and almost one quarter (22%) had identified potential funding bias.
Characteristics of included studiesSposato (2015) included studies of AF regardless of duration of the arrhythmia. For each device group, Table 5.3.81 shows the number of cohorts, their cryptogenic status, the total patients included and the time from clinical event to monitoring, along with the mean duration of monitoring for that group.
A notable difference between the Phase 2 and Phase 3 Holter-monitoring groups is the time from IS/TIA event to the start of monitoring, which was 2.9 days (standard deviation [SD] 2.7) for inpatient Holter, but 39.9 days (SD 57.5) for outpatient Holter. The authors commented that while monitoring started at similar times for outpatient Holter (Phase 3) and ELR, MCT and ILR (Phase 4), the Phase 4 methods were usually preceded by Holter monitoring.
Table 5.3.81 Sposato (2015): Time to start of monitoring and duration of monitoring for different groups
Phase Device Number of cohorts
N Cryptogenic-onlyCohorts (patients)
Time to start of monitoringDays (SD) [range]
Duration (days)
2 Inpatient Holter 16 4,618 0 (0) 2.9 (2.7) [1, 7] 1.6 ±1.6
3 Outpatient Holter 13 2,225 5 (385) 39.9 (57.5) [6, 180] 2.3 ±2.1
4 MCT 5 417 4 (289) 26.7 (21.9) 21.0 ±0.0
4 ELR 7 829 3 (536) 39.2 (17.9) 18.0 ±11.6
4 ILR 7 477 7 (477) 74.8 (13.4) 391.6 ±25.2Abbreviations: CI, confidence interval; ELR, event loop recorder, ILR, implantable loop recorder; MCT, mobile cardiac telemetry; SD, standard deviation.
From earlier to later phases, there is an increase in the number of patients known to have cryptogenic stroke. No patients in the inpatient Holter group were selected for cryptogenic stroke, only five of the 13 outpatient Holter cohorts investigated exclusively cryptogenic stroke patients, but in the Phase 4 group, 14 of 19 cohorts were selected cryptogenic populations. These selected cohorts represent 0%, 17% and 76% of patients in these phases, respectively37. All patients in the ILR group had cryptogenic stroke.
Results for AECG cohortsTable 5.3.82 shows the individual study characteristics and findings for the 48 AECG cohorts. Where reported, the mean age of patients in these studies was over 50 (one study reported 48.8 years), and most studies investigated patients with a mean age of over 60 years.
Table 5.3.82 Sposato (2015): Characteristics and findings of included studiesRef IDPhase indicated where more than one cohort is extracted
Study design Event Crypto-genic only
N Mean age
(years)
Duration of
monitoring (days)
Patient-days of
monitoring
Patient-days of
monitoring per AF
Diagnostic yield: PSAFn (%)
Phase 2: inpatient HolterAtmuri (2012) retrospective IS/TIA No 129 65·3 1 29 11 12 (9%)Barthelemy (2003) Phase 2 prospective IS/TIA No a 55 64·0 1 55 18 3 (5%)Beaulieu-Boire (2013) retrospective IS/TIA No 284 NR 1 284 12 24 (8%)
37 An unknown number of additional cryptogenic stroke patients would be included in the non-selected cohorts.
MBS Review – Ambulatory Electrocardiography Review Report Page 133

May 2016
Ref IDPhase indicated where more than one cohort is extracted
Study design Event Crypto-genic only
N Mean age
(years)
Duration of
monitoring (days)
Patient-days of
monitoring
Patient-days of
monitoring per AF
Diagnostic yield: PSAFn (%)
Dogan (2012) retrospective IS No 400 69·0 1 400 10 40 (10%)Douen (2008) retrospective IS No 117 NR 1 117 39 3 (3%)Grond (2013) prospective IS/TIA No 1,135 67·0 3 3,405 69 49 (4%)Hornig (1996) retrospective IS/TIA No 266 59·1 1 266 27 10 (4%)Jabaudon (2004) Phase 2 retrospective IS/TIA No 139 NR 1 139 20 7 (5%)Lazzaro (2012) retrospective IS/TIA No 133 63·1 1 133 17 8 (6%)Ritter (2013) b Phase 2 prospective IS No 649 NR 1 649 108 6 (1%)Rizos (2012) prospective IS/TIA No 456 69·0 1 456 456 1 (<1%)Schaer (2009) retrospective IS No 145 NR 1 145 145 1 (1%)Suissa (2013) retrospective IS No 338 NR 1 338 169 2 (1%)Thakkar (2014) retrospective IS/TIA No 52 59·5 1 52 17 3 (6%)Wohlfahrt (2014) prospective IS/TIA No 224 NR 7 1,568 54 29 (13%)Yu (2009) retrospective IS No 96 74·0 1 96 11 9 (9%)Phase 3: outpatient HolterAlhadramy (2010) retrospective IS/TIA No 413 65·0 1 413 11 39 (9%)Dangayach (2011) retrospective IS Yes 49 58·2 6 294 23 13 (27%)Doliwa (2012) retrospective IS/TIA No 249 72·0 1 249 50 5 (2%)Fonseca (2014) prospective IS/TIA Yes 80 63·8 Up to 3 80 5 17 (21%)Gunalp (2006) NR IS No 23 66·0 1 23 3 8 (35%)Manina (2014) prospective IS/TIA Yes 114 63·1 4 456 16 29 (25%)Ritter (2013) Phase 3 prospective IS Yes 60 63·0 7 420 420 1 (2%)Schuchert (1999) prospective IS Yes 82 59·7 3 246 49 5 (6%)Shafqat (2004) retrospective IS No 196 66·8 1 196 39 5 (3%)Shibazaki (2012) prospective IS No 536 71·1 1 536 45 12 (2%)Tagawa (2007) prospective IS No 241 72·6 1 241 9 26 (11%)Vandenbroucke (2004) retrospective IS No 114 68·0 1 114 16 7 (6%)Yodogawa (2013) prospective IS No 68 69·9 3 204 12 17 (25%)Phase 4: MCTBhatt (2011) retrospective IS/TIA Yes 62 61·0 21 1,302 87 15 (24%)Kamel (2013) RCT IS/TIA Yes 15 65·0 21 315 NA 0 (0%)Miller (2013) retrospective IS/TIA Yes 156 68·5 21 3,276 121 27 (17%)Rabinstein (2013) prospective IS No a 128 66·0 21 2,688 108 25 (20%)Tayal (2008) retrospective IS/TIA Yes 56 66·0 21 1,176 90 13 (23%)Phase 4: ELRBarthelemy (2003) Phase 4 prospective IS/TIA No a 28 64·0 3 152 38 4 (8%)Elijovich (2009) retrospective IS/TIA Yes 20 68·0 30 600 150 4 (20%)Flint (2012) Registry retrospective IS Yes 236 64·6 25 5,782 199 29 (12%)Gladstone (2014) RCT IS/TIA Yes 280 72·5 30 8,400 191 44 (16%)Higgins (2013) RCT IS/TIA No 50 67·1 7 350 17 21 (42%)Jabaudon (2004) Phase 4 retrospective IS/TIA No 88 NR 7 616 123 5 (6%)Wallmann (2007) prospective IS No 127 61·5 21 2,667 148 18 (14%)Phase 4: ILRChristensen (2014) prospective IS Yes 85 56·7 569 48,365 3,455 14 (16%)Cotter (2013) prospective IS/TIA Yes 51 51·5 229 11,679 898 13 (25%)Dion (2010) prospective IS/TIA Yes 24 48·8 435 10,440 10,440 1 (4%)Etgen (2013) retrospective IS/TIA Yes 22 61·6 365 8,030 1,338 6 (27%)Merce (2013) retrospective IS/TIA Yes 14 65·6 870 12,180 2,436 5 (36%)Ritter (2013) Phase 4 prospective IS Yes 60 63·0 382 22,920 2,292 10 (17%)Sanna (2014) d RCT IS/TIA Yes 221 62·0 180 39,780 2,094 19 (9%)Abbreviations: ELR, event loop recorder; ILR, implantable loop recorder; IS, ischaemic stroke; MCT, mobile cardiac telemetry; NA, not applicable; NR, data not reported by original study; PSAF, post-stroke atrial fibrillation; TIA, transient ischaemic attack.a Results reported separately for cryptogenic stroke.b This data is attributed to Ritter (2013), but this study publication does not include any data for Phase 2 monitoring, and is for a different population (only cryptogenic versus unselected), and is much smaller (60 patients versus 649 patients). The authors of the current Review were not able to identify an alternative publication in the Sposato (2015) systematic review that describes this data.c Reported by Sposato (2015) as ELR, but the device is described by Wallman (2007) as an event recorder.d Six-month data shown here, but 12-month data also available and used in a sensitivity analysis.
Meta-analyses of diagnostic yieldMeta-analyses of diagnostic yield using a random effects model were performed for each of these four phases and for each of the subgroups. Heterogeneity was quantified using the χ2-
MBS Review – Ambulatory Electrocardiography Review Report Page 134

May 2016
based Q statistic (for between-study heterogeneity) and I2 (variation across a group of studies) and was found to be significant for all groups. This is not surprising in light of the differences between these studies with regard to included populations, diagnostic technologies, timing, and sequences of screening methods. Age and risk factors could not be adjusted for as they were not consistently reported across studies.
Table 5.3.83 shows the pooled estimates of diagnostic yield by group: corresponding forest plots are shown in Figure 5.3.20 to Figure 5.3.22.
Table 5.3.83 Sposato (2015): Pooled estimates of diagnostic yield for different monitoring groups
Phase Device Pooled diagnostic yield (%) [95% CI] Q statistic,p(Q) value a
I2
2 Inpatient Holter 4.5 [2.7, 6.7] 142 p<0.0001 89.4%
3 Outpatient Holter 10.7 [5.6, 17.2] 148 p<0.0001 91.9%
4 MCT 15.3 [5.3, 29.3] 14 p<0.007 71.4%
4 ELR 16.2 [9.3, 24.6] 28 p<0.0001 78.6%
4 ILR 16.9 [10.3, 24.9] 19 p<0.005 67.8%
4 Phase 4 combined 16.9 [13.0, 21.2] NR –Abbreviations: CI, confidence interval; ELR, event loop recorder, ILR, implantable loop recorder; MCT, mobile cardiac telemetry.a p-value for the Q statistic is significant if < 0.1.
Phase 2: Inpatient HolterFigure 5.3.20 shows the forest plot of diagnostic yield for inpatient Holter monitoring. The proportion of patients with AF detected was 4.5% [95% CI: 2.7, 6.7]. No patients had a diagnosis of cryptogenic stroke, presumably due to Holter being a prerequisite for the diagnosis of this condition. Two of the 16 cohorts were monitored for longer than 24 hours, but these constitute 29% of all patients. The authors commented that the diagnostic yield would probably have been lower if limited to 24 hours of monitoring.
Figure 5.3.20 Sposato (2015): Patients diagnosed with AF during in-hospital Holter (part of Phase 2)
Source: Sposato (2015), Figure 3, p4Abbreviations: AF, atrial fibrillation; PSAF, post-stroke atrial fibrillation; CI, confidence interval; IS, ischaemic stroke; TIA, transient ischaemic attack.X-axis is the proportion of patients diagnosed with AF; the first column of numbers is the number diagnosed with AF; second column is the number of patients. The proportion of patients with PSAF (95% CI) is shown to the right of the plot, followed by the weight attributed to the study in the analysis.
MBS Review – Ambulatory Electrocardiography Review Report Page 135

May 2016
Phase 3: Outpatient HolterThe diagnostic yield for outpatient Holter was 10.7% [95% CI: 5.6, 17.2]. Monitoring duration was longer than 24 hours in around half the studies (7 of 13 cohorts), but patients in these cohorts constitute the majority (80%) of patients in Phase 3.
The authors noted that for five cohorts, the diagnostic yield was substantially higher than the summary yield (diagnostic yield ranging from 21.3% to 34.8%). Four of these studies had a long duration of monitoring and three were in cryptogenic stroke cohorts, which the authors note may have inflated the yields.
Figure 5.3.21 Sposato (2015): Patients diagnosed with AF during outpatient Holter (Phase 3)
Source: Sposato (2015), Figure 5, p6Abbreviations: AF, atrial fibrillation; PSAF, post-stroke atrial fibrillation; CI, confidence interval; IS, ischaemic stroke; TIA, transient ischaemic attack.Note: Monitoring was typically for 24 hours. Exceptions include Dangayach (2011), 48 hours; Schuchert (1999), 72 hours; Manina (2014), 96 hours; Ritter (2013), seven days; Yodogawa (2013), 3 days; Fonesca (2014), up to 3 days.
Phase 4: MCT, ELR and ILRPhase 4 monitoring was usually in patients already screened with inpatient monitoring, or outpatient Holter, or both, making this population highly selected. The diagnostic yield for medium- to long-term devices, as a group, was 16.9% [95% CI: 13.0, 21.2]. The main analysis of ILR used the 6-month monitoring results from the CRYSTAL AF study (Sanna, 2014), the largest of the included studies of ILR. Using the 12-month monitoring results from this study increased the diagnostic yield of ILR to 17.8% [95% CI: 12.0, 24.6].
Figure 5.3.22 shows the forest plots of diagnostic yield for MCT (15.3% [95% CI: 5.3, 29.3]), ELR (16.2% [95% CI: 9.3, 24.6]), and ILR (16.9% [95% CI: 10.3, 24.9]). There were no statistically significant differences between individual devices (including the higher summary yield for ILR using 12-month CRYSTAL AF data). The authors commented this similarity in yield across the Phase 4 devices is not a surprising due to the pre-selection of patients with the same, earlier investigations. They make the comment that further study is necessary to assess the costs and benefits of using noninvasive monitoring (MCT, ELR) before invasive methods of monitoring (ILR).
MBS Review – Ambulatory Electrocardiography Review Report Page 136

May 2016
Figure 5.3.22 Sposato (2015): Patients diagnosed with AF using MCT, ELR or ILR (Phase 4)
Source: Sposato (2015), Figure 5, p6Abbreviations: AF, atrial fibrillation; ELR, event loop recorder; ILR, implantable loop recorder; IS, ischaemic stroke; MCT, mobile cardiac telemetry; PSAF, post-stroke atrial fibrillation; TIA transient ischaemic attack.
The relationship between the number of diagnoses and duration of monitoring was compared for MCT and ILR, as shown in the Kaplan-Meier plot in Figure 5.3.23 (insufficient data was available to include ELR in this analysis). At 21 days, 19.1% of patients using MCT (95% CI: 14·9, 24·1) and 9.6% of patients using ILR (95% CI: 7.5, 12.1) were diagnosed with post-stroke AF. After adjusting for age, sex, and time to initiation of monitoring, the detection of AF was 5.8 times more likely at 21 days using MCT than ILR; hazard ratio (HR) 5.8 [95% CI: 3.3, 10.2; p<0·0001]. The authors speculate the longer time from event to start of monitoring for ILR (twice as long as for MCT) may have led to the detection of fewer instances of AF. Also, patients undergoing ILR are likely to have undergone more thorough pre-screening for AF than those undergoing MCT, due to the invasive nature of the procedure. Therefore this analysis may be as much a comparison of populations as technologies.
MBS Review – Ambulatory Electrocardiography Review Report Page 137

May 2016
Figure 5.3.23 Sposato (2015): Days to detection of post-stroke AF with MCT and ILR, adjusted for age, sex and time to initiation of monitoring
Source: Sposato (2015) Figure 7, p 7Abbreviations: AF, atrial fibrillation; ILR, implantable loop recorder; MCT, mobile cardiac telemetry: PSAF, post-stroke atrial fibrillation; TIA, transient ischaemic attack.Note: Data were pooled from four studies for MCT (upper, blue line) and from six studies (lower, red line) for ILR.
Sequential combination of all four phasesSposato (2015) presented a probability tree showing estimates of the diagnostic yield that could be expected in a cohort of patients that progressed sequentially through each monitoring phase (Figure 5.3.24). The main meta-analyses provided the probability estimates of being diagnosed at each phase, and separate meta-analyses supplied probability estimates of patients progressing undiagnosed to the next phase. It was assumed all patients received an ECG on hospital admission.
MBS Review – Ambulatory Electrocardiography Review Report Page 138

May 2016
Figure 5.3.24 Sposato (2015): Sequential cardiac monitoring model showing probability of progression from one phase to the next
Source: Sposato (2015) Figure 6, p7Abbreviations: AF, atrial fibrillation.
After sequential screening, the overall proportion of this theoretical cohort diagnosed with AF was 23.7% [95% CI: 17.2, 31.0], of which half were diagnosed during in-hospital ECG (Phases 1 and 2), a further third during outpatient Holter (Phase 3) and one fifth during medium or long-term AECG (Phase 4; Table 5.3.84).
Table 5.3.84 Sposato (2015): Cumulative proportion of total diagnoses
Phase Monitoring Cumulative % of total diagnoses made by all ECG/AECG a
Incremental cumulative %
1 then 2 Admission ECG then inpatient ECG (including inpatient Holter)
50.2% –
1 then 2 then 3 Admission ECG then inpatient ECG then outpatient Holter
81.9% 31.7%
All 4 phases Admission ECG then inpatient ECG then outpatient Holter then medium- and/or long-term AECG
100% 18.1%
Abbreviations: AECG, ambulatory electrocardiography; ECG, electrocardiographya Results shown are proportions of the 23.7% [17.2, 31.0] of all admitted IS/TIA patients that were diagnosed with AF by some type of ECG.
The purpose of this analysis was to estimate how frequently AF can be detected in the post-stroke population, rather than just the mean yield for each diagnostic procedure. However, the authors of the current Review note this model does not necessarily reflect patterns of clinical management. For example, the proportion of patients that do not receive further investigation after failing to receive a diagnosis after a particular phase of testing may differ between this collection of studies and clinical practice in Australia. Also, patients do not necessarily progress through these tests in the order specified in these phases (e.g. Holter monitoring is not a prerequisite for MBS-funded ELR or ER: Items 11710 and 11711).
SafetySafety outcomes were not reported in this systematic review.
MBS Review – Ambulatory Electrocardiography Review Report Page 139

May 2016
Author conclusionsThe authors noted a number of limitations in their study. The stratification of devices into four phases is subjective, and the history of previous monitoring was not consistent between groups being compared. A large number of patients did not continue to Phase 4 monitoring, and those that did were highly selected for cryptogenic stroke. While this may reflect clinical practice, it prevents generalisations of these results to a less selected population. The clinical significance of short-duration AF (i.e. less than 30 seconds) is not known, nor is there consensus on the minimum duration of AF that requires anticoagulation.
In conclusion, the authors made the following points:
AF might be diagnosed in almost a quarter of patients with IS/TIA without known AF, and among patients with IS/TIA, overall prevalence of AF may be 40%.
It is not known whether cases of AF diagnosed within a few days post-stroke have similar risks of recurrent stroke as cases diagnosed many months after the cerebrovascular event.
Clinicians should plan the best available combination of post-stroke AF screening methods rather than selecting a single method.
Researchers should try to identify the optimum sequence of diagnostic methods rather than assessing the diagnostic yield of single technologies.
Efforts should be made to identify sequences of diagnostic methods that are cost-effective and achieve high diagnostic yields in the shortest possible time after stroke or TIA.
AF after cryptogenic stroke: Afzal (2015)The systematic review by Afzal et al (2015) investigated the detection of AF specifically in patients with cryptogenic stroke or TIA; studies that included patients without complete evaluation to rule out other causes of stroke were excluded. Eligible devices were ILRs or any wearable device. A total of 13 observational studies and three RCTs were identified for inclusion in the review. Four of the observational studies investigated two devices either sequentially or concurrently in the same set of patients.
Cohort characteristics and resultsTable 5.3.85 shows the study characteristics including criteria for AF, where defined, which ranges from 20 seconds to over two minutes. The findings are also reported here, including the proportion of patients in whom AF was detected and the time to AF detection.
MBS Review – Ambulatory Electrocardiography Review Report Page 140

May 2016
Table 5.3.85 Afzal (2015): Characteristics and findings of included studiesRef ID Devices n Age (years) mean ±SD Criteria for AF Time from event to
interventionDuration of monitoring (average days)
Time to AF detection (days)
% with AF
RCTs
Gladstone (2014) ELR vs Holter, 24h 557 ELR: 72.5 ± 8.5, Holter: 73.2 ± 8.8 ≥30 seconds 75.1 ± 38.6 days 30 7-14 (mean) 12.9 a
Sanna (2014) ILR vs conventional follow up b 441 AF: 61.6 ± 11.4 Control: 61.4 ± 11.3 >30 seconds 38.1 ± 27.6 days 180 84 (median) 7.5 a
Higgins (2013) c ELR (AT) vs usual care b 100 65.8 (12.3) 20 seconds <7 days 7 NR 16 a
Prospective
Manina (2014) d Holter, 96h 114 63.1 ± 15.1 ≥10 seconds <30 days 4 8.8 24.3
Barthelemy (2003) d ELR (AT) 28 64.0 ± 16.3 ≥30 seconds 10 ± 2 days 4 NR 14.3
Flint (2012) – registry ELR 236 64.6 ± 13.8 >30 seconds 29 (17–50) days 28 (20-30) 11.4 ± 8.6 11
Jabaudon (2004) d ELR (AT/PT) 88 66 (37–93); 72 (56–91) NR 55 hours 7 NR 5.7
Rabinstein (2013) MCT 64 67.9 ± 11.0 ≥30 seconds <3 months 21 3 (median)(range 0–20)
25
Christensen (2014) ILR 85 AF: 67; Non-AF: 54 >2 minutes 107 ± 117 days 569 ± 310 109 ± 48 16.1
Cotter (2013) ILR 51 51.5 ± 13.9 ≥2 minutes 174 (134) days AF: 50Non-AF:229
48 (0–154) median (range) 25.5
Etgen (2013) ILR 22 AF: 65.8 (CI: 45.3, 86.4)Non-AF: 60.0 (CI: 54.4,65.6)
NR < 2 weeks 365 152 (61.6–244.1)mean (CI)
27.3
Merce (2013) ILR 14 65.4 ± 10.9 NA NR >30 months NA 35.7
Ritter (2013) d ILR 60 63 years (IQR 48.5–72) ≥30 seconds 13 (IQR:10–65) 556 64 (1–556) median (range) 17
Rojo-Martinez (2013) e ILR 101 67 NA NR 281 ± 212 102 (26–240)median (range)
33.7
Retrospective
Elijovich (2009) ELR 20 68 ± 15 NR NR 30 166 (55–395) hrs 20
Tayal (2008) MCT 56 66 ± 11 ≥30 seconds 20 (1–122) days 21 (5–21) 7 (2–19) 5.3Abbreviations: AF, atrial fibrillation; AT; auto triggered; ; CI, confidence interval; ELR, event loop recorder; ILR, implantable loop recorder; IQR, interquartile range; MCT, mobile cardiac telemetry; NA, not applicable; NR, not reported; PT, patient triggered; RCT, randomised controlled trial; ; SD, standard deviation.Values are expressed as mean ±SD unless specified otherwise.a Difference in diagnostic yield between intervention and control groups.b Conventional follow up/usual care included almost no AECG in Sanna (2014), and ECG performed at the discretion of the investigator, which could include Holter monitoring, in Higgins (2013).c This study did not specify that patients had cryptogenic stroke. Brain imaging was required prior to inclusion in study.d These studies included comparisons with other tests in the same group of patients. Results for only one device were extracted by Afzal (2015).e Abstract only.
MBS Review – Ambulatory Electrocardiography Review Report Page 141

May 2016
Meta-analysis of RCTs for medium- to long-term monitoringThe three RCTs were combined in a meta-analysis of the likelihood of receiving a diagnosis of AF (Figure 5.3.25), comparing either ELR (Gladstone, 2014; Higgins, 2013) or ILR (Sanna, 2014) with routine follow up. Routine follow up comprised 24-hour Holter monitoring in Gladstone et al (2014) (with additional AECG used at the discretion of the physician), but Holter monitoring was rarely used 38 in Sanna et al (2014), and was used at the discretion of the investigator in Higgins et al (2013).
A pooled OR of 4.54 [95% CI: 2.92, 7.06] was found, favouring ELR/ILR. Despite the pooling of different classes of monitoring device, there was no heterogeneity between the trial results (I2 = 0%).
Figure 5.3.25 Meta-analysis of RCTs of AF detection post cryptogenic stroke
Source: Afzal (2015) Figure 2
Across all studies, the overall detection of AF with prolonged outpatient monitoring was 17.6% [95% CI: 12.5, 22.7]. A significantly higher detection rate was obtained using ILR (23.3% [95% CI 7.91, 19.32]39) compared to wearable devices (ELR, MCT and 96-hour Holter, 13.6% [95% CI: 13.83, 32.29]40; p < 0.05). The authors note that this finding is tempered by the inherent differences in study designs, duration of monitoring and patient populations in these two groups.
The authors of the current Review note this pooled diagnostic yield estimate of 23.3% is higher than that from the ILR RCT in the meta-analysis above: 8.6% (19/221; Sanna, 2014). This estimate is for 6-months follow up; at 12 months this increased to 13.1%, and to 19.0% by three years (see the following section on the CRYSTAL AF RCT).
Duration of monitoring required for detection of AF was reported in Afzal (2015), but the measure used was not specified (i.e. median or mean). For wearable devices, monitoring was required for 10 days (range; 7, 64) and for ILR, monitoring was required for 93 days (range; 48, 152). Age was found to be a risk factor for detection of AF in these studies, with the mean age of patients with AF (67.03 ±4.19 years) being higher than that in patients without AF (59.6 ±6.5 years; p = 0.03).
The authors concluded that prolonged monitoring results in increased detection of AF in patients with cryptogenic stroke (compared to routine follow up), and that the yield of AF detection appears to be higher with ILR compared to wearable monitoring devices. They also note the clinical implications of detection of subclinical AF are not known.
38 The CRYSTAL AF trial (Sanna, 2014) used AECG in only 12% of patients in the first 12 months (see the following section for more details about the comparators in the CRYSTAL AF and EMBRACE trials).
39 The confidence interval is not consistent with the point estimate, which is higher than the upper limit.40 The confidence interval is not consistent with the point estimate, which is lower than the lower limit.
MBS Review – Ambulatory Electrocardiography Review Report Page 142

May 2016
Safety of ILRThe authors of Afzal (2015) did not extract any safety data, but made the comment that ‘the review demonstrates that ILR is safe’. They also stated that the incidence of important clinical adverse outcomes, such as implantation site infection, was very low, quoting the publication for CRYSTAL AF RCT (Sanna, 2014).41
Additional RCT publications for AF after cryptogenic strokeAs discussed in Section 5.2.5, the literature search for Level II evidence identified four publications (Brachmann, 2016; Thijs, 2016; Choe, 2015 and Gladstone, 2015) that were not included in a systematic review/HTA (). These publications were all further analyses of two RCTs (CRYSTAL AF and EMBRACE) already identified in the included systematic reviews. The original RCT publications for these trials were not described in detail, abd this will be discussed here to provide context for the more recently published additional citations. The findings of the two original RCTs and the four subsequent publications are summarised in Table 5.3.86 (CRYSTAL AF) and Table 5.3.87 (EMBRACE).
CRYSTAL AF RCTThe CRYSTAL AF trial (Sanna, 2014) evaluated ILR versus conventional follow up for the detection of AF (>30 seconds) in patients at least 40 years of age with cryptogenic stroke or TIA. The index event must have occurred in the previous 90 days (the mean time between the event and randomisation was 38 ±27.6 days). Cryptogenic stroke was established, along with other tests, using 24 hours or more of ECG monitoring (Holter or telemetry). Patients with a history of AF were excluded.
Patients were randomised to ILR (N = 221) or control (N = 220) and were followed for up to 36 months. Patients assigned to ILR were scheduled to have the device inserted within 10 days of randomisation (208 received an ILR, 184 within 10 days).
Conventional follow up involved ECG monitoring performed at the discretion of the site investigator at scheduled and unscheduled visits. This consisted of AECG monitoring in only 8% of patients in the first six months, increasing to 12% by 12 months (non-ambulatory ECG was performed in 45% of patients by 12 months). Therefore a large majority of patients in the conventional follow-up group did not receive any AECG during the first 12 months of the study.
The results of the CRYSTAL AF trial are summarised in Table 5.3.86. The rate of AF detection was estimated with censored data (the Kaplan–Meier method was used, and comparisons between groups were made on an intention-to-treat basis with the use of a log-rank test). As a consequence, the AF detection rates reported here cannot be compared with the simple proportions reported as diagnostic yield in other studies (number with AF/number at start of study). However, the diagnostic yields have been calculated post hoc by the authors of the current Review, to allow a comparison of results across studies. Both sets of results are shown in Table 5.3.86.
At each time point reported (6, 12 and 36 months), the proportion of patients diagnosed with AF (censored data) was significantly higher in the ILR group compared to the control group (HR p <0.001 for 6, 12 and 36 months; see Table 5.3.86). The authors concluded that ILR is superior to conventional follow up for detecting AF after cryptogenic stroke.
41 The safety data for this RCT is extracted in the following section in which additional RCT publications are discussed.
MBS Review – Ambulatory Electrocardiography Review Report Page 143

May 2016
In the first 12 months, recurrent stroke or TIA occurred in 15 patients (7.1%) in the ILR group and 19 patients (9.1%) in the control group. Use of oral anticoagulants was 14.7% in the ILR group and 6.0% in the control group at 12 months (p = 0.007), by which time 97.0% of patients with AF were taking oral anticoagulants.
Adverse events were reported for the ILR group only. Five of the 208 inserted devices were removed due either to infection or pocket site erosion. The most common adverse events in this group were the following insertion site reactions: irritation/inflammation (4 patients; 1.9%), infection (3 patients; 1.4%), pain (3 patients; 1.4%).
The authors state that this study has a number of limitations, as follows:
It is unclear whether newly discovered AF was causally related to the index stroke, because not all strokes, even in patients with documented AF, are due to the arrhythmia.
The clinical significance of brief episodes of AF detected with the use of an ILR is unknown.
Not all episodes of AF can be accounted for, because the device has a limited memory, and once the storage capacity is met, data on the oldest episodes are discarded in order to record new episodes.
The Brachmann (2016) publication contains the three-year results for the primary outcome as previously published in Sanna (2014), as well as some previously unpublished data: AF detection rates at additional time points, recurrent stroke at 36 months; change in the use of oral anticoagulants at 36 months, and information about the ECG performed in the control arm during the second and third years of the study.
Table 5.3.86 shows the detection rates of AF at the additional time points of one month and 24 months along with the other time points. Statistical comparisons of these time points are not reported, but the trend is consistent with that seen for the time points in Sanna (2014).
The patient-relevant outcome of recurrent stroke at 36 months was reported: 20 in the ILR arm and 24 in the control arm by 36 months, representing 9.1% and 10.9% of the ILR and control arms, respectively.42 No statistical comparison of this outcome was presented, and the authors of Brachmann (2016) note that this study is not powered to detect a between-group difference for this outcome. The AF status of the patients with recurrent stroke was not reported.
The proportion of patients on oral anticoagulant therapy was compared between groups and found to be statistically significantly higher in the ILR group at each time point (denominators were censored at each time point, making the proportions at the end of the study quite high). The baseline proportions taking anticoagulants was not reported, but almost all patients diagnosed with AF started taking anticoagulant therapy (97% by 12 months, remaining high at 91% by 36 months).
Brachmann (2016) also reported the number of ECG tests used in the control group for each of the three years of the study (but not the number of patients receiving the test43), and the use of Holter monitoring remained infrequent through the final two years of the study.
42 Post hoc calculation by the authors of the current Review, using the number of randomised patients as the denominator.43 As reported in Sanna (2014), some patients received repeat testing, so the number of tests is greater than the number of
patients tested.
MBS Review – Ambulatory Electrocardiography Review Report Page 144

May 2016
Brachmann and colleagues state that this study has a number of limitations, as follows:
It was not powered to evaluate the rate of recurrent stroke after the index cryptogenic stroke.
It is unclear whether newly detected AF of short or long duration was related to the index stroke.
The ILR device has a two-minute detection window, which may have resulted in missing AF episodes of less than two minutes.
The algorithm for detection of AF is not infallible, though the accuracy for quantifying the duration of AF is reported to be 98.5%.
Choe (2015) evaluated the sensitivity and NPV of simulated external monitoring techniques based on a cohort from the ILR arm of the CRYSTAL AF trial. Simulated single-session and periodic monitoring strategies (short term and medium term) were compared to long-term monitoring in 168 ILR patients. Single-session monitoring included 24-hour Holter, 48-hour Holter, 7-day Holter, 21-day ELR, and 30-day ELR.44 Periodic monitoring consisted of quarterly 24-hour Holter, 48-hour Holter, or 7-day Holter, and monthly 24-hour Holter.
According to the simulation, for a single-session monitoring period the sensitivity for AF diagnosis was lowest with a 24-hour Holter (1.3%) and highest with a 30-day event recorder (22.8%). For periodic monitoring strategies, quarterly 24-hour Holter monitoring had the lowest sensitivity (3.1%), whereas quarterly 7-day Holter monitoring had the highest sensitivity (20.8%). Long-term ILR monitoring was superior in both sensitivity and NPV for the detection of AF compared to all Holter/ELR monitoring strategies evaluated (p <0.001).
Choe and colleages state that this study has a number of limitations, as follows:
The analysis was restricted to patients with at least 345 days of data to simulate the longest monitoring scenario of 12 monthly 24-hour Holters.
Although time to the first episode of AF, defined as more than 30 seconds in duration, was considered the primary end point of the CRYSTAL AF trial, the devices used in this study are unlikely to register an AF episode less than two minutes based on the requirements of the AF detection algorithm (as stated for Brachmann, 2016 and Thijs, 2016).
For the purposes of the simulation, 100% patient compliance with external monitoring was assumed, which may have overestimated the simulated monitoring results. It has been shown that patient compliance diminishes as the nominal monitoring duration increases, owing to concerns regarding skin irritation and the inconvenience associated with performing activities of daily living.
Thijs et al (2016) assessed predictors of AF in cryptogenic stroke patients who received an ILR as part of the CRYSTAL AF trial. The authors report that significant univariate predictors of AF at 12 months included age, CHADS2 score, PR interval, premature atrial contractions, and diabetes. In multivariate analysis, age (HR per decade 1.9 [1.3–2.8], p=0.0009) and PR interval (HR 1.3 [1.2–1.4], p <0.0001) remained significant and together yielded an area under the receiver-operating characteristic curve of 0.78 (0.70–0.85). The same predictors were found at 36 months.
44 Choe et al (2015) specified ‘event recorder’ without reference to looping capacity. It is assumed an event recorder with automatic activation would be an appropriate equivalent to ILR, which implies an ELR.
MBS Review – Ambulatory Electrocardiography Review Report Page 145

May 2016
The findings of the primary publication for the CRYSTAL AF RCT (Sanna, 2014) and two of the subsequent publications identified in the literature search (Brachmann, 2016; Choe, 2015) are summarised in Table 5.3.86.
Table 5.3.86 Findings of the CRYSTAL AF RCT and recently published analysesOutcome Findings
Sanna (2014) – Primary publicationAF detection (Kaplan-Meier analysis and proportion of patients with AF)
6 months12 months36 months
ILR CTRL ILR CTRLKaplan-Meier analysis HR [95% CI] (N = 221) (N = 220)
n (% K-M) a n (% K-M) a % of N % of N19 (8.9) 3 (1.4) 6.4 [1.9, 21.7] 8.6 1.429 (12.4) 4 (2.0) 7.3 [2.6, 20.8] 13.1 1.842 (30.0) 5 (3.0) 8.8 [3.5, 22.2] 19.0 2.3
p < 0.001 for each HR
Median time to AF [IQR]6 months12 months36 months
ILR CTRL41 d [14, 84] 32 d [2, 73]84 d [18, 265] 53 d [17, 212]8.4 m b[NR] 2.4 m b [NR]
Recurrent stroke/TIA (patients)12 months
ILR CTRL15 (7.1%) 19 (9.1%)
Conventional follow-up tests (% patients) c
0-6 months6-12 monthsTotal
ECG Holter ER d AF (n)30.0% 7.7% 0.5% 315.0% 4.5% 0% 145.0% 12.3% 0.5% 4Yield by device not reported.
% of patients on anticoagulants Reported in Sanna (2014) for 6 and 12 months, see results from Brachmann (2016) below.
Author’s conclusions ECG monitoring with an ILR was superior to conventional follow up for detecting AF after cryptogenic stroke. AF after cryptogenic stroke was most often asymptomatic and paroxysmal and thus unlikely to be detected by strategies based on symptom-driven monitoring or intermittent short-term recordings.
Brachmann (2016) – Additional outcomes
AF detection (incl. additional time points not in Sanna, 2014)1 month (new data)6 months12 months (*n=26 instead of 29 for ILR)24 months (new data)36 months
ILR CTRL ILR CTRLn (% K-M) a n (% K-M) a % of N % of N8 (3.7) 1 (0.5) 3.6 0.5
19 (8.9) 3 (1.4) 8.6 1.426* (12.4) 4 (2.0) 11.8 1.838 (21.1) 5 (3.0) 17.2 2.342 (30.0) 5 (3.0) 19.0 2.3
Recurrent stroke/TIA (patients)36 months
ILR CTRL20 24
% of patients on anticoagulants (N censored at each time point)6 months12 months24 months36 months
ILR CTRL Difference [95% CI]% (N) % (N)10.1 (208) 4.6 (197) 5.5 [0.5, 10.6] p = 0.037514.7 (197) 5.9 (185) 8.8 [2.8, 14.8] p = 0.006926.1 (88) 5.6 (89) 20.5 [10.2, 30.9] p = 0.000238.5 (26) 8.3 (24) 30.1 [8.4, 51.8] p = 0.0195
% of patients with AF on anticoagulants (in ILR group) e
6 months12 months24 months36 months
% (n/N)
94.7 18/1996.6 28/29 f
92.3 36/39 f
90.5 38/42
Conventional follow-up tests (no. of tests)0-12 months12-24 months24-36 monthsTotal
ECGs Holter ER AF (patients) yield by device not reported122 32 1 462 14 0 119 6 0 0203 52 1 5See Sanna (2014) for number of patients receiving each test in the first 6 and 12 months.
Authors’ conclusions Three-year monitoring by ILR in cryptogenic stroke patients demonstrated a significantly higher AF detection rate compared with routine care. Given the frequency of asymptomatic first episodes and the long median time to detection, these findings highlight the limitations of using traditional AF detection methods. The majority of patients with AF were prescribed oral anticoagulation therapy.
MBS Review – Ambulatory Electrocardiography Review Report Page 146

May 2016
Outcome Findings
Choe (2015) – Post hoc analysis
Simulated AECG (12-months follow up)One-time monitoringLowest sensitivity: Holter, 24hHighest sensitivity: 30-day ELRRepetitive monitoringLowest sensitivity: Quarterly Holter, 24hHighest sensitivity: Quarterly Holter, 7 days
Sensitivity (%) NPV (%) (ILR as reference standard; N=168)
1.3 82.322.8 85.6
3.1 82.620.8 85.3
ILR vs any simulated short- or medium-term monitoring
p <0.001 for both sensitivity and NPV of: 24h Holter once; 24h Holter monthly; 24h Holter quarterly 48h Holter once; 48h Holter quarterly 7-day Holter once; 7-day Holter quarterly 21-day ELR; 30-day ELR
Authors’ conclusions Long-term continuous ECG monitoring with ILRs is significantly more effective than any of the simulated [shorter-term] monitoring strategies for identifying AF in patients with previous cryptogenic stroke.
Abbreviations: AECG, ambulatory electrocardiogram; AF, atrial fibrillation; CHADS2 score, tool for assessing stroke risk in patients with AF; CI: confidence interval; CTRL, control; d, days; ECG, electrocardiogram; ELR, external loop recorder; ER, event recorder (looping capacity not specified); HR, hazard ratio; ILR, implantable loop recorder; incl., including; IQR, interquartile range; ITT, intention-to-treat; K-M, Kaplan-Meier; m, months; NPV, negative predictive value; RCT, randomised controlled trial.a The rate of AF detection was estimated with the use of the Kaplan-Meier method and was compared between groups on an ITT basis with the use of a log-rank test. This is in contrast to the simple proportions of the ITT population reported in other studies. Numbers of patients with AF were used post hoc to calculate simple proportions of the randomised groups, allowing comparison with other studies.b Median months to AF reported for 36-month follow up taken from Brachmann (2016).c Proportions calculated post hoc. Totals calculated by summing the two 6-month periods (totals match those for 0-12 months reported by Brachmann (2016) so it appears patients monitored during first six months were not monitored again during second six months).d Sanna (2014) reports an event recorder (ER), with no mention of looping capacity.e Numerators calculated post hoc.f Denominator differs by one from that reported above for primary outcome.
EMBRACE RCTThe EMBRACE RCT (Gladstone, 2014) was a multicentre trial that evaluated ELR versus conventional follow up (24-hour Holter) in patients at least 55 years of age with cryptogenic stroke or TIA occurring in the previous six months (the mean time from stroke event to randomisation was 75.1 ±38.6 days). Cryptogenic stroke was established using the TOAST criteria45 after standard workup by a neurologist, including at least 24 hours of Holter monitoring. Patients with a history of AF were excluded.
Patients could be randomised to ELR (N = 287) or one additional round of Holter monitoring (N = 285) and were followed up for 90 days. The ELR device was auto triggered only and data were transmitted trans-telephonically. Patients were asked to wear the monitor as much as possible for 30 days, and if AF was detected patients could stop wearing the monitor (85% of patients completed three or more weeks of ELR, and 61.7% completed four weeks).
At the discretion of their clinician, patients could receive additional AECG not specified in the protocol. In the control group, ex-protocol AECG included 24/48-hour Holter (25 patients, detecting AF in one patient) and ELR (five patients, detecting AF in one patient) within the 90-day follow-up period. While the primary outcome included AF detected by these methods, some secondary outcomes excluded findings from ex-protocol devices, and in no instances did this change the overall findings.
The findings of the EMBRACE RCT are shown in Table 5.3.87. Compared to 24 hours of Holter monitoring, up to 30 days of ELR detected a significantly greater number of AF cases of at least 30 seconds duration (primary outcome,46 p <0.001) and of at least 2.5 minutes duration (secondary outcome, p <0.001), by 90-day follow up. Change in patient management
45 Classification of subtypes of acute ischaemic stroke using criteria developed for the trial of Org 10172 in Acute Stroke Treatment (TOAST).
MBS Review – Ambulatory Electrocardiography Review Report Page 147

May 2016
also showed a statistically significant difference between the two groups by 90 days post randomisation, with more patients starting either anticoagulant or antiplatelet therapy after ELR compared with an additional 24 hours of Holter monitoring (p = 0.01; p = 0.006, respectively). More patients in the ELR arm also changed from antiplatelet to anticoagulant therapy than did patients in the control group (p <0.001).
The authors concluded that ELR for 30 days is superior to the standard practice of short-term Holter monitoring for the detection of AF in patients with cryptogenic stroke/TIA. No safety outcomes were reported.
The authors state that the EMBRACE RCT has a number of limitations, as follows:
The total burden of AF per patient could not be determined, owing to the limitations of device and study design.
Overall AF prevalence may be underestimated due to starting monitoring relatively late in many patients, severe stroke being under-represented in the study, and not rigorously testing patients for cryptogenic stroke, potentially reducing the proportion of patients with AF.
A post hoc analysis of the EMBRACE RCT (Gladstone, 2015) evaluated patients enrolled in the intervention arm (ELR) for an association between baseline variables and subsequent AF detection. Variables tested were limited to the following: atrial premature beats (APBs) per 24-hour Holter immediately after index stroke/TIA; non-sustained atrial tachycardia per 24-hour Holter; age; and left atrial enlargement (by echocardiography).
The authors concluded that among older cryptogenic stroke or TIA patients, the number of APBs on a routine 24-hour Holter ECG was a strong dose-dependent independent predictor of prevalent subclinical AF. Those with frequent APBs have a high probability of AF and represent ideal candidates for prolonged ECG monitoring for AF detection. The other outcomes tested did not predict AF.
Table 5.3.87 Findings of the EMBRACE RCTOutcome Findings
Gladstone (2014) – Primary publicationAF detection (Proportion of patients with AF at 90-day follow up)
≥30 seconds a
≥ 2.5 minutes b
ELR (N = 287) CTRL (N = 285) Absolute difference [95% CI]n/N (%) n/N (%) 45/280 (16.1) 9/277 (3.2) 12.9 [8.0, 17.6] p <0.00128/284 (9.9) 7/277 (2.5) 7.3 [2.6, 20.8] p <0.001
% taking therapy (90-day follow up)
Anticoagulant therapy taken at 90 daysAntiplatelet therapy only taken at 90 daysChange in management by 90 daysFrom antiplatelet to anticoagulant therapyFrom anticoagulant to antiplatelet therapy
ELR CTRL Absolute difference [95% CI]n/N (%) n/N (%) 52/280 (18.6) 31/279 (11.1) 7.5 [1.6, 13.3] p = 0.00223/280 (79.6) 246/279 (88.2) -8.6 [-14.6, -2.5] p = 0.006
38/280 (13.6) 13/279 (4.7) 8.9 [4.2, 13.6] p <0.0013/280 (1.1) 2/279 (0.7) 0.4 [-1.2, 1.9] p = 0.66
46 Primary outcome included AF detected by monitors not specified in the study protocol i.e. those prescribed clinically (see Table 5.2.67 footnotes for a description of this ex-protocol monitoring). However, the difference between groups in the detection of AF of ≥30 seconds by study monitors only was also statistically significant.
MBS Review – Ambulatory Electrocardiography Review Report Page 148

May 2016
Outcome Findings
Authors’ conclusions Among patients with a recent cryptogenic stroke or TIA, noninvasive AECG monitoring for a target of 30 days significantly improved the detection of AF by a factor of more than five and nearly doubled the rate of anticoagulant treatment, as compared with the standard practice of short-duration ECG monitoring.
Abbreviations: abs, absolute; AC, anticoagulant; AECG, ambulatory electrocardiogram; AF, atrial fibrillation; AP, antiplatelet; CI: confidence interval; CTRL, control; diff, difference; ECG, electrocardiogram; ELR, external loop recorder; RCT, randomised controlled trial; TIA, transient ischaemic attack.a Primary outcome: in patients for whom the AF status could be assessed (i.e. patients with cardiac monitoring by study monitors or ex-protocol monitors) by 90-day follow up.b Secondary outcomes: AF detected using study monitors in patients with any duration of monitoring.
Post-ablation AFThe literature search of the Medline and EMBASE databases identified one publication (Kapa, 2013) in a patient population not previously identified in the systematic reviews/HTAs: AF after ablation. In the ABACUS trial, Kapa (2013) evaluated whether long-term monitoring using an ILR would enhance the ability to detect AF and/or organised atrial tachyarrhythmias (OATs) compared with conventional monitoring after AF catheter ablation. Conventional monitoring involved 30-day TTM, which is referred to here as ELR.
Of the 44 enrolled patients, 43 received an ILR immediately after ablation, and a further five were explanted or withdrew, leaving 38 patients in the study cohort. For the first six months, all 38 patients underwent conventional monitoring (twice daily one-minute pulse rate assessment and 30-day ELR at discharge and at five months post ablation) plus remote transmission of ILR data every 31 days. Over this period, clinical decisions were made based on conventional monitoring. Subjects were then randomised for the remaining six months to either arrhythmia assessment and management by ILR (N = 20) or conventional monitoring (twice daily one-minute pulse rate assessment and 30-day ELR at 11 months post ablation; N = 18). Patients were followed up for one year.
Over the study period, six patients withdrew. The authors found that during the first six months, AF was detected in significantly more patients with ILR compared to conventional monitoring, but no difference was found in the second six-month period. In the first six months, AF was detected by conventional monitoring in seven patients, and by ILR in these same seven plus a further 11 patients (p = 0.002). The 11 patients detected with ILR only had a significantly lower AF burden (p = 0.01) and a shorter AF duration (p = 0.04) than those detected with both strategies.
During the second six-month period, five patients in the conventional monitoring group refused to wear the ELR (none of whom experienced AF, as confirmed with the ILR). Of the remaining 13 patients in this arm, AF was detected by ELR (and confirmed with ILR) in five patients (28% of 18 patients). AF was detected in five patients in the ILR arm (25% of 20).
AF was falsely diagnosed frequently by ILR over the 12-month study period (730 of 1,421 episodes; 51%; adjudicated by electrophysiology). However, most patients with false AF also experience true AF, and exclusively false AF detection (without any true AF) occurred in only five patients (13% of study cohort).
Over the 12 months of the study, significantly more patients in the ILR arm underwent change in patient management compared with the conventional monitoring arm, with regard to rate control agents (60% vs 39%, p = 0.02) and antiarrhythmic drugs (71% vs 44%, p = 0.04). As shown in Figure 5.3.26, the between-group difference was larger in the second six months than in the first six months. The authors comment this is likely because
MBS Review – Ambulatory Electrocardiography Review Report Page 149

May 2016
comprehensive monitoring via ILR may have made the clinical team more comfortable in stopping these drugs if no arrhythmia recurrences were seen
Figure 5.3.26 Kapa (2013): Proportion of patients in each study arm taking antiarrhythmic drugs
Source: Kapa (2013), Figure 4.Abbreviations: AAD, antiarrhythmic drugs; ILR, implantable loop recorder.
The authors concluded that ILR can detect more arrhythmias than conventional therapy and with adequate oversight, ILRs may be useful in monitoring patients after ablation. However, false detection remains a challenge. The authors report several limitations for this study, as follows:
The trial was designed as a pilot study and thus the number of patients included was small (N = 38 randomised). Furthermore, there was a significant dropout rate (14%).
The study occurred in two phases – an initial six-month non-randomised phase followed by a six-month randomised phase. Because of this design, assessment of the two monitoring strategies with respect to clinical management of patients was relegated to the second half, which may have been too short a duration for making this comparison.
Given the non-compliance of patients with ELR, the ability of ILR to offer incremental benefit in identifying patients with AF recurrence may be overstated. However, non-compliance with ELR is a reality in clinical practice and the study highlights this point.
5.3.3 Evaluation of syncope
The key review for syncope is the HTA supporting the NICE Clinical Guidance for TLoC (Westby, 2010). Two independent systematic reviews within the HTA provide clinical evidence relevant to the current Review, and referred to here as Westby (2010) and Westby (2010-Pacing). Evidence from the subsequent update to this HTA (NICE, 2012) is reported separately.
MBS Review – Ambulatory Electrocardiography Review Report Page 150

May 2016
TLoC and syncope are used interchangeably within the NICE guideline/HTA. For consistency within the current Review, the term syncope will substitute instances of TLoC in the HTA (Westby, 2010).
The Westby (2010) evidence review investigated the value of further diagnostic tests for patients without a firm diagnosis after initial assessment (primary care, emergency departments, paramedic services, walk-in clinics etc.). Secondary tests such as AECG are assumed to form part of the workup during specialist care. The initial assessment is expected to identify patients with orthostatic hypotension, an uncomplicated faint, or definite epileptic seizures. The secondary investigations forming the focus of the Westby (2010) review are concerned with diagnosing the following possible causes of syncope:
suspected cardiac arrhythmic cause; suspected neurally mediated syncope and suspected carotid sinus syncope; or unexplained syncope (which may include possible psychogenic seizures and possible
epileptic seizures).
The Westby (2010-Pacing) review investigated whether tests such as AECG can be used to identify patients who may benefit from pacing therapy. It is assumed that this population includes people with a cardioinhibitory form of either neurally mediated syncope or carotid sinus syncope (patients with vasodepression are assumed not to benefit from a pacemaker).
The results of these two evidence reviews within the NICE guideline (CG109) are presented in turn in this section. Results from Westby (2010) are presented in two parts (comparative diagnostic studies and observational diagnostic studies), while the single included study in Westby (2010-Pacing) is presented in a third section. Adverse events are reported following the efficacy results.
Comparative diagnostic studies: Westby (2010)Three AECG RCTs are included in the Westby (2010) review. Farwell (2006) and Krahn (2001a) both compare ILR with conventional testing. Rockx (2005) compares 48h Holter with ELR. These studies were classified by Westby (2010) as the population ‘unexplained syncope after secondary tests’. Results from these studies are presented below.
ILR versus conventional testing – meta-analysisTwo RCTs investigated ILR compared with conventional testing: a larger RCT of 201 subjects (Farwell, 2006; automatic- or patient-triggered ILR) and a smaller study of 60 patients (Krahn, 2001a; patient-triggered ILR).
Of note, only the smaller study (Krahn, 2001a) was included in the 2003 MSAC Assessment Report of ILR for unexplained recurrent syncope. The authors of the MSAC Assessment Report commented on the limited evidence of the effectiveness of ILR compared with ELR, stating that Krahn (2001a) was not optimally designed to compare ILR with conventional monitoring, primarily due to a longer follow up for patients in the ILR arm along with the relatively early crossover of patients from conventional testing to ILR.
The comparator arms of both RCTs was conventional testing but this testing varied. In Krahn (2001a), conventional testing included ELR, TT and electrophysiology tests for all patients while in Farwell (2006), up to 38% of patients had AECG (28 ELR and 11 Holter tests performed in 98 patients). The authors noted the Farwell (2006) study was partly funded by Medtronic Inc. and that three of the authors of Krahn (2001a) were consultants to Medtronic Inc.
MBS Review – Ambulatory Electrocardiography Review Report Page 151

May 2016
Diagnostic yieldA meta-analysis of these two studies is shown in Figure 5.3.27. A significantly larger diagnostic yield, defined as a diagnoses achieved, is observed for ILR compared to conventional testing, with a risk ratio (RR) of 4.27 [95% CI 2.46, 7.41]. The six diagnoses achieved in the conventional arm of Krahn (2001a) were made using ELR (one patient), TT test (two patients) or electrophysiology tests (three patients).
Figure 5.3.27 Westby (2010): Diagnostic yield (diagnoses achieved) for ILR versus conventional testing
Source: Westby (2010), Figure 5-13, pp267Abbreviations: CI, confidence interval; IER, implantable event recorder (ILR); ILR, implantable loop recorder.
Time to ECG-diagnosis data was compared in the two groups by Farwell (2006), with a HR of 6.53 [95% CI 3.73, 11.4] for ILR versus conventional testing (there was no significant difference between groups for the time to first syncope).
The Krahn (2001a) study allowed for crossover of patients undiagnosed by conventional tests to ILR (and vice versa). There was no significant difference between the two groups – ILR (no diagnosis) then conventional tests versus conventional test (no diagnosis) then ILR – as shown in Figure 5.3.28.
Figure 5.3.28 Westby (2010): Diagnostic yield for undiagnosed patients who crossed over to other strategy
Source: Westby (2010), Figure 5-14, pp268Abbreviations: CI, confidence interval; IER, implantable event recorder (ILR); ILR, implantable loop recorder.
Time to second syncopeFarwell (2006) reported the time to second syncope recurrence, capturing the impact of treatment as a consequence of diagnosis. The Kaplan-Meier plot showed a divergence between groups after around 300 days, with patients receiving a diagnosis after ILR taking significantly longer to experience a further syncope compared to the conventional tests group (p = 0.04).
Quality of lifeA general well-being VAS was used to measure QoL in Farwell (2006): a statistically significant difference between groups was observed at 18-month follow up, with greater
MBS Review – Ambulatory Electrocardiography Review Report Page 152

May 2016
improvement in QoL in the ILR group (p = 0.03). No significant difference between groups was detected using the SF-12 questionnaire.
Holter, 48h, versus ELR – single studyThe Rockx (2005) RCT compared 48-hour Holter monitoring with patient-activated47 ELR in 100 patients with syncope or presyncope referred to a hospital-based monitoring unit. The frequency of prior symptoms was low (two per year), which the authors of Westby (2010) noted was not the appropriate population for a Holter monitor. A design similar to that in Krahn (2001a) was used, with patients undiagnosed by one test48 offered the option of crossing over to the other test.
Figure 5.3.29 shows diagnostic yield (AECG recording during syncope, with or without arrhythmia) after the first phase of monitoring. Patients using an ELR were significantly more likely to have captured an ECG during syncope at the end of the first phase than were patients using the 48-hour Holter (RR 2.69 [95% CI: 1.57, 4.61]).
Of the group randomised to ELR, 35 patients completed both phases of this study and 35 received a diagnosis (100%). Of the group randomised to Holter, 41 patients completed both phases and only 25 received a diagnosis (61%; RR 1.46 [95% CI: 1.05, 2.03]; Figure 5.3.29). The authors of the current Review noted that this suggests possible imbalance in patient characteristics between the two arms in this study.
Figure 5.3.29 also shows a comparison of Holter followed by ELR versus ELR alone. There is no statistical difference between these groups, suggesting no additional benefit from 48-hour Holter monitoring.
Figure 5.3.29 Westby (2010): Diagnostic yield for ELR versus 48h Holter monitoring
Source: Westby (2010), Figure 5-15, pp269Abbreviations: CI, confidence interval; ELR, event loop recorder; EER, external event recorder (same as ELR).
47 Activation type not reported by Westby (2010) but neither by Rockx (2005) – assumed to be patient-activated as failure of patient to activate is a reason for no diagnosis.
48 No recurrence of syncope or, for ELR, failure to activate device.
MBS Review – Ambulatory Electrocardiography Review Report Page 153

May 2016
Observational diagnostic studies: Westby (2010)Table 5.3.88 lists the 37 AECG studies that provide single group/case series evidence used in Westby (2010). A further three observational studies were included, but no data from these studies was identified in Westby (2010).
Four of the 37 studies are RCTs, from which cohorts have been extracted and added to the analyses of observational studies. The Rockx (2005) RCT compared two AECG tests, and both arms were extracted. Both Farwell (2006) and Krahn (2001a) compared ILR and conventional testing, and the ILR arms of these RCTs are used here. These three RCTs were discussed in the previous section of the current Review. Rothman (2007) is an RCT comparing ELR with an out-of-scope test (MCT); the ELR arm data was extracted and used as a single group.
As shown in Table 5.3.88, data from these 37 studies were categorised into the following four population groups for analysis:
A. Suspected arrhythmic causeB. Suspected neurally mediated syncope on the basis of the initial assessmentC. Unexplained cause on the basis of the initial assessmentD. Unexplained cause following secondary tests (e.g. TT test)
A large proportion of the studies investigated ILR (21 studies), and many of these are in patients with unexplained syncope after secondary tests (14 studies). Ten of the observational studies were published after the 2003 MSAC Assessment Report of ILR for unexplained recurrent syncope.49
Most of the Holter studies are in patients with suspected arrhythmia. Data for ELR is extracted from only five studies, almost exclusively in patients with unexplained syncope.
Table 5.3.88 Westby (2010): Population groups for AECG studiesStudy ID Device A
Suspected arrhythmia
B
Suspected neurally mediated
C
Unexplained after initial tests
D
Unexplained after secondary tests a
Cohorts from RCTsFarwell (2006) ILR (AT/PT) Rockx (2005) ELR vs 48h Holter Rothman (2007) ELR Krahn (2001a) ILR Observational studiesHolterAronow (1993) 24h Holter Brembilla-Perrot (2001) 24h Holter Brembilla-Perrot (2004a) 24h Holter Brembilla-Perrot (2004b) 24h Holter Comolli (1993) 24h Holter Lacroix (1981) 24h Holter Sarasin (2005) 24h Holter Arya (2005) 48h Holter Fitchet (2003) 48h Holter Ringqvist (1989) 48h Holter Kapoor (1991) 72h Holter ELRFogel (1997) ELR Linzer (1990) ELR Schuchert (2003) ELR
49 MSAC recommended that on the strength of evidence pertaining to the safety, effectiveness and cost-effectiveness of ILR for unexplained syncope, public funding should be supported for this procedure in patients with recurrent syncope who have had appropriate prior investigations. MBS item number 38285 was created on 1 November 2004.
MBS Review – Ambulatory Electrocardiography Review Report Page 154
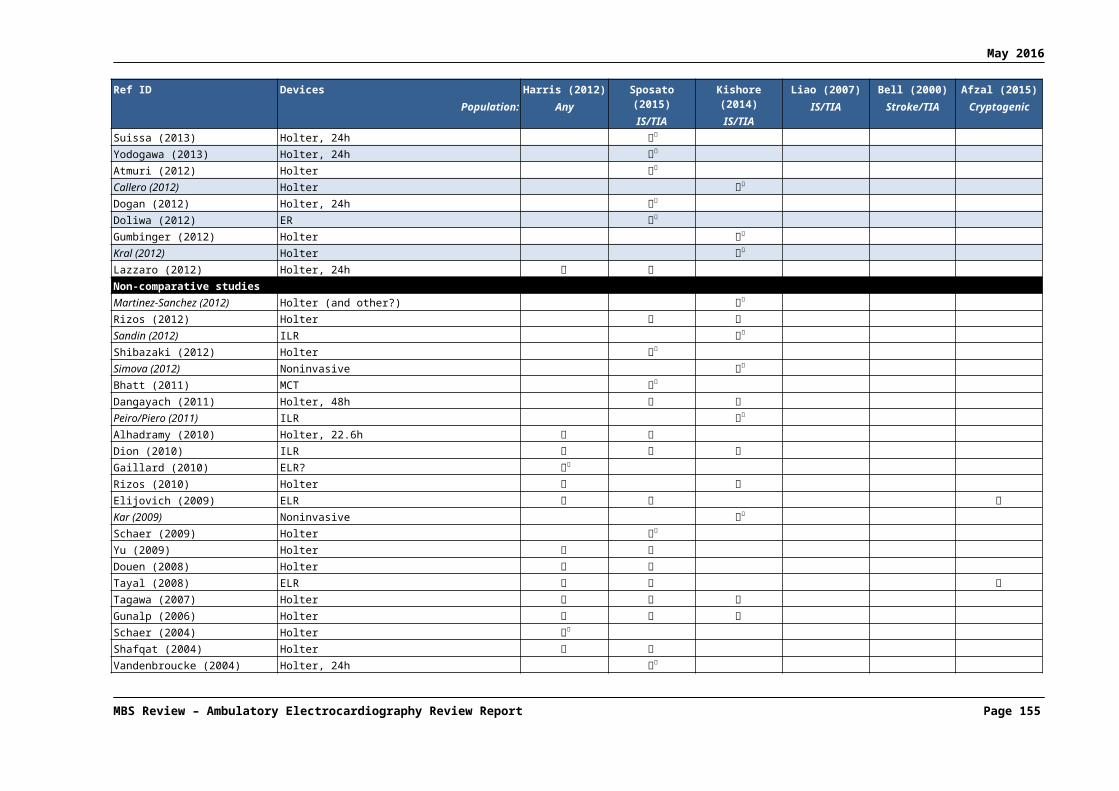
May 2016
Study ID Device A
Suspected arrhythmia
B
Suspected neurally mediated
C
Unexplained after initial tests
D
Unexplained after secondary tests a
Observational studiesILRBoersma (2004) ILR (AT/PT) c
Brignole (2001) ILR (PT) Brignole (2005) ILR (AT/PT) Brignole (2006) IRL (AT/PT) Deharo (2006) IRL (AT/PT) Donateo (2003) ILR (PT) c
Ermis (2003) ILR (AT/PT) Garcia-Civera (2005) ILR (PT) Krahn (1998) ILR (PT) Krahn (1999) ILR (PT) Krahn (2002) ILR (PT) Krahn (2004) ILR (AT/PT) Lombardi (2005) ILR (AT/PT) Menozzi (2002) ILR (PT) Moya (2001) ILR (PT) Nierop (2000) ILR (PT) c
Pezawas (2007) ILR (AT/PT) Pierre (2008) ILR (AT/PT) Seidl (2000) ILR (PT) Included, no data shownBoudoulas (1979) b 24h Holter Boudoulas (1983) b 24h Holter Sarasin (2001) 24h Holter, ELR Abbreviations: AT, auto triggered; ELR, event loop recorder; ILR, implantable loop recorder; PT, patient triggered; RCT, randomised controlled trial.a This group is similar to the ‘unexplained after initial tests’ population, but with results of secondary tests available.b No AECG data from either Boudoulas (1979) or Boudoulas (1983) is reported in Westby (2010). The treadmill data from Boudoulas (1979) is included elsewhere in Westby (2010). c These studies did not exclude patients with a positive tilt table test (i.e. similar to group C but with tilt status known.
It was noted by the authors of Westby (2010) that diagnostic yield was defined differently by different authors. They found the most useful information to extract was the separate outcomes, rather than an overall diagnostic yield. For each of the four patient populations, the following outcomes were extracted: number of patients with no syncope during AECG monitoring; number of patients with an ECG showing normal rhythm and rate during syncope; number of patients with an ECG showing arrhythmia during syncope; number of patients with an ECG showing arrhythmia not during syncope; number of patients started on therapy; time to first recurrence of syncope; total number of arrhythmic events for various monitoring periods.
A. Patients with a suspected arrhythmic cause of syncopeEleven studies50 investigating AECG for patients with a suspected arrhythmic syncope were included in Westby (2010). Patients in all studies had recurrent syncope, with the exception of the 24-hour Holter study by Sarasin (2005) which included patients with a single episode (52%).
Figure 5.3.30 shows the forest plot for the proportion of patients with no syncope during monitoring, according to the eight studies that reported this outcome. Rothman (2007) includes pre-syncopal events, which may explain the lower proportion of patients without symptoms during monitoring. The likelihood of not experiencing syncope during the monitoring period appears to be high for Holter monitoring and lower for ELR or ILR, which may be expected. There was significant heterogeneity (judged visually) for the ILR studies.
50 Westby (2010) refers to 13 included studies, but for two studies (Brembilla-Perrot, 2001; Brembilla-Perrot; 2004), no data were presented apart from deaths, which are reported in the current Review in ‘Safety of AECG: Westby (2010)’.
MBS Review – Ambulatory Electrocardiography Review Report Page 155

May 2016
Figure 5.3.30 Westby (2010): Proportion of patients with no syncope during monitoring (suspected arrhythmic cause)
Source: Westby (2010), Figure 5-1, pp248Abbreviations: ELR, event loop recorder; ILR, implantable loop recorder.
Figure 5.3.31 shows the proportion of patients with normal rhythm during syncope, as reported in seven studies.
Figure 5.3.31 Westby (2010): Proportion of patients with syncope, no arrhythmia (suspected arrhythmic cause)
Source: Westby (2010), Appendix D4 Figure 1, p2Abbreviations: ELR, event loop recorder; ILR, implantable loop recorder.
Figure 5.3.32 shows the proportion of patients with arrhythmia recorded during syncope in the eight studies that reported this outcome. The diagnostic yield for capturing an arrhythmia during syncope was higher for ELRs (41%; one study) and ILRs (~30%; four studies) than for Holter monitoring (7%; three studies). No heterogeneity among the ILR studies was observed.
MBS Review – Ambulatory Electrocardiography Review Report Page 156

May 2016
Figure 5.3.32 Westby (2010): Proportion of patients with arrhythmia during syncope (suspected arrhythmic cause)
Source: Westby (2010), Figure 5-2, pp249Abbreviations: ELR, event loop recorder; ILR, implantable loop recorder.
Figure 5.3.33 shows the proportion of patients with arrhythmia not during syncope, as reported in seven studies.
Figure 5.3.33 Westby (2010): Proportion of patients with arrhythmia, no syncope (suspected arrhythmic cause)
Source: Westby (2010), Appendix D4 Figure 2, p3Abbreviations: ELR, event loop recorder; ILR, implantable loop recorder.
Figure 5.3.34 shows the proportion of patients started on therapy based on AECG findings, as reported in four studies, three of which were for ILR. Therapies included pacemakers, implantable defibrillators and antiarrhythmic drugs.
MBS Review – Ambulatory Electrocardiography Review Report Page 157

May 2016
Figure 5.3.34 Westby (2010): Number of patients started on therapy (suspected arrhythmic cause)
Source: Westby (2010), Appendix D4 Figure 4, p5Abbreviations: ELR, event loop recorder; ILR, implantable loop recorder.
The frequency of syncope prior to monitoring and the time to first syncope during monitoring were reported, where available (Table 5.3.89).
Table 5.3.89 Time to first syncope (suspected arrhythmic cause)
Study name Prior frequency(no./year) a
Duration of monitoring
(days)
Time to first syncope
Holter, 24hSarasin (2005) NR 1 NR
Holter, 48hArya (2005) NR 2 NR
Ringqvist (1989) NS 2 NR
ELRRothman (2007) NR NR Median time to syncope was 10 and 6 days for ELR and
telemetry51 respectively.
ILRBrignole (2001) 1.5 (median) 4852 37% had event after median 48 days (range 2–367) days
Garcia-Civera (2005) 3.5 (mean) 276 ILR-documented syncope/presyncope occurred in 40% of patients in mean of 85 (SD 95) days
Krahn (1999) 5.1 (mean) 315 58/85 (68%) had symptoms a mean of 71 (79) b days after ILR
Menozzi (2002) 1 (median) 480 Syncope occurred in 6/35 (17) 5 of patients after a mean of 6 (5) months (180 days)
Source: Westby (2010), Appendix D1, Table 3.4.2, p61 and Westby (2010), p247Abbreviations: ELR, event loop recorder, ILR, implantable loop recorder; NR, not reported; NS, not stated.a Westby (2010) does not indicate whether mean or medians are reported, except where mentioned in the text (annotated here).b Westby (2010) does not indicate whether (79) is the standard deviation, but it is likely to be, given that the mean is reported.
Figure 5.3.35 reports the number of arrhythmic events (with or without concurrent syncope) detected after 24-hour and 48-hour Holter monitoring in the same group of patients. The authors note this result indicates that additional information can be obtained with a second day of Holter monitoring. Without reference to the original study, it is unclear what proportion of these arrhythmias are repeat events in the same patients, and how many found on the second day were first arrhythmias.
51 Telemetry was out of scope for Westby (2010-CR).52 Primary endpoint was monitoring until first syncopal episode.
MBS Review – Ambulatory Electrocardiography Review Report Page 158
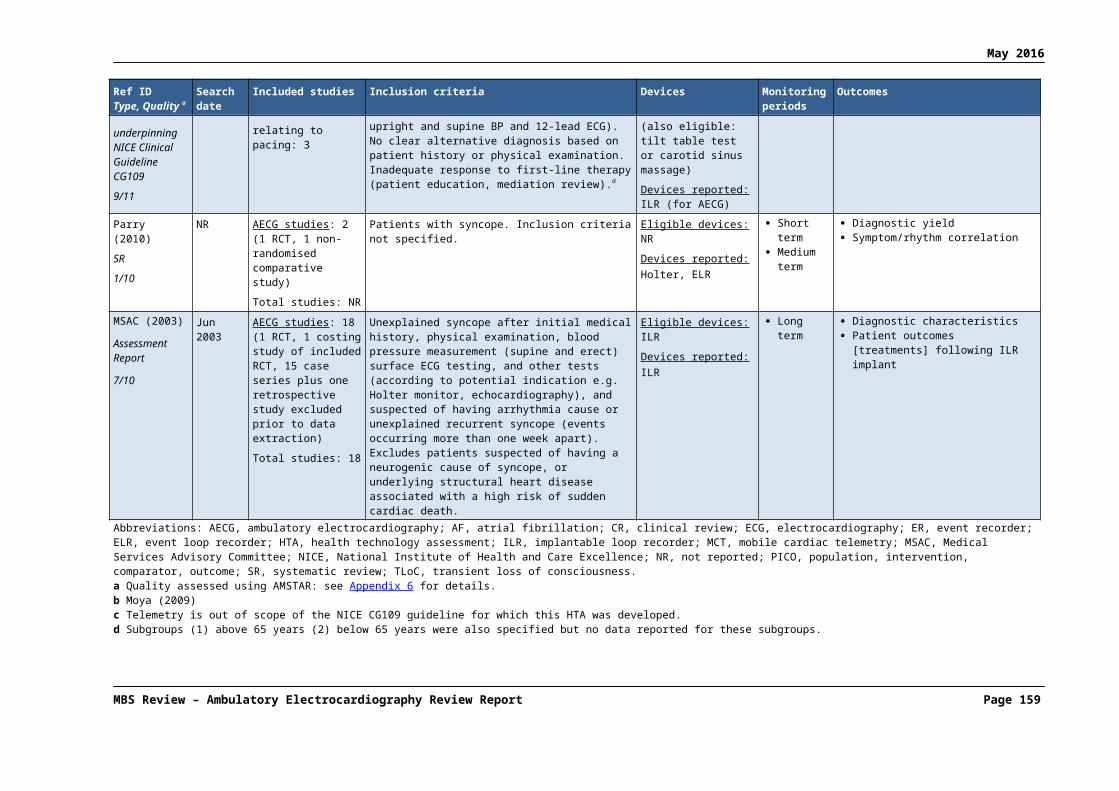
May 2016
Figure 5.3.35 Westby (2010): 24h Holter versus 48h Holter: proportion of arrhythmic events detected (suspected arrhythmic cause)
Source: Westby (2010), Figure 5-3, pp250
B. Patients with suspected neurally mediated syncopeFour studies investigated AECG for patients with suspected neurally mediated syncope; one 48-hour Holter monitoring study (Fitchet, 2003) and three ILR studies (Brignole, 2006; Deharo, 2006; Moya, 2001). Fitchet (2003) and Deharo (2006) only included patients with vasovagal syncope. Brignole (2006) included patients with neurally mediated syncope with a severe presentation, excluding carotid sinus syncope. Moya (2001) included two populations, one TT positive and the other TT negative; the former is included in this population group while the latter is included in population group D (unexplained syncope after secondary tests) and is carotid sinus negative. The Brignole (2006) study consisted of two phases, of which the first phase (case series) is relevant. All studies reported that patients had recurrent syncope. The authors noted that Medtronic Inc. provided funding and a study manager for the Brignole (2006) study.
Figure 5.3.36 to Figure 5.3.39 depict outcomes relating to diagnostic yield, as reported by the four studies in patients with suspected neurally mediated syncope. Figure 5.3.40 shows the proportion of patients started on therapy.
Figure 5.3.36 Westby (2010): Proportion of patients with no syncope during monitoring (suspected NMS)
Source: Westby (2010), Figure 5-4, pp251Abbreviations: ILR, implantable loop recorder; NMS, neurally mediated syncope.
MBS Review – Ambulatory Electrocardiography Review Report Page 159
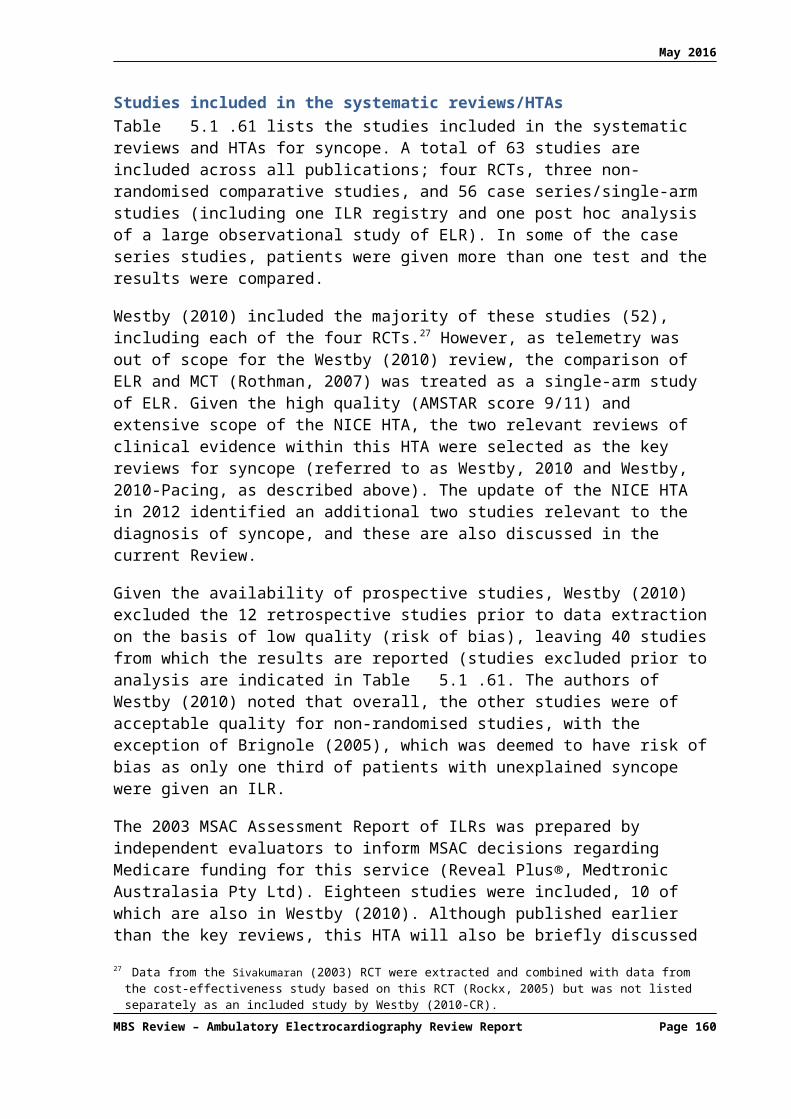
May 2016
Figure 5.3.37 Westby (2010): Proportion of patients with syncope, no arrhythmia (suspected NMS)
Source: Westby (2010), Appendix D4, Figure 6, p6Abbreviations: ILR, implantable loop recorder; NMS, neurally mediated syncope.
Figure 5.3.38 Westby (2010): Proportion of patients with arrhythmia during syncope (suspected NMS)
Source: Westby (2010), Figure 5-5, pp251Abbreviations: ILR, implantable loop recorder; NMS, neurally mediated syncope.
Figure 5.3.39 Westby (2010): Proportion of patients with arrhythmia, no syncope (suspected NMS)
Source: Westby (2010), Appendix D4, Figure 7, p6Abbreviations: ILR, implantable loop recorder; NMS, neurally mediated syncope.
Figure 5.3.40 Westby (2010): Number of patients started on therapy (suspected NMS)
Source: Westby (2010), Appendix D4, Figure 10, p7Abbreviations: ILR, implantable loop recorder; NMS, neurally mediated syncope.
MBS Review – Ambulatory Electrocardiography Review Report Page 160

May 2016
Table 5.3.90 reports the frequency of syncope prior to monitoring and time to first syncope, as reported by the four studies in patients with suspected neurally mediated syncope.
Table 5.3.90 Westby (2010): Time to first syncope, suspected neurally mediated syncope
Study name Prior frequency (no./year) a
Duration of monitoring (days)
Time to first syncope
Holter, 48hFitchet (2003) 2.5 2 NR
ILRBrignole (2006) 2 270 NR (but 36% patients had event after median 9 months (IQR
3–17)
Deharo (2006) 6.9 510 12/25 had events; time to 1st event mean 4.8 months (SD 4.7)
Moya (2001) TT+ve 1.5 300 8/29 (28%) of patients had recurrence at a median of 59 days (range 22–98)
Source: Westby (2010), Appendix D1, Table 3.4.2, p61Abbreviations: ILR, implantable loop recorder; IQR, interquartile range; NR, not reported; SD, standard deviation; TT +ve, tilt table test positive.Note: Data for Brignole (2006) not reproduced here as correct outcome was not captured.a Westby (2010) does not indicate whether mean or medians are reported.
C. Patients with unexplained syncope after initial testsThree studies included patients with unexplained syncope after an initial assessment. In a 72-hour Holter study by Kapoor (1991), over half of the patients (55/95) had recurrent syncope; the TLoC patient history was not reported in the 24-hour Holter study by Comolli (1993) or the ILR study by Ermis (2003).
Outcomes relating to diagnostic yield are depicted in Figure 5.3.41 to Figure 5.3.44.
Figure 5.3.41 Westby (2010): Proportion of patients with no syncope during monitoring (unexplained after initial tests)
Source: Westby (2010), Figure 5-6, pp253Abbreviations: ILR, implantable loop recorder.
MBS Review – Ambulatory Electrocardiography Review Report Page 161

May 2016
Figure 5.3.42 Westby (2010): Proportion of patients with syncope, no arrhythmia (unexplained after initial tests)
Source: Westby (2010), Appendix D4, Figure 11, p8Abbreviations: ILR, implantable loop recorder.
Figure 5.3.43 Westby (2010): Proportion of patients with arrhythmia during syncope (unexplained after initial tests)
Source: Westby (2010), Figure 5-7, pp253Abbreviations: ILR, implantable loop recorder.
Figure 5.3.44 Westby (2010): Proportion of patients with arrhythmia, no syncope (unexplained after initial tests)
Source: Westby (2010), Appendix D4, Figure 12, p8Abbreviations: ILR, implantable loop recorder.
One study (Ermis 2003) reported that 16 out of 50 patients were started on therapy after ILR monitoring. This outcome was not reported for the Holter studies.
MBS Review – Ambulatory Electrocardiography Review Report Page 162

May 2016
Time to first syncope was reported only by Ermis (2003). Mean time to syncope was 13.4 months (range 1-23) in 12% of patients.
Kapoor (1991) monitored patients for 24 hours, followed by two subsequent 24-hour periods for those patients without an arrhythmia recorded. Figure 5.3.45 shows the proportion of patients with any arrhythmia recorded (with and without syncope) for each of the three 24-hour periods, as well as the cumulative yield over 48 hours and 72 hours.
Figure 5.3.45 Westby (2010): Proportion of patients with arrhythmias recorded after Holter monitoring for 24h vs 48h vs 72h (unexplained after initial tests)
Source: Westby (2010), Figure 5-8, pp254
D. Patients with unexplained syncope after secondary testsA total of 20 studies investigating AECG for patients with unexplained syncope after secondary tests were included in Westby (2010). The two arms of the Rockx (2005) RCT data were used as two separate groups (48-hour Holter and ELR), making 21 groups in total. Most studies included patients with recurrent syncope.
Three ILR studies did not exclude patients with a positive TT test result (Boersma, 2004; Donateo, 2003; Nierop, 2000), and sensitivity analyses were conducted to explore the impact of their removal on the degree of heterogeneity (judged visually). The authors stated that subgroup analysis by the exclusion or inclusion of TT positive patients did not explain the significant heterogeneity found in these studies.
Figure 5.3.46 to Figure 5.3.48 (which depict the proportion of patients with no syncope during monitoring, the proportion of patients with no arrhythmia during syncope, and the proportion of patients with arrhythmia during syncope) show between-study heterogeneity within device categories. This is especially notable in Figure 5.3.47, where Rockx (2005), in particular, reports a very high proportion of patients with normal rhythm – assessed by ELR – during syncope. The authors noted that this study included both syncope and presyncope symptoms. Sensitivity analyses excluding studies that did not exclude patients with a positive TT test (indicated by dots in the figures) did not resolve the heterogeneity for any of these outcomes.
MBS Review – Ambulatory Electrocardiography Review Report Page 163

May 2016
Figure 5.3.46 Westby (2010): Proportion of patients with no syncope during monitoring (unexplained syncope after secondary tests)
Source: Westby (2010), Figure 5-9, pp256Abbreviations: ELR, event loop recorder; ILR, implantable loop recorder.Note: dots mark studies that did not exclude patients with a positive tilt table test result.
MBS Review – Ambulatory Electrocardiography Review Report Page 164

May 2016
Figure 5.3.47 Westby (2010): Proportion of patients with syncope, no arrhythmia (unexplained syncope after secondary tests)
Source: Westby (2010), Appendix D4, Figure 14, p10Abbreviations: ELR, event loop recorder; ILR, implantable loop recorder.Note: dots mark studies that did not exclude patients with a positive tilt table test result.
MBS Review – Ambulatory Electrocardiography Review Report Page 165

May 2016
Figure 5.3.48 Westby (2010): Proportion of patients with arrhythmia during syncope (unexplained syncope after secondary tests)
Source: Westby (2010), Figure 5-10, pp258Abbreviations: ELR, event loop recorder; ILR, implantable loop recorder.Note: dots mark studies that did not exclude patients with a positive tilt table test result.
Figure 5.3.49 shows most studies reported very low rates of arrhythmia not during syncope.
MBS Review – Ambulatory Electrocardiography Review Report Page 166

May 2016
Figure 5.3.49 Proportion of patients with arrhythmia, no syncope (unexplained syncope after secondary tests)
Source: Westby (2010), Appendix D4, Figure 15, p11Abbreviations: ELR, event loop recorder; ILR, implantable loop recorder.Note: dots mark studies that did not exclude patients with a positive tilt table test result.
Figure 5.3.50 Westby (2010): Number of patients started on therapy (unexplained syncope after secondary tests)
Source: Westby (2010), Appendix D4, Figure 18, p13Abbreviations: ELR, event loop recorder; ILR, implantable loop recorder.Note: dots mark studies that did not exclude patients with a positive tilt table test result.
Table 5.3.91 shows the frequency of syncope prior to monitoring and time to first syncope, where reported, in patients with unexplained syncope after initial tests.
The authors noted that patients in most of these studies experienced syncope infrequently, so devices other than ILR were less likely to detect an event during the monitoring period.
MBS Review – Ambulatory Electrocardiography Review Report Page 167

May 2016
Table 5.3.91 Westby (2010): Time to first syncope (unexplained syncope after secondary tests)
Study name Prior frequency (no./year) a
Duration of monitoring
(days)
Time to first syncope
Holter, 24hAronow (1993) NR 1 NR
Lacroix (1981) 3 1 NR
Sarasin (2001) NR 1 NR
Holter, 48hRockx (2005) 1.8 2 NR
ELRFogel (1997) NR 28 NR
Linzer (1990) 10 30 mean duration of monitoring before diagnosis was 1 week (7 days)
Rockx (2005) 1.8 30 median time to diagnosis 16 days (mean 17 (13)b)
Sarasin (2001) NR 7 NR
Schuchert (2003) 6 50 median time to syncope 103 days (range 1 to 704 days) after tilt test in 8/24 patients
ILRBoersma (2004) 653 540 NR
Brignole (2005) NR 420 NR
Donateo (2003) 1.5(median)
540 16/36 activated device for syncope: median time 9 months (range 1–36)
Farwell (2006) 1.5 (mean) 510 NR
ILR
Krahn (1998) 3.654 138 21/24 developed syncope or presyncope at a mean of 5.1 (4.8b) months = 153 days
Krahn (2001) 2.6 365 NR
Krahn (2002) NR 6 months (180 days)
symptoms recurred in 69% of patients at a mean of 93 (107b) days
Krahn (2004) 4.455 365 NR
Lombardi (2005) 2 210 NR [7.6 months in text of main report]
Moya (2001) TT-ve 2(median)
270 24/82 (29%) of patients had recurrence at a median of 105 days (range 47–226)
Nierop (2000) 5.2(mean)
330 NR – 44 events (syncope or presyncope) in mean of 11-months follow up; of these 37 in 1st 6 months and 7 in months 7–12, but cannot calculate mean time to recurrence per patient as patients could have more than 1 event
Pezawas (2007) NR 480 NR – recurrence in 60/70 patients with actuarial recurrence rate 30% at 3 months, 65% at 12 months and 91% at 24 months in those with structural heart disease and 35%, 68% and 87% without structural heart disease
Pierre (2008) NR 306 43/95 (45.2%) of patients had recurrence at a mean time of 5.4 (4.6b) months = 162 days
Seidl (2000) 6.3 (mean) 324 NRSource: Westby (2010), Appendix D1, Table 3.4.2, p61; Westby (2010), p255Abbreviations: ELR, event loop recorder, ILR, implantable loop recorder; IQR, interquartile range; NR, not reported; SD, standard deviation; TT-ve, tilt table test negative.a Westby (2010) does not indicate whether mean or medians are reported, except where mentioned in the text (annotated here).b Westby (2010) does not indicate whether numbers in brackets are the SD, but they are likely to be, given that the mean is reported.
53 Data extraction table reports 6 without units, text reports median of 2.7.54 Data extraction table reports 3.6 without units, text reports mean of 7.2.55 Data extraction table reports 4.4 without units, text reports median of 2.
MBS Review – Ambulatory Electrocardiography Review Report Page 168

May 2016
Summary statistics for main outcomesTable 5.3.92 presents summary statistics for the main outcomes for the four patient populations, showing an additional subgroup of patients with suspected arrhythmia where the proportion of patients in the study with recurrent syncope is less than 50%. For each of these outcomes, the median of proportions is reported, by population and device. Bold text indicates a high level of heterogeneity.
Table 5.3.92 Westby (2010): Descriptive statistics summarising results of observational AECG studies and RCT cohorts
Population Holter, 24h Holter, 48h ELR ILRNo syncope during monitoringSuspected arrhythmia (>50% single episode)
Median 84%[1 study, 140 patients]
none none none
Suspected arrhythmia none Median 89.5% (range 87%-92%)[2 studies, 112 patients]
Median 31%[1 study, 51 patients]
Median 50% (range 32%-60%)[4 studies, 253 patients]
Suspected NM syncope none Median 80%[1 study, 118 patients]
none Median 64% (range 52%-66%)[3 studies, 446 patients]
Unexplained after initial Median 92%range (85%-99%)[2 studies, 382 patients]
Median 79% (72h Holter)[1 study, 95 patients]
none Median 88%[1 study, 50 patients]
Unexplained after secondary tests
none Median 76%[1 study, 51 patients]
Median 55.5% (range 22%-68%)[4 studies, 192 patients]
Median 43.5% (range 13%-66%)[14 studies, 1052 patients]
Normal rhythm during syncopeSuspected arrhythmia (>50% single episode)
Median 9%[1 study, 140 patients]
none none none
Suspected arrhythmia none Median 6%[1 study, 63 patients]
Median 27%[1 study, 51 patients]
Median 8.5% (range 2%-34%)[4 studies, 253 patients]
Suspected NM syncope none Median 12%[1 study, 11 patients]
none Median 9% (range 7%-20%)[3 studies, 446 patients]
Unexplained after initial Median 7% (range 0%-14%)[2 studies, 382 patients]
Median 20% (72h Holter)[1 study, 95 patients]
none Median 4%[1 study, 50 patients]
Unexplained after secondary tests
Median 0%[1 study, 100 patients]
Median 24%[1 study, 51 patients]
Median 14% (range 0%- 61%)[4 studies, 192 patients]
Median 24% (range 6%-42%)[14 studies, 1052 patients]
Arrhythmia during syncopeSuspected arrhythmia (>50% single episode)
Median 6%[1 study, 140 patients]
none none none
Suspected arrhythmia none Median 7%(range 6%-8%)[2 studies, 112 patients]
Median 41% [1 study, 51 patients]
Median 31% (range 25%-38%)[4 studies, 253 patients]
Suspected NM syncope none Median 8% [1 study, 118 patients]
none Median 21% (range 18%-28%)[3 studies, 446 patients]
Unexplained after initial Median 1% (range 1%-1%)[2 studies, 382 patients]
Median 1% (72h Holter)[1 study, 95 patients]
none Median 8%[1 study, 50 patients]
Unexplained after secondary tests
none Median 0% [1 study, 51 patients]
Median 8.5% (range 2%-16%) [4 studies, 192 patients]
Median 28.5% (range 18%-47%)[14 studies, 1052 patients]
Arrhythmia, not during syncopeSuspected arrhythmia (>50% single episode)
Median 0%[1 study, 140 patients]
none none none
Suspected arrhythmia none Median 21.5% (range 8%-35%) [2 studies, 112 patients]
Median 0%[1 study, 51 patients]
Median 0% (range 0%-8%)[3 studies, 168 patients]
Suspected NM syncope none Median 0%[1 study, 118 patients]
none Median 3%[1 study, 392 patients]
Unexplained after initial tests
Median 10% (range 1%-19%)
Median 23% (48h Holter)[1 study, 95 patients]
none Median 26%[1 study, 50 patients]
MBS Review – Ambulatory Electrocardiography Review Report Page 169

May 2016
Population Holter, 24h Holter, 48h ELR ILR[2 studies, 382 patients] Median 26% (72 hour
Holter)[1 study, 95 patients]
Unexplained after secondary tests
none Median 0%[1 study, 51 patients]
Median 0% (range 0%-0%)[3 studies, 130 patients]
Median 0% (range 0%-15%)[8 studies, 566 patients]
Patients started on therapySuspected arrhythmia (>50% single episode)
none none none none
Suspected arrhythmia none Median 13% [1 study, 63 patients]
none Median 26% (range 22%-44%)[3 studies, 168 patients]
Suspected NM syncope none Median 3%[1 study, 118 patients]
none Median 14% (range 14%-28%)[3 studies, 446 patients]
Unexplained after initial none none none Median 32%[1 study, 50 patients]
Unexplained after secondary tests
Median 43%[1 study, 148 patients]
none Median 18%[1 study, 57 patients]
Median 28% (range 12%-49%)[13 studies, 1022 patients]
Source: Westby (2010) Table 24, p 259Abbreviations: AECG, ambulatory electrocardiography; ELR, event loop recorder, ILR, implantable loop recorder; NM, neurally mediated; RCT, randomised controlled trial.Bold indicates a high level of heterogeneity (as determined by visual inspection – no meta-analysis was performed).
The two major outcomes for diagnostic yield are syncope during monitoring (inverse of no syncope during monitoring), and arrhythmia detected during syncope. General trends noted by the authors are as follows:
For each population, there is a general increase in the proportion of people with syncope during monitoring in the order 24-hour Holter, 48-hour Holter, ELR and ILR, although the estimate for ELR for the suspected arrhythmia group is anomalously high, possibly due to a good match between frequency of syncope and the event recorder duration of monitoring. For example, in the suspected arrhythmia group, 11%56 of patients had syncope during 48 hours of Holter monitoring, 69%57 with an ELR, and 50% with an ILR.
The same trends are found for arrhythmia during syncope, with the yield for this outcome, ranging from 7% (48h Holter) to 31% (ILR) for the suspected arrhythmia group, and 1% (Holter) to 8% (ILR) for the group with unexplained syncope after the initial assessment.
Both ‘no arrhythmia during syncope’ and ‘no syncope during arrhythmia’ appear to be independent of device.
A higher proportion of patients started on therapy as directed by ILR than by other device types. However, the authors of the current Review note that this trend may be related to study design as the ILR studies often included longer-term outcomes.
ILR activation: patient vs automatic/patientComparisons of ILRs with and without automatic activation are reproduced here for two outcomes; arrhythmia during syncope (Figure 5.3.51) and arrhythmia with no syncope (Figure5.3.52). The authors commented that there appears to be no significant differences between devices that are patient triggered compared to devices that are automatically or patient- triggered, although they also note that this is an indirect comparison. The authors of the current Review note that only the patient population with unexplained syncope after
56 89.5% with no syncope during monitoring.57 31% with no syncope during monitoring.
MBS Review – Ambulatory Electrocardiography Review Report Page 170
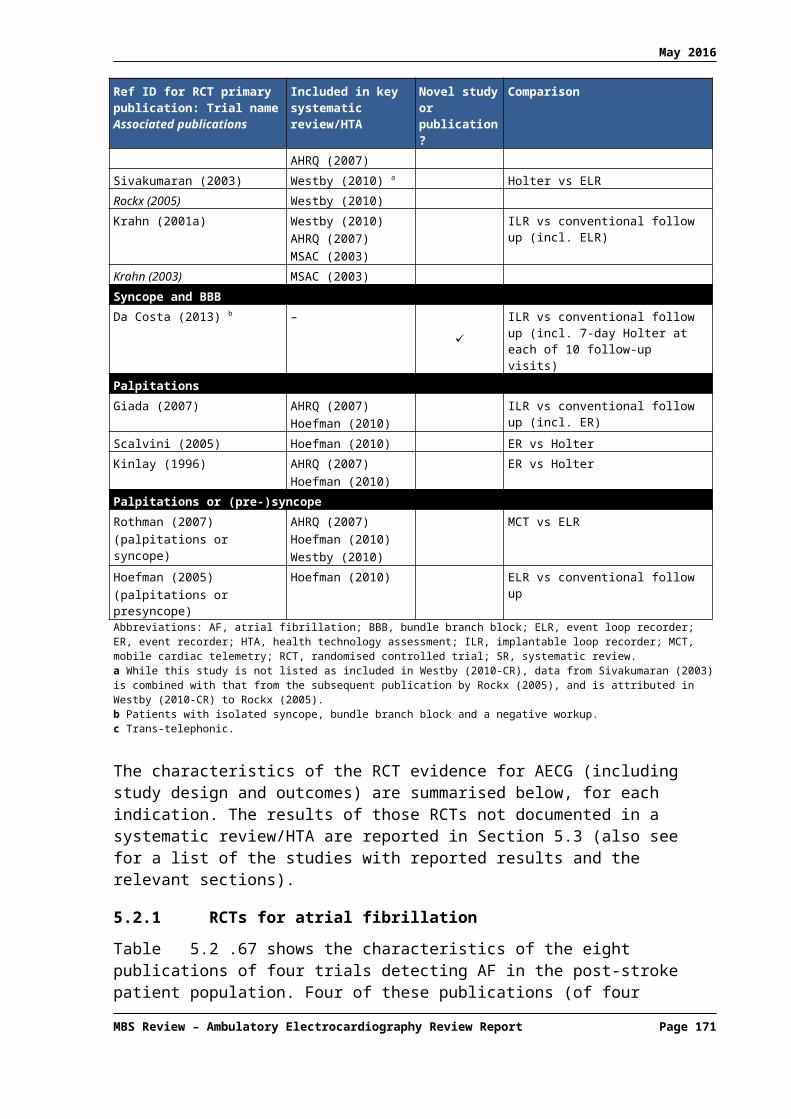
May 2016
secondary tests included sufficient studies in both subgroups to allow a comparison of device activation types.
Two individual studies were discussed in Westby (2010). In Ermis (2003), arrhythmias (with or without syncope) were mostly detected by automatic activation and rarely by patient (or patient plus automatic). In Farwell (2006), over a third of patients failed to manually trigger recording of their first syncope (either due to failure to activate or delayed device interrogation resulting in loss of captured data). However, this reduced to 5% at long-term follow up. This study noted that 19% of all diagnoses were made using automatically activated recordings.
Figure 5.3.51 Westby (2010): Arrhythmia during syncope, AT/PT vs PT for ILRs
Source: Westby (2010), Appendix D4, Figure 2.3.2, p33Abbreviations: AT, auto triggered; ILR, implantable loop recorder, NMS, neurally mediated syncope; PT, patient triggered.
MBS Review – Ambulatory Electrocardiography Review Report Page 171

May 2016
Figure 5.3.52 Westby (2010): Arrhythmia with no syncope: AT/PT vs PT for ILRs
Source: Westby (2010), Appendix D4, Figure 2.3.3, p34Abbreviations: AT, auto triggered; ILR, implantable loop recorder, NMS, neurally mediated syncope; PT, patient triggered.
AECG to direct pacing therapy: Westby (2010)The Westby (2010) full guideline included a systematic review of the evidence for AECG to guide pacing therapy. This review included studies for other, out-of-scope tests, and one study of ILR, discussed below.
Brignole (2006) was a prospective, multinational study funded by Medtronic Inc. in patients with suspected neurally mediated syncope on initial assessment with a severe clinical presentation. This was a two phase study, with the first stage involving ILR monitoring of a series of patients, followed by allocation of patients with an ILR-documented syncope into two non-randomised groups: ILR-based treatment and no specific treatment. Of the 392 patients that commenced Phase I, ILR-documented syncope was obtained in 106 patients, of which 53 received ILR-based treatment (pacemaker or other) and 50 received no specific therapy.
Outcomes included time to recurrence of syncope after therapy and total burden of syncope after therapy. Diagnostic accuracy outcomes, such as sensitivity and specificity, were not reported by Brignole (2006) but data were extracted by Westby (2010) for the purpose of estimating these.
Effectiveness outcomesAsystole greater than three seconds or bradyarrhythmia (indications for pacemaker) were detected during syncope in 61 patients, of which 47 received a pacemaker (one was lost to follow up but it was unclear why the other 13 patients received non-specific therapy). A further six patients received therapy for tachycardia detected by ILR, making a total of 53 patients with ILR-directed therapy. The remaining 50 patients received counselling/non-specific therapy.
MBS Review – Ambulatory Electrocardiography Review Report Page 172
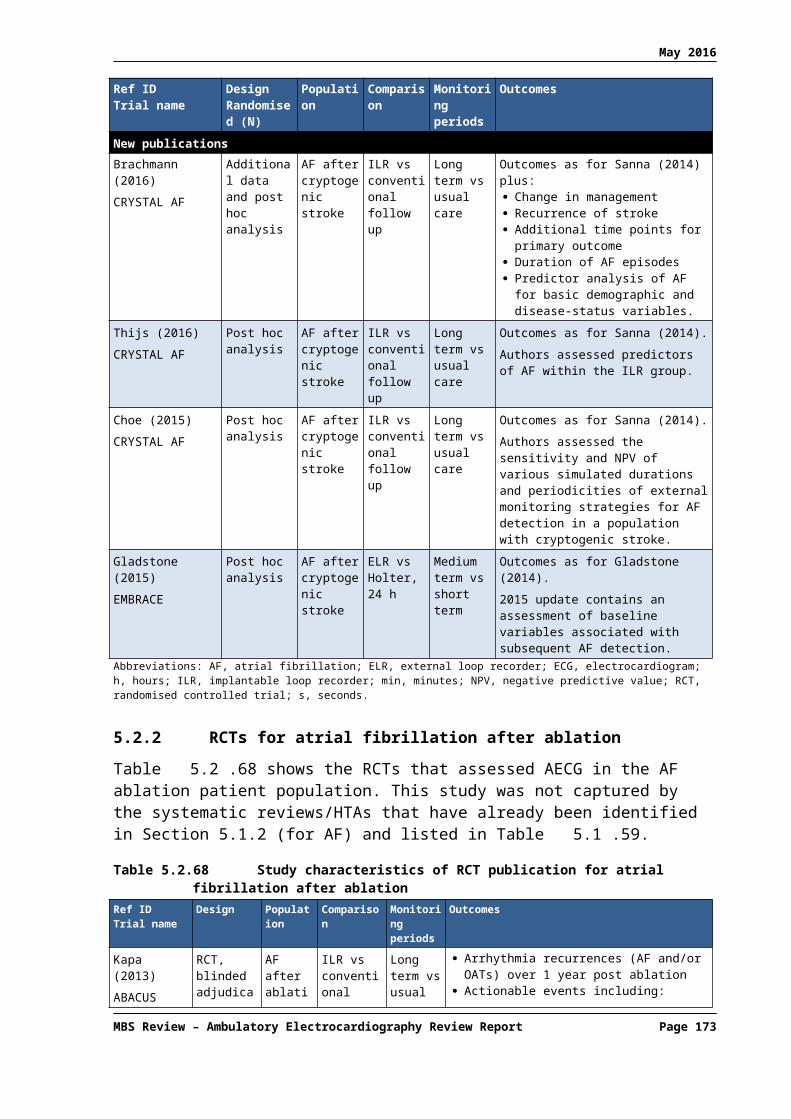
May 2016
Among the 61 patients with asystole or bradyarrhythmia, the total burden of syncope after treatment was 9% in the ILR-directed pacing group (4/47) and 31% in the non-specific therapy group (4/13). The time to second recurrence of syncope (i.e. first syncope after therapy) in these groups was significantly different (HR 0.10 [95% CI: 0.02, 0.43]), favouring the pacemaker group. There was no difference between groups for time to first recurrence, during the ILR phase, suggesting similarity between these groups prior to treatment. However, the authors of the current Review note that while the post-pacing differences are significant, a valid statistical comparison between these two groups cannot be made as it is unclear why the 13 patients that did not receive pacing were not chosen for pacing, and this potentially biases the two groups substantially.
The pacemaker group (47 patients) was also compared with the group without asystole/ bradycardia (43 patients) and, therefore, no pacemaker. Time to second syncope was much longer in the pacemaker group (HR 0.20 [95% CI: 0.07, 0.55]).
Diagnostic accuracyFigure 5.3.53 shows the sensitivity and specificity of ILR for directing pacing therapy using ‘symptom-free after pacing’ as a reference standard. In this analysis, all 47 patients who received a pacemaker were considered to be ‘true positives’ while the 13 patients that did not go on to receive pacing, despite detection of syncope by ILR, were considered to be ‘false positives’.58 Using this approach, the sensitivity and specificity are likely to be overestimated patients with a negative ILR test were not given a pacemaker, so would automatically have a true negative result.
Figure 5.3.53 Westby (2010): Diagnostic test accuracy of ILR to direct pacing vs symptom-free after pacing
Source: Westby (2010) Figure 6.4, p373Abbreviations: IER, implantable event recorder (i.e. ILR); FN, false negative; FP, false positive; TN, true negative; TP, true positive.
Safety of AECG: Westby (2010)
Comparative evidenceIn the Farwell (2006) RCT comparing ILR and conventional testing in 198 subjects, no difference was observed between groups in death at censorship.
Observational studiesTable 5.3.93 presents summary statistics for deaths and adverse events in the included studies, by population and device. No safety outcomes were reported by ELR studies. The authors commented that the elevated number of deaths of patients with suspected arrhythmic cause of syncope (Holter monitoring) are more likely to be due to the patient characteristics than the type of device.
Table 5.3.93 Westby (2010): Summary statistics for deaths and adverse events, by population and devicePopulation Holter, 24h Holter, 48h ELR ILRDeathsSuspected Median 18% (range 16% to NR NR Median 2% (range 2% to 2%)58 4/47 patients with a pacemaker were not symptom-free after pacing. Thus, the number of ‘true positives’ in the analysis
should be 43 and the number of ‘false positives’ should be 17. The resultant sensitivity is 100% and specificity is 95%.
MBS Review – Ambulatory Electrocardiography Review Report Page 173

May 2016
Population Holter, 24h Holter, 48h ELR ILRarrhythmia 29%)
[3 studies; 310 patients][3 studies; 133 patients]
Suspected NM syncope
NR NR NR Median 0%[1 study; 29 patients]
Unexplained after initial
NR NR NR Median 6%[1 study; 50 patients]
Unexplained after secondary tests
Median 13%[1 study; 100 patients]
NR NR Median 1.5% (range 0% to 11%)[6 studies; 516 patients]
Adverse eventsSuspected arrhythmia
NR NR NR 4 AEs (3 infections, 1 pain)[1 study, 85 patients]
Suspected NM syncope
NR NR NR 5 infections[2 studies; 417 patients]
Unexplained after initial
NR NR NR NR
Unexplained after secondary tests
NR NR NR 12 AEs[1 study, 130 patients]
Source: Westby (2010) Table 24, p 259Abbreviations: AE, adverse event; ELR, event loop recorder, ILR, implantable loop recorder; NM, neutrally mediated; NR, not reported.
Update of Westby (2010): NICE (2012)An update of the CG109 guidance for TLoC identified new studies relating to AECG. Edvardsson (2011) reported a prospective, observational study of ILR (Reveal). Patients had either syncope or presyncope, and many had numerous non-diagnostic investigations and specialist consultations before ILR implantation. Of 570 patients analysed, 218 had syncope during monitoring and ILR was diagnostic in 170 of these, possibly contributing to a further 13 diagnoses (30-32% diagnostic yield). Most patients who experienced syncope did so after 30 days of monitoring.
The authors noted that these results are consistent with the findings and recommendations of the original full guideline (Westby, 2010).
The authors also noted that remote monitoring technology that has the capacity for automatic data transfer may address some of the problems with ILRs (such as limited memory, sensing artefacts, necessary manual download). The authors of the current Review note that this type of monitoring (telemetry) was out of scope for the CG109 guideline. However, this is not mentioned in NICE (2012).
The update briefly discussed the results of Arrocha (2010), a non-randomised study of 40 patients with unexplained syncope that assessed the burden to physicians when ECG data is directly transmitted from the ILR to a central ECG monitoring centre. The study found that while feasible, this approach did create an excessive ECG-recording burden.
Additional RCTs for syncopeAs discussed in Section 5.2.5, the literature search for Level II evidence identified three RCT publications (Sulke, 2015; Podoleanu, 2014; Da Costa, 2013) that were not included in a systematic review/HTA ().
In the EaSyAS II trial, Sulke (2015) evaluated the first-line use of a novel remotely monitored ILR in the investigation of unexplained syncope (no secondary testing required), and compared it to conventional therapy and a dedicated syncope clinic. ELR and ILR were available tests in the SC group (testing in conventional therapy not described). The Sleuth device (Transoma Medical, Inc.) is a remotely monitored ILR, which automatically uploads all patient activations immediately. There were four possible groups into which patients could
MBS Review – Ambulatory Electrocardiography Review Report Page 174

May 2016
be randomised: ILR only (N = 66), ILR plus SC (N = 59), SC only (N = 60), or conventional therapy (N = 61). Median follow up was 20.4 months.
With respect to frequency of ECG diagnosis, the ILR (alone) group achieved an ECG diagnostic yield of 43.9% (29 of 66 patients); in comparison, the conventional management group achieved a diagnostic yield of 1.6% (1 of 61 patients) using Holter monitoring. For the primary outcome of time to ECG diagnosis, the time was significantly shorter with ILR (alone) compared to conventional therapy (HR = 35.5, p = 0.0004). Figure 5.3.54 shows the time to ECG diagnosis in all four groups studied in the RCT.
Figure 5.3.54 Time to ECG diagnosis
Source: Westby (2010) Figure 6.4, p373Abbreviations: CONV, conventional therapy; ECG, electrocardiogram; ILR, implantable loop recorder; SC, syncope clinic.
A limitation of this study is acknowledged by the authors, randomisation began in August 2007 with a minimum follow-up period of 12 months; therefore, ILR technology may have rapidly evolved between 2007 and the publication date in 2015.
In the FRESH trial, Podoleanu (2014) compared a conventional evaluation strategy in patients with unexplained syncope after secondary tests, with reference to diagnostic yield, cost and impact on QoL. The ILR used in the study was the Reveal® or Reveal Plus® device (Medtronic Inc.). There were two possible groups into which patients could be randomised: ILR group (N = 39) or conventional therapy (N = 39). The proportion of patients receiving AECG as part of conventional therapy was not reported.
After 14 months of follow up, a definite cause of syncope was established in 18/39 (46.2%) patients in the ILR group and 2/39 (5.1%) patients in the conventional group (p <0.001), demonstrating a significantly improved diagnostic yield in the ILR group. In the conventional group, the possible aetiology was reflex syncope in 8/39 (20.5%) patients.
The limitations of this study acknowledged by the authors result from the small number of patients included; this was due to the relative low rate of ILR implantations and poor knowledge of this diagnostic tool in France during the study period, as the device and implantation were not reimbursed.
MBS Review – Ambulatory Electrocardiography Review Report Page 175
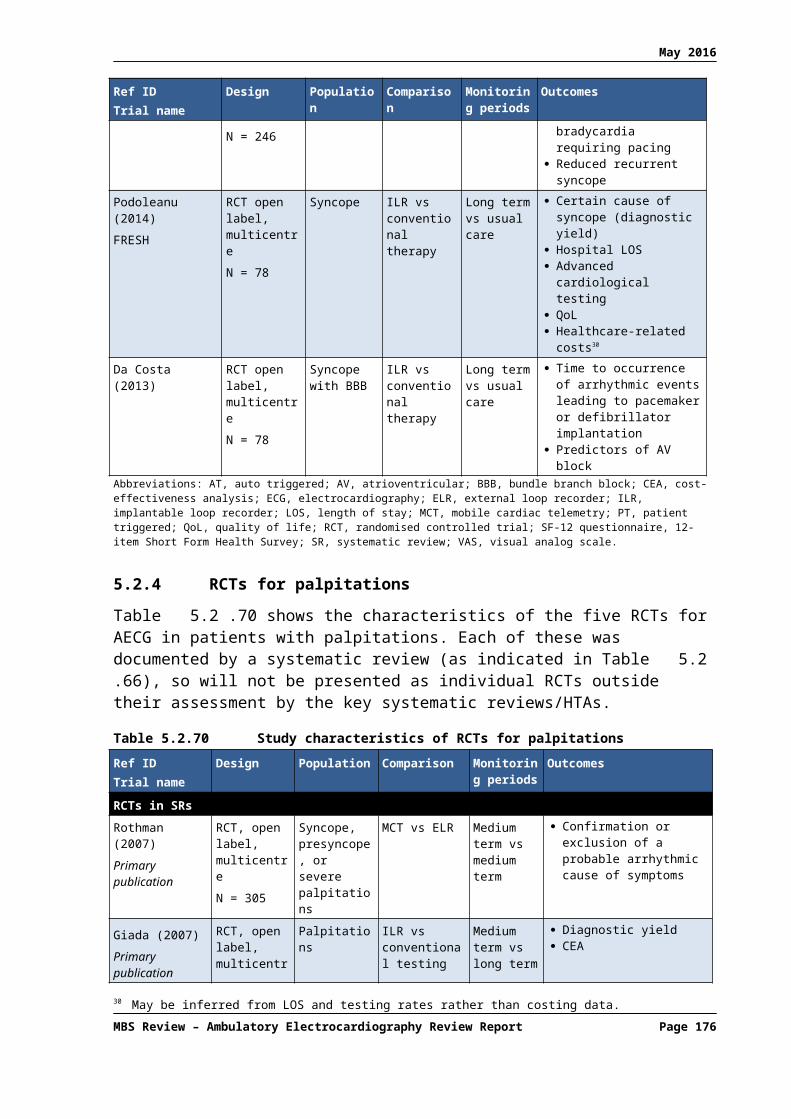
May 2016
Da Costa (2013) compared two syncope evaluation strategies, primary use of an ILR versus conventional testing, and estimated the prevalence of significant arrhythmias using both strategies. Randomised patients had a single syncopal episode associated with any type of bundle branch block and negative electrophysiological study (i.e. unexplained syncope after secondary tests). There were two possible groups into which patients could be randomised: ILR (N = 41) or conventional therapy (N = 37). Mean (SD) follow up was 27 ± 12 months. Conventional therapy included 7-day Holter monitoring at each follow-up visit (every three months until final follow up at 36 months).
Across the two groups, 21/78 patients (26.9%) developed significant arrhythmic events: ventricular tachycardia (1/78; 1.3%); sudden death (2/78; 2.6%); third-degree AV block (14/78; 17.9%); sick sinus syndrome (4/78; 5.1%). In 19/78 (24.4%) patients, relevant arrhythmias were diagnosed, with a significant difference (p – 0.02) between the ILR group (15/41; 36.6%) and the conventional follow-up group (4/37; 10.8%).
Limitations of the study, as identified by the authors themselves, are as follows:
The event rate in the studied population is low due to the patient selection criteria – one single syncope episode, bundle branch block and negative electrophysiological study.
The sample size was small and a larger number of patients presenting with left or right bundle branch block or bifascicular block would be necessary for each patient group.
A longer follow-up duration (e.g. a minimum of 3-5 years/patient) would have allowed determination of the cumulative incidence of heart block.
The results from the three above mentioned RCTs were generally in agreement with each other, and with those results reported in the systematic reviews/HTAs. The diagnostic yield for the ILR groups was 37-46%, whereas the analogous figures for the conventional therapy groups was 2-11%; this difference was statistically significant in all three studies.
5.3.4 Evaluation of palpitations
A total of 28 studies (16 comparative and 12 non-comparative) are included in the Hoefman (2010) systematic review of AECG for patients with palpitations. Of the 16 comparative studies, five are RCTs and 11 are either non-randomised comparative studies or include subgroup comparisons of different types of recording triggers (i.e. patient activation versus automatic activation). Most studies investigated ELR (or ER) and/or Holter; only two studies investigated ILR. The study findings were not combined in a meta-analysis, due to either clinical or methodological heterogeneity, so results are presented in tabular form.
Table 5.3.94 shows the characteristics and findings of the comparative studies and studies that report results for automatic versus patient-activated recordings. The authors note that most patients were in tertiary care with a variable amount of cardiac pathology, sometimes known prior to the study.
ER59 is compared to Holter monitoring (24-48 hours) in six studies, consisting of primary and secondary care patients. Diagnostic yield for ER ranges from 21% to 62% compared with a maximum of 30% for Holter monitoring. ERs were more effective at excluding arrhythmias as the cause of symptoms (34%) than was Holter (2%; data not tabulated). A statistically
59 Hoefman (2010) refers to these studies as continuous event recording. However, they are all studies of non-looping devices (i.e. not ELR, but ER).
MBS Review – Ambulatory Electrocardiography Review Report Page 176

May 2016
significant difference was observed for the diagnostic yield of ER versus usual care (67% vs 27%, respectively).
Based on three studies (Martinez, 2004; Balmelli, 2003; Roche, 2002), the range of diagnostic yields for patient-triggered ELRs is 22% to 67% while the range for auto-triggered ELRs is 39% to 80%, with yields higher with the auto-triggered devices compared to the patient-triggered devices. These studies report the additional relevant diagnoses derived from automatically triggered recordings on ELR as ranging from 11% to 17% (data not tabulated). Consistent with this trend, the registry study by Reiffel (2005) reported a diagnostic yield of 71% for auto-triggered recordings among 600 patients and 27% with the patient-triggered recordings among another 600 patients. A further 600 patients monitored with a Holter were diagnosed in 6% of cases. The populations included in this study are not described.
A comparison of MCT and patient-activated ELR found a significant difference in detection of clinically significant arrhythmias (41% versus 15%, respectively; p < 0.05) and diagnostic yield (all, including exclusionary, diagnoses; 88% versus 75%, respectively; p = 0.008).60 A subgroup analysis of study sites with exclusively auto-triggered ELRs found that MCT remained superior to ELR (88% versus 46%, respectively; p = 0.02). The relative diagnostic yields from mostly patient-triggered ELR (75%) and auto-triggered ELRs (46%) indicate that the former is more effective than the latter, which is in contrast to the findings of the ELR (PT) vs ELR (AT/PT) studies discussed above.
The auto-trigger feature of MCTs was found to make diagnoses that would otherwise be missed, in patients without symptoms during their arrhythmia, with an additional 6-26% of patients diagnosed this way (Olson, 2007).
In another study (Ng, 2004), patient-activated recordings found arrhythmias in 16% of patients, but the automatic activation mode found no additional relevant arrhythmias.61 The authors noted a high rate of inappropriate activation in this mode. Significantly more patients were diagnosed with ILR (73%) than with conventional follow up that included ER (21%; Giada (2007)).
60 Not reported by Hoefman, 2010; extracted directly from primary publication (Rothman, 2007).61 Extracted directly from Ng (2004).
MBS Review – Ambulatory Electrocardiography Review Report Page 177
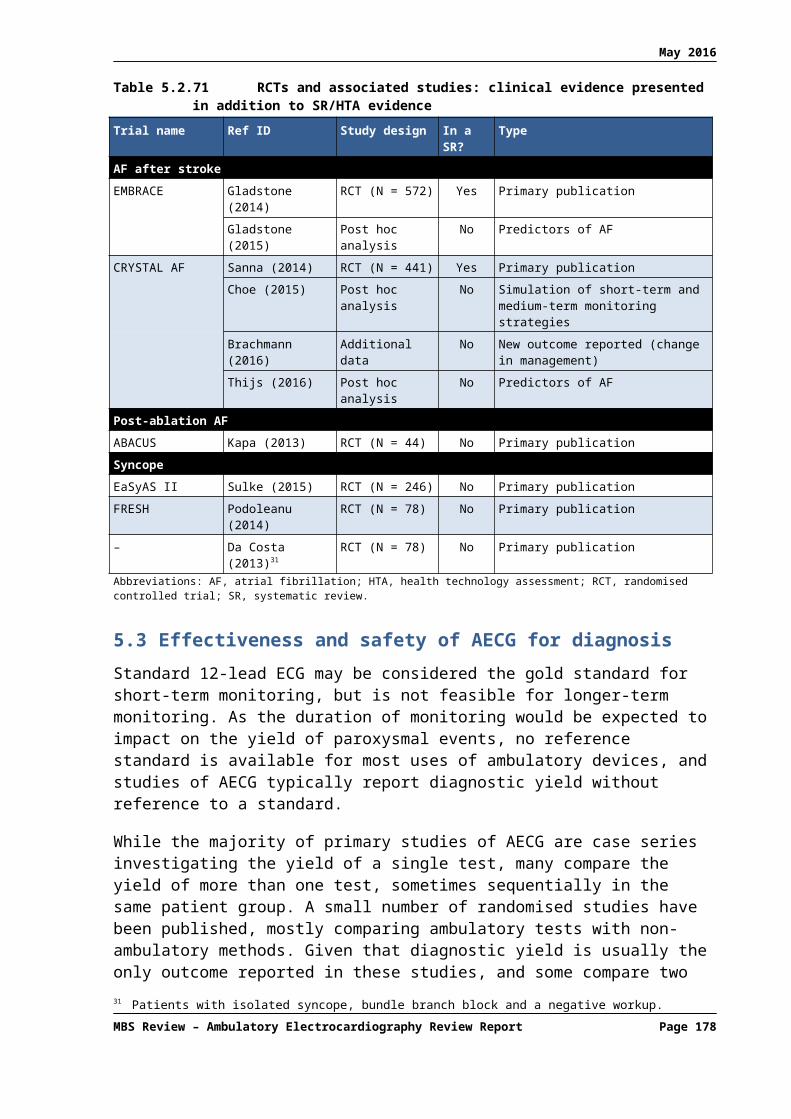
May 2016
Table 5.3.94 Hoefman (2010): Findings of comparative studies and studies with subgroup comparisonsRef ID Study design Population N Device Comparator % with diagnoses (device vs comparator)ER vs ILRGiada (2007) RCT Palpitations, initial neg. evaluation 50 ILR conventional f’up incl. ER ILR: 73% ER: 21% p < 0.05MCT vs ELRRothman (2007) RCT Palpitations [also (pre-)syncope] 266 MCT ELR (PT) Clinically significant arrhythmias
MCT: 41% ELR: 15% p < 0.05Diagnoses made (including exclusionary) a
MCT: 88% ELR: 75% p = 0.008Diagnoses made at sites using auto-activated ELRs a
MCT: 88% ELR: 46% p = 0.002ER b vs ECGWu (1995) retrospective Palpitations, (pre)syncope, dizziness 91 ER (PT) ECG ER: 37% ECG: 10%ER b vs HolterScalvini (2005) RCT Palpitations 310 ER (PT) Holter, 7 days ER: 52% Holter, 7 days: 48%Kinlay (1996) RCT crossover Palpitations 43 ER (PT) Holter ER: 67% Holter: 30% p < 0.05Kus (1995) prospective Palpitations 100 ER (PT) Holter ER: 65% Holter: 32%Klootwijk (1986) prospective Palpitations; 24h Holter twice neg. 100 ER (PT) Holter c ER: 48% Holter: 0% (inclusion criteria)Visser (1984) prospective Palpitations 50 ER (PT) Holter ER: 62% Holter: 12%Grodman (1979) prospective Palpitations 59 ER (PT) Holter ER 3; Holter 3; Holter plus ER 9 d
ELR vs usual careHoefman (2005) RCT Palpitations and/or dizziness 244 ELR (PT) usual care ELR (PT): 67% usual care 27% p < 0.05ILR – PT vs ATNg (2004) e retrospective Palpitations, (pre)syncope 50 patient-triggered ILR auto-triggered ILR ILR (PT): 16% ILR (AT) no additional diagnosesMCT – PT vs ATOlson (2007) retrospective Palpitations, (pre)syncope, therapy
evaluation122 f patient-triggered MCT auto-triggered MCT No prior arrhythmia diagnosis: MCT (PT): 78% MCT (AT): additional
6% g Prior arrhythmia detected: MCT (PT): 47% MCT (AT): additional 26% h
ELR – PT vs ATReiffel (2005) registry Unknown 1800 patient-triggered ELR auto-triggered ELR vs Holter ELR (PT): 27% ELR (AT): 71% Holter: 6%Martinez (2004) prospective Palpitations, dizzy, syncope, neg.
Holter96 patient-triggered ELR auto-triggered ELR ELR (PT): 22% ELR (AT): additional 17%
Balmelli (2003) prospective Palpitations, dizziness, syncope 101 patient-triggered ELR auto-triggered ELR ELR (PT): 37% ELR (AT): 63%Roche (2002) prospective Palpitations, neg. 24h Holter 65 patient-triggered ELR auto-triggered ELR ELR (PT): 67% ELR (AT): 80%Abbreviations: AECG, ambulatory ECG; AT, automatically triggered; ECG, electrocardiogram; ER, event recorder; ELR, event loop recorder; f’up, follow up; ILR, implantable loop recorder; MCT, mobile cardiac telemetry; neg, negative; PT, patient triggered; RCT, randomised controlled trial.a Extracted directly from primary publication for this RCT (Rothman, 2007).b Table 3 of Hoefman (2010) labels these studies as continuous event monitoring, but all these studies are of non-looping ERs (handheld, trans-telephonic etc.).c Holter is not a true comparator as patients were selected based on no arrhythmias after two episodes of Holter monitoring.d Proportions not reported by Hoefman (2010) for this study. e This study was classified by Hoefman (2010) as ELR versus ILR, but in fact is an analysis of patient-trigger ILR verses auto-trigger ILR (Reveal Plus).f Of 122, only 76 were patients with palpitations, and data reported is for this population.g Calculated post hoc from data extracted from Olson (2007): 14/18 patients had symptoms plus arrhythmia (PT = 78%); 1/18 patients had auto-detected arrhythmia with no symptoms (AT incremental = 6%).h Calculated post hoc from data extracted from Olson (2007): 27/58 patients had symptoms plus arrhythmia (PT = 47%); 15/58 patients had auto-detected arrhythmia with no symptoms (AT incremental = 26%).
MBS Review – Ambulatory Electrocardiography Review Report Page 178

May 2016
The findings of the 12 simple, descriptive studies in Hoefman (2010) are shown in Table 5.3.95. Some studies report change in management in addition to diagnostic yield. The authors comment that while higher yields appear to be generated by ELR, comparison of these results is not possible in light of the variations in populations and methodology, and would probably lead to false conclusions. They note that conclusions should be based on studies that compared the yield of two or more devices in the same group, or in randomised groups of patients (discussed above).
Table 5.3.95 Hoefman (2010): Findings of non-comparative studiesRef ID Study design Population N FindingsHolterMcClennen (2000)
retrospective Palpitations, presyncope, cerebral ischaemia, AF evaluation
164 Day 1: 19% relevant diagnosesDay 2: 3% relevant diagnoses
Rana (1989) retrospective Palpitations, dizziness, falls breathlessness, chest pain, syncope
252 12% relevant diagnoses10% change in management
Erikson (1980) retrospective Palpitations, dizziness, falls breathlessness, chest pain, syncope
150 29% relevant diagnoses46% management change
ERSchuchert (2002) prospective Palpitations 55 32% relevant diagnosesShanit (1996) prospective Chest pain, arrhythmia, hypertension,
reassurance2563 26% relevant diagnoses
Assayag (1992) retrospective Palpitations, Holter negative 1287 42% diagnosesSafe (1990) prospective 73 palpitations, 6 dizziness, 3 chest pain and
palpitations. Standard ECG not diagnostic82 23% diagnoses
13% relevant diagnosesELRWu (2003) retrospective Palpitations, presyncope, chest pain,
dyspnoea660 64% diagnoses
Palpitation group 66% diagnosesSummerton (2001)
prospective Palpitations 139 30% diagnoses19% relevant diagnoses
Zimetbaum (1998)
prospective Palpitations 112 84% diagnoses <2weeks36% relevant diagnoses2 weeks cost-effective
Fogel (1997) 62 prospective Palpitations, presyncope 184 66% patients with palpitations43% relevant diagnosesMost cost-effective with palpitations
Brown (1987) retrospective Palpitations dizziness, syncope, abnormal Holter, symptoms after treatment
106 66% diagnoses7% relevant diagnoses
Abbreviations: AF, atrial fibrillation; ECG, electrocardiogram; ER, event recorder; ELR, event loop recorder.
The authors concluded that the non-comparative studies were not very informative, and that the comparative studies suffered from methodological shortcomings. The authors also noted the variety of device models may explain differences in diagnostic yield. Therefore, choice of device is not evidence-based, and they consider the selection of device should be guided by the frequency of symptoms and whether or not patients feel palpitations. For daily symptoms, a Holter monitor can be used, while an event recorder is appropriate for symptoms that occur weekly. In symptomatic patients, patient-triggered devices are preferred over auto-triggered devices as the relationship between symptoms and arrhythmia is clear. In addition, these devices can serve to demonstrate an absence of arrhythmia during symptoms, which can exclude relevant arrhythmias as well as reassure anxious patients. Auto-triggered devices can be useful where a patient is not capable of operating the trigger, or when symptomless palpitations are suspected (e.g. paroxysmal AF).
62 Some patients used ER
MBS Review – Ambulatory Electrocardiography Review Report Page 179

May 2016
6 REVIEW OF THE ECONOMIC EVIDENCE FOR AECG
This section presents a summary of the economic studies that were identified through the systematic literature review. A formal modelled economic evaluation of AECG was not within the scope of this Review.
6.1 Studies relevant to the economic evaluation of AECG
The systematic literature review identified seven cost-utility analyses (CUAs), 10 cost-effectiveness analyses (CEAs) and five costing studies that were relevant to this Review. The included studies and the source of funding for those studies are listed in Table 6.1.96.
Table 6.1.96 Listing of all included economic studies
Ref ID Title Source of funding
CUAsDavis (2012) Implantable loop recorders are cost-effective when
used to investigate transient loss of consciousness which is either suspected to be arrhythmic or remains unexplained.
This work was supported by funding from NICE, UK.
Davis (2013) Tilt testing is more cost-effective than implantable loop recorder monitoring as a means of directing pacing therapy in people with recurrent episodes of suspected vasovagal syncope that affect their quality of life or present a high risk of injury.
This work was supported by funding from NICE, UK.
Kamel (2010) Cost-effectiveness of outpatient cardiac monitoring to detect atrial fibrillation after ischemic stroke.
None stated.
Levin (2015) A cost-effectiveness analysis of screening for silent atrial fibrillation after ischaemic stroke.
This work was supported by grant from VINNOVA – Swedish Governmental Agency for Innovation Systems.
Mayer (2013) Cost-effectiveness of 7-day-Holter monitoring alone or in combination with transthoracic echocardiography in patients with cerebral ischemia.
None stated.
MSAC (2003) MSAC Application 1061: Implantable loop recorder for unexplained recurrent syncope.
This work was commissioned by the Department of Health, Canberra.
Westby (2010) Transient loss of consciousness (‘blackouts’) management in adults and young people. Full guideline.
None stated. Guideline from the National Clinical Guideline Centre for Acute and Chronic Conditions, Royal College of Physicians, UK.
CEAsCzosek (2013) Utility of ambulatory monitoring in patients with
congenital heart disease.None stated.
Fitchet (2003) Holter monitoring vs tilt testing in the investigation of suspected vasovagal syncope.
None stated.
Giada (2007) Recurrent Unexplained Palpitations (RUP) Study: comparison of implantable loop recorder versus conventional diagnostic strategy
Funded, in part, by Medtronic.
Hoch (2006) Using the net benefit regression framework to construct cost-effectiveness acceptability curves: an example using data from a trial of external loop recorders versus Holter monitoring for ambulatory monitoring of "community-acquired" syncope.
None stated.
Krahn (1999) The high cost of syncope: cost implications of a new insertable loop recorder in the investigation of recurrent syncope.
None stated, but one author employed by ILR manufacturer.
Krahn (2003) Cost implications of testing strategy in patients with syncope: randomized assessment of syncope trial.
Not reported. Medtronic provided loop recorders for the 30 patients who underwent primary
MBS Review – Ambulatory Electrocardiography Review Report Page 180

May 2016
Ref ID Title Source of fundingmonitoring.
CEAsMcClennen (2001)
Holter monitoring: are two days better than one? Supported in part by grants from the Mathers Charitable Foundation; the National Aeronautics and Space Administration (NAGW-5039); and the National Institutes of Health/National Center for Research Resources (P41 RR13622).
Rockx (2005) Is ambulatory monitoring for “community-acquired” syncope economically attractive? A cost-effectiveness analysis of a randomized trial of external loop recorders versus Holter monitoring.
None stated.
Sadri (2014) The effect of late adoption of Canadian innovations: a case for implantable cardiac monitors.
Medtronic.
Simpson (1999) A cost-effective approach to the investigation of syncope: relative merit of differentdiagnostic strategies
None stated, but one author employed by ILR manufacturer.
Costing studiesEdvardsson (2015)
Costs of unstructured investigation of unexplained syncope: insights from a micro-costing analysis of the observational PICTURE registry.
The PICTURE registry was funded by Medtronic. Funding to pay the Open Access publication charges for this article was provided by Medtronic.
Farwell (2004) Use of implantable loop recorders in the diagnosis and management of syncope.
Partly funded by Medtronic.
Farwell (2006) The clinical impact of implantable loop recorders in patients with syncope.
Partly funded by Medtronic UK.
NICE (2010) Costing statement: transient loss of consciousness (‘blackouts’) management in adults and young people.
None stated.
Providencia (2014)
Financial impact of adopting implantable loop recorder diagnostic for unexplained syncope compared with conventional diagnostic pathway in Portugal.
Main author has a research grant from Medtronic. Other authors are Medtronic employees.
Abbreviations: CEA, cost-effectiveness analysis; CUA, cost-utility analysis; ILR, implantable loop recorder; MSAC, Medical Services Advisory Committee; NICE, National Institute for Health and Care Excellence; UK, United Kingdom.
Only one Australian study was identified (MSAC, 2003) that used Australian cost data; however, these data were based on 2003 MBS and PBS prices and may have changed significantly in the >10 years since this analysis was undertaken. Furthermore, this analysis does not incorporate recent evidence for ILR monitoring. As mentioned in Section 5.1.3, several RCTs comparing ILR with conventional testing have been published since 2003.
In addition, several of the economic studies examined the use of 48-hour Holter monitoring and one study examined 7-day Holter monitoring, which, according to expert opinion, is not standard practice in Australia.
6.2 Cost-utility analyses
The characteristics of the included CUAs are summarised in Table 6.2.97. All of the studies are described in further detail in Sections 6.2.1 to 6.2.7, with a particular focus on the key cost and effectiveness inputs, the results of the economic analyses and the findings of any sensitivity analyses that were undertaken.
MBS Review – Ambulatory Electrocardiography Review Report Page 181

May 2016
Table 6.2.97 Characteristics of included cost-utility analyses of AECG
Study IDCountry/ perspective
Population Comparison Economic analysis Source of health outcomes Source of utility weights
Authors’ conclusions
Unexplained syncope
MSAC (2003)
Australia
Healthcare system perspective
Hypothetical cohort of patients with recurrent syncopal episodes occurring at intervals >1 week apart
ILR vs standard care (i.e. no further ECG monitoring in the majority of patients)
CUA – ICER expressed as cost per QALY.
Time horizon: 3 years. Costs and benefits occurring in
years 2 and 3 were discounted at 5% per annum.
Published literature – incremental proportion of patients achieving a diagnosis (Krahn et al, 2001; Krahn et al, 2003), proportion with bradyarrhythmia/tachycardia (Krahn et al, 1998, 1999, 2001; Seidl et al 2000)
Published literature (Rose et al, 2000). The EQ-5D was completed by 136 patients with varying numbers of lifetime syncopal episodes.
In the base case, the incremental cost of ILR per additional QALY gained was $44,969.In sensitivity analyses the incremental cost per QALY ranged from $23,555 to $76,132.MSAC found that the use of ILR in patients who have had appropriate prior investigations is appropriate and supported public funding for this procedure on the basis of evidence of the safety, effectiveness and cost-effectiveness of ILR.
Westby (2010)a
UK
Healthcare system (NHS) and personal social services perspective
Patients referred for specialist cardiology assessment based on their initial assessment
24h or 48h Holter or ELR or ILR vs no further diagnostic testing; ILR vs conventional monitoringb
CUA – ICER expressed as cost per QALY.
Where possible, costs were based on 2007/2008 NHS reference costs.
Costs and benefits discounted at 3.5%.
Systematic literature search.Diagnostic yield of ILR vs conventional monitoring was based on the Farwell RCT.
Literature review. Only one study identified that provided preference-based measure of HRQoL in this population (Lopez-Jimenez, 2002; RCT, N=407).
AECG is cost-effective compared to no further testing in patients with suspected arrhythmic syncope or unexplained syncope and these results are robust under the sensitivity analyses conducted.
Davis (2012)
UK
Healthcare system (NHS) and personal social services perspectivec
Infrequent episodes of arrhythmic or unexplained syncope
1) ILR vs no further testingd
2) ILR vs conventional testing
CUA – ICER expressed as cost per QALY.
Decision tree model. Costs and QALYs were discounted
at 3.5%. Cost of ILR (implantation and
removal), ED attendance, hospital admission and follow up were based on NHS reference costs (2007-08).
Device cost based on a 2004 published estimate, uplifted to 2008 prices.
Systematic review of the literature was conducted to gather outcome data (e.g. diagnostic event rates, distribution of arrhythmia types, syncope recurrence rates, etc).Survival data from the Devon Heart Block and Bradycardia Survey study.
Targeted review of studies in patients with TLoC caused by either syncope or epilepsy to identify published preference-based utility weights.
ILR monitoring is likely to be a cost-effective testing strategy in people presenting to the UK NHS who are experiencing infrequent episodes of syncope which either remain unexplained or are suspected to be arrhythmic after initial assessment and specialist cardiovascular assessment.ILR monitoring results in an increase rate of arrhythmia diagnosis, but at an additional cost.NICE has accepted that the use of ILR patients with infrequent episodes of arrhythmic or unexplained syncope is cost-effective and have recommended its use in this population.
MBS Review – Ambulatory Electrocardiography Review Report Page 182
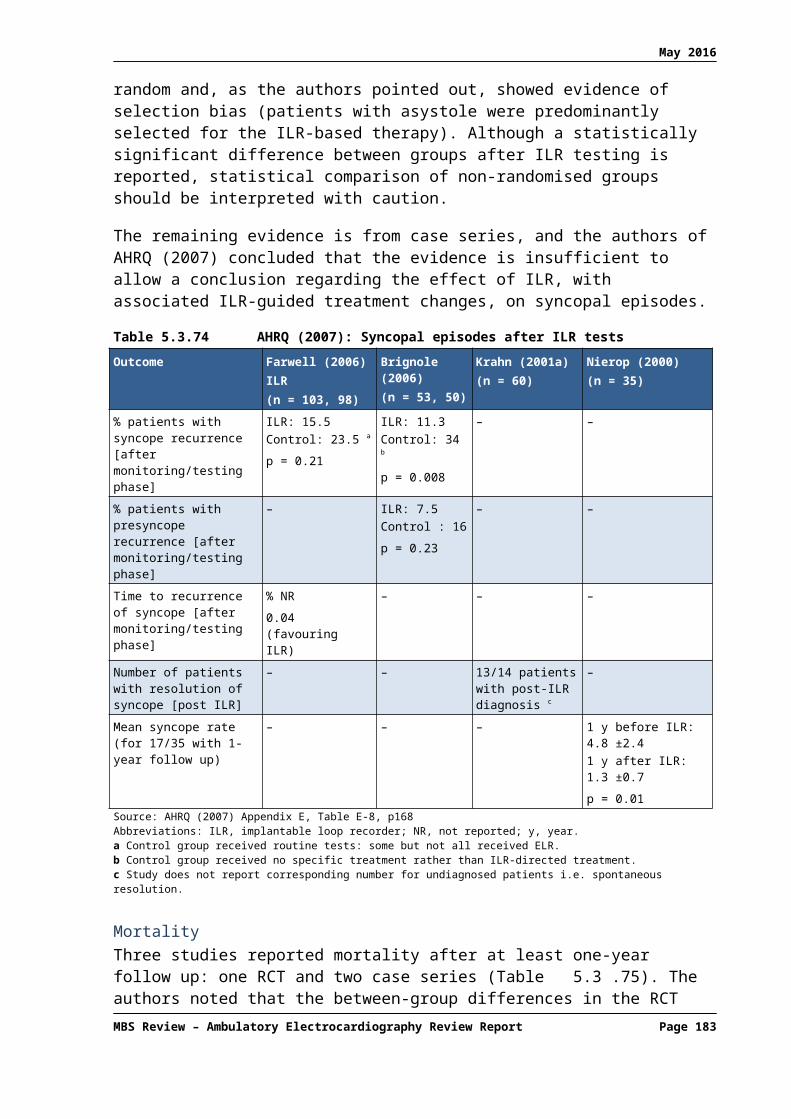
May 2016
Study IDCountry/ perspective
Population Comparison Economic analysis Source of health outcomes Source of utility weights
Authors’ conclusions
Davis (2013)
UK
Healthcare system (NHS) and personal social services perspectivec
Recurrent episodes of syncope that are suspected to be vasovagal
ILR vs no testing; TT vs no testing; TT + ILR when TT is ‘negative’ (i.e. does not provoke syncope accompanied by asystole) vs no testing.
CUA – ICER expressed as cost per QALY.
Decision tree model. Costs and QALYs were
discounted at 3.5%. Costs for diagnostic procedures
(TT and ILR implantation and removal), ED attendance, hospital admissions and follow up were based on NHS reference costs (2007-08).
Device cost based on a 2004 published estimate, uplifted to 2008 prices.
Diagnostic event rates applied in the model were from the largest of three studies identified through a systematic literature search – the ISSUE 2 study (Brignole et al, 2006). Other outcomes (e.g. syncope recurrence rate) taken from other studies identified in the systematic review.Survival data from the Devon Heart Block and Bradycardia Survey study.
Utility weights calculated for the 2010 NICE guideline were used in this economic analysis (Westby et al, 2010).
TT alone is likely to be the most cost-effective strategy to direct pacing therapy in patient with recurrent episodes of syncope that are adversely affecting their quality of life or represent a high risk of injury and which are suspected to be vasovagal. ILR alone was extendedly dominated by the other strategies, meaning that it is never the most cost-effective option.Therefore, NICE has recommended the use of TT in this population because it considers it to be a more cost-effective use of NHS resources than alternative strategies which include ILR monitoring.
Cerebral ischaemia
Levin (2015)
Sweden
Societal perspectivee
Hypothetical cohort of patients, 75 yrs, with recent ischaemic stroke or TIA. No previous diagnosis of AF
24h Holter vs no screening; intermittent ECG with handheld device vs no screeningf
Short-term decision tree model until onset of anticoagulant treatment followed by Markov model simulating health states for 20 years.
Costs and effects (life-years and QALYs) discounted by 3% annually.
Diagnostic yield data obtained from one observational prospective controlled study (Sobocinski, 2012; N=249).
Costs were converted to Euros on 31/12/2013 (1€ = 8.83 SEK).
Screening costs based on actual costs in clinical study minus costs associated with conducting the study (Grond, 2013).
ComplicationsPatients on warfarin: RE-LY trial (Connolly 2009; Oldgren 2011); Patients not on warfarin: data from a Swedish registry study (Friberg 2012).SurvivalSeveral sources in the published literature and stroke registry data.
Assessed in separate Swedish study using EQ-5D (Burstrom 2001).
Screening of silent AF by intermittent (handheld) ECG recordings in patients with a recent ischaemic stroke is a cost-effective use of health care resources saving costs and lives and improving the quality of life.Continuous 24h Holter monitoring was inferior to intermittent ECG in terms of cost-effectiveness, due to both lower sensitivity and higher costs.
MBS Review – Ambulatory Electrocardiography Review Report Page 183

May 2016
Study IDCountry/ perspective
Population Comparison Economic analysis Source of health outcomes Source of utility weights
Authors’ conclusions
Mayer (2013)
Germany
Third-party payers’ perspective
Hypothetical cohort of patients, 68 yrs, after first ischaemic stroke or TIA. No previous diagnosis of AF
24h Holter vs 7d Holter (alone or in combination with prior selection via TTE).
Markov microsimulation model to estimate lifetime costs, cumulative QALYs, and ICER.
Cost and QALY estimates discounted at a rate of 3%.
Costs were adjusted to 2011 Euro using German CPI.
Time horizon: lifetime; Cycle length: 6 months.
Inputs for ischaemic stroke/TIA recurrence obtained from published clinical trials (ACTIVE W trial, RE-LY trial) and meta-analyses.PAF detection rate for each strategy derived from the Find-AF cohort study.
Published quality of life and cost-effectiveness studies
A 7d Holter increases the detection of PAF in patients with cerebral ischaemia which leads to improved antithrombotic regimens; therefore, it avoids recurrent strokes, saves future costs, and decreases quality of life impairment.The use of a 7d Holter as opposed to a standard 24h Holter in patients with cerebral ischaemia is cost-effective across a wide range of variation of key variables and model input data.
Kamel (2010)
US
Societal perspectiveg
Hypothetical cohort of patients, 70 yrs, with AF and prior stroke
Standard care (aspirin prescribed after ischaemic stroke, no outpatient cardiac monitoring); vs an additional 7 days of outpatient cardiac monitoringh, which could detect AF and trigger a change from aspirin to warfarin.
Semi-Markov model. Cost-utility analysis – ICER
expressed as cost per QALY. Yield of outpatient cardiac
monitoring was estimated using a systematic review of the English-language literature.
Costs and life-years were discounted at 3%.
Costs and utilities were projected over a maximum of 20 years; median expected survival was 13.3 years.
Costs were converted to 2010 USD using the medical care component of the CPI.
Published literature. Raw data from multiple sources were meta-analysed where applicable.
Published literature. Most utility weights were sourced from O’Brien and Gage (2005).
In this cost-utility analysis based on a systematic review of the literature, 1 week of continuous outpatient cardiac monitoring after ischaemic stroke appears cost-effective through identification of patients with underlying paroxysmal AF who would benefit from warfarin therapy.The study emphasises that there is a lack of clinical trials addressing the optimal length of monitoring.
Abbreviations: AECG, ambulatory electrocardiography; AF, atrial fibrillation; CPI, consumer price index; CUA, cost-utility analysis; ECG, electrocardiogram; ED, Emergency department; ELR, external loop recorder; EQ-5D, EuroQoL-5 dimensions; HRQoL, health-related quality of life; ICER, incremental cost-effectiveness ratio; ILR, implantable loop recorder; IS, ischaemic stroke; ISSUE, International Study on Syncope of Uncertain Aetiology; MSAC, Medical Services Advisory Committee; NA, not applicable; NHS, National Health Service; NICE, National Institute for Health and Care Excellence; PAF, paroxysmal atrial fibrillation; QALY, quality-adjusted life-year; RCT, randomised controlled trial; SAQ, Seattle Angina Questionnaire; SEK, Swedish Krona; TIA, transient ischaemic attack; TLoC, transient loss of consciousness; TT, tilt test; TTE, transthoracic echocardiography; UK, United Kingdom; US, United States; USD, US dollars.a See Davis et al (2013) for details of the economic evaluation of various testing strategies to direct pacing therapy. This evaluation was also presented in Section 6.7 of Westby et al (2010) but is not reproduced here.b Westby et al (2010) noted that the conventional monitoring arm from Farwell (2006) seemed to be reasonably representative of the testing strategy that might be used in the UK if ILRs were not available. Note that conventional monitoring was not considered a suitable comparator for ELR or Holter monitoring as these tests form part of the conventional monitoring strategy.c This analysis was conducted to inform clinical guideline recommendations made by NICE on the management of TLoC.d Initial testing involves assessment of history, physical examination, and 12-lead ECG.e Productivity losses not estimated due to age of patients (75 years).f Handheld ECG versus no screening was the base case analysis; however 24h Holter vs no monitoring was a secondary comparison that was of relevance to this Review.g However, costs borne by caretakers were not considered.h The model was based on the use of auto-triggered, non-attended, surface loop recorders.
MBS Review – Ambulatory Electrocardiography Review Report Page 184
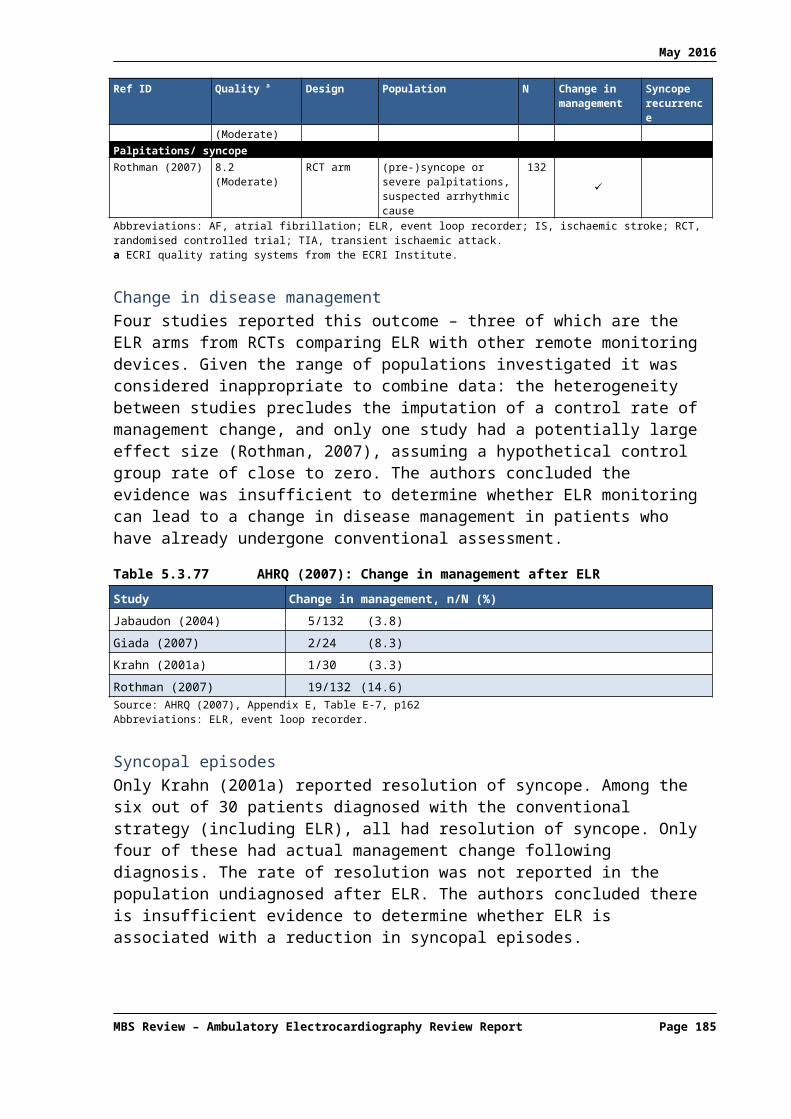
May 2016
6.2.1 Medical Services Advisory Committee (2003)
In November 2003, MSAC considered an Assessment Report that evaluated the use of ILR in unexplained recurrent syncope (MSAC application 1061). After reviewing the clinical and economic evidence, MSAC recommended that public funding should be supported for the use of ILR in patients with recurrent syncope who have undergone appropriate prior investigations.
The Assessment Report was informed by an application from an ILR manufacturer that included two economic evaluations: one that placed ILR early in the diagnostic pathway (instead of ELR and TT testing) and one that placed ILR later in the pathway. The latter was more applicable to Australian clinical practice. Some estimates and assumptions in the manufacturer’s model were adopted in a final model that was presented to MSAC. The final model, developed by the Centre for Health Economics of Monash University, is summarised below.
A cost-utility analysis was undertaken to compare ILR with standard care in the diagnosis of recurrent unexplained syncope in patients who experience transient symptoms suggestive of cardiac arrhythmia. The relevant patient population was patients in whom diagnosis is not achieved through history, physical examination, monitoring of blood pressure and ECG, and who are determined to either have no structural heart disease or be at low risk of SCD. In these patients the use of ELR may not be suitable, as it is impractical for patients to wear an ELR for more than a few weeks.
The main outcome in the model was the proportion of patients successfully treated following diagnosis. Based on data from the crossover arm of Krahn et al (2003), the diagnostic yield of ILR in patients in whom ELR failed to achieve a diagnosis was 33%. As shown in Table 6.2.98, the model assumed that no further diagnoses would be established in the standard care arm (assumed to consist of no further ECG monitoring in the majority of cases, because ELR is inappropriate or has failed). Of the additional patients diagnosed, it was assumed that 77% are diagnosed with bradyarrhythmia and 23% are diagnosed with tachyarrhythmia (as per the manufacturer’s application).
Table 6.2.98 Key inputs used in the model (MSAC, 2003)
Description Event rate
ILRNo diagnosis 0.670
Diagnosis made 0.330
Diagnosis made and successfully treated 0.740
Diagnosis made and unsuccessfully treated 0.260
Standard careNo diagnosis 1.000
Diagnosis made 0
Successfully treated 0.740
Unsuccessfully treated 0.260Source: MSAC (2003), Figure 7, p47Abbreviations: ILR, implantable loop recorder; MSAC, Medical Services Advisory Committee.
The original economic evaluation undertaken by the manufacturer used EQ-5D data from Rose et al (2000) to estimate utility weights. The model assumed a utility gain of 0.242 for successfully treated patients compared with patients who do not achieve a diagnosis or are
MBS Review – Ambulatory Electrocardiography Review Report Page 185

May 2016
unsuccessfully treated following diagnosis. However, the assessment group believed this to be an overestimate63 and instead adopted a lower estimate for utility gain of 0.132 based on a sensitivity analysis undertaken in the manufacturer’s application.
Costs included in the model were from various sources including: the manufacturer’s application (cost of the device); MBS item fees from May 2003 (costs for the screening test and follow-up visits, implant and explant procedures); and PBS prices from August 2003 (cost of antibiotic prophylaxis following implant of the ILR, antibiotics for the treatment of adverse events,64 and costs for patients treated pharmacologically for bradyarrhythmia or tachyarrhythmia). Finally, the model assumed that 25% of patients with bradyarrhythmia are treated by insertion of a pacemaker. Those patients were assigned a treatment cost of $7,000 based on Round 5 DRG cost weights (F17Z).
The results of the cost-utility analysis are shown in Table 6.2.99. The total incremental cost of ILR included incremental diagnostic costs of $4,419.03, an incremental treatment cost of $695.90, and –$970.10 in cost offsets. Cost offsets were incorporated in order to compensate for the avoidance of treatment and fewer hospitalisations that would result from recurrent syncopal episodes if successful diagnosis/treatment with ILR did not occur.
Table 6.2.99 Results of the economic analysis: recurrent unexplained syncope – ILR vs. standard care (MSAC, 2003)
Model version Incremental cost of ILR ($)
Incremental QALYs
Incremental costper additional
patient diagnosed ($)
Incremental costper patient successfully treated ($)
Incremental costper QALY gained
($)
Base case 4,144.83 0.09 12,560 16,973 44,969Source: MSAC (2003), Table 26, p48Abbreviations: ILR, implantable loop recorder; MSAC, Medical Services Advisory Committee; QALY, quality-adjusted life-year.Note: 5% discount applied.
Finally, the economic evaluation provided a series of one-way sensitivity analyses that are summarised in Table 6.2.100.
Table 6.2.100 Sensitivity analyses: recurrent unexplained syncope – ILR vs. standard care – (MSAC, 2003)
Parameter Base case value
New value Revised incremental cost per QALY gained ($)
Time horizon 3 years 5 years 25,392
% bradycardia/ tachycardia 77%/23% 50%/50% 44,343
Additional proportion of patients diagnosed by ILR 33% 20% 76,132
Proportion of diagnosed cases who are successfully treated 74% 60% 57,917
Utility gain from successful treatment (each year, undiscounted)
0.132 0.242 23,555
Incremental cost of ILR, excluding treatment costs and cost offsets
- 4,419.03 47,944
Source: MSAC (2003), Table 26, p49Abbreviations: ILR, implantable loop recorder; MSAC, Medical Services Advisory Committee; QALY, quality-adjusted life-year.Note: 5% discount applied.
63 The manufacturer’s model estimated the average utility score for patients experiencing 4.4 syncopal episodes per year (based on Rose et al, 2000); however, other published sources report a much lower rate (e.g. Krahn et al [2001] reported between 2.3 and 2.8 episodes per year).
64 This cost was applied to 2.3% of patients (i.e. the proportion estimated to experience adverse events).
MBS Review – Ambulatory Electrocardiography Review Report Page 186
May 2016
It should be noted that it was not clear from the MSAC report how the proportion of patients successfully treated had been estimated and the model was sensitive to that outcome.
6.2.2 Westby (2010)
Westby et al (2010) undertook a systematic review of the literature to identify published economic evaluations that were relevant to the NICE guideline. The authors stated that most of the studies found through the systematic review did not consider the impact of diagnosis on patient outcomes and all of the studies were considered to have potentially serious limitations. One CUA was identified (MSAC, 2003); however, Westby et al (2010) noted several limitations with this analysis, including the fact that it was from a non-UK setting.
In lieu of existing published evidence from the UK, Westby et al (2010) undertook an economic evaluation to assess the cost-effectiveness of AECG in patients who are referred for specialist cardiology assessment based on their initial assessment. The study population was divided into three subgroups based on the suspected cause of syncope after initial assessment and any prior use of diagnostic tests, as these factors were thought to be likely to affect diagnostic yield. The subgroups considered in the model were:
1. Suspected arrhythmia on the basis of the initial assessment
2. Unexplained cause on the basis of the initial assessment
3. Unexplained cause following secondary tests
The Guideline Development Group emphasised that the various types of AECG considered in the economic evaluation (24h Holter, 48h Holter, ELR and ILR) would be used in different populations based on the frequency of syncopal episodes. Therefore, the model did not compare different forms of AECG against each other as they are unlikely to be relevant alternatives in the same patient. The specific comparisons assessed in this economic evaluation were summarised in Table 6.2.97.
Several key costs used in the economic evaluation are shown in Table 6.2.101. In addition to the costs shown below, the economic evaluation considered treatment costs (e.g. implantation, device and follow-up costs relating to pacing therapy), and costs following recurrence (e.g. ambulance, ED attendance, and admission costs).
Table 6.2.101 Key device and procedure costs applied to the model (Westby, 2010)
Description HRG code Cost, midpoint (IQR), £
Source
ILR monitoringImplantation (day case procedure) EA03Z 1,895 (1,160 – 2,564) NHS reference cost 2007-08
Removal (day case procedure) EA47Z 526 (347 – 575) NHS reference cost 2007-08
Device acquisition - 1,600 (NR)a National Horizon Scanning Centre 2004
Holter and ELR monitoring24h ECG/BP monitoring DA09 54 (37 – 63) NHS reference cost 2007-08
AECG monitoring (outpatient) EA47Zb 117 (64 – 156) NHS reference cost 2007-08Source: Westby et al (2010), pp. 319-320Abbreviations: AECG, ambulatory electrocardiogram; BP, blood pressure; ECG, electrocardiogram; ELR, external loop recorder; HRG, Healthcare Resource Group; ILR, implantable loop recorder; IQR, interquartile range; NHS, National Health Service; NR, not reported.a Unit cost was uplifted from 2004 to 2008 using the Hospital and Community Services Pay and Prices Index (uplift = 256.9/224.8). b Covers a variety of procedures including 24/48h AECG, Holter extended ECG, Cardiomemo ECG, exercise ECG, tilt table testing and ILR removal. This cost was only used in a sensitivity analysis, as the Guideline Development Group felt that the direct access cost (DA09, £54) was likely to be the most relevant cost for AECG in the syncope population.
MBS Review – Ambulatory Electrocardiography Review Report Page 187

May 2016
The resource use and cost data shown in Table 6.2.102 relates to the ILR versus conventional monitoring comparison. The data were derived from interim findings of the Farwell RCT to the point at which all patients had been followed up for at least six months (Farwell et al, 2004). As shown below, the lower total cost associated with ILR (–£809, 95% CI –£2766.22 to £123.42) was largely driven by the difference in hospitalisation costs. Note that Westby et al (2010) chose to use resource use/costs from Farwell (2004) to reflect a lower rate of testing and lower cost of hospitalisation in the ILR group; however, by the end of the study (median follow up 17 months) the cost difference between ILR and conventional monitoring was no longer statistically significant (Farwell et al, 2006).
Table 6.2.102 Resource use and cost of testing and hospitalisations after randomisation (Westby, 2010)
Resource ILR Conventional monitoring Difference in costs, Mean (95% CI)
Computed tomography head 4 8 –5.30 (–13.86 to 1.29)
Magnetic resonance imaging 1 1 –0.05 (–3.06 to 2.91)
Electroencephalogram 0 2 –2.04 (–4.80 to 0.72)
Carotid Doppler 3 5 –2.19 (–8.14 to 2.89)
Echo 12 15 –8.54 (–25.31 to 6.54)
24h Holter 4 11 –7.34 (–15.08 to –0.37)
EER: ‘R Test’ 5 28 –29.84 (–43.49 to –18.04)
Electrophysiologic study 0 1 –6.12 (–17.90 to 5.65)
Total investigation costs, £ 34.0 95.4 –61.43 (–92.92 to –35.16)
Hospitalisation costs, £ 379 1090 –747.30 (–2728.48 to –72.75)
Total costs, £ 406 1210 –808.72 (–2766.22 to –123.42)Source: Westby et al (2010), Table 26, p321Abbreviations: CI, confidence interval; EER, external event recorder (ELR); ILR, implantable loop recorder.Note: Costs reported exclude the cost of ILR.
Across all comparisons, the reference standard for diagnosing or excluding arrhythmia was an ECG recording during syncope and the model assumed that all patients who had an ECG recorded during syncope were correctly diagnosed. The events and outcomes that made up the model structure are summarised below:
Syncopal event during testing (P1)
- Arrhythmia recorded (P2)- Normal rhythm recorded (P3)- Event missed (1-P2-P3)
No syncopal event during testing (1-P1)
- Arrhythmia captured not during syncopal event (P4)- No arrhythmia recorded (1-P4)
Westby et al (2010) calculated probabilities for the economic evaluation (P1, P2, P3, P4) using raw data from all of the available studies for each AECG type. As the systematic literature search did not identify any studies comparing AECG with a strategy of no further testing, the model assumed that the no testing strategy would result in the same rate of syncope during the monitoring period but that none of the episodes would result in a diagnosis.
MBS Review – Ambulatory Electrocardiography Review Report Page 188

May 2016
A summary of the data for each population, type of AECG, and outcome is presented in Table6.2.103 for the comparisons against no further testing and Table 6.2.104 for ILR versus conventional monitoring.
Table 6.2.103 Event rates used to populate model structure for indirect comparisons (ILR, ELR, 24h Holter, 48h Holter) against no further testing (Westby, 2010)
Population/ Technology
N studies
Prob of syncope, P1
Syncope +arrhythmia, P2
Syncope + normal ECG, P3
Syncope + no ECG, (1-P2-P3)
No syncope + arrhythmia (P4)
ILRSuspected arrhythmia
4 133/253=0.53
78/133=0.59
39/133=0.29
16/133=0.12
4/4 (3 studies)=0.09
Unexplained after secondary tests
15 616/1102=0.56
300/616=0.49
276/616=0.45
40/616=0.06
23/175 (7 studies)=0.13
ELRSuspected arrhythmia
1 35/51=0.69
21/35=0.60
14/35=0.40
0/35=0.00
0/16=0.00
Unexplained after secondary tests
4 98/192=0.51
17/98=0.17
49/98=0.50
32/98=0.33
8/16 (1 study)=0.50
48h HolterSuspected arrhythmia
1 8/63=0.13
4/8=0.50
4/8=0.50
0/8=0.00
8/55=0.15
Unexplained after initial tests
1 20/95=0.21
1/20=0.05
19/20=0.95
0/20=0.00
25/75=0.33
Unexplained after secondary tests
1 12/51=0.24
0/12=0.00
12/12=1.00
0/12=0.00
0/39=0.00
24h HolterSuspected arrhythmia
1 22/140=0.16
15/22=0.68
7/22=0.32
0/22=0.00
0/118=0.00
Unexplained after initial tests
1 3/287=0.01
2/3=0.67
1/3=0.33
0/3=0.00
55/284=0.19
Source: Westby et al (2010), Table 27, p324Abbreviations: ECG, electrocardiogram; ELR, external loop recorder; ILR, implantable loop recorder.
Table 6.2.104 Event rates used to populate model structure for ILR versus conventional monitoring (Westby, 2010)
Population/ Technology
N studies
Prob of syncope, P1
Syncope +arrhythmia, P2
Syncope + normal ECG, P3
Syncope + no ECG, (1-P2-P3)
No syncope + arrhythmia (P4)
ILR 1 48/101=0.48
20/48=0.42
23/48=0.48
5/48=0.10
0/53=0.00
Conventional monitoring
1 37/97=0.38
4/37=0.11
3/37=0.08
30/37=0.81
0/60=0.00
Source: Westby et al (2010): Table 28, p 325.Abbreviations: ECG, electrocardiogram; ILR, implantable loop recorder.Note: Event rates were from Farwell et al (2006).
Using the event rates outlined above, the economic model estimated the costs and health outcomes that would result from using each of the AECG monitors. Post-diagnostic outcomes considered in the evaluation were restricted to three key arrhythmias (atrioventricular [AV] block, sick sinus syndrome [SSS] and ventricular tachycardia [VT]) that were selected based on the potential impact of treatment on costs (e.g. dual-chamber pacemaker) and QALYs.65 The event rates used to describe the distribution of arrhythmias are shown in Table 6.2.105. 65 By not including any benefits for patients who have an arrhythmia diagnosed other than SSS, AV block or VT and not
including any benefits for patients who have an arrhythmic cause excluded, the model probably underestimated the cost-effectiveness of testing.
MBS Review – Ambulatory Electrocardiography Review Report Page 189

May 2016
These event rates were applied to all forms of AECG monitoring, assuming that there would be no difference in the type of arrhythmias that the different AECG technologies would diagnose or fail to detect. As outlined in the table below, the model also included post-diagnostic outcomes for some clinically significant arrhythmias recorded during an asymptomatic period.
Table 6.2.105 Event rates used to describe the distribution of arrhythmias
Parameter Event rate N studiesProportion of arrhythmias during syncope that are bradyarrhythmias
406/550 = 0.74 31
Proportion of bradyarrhythmias during syncope that are: AV block Sick sinus syndrome Other bradycardias
106/279 = 0.38157/279 = 0.5616/279 = 0.06
20
Proportion of tachyarrhythmias during syncope that are: VT during syncope Other tachycardias
38/141 = 0.27103/141 = 0.73
27
Proportion of arrhythmias not during syncope that are bradyarrhythmias
63/129 = 0.49 8
Proportion of bradyarrhythmias not during syncope that are: Complete AV block Asystole >3s Other bradycardias
16/63 = 0.2344/63 = 0.649/63 = 0.13
8
Proportion of tachyarrhythmias not during syncope that are: Sustained VT Other tachycardias
25/66 = 0.3841/66 = 0.62
8
Source: Westby et al (2010), Table 29, p327Abbreviations: AV, atrioventricular; VT, ventricular tachycardia.
A non-systematic review was undertaken to source estimates of post-monitoring costs and benefits that would occur in diagnosed and undiagnosed patients with SSS, AV block and VT, including the cost of therapy after diagnosis (e.g. dual-chamber pacing for bradycardia due to SSS or AV block). Similarly a literature review sourced quality of life evidence to provide estimates of utility weights for the model.
Table 6.2.106 Key cost inputs relating to therapy/recurrence after monitoring
Item HRG code Cost, £ SourceDual-chamber pacing Device cost (including leads) Annual follow-up appointment
-320a
£1882£105
Association of British Healthcare IndustriesNHS reference cost 2007-08
Cost of recurrence VB07ZPS31
£342b NHS reference cost 2007-08
Cost of recurrence (including hospitalisation)c
VB07ZPS31EB081
£660 NHS reference cost 2007-08
Abbreviations: HRG, Healthcare Resource Group; NHS, National Health Service.a NHS reference cost for a consultant led non-admitted face-to-face follow-up appointment in cardiology.b The model assumed that each recurrence results in a category A ambulance call-out and a category 2 A&E consultation.c This cost was used in a sensitivity analysis.
The results of the economic analysis are presented in Table 6.2.107. The table shows the additional diagnoses achieved for testing compared to no testing (or conventional monitoring for ILR) per 1000 patients tested, as well as the incremental costs and QALYs per patient tested. Across all comparisons of AECG versus no further testing, AECG monitoring was
MBS Review – Ambulatory Electrocardiography Review Report Page 190

May 2016
highly likely to be cost-effective compared with no testing at a threshold of £20,000 per QALY gained.
The comparison of ILR and conventional testing resulted in lower cost-effectiveness compared with ILR versus no further testing, based on the assumption that some diagnoses would be achieved through other AECG technologies used in the conventional testing arm. A later publication that reported the results of the ILR comparisons indicated that the QALY gains associated with ILR monitoring were largely the result of treatment of AV block (Davis et al, 2012).
MBS Review – Ambulatory Electrocardiography Review Report Page 191
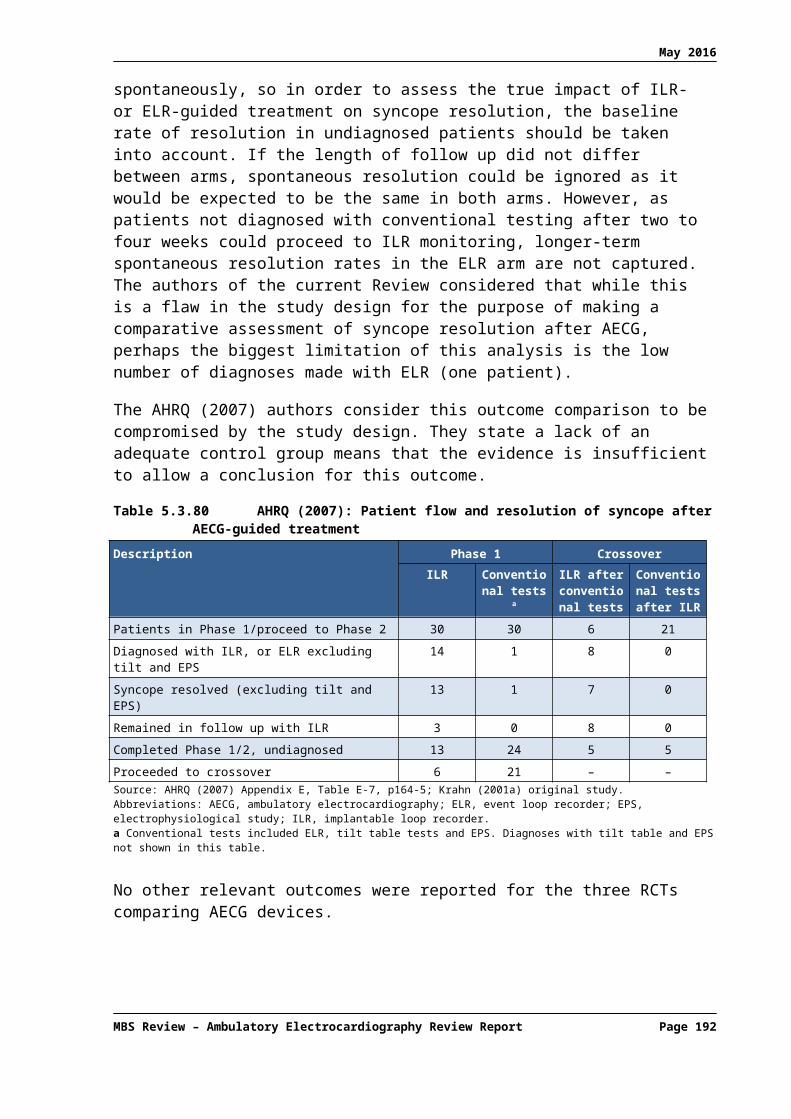
May 2016
Table 6.2.107 Cost-effectiveness results for AECG compared with no testing, or conventional testing for ILR (Westby, 2010)
Comparison and population AV block diagnoseda
SSS diagnoseda
VT diagnoseda
Other arrhythmia diagnoseda
Arrhythmia excludeda
Incremental cost per patient
tested (£)
Incremental QALY gained per patient
tested
Incremental cost per QALY
(£)
Likelihood of being CE at
£20K per QALY gained (%)
Likelihood of being CE at
£30K per QALY gained (%)
ILR vs no testingSuspected arrhythmia 91 (91) 143 (141) 31 (30) 91 (88) 155 (154) 6,522 (6,460) 0.398 (0.394) 16,370 (16,390) 93.9 100.0
Unexplained after secondary tests
83 (83) 132 (131) 31 (30) 86 (86) 250 (250) 6,410 (6,380) 0.369 (0.366) 17,390 (17,450) 88.3 100.0
ILR vs conventional testingb
Unexplained after secondary tests
42 (44) 61 (65) 10 (11) 34 (37) 186 (197) 4,150 (4,220) 0.171 (0.181) 24,310 (23,360) 24.0 72.0
ELR vs no testingSuspected arrhythmia 112 (115) 169 (171) 31 (29) 98 (96) 269 (275) 2,770 (2,700) 0.468 (0.471) 5,910 (5,730) 100.0 100.0
Unexplained after secondary tests
53 (53) 114 (113) 54 (54) 114 (114) 253 (255) 3,220 (3,207) 0.324 (0.361) 9,930 (10,140) 100.0 100.0
48h Holter vs no testingSuspected arrhythmia 35 (32) 71 (66) 31 (29) 68 (63) 69 (63) 1,940 (1,800) 0.202 (0.184) 9,590 (9,790) 100.0 100.0
Unexplained after initial tests 35 (33) 90 (86) 52 (52) 106 (103) 197 (200) 2,960 (2,900) 0.260 (0.243) 11,380 (11,930) 100.0 100.0
Unexplained after secondary testsc
7 (0) 13 (0) 5 (0) 11 (0) 227 (235) 361 (50) 0.037 (0.000) 9,850 (dominated)
96.7 99.0
24h Holter vs no testingSuspected arrhythmia 31 (30) 47 (45) 9 (8) 28 (25) 54 (50) 823 (743) 0.131 (0.123) 6,270 (6,019) 100.0 100.0
Unexplained after initial tests 24 (24) 64 (64) 38 (38) 76 (75) 6 (3) 2,150 (2,122) 0.184 (0.176) 11,720 (12,040) 100.0 100.0Abbreviations: AECG, ambulatory electrocardiogram; AV, atrioventricular; CE, cost-effective; ELR, external loop recorder; ILR, implantable loop recorder; QALY, quality-adjusted life-year; SSS, sick sinus syndrome; VT, ventricular tachycardia. Note: Main results are averages across 10,000 PSA samples and deterministic estimates are presented in brackets.a Additional patients with arrhythmia diagnosed or excluded from 1000 patients tested.b Note: the guideline development group felt that Holter or ELR monitoring was inappropriate in patients having very infrequent syncopal episodes as the likelihood of achieving symptoms ECG correlation was low. However, the results for ILR vs conventional testing based on the Farwell 2006 study, show that ILR is still reasonably cost-effective (ICER <£30,000 per QALY) even when compared to a strategy in which some patients receive a diagnosis through the use of other forms of AECG.c The probabilistic estimate for this comparison should be treated with caution. This comparison was informed by a single study in which none of the Holter tests results in an arrhythmia diagnosis.
MBS Review – Ambulatory Electrocardiography Review Report Page 192

May 2016
Several scenario analyses were undertaken to assess whether the cost-effectiveness results were sensitive to any of the key assumptions in the model. The results demonstrate that the model is most sensitive to changes in assumptions regarding HRQoL gain and survival after treatment. Interestingly, the cost-effectiveness results were robust to changes in the cost of ongoing recurrences in undiagnosed and therefore untreated AV block or SSS.
Table 6.2.108 Scenario sensitivity analysis
Comparison and population Incremental cost per patient tested
(£)
Incremental QALY gained per patient
tested
Incremental cost per QALY (£)
ILR monitoring vs no testing in population with unexplained syncope after secondary testsBase case 6,410 0.369 17,390
No survival gain from pacing after AV block observed during syncope
6,400 0.261 24,510
Recurrences continue beyond 2 years in unpaced patients with AV block or SSS
6,340 0.367 17,310
Recurrences result in short stay admission in addition to ambulance call-out and A&E assessment
6,380 0.367 17,370
Continued recurrences beyond 2 years in unpaced patients and recurrences result in admission
6,290 0.367 17,140
Unpaced patients with AV block or SSS experience an average of one admission per annum
5,620 0.367 15,320
Lower limit for utility gain after pacing and no utility gain after pacing an no utility gain after ICD therapy
6,400 0.284 22,520
No uplift in ILR device cost since 2004 (£1,400 instead of £1,600)
6,200 0.367 16,890
Costs and benefits of pacing estimated over 6 year horizon
6,360 0.261 24,350
ILR monitoring vs conventional testing in population with unexplained syncopeBase case 4,150 0.171 24,310
No cost saving (zero instead of –£809) from lower resource use after ILR compared to conventional monitoring
4,970 0.170 29,130
24h Holter monitoring vs no testing in a population with unexplained syncope after secondary testsBase case 2,150 0.184 11,720
Outpatient costs for AECG (£117 instead of £54) 2,210 0.183 12,050
24 Holter monitoring vs no testing in suspected arrhythmiaBase case 823 0.131 6,270
Lower limit for utility gain after pacing and no utility gain after ICD therapy
825 0.102 8,050
Abbreviations: A&E, Accident and Emergency; AECG, ambulatory electrocardiogram; AV, atrioventricular; ICD, implantable cardioverter-defibrillator; ILR, implantable loop recorder; QALY, quality-adjusted life-year; SSS, sick sinus syndrome.
Finally, note that Westby et al (2010) also undertook an economic evaluation of testing strategies using TT testing, AECG or sequences of these tests in patients with suspected vasovagal syncope in whom pacemaker therapy is being considered. This economic evaluation resulted in a later publication by Davis et al (2013) and is summarised in Section 6.2.4.
6.2.3 Davis (2012)
This publication described an economic evaluation that was undertaken to inform the 2010 NICE guideline on the cost-effectiveness of ILRs in a UK setting. The results of the economic
MBS Review – Ambulatory Electrocardiography Review Report Page 193

May 2016
evaluation are summarised under Westby et al (2010), along with the cost-effectiveness of other AECG technologies.
6.2.4 Davis (2013)
This study was undertaken to inform the 2010 NICE guideline on the management of syncope (referred to in the guideline as TLoC).66 This economic evaluation assessed the cost-effectiveness of ILRs and TT testing (TT) to determine the appropriateness of pacing therapy in people with recurrent syncope that is suspected to be vasovagal. Cardiac pacing may be a beneficial intervention in patients who experience a cardioinhibitory response (bradycardia or asystole) during vasovagal syncope; however, patients whose syncope is mediated by a vasodepressor mechanism would not receive symptomatic benefit from pacing therapy, as it would not prevent the drop in blood pressure that causes syncope.
As shown in Table 6.2.97, the model compared three testing strategies to no testing: ILR alone, TT alone, and TT followed by ILR when TT is ‘negative’.67 The underlying mechanism of syncope in the no testing strategy was assumed to be identical to that seen in the ILR monitoring strategy; however, it was assumed that the no testing strategy would not result in any diagnoses.
The total cost of each strategy included the cost of testing and providing treatment following diagnosis, minus any cost savings from reductions in syncope recurrence. For treatment following diagnosis, the model assumed that all patients with asystole during syncope would receive a dual-chamber pacemaker and that patients with VT during syncope would receive an implantable cardioverter-defibrillator (ICD).
As shown in Table 6.2.109, the model estimated that the strategy involving ILR alone would result in the lowest QALY gains over the lifetime of the model compared with the strategies involving TT. While ILR alone would result in more patients correctly receiving pacing than TT alone, the higher cost per patient meant that the ICER for ILR versus no testing, while still possibly acceptable, was much higher than the ICER for TT. Furthermore, when the incremental cost-effectiveness of ILR was compared directly with TT, the ICER was over £38,000.68
66 The same economic evaluation is summarised in Section 6.7 of Westby et al (2010).67 The study authors defined a ‘positive’ TT as asystole during syncope and a ‘negative’ TT as either a mixed or
vasodepressor response or bradycardia without asystole during syncope or an absence of syncope. Using these definitions and data from ISSUE 2, the authors calculated the sensitivity and specificity of TT in identifying patients with asystole during spontaneous syncope.
68 NICE does not apply a rigid cost-effectiveness threshold, but its methods guidance suggests that interventions with an ICER under £20,000 are unlikely to be rejected on the basis of cost-effectiveness and those with an ICER above £30,000 are likely to be rejected on the basis of cost-effectiveness (Davis et al, 2013).
MBS Review – Ambulatory Electrocardiography Review Report Page 194

May 2016
Table 6.2.109 Clinical and economic outcomes predicted by the model: recurrent syncope, vasovagal syncope suspected (Davis, 2013)
Outcome No testing TT ILR TT + ILR if TT is negative
Clinical outcomes per 1000 patients testeda
Arrhythmia correctly paced 0 69 145 195
Inappropriate pacing 0 20 0 20
Diagnosed VT 0 0 11 11
Missed arrhythmia eligible for pacing 538 469 392 342
Missed VT 151 151 140 140
Other cause undiagnosed 311 292 311 292
Economic outcomes per patient testedb
Cost (£) 2,240 2,780 7,450 7,540
QALYs 4.241 4.332 4.453 4.519
ICER (£ per QALY)versus no testingversus TT
NANA
5,960NA
24,62038,570
19,11025,470
Likelihood (%) of being optimal strategy at:£20k per QALY£30k per QALY
<1<1
94.017.8
<5.982.3
<1<1
Sources: Davis et al (2013), Table 3, p 807; Westby et al (2010), Table 36, p 383.Abbreviations: ICER, incremental cost-effectiveness ratio; ILR, implantable loop recorder; QALY, quality-adjusted life-year; TT, tilt testing; VT, ventricular tachycardia.Note: 3.5% discount applied.a Clinical outcomes are point estimates from deterministic model. b Costs and QALYs are means across 10,000 probabilistic samples.
As acknowledged by Davis et al (2013), some simplifying assumptions adopted in the model may have resulted in an underestimation of the cost-effectiveness of the three testing strategies. In particular, the model failed to account for the potential changes to patient management and outcomes that would result from observing a normal rate and rhythm during syncope or an absence of syncope during monitoring. Similarly, the model did not account for benefits in patients diagnosed with arrhythmias other than asystole or VT.
Univariate sensitivity analyses demonstrated that the cost-effectiveness of the three testing strategies was robust to changes in estimates of the rate and cost of recurrences. However, the ICER increased when the survival gain from pacing was removed, when costs and benefits of pacing were restricted to six years, and when a lower HRQoL estimate for pacing or ICD therapy was tested. Importantly, none of the sensitivity analyses reduced the ICER of ILR compared with TT to below £20,000 per QALY (see Table 6.2.110).
Table 6.2.110 Univariate sensitivity analyses: recurrent syncope, vasovagal syncope suspected – ILR vs. TT (Davis, 2013)
ILR vs TT Incremental cost per QALY (£)
Base case 38,570
No survival gain from pacing after AV block observed during syncope 49,710
Bradycardia treated with pacemaker as well as asystole 35,330
Recurrences continue beyond 2 years in unpaced patients with AV block or SSS 38,450
Recurrence results in short stay admission 38,390
Continued recurrences beyond 2 years that result in short stay admission 38,370
MBS Review – Ambulatory Electrocardiography Review Report Page 195

May 2016
ILR vs TT Incremental cost per QALY (£)
Unpaced patients with AV block or SSS experience an average of one admission per annum 36,220
Lower limit for utility gain after pacing and no utility gain after ICD therapy 46,610
No uplift in ILR device cost since 2004 (£1,400 instead of £1,600) 36,850
Costs and benefits of pacing estimated over 6 year horizon 52,640Source: Westby et al (2010), Table 37, p385Abbreviations: AV, atrioventricular; ICD, implantable cardioverter-defibrillator; ILR, implantable loop recorder; TT, tilt testing; QALY, quality-adjusted life-year; SSS, sick sinus syndrome.
6.2.5 Levin (2015)
The aim of this study was to assess the cost-effectiveness of two screening methods for detection of silent AF, periodic ECG recordings with a handheld device at regular time intervals, and short-term Holter monitoring, compared with no screening in a hypothetical cohort of 75-year-old patients with a recent ischaemic stroke.
The economic evaluation was informed by an observational study of 249 patients from three Swedish hospitals who had suffered from IS/TIA in the past 14 days. The participants, all with no previously known AF, underwent continuous 24-hour Holter monitoring before or within the first few days after discharge. At the same time, patients were equipped with a handheld ECG recorder and instructed to perform 10-second rhythm recordings twice daily for 30 days, as well as recording during arrhythmic symptoms.
The health states included in the model were ‘AF positive with anticoagulants’, ‘AF positive with no anticoagulants’, ‘AF negative’ and ‘dead’. Patients could move between the aforementioned health states annually until death. The events and complications that were considered in the model were ischaemic and haemorrhagic strokes, and major and minor bleeding. Both stroke types were associated with lifelong costs and deterioration of quality of life, while bleeding events were assumed to affect costs and quality of life only in the year in which they occur. Data to inform the risk of events and complications for patients taking warfarin and no anticoagulants were obtained from the published sources listed in Table 6.2.111.
Table 6.2.111 Absolute annual risks of complications with warfarin or no anticoagulants for patients with AF in CHADS2 3-6 (Levin, 2015)
Complication WarfarinRate per patient year (%)
Source No anticoagulantsRate per patient year (%)
Source
Stroke or systemic embolism 2.73 Oldgren (2011) 9.00 Friberg (2012)
Intracranial bleeding 1.07 Friberg (2012) 0.60 Friberg (2012)
Major bleeding 4.60 Oldgren (2011) 2.70 (all risk groups) Friberg (2012)
Minor bleeding 16.37 Connolly (2009) 7.10 AssumptionSource: Levin et al (2015), Table 1, p209Abbreviations: AF, atrial fibrillation; CHADS, Congestive heart failure, Hypertension, Age, Diabetes, prior Stroke (stroke risk prediction).
In addition to the estimates listed above, the model included assumptions about warfarin discontinuation (20% of patients in the first year and 30% annually thereafter) and the detection of silent AF subsequent to initial screening (approximately 5% of patients annually). The main cost and QALY estimates are summarised in Table 6.2.112.
MBS Review – Ambulatory Electrocardiography Review Report Page 196

May 2016
Table 6.2.112 Cost and quality of life parameters in the model (Levin, 2015)
Parameter Estimate Source
Cost (€)Inviting a patient to screening 2.2 Personal communicationa
Screening investigation handheld ECG 108 Personal communicationa
Screening investigation Holter ECG 271 Purchasing costsb
Warfarin treatment per year 757 Davidson (2011)
Cost per monitoring visit (warfarin) 22 Davidson (2011)
Stroke, admission costs 11,502 Ghathnekar (2012)
Stroke, outpatient costs, first year 3,894 Ghathnekar (2012)
Stroke, outpatient costs, second year onwards 549 Ghathnekar (2012)
Stroke, social services costs, first year 3,148 Ghathnekar (2012)
Stroke, social services costs, second year onwards 3,875 Ghathnekar (2012)
Major bleeding 2,704 O’Brien (2005)
QALY weights75-79 years with AF 0.76 Burstrom (2001)
80-84 years with AF 0.71 Burstrom (2001)
QALY weight decrement: ischaemic stroke 0.15 Lee (2010)
QALY weight decrement: haemorrhagic stroke 0.30 Lee (2010)Source: Levin (2015), Table 2, p210Abbreviations: AF, atrial fibrillation; ECG, electrocardiogram; QALY, quality-adjusted life-year.a Personal communication between study authors and Mats Palerius from Zenicor Medical Systems AB on 10 October 2012.b Department of Cardiology, Linköping University Hospital, Sweden.
As shown in Table 6.2.113, the effects of AF screening were measured as a number of prevented strokes, number of life-years gained, and number of QALYs gained. One analysis (not presented) showed that continuous 24-hour Holter was dominated by handheld ECG, due to its lower sensitivity and higher costs. The base case cost-effectiveness analysis in Levin (2015) therefore compared handheld ECG screening with no screening. However, as handheld ECG is out of scope for this Review, only the cost-effectiveness results relating to the 24-hour Holter versus no screening are presented here. Additionally, while several one-way sensitivity analyses were undertaken, they were all relevant to the handheld ECG versus no screening comparison.
Table 6.2.113 Cost-effectiveness of Holter screening compared with no screening – costs and effects calculated for 1,000 screened patients (Levin, 2015)
Description Costs (€) No. of strokes LYs QALYs Cost per LY gained (€)
Cost per QALY gained (€)
No screening 4,020,000 143 9,528 6,435 - -
24h Holter 4,255,000 140 9,537 6,442 26,111 33,571Source: Levin (2015), Table 3, p211. Cost per LY and Cost per QALY calculated based on data provided.Abbreviations: LY, life-year; QALY, quality-adjusted life-year.
6.2.6 Mayer (2013)
This study from Germany compared the cost-effectiveness of 24-hour and 7-day Holter monitoring (with or without transthoracic echocardiography [TTE]) to detect paroxysmal AF in a hypothetical cohort of patients with acute IS/TIA.
This economic evaluation was based on an underlying assumption that patients with paroxysmal AF at screening would be treated with warfarin, while AF negative patients
MBS Review – Ambulatory Electrocardiography Review Report Page 197

May 2016
would receive aspirin. Following screening, patients entered a Markov model that simulated long-term disease course. The model included seven permanent health states: TIA, minor stroke, major stroke, recurrent minor or major stroke, intracranial haemorrhage and death.
AF detection rates for the three strategies were derived from the Find-AF cohort study. Based on 7-day Holter data from that study, AF was deemed to have a prevalence of 13.3% in the relevant population and, assuming that 7-day Holter had 100% sensitivity, the sensitivity of 24-hour Holter monitoring was calculated to be 46.4% (i.e. 53.6% of AF cases would not be detected using this strategy). Several other key model inputs are shown in Table 6.2.114.
Table 6.2.114 Health outcome, quality of life and cost parameters in the model (Mayer, 2013)
Model inputs Base case (range)
Health outcomesAnnual rate of stroke (%):
with warfarin and AFa
with aspirin and AFa
with aspirin and without AF
3.02 (2.72–3.32)6.3 (5.67–6.93)
1.31 (1.18–1.44)
Ischaemic strokes with warfarin that were:fatal (%)major (disabling) (%)minor (%)TIA (%)
8.2 (8.2–10.1)40.2 (40.2–41.7)42.5 (34.8–42.5)9.1 (9.1–13.3)
Ischaemic strokes with aspirin that were:fatal (%)major (disabling) (%)minor (%)TIA (%)
17.9 (10.1–17.9)30.0 (30.0–41.7)41.0 (34.8–41.0)11.0 (11.0–13.3)
Relative risk of stroke with warfarin compared with aspirin 0.48 (0.37–0.63)
Relative risk of stroke with AF compared with no AF 4.8 (2.0–6.0)
Annual rate of haemorrhagic stroke/ICH (%):with warfarinb
with aspirinb
1.28 (1.15–1.41)0.76 (0.68–0.84)
Relative risk of haemorrhage with aspirin compared with compared with warfarin 0.59 (0.5–0.7)
Mortality after haemorrhagic stroke/ICH 0.6 (0.46–0.68)
Quality of lifeIschaemic stroke, major 0.52 (0.47–0.57)
Ischaemic stroke, minor 0.87 (0.78–0.96)
Recurrent stroke (2nd disabling stroke) 0.12 (0.11–0.13)
TIA 0.9 (0.81–0.99)
Haemorrhagic stroke/ICH 0.62 (0.55–0.67)
MBS Review – Ambulatory Electrocardiography Review Report Page 198
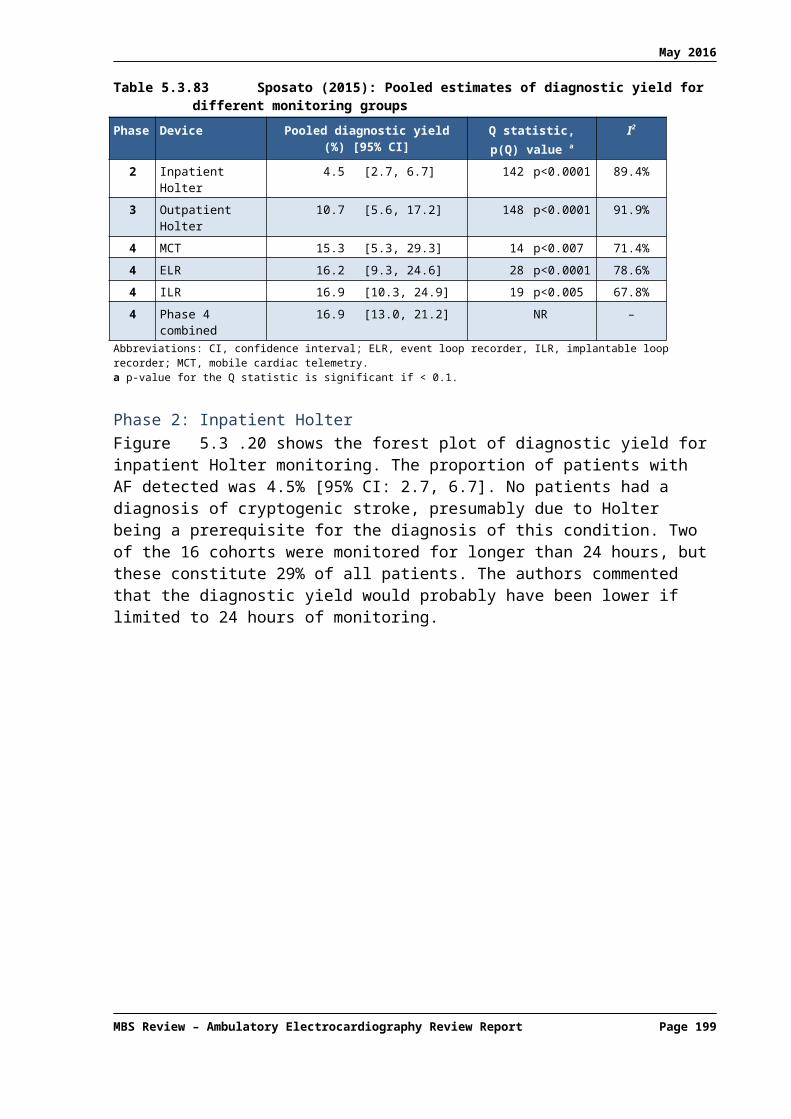
May 2016
Model inputs Base case (range)
Costs, € (2011)Cost of acute carec
Ischaemic stroke, with AFIschaemic stroke, without AFIschaemic stroke, fatalHaemorrhagic strokeHaemorrhagic stroke, fatalTIA
7,315 (6,584–8,047)6,224 (5,602–6,846)4,031 (3,628–4,434)5,546 (4,991–6,100)3,652 (3,287–4,017)2,637 (2,373–2,900)
Additional resource cost 7d vs 24h Holterd 34 (20–165)Source: Mayer et al (2013), Table 1, p878Abbreviations: AF, atrial fibrillation; ICH, intracranial haemorrhage; TIA, transient ischaemic attack.a Rate of stroke increase by a factor of 1.4 per decade of life, compounded for every 6-month cycle.b Rate of haemorrhagic stroke/ICH increased by a factor of 1.97 per decade of life, compounded for every 6-month cycle.c Costs of acute care after recurrent events include those for emergency ambulance transportation, hospitalisation, and inpatient (acute) rehabilitation. Direct costs were estimated in a way that reflected the German health care system.d Based on detailed resource utilisation data from the Find-AF study.
The results of the economic analysis are shown in Table 6.2.115. In the base case, 24-hour Holter monitoring was dominated by 7-day monitoring due to higher lifelong costs and lower QALYs. Sensitivity analyses that examined many variations in key model inputs demonstrated that 7-day Holter monitoring was cost-effective or dominant in most scenarios compared with 24-hour monitoring. Finally, preselecting patients for the 7-day Holter with TTE had no positive effect on the cost-effectiveness of 7-day monitoring due to false-negative results that arose from this strategy.
Table 6.2.115 Results of the economic analysis: cerebral ischaemia – 24h Holter monitoring vs. 7d Holter monitoring with and without prior TTE (Mayer, 2013)
Monitoring Lifelong discounted costsa (€)
Incremental cost (€)
Quality-adjusted life expectancy
Incremental effect (QALYs)
ICER (€ per QALY)
TTE/7d Holter 32,886.9 - 3.842 - Reference
7d Holter 32,895.8 8.9 3.844 0.0017 5,353.92
24h Holter 32,912.3 16.5 3.833 –0.0111 DominatedSource: Mayer et al (2013), Table 4, p881 Note: 3% discount applied. Costs and QALYs reported in the publication abstract differed from those reported elsewhere in the publication. This table presents values as per the body of the report (p880) and Table 4 (p881). Abbreviations: ICER, incremental cost-effectiveness ratio; QALY, quality-adjusted life-year; TTE, transthoracic echocardiography.a Post-acute cost of care were calculated for 1-6 months, 7-12 months and every following 6 month period after the initial event.
6.2.7 Kamel (2010)
This US study examined the cost-effectiveness of outpatient cardiac monitoring compared with standard care for the detection of AF in a hypothetical cohort of patients with recent ischaemic stroke. In the model, patients found to have AF through outpatient cardiac monitoring were treated with warfarin, while those who received standard care after ischaemic stroke received aspirin.
Some key model inputs are summarised in Table 6.2.116, including the diagnostic yield of outpatient cardiac monitoring and the estimated rate of ischaemic stroke recurrence on warfarin versus aspirin. The former was based on a meta-analysis of data from four studies that resulted in a diagnostic yield of 5.9% (95% CI, 3.6% to 9.3%).69 The semi-Markov model
69 The Cochran Q test and the I2 method of Higgins and Thompson demonstrated no evidence of significant heterogeneity (Q test P=0.78; I2=0).
MBS Review – Ambulatory Electrocardiography Review Report Page 199

May 2016
included various health states such as uncomplicated AF, AF and prior stroke, and AF and prior intracerebral haemorrhage.
Table 6.2.116 Value and source of key model inputs used in the base case and ranges used in sensitivity analyses (Kamel, 2010)
Variable Value Range Source
Patient characteristicsAge, years 70 65–90 Assumption
Male, % 50 50 Assumption
Transition probabilitiesRate of ischaemic stroke on aspirin, % per year 4.5 2–12 O’Brien and Gage (2005)
Relative risk of stroke, warfarin versus aspirin 0.48 0.37–0.63 O’Brien and Gage (2005)
Rate of haemorrhagic stroke on warfarin, % per year 0.4 0.4–1.2 O’Brien and Gage (2005)
Rate of major haemorrhage on warfarin, % per year 2.5 2.0–4.0 O’Brien and Gage (2005)
Relative risk of haemorrhage, aspirin versus warfarin 0.59 0.5–0.7 O’Brien and Gage (2005)
Utility weightsUtility of each life-year on warfarin 0.987 0.953–1.0 O’Brien and Gage (2005)
Utility of each life-year on aspirin 0.998 0.994–1.0 O’Brien and Gage (2005)
Utility of each life-year given major residual symptoms 0.39 0–1.0 O’Brien and Gage (2005)
Utility of each life-year given minor residual symptoms 0.75 0–1.0 O’Brien and Gage (2005)
Utility of remaining life-years with arrhythmia 1.0 0.99–1.0 Schoenbaum et al (2001)Eborall et al (2007)Haynes et al (1978)
Other key model inputsYield of outpatient cardiac telemetry to detect AF, % 5.9 0–20 Jabaudon et al (2004)
Barthelemy et al (2003)Schuchert et al (1999)
Tayal et al (2008)
Rate of diagnosis of AF without outpatient monitoring 25a 0–95 Kamel et al (2009)
Rate of incidental arrhythmias requiring evaluation, % 5 0–20 Tayal et al (2008)Koudstall et al (1986)Mikolich et al (1981)
Rate of β-blocker use, % 100 0–100 Fuster et al (2006)Wyse et al (2002)
Crandall et al (2009)
Rate of cardioversion or ablation, % 0 0–50 Fuster et al (2006)Wyse et al (2002)
Crandall et al (2009)
Rate of pacemaker placement, % 0 0–5 Tayal et al (2008)Koudstall et al (1986)Mikolich et al (1981)
Epstein et al (2008)
Rate of electrophysiological study, % 0 0–3 Epstein et al (2008)Moss et al (2002)
Sanders et al (2005)Handke et al (2005)Falcone et al (2000)
Rate of depression, % 0 0-2.5 Schoenbaum et al (2001)Eborall et al (2007)Haynes et al (1978)
Cost of outpatient monitoringb, US$ 168 50–2500 Zimetbaum et al (1998)CMS (2010)
MBS Review – Ambulatory Electrocardiography Review Report Page 200
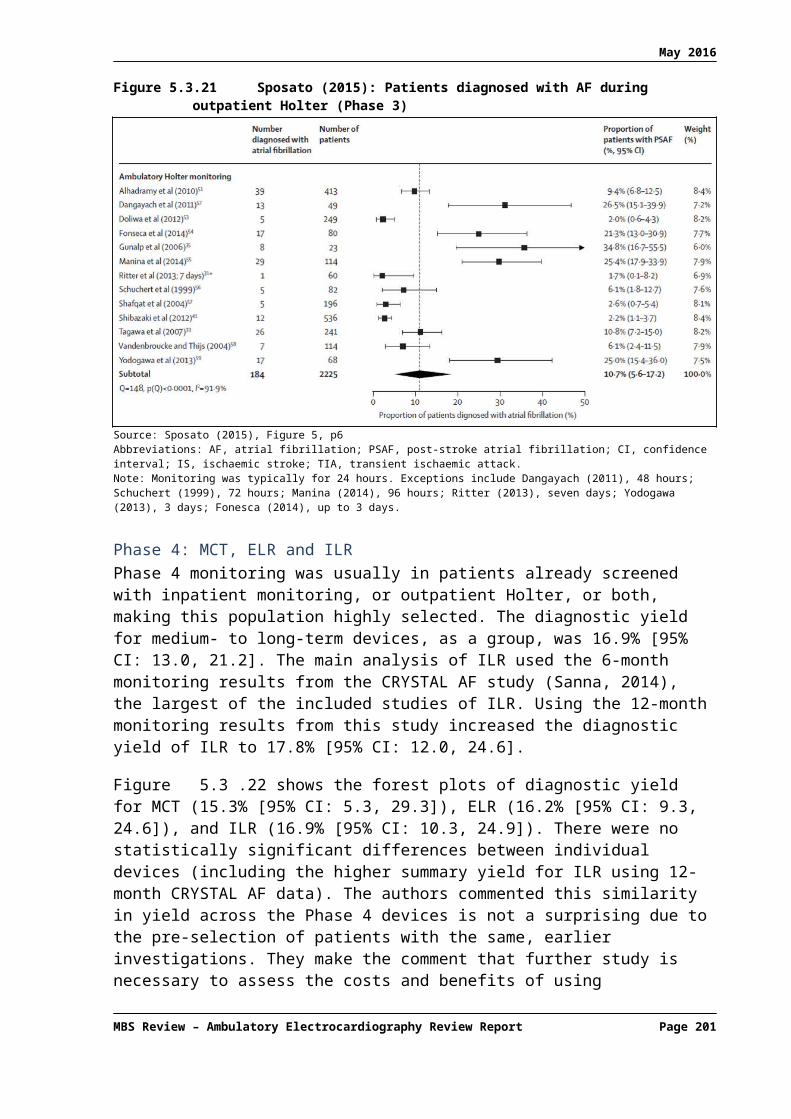
May 2016
Variable Value Range SourceHoch et al (2006)
Source: Kamel et al (2010), Table 2, p1515 Abbreviations: AF, atrial fibrillation.a The authors estimated that 25% of asymptomatic paroxysmal AF not detected by standard inpatient cardiac telemetry would be diagnosed before a recurrent stroke even without outpatient cardiac monitoring. Therefore, AF would be diagnosed in 5.9% of the monitoring group and 1.45% (5.9%*25%) of the standard care group.b Including the cost of equipment, technician services, and physician interpretation.
As shown in Table 6.2.117, the net cost of outpatient cardiac monitoring in 1,000 patients was US$440,000, including direct monitoring costs, the cost of β-blocker therapy and comparative cost of warfarin in those with AF, and the cost of cardiological evaluation in those with an incidentally discovered arrhythmia other than AF. The monitoring strategy led to a total comparative gain of 34 QALYs that resulted in an ICER of US$13,000 per QALY.
Table 6.2.117 Costs and quality-adjusted survival associated with outpatient cardiac monitoring – Base case (Kamel, 2010)
Outpatient monitoring Standard care DifferenceHypothetical cohort (N) 1,000 1,000 -
Yield (no. of cases of AF detected) 59 15 44
Lifetime cost associated with warfarin,a US$ 95,000 24,000 71,000
Lifetime cost of β-blockers, US$ 257,000 64,000 193,000
Cost of cardiological evaluationb, US$ 7,500 0 7,500
Cost of monitoring, US$ 168,000 0 168,000
Net cost, US$ 528,000 88,000 440,000
Increase in QALYs 46 12 34
Cost-utility ratio (US$/QALY) - - 13,000Source: Kamel et al (2010), Table 3, p1517a This is the net cost of warfarin therapy compared to aspirin therapy, which reflects the higher cost of warfarin as well as the cost savings from prevention of strokes compared with aspirin.b For incidentally discovered arrhythmia other than AF.
Sensitivity analyses demonstrated that monitoring was cost-effective at any yield greater than 0.8% and at any cost less than $2,000 per patient. Based on a standard cost-effectiveness threshold of $50,000 per QALY, outpatient cardiac monitoring remained cost-effective even if the model assumed that 85% of patients with underlying AF were diagnosed without outpatient monitoring (i.e. only 15% of patients with underlying AF remained undiagnosed until stroke recurrence).
6.3 Cost-effectiveness analyses
The 10 CEAs identified through the systematic literature review are summarised in Table 6.3.118. Two of the studies report the same economic model in different settings (Krahn et al, 1999; Simpson et al, 1999). These model-based evaluations considered several alternative diagnostic pathways to determine the optimum sequencing of several diagnostic tests.
The trial-based studies by Hoch et al (2006) and Rockx et al (2005) were based on the same patient population. The main objective of the Hoch publication was to present a cost-effectiveness acceptability curve. As such, Rockx et al (2005) provides a more detailed summary of the economic evaluation for the purpose of this Review. In addition, Hoch et al (2006) did not discuss patient cross over in the event that no diagnosis was reached after patients completed their assigned monitoring strategy. It should be noted that there are minor discrepancies in the reporting of costs between the two studies and the reason for this is
MBS Review – Ambulatory Electrocardiography Review Report Page 201

May 2016
unclear. For example, the cost for a Holter monitor was reported as US$212.92 in Hoch et al (2006) and US$177.64 in Rockx et al (2005). Therefore, both studies are summarised in the table below.
MBS Review – Ambulatory Electrocardiography Review Report Page 202

May 2016
Table 6.3.118 Characteristics of the cost-effectiveness analyses of AECGStudy ID
Country/ perspective
Population Intervention Derivation of costs Derivation of effectiveness Findings
Model-based
Krahn (1999)
US
Societala
Theoretical cohort of 100 patients with a first episode of unexplained syncope undergoing a series of cardiac investigations. 40% of the population were assumed to have SHD.
1) Holter, Echo, TT, ELR, EPS
2) As 1) but ILR after EPS
3) as 2) but Echo only if presence of SHD uncertain (50%)
4) as 2) but EPS only if SHD present
5) As 2) but echo only if presence of SHD uncertain (50%) and EPS only if SHD present
The cost of each test was based on the Medicare physician fee schedule and an extrapolated median Medicare cost.
Hospital costs were estimated using hospital claims data from 1,019 unique hospitalisations for investigation of syncope, based on median inpatient costs.
All costs were expressed in 1995 USD.
Treatment costs were not included.
The diagnostic yield of each test was based on the weighted average of that test from different published studies.
The incremental cost per diagnosis ratio was calculated for the ILR in each model, reflecting the additional cost of gaining a 1% increase in cumulative diagnostic yield when going from a strategy that does not include the ILR to one where it is used as a last resort.
A decision analytic model was undertaken that combined cost estimates with published data on diagnostic yield of each test (i.e. incremental cost per diagnosis).
The cost of the diagnostic approach described as Intervention 1 was $2,840 per diagnosis obtained, with a cumulative diagnostic yield of 84%. Addition of ILR at the end of the cascade (Intervention 2) increased the diagnostic yield to 98% with a cost per diagnosis of $3,193.
Changes to the cascade described in Interventions 3, 4 and 5 reduced cost per diagnosis to $3,041, $2,995 and $2,494, respectively, while the diagnostic yield remained high (98%) in each of these approaches.
The incremental cost per diagnosis for the ILR ranged from $2,384 to $4,383 in the 4 models in which the ILR was used as a last resort, reflecting the cost of a 15% to 17% increase in diagnostic yield.
Simpson (1999)
Canada
Third-party payer
Theoretical cohort of 100 patients undergoing cardiac investigations following a first episode of unexplained syncope. 40% of the population were assumed to have SHD.
1) Holter, Echo, TT, ELR, EPS.
2) As 1) but ILR after EPS
3) as 2) but Echo only if presence of SHD uncertain (50%)
4) as 2) but EPS only if SHD present
5) As 2) but echo only if presence of SHD uncertain (50%) and EPS only if SHDPresent
6) ELR, TT, Holter, EPS if SHD, ILR, Echo, EPS if no SHD
The costs of ELR, TT, Holter, EPS, ILR, and echocardiography were calculated.
Costs including materials, human resources, overheads and physician costs (based on the Ontario Health Insurance Plan Physicians' Fee Schedule) were examined at the London Health Sciences Centre (London, Ontario). Test costs were also examined at other centres by examining physician fee schedules in three other Canadian provinces.
High-end and low-end cost estimates were calculated based on figures from the four tertiary care centres.
The cost of ILR was obtained from the manufacturer. The operating cost of ILR was obtained using figures for pacemaker pulse generator replacement.
Costs were expressed in 1997 CAD.
The diagnostic yield of each test was based on the weighted average of that test from 14 published studies.
Each strategy was compared based on the number of patients diagnosed at the end of diagnostic pathway
The diagnostic yields were 38% for ELR, 58% for TT, 21% for Holter, 52% for EPS with SHD, 88% for ILR, 3% for echocardiography, and 5% for EPS with no SHD.
Individual diagnostic yields were combined to determine the diagnostic yields for the different interventions (diagnostic cascades).
A simulation model was used to determine the diagnostic yield and costs of each test order. ILR, which was included in all except Intervention 1, improved the rate of diagnosis.
The conventional diagnostic cascade (Intervention 1) resulted in a diagnosis in 85% of patients, at a cost per diagnosis of $467 to $959.
The addition of ILR at the end of the diagnostic cascade (Intervention 2) increased the diagnostic yield to 98%, with an increase in the cost per diagnosis to $660 to $1,341.
Intervention 5 involved selective use of echocardiography and selective use of EPS. The diagnostic yield remained at 98% with a cost per diagnosis of $575 to $1,143.
The optimal cascade (Intervention 6) increased the diagnostic yield to 98.9%, at a cost of $460 to $1043 per diagnosed patient; however this approach may not be clinically viable.b
A combination of new technology and selective use of investigations has the potential to raise diagnostic yield without appreciably increasing cost per diagnosis.
MBS Review – Ambulatory Electrocardiography Review Report Page 203

May 2016
Study ID
Country/ perspective
Population Intervention Derivation of costs Derivation of effectiveness Findings
Trial-based
Czosek (2013)
US
Payer perspective
Patients with congenital heart disease and at least one previous Holter study (N=189)
24h Holter monitoring for routine screening in asymptomatic patients (80%) and evaluation of symptomatic patients (20%).
Average reimbursement rates for Holter monitoring at a US Children's Hospital (including third-party payers, self-pay, Medicare, Medicaid)
Single institution retrospective analysis of Holter monitoring. 22/589 Holter studies resulted in a 'clinically significant study' that led to a change in management (e.g. EPS, pacemaker or ICD implantation or replacement, initiation or change in antiarrhythmic drug therapy, or findings that directly led to additional testing).
Cost per clinically significant study was $12,732. Cost was dependent on type of congenital heart disease and patient age ($4,281 for patients >25 years old compared to $35,187 for those <18 years).
Fitchet (2003)
UK
Unclear
Consecutive patients with suspected vasovagal syncope (N=128)c
48h Holter vs TT. All analysed patients underwent both tests within a 3 month period.
Prior to enrolment in this study patients underwent history, physical examination, and 12-lead ECG to detect clinical evidence of structural heart disease and contraindications to TT.
Costs from a single institution.
TT: £300 (500€)Holter: £100 (167€)
Endpoint were symptom-ECG correlation during Holter monitoring and positive TT. Syncope occurred in 2 (2%) patients during Holter monitoring. Presyncope was reported in 22 (19%); asymptomatic arrhythmias were recorded in 103 (87%). TT was positive in 39 (33%).
Change in patient management occurred in 3 (3%) patients following Holter monitoring and 39 (33%) patients following positive TT.
Cost per achievement of symptom-ECG correlation was £908 (1,513€) for TT and £5,900 (9,833€) for 48h Holter monitoring.
Holter monitoring produces a low yield of clinically useful information in the investigation of suspected vasovagal syncope. A TT test should be considered the primary investigation of choice in such patients.
Giada (2007)
Italy
Hospital perspective
Patients with infrequent (≤1 episode per month), sustained (>1 min) palpitations (N=50)
Patients were randomised to ILR implantation (12 months monitoring); or conventional strategy (24h Holter, a 4-week period of AECG monitoring with external recorder, and EPS when the 2 other tests yielded negative results).d,e
Hospital costs reported in 2005 Euro. It was not clear from which of the study hospital(s) costs were calculated.
For Holter and the external recorder costs included staff costs, equipment and disposables. For EPS and ILR costs included staff, equipment, disposables and use of EPS room.
Monitoring was regarded as diagnostic only when a symptom-rhythm correlation was established during spontaneous palpitations resembling the symptoms before enrolment.ILR monitoring was regarded as non-diagnostic when arrhythmias were not associated with any symptoms.
In the conventional strategy, EPS was regarded as diagnostic if it induced any brady- or tachyarrhythmias that were sustained (>1 min or requiring urgent interruption), and accompanied by reproduction of the spontaneous symptoms.
Based on the definitions outlined above, a diagnosis was obtained in 5 patients in the conventional strategy group, and in 19 subjects in the ILR group (21% vs. 73%, p < 0.001).
The cost per patient in the ILR group was €2,233 ± €265 compared with €1,410 ± €1,389 in the conventional strategy group (p=0.001)
Despite the higher initial cost, the cost per diagnosis in the ILR group was lower than in the conventional strategy group (€3,056 ± €363 vs. €6,768 ± €6,672, p=0.012).
The publication reported an ICER for the ILR strategy of €1,576, where the ICER was calculated as the difference between the total cost of ILR and the conventional strategy, divided by the difference in the percentage of diagnoses made between ILR and the conventional strategy. Sensitivity analysis confirms the results, except for EPS 50%.
The study population was highly selected and the results cannot be generalised to the entire population with palpitations, particularly those with frequent symptoms who may benefit from short-term
MBS Review – Ambulatory Electrocardiography Review Report Page 204
May 2016
Study ID
Country/ perspective
Population Intervention Derivation of costs Derivation of effectiveness Findings
monitoring.
Trial-based
Krahn (2003)
Canada
Societal perspectivef
Patients with recurrent unexplained syncope and LV ejection fraction >35% (N=60)
Patients were randomised to ILR (1 yr monitoring) or conventional testing (ELR [2-4 weeks], TT and EPS)
If undiagnosed after their assigned strategy, patients were able to cross over to alternate strategy.
The costs of investigations (in 2002 CAD) were calculated based on the Ontario Health Insurance Program fee schedule for technical and professional fees and also included an estimate of materials, labour, maintenance, and overheads for hospital-based investigations based on peer-reviewed research billing codes.
Achievement of diagnosis was defined as symptom-rhythm correlation for ILR and standard criteria for other tests.
In the ILR arm, 14/30 (47%) patients were diagnosed compared with 6/30 (20%) who underwent conventional testing (p=0.029).
The strategy of ILR followed by tilt and EPS had a diagnostic yield of 50%. Conventional testing followed by ILR was comparable with a diagnostic yield of 47%.
Cross over:5/16 patients (31%) who were undiagnosed after ILR monitoring crossed over to conventional testing; 21/24 patients (88%) who were undiagnosed after conventional testing crossed over to ILR.
ILR was associated with a cost per patient of $2,731 ± $285; the conventional strategy cost $1,683 ± $505 per patient (p<0.0001).g The incremental cost per additional diagnosis for ILR vs conventional testing was $3,930.
The cost per diagnosis in the ILR arm was $5,852 ± $610 compared with a cost per diagnosis of $8,414 ± $2,527 in the conventional testing arm (p<0.0001).
Overall, a strategy of ILR followed by tilt and EPS was associated with a cost of $2,937 ± $579 per patient and $5,875 ± $1,159 per diagnosis. Conventional testing followed by ILR had a greater cost of $3,683 ± $1,490 per patient (p=0.013) and greater cost per diagnosis of $7,891 ± $3,193 (p=0.002).
The overall incremental cost per additional diagnosis for ILR vs conventional testing (including crossover) was –$22,380, implying cost savings with a primary strategy of ILR monitoring.h
The cost per diagnosis for individual tests was calculated. Tilt testing was most cost effective at $2,901 per diagnosis, followed by ILR at $6,158 per diagnosis. ELRs ($10,061/diagnosis) and EPS ($10,700/diagnosis) were associated with much greater average costs.
McClennen (2001)
US
Hospital
Consecutive patients with palpitations, presyncope, syncope, suspected AF or cerebral ischaemic events referred to a tertiary arrhythmia monitoring laboratory (N=164)
48h Holter monitoring.
Note: Each patient’s data were analysed as two separate 24h monitoring periods in order to generate data for a comparison of 24h vs 48h Holter monitoring.
Costs considered in the analysis included the cost of laboratory technical staff, the interpreting physician fee, and monitoring equipment depreciation.
The daily monitoring cost was $300 per patient (1998 USD).
Positive diagnostic outcomes were defined as: (1) relevant symptoms in the presence or absence of arrhythmia, (2) potentially serious arrhythmias, or (3) other arrhythmias.
Symptoms or arrhythmia on the second day of monitoring were only considered diagnostic if not already documented in the initial 24h period.
96 patients (59%) were diagnosed with a new arrhythmia on Day 1 compared with 8 patients (5%) on Day 2.
Using the combined outcome of new symptoms and/or any new arrhythmia, 117 patients (71%) reached that end point during Day 1 compared with 23 patients (14%) on the second day.
Overall, the incremental cost of detecting a new symptom was $665 on Day 1 vs $3,075 on Day 2.
The incremental cost of detecting a new arrhythmia was $513 on Day 1 vs $6,150 on Day 2; and $1,587 on Day 1 vs $9,840 on Day 2 for detection of a new serious arrhythmia.
The incremental cost of the combined outcome (new symptoms and/or new arrhythmia) was $421 on Day 1 vs $2,139 on Day 2.
The authors concluded that 48h Holter monitoring is not cost-effective when compared with 24h Holter monitoring, with the possible exception of evaluating asymptomatic paroxysmal AF.
In patients being evaluated for possible AF, the incremental cost of diagnosing a new serious arrhythmia increased from $450 for 24h Holter monitoring to $2,100 for 48h Holter monitoring.
MBS Review – Ambulatory Electrocardiography Review Report Page 205

May 2016
Study ID
Country/ perspective
Population Intervention Derivation of costs Derivation of effectiveness Findings
Trial-based
Hoch (2006)
Canada
Healthcare system perspective (Ministry of Health)
Patients referred for ambulatory monitoring with syncope or presyncope (N=100)
Patients were randomised to 48h Holter monitoring or ELR (1 month).
Direct costs were calculated based on the 2003 Ontario Health Insurance Plan fee schedule combined with hospital case costing of labour, materials, service and overhead costs for diagnostic testing and related equipment. Costs were reported in USD based on the conversion rate on 20/07/2005 ($1 USD = $1.21543 CAD).
Holter monitoring: $212.92ELR: $648.50
The effectiveness of each monitoring strategy was dependent on symptom-rhythm correlation during monitoring.
In the ELR group, 31/49 (63.27%) patients had symptom recurrence and successful activation compared with 12/51 (23.52%) in the Holter group.
The extra cost of $435.58 for the ELR was accompanied by a 39.74% increase of success while monitoring compared with 48h Holter.
The ICER of the ELR was $1,096 per extra successful diagnosis.
Rockx (2005)
Canada
Healthcare system perspective (Ministry of Health)
Patients (N=100) referred for ambulatory monitoring (mostly from primary care) with symptoms of syncope and/or presyncope.i
1a) 1 month of external event recorder
1b) as for 1a) but with cross over to 48 hour Holter if failed activation or no recurrence during 1month
2a) 48 hour Holter monitoring
2b) As for 2a) with cross over to 1 month external event recorder if no symptom recurrence during 48hr
Costs in this RCT were based on Canadian resource use and Ontario-based fee codes but were subsequently converted to 2005 USD.
Unit costs are reported for each test, but resource use following randomisation is not reported separately from overall costs.
48h Holter monitoring was estimated to cost $175 per patient and ELR $534 per patient. The crossover strategy of Holter monitoring followed by ELR cost on average $481 per patient, while ELR followed by Holter monitoring cost $551 on average.
The effectiveness of each monitoring strategy was dependent on symptom-rhythm correlation during monitoring, defined as arrhythmia recorded during symptoms (arrhythmia diagnosis) or normal sinus rhythm recorded during symptoms (arrhythmia excluded).
These data were used to inform the cost per patient (treatment costs not included) and incremental cost per additional diagnosis.
In the ELR group, 63% of patients had symptom recurrence and successful activation, compared with 24% in the Holtergroup (p<0.0001).
The additional cost of $358.38 for ELR was accompanied by a 39.74% increase of success while monitoring compared with 48h Holter. The incremental cost per additional diagnosis with ELR was US$902.
Uncertainty was estimated by using statistical bootstrapping to generate 1000 ICER estimates. For ELR vs Holter monitoring (without cross over) 21% of ICERs were below US$750 and 90% were below US$1,250.
A strategy of Holter monitoring followed by ELR (where appropriate) had a lower cost than initial ELR followed by Holter monitor (US$481 ± US$267 vs US$551 ± US$83, p=0.08) but was associated with a lower overall diagnostic yield (49% vs 63%) and a resultant higher cost per diagnosis (US$982 vs US$871).
This study was considered to have potentially serious limitations as it did not include the impact of post-diagnostic outcomes, such as treatment, on costs and benefits.
Budget impact
Sadri (2014)
Canada
Healthcare system perspective
Patients with unexplained syncope
ILR (referred to in this publication as an implantable cardiac monitor, ICM).
Cost data were derived from the published literature.
Conventional testing: $1,683ILR: $2,731Therefore, the additional cost of
A systematic literature search was undertaken to inform a budget impact analysis regarding the cost and diagnostic accuracy of ILR.
In 2011, the analysis estimated that 1,696 patients with unexplained syncope would
Based on the estimated population with unexplained syncope in 2011 (N=2,174), the estimated cost per patient and estimated diagnosis rates, conventional testing would cost approximately $8,800 per diagnosed case compared with $3,500 per case diagnosed using ILR.
Therefore in 2011, the estimated cost saving for ILR was $5,300 per diagnosed case.
MBS Review – Ambulatory Electrocardiography Review Report Page 206

May 2016
Study ID
Country/ perspective
Population Intervention Derivation of costs Derivation of effectiveness Findings
(Ontario) testing with ILR was $1,048 per patient.
In 2011, the analysis estimated that 2,174 patients had unexplained syncope in Ontario (based on hospital discharge data and multiplied by 40% assuming that some patients may present in the primary care setting). The total cost of conventional testing was estimated to be $3,658,842 compared with $5,937,194 for ILR, resulting in a total incremental cost of $2,278,352.
be diagnosed using ILR vs 413 with conventional testing, suggesting that the use of ILR would have resulted in 1,283 additional diagnoses.
The use of ILR can lead to significant benefits to patients in terms of avoiding unnecessary tests and preventing negative outcomes such as falls, broken bones, loss of independence, and even premature death, and it can also lead to savings to the healthcare system from avoidance of emergency department visits as well as unnecessary diagnostic tests.
Note: Krahn et al (1999) and Simpson et al (1999) report the same economic model in different settings.Abbreviations: AECG, ambulatory electrocardiography; AF, atrial fibrillation; CAD, Canadian dollar; ECG, electrocardiogram; ELR, external loop recorder; EPS, electrophysiology study; ICER, incremental cost-effectiveness ratio; ICD, implantable cardioverter-defibrillator; ICM, implantable cardiac monitor; ILR, implantable loop recorder; LV, left ventricular; RCT, randomised controlled trial; SHD, structural heart disease; TT, (head-up) tilt test; US, United States; USD, US dollar. a Although the paper stated that costs were considered from a societal perspective, the included costs all appeared to be direct medical costs.b The order of Intervention 6 was decided by ordering the tests in ascending order of cost per diagnosis; however, this approach may not be clinically viable. Specifically, this strategy involved the use of EPS in patients with SHD prior to the use of echocardiogram which may be useful in determining whether SHD is present. It also included Holter monitoring after ELR has failed which does not seem clinically useful.c TT and 48h Holter monitoring were successfully completed in 118 patients.d Prior to enrolment, all patients underwent history, physical examination, ECG, echocardiography to exclude SHD, and blood chemistry examinations to exclude palpitations of non-cardiac origin.e If the conventional strategy did not provide a diagnosis, patients had the option to cross over to ILR.f Although the paper stated that costs were considered from a societal perspective, the included costs all appeared to be direct medical costs.g Unit costs were reported for each test, but resource use following randomisation was not reported separately from overall costs.h The findings of this study cannot be generalised to other populations with syncope, particularly those with poor ventricular function who were excluded.i Described by the authors as ‘community-acquired syncope’ to reflect the fact that it is unlikely to include high-risk patients who would be admitted and investigated promptly.
MBS Review – Ambulatory Electrocardiography Review Report Page 207

May 2016
6.4 Costing studies
Five studies were identified that examined the cost of AECG, particularly ILR, in patients with unexplained, recurrent syncope. Two studies reported outcomes from the same trial-based economic evaluation at different durations of follow up. Farwell (2006) reported costs of hospitalisation and investigations for syncope incurred between randomisation and final study census (median follow up of 17 months), while Farwell (2004) reported intermediate results when a minimum of 6-months follow up had been recorded for all patients.
MBS Review – Ambulatory Electrocardiography Review Report Page 208

May 2016
Table 6.4.119 Characteristics of the costing studies of AECG
Study IDCountry
Population Intervention Derivation of costs Cost findings Conclusions
Unexplained syncopeProvidencia (2014)
Portugal
Healthcare system (PNHS)
Patients with unexplained, recurrent syncope (N=197).
Early referral for ILR vs conventional diagnostic pathway (CDP).
Data on the frequency of use of a range of diagnostic tests came from the published literature and was used to estimate the average cost of syncope episode admissions, using costs from the PNHS prices table (2013).a
Two DRG tariffs were used as a proxy for the (inpatient) cost of trauma/injury in recurrent syncope.ILR device cost (2,000€) was based on the price of Reveal DX loop recorder in Portugal.A Markov model was developed to estimate the expected number of hospital admissions due to unexplained syncope and its respective financial impact in patients implanted with ILR vs CDP.Time horizon: 3 yrs and lifetime.Costs discounted at 5% per yr.
Average cost of a syncope event was estimated to be between 1,760€ and 2,800€.
Lifetime horizon costs (discounted) of hospital admissions and syncope diagnosis for the entire cohort were 23% lower among patients in the ILR group compared with the CDP group (1,204,621€ for ILR vs 1,571,332€ for CDP).
This translates to a saving of 1,861€ per patient.
ILR led to an earlier diagnosis and consequently to a lower number of syncope hospital admissions, allowing important hospital offsets, with savings of between 307,872€ and 973,429€ for the entire cohort (1,563€ to 4,941€ per patient) over a lifetime horizon.
Over a 3-year horizon, costs were higher in the ILR group, due to the upfront cost of the device and implantation.
The utilisation of ILR leads to an earlier diagnosis and lower number of syncope hospital admissions and investigations, thus allowing significant cost offsets in the Portuguese setting.ILR appears to be significantly cost saving over a lifetime horizon under every scenario considered. One-way sensitivity analyses failed to identify any plausible scenario under which ILR use does not result in significant cost savings, prompting us to believe that ILRs should be offered to indicated patients.
Unexplained syncope
MBS Review – Ambulatory Electrocardiography Review Report Page 209
May 2016
Study IDCountry
Population Intervention Derivation of costs Cost findings Conclusions
Edvardsson (2015)
UK
Patients with recurrent, unexplained syncope who underwent ILR after initial diagnostic tests (N=570)
Diagnostic tests (e.g. 12-lead ECG, echo, basic laboratory tests, CSM, tilt test, ELR, MRI, CT, EEG) undertaken prior to implantation of an ILR.
Mean and median costs per patient were calculated using data on diagnostic test utilisation from the observational PICTURE registry.Costs were sourced from a micro-costing study performed at a medium-sized university hospital in the UK; and 2009-10 NHS reference costs, where available.a
There is a lot of variation in the number of tests per patient and some patients received a large number of tests (e.g. 25% underwent more than 20 tests).
Median cost of diagnostic tests per patient was £1,114 (95% CI £995–£1,233).
Mean cost per patient was higher £1,613 (95% CI £1,494–£1,732), as many patients received more than the median number of tests.
For 10% of patients the cost exceeded £3,539.
Cost of ILR device and all procedure costs and overheads was £2,606 based on 2009-10 NHS reference costs.
An earlier rather than a later ILR implant reduced the number of preimplant tests without reducing the diagnostic yield.Important opportunities to reduce test-related costs before an ILR implant were identified, e.g. by more appropriate use of tests recommended in the initial evaluation, by decreasing repetition of tests (e.g. standard ECG and Holter recordings were very frequently repeated), and by avoiding early use of specialised and expensive tests.
NICE (2010)
UK
Patients with unexplained, infrequent syncope (i.e. less than once every 2 weeks)
ILR vs ELR ILR device cost was based on the 2004 Horizon scanning briefing70, uplifted from 2004 to 2008 using the Hospital and Community Services Pay and Prices Index.ELR device was a midpoint based on the cost range of products in the NHS Purchasing and Supply Agency buyers’ guide 2009.The cost of device implantation/removal was based on 2007-08 NHS reference costs.
Cost to fit device (ILR vs ELR): £1,965 vs £131
Estimated cost of device (ILR vs ELR): £1,600 vs £295–1,035
Device removal cost (ILR only): £643 Total cost (ILR vs ELR): £4208 vs £426-
1,166 Estimated difference in cost: £3,042–
3,782
Based on expert clinical opinion, there is likely to be a significant increase in the numbers of implantable event recorders after publication of the NICE guidance.The resultant annual savings from reduced admissions to hospital, fewer inappropriate admissions and tests, and lower risk of misdiagnosis could be significant, and may fully offset any additional costs.
Unexplained syncopeFarwell (2006)
Patients presenting acutely
Patients randomised to
Costs incurred by further hospital admissions and investigations for
ILR patients had a highly significant reduction in subsequent investigational
ILR patients had fewer post-randomisation investigations and fewer days in hospital; however,
70 National Horizon Scanning Centre (2004). Reveal Plus (™) implantable loop recorders for the investigation of syncope and other events - horizon scanning review, Birmingham: National Horizon Scanning Centre (NHSC).
MBS Review – Ambulatory Electrocardiography Review Report Page 210

May 2016
Study IDCountry
Population Intervention Derivation of costs Cost findings Conclusions
UK
Healthcare system (NHS)
with recurrent syncope (>2 in past 12 mths) and no diagnosis following initial clinical workupc
(N=201)
ILR with automatic and patient activation (n=103 with 2 lost to follow up) or conventional testing (n=98 with 1 lost to follow up).
syncope, calculated from after-device-implantation to final census, were based on local 2001-02 NHS costs.Cost of treating diagnosed cause and costs associated with ILR monitoring not estimated.Median follow up was 17 months (IQR 9-23).Note: Farwell (2004) presents interim findings of the same RCT, see below.
costs £37.9 (0/0/100 lower quartile/median/upper quartile) vs. £108 (0/100/200 lower quartile/median/upper quartile) (mean difference £70.1, 95% CI £40.3–99.3, p<0.001).
Overall costs (including hospital stay) incurred post randomisation, not including ILR (list price £1,350), were lower in the ILR group, £820 (0/0/200 lower quartile/median/ upper quartile) vs. £1,380 (0/100/800 lower quartile/median/upper quartile) but not significantly so (mean difference £555, 95% CI £252–£1,990, p=0.28).
cost savings were not statistically significant.There is a high initial cost for the ILR (UK list price £1350). This study demonstrated a small significant reduction in costs of further investigations with the use of ILR; however, no significant reduction in overall subsequent costs was observed.Use of the ILR has led to significantly more diagnoses of the cause of syncope being achieved, more rapid introduction of therapy and a greater variety of therapies being introduced. Use of the ILR also allows appropriate therapies for syncope to be selected. This results in a significant increase in the time to recurrent syncopal episodes and improved general well-being in an unselected population with syncope of unknown cause.
Farwell (2004)
UK
Healthcare system (NHS)
Patients presenting acutely with recurrent syncope (>2 in past 12 mths) and no diagnosis following initial clinical workupc (N=201)
Patients randomised to ILR with automatic and patient activation (n=103 with 2 lost to follow up) or conventional testing (n=98 with 1 lost to follow up).
Costs incurred by further hospital admissions and investigations for syncope, calculated from after-device-implantation to censorship, were based on local 2001-02 NHS costs.Mean follow up was 276 days (±134), minimum of 6 months.
ILR patients had lower post-randomisation hospitalisation costs (£343 versus £1,090, mean difference £747, 95% CI £72.8–£2,730) and a highly significant reduction in subsequent investigational costs (£34.0 versus £95.4, mean difference £61.4, 95% CI £35.2–£92.9)d.
Total cost was significantly lower in the ILR group, £406 versus £1,210 (mean difference £809, 95% CI £123–£2,770).
While the initial cost of the ILR is high (UK list price £1350), this is offset by a subsequent reduction in investigational and hospitalisation costs that is equivalent to 60% of the purchase price of the device.However, the ILR failed to further reduce syncope. It therefore failed to improve quality of life, despite improving diagnostic rates. This may partly be due to the deficiency of currently accepted therapies for preventing syncope.
Abbreviations: CDP, conventional diagnostic pathway; CI, confidence interval; CSM, carotid sinus massage; CT, computed tomography; DRG, diagnosis-related group; ECG, electrocardiogram; Echo, echocardiogram; EEG, electroencephalogram; ELR, external loop recorder; ILR, internal loop recorder; IQR, interquartile range; MRI, magnetic resonance imaging; NHS, National Health Service; NICE, National Institute of Health and Care Excellence; PICTURE, Place of Reveal In the Care pathway and Treatment of patients with Unexplained Recurrent Syncope; PNHS, Portuguese National Health Service; UK, United Kingdom.a In the base case, the diagnostic cost estimate was derived from Sousa et al (2013) and was applied to all syncope events in the CDP arm and to syncope events in the ILR arm beyond the 3-year device battery life.b Note: other costs, such as specialist visits, admissions to the emergency room, and/or hospitalisation or injury caused by severe trauma associated with syncope were not assessed.c Comprising history and physical examination, 12-lead ECG, full blood count, urea and electrolytes, plasma glucose and Holter monitoring in the patients with suspected cardiac syncope. Patients without a Class I indication for cardiac pacing following CSM and TT were randomised to one of the intervention groups.d See Table 4 (p 1261) of the publication for a breakdown of investigational costs by procedure type (Note: the table is reproduced in Table 6.2.102 of this Report).
MBS Review – Ambulatory Electrocardiography Review Report Page 211
May 2016
7 FINDINGS AND CONCLUSIONS
This section synthesises the findings from the Review of AECG, based on the analysis of the available MBS data, a review of clinical guidance, and evidence obtained through systematic literature review.
7.1 Drivers of growth in AECG monitoring in Australia
The usage of each of the six MBS items for AECG monitoring increased from 2010-11 to 2014-15, with growth being continuous for all six items during this period. However, in recent years there was a plateau seen in the use of Items 11710 and 11711 (for ERs and ELRs) at the same time that the number of insertion procedures for ILRs (Item 38285) more than doubled. MBS item 11709 for Holter monitoring is the most commonly used item, with over 277,000 services in 2014-15. Between 2010-11 and 2014-15, the number of services for Item 11709 increased by 63.8%.
In order to investigate whether the observed increase in AECG services is due to greater dispersion of the technologies into regional Australia, MBS data were analysed by patient remoteness area. Between 2010-11 and 2014-15, there was no substantial change in the proportion of patients from various regional and remote areas receiving services for Items 11709, 11710, 11711, 38285 and 11722, with patients in major cities accounting for more than 70% of services. Therefore, the dissemination of these services to regional areas has not contributed to overall service growth. However, for Item 11708, there has been a marked change in the proportion of patients from inner and outer regional Australia receiving the service, which may be indicative of greater use of MCT devices such as V-Patch in regional areas. In 2014-15, patients in regional areas accounted for approximately one third of all services for Item 11708.
The frequency of AECG services per patient was also explored to determine whether the increase in the use of AECG services can be explained by multiple claims to cover extended monitoring periods. There has been a substantial increase in the proportion of patients receiving multiple (two or more) services per year for Item 11708 (40% in 2014-15, up from 19% in 2010-11), which has contributed to a sudden and marked increase in the number of claims for this item. However, no material changes were observed in the proportion of patients receiving multiple Holter monitor services per year using Item 11709 (8%).71 Therefore, as Item 11709 represents 93% of total services for the included AECG items, the overall increase in AECG usage is not driven by an increase in the frequency of services per patient per year.
In terms of the health professionals providing AECG monitoring services, the substantial growth of Holter monitor services appears to be driven by an increase in use by cardiologists, rather than increased use by GPs. Almost half of Holter monitoring services are provided by cardiologists, whereas less than 5% are provide by GPs. However, interpretation of these data are hampered by the fact that pathologists also dispense Holter monitors on behalf of other healthcare professionals (including GPs). The number of Holter services provided by pathology specialists increased by 69% over the past five years, and in 2014-15 they accounted for 27% of services for Item 11709.
71 Nor for items for ER, ELR or ILR.
MBS Review – Ambulatory Electrocardiography Review Report Page 212

May 2016
There has been a substantial growth in the number of services for Item 11708 provided by both cardiologists and GPs. GPs accounted for 13% of services in 2010-11, rising to 27% in 2014-15. GPs provided only a small proportion of services relating to external and implantable event recording, and therefore the marked growth of these services is driven by cardiologists.
In conclusion, the observed increase in services for Item 11709 (and for the four items relating to external and implantable event recording) is not explained by an increase in the frequency of services per patient, greater regional dispersion of services, or more vigorous use of AECG monitoring by GPs (although there has been growth in the number of GPs and pathologists dispensing Holter monitors). It is possible that the observed growth may be due to an increase in the accessibility of AECG monitors overall or to increasing use of the service for emerging indications.
In contrast, the increase in services for Item 11708 (possibly for the V-Patch device) can be attributed to increased use by GPs, increased dispersion of the technology into regional Australia, and an increase in the frequency of services per patient (which may indicate repeat services to cover longer-term monitoring).
7.2 Summary of findings from the review of guidelines
7.2.1 For what clinical indications is AECG recommended?
According to the most current Australian guideline on AECG monitoring (CSANZ 2012), the major indications for AECG are:
patients in whom the probable mechanism of palpitations is not clear from clinical history; and
patients with syncope or presyncope in whom bradycardia or tachycardia is suspected.
The CSANZ guideline states that AECG may also be indicated for:
patients with pacemakers, in whom pacemaker malfunction is suspected; risk assessment post MI; or follow up of drug therapy for arrhythmias.
The CSANZ guideline contains no formal recommendations or clear links to the clinical evidence. Guidance was based on a 1999 ACC/AHA guideline on AECG monitoring and a 1993 AHA/ACC/ACP statement on clinical competence in AECG.
Table 7.2.120 lists the formal recommendations from international guidelines relating to indications for AECG monitoring of various durations, together with the strength of the recommendation and level of evidence (where reported).
In brief, short-term AECG monitoring (using Holter monitors or similar) is recommended for:
patients with suspected paroxysmal AF undetected by standard ECG recording; patients who have experienced IS/TIA, when arrhythmias are suspected and no other
causes are found, in potential candidates for oral anticoagulant therapy; patients with a suspected cardiac arrhythmic cause of syncope; patients with unexplained syncope; patients with recurrent palpitations;
MBS Review – Ambulatory Electrocardiography Review Report Page 213

May 2016
patients with congenital heart disease when there is a need to clarify or exclude an arrhythmia diagnosis, correlate arrhythmias with symptoms, evaluate risk, or determine appropriate therapy;
initial evaluation of asymptomatic adolescent and young adult patients with tricuspid regurgitation;
initial assessment of Chagas’ heart disease in patients with altered resting ECG; assessment of arrhythmias and prognostic stratification of patients with chronic chagasic
cardiopathy; infants and children suspected of having ventricular arrhythmias; infants and children with previously documented frequent ventricular ectopy, and when
continued ectopy is confirmed or strongly suspected; assessment of rate control or bradycardia in patients with AF treated with rate control;
and assessment of the efficacy of treatment in patients treated with rhythm control.
Medium-term AECG monitoring (using ELRs or ERs) is recommended for:
patients with suspected paroxysmal AF undetected by standard ECG recording; selected older patients with an acute, nonlacunar, embolic stroke of undetermined source,
in potential candidates for oral anticoagulant therapy; detection of AF after IS/TIA with no other apparent cause; patients with a suspected cardiac arrhythmic cause of syncope; patients with unexplained syncope; patients with recurrent (pre)syncopes of suspected arrhythmic origin and absence of high-
risk criteria that require immediate hospitalisation or intensive evaluation; patients with recurrent palpitations, undocumented by conventional ECG techniques,
who have absence of high-risk criteria, which require immediate hospitalisation or intensive evaluation;
initial evaluation of patients with hypertrophic cardiomyopathy to detect ventricular tachycardia and identify patients who may be candidates for ICD therapy;
patients with hypertrophic cardiomyopathy who develop palpitations or light-headedness; adults with hypertrophic cardiomyopathy to assess for asymptomatic paroxysmal
AF/atrial flutter; and patients with congenital heart disease to establish whether or not sporadic symptoms are
caused by transient arrhythmias.
Long-term AECG monitoring (using ILRs) is recommended for:
patients with a suspected cardiac arrhythmic cause of syncope; patients with unexplained syncope; early phase evaluation in patients with recurrent syncope of uncertain origin who have
absence of high-risk criteria that require immediate hospitalisation or intensive evaluation;
assessment of bradycardia before embarking on cardiac pacing in patients with suspected or certain reflex (neutrally mediated) syncope presenting with frequent or traumatic syncopal episodes;
severe infrequent palpitations associated with haemodynamic compromise, when all the other examinations prove inconclusive;
palpitations in non-compliant patients without haemodynamic compromise when a clinically significant arrhythmic cause is likely or must be ruled out; and
patients with congenital heart disease where the index of suspicion for a malignant arrhythmia is high (e.g. syncope) but a symptom–rhythm correlation cannot be
MBS Review – Ambulatory Electrocardiography Review Report Page 214

May 2016
established by conventional noninvasive techniques or invasive electrophysiologic testing.
Several guidelines and position statements also mentioned other indications for AECG monitoring (mainly short-and medium term), but did not develop formal recommendations. These indications included:
follow up after an AF ablation procedure; diagnosis of CPVT, particularly in children who are not able to perform exercise testing; diagnosis of SSS; investigation of cardiac dysfunction in patients with Duchenne or Becker muscular
dystrophy; perioperative monitoring for open surgical and endovascular thoracic aortic repairs, and
after CABG surgery.
MBS Review – Ambulatory Electrocardiography Review Report Page 215

May 2016
Table 7.2.120 Summary of specific recommendations relating to indications for AECG monitoringPopulation
Monitoring periodRecommendations Class of
recommendationaLOEa
AFShort termNICE 2014 In patients with suspected paroxysmal AF undetected by standard ECG recording, a 24-hour ambulatory ECG monitor should be
used in those with suspected asymptomatic episodes or symptomatic episodes less than 24 hours apart.- -
Medium termNICE 2014 In patients with suspected paroxysmal AF undetected by standard ECG recording, an event recorder ECG should be used in those
with symptomatic episodes more than 24 hours apart.- -
Duration not specifiedESC 2010 In patients with suspected symptomatic AF, additional ECG monitoring b should be considered in order to document the
arrhythmia.IIa B
ESC 2010 Additional ECG monitoring b should be considered for detection of ‘silent’ AF in patients who may have sustained an AF-related complication.
IIa B
AF after strokeShort termCCS 2014 For patients being investigated for an acute embolic ischemic stroke or TIA, we recommend at least 24 hours of ECG monitoring to
identify paroxysmal AF in potential candidates for OAC therapy.Strong Moderate
quality
ESO 2008 It is recommended that all acute stroke and TIA patients should have a 12-lead ECG. In addition continuous ECG recording is recommended for ischaemic stroke and TIA patients.
I A
ESO 2008 It is recommended that for stroke and TIA patients seen after the acute phase, 24-hour Holter ECG monitoring should be performed when arrhythmias are suspected and no other causes of stroke are found.
I A
Medium termHSFC 2015 In cases where the ECG or initial cardiac rhythm (e.g. 24- or 48-hour ECG) does not show atrial fibrillation but a cardioembolic
mechanism is suspected, prolonged ECG monitoring, up to 30 days duration, is recommended in selected patients for detection of paroxysmal AF.
- B
CCS 2014 For selected older patients with an acute, nonlacunar, embolic stroke of undetermined source for which AF is suspected but unproven, additional ambulatory monitoring (beyond 24 hours) for AF detection is suggested, where available, if it is likely that oral anticoagulant therapy would be prescribed if prolonged AF is detected.
Conditional Moderate quality
AHA/ASA2014
For patients who have experienced an acute ischaemic stroke or TIA with no other apparent cause, prolonged rhythm monitoring (≈30 days) for AF is reasonable within 6 months of the index event.
IIa C
SyncopeShort termNICE 2010 For people with a suspected cardiac arrhythmic cause of syncope, offer an ambulatory ECG and do not offer a tilt test as a first-
line investigation. The type of ambulatory ECG offered should be chosen on the basis of the person’s history (and, in particular, frequency) of TLoC.
- -
MBS Review – Ambulatory Electrocardiography Review Report Page 216

May 2016
PopulationMonitoring period
Recommendations Class of recommendationa
LOEa
For people who have TLoC at least several times a week, offer Holter monitoring (up to 48 hours if necessary). If no further TLoC occurs during the monitoring period, offer an external event recorder that provides continuous recording with the facility for the patient to indicate when a symptomatic event has occurred.
NICE 2010 For all people with unexplained syncope (including after negative carotid sinus massage test in those for whom this is appropriate), offer ambulatory ECG (see recommendation above). Do not offer a tilt test before the ambulatory ECG.
- -
ESC 2009 ECG monitoring is indicated in patients who have clinical or ECG features suggesting arrhythmic syncope. The duration (and technology) of monitoring should be selected according to the risk and the predicted recurrence rate of syncope: Holter monitoring is indicated in patients who have very frequent syncope or presyncope (≥1 per week).
I B
Medium termNICE 2010 For people with a suspected cardiac arrhythmic cause of syncope, offer an ambulatory ECG and do not offer a tilt test as a first-
line investigation.For people who have TLoC every 1–2 weeks, offer an external event recorder. If the person experiences further TLoC outside the period of external event recording, offer an implantable event recorder.
- -
NICE 2010 For all people with unexplained syncope (including after negative carotid sinus massage test in those for whom this is appropriate), offer ambulatory ECG (see recommendation above). Do not offer a tilt test before the ambulatory ECG.
- -
ESC 2009 ELRs should be considered in patients who have an inter-symptom interval ≤4 weeks. IIa BEHRA 2009 ELRs may be indicated in patients with recurrent (pre)syncopes who have inter-symptom interval of 4 weeks, and suspicion of
arrhythmic origin and absence of high-risk criteria that require immediate hospitalisation or intensive evaluation.IIa B
Long termNICE 2010 For people with a suspected cardiac arrhythmic cause of syncope, offer an ambulatory ECG and do not offer a tilt test as a first-
line investigation.For people who have TLoC infrequently (less than once every 2 weeks), offer an implantable event recorder. A Holter monitor should not usually be offered unless there is evidence of a conduction abnormality on the 12-lead ECG.
- -
NICE 2010 For all people with unexplained syncope (including after negative carotid sinus massage test in those for whom this is appropriate), offer ambulatory ECG (see recommendation above). Do not offer a tilt test before the ambulatory ECG.
- -
NICE 2010 When offering a person an implantable event recorder, provide one that has both patient activated and automatic detection modes. Instruct the person and their family and/or carer how to operate the device. Advise the person that they should have prompt follow up (data interrogation of the device) after they have any further TLoC.
- -
ESC 2009 ILR is indicated in an early phase of evaluation in patients with recurrent syncope of uncertain origin who have absence of high-risk criteria that require immediate hospitalisation or intensive evaluation, and a high likelihood of recurrence within battery longevity of the device.
I B
EHRA 2009 ILR is indicated in an early phase of evaluation in patients with recurrent syncope of uncertain origin who have absence of high-risk criteria that require immediate hospitalisation or intensive evaluation, and a high likelihood of recurrence within battery longevity of the device.
I A
ESC 2009EHRA 2009
ILR is indicated in high-risk patients in whom a comprehensive evaluation did not demonstrate a cause of syncope or lead to a specific treatment.
I B
MBS Review – Ambulatory Electrocardiography Review Report Page 217

May 2016
PopulationMonitoring period
Recommendations Class of recommendationa
LOEa
ESC 2009EHRA 2009
ILR may be indicated to assess the contribution of bradycardia before embarking on cardiac pacing in patients with suspected or certain reflex (neutrally mediated) syncope presenting with frequent or traumatic syncopal episodes.
IIa B
EHRA 2009 ILR may be indicated in patients with TLoC of uncertain syncopal origin in order to definitely exclude an arrhythmic mechanism. IIb CPalpitationsShort termEHRA 2011 Indications for Holter monitoring: From daily to weekly palpitations; patients who are unable to use other ambulatory ECG
monitoring devices.- -
Medium termEHRA 2011 Indications for ERs: From weekly to monthly, fairly long-lasting palpitations not accompanied by haemodynamic impairment;
compliant patients.- -
EHRA 2011 Indications for ELRs/MCOT: From weekly to monthly, short-lasting palpitations associated to haemodynamic impairment; very compliant patients.
- -
EHRA 2009 ELRs are indicated in patients with recurrent palpitations, undocumented by conventional ECG techniques, who have: inter-symptom interval <4 weeks and absence of high-risk criteria, which require immediate hospitalisation or intensive evaluation.
I B
Long term
EHRA 2011 Indications for ILRs: From monthly to yearly palpitations associated with haemodynamic compromise; when all the other examinations prove inconclusive; non-compliant patients without haemodynamic compromise when a clinically significant arrhythmic cause is likely or must be ruled out.
- -
EHRA 2009 ILRs may be indicated in selected cases with severe infrequent symptoms when ELRs and other ECG monitoring systems fail to document the underlying cause.
IIa B
Ventricular arrhythmiaShort termESC 2015 Ambulatory ECG c is recommended to detect and diagnose arrhythmias. Twelve-lead ambulatory ECG is recommended to evaluate
QT-interval changes or ST changes.1 A
PACES/HRS 2013 Infants and children suspected of having ventricular arrhythmias should have a 12-lead ECG, echocardiography, 24-hour ambulatory ECG monitoring, and a detailed personal and family history.For infants and children with previously documented frequent ventricular ectopy, and when continued ectopy is confirmed or strongly suspected, follow-up 24-hour ambulatory ECG monitoring is recommended.
I
I
C
C
ACC/AHA/ ESC 2006 Ambulatory ECG is indicated when there is a need to clarify the diagnosis by detecting arrhythmias, QT-interval changes, T-wave alternans, or ST changes, to evaluate risk, or to judge therapy.
I A
Medium termESC 2015 Cardiac event recorders are recommended when symptoms are sporadic to establish whether they are caused by transient
arrhythmias.I B
ACC/AHA/ ESC 2006 Event monitors are indicated when symptoms are sporadic to establish whether or not they are caused by transient arrhythmias. I BLong term
MBS Review – Ambulatory Electrocardiography Review Report Page 218

May 2016
PopulationMonitoring period
Recommendations Class of recommendationa
LOEa
ESC 2015 Implantable loop recorders are recommended when symptoms, e.g. syncope, are sporadic and suspected to be related to arrhythmias and when a symptom–rhythm correlation cannot be established by conventional diagnostic techniques.
I B
ACC/AHA/ ESC 2006 Implantable recorders are useful in patients with sporadic symptoms suspected to be related to arrhythmias such as syncope when a symptom-rhythm correlation cannot be established by conventional diagnostic techniques.
I B
Hypertrophic cardiomyopathyShort term
ACCF/AHA 2011 Twenty-four–hour ambulatory (Holter) electrocardiographic monitoring is recommended in the initial evaluation of patients with HCM to detect ventricular tachycardia (VT) and identify patients who may be candidates for ICD therapy.
I B
ACCF/AHA 2011 Twenty-four–hour ambulatory (Holter) electrocardiographic monitoring or event recording is recommended in patients with HCM who develop palpitations or light-headedness.
I B
ACCF/AHA 2011 Twenty-four–hour ambulatory (Holter) electrocardiographic monitoring, repeated every one to two years, is reasonable in patients with HCM who have no previous evidence of VT to identify patients who may be candidates for ICD therapy.
IIa C
ACCF/AHA 2011 Twenty-four–hour ambulatory (Holter) electrocardiographic monitoring might be considered in adults with HCM to assess for asymptomatic paroxysmal AF/atrial flutter.
IIb C
Congenital heart diseaseShort term
PACES/HRS 2014 Ambulatory ECG monitoring is indicated when there is a need to clarify or exclude an arrhythmia diagnosis, correlate arrhythmias with symptoms, evaluate risk, or determine appropriate therapy.
I B
PACES/HRS 2014 Periodic Holter monitoring can be beneficial as part of routine follow up in adults with transposition of the great arteries and atrial switch surgery, Fontan palliation, and in patients with tetralogy of Fallot over 35 years of age.
IIa B
Medium termPACES/HRS 2014 Cardiac event loop recorders are indicated to establish whether or not sporadic symptoms are caused by transient arrhythmias. I CLong termPACES/HRS 2014 ILRs are useful in cases where the index of suspicion for a malignant arrhythmia is high (e.g. syncope) but a symptom–rhythm
correlation cannot be established by conventional noninvasive techniques or invasive electrophysiologic testing.I B
Valvular heart diseaseShort termACC/AHA 2006 Holter monitoring may be considered for the initial evaluation of asymptomatic adolescent and young adult patients with tricuspid
regurgitation, and serially every one to three years.IIb C
Chagas’ heart diseaseShort termBSC 2011 Holter monitoring is indicated in the initial assessment of patients with altered resting ECG. IIa CBSC 2011 Holter monitoring is indicated for the assessment of arrhythmias and prognostic stratification of patients with chronic chagasic
cardiopathy.I C
MBS Review – Ambulatory Electrocardiography Review Report Page 219

May 2016
PopulationMonitoring period
Recommendations Class of recommendationa
LOEa
BSC 2011 Patients with chronic chagasic cardiopathy with high density of ventricular arrhythmia, particularly those with electrocardiographic abnormalities, regional or global ventricular dysfunction, and HF; Holter monitoring should be performed independently of symptoms, because it can identify complex arrhythmias, impacting on the treatment and prognosis.
IIa B
Heart failure childrenShort termCCS 2013 Holter/ambulatory ECG monitoring is not indicated as a primary diagnostic test in HF, unless HCM, arrhythmogenic RV CM, or
tachycardia-induced CM is the suspected cause.Conditional Low
CCS 2013 Holter/ambulatory ECG monitoring might be indicated during chronic follow up, particularly in higher arrhythmia risk groups, including patients with primary restrictive CM or HCM, with tachycardia-induced CM, or those who are taking antiarrhythmic therapy.
Conditional Low
Assessment of rate or rhythm controlShort termESC 2010 In patients with AF treated with rate control, Holter ECG monitoring should be considered for assessment of rate control or
bradycardia.In patients treated with rhythm control, repeated ECG monitoring may be considered to assess the efficacy of treatment.
IIa
IIb
C
BAbbreviations: ACC, American College of Cardiology; ACCF, American College of Cardiology Foundation; AECG, ambulatory electrocardiography; AHA, American Heart Association; AF, atrial fibrillation; ASA, American Stroke Association; AV, atrioventricular; BSC, Brazilian Society of Cardiology; CABG, coronary artery bypass graft; CCS, Canadian Cardiovascular Society; CM, cardiomyopathy; ECG, electrocardiogram; EHRA, European Heart Rhythm Association; ELR, external loop recorder; ER, event recorder; ESC, European Society of Cardiology; ESO, European Stroke Organisation; HCM, hypertrophic cardiomyopathy; HF, heart failure; HRS, Heart Rhythm Society; HSFC, Heart and Stroke Foundation of Canada; ICD, implantable cardioverter-defibrillator; ILR, implantable loop recorder; LOE, level of evidence; MCOT, mobile cardiac outpatient telemetry; NICE, National Institute for Health and Care Excellence; OAC, oral anticoagulation therapy; PACES, Paediatric and Congenital Electrophysiology Society; SVT, supraventricular tachycardia; RM, remote monitoring; RV, right ventricular; SCD, sudden cardiac death; TIA, transient ischaemic attack; TLoC, transient loss of consciousness; VT, ventricular tachycardiaa See Appendix 9 for an explanation of the grading of recommendations and levels of evidence.b Monitoring using Holter or external ERs should be considered when arrhythmia or therapy-related symptoms are suspected. More intense and prolonged monitoring is justified in highly symptomatic patients, patients with recurrent syncope, and patients with a potential indication for anticoagulation (especially after cryptogenic stroke). In selected patients, ILR may be considered to establish the diagnosis.c The guideline states that 24- to 48-hour continuous Holter recording is appropriate whenever the arrhythmia is known or suspected to occur at least once a day.
MBS Review – Ambulatory Electrocardiography Review Report Page 220

May 2016
7.2.2 For what clinical indications is one duration of AECG monitoring recommended over another (i.e. short term vs medium term, etc.)?
There was general agreement in guidelines that the duration and type of AECG monitoring should be selected according to the patient’s history and the predicted recurrence rate (frequency) of symptoms. In general:
Holter monitoring (24-48 hours) is indicated in patients who have very frequent symptoms (symptoms that occur daily or at least once per week), or are unable to use other AECG monitoring devices.
ERs or ELRs are recommended for patients with recurrent symptoms that occur weekly or at least once a month. External event recording is generally not recommended for more than 3–4 weeks due to poor patient compliance.
ILRs are useful for patients with infrequent symptoms (monthly to yearly) when all the other examinations prove inconclusive, and for non-compliant patients when a clinically significant arrhythmic cause is likely or must be ruled out.
7.2.3 For what clinical indications is one mechanism of triggering event recording (i.e. intermittent recording) recommended over another?
There were no clear recommendations relating to the mechanism of triggering recording; however, general guidance suggests that the use of patient-activated ERs for the detection of arrhythmias may be inappropriate in patients experiencing sudden asymptomatic syncope due to the inability of the patient to activate the ER prior to fainting. Patient-activated ERs and patient-activated ELRs may also miss the detection of transient asymptomatic arrhythmias.
ERs and ELRs are generally considered to be more useful for palpitations (with weekly recurrence) than for syncope evaluation. However, patient-activated ERs are useful only when symptoms (e.g. palpitations) last long enough to allow the patient to activate the recorder, and have the disadvantage that arrhythmic triggers are not revealed.
7.2.4 Are the descriptors for the MBS item numbers/services under review consistent with evidence-based (or in the absence of evidence, consensus-based) recommendations provided in relevant clinical practice guidelines?
Indications for monitoringThe descriptors for four of the six MBS items (11708, 11709, 11710, and 11711) do not provide any details of the intended target population for AECG monitoring or restrict the use of AECG monitoring to any particular clinical indication. Table 7.2.120 provides a list of presentations/indications for continuous and event recording, as recommended in Australian and international CPGs. CPGs emphasise that the choice of monitoring period and device depends on the type and frequency of patient’s symptom(s), the ability of the patient (e.g. to activate a device while having symptoms, to fill out a diary), and the accessibility of the device (BCMA, 2013).
In contrast to the items for short- and medium-term monitoring, the descriptors for MBS items 38285 and 11722, which are for ILRs, restrict use of these devices to the diagnosis of patients with recurrent unexplained syncope where:
a diagnosis has not been achieved through all other available cardiac investigations; a neurogenic cause is not suspected; and it has been determined that the patient does not have structural heart disease associated
with a high risk of SCD.
MBS Review – Ambulatory Electrocardiography Review Report Page 221
May 2016
According to Explanatory Note T8.62 for Item 38285, the term ‘recurrent’ refers to more than one episode of syncope, where events occur at intervals of one week or longer. NICE (2010) recommends ILR for people who have syncope infrequently, defined as less than once every two weeks.
Although the descriptors and Explanatory Notes relating to Items 38285 and 11722 are largely consistent with evidence-based CPGs, NICE (2010) also recommends the use of ILRs in patients with a suspected cardiac arrhythmic cause of syncope.
Furthermore, ILR is recommended in patients with severe infrequent palpitations associated with haemodynamic compromise, when all the other examinations prove inconclusive (EHRA, 2011). ILR is also recommended in adults with congenital heart disease where the index of suspicion for a malignant arrhythmia is high (e.g. syncope) but a symptom–rhythm correlation cannot be established by conventional noninvasive techniques or invasive electrophysiologic testing (PACES/HRS, 2014), and for remote monitoring of ICEDs (HRS, 2015).
The Explanatory Note for Item 38285 lists the other available cardiac investigations that must be undertaken prior to implantation of a loop recorder. These include:
a complete history and physical examination that excludes a primary neurological cause of syncope and does not exclude a cardiac cause;
ECG (MBS items 11700-11702); echocardiography (MBS items 55113-55115); continuous ECG recording or AECG monitoring (MBS items 11708-11711); upright TT test (MBS item 11724); and cardiac electrophysiological study, unless there is reasonable medical reason to waive
this requirement (MBS item 38209).
The EHRA (2009) Position Paper on indications for the use of diagnostic implantable and external ELRs states that ILR was initially used as last resort in the evaluation of syncope after all investigations were negative. However, several studies have shown a poor correlation between the responses of TT testing and ECG observation at the time of spontaneous syncope (the reference standard), which raises concerns about the utility of TT testing in the diagnostic workup. These concerns were also raised in an earlier scientific statement on the evaluation of syncope from the AHA/ACCF (2006). The NICE (2010) guideline for the management of TLoC specifically recommends against TT testing as a first-line investigation for a person with a suspected cardiac arrhythmic cause of syncope or with unexplained syncope.
Duration of monitoringThe descriptors for two MBS items for continuous recording (Items 11708 and 11709) specify a monitoring period of 12 hours or more. Where a recording is analysed and reported on, and a decision is made to undertake a further period of monitoring, the second episode is regarded as a separate service. There is no upper limit for monitoring duration and no limit on the number of services that may be claimed within a specified time period. If services for V-Patch devices are being claimed using Item 11708, the monitoring period may be up to seven days.72
CPGs generally recommend Holter monitoring for 24 hours, although some also suggest that 48-hour monitoring may be appropriate (e.g. for syncope). One guideline on the general use of AECG monitors (BCMA 2013) states that if the initial Holter monitoring is inconclusive
72 V-Patch is designed to be worn for up to seven days without changing the patch or recharging the batteries.
MBS Review – Ambulatory Electrocardiography Review Report Page 222

May 2016
due to low frequency of symptoms, a repeated Holter monitoring may not be appropriate and second-line investigations should be considered.
The two MBS items for external event recording (Items 11710 and 11711) also specify a monitoring period of 12 hours or more, with no further guidance on an appropriate monitoring period. However, the descriptors for Items 11710 and 11711 specify that the benefits are payable once in any four-week period. External event recorders are not recommended for more than three to four weeks’ use due to poor patient compliance (EHRA 2011).
The Explanatory Note relating to Item 38285 states that benefits are payable only once per day, which is appropriate for implantation of a loop recorder. There could be a need for repeat implantation due to complications or device malfunction. The battery life of an ILR is two years or more. There is no limit to the frequency of benefits payable for ILR monitoring using Item 11722.
Activation of event recordingThe descriptors for Items 11710 and 11711 restrict the use of these items to patient-activated devices. There is no mention of whether the devices can also be auto triggered, so the use of Item 11710 can presumably extend to devices that are auto plus patient triggered. Clinical guidelines advise that the use of patient-activated devices for the detection of arrhythmias may be inappropriate in patients experiencing sudden asymptomatic syncope (due to the inability of the patient to activate the device prior to fainting) and for detection of transient asymptomatic arrhythmias.
Of note, it has been suggested that V-Patch devices are currently being claimed using Item 11708, which is intended for continuous recording not using a Holter. However, although V-Patch and other MCT devices are referred to as real-time continuous monitoring, these devices do not continuously record the patient’s full ECG. Rather, they are event recorders, continuously primed to upload brief recordings of an event to a remote diagnostic monitoring laboratory at the time it occurs, rather than at the end of the monitoring period.
The descriptors and Explanatory Note relating to Items 38285 and 11722 do not specify the mechanism of triggering. ILRs may be patient triggered or auto plus patient triggered. The NICE (2010) guideline on the management of TLoC recommends that patients are offered an implantable event recorder that has both patient-activated and automatic detection modes.
7.3 Evidence for the effectiveness and safety of AECG
As outlined in Section 2.4.1, the research questions for the clinical evidence review are:
(1) What is the evidence of effectiveness and safety of AECG monitoring of any duration compared with no AECG monitoring?
(2) What is the evidence of effectiveness and safety of AECG monitoring of one duration (short-, medium-, or long term) compared with AECG monitoring of a different duration (short-, medium-, or long term)?
(3) What is the evidence of effectiveness and safety of auto-triggered AECG monitoring compared with patient-triggered AECG monitoring of the same duration (either medium- or long term)?
MBS Review – Ambulatory Electrocardiography Review Report Page 223

May 2016
The most commonly reported outcome in the identified evidence for AECG is diagnostic yield (e.g. proportion of patients with a detected arrhythmia, or with an arrhythmia/symptom correlation etc.). In the absence of a reference standard, sensitivity and specificity cannot be assessed. Only a minority of studies reported longer-term outcomes (e.g. change in patient management), and patient-relevant outcomes were rarely included. Therefore the question of effectiveness is largely addressed in the current Review in respect of diagnostic yield.
The bulk of AECG studies are not comparative, and even where comparative evidence was available, systematic reviews would typically use cohort data to derive diagnostic yield summary statistics across all study types for a particular device or group of devices. Therefore, the comparative effectiveness of AECG is primarily addressed using low-level, non-comparative evidence.
The evidence was not well-suited to address the question of the relative effectiveness of AECG versus no AECG, as few studies included patients that had no prior AECG. However, prior monitoring frequently consisted of AECG from a shorter monitoring period; patients were often screened with a Holter prior to study entry (including some Holter studies), and for ILR studies, extended Holter, MCT or ELR were sometimes used. The comparison most readily afforded by the available evidence, therefore, is AECG versus no further monitoring, with the caveat that prior monitoring history is not necessarily consistent across all studies.
Therefore, with respect to the effectiveness of AECG versus no AECG (Question 1), the current Review will present findings in terms of AECG versus no further monitoring. In this framework, diagnostic yield will be considered as a measure of the incremental increase in diagnoses after further AECG monitoring with the index test.
With regard to the effectiveness of one duration of AECG compared to another (Question 2), comparisons are also often confounded by heterogeneity of prior AECG monitoring, and conclusions must be considered in light of these limitations.
The following sections present the overall findings of the key systematic reviews/HTAs and summarise the findings in relation to the clinical questions of the current Review. The findings are then synthesised across the systematic reviews, by clinical question.
7.3.1 Detection of arrhythmia for any indication
The authors of the AHRQ (2007) HTA state that a review of the downstream utility of a diagnostic technology needs to evaluate whether diagnosis actually leads to a change in clinical management and, ideally, should evaluate whether the diagnosis ultimately leads to improved patient-oriented outcomes. However, most studies in the field address the question of diagnostic yield, and rarely report downstream, patient-oriented outcomes. Despite the age of the review and the extensive overlap with other key reviews (mostly Westby, 2010), this HTA was included in the current Review due to the focus on outcomes downstream from diagnosis.
This HTA included only medium- and long-term AECG devices (i.e. excluded Holter monitoring) as the index test (although Holter was included as a comparator). Monitoring with these devices was referred to collectively as remote cardiac monitoring. Two questions of relevance to the current Review were addressed, paraphrased as follows:
1. Is management changed as a result of remote cardiac monitoring and do these changes lead to improvements in symptoms/patient-relevant outcomes? (Q.3 in AHRQ, 2008)
MBS Review – Ambulatory Electrocardiography Review Report Page 224

May 2016
The implied comparator is conventional follow up, which may include other forms of AECG (e.g. Holter). This question is aligned with the first clinical question in the current Review, where the comparator for remote monitoring is no AECG (or, more specifically, no further AECG).
2. Does one category of device lead to greater improvement than another? (Q.4 in AHRQ, 2008)
This question is aligned with the second and third clinical questions in the current Review.
Table 7.3.121 presents the findings from the AHRQ (2007) HTA with reference to the clinical questions of the current Review.
Table 7.3.121 Findings of the AHRQ (2007) HTA of remote cardiac monitoring for any arrhythmiaClinical question by outcome
Population
Evidence base Findings Conclusions
Question 1:AECG vs no further AECG
Change in management
Long-term AECG
ILR vs no further AECG
Unexplained syncope
Pooled odds ratio of change in management from 11 studies using comparator of 1 RCT as assumed rate for control group.
Moderate quality on average; moderate strength of evidence.
Direction of effect in favour of ILR, even in sensitivity analyses that increase control rate from 7.1% to 20%. a
ILR superior to no ILR (conventional assessment).
Syncopal episode recurrence
Long-term AECG
ILR vs no further AECG
Unexplained syncope
Proportions with syncope recurrence from 2 RCTs (1 high quality, 1 low quality and 2 case series (moderate quality).
Conflicting findings; 1 high-quality RCT found no difference between ILR and no ILR, the other found ILR superior but groups not actually randomised. One case series showed a significant reduction before/after test.
Insufficient evidence.
Mortality
Long-term AECG
ILR vs no further AECG
Unexplained syncope
Mortality rate from two RCTs (1 high quality, 1 low quality) and 1 moderate-quality case series.
No difference detected in high-quality RCT. Comparative data not available for other studies.
Insufficient evidence.
QoL
Long-term AECG
ILR vs no further AECG
Unexplained syncope
QoL assessments from 1 high-quality RCT.
6 months: no difference for either SF-12 or general well-being VAS.
12 months: general well-being VAS favours ILR, but small effect size.
Insufficient evidence.
Question 2:Duration vs duration
Change in management
Medium-term vs long-term AECG
ER vs ILR
Palpitations
Proportions of ECG-guided treatment change from 1 moderate-quality RCT.
% with treatment change: 2/24 vs 19/26; p = 0.0002, favouring ILR, but study too small and imbalanced at baseline to allow conclusion.
Insufficient evidence for ER vs ILR.
Medium-term vs long-term AECG
ELR vs ILRSyncope
Proportions of ECG-guided treatment change from 1 moderate-quality RCT.
% with treatment change: 1/30 vs 14/30; p = 0.0001, favouring ILR, but study too small and imbalanced at baseline to allow conclusion.
Insufficient evidence for ELR vs ILR in change in management.
Syncopal episode recurrence
Medium-term vs long-term AECG
ELR vs ILR
Syncope
Proportions with syncope recurrence from 1 moderate-quality RCT.
1/1 vs 13/14 after first phase, 0/0 vs 7/8 in crossover phase, but authors note spontaneous resolution not captured equally for two tests (and is small and imbalanced at baseline).
Insufficient evidence for ELR vs ILR.
MBS Review – Ambulatory Electrocardiography Review Report Page 225

May 2016
Clinical question by outcome
Population
Evidence base Findings Conclusions
Question 3:Patient vs patient/auto triggered
Change in management
Medium-term AECG: PT vs AT/PT
MCT vs ELR b
Severe palpitations (<once /24h)
Proportions of ECG-guided treatment change and detection of clinically significant arrhythmias (presumably those requiring change in treatment) from 1 moderate-quality RCT.
% with treatment change: 55/134 vs 19/132; p < 0.05, favouring MCT.Significant difference, favouring MCT, in detection of clinically significant arrhythmias.
MCT (AT/PT) superior to ELR (PT).
Abbreviations: AECG, ambulatory electrocardiography; AT, auto triggered; ELR, event loop recorder; ER, event recorder; ILR, implantable loop recorder; MCT, mobile cardiac telemetry; mgmt., management; PT, patient triggered; QoL, quality of life; RCT, randomised controlled trial; SF-12, 12-item Short Form Health Survey; VAS, visual analog scale.a Authors note that this synthesis was not intended to provide a quantitative estimate, but to allow a conclusion regarding the direction of effect.b 80% of patients in the ELR group used devices that were patient activated only. The AHRQ (2007) authors do not specify that this comparison provides evidence for patient-activated ELRs in particular, but they note the conclusions cannot be extended to automatically activated devices. Therefore this RCT is regarded by the current Review as a comparison of patient-triggered ELR and auto- or patient-triggered MCT.
Overall, the evidence was insufficient to allow conclusions about the impact of remote cardiac monitoring on any patient-relevant outcomes. However, evidence was identified that certain remote cardiac monitoring devices do lead to changes in patient management:
Patients with unexplained syncope are more likely to undergo a change in management when using ILR monitoring than when using conventional assessment (i.e. Holter monitoring and/or TT testing): moderate strength of evidence (based on 11 studies of moderate quality, on average).
Patients with severe palpitations less than once per 24 hours are more likely to undergo a change in disease management when using MCT (auto and patient activated) than when using patient-activated ELR: weak strength of evidence (one high-quality multicentre trial).
The evidence was insufficient to evaluate the effect of other remote monitoring devices (auto-activated ELRs and ERs) on change in disease management.
For the purposes of the current Review, the evidence presented in AHRQ (2007) shows a difference in change in management for patients with unexplained syncope using long-term AECG compared to short-term AECG, favouring ILR. It also found a difference in change in management for patients with severe palpitations using MCT compared to patient-activated ELR, favouring the auto-activated MCT. Change in patient management is a surrogate outcome; the assumption is that any change has a positive impact on the patient.
7.3.2 Detection of AF after stroke
Two key systematic reviews with overlapping populations were presented for this indication, one for non-haemorrhagic IS/TIA of any cause (Sposato, 2015) and the other for cryptogenic IS/TIA (Afzal, 2015). These systematic reviews used different analytical approaches: Afzal (2015) meta-analysed diagnostic yield from three RCTs of longer-term monitoring (ILR/ELR) versus conventional follow up, and provided a narrative review of the results from studies of other design; Sposato (2015) pooled diagnostic yield from cohorts derived from studies of any design. This approach allowed for large datasets but, not surprisingly, introduced heterogeneity. The findings of each of these studies are examined in respect of the clinical questions of the current Review.
MBS Review – Ambulatory Electrocardiography Review Report Page 226

May 2016
Sposato (2015)The only classification of studies in the Sposato (2015) review was by device type: nine ECG recording technologies were grouped into one of four phases of ECG. In-hospital Holter monitoring was reported within Phase 2. Out-patient ambulatory monitoring was divided into Phase 3 (outpatient Holter) and Phase 4 (medium- to long-term AECG). Within Phase 4, results were reported separately for ELR, MCT and ILR. Table 7.3.122 summarises the findings of Sposato (2015) in terms of the clinical questions of the current Review.
The purpose of the Sposato (2015) review was to estimate the prevalence of AF in the IS/TIA population rather than to compare the various ECG monitoring technologies. Although summary statistics of diagnostic yield were reported for each phase and each group (Table 7.3.122), the authors do not purport to directly compare the diagnostic yields of each device type if used in place of the other, as patients undergoing latter-phase monitoring had varied monitoring histories with prior-phase technologies. Furthermore, while the Sposato (2015) review included any IS/TIA populations, the proportion of cryptogenic stroke patients within a device group increased as the duration of monitoring increased, with the ILR group being exclusively cryptogenic patients. Consequently, the conclusions of the Sposato (2015) review are limited regarding the relative benefits of different AECG monitoring methods.
However, Sposato (2015) did compare types of Phase 4 devices, and found no statistically significant differences in diagnostic yield between ILR and either ELR or MCT (medium-term versus long-term AECG). The comparison of ILR and MCT for another outcome – proportion of diagnoses made in the first 21 days of monitoring – found an almost six-fold higher rate of diagnosis at 21 days using MCT compared to ILR. The authors warned that these patient populations are dissimilar. Prior to ILR, patients were more likely to have had extensive monitoring compared to those using MCT, and the delay from clinical event to monitoring was twice as long for ILR than for MCT, which the authors suggest may result in fewer instances of AF in the ILR cohort. Therefore, it cannot be concluded from this data that MCT provides more rapid diagnosis than ILR in the same patient population.
The authors noted that Holter monitoring was usually performed prior to longer monitoring strategies, and no comparison was reported of short-term AECG with medium- or long-term AECG in the Sposato (2015) review.
The authors presented a sequential monitoring model of diagnostic yield which took into account the proportions and types of prior monitoring in each cohort. The purpose of this model was to estimate the frequency of undiagnosed AF in the IS/TIA population. The probability of receiving a diagnosis after each phase is derived from this model, expressed as a proportion of the total IS/TIA population undergoing any ECG assessment, rather than as a proportion of patients undergoing monitoring with a particular device. This overall probability of diagnosis was reported for short-term AECG (7.5%) and medium- to long-term AECG (4.3%), which corresponds to 31.7% and 18.1%, respectively, of all AF diagnoses made by any ECG.
These probabilities indicate a greater proportion of diagnoses are made using Holter compared to medium- or long-term monitoring devices, but once again, this information cannot be used to compare the two monitoring strategies as patients undergoing medium- or long-term AECG have usually already been screened with short-term AECG.
For the purposes of the current Review, the evidence presented in Sposato (2015) shows no difference in the diagnostic yield of medium-term and long-term AECG. This finding is
MBS Review – Ambulatory Electrocardiography Review Report Page 227

May 2016
derived from largely cryptogenic stroke populations. The rate of diagnosis was found to be higher for MCT than ILR. Both of these conclusions are based on comparisons of dissimilar populations with regards to monitoring history.
Table 7.3.122 Findings of the systematic review by Sposato (2015) for detection of post-IS/TIA AF
Clinical question by outcome
Analysis Findings[95% CI]
Conclusions
Question 1:AECG vs no further AECG
Diagnostic yieldShort-term AECGHolter (outpatient) vs no further AECG
Pooled diagnostic yield 10.7 [5.6, 17.2] General trend: Holter detect less AF than longer AECG, but no difference between medium-term AECG and ILR is evident.
Medium-term AECGMCT vs no further AECG
Pooled diagnostic yield 15.3 [5.3, 29.3]
Medium-term AECGELR vs no further AECG
Pooled diagnostic yield 16.2 [9.3, 24.6]
Long-term AECGILR vs no further AECG
Pooled diagnostic yield 16.9 [10.3, 24.9]
Medium/long-term AECGELR/MCT/ILR vs no further AECG
Pooled diagnostic yield 16.9 [13.0, 21.2]
% of all IS/TIA patientsShort-term AECGHolter (outpatient) vs no further AECG
% of all IS/TIA patients diagnosed with AF by outpatient Holter a
7.5 More total diagnoses are made using Holter than ELR/MCT/ILR (but the latter are typically used in Holter –ve patients).
Medium/long-term AECGELR/MCT/ILR vs no further AECG
% of all IS/TIA patients diagnosed with AF by med/long-term AECG a
4.3
Question 2:Duration vs durationDiagnostic yieldMedium-term vs long-term AECGMCT vs ILR
Statistical comparison of pooled diagnostic yields
15.3 [5.3, 29.3]vs
16.9 [10.3, 24.9]
No difference in diagnostic yield between MCT and ILR
Medium-term vs long-term AECGELR vs ILR
Statistical comparison of pooled diagnostic yields
16.2 [9.3, 24.6]vs
16.9 [10.3, 24.9]
No difference in diagnostic yield between ELR and ILR
Days to detectionMedium-term vs long-term AECGMCT vs ILR
HR from Kaplan-Meier analysis of pooled data: % diagnoses made by 21 days
HR5.8 [3.3, 10.2]
The time to diagnosis is less for MCT than ILR.
Abbreviations: AECG, ambulatory electrocardiography; AF, atrial fibrillation; CI, confidence interval; ECG electrocardiography; ELR, event loop recorder; HR, hazard ratio; ILR, implantable loop recorder; IS, ischaemic stroke; MCT, mobile cardiac telemetry; med, medium; NR, not reported; TIA, transient ischaemic attack.a Derived from sequential monitoring model.
Afzal (2015)Table 7.3.123 summarises the findings of Afzal (2015) in terms of the clinical questions of the current Review. The aim of this systematic review was to compare the effectiveness of ILR with wearable devices in detection of AF in patients with cryptogenic stroke. Wearable devices included ELR, MCT and one study of 96-hour Holter. Cohort data were used to
MBS Review – Ambulatory Electrocardiography Review Report Page 228

May 2016
calculate pooled estimates of diagnostic yield for long-term AECG (ILR: 23.3% [95% CI: 13.83, 32.29]) and medium-term AECG (ELR/MCT/96h Holter: 13.6% [95% CI 7.91, 19.32]). The difference between these rates was statistically significant. The authors comment that this finding is tempered by dissimilar patient populations, study designs and durations of monitoring, but they conclude that the overall detection of AF with prolonged outpatient monitoring using ILR was superior when compared with wearable devices. The authors of the current Review note that this pooled diagnostic yield estimate for ILR is higher than that from the ILR cohort of the CRYSTAL AF RCT at six months (8.6%), 12 months (13.1%) and 36 months (19.0%).73
A meta-analysis was presented of the three RCTs for AF in cryptogenic stroke that compare medium- to long-term monitoring with conventional follow up. Gladstone (2014) (EMBRACE) and Higgins (2013) investigated ELR while Sanna (2014) (CRYSTAL AF) investigated ILR. Conventional follow up was 24-hour Holter monitoring in one study and included Holter monitoring at the discretion of the investigator in the other two studies, so for the purposes of the current Review, this comparison will be regarded as short-term/no AECG versus medium/long-term AECG. Medium/long-term AECG was found to be superior to short-term/no AECG (OR 4.54 [95% CI: 2.92, 7.06]). No heterogeneity was observed between the trial results (I2 = 0), despite combining diagnostic yields for medium-term and long-term devices. This finding should be considered in light of the differences in populations, study designs and duration of monitoring. An indirect comparison of ELR versus ILR in these RCTs was not presented.
For the purposes of the current Review, the evidence presented in Afzal (2015) shows a statistically significant difference in the diagnostic yield of medium-term and long-term AECG in cryptogenic stroke populations, favouring long-term monitoring. A statistically significant difference was also found for the likelihood of AF diagnosis by medium- or long-term AECG compared to conventional follow up, which usually included short-term monitoring. These results should be interpreted in light of the limitations of statistical comparison of non-randomised groups.
Table 7.3.123 Findings of the SR by Afzal (2015) for the detection of post-cryptogenic stroke AF
Clinical Question Analysis Diagnostic yield[95% CI]
Conclusions
Question 1:AECG vs no further AECGMedium-term AECGELR/MCT/96h Holter vs no further AECG
Pooled diagnostic yield from all cohorts
13.6% [7.91, 19.32] General trend: ILR detects more AF than medium-term AECG
Long-term AECGILR vs no further AECG
Pooled diagnostic yield from all cohorts
23.3% [13.83, 32.29]
Question 2:Duration vs durationShort-term/no AECG vs medium/long-term AECGHolter (most/all pts) vs ELR/ILR
Pooled odds ratio of receiving diagnosis (detecting AF) from 3 RCTs
OR 4.54 [2.92, 7.06]favouring ELR/ILR
Med/long-term AECG is superior to short-term/no AECG a
Medium-term vs long-term AECGELR/MCT/96h Holter vs ILR
Statistical comparison of pooled diagnostic yields from all cohorts
13.6% [7.91, 19.32]vs
23.3% [13.83, 32.29]
ILR is superior to medium-term AECG
73 Simple proportions of randomised group, as per other studies, calculated post hoc rather than the Kaplan-Meier estimates reported in the CRYSTAL AF publications.
MBS Review – Ambulatory Electrocardiography Review Report Page 229

May 2016
Clinical Question Analysis Diagnostic yield[95% CI]
Conclusions
p < 0.05Abbreviations: AECG, ambulatory electrocardiography; AF, atrial fibrillation; CI, confidence interval; ELR, event loop recorder; h, hour; ILR, implantable loop recorder; MCT, mobile cardiac telemetry; OR, odds ratio; pts (patients); SR, systematic review.a The comparator was 24-hour Holter monitoring in one RCT and routine follow up, in which Holter was used at the discretion of the investigator, in the other two RCTs.
Additional RCT evidenceAs described in Section 5.2.5, only RCTs not documented by the systematic reviews in the current Review will be discussed as individual Level II evidence. The EMBRACE and CRYSTAL AF RCTs, however, are reported in post hoc analyses not included in a systematic review. Therefore, these two RCTs, which are the largest RCTs of remote monitoring for AF, are discussed here in more detail than presented in the systematic reviews.
CRYSTAL AFThe CRYSTAL AF RCT found ILR was superior to conventional follow up in patients with cryptogenic stroke. However, conventional follow up in this trial involved AECG in only 8% of patients (and non-ambulatory ECG in 45%) during the first 12 months of the study. The authors of the current Review question the appropriateness of such a limited amount of AECG in the comparator arm, in light of the recommendations of clinical practice guidelines that AECG, or 24-hour ECG monitoring, or longer, should be performed in patients with suspected AF (HSFC, 2015; ESO, 2008). In light of this, the comparator arm of CRYSTAL AF cannot be regarded as equivalent to short-term AECG.
The post hoc analysis by Choe (2015) goes some way to addressing this issue, by modelling the AF that would have been detected had AECG been used in all patients in the comparator arm. Various Holter and ELR strategies were simulated based on data from the ILR arm of the study, assuming that monitoring with either Holter or ELR during the simulated periods would detect the same AF events that had been detected by ILR during those periods.
The authors found that long-term monitoring with ILR was superior in both sensitivity and NPV for the diagnosis of AF compared to all the simulated Holter/ELR monitoring strategies evaluated.
Table 7.3.124 Findings of the CRYSTAL AF RCT and associated studies
Clinical Question Evidence base and analysis
Results Conclusions
Question 1:AECG vs no further AECGDiagnostic yieldLong-term AECGILR vs no further AECG (in most patients) a
1 RCTILR: 221 CTRL: 220Statistical comparison of randomised groups
HR [95% CI]6 months 6.4 [1.9, 21.7]12 months 7.3 [2.6, 20.8]36 months 8.8 [3.5, 22.2]p <0.001 for all time points
ILR is superior to conventional follow up (including limited AECG).
Change in managementLong-term AECGILR vs no further AECG (in most patients) a
1 RCTILR: 221 CTRL: 220Statistical comparison of randomised groups
Difference [95% CI]6 months 5.5 [0.5, 10.6]12 months 8.8 [2.8, 14.8]24 months 20.5 [10.2, 30.9]36 months 30.1 [8.4, 51.8]p <0.001 for all time points
ILR is superior to conventional follow up (including limited AECG).
MBS Review – Ambulatory Electrocardiography Review Report Page 230

May 2016
Clinical Question Evidence base and analysis
Results Conclusions
Question 2:Duration vs durationDiagnostic yieldShort-term vs long-term AECGILR vs simulated Holter: 24h 24h, quarterly for 1 year 24h, monthly for 1 year 48h 48h, quarterly for 1 year
Post hoc analysis of 1 RCTStatistical comparison of RCT cohort and simulated cohort.
p <0.001 for all comparisons of sensitivity and NPV
ILR is superior to conventional follow up with short-term AECG.
Medium-term vs long-term AECGILR vs simulated Holter: 7 days 7 days, quarterly for 1 year
ILR vs simulated ELR b
21 days 30 days
Post hoc analysis of 1 RCTStatistical comparison of RCT cohort and simulated cohort.
p <0.001 for all comparisons of sensitivity and NPV
ILR is superior to conventional follow up with medium-term AECG.
Abbreviations: AECG, ambulatory electrocardiography; AF, atrial fibrillation; CI, confidence interval; ELR, event loop recorder; HR, hazard ratio; ILR, implantable loop recorder; NPV, negative predictive value; RCT, randomised controlled trial.a Holter monitoring in the conventional monitoring group was conducted in only 8% of patients by 6 months, and 12% by 12 months.b Choe (2015) specified ‘event recorder’ without reference to looping capacity. It is assumed an event recorder with automatic activation would be an appropriate equivalent to ILR, which implies an ELR.
For the purposes of the current Review, the evidence from the CRYSTAL AF RCT shows that for the detection of AF patients with cryptogenic stroke, ILR is superior to conventional follow up, where that follow up includes mostly non-ambulatory ECG, and AECG in a minority of patients. Evidence from post hoc modelling of data from the ILR arm of this study indicates ILR may be superior to short-term and medium-term monitoring strategies.
EMBRACEThe EMBRACE RCT found that ELR was superior to an additional 24 hours of Holter monitoring, both in detection of AF and subsequent change in patient management (Gladstone, 2014), as shown in Table 7.3.125. In this RCT, a minimum of 24 hours of AECG was used in all patients in the control arm, with some patients receiving additional AECG outside that specified in the protocol at the direction of their clinician, as might occur in conventional follow up. As this has the potential to increase the diagnostic yield of the control arm, this is a conservative departure from the indicated comparator. Therefore, this RCT can be considered as a comparison of short-term AECG with medium-term AECG.
Table 7.3.125 Findings of the EMBRACE RCT
Clinical Question Evidence base and analysis
Results Conclusions
Question 2:Diagnostic yieldShort-term vs medium-term AECGHolter vs ELR
1 RCTELR: 287 CTRL: 285Statistical comparison of randomised groups
Difference [95% CI]AF ≥30 s 12.9 [8.0, 17.6] p < 0.001AF ≥2.5 min 7.3 [2.6, 20.8] p < 0.001
ELR is superior to 24-hour Holter.
Change in managementShort-term vs medium-term AECGHolter vs ELR
1 RCTELR: 287 CTRL: 285Statistical comparison of
% started by 90 daysDifference [95% CI]
anticoagulants 7.5 [1.6, 13.3] p = 0.01
ELR is superior to 24-hour Holter.
MBS Review – Ambulatory Electrocardiography Review Report Page 231

May 2016
Clinical Question Evidence base and analysis
Results Conclusions
randomised groups antiplatelets -8.6 [-14.6, -2.5] p = 0.006Abbreviations: AECG, ambulatory electrocardiography; AF, atrial fibrillation; CI, confidence interval; CTRL, control; ELR, event loop recorder; RCT, randomised controlled trial.
For the purposes of the current Review, the evidence from the EMBRACE RCT shows that for the detection of AF patients with cryptogenic stroke, ELR is superior to conventional follow up, where that follow up includes an additional 24 hours of Holter monitoring beyond that used in the screening process. ELR is also superior to conventional follow up in change in patient management.
AECG for post-stroke AF – conclusionsIn summary, the findings of the key systematic reviews and RCTs for detecting AF after stroke or cryptogenic stroke are summarised, by clinical question, in Table 7.3.126. The majority of patients in studies of ELR, MCT or ILR had cryptogenic stroke.
Based on RCT evidence in cryptogenic stroke, ELR is superior to Holter monitoring (EMBRACE), and ILR is superior to no further monitoring (conventional follow up, consisting of Holter in 12% of patients over 12 months; CRYSTAL AF).
Diagnostic yield of ILR from pooled estimates and RCT cohorts are in agreement, typically 13-16%, with the exception of the pooled estimate of 23.3% from Afzal (2015). The only evidence that ILR may be superior to medium-term AECG is from a statistical comparison of this pooled estimate of 23.3% with that for ELR/MCT/96-hour Holter (Afzal, 2015), and from simulated cohorts based on a post hoc analysis of CRYSTAL AF. The only evidence that ILR may be superior to short-term AECG is from the same post hoc, simulated cohorts.
Overall, the evidence suggests that for patients with cryptogenic stroke, long-term AECG is superior to no further AECG, and medium-term AECG is superior to short-term AECG.
MBS Review – Ambulatory Electrocardiography Review Report Page 232
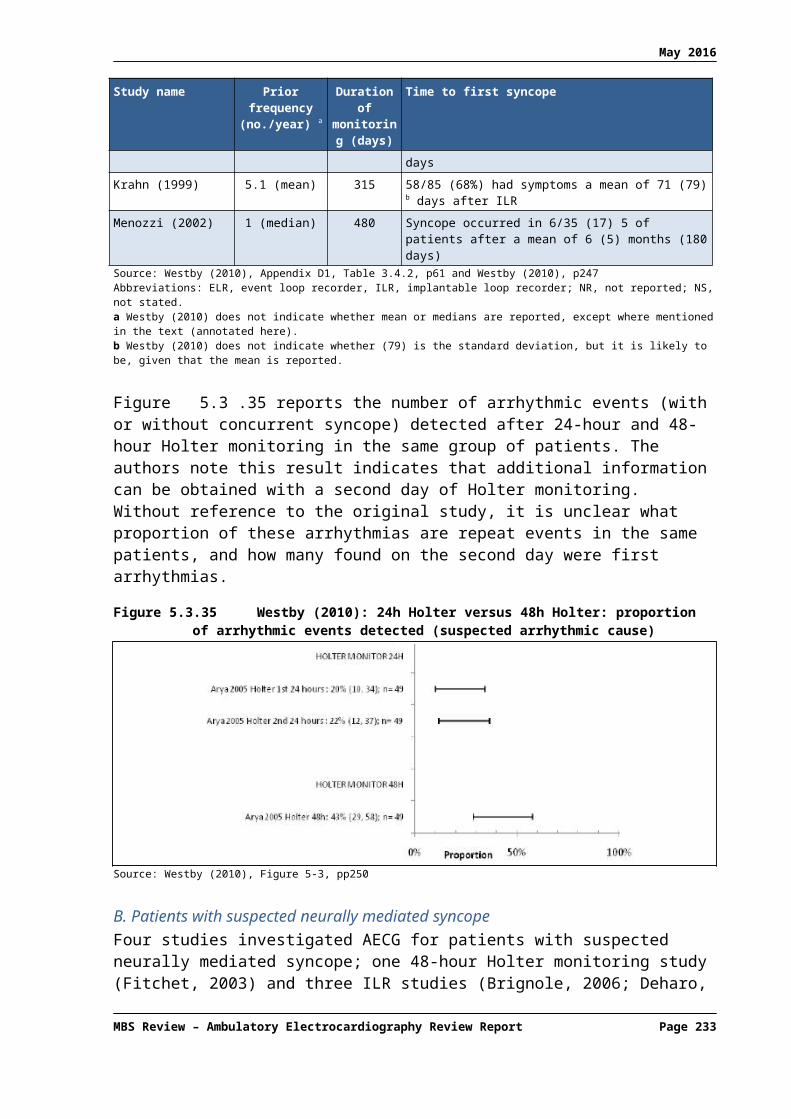
May 2016
Table 7.3.126 Conclusions from evidence for AECG for the detection of AF after strokeClinical questionComparison
Sposato (2015)IS/TIA a
Afzal (2015)Cryptogenic stroke
CRYSTAL AF RCTCryptogenic stroke
EMBRACE RCTCryptogenic stroke
Concordance/conclusion
Q1. AECG vs no further AECG
Short-term AECG vs no further AECG
AF % [95% CI] pooled
10.7 [5.6, 17.2]
N/A N/A AF (≥30 s) %
Holter, 24h: 3.2%
A range of diagnostic yields are reported for a range of Holter monitoring strategies, which, in light of the variation in populations, prior monitoring and study designs, may not be inconsistent.
Medium-term AECG vs no further AECG
AF % [95% CI] pooled
MCT b 15.3 [5.3, 29.3]ELR c 16.2 [9.3, 24.6]
AF % [95% CI] pooled
ELR/MCT/96h13.6 [7.91, 19.32]
N/A AF (≥30 s) %
ELR: 16.1%
Similar diagnostic yields are reported for medium-term AECG. The diagnostic yield of medium-term AECG may be similar in cryptogenic stroke and populations enriched for cryptogenic stroke (65-70% selected), based on 1 RCT and pooled estimates across all study designs.
Long-term AECG vs no further AECG
AF % [95% CI]: pooled
ILR d 16.9 [10.3, 24.9]
Monitoring duration ranged from 180 days to 870 days
AF % [95% CI] pooled
ILR 23.3 [13.83, 32.29]
Monitoring duration ranged from 229 days to > 30 months
ILR vs conventional follow up
AF % for ILR group e
6 months 8.612 months 13.136 months 19.0
AF detected HR [95% CI]6 mth 6.4 [1.9, 21.7]12 mth 7.3 [2.6, 20.8]36 mth 8.8 [3.5, 22.2]p < 0.001 for each, favouring ILR
Difference Tx % [95% CI]
12 mth 8.8 [2.8, 14.8]p < 0.001 for all time points, favouring ILR
N/A Based on 1 RCT, ILR is superior to conventional follow up (where Holter is used in 12% of patients by 12 months, and most patients receive no ECG), for the detection of AF in patients with cryptogenic stroke.
A range of diagnostic yields are reported for ILR, which, in light of the heterogeneity in population and study design, may not be inconsistent.Diagnostic yield with ILR may be higher for cryptogenic stroke than unselected IS/TIA, based on pooled estimates across all study designs, but the pooled estimate for cryptogenic stroke is not in agreement with that from 1 RCT.
Q2. Duration vs duration
Short-term vs medium-term AECG
N/A N/A N/A Difference in AF (≥30 s) % [95% CI]ELR vs Holter, 24h12.9 [8.0, 17.6] p<0.001
Difference Tx % [95% CI]ELR vs Holter, 24hAnticoagulants started7.5 [1.6, 13.3] p = 0.01Antiplatelets started-8.6 [-14.6, -2.5] p = 0.006
ELR is superior to 24-hour Holter monitoring for both detection of AF and change in patient management, based on 1 RCT of patients with cryptogenic stroke.
Q2. Duration vs duration
MBS Review – Ambulatory Electrocardiography Review Report Page 233

May 2016
Clinical questionComparison
Sposato (2015)IS/TIA a
Afzal (2015)Cryptogenic stroke
CRYSTAL AF RCTCryptogenic stroke
EMBRACE RCTCryptogenic stroke
Concordance/conclusion
Short-term/no AECG vs medium/long-term AECG
N/A AF detected: OR [95% CI]
ILR/ELR/MCT vs Holter/no AECG4.54 [2.92, 7.06]
favouring ILR/ELR/MCT
N/A N/A ILR/ELR/MCT is superior to limited Holter monitoring f for the detection of AF in patients with cryptogenic stroke, based on a meta-analysis of three RCTs.
Short-term vs long-term AECG
N/A N/A Sensitivity & NPV
ILR (reference test) vs various simulated short-term monitoring periodsp<0.001 for all comparisons.
N/A ILR is superior to Holter for the detection of AF after cryptogenic stroke, based on simulated short-term monitoring.
Medium-term vs long-term AECG
AF % [95% CI]
MCT vs ILR g
15.3 [5.3, 29.3] vs16.9 [10.3, 24.9]p >0.05
ELR vs ILR h
16.2 [9.3, 24.6] vs16.9 [10.3, 24.9]p >0.05
AF % [95% CI]
ELR/MCT/96h Holter vs ILR
13.6% [7.91, 19.32] vs23.3% [13.83, 32.29]
p <0.05 favouring ILR
Sensitivity & NPV
ILR (reference test) vs various simulated medium-term monitoring periods
p<0.001 for all comparisons.
N/A Based on pooled estimates across all study designs, there is conflicting evidence on the relative effectiveness of ILR and medium-term AECG for the detection of AF.a
One study of simulated medium-term monitoring based on an RCT suggests ILR is superior to medium-term AECG for AF detection.
Abbreviations: AECG, ambulatory electrocardiography; AF, atrial fibrillation; APBs, atrial premature beats; CI, confidence interval; ECG electrocardiography; ELR, event loop recorder; h, hour; HR, hazard ratio; ILR, implantable loop recorder; IS, ischaemic stroke; MCT, mobile cardiac telemetry; mth, months; N/A, not applicable; NPV, negative predictive value; OR, odds ratio; RCT, randomised controlled trial; s, seconds; TIA, transient ischaemic attack; TX, treatment.a While the Sposato (2015) systematic review did not select for cryptogenic stroke patients, the majority of patients in the medium- and long-term AECG studies had cryptogenic stroke.b At least 70% of patients in the MCT group had cryptogenic stroke.c At least 65% of patients in the ELR group had cryptogenic stroke.d All patients in the ILR group had cryptogenic stroke.e Simple proportions of randomised groups, calculated post hoc (i.e. not the Kaplan-Meier proportions reported in the CRYSTAL AF publications.f The comparators were 24-hour Holter monitoring in one RCT, and Holter use at the discretion of the investigator in the other two RCTs.g All patients in the ILR group and at least 70% of patients in the MCT group had cryptogenic stroke.h All patients in the ILR group and at least 65% of patients in the ELR group had cryptogenic stroke.
MBS Review – Ambulatory Electrocardiography Review Report Page 234

May 2016
7.3.3 Detection of AF after ablation
The effectiveness of AF treatment with ablation can be assessed using AECG; the evidence identified for this use of AECG is one RCT of ILR compared to conventional monitoring which included ELR. Forty three patients were implanted with an ILR and all received both forms of follow up for the first six months, at which point patients were randomised to continue or to stop conventional monitoring for the following six months.
AF was detected in significantly more patients with ILR compared to conventional monitoring including ELR in the first six months, but no difference was found during the randomised period of the study (second six-month period). However, during the randomised period, fewer patients discontinued antiarrhythmic drugs in the conventional monitoring group than in the ILR group (p = 0.04 for the between-group difference over the entire study period).
AECG for post-ablation AF – conclusionsLonger-term AECG is more effective than medium-term AECG for the assessment of AF ablation and change in patient management.
7.3.4 Evaluation of syncope
Westby (2010) and NICE (2012) updateAn HTA supporting the NICE Clinical Guidance for TLoC (Westby, 2010) reviewed the clinical evidence for the evaluation of syncope.
The three included RCTs were presented as comparative studies74 and, where appropriate, pooled estimates were reported. The RCTs also contributed cohorts to the analysis of observational studies, which were grouped into four population subgroups:
Suspected arrhythmic cause Suspected neurally mediated syncope on the basis of the initial assessment Unexplained cause on the basis of the initial assessment Unexplained cause following secondary tests (e.g. TT test).
The majority of the 37 included studies, including all three RCTs, fell into the ‘unexplained after secondary tests’ subgroup.
A number of outcomes were reported, most associated with diagnostic yield. The two major diagnostic yield outcomes were the proportion of patients with arrhythmia during syncope, and syncope during monitoring (inverse of the reported ‘no syncope during monitoring’). Change in therapy was also reported.
The findings of Westby (2010) are summarised below, by population subgroup.
Suspected arrhythmic cause of syncopeThe authors noted that almost all studies included patients with a history of infrequent syncope, but concluded that there was sufficient clinical evidence to recommend AECG in this population. Summary statistics for the two major diagnostic yield outcomes (Table 7.3.127) indicate ILR and ELR capture more syncopal events and more symptomatic arrhythmias than Holter monitoring. Based on a single RCT cohort (Rothman, 2007), events 74 A fourth RCT, Rothman (2007), compared ELR with MCT, and so was out of scope for Westby (2010): only the ELR
cohort was extracted from this study. However, this RCT is also included in two other key studies in the current Review: AHRQ (2007) and Hoefman (2010).
MBS Review – Ambulatory Electrocardiography Review Report Page 235

May 2016
captured and symptomatic arrhythmias detected was greater for ELR than ILR. This is in contrast to the trends observed in other populations, where ILR yields are typically higher than ELR yields.
The evidence base for ELRs in Westby (2010) is limited to only five studies, but at 41%, Rothman (2007) reports the highest yield of symptomatic arrhythmias (the other four are studies in patients with unexplained syncope after secondary tests, with symptomatic arrhythmias detected in 8.5%; range 2% to 16%). According to the authors of the current Review, it is possible that this high yield in Rothman (2007) is related to study design or perhaps population (mixture of syncope and palpitations).
For the other diagnostic yield outcomes, the Westby (2010) authors noted that Holter may be more likely to detect arrhythmias not occurring during syncope, which may assist in diagnosis. They also stated that ELR and ILR devices may fail to keep a record of the ECG during syncope if they are not activated, or they are activated multiple times, overwriting information. They made the point that the three types of devices (Holter, ELR and ILR) therefore produce slightly different information. However, it was decided that the principle aim of AECG is to obtain an ECG during syncope, and that it was preferable to match the type of device with the frequency of previous episodes to increase the chances of capturing events during monitoring. More patients tended to change management after ILR than Holter.
Table 7.3.127 Findings of the Westby (2010) SR for suspected arrhythmic syncope for two main diagnostic yield outcomes and change in patient management
Comparison Evidence base Median (range)
Conclusions for suspected arrhythmic syncope
Question 1:Symptomatic arrhythmiaShort-term AECGHolter, 24h vs no further AECG
1 case series (N = 140) 6% General trend: ELR and ILR detect more symptomatic arrhythmias than Holter.
Short-term AECGHolter, 48h vs no further AECG
2 case series (N = 112), no heterogeneity
7% (6, 8)
Medium-term AECGELR vs no further ELR
1 RCT cohort (N = 51) 41%
Long-term AECGILR vs no further ILR
4 case series (N = 253), no heterogeneity
31% (25, 38)
Syncope during monitoringShort-term AECGHolter, 24h vs no further AECG
1 case series (N = 140) 16% General trend: more syncopal events occur during ELR or ILR than Holter monitoring.
Short-term AECGHolter, 48h vs no further AECG
2 case series (N = 112), no heterogeneity
10% (8, 13)
Medium-term AECGELR vs no further ELR
1 RCT cohort (N = 51) 69%
Long-term AECGILR vs no further ILR
4 case series (N = 253), with heterogeneity
50% (40, 68)
Patients started on therapyShort-term AECGHolter, 48h vs no further AECG
1 case series (N = 63) 13% General trend: more patients change management after ILR than Holter.
Long-term AECG 3 case series (N = 168) 26% (22, 44)
MBS Review – Ambulatory Electrocardiography Review Report Page 236

May 2016
Comparison Evidence base Median (range)
Conclusions for suspected arrhythmic syncope
ILR vs no further ILRAbbreviations: AECG, ambulatory electrocardiography; ELR, event loop recorder, h, hours; ILR, implantable loop recorder; RR, risk ratio; SR systematic review.Note: presence of heterogeneity determined by Westby (2010) from visual assessment of forest plots.
Suspected neurally mediated syncopeSummary statistics for the two major diagnostic yield outcomes (Table 7.3.128) indicate that ILR captures more syncopal events and more symptomatic arrhythmias than Holter monitoring, and that more patients tended to change management after ILR than Holter. However, AECG was not recommended for this population by the guideline working group, for the reasons outlined below.
The authors considered whether diagnostic tests (TT tests, AECG) should be carried out in people with neurally mediated syncope with a greater clinical need, notably those with a high symptom burden who had poor quality of life and/or were at high risk of injury, and for whom pacing could be considered as an option. The authors noted that 48-hour Holter monitoring in the Fitchet (2003) study did not detect any relevant arrhythmias (symptomatic asystole or bradycardia). The remaining studies in this population were of ILR. The majority of comments regarding ILR in this population relate to the comparative evidence with respect to TT testing, so is out of scope of the current Review.
However, the following observation was made regarding ILR in this population. In the Brignole (2006) study, 26% of patients with a syncope event during monitoring did not capture the ECG with ILR, preventing an estimate of accuracy in those patients without a recording of the event. The authors also commented that in view of the high specificity and relatively low sensitivity of the TT test compared to ILR (not reported here), the guideline development groups considered that the TT test might be used first, followed by an ELR in those with a negative result, in order to guide pacing. However, in light of a cost-effectiveness analysis performed by the same authors, AECG was not recommended for this population.
Table 7.3.128 Findings of the Westby (2010) SR for suspected neurally mediated syncope
Comparison Evidence base Median (range)
Conclusions for suspected NM syncope
Question 1:AECG vs no further AECGSymptomatic arrhythmiaShort-term AECGHolter vs no further AECG
1 case series (N = 118) 8% General trend: ILR detect more symptomatic arrhythmias than Holter.
Long-term AECGILR vs no further ILR
3 case series (N = 446) 21% (18, 28)
Syncope during monitoringShort-term AECGHolter vs no further AECG
1 case series (N = 118) 20% General trend: more syncopal events occur during monitoring with ILR than with Holter.
Long-term AECGILR vs no further ILR
3 case series (N = 446) 36% (34, 48)
Patients started on therapyShort-term AECGHolter vs no further AECG
1 case series (N = 118) 3% General trend: more patients change management after ILR than Holter.
Long-term AECGILR vs no further ILR
3 case series (N = 446) 14% (14, 28)
MBS Review – Ambulatory Electrocardiography Review Report Page 237
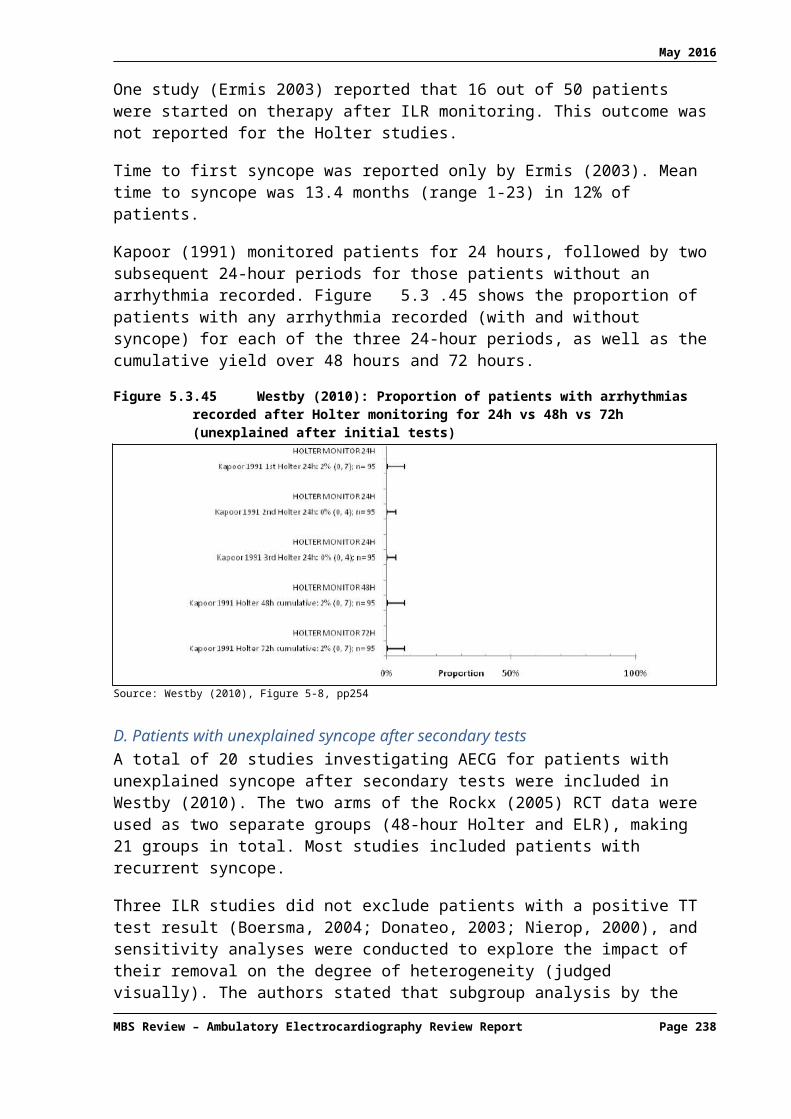
May 2016
Abbreviations: AECG, ambulatory electrocardiography; ILR, implantable loop recorder; NM, neurally mediated; SR systematic review.Note: Westby (2010) did not comment on the degree of visual heterogeneity for these studies.
Unexplained syncope after initial testsSummary statistics for the two major diagnostic yield outcomes and change in patient therapy are shown in Table 7.3.129 for the three studies in patients with unexplained syncope after initial tests. For detection of symptomatic arrhythmia, the same trend is observed as in the other population subgroups.
No conclusions are presented by the authors of Westby (2010) regarding this population. While they were interested in determining which tests should be performed on patients with unexplained syncope after initial tests, there was limited evidence for this population, with the bulk of evidence in patients with unexplained syncope after secondary tests. The authors used the evidence for the latter population as indirect evidence for the former.
Table 7.3.129 Findings of the Westby (2010) SR for unexplained syncope after initial tests
Comparison Evidence base Median (range)
Conclusions for suspected arrhythmic syncope
Question 1:AECG vs no further AECGSymptomatic arrhythmiaShort-term AECGHolter, 24h vs no further AECG
2 case series (N = 382) 1% (1, 1) General trend: ILRs detect more symptomatic arrhythmias than Holter.
Short-term AECGHolter, 48h vs no further AECG
1 case series (N = 95) 1%
Long-term AECGILR vs no further ILR
1 case series (N = 50) 8%
Syncope during monitoringShort-term AECGHolter, 24h vs no further AECG
2 case series (N = 382)
8% (1, 15) General trend: no correlation between yield and duration of monitoring evident.
Short-term AECGHolter, 48h vs no further AECG
1 case series (N = 95) 21%
Long-term AECGILR vs no further ILR
1 case series (N = 50) 12%
Patients started on therapyLong-term AECGILR vs no further ILR
1 case series (N = 50) 32% –
Abbreviations: AECG, ambulatory electrocardiography; ILR, implantable loop recorder; SR systematic review.Note: Westby (2010) did not comment on the degree of visual heterogeneity for these studies.
Unexplained syncope after secondary testsThere is evidence from two RCTs supporting the superiority of ILR over shorter-term AECG in this population. The larger of these RCTs (Farwell, 2006; N = 201) compared ILR to conventional testing in which Holter or ELR was used in up to 38% of patients (i.e. limited shorter-term AECG). A HR for time to diagnosis of 6.5 [95% CI 3.73, 11.4] was found, significantly favouring ILR over conventional testing (with limited AECG). Recurrence of syncope was significantly reduced in the ILR group after treatment compared to the control group (p = 0.04). While a general well-being VAS was significantly higher at 18 months for patients in the ILR group (p = 0.03), no difference was found using the SF-12 questionnaire.
MBS Review – Ambulatory Electrocardiography Review Report Page 238

May 2016
The smaller RCT (Krahn, 2001a; N = 60), compared ILR with conventional testing that used ELR in all patients, along with other tests. A significantly higher diagnostic yield was found with ILR than with conventional testing (RR 2.33 [95% CI: 1.04, 5.25]), with only one of the six diagnoses made in the conventional testing group as result of ELR monitoring.
The Westby (2010) authors noted these two studies are of moderate quality, and that both were funded by Medtronic Inc. They stated that the finding by Farwell (2006) of a significantly longer time to second recurrence of syncope in the ILR group indicates treatment may delay or prevent the second recurrence if diagnosis is achieved at the first recurrence during monitoring.
There is evidence from one RCT supporting the superiority of ELR over 48-hour Holter in this population. During the first phase of the crossover study by Rockx (2005), significantly more syncope events were captured by ELR compared to 48-hour Holter (RR 2.69 [95% CI: 1.57, 4.61]). The authors of Westby (2010) commented that (Rockx, 2005) was not a particularly helpful study as the Holter device was not appropriate for this population (low prior frequency of syncope of only two per year).
Summary statistics for the two major diagnostic yield outcomes (Table 7.3.130) show the general trend across the evidence base of increasing yields with increasing duration of monitoring.
AECG was recommended in this population by the Guideline Development Group.
Table 7.3.130 Findings of the Westby (2010) SR for unexplained syncope after secondary tests for two main diagnostic yield outcomes and change in patient management
Comparison Evidence base Findings[95% CI]
Conclusions for unexplained syncope after secondary tests
Question 1:AECG vs no further AECGSymptomatic arrhythmiaShort-term AECGHolter, 48h vs no further AECG
1 RCT cohort (N = 51) 0% General trend: more symptomatic arrhythmias are detected by ILR than ELR, and both detect more than Holter.
Medium-term AECGELR vs no further ELR
1 RCT cohort, 3 case series (N = 192)
8.5% (2, 16)
Long-term AECGILR vs no further ILR
2 RCT cohorts, 12 case series (N = 1052)
28.5% (18, 47)
Syncope during monitoringShort-term AECGHolter, 48h vs no further AECG
1 RCT cohort (N = 51) 24% General trend: more syncopal events occur during ILR or ELR than Holter.
Medium-term AECGELR vs no further ELR
1 RCT cohort, 3 case series (N = 192)
44% (32, 78)
Long-term AECGILR vs no further ILR
2 RCT cohorts, 12 case series (N = 1052)
56% (34, 87)
Patients started on therapyShort-term AECGHolter, 24h vs no further AECG
1 case series (N = 148) 43% General trend: no correlation between yield and duration of monitoring evident.
Medium-term AECGELR vs no further ELR
1 case series (N = 57) 18%
Long-term AECG 1 RCT cohort, 12 case 28% (12, 49)
MBS Review – Ambulatory Electrocardiography Review Report Page 239

May 2016
Comparison Evidence base Findings[95% CI]
Conclusions for unexplained syncope after secondary tests
ILR vs no further ILR series (N = 1022)
Question 2:Duration vs durationSyncope during monitoringShort-term vs medium-term AECGHolter (48h) vs ELR (PT) a
1 RCTHolter: N = 51ELR: N = 49
Holter: 12 pts (24%)ELR: 31 pts (63%)RR 2.69 [1.57, 4.61]
ELR is superior to 48-h Holter for capturing syncope during monitoring in patients with unexplained syncope b
Short or medium-term/no AECG vs long-term AECGILR vs conventional follow up (including limited Holter/ELR) c
1 RCTILR: N = 103Conventional: N = 98
ILR: 43 pts (42%)Conventional: 7 pts (7.1%)HR 6.53 [3.73, 11.4] p <0.001
ILR is superior to conventional testing, including short- or medium-term AECG in some patients, for diagnosing patients with unexplained syncope.
Symptomatic arrhythmiaMedium-term AECG + other tests vs long-term AECGELR (all pts) + other tests vs ILR
1 RCT d
ELR + other tests: n = 30ILR: n = 30
ELR + other tests: 6/30 (20%) e
ILR: 14/30 (47%)RR 2.33 [1.04, 5.25]
ILR is superior to ELR plus other tests (and therefore ELR alone) for diagnosing patients with unexplained syncope.
Abbreviations: AECG, ambulatory electrocardiography; CI, confidence interval; ELR, event loop recorder, HR, hazard ratio; ILR, implantable loop recorder; pt, patients; PT, patient triggered; pts, patients; RCT, randomised controlled trial; RR, risk ratio.a Rockx (2005) reported approximately 33% of patients in the Holter group and 50% of patients in the ELR (PT) group received Holter monitoring prior to study entry.b The populations in this study may have been biased, as after a subsequent crossover phase, symptom-rhythm correlation was achieved in 100% of patients randomised to ELR but only 61% of patients randomised to Holter.c In Farwell (2006), a total of 11 Holter tests and 28 ELR tests were conducted in an unreported number of patients in the conventional follow-up arm (i.e. up to 38% of patients).d Krahn (2001a) results shown for first phase of study, prior to crossover.e One patient was diagnosed in the ELR plus other tests group using ELR.
24-hour vs 48-hour vs 72-hour HolterTwo studies provide low-quality evidence that an additional 24 hours of Holter monitoring can result in a significantly higher diagnostic yield than one 24-hour monitoring period in patients with suspected arrhythmic syncope or unexplained syncope after initial tests. In the latter population, monitoring extended a further 24 hours (i.e. 72-hour monitoring) did not result in further significant improvement in diagnostic yield.
Patient-triggered vs patient-triggered/auto-triggered devicesThere is low-quality evidence from two studies regarding the benefit of adding an automatic activation option to ILR devices, which appear to enhance the diagnostic yield. However, subgroup analyses that grouped studies according to whether the device was patient triggered or automatic/patient triggered did not reveal any between-group differences in the detection of arrhythmia during syncope, nor arrhythmia without syncope (although it appears to the authors of the current Review that only the population of unexplained syncope after secondary tests included sufficient studies in both subgroups to allow a comparison of device activation types for these outcomes).
NICE (2012) updateThe NICE (2012) update of the Westby (2010) systematic review identified a large observational study that while not providing comparative evidence, was consistent with the NICE CG109 recommendations. The authors also discussed a study of ILR using remote monitoring technology, which concluded that although feasible, this approach generates an excessive burden of ECG recordings. Evidence from these studies did not result in any
MBS Review – Ambulatory Electrocardiography Review Report Page 240

May 2016
changes to the guideline, but the authors stated that the telemetry study shows there is a possible option for remote ECG monitoring using ILRs.
General trends across population groupsThe Westby (2010) authors concluded that for each syncope population subgroup, there is a general increase in the proportion of people with syncope during monitoring in the order 24-hour Holter, 48-hour Holter, ELR and ILR. The same trend was observed for arrhythmia detected during syncope in the populations of suspected arrhythmia and unexplained syncope after secondary tests. The outcomes ‘no arrhythmia during syncope’ and ‘no syncope during arrhythmia’, however, appear to be independent on the type of AECG device used.
The authors found that in the ILR studies across the combined groups of suspected arrhythmic cause and unexplained cause, there appears to be a correlation between ‘syncope detected during monitoring’ and the mean frequency of previous syncope. They also concluded that a higher proportion of people started on AECG-directed therapy after ILR.
Overall, the authors concluded that the evidence supports the hypothesis that the type of device should be tailored to the frequency of previous syncope and that it was inappropriate to compare, head-to-head, the different AECG devices. They also commented that many of the ELR and ILR studies recruited patients with a negative Holter test, which would under-estimate the diagnostic yield of these devices in the absence of Holter monitoring.
Additional RCT evidenceThree RCTs of AECG were published after the key systematic review for syncope (Westby, 2010); a UK trial of an ILR with automatic upload upon patient trigger (EaSyAS II; Sulke, 2015), and two French trials of various Reveal ILRs (FRESH; Podoleanu, 2014 and Da Costa, 2013). The patient populations were unexplained syncope in EaSyAS II, and unexplained syncope after secondary tests in the other two studies. Only the study by Da Costa (2013) compared ILR to a specified amount of AECG: repetitive 7-day Holter monitoring. While Holter monitoring was listed as a possible conventional test in the other two studies, the number of patients who received Holter monitoring was not reported.
The findings for diagnostic yield (Table 7.3.131) are consistent with those reported by Westby (2010) for patients with unexplained syncope. Diagnostic yields with ILR were of a similar magnitude (37% to 46% in these studies, 42% to 47% in Westby, 2010; Table 7.3.130), and ILR was found to be superior to either no or limited Holter monitoring or medium-term AECG (extended Holter monitoring).
Table 7.3.131 Findings of additional AECG RCTs for syncope
Comparison Evidence base Findings[95% CI]
Conclusions for unexplained syncope
Question 2:Duration vs durationDiagnostic yieldLong-term AECG vs conventional testsILR vs conventional follow up (amount of Holter use NR)
1 RCT (EaSyAS II) a
ILR: N = 66Conventional: N = 61
ILR: 29/66 (44%)Conventional: 1/61 (1.6%) b
p = NR
ILR is superior to conventional testing, including an unreported amount of Holter monitoring, for diagnosing patients with unexplained syncope.
Long-term AECG vs conventional testsILR vs conventional follow up (amount of Holter use NR)
1 RCT (FRESH)ILR: N = 39Conventional: N = 39
ILR: 18/39 (46%)Conventional: 2/39 (5.1%) c
ILR is superior to conventional testing, including an unreported amount of Holter monitoring, for diagnosing patients with unexplained syncope.
MBS Review – Ambulatory Electrocardiography Review Report Page 241

May 2016
Comparison Evidence base Findings[95% CI]
Conclusions for unexplained syncope
p <0.001
Question 2:Duration vs durationSignificant arrhythmiasMedium-term + other tests vs long-term AECG7-day Holter every 3 months (plus conventional tests) vs ILR
1 RCTExtended Holter: N = 37ILR: N = 41
Extended Holter: 4/37 (11%)ILR: 15/41 (37%)p = 0.02
ILR is superior to extended Holter for capturing significant arrhythmias during monitoring in patients with unexplained syncope c
Abbreviations: AECG, ambulatory electrocardiography; CI, confidence interval; ELR, event loop recorder, HR, hazard ratio; ILR, implantable loop recorder; incl., including; NR, not reported; RCT, randomised controlled trial; RR, risk ratio.a This RCT included another two randomised groups not shown here: syncope clinic and syncope clinic plus ILR.b The single diagnosis in the conventional follow-up group was made using 24-h Holter monitoring.c Mode of diagnosis in the conventional follow-up group was not reported.
AECG for syncope – conclusionsIn summary, the findings of the key systematic reviews and RCTs for diagnosing the cause of syncope are summarised in Table 7.3.132. The majority of studies were in patients with unexplained syncope after secondary tests, with a large number in patients with a suspected arrhythmic syncope.
ILR was found to be superior to conventional follow up including limited shorter-term AECG in three RCTs. In two of these studies, the amount of Holter monitoring was not reported, and in the other, ELR or Holter were used in no more than 38% of patients, preventing direct comparison of monitoring durations.
Based on RCT evidence, ELR appears to be superior to 48-h Holter and ILR is superior to ELR plus other tests. However, it should be noted that the ELR diagnostic yields vary in these RCTs: 63% in the former, but only 20%75 in the latter (including those patients diagnosed with other tests). This suggests very different study protocols were used or different patient populations were included. In fact, the ‘ELR plus other tests’ cohort was not included in the summary statistics for ELR by Westby (2010), possibly due to the potential confounding of the other tests. No other direct comparisons of ELR and ILR were identified.
Across study designs, ELR and ILR have a similar range of diagnostic yields in the unexplained syncope population (32% to 78% for ELR, 34% to 87% for ILR), and values for the other populations fall within these ranges. The range for Holter monitoring falls below these (8-24% across all populations).
Overall, it can be concluded that both medium-term AECG and long-term AECG have higher diagnostic yields than short-term AECG, but the evidence is insufficient regarding the relative yields for medium-term and long-term AECG for patients with syncope.
75 Of the six patients diagnosed in the ELR plus other tests group, only one was diagnosed using ELR. If all six patients had been diagnosed with ELR, ILR would remain superior to ELR in this study.
MBS Review – Ambulatory Electrocardiography Review Report Page 242

May 2016
Table 7.3.132 Conclusions from evidence for AECG for the evaluation of syncopeClinical question Suspected arrhythmic cause Suspected neurally mediated syncope Unexplained syncope a Conclusions
Question 1:AECG vs no further AECG
Short-term AECG vs no further AECG
Diagnostic yield % (syncope + ECG)24h Holter: 16% (1 case series)48h Holter: 8% to 13% (2 case series)
Change in management48h Holter: 13% (1 case series)
Diagnostic yield % (syncope + ECG)48h Holter: 20% (1 case series)
Change in managementHolter: 3% (1 case series)
Diagnostic yield % (syncope + ECG)48h Holter: 24% (1 RCT)
Change in management24h Holter: 43% (1 case series)
Diagnostic yields ranging from 8% to 24% are reported for various Holter monitoring strategies. In light of the variation in syncope populations, this may not be inconsistent.
Change in management varied greatly between two populations, but the evidence base is limited to two case series.
Medium-term AECG vs no further AECG
Diagnostic yield % (syncope + ECG)ELR: 69% (1 RCT)
No evidence identified Diagnostic yield % (syncope + ECG)ELR: 32% to 78% (1 RCT, 3 case series, median 44%)
Change in managementELR: 18% (1 case series)
A wide range of values for diagnostic yields with ELR are reported, from 32% to 78%, with the lowest and highest yield in the same patient population group (unexplained syncope).
These 5 studies represent the entire evidence base for ELR in syncope (the RCTs are discussed further in Question 2).
Long-term AECG vs no further AECG
Diagnostic yield % (syncope + ECG)ILR: 40% to 68% (4 case series, median 50%)
Change in managementILR: 22% to 44%
Diagnostic yield % (syncope + ECG)ILR: 34% to 48% (3 case series, median 36%)
Change in managementIRL: 14% to 28% (3 case series, median 14%)
Diagnostic yield % (syncope + ECG)ILR: 34% to 87% (2 RCTs, 12 case series, median 56%)
ILR: 30-32% (Patient registry N = 570) b
Change in managementILR: 12% to 49% (1 RCT, 12 case series, median 28%)
For ILR, diagnostic yields range from 34% to 87%, and change in management from 12% to 49%. For both outcomes, the lowest and highest values are found in the same patient population group (unexplained syncope). This population group includes the greatest number of studies.
Question 2:Duration vs duration
Short-term vs medium-term AECG
No evidence identified No evidence identified Diagnostic yield % (syncope + ECG)
48h Holter ELR24% (12/51) 63% (31/49)
RR 2.69 [1.57, 4.61]
Based on one RCT, ELR is superior to 48h Holter in the unexplained syncope population.
Short-term/no AECG vs long-term AECG
No evidence identified No evidence identified Diagnostic yield % (diagnoses made)
1 RCT:Conventional ILR(AECG NR)1.6% (1/61) c 44% (29/66)
1 RCT:Conventional ILR(AECG NR)5.1% (2/39) 46% (18/39)p <0.001
Based on two RCTs, ILR is superior to limited short-term AECG for diagnosing the cause of syncope in the unexplained syncope population.
MBS Review – Ambulatory Electrocardiography Review Report Page 243
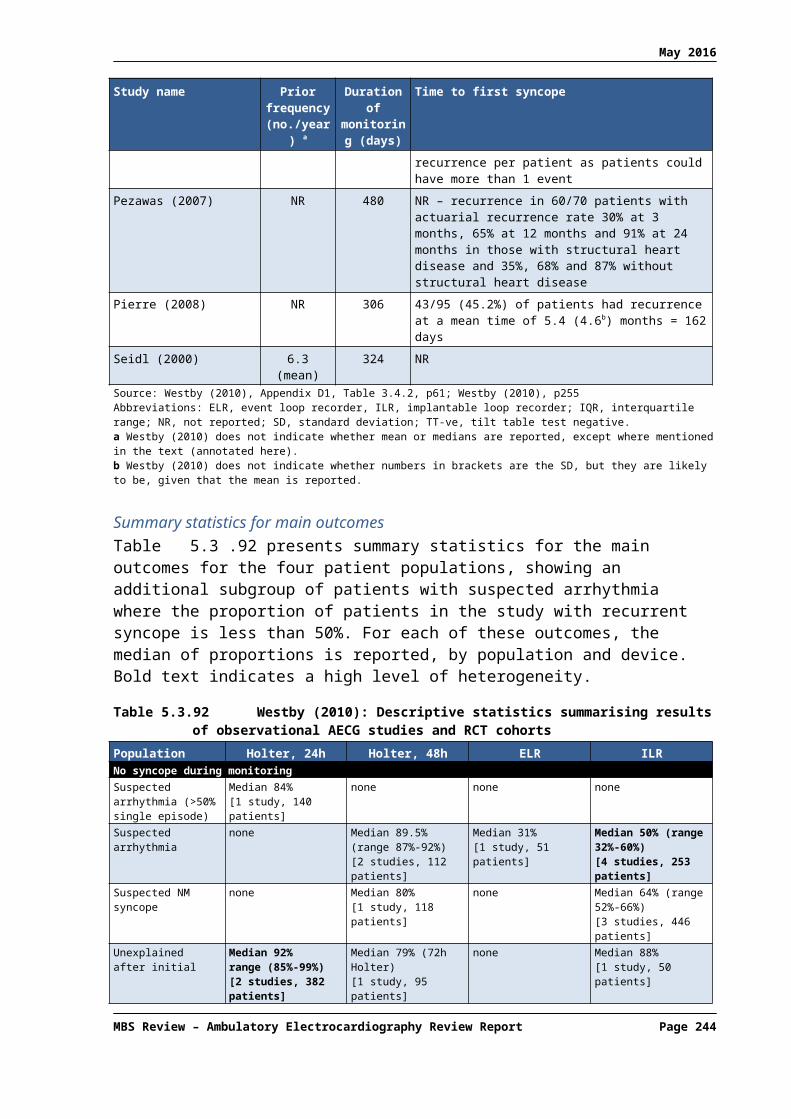
May 2016
Clinical question Suspected arrhythmic cause Suspected neurally mediated syncope Unexplained syncope a Conclusions
Question 2:Duration vs duration
Short-term, medium-term or no AECG vs long-term AECG
No evidence identified No evidence identified Diagnostic yield % (syncope + ECG)
Limited Holter/ELR d ILR7.1% (7/98) 42%(43/103)HR 6.53 [3.73, 11.4]
Based on one RCT, ILR is superior to conventional testing, including short- or medium-term AECG in some patients, in the unexplained syncope population.
Medium-term AECG (+ other tests) vs long-term AECG
No evidence identified No evidence identified Diagnostic yield % (syncope+arrhythmia)
1 RCT:ELR (+ other tests) ILR
20% (6/30) e 47% (14/30)RR 2.33 [1.04, 5.25]
Significant arrhythmias %
1 RCT:Repeated 7-day Holter f ILR
11% (4/37) 37% (15/41)p = 0.02
Based on one small RCT, ILR is superior to ELR plus other tests (and therefore ELR alone) for diagnosing patients with unexplained syncope.
Based on one small RCT, ILR is superior to repeated 7-day Holter monitoring for finding significant arrhythmias in the unexplained syncope population.
Question 3:Patient triggered vs patient/auto triggered
Long-term, patient-triggered AECG vs long-term, auto/patient-triggered AECG
No evidence identified No evidence identified Diagnostic yield % (syncope+arrhythmia)Patient-triggered ILRs (7 studies) vs auto/patient-triggered ILRs (7 studies): no difference observed on visual inspection of plots.
Based on limited evidence, there may be no difference in the ILR capture of arrhythmia-syncope correlations between devices with or without an auto-trigger capacity.
Abbreviations: AECG, ambulatory electrocardiography; CI, confidence interval; ECG, electrocardiogram; ELR, event loop recorder, HR, hazard ratio; ILR, implantable loop recorder; incl., including; NR, not reported; RCT, randomised controlled trial; RR, risk ratio.a For simplicity, results from the three studies of unexplained syncope after initial tests from Westby (2010) are not shown in this table.b Edvardsson (2011) identified in NICE (2012) update of Westby (2010).c The single diagnosis made in the conventional assessment arm of the EaSyAS II trial was made using a 24-hour Holter.d In Farwell (2006), a total of 11 Holter tests and 28 ELR tests were conducted in an unreported number of patients in the conventional follow-up arm (i.e. up to 38% of patients).e Only one of the six diagnoses in the ELR (+ other tests) group was made using ELR (Krahn, 2001a).f In the Da Costa (2013) study, 7-day Holter monitoring was repeated every 3 months for 3 years, and this group also received other conventional testing.Note Syncope + ECG refers to the outcome of ‘syncope during monitoring’ (i.e. inverse of the ‘no syncope during ECG’ outcome reported by Westby, 2010).
MBS Review – Ambulatory Electrocardiography Review Report Page 244

May 2016
7.3.5 Evaluation of syncope patients for pacing therapy
AECG for directing pacing – conclusionsThe Westby (2010) review found one case series study (Brignole, 2006) in patients with suspected neurally mediated syncope on initial assessment that found ILR-directed pacing resulted in longer times to second syncope and a lower overall burden of syncope compared with non-specific therapy. Statistical analyses were performed on differences between these groups and found to be significant. However, allocation to these groups was by investigator selection (not randomised), and the criteria for group allocation were not described. Therefore, the authors of the current Review suggest such analyses must be interpreted with caution. Nonetheless, between-group differences were large.
7.3.6 Evaluation of palpitations
One systematic review (Hoefman, 2010) assessed the clinical evidence for AECG in the evaluation of palpitations. While only five of the 28 identified studies are RCTs, 11 were comparative (non-randomised or two tests in the same patient population). The authors noted the 12 non-comparative studies were not very informative due to heterogeneity in design, populations and device types. The findings of the comparative studies only are shown in Table 7.3.133. While the majority of studies included patients with palpitations, some also included patients with other symptoms such as syncope, presyncope or dizziness, so populations are indicated in this summary table.
One study found ELR to be superior to usual care (testing not described), and another found more patients were diagnosed with ER than with ECG (i.e. no ambulatory ECG). No evidence was identified comparing short-term or long-term AECG with usual care or no AECG.
Two RCTs and three non-randomised comparative studies compared short-term AECG with medium-term AECG: ER versus Holter. While a range of diagnostic yields were reported, yields were consistently greater using ER than Holter within each study. The difference between Holter and ER was statistically significant in the Australian RCT (Kinlay, 1996) but not in the other RCT (Scalvini, 2005), which compared ER to 7-day Holter monitoring. This evidence suggests ER is superior to Holter monitoring in this population.
One RCT compared medium-term AECG and long-term AECG, and found ILR is superior to ER. No other studies compared devices from different monitoring periods.
A number of studies provided data that allowed a comparison of different types of activation: patient-triggered versus auto-triggered devices. Only one of these was an RCT (Rothman, 2007) in which a subgroup analysis allowed a comparison of MCT and ELR, both auto activated. The ELR (auto triggered) yield in this subgroup analysis was substantially lower than observed across the entire study (mostly patient-triggered devices; 46% versus 75%, respectively).
However, it is not clear whether the auto-triggered devices could also be patient activated in this study. Furthermore, these results are in contrast to the findings of four other studies that consistently found higher yields from devices that included an auto-trigger feature compared to those without (median 67% versus 32%, respectively). This evidence suggests the addition of auto-trigger features tends to increase diagnostic yield of ELRs.
MBS Review – Ambulatory Electrocardiography Review Report Page 245

May 2016
An increase in total diagnoses was also found in a study of MCT, where additional diagnoses were made in asymptomatic patients using the auto-trigger feature (6% in patients without a prior diagnosis of arrhythmia, and 26% of patients with a prior diagnosis of arrhythmia).
In contrast to the evidence supporting the use of auto activation in medium-term AECG, one small study found the auto-activation feature of an ILR device, despite activating a large number of recordings, did not produce any additional diagnoses (clinically relevant arrhythmias).
AECG for palpitations – conclusionsIn summary, the evidence supports the conclusion that medium-term AECG is superior to short-term AECG, and long-term AECG is superior to medium-term AECG in the diagnosis of patients with palpitations, and that the addition of an auto-trigger feature to medium-term devices increases the diagnostic yield when used in addition to a patient-trigger feature.
Table 7.3.133 Conclusions from evidence for AECG for the evaluation of palpitations: diagnostic yieldClinical question Evidence base
PopulationFindings Conclusions
Question 1:AECG vs no further AECG
Medium-term AECG
1 study (N = 244)
Palpitations or dizziness
ELR usual care (not described)67% 27% p <0.05
Based on 1 study, more diagnoses are made using ELR compared to usual care.
1 study (N = 91)
Palpitations, (pre)syncope, dizziness
ER ECG (non-ambulatory)
37% 10%
Based on 1 study, more diagnoses are made using ER than non-ambulatory ECG.
Question 2:Duration vs duration
Short-term vs medium-term AECG
2 RCTs, 3 studies (N = 603)
Palpitations
Median (range)Holter ER31% (12, 48)76 62% (48, 67)
Based on two RCTs and 3 studies, more diagnoses are made using ER than Holter in patients with palpitations.
Medium-term vs long-term AECG
1 RCT (N = 50)
Palpitations
ER ILR21% 73% p<0.05
Based on 1 RCT, ILR is superior to ER in patients with palpitations.
Question 3:Patient vs patient/auto triggered
Medium-term AECG: PT vs AT/PT
1 registry (N = 1200) and 3 studies (N = 262)
Palpitations, syncope, (plus dizziness in two studies). Registry population NR.
Median (range)ELR (PT) ELR (PT/AT)32% (22, 67) 67% (39, 80)
Based on 4 comparative studies, auto-triggered ELRs yield more diagnoses than patient-triggered devices.
1 RCT (N = 266) 77
Palpitations or (pre-)syncope
MCT (AT/PT) ELR (80% PT)(AT/PT) (80% PT)88% 75% p = 0.008
Subgroup analysis (N = 50)MCT ELR(AT/PT) (AT)88% 46% p = 0.002
In contrast to the above findings, a subgroup analysis of one RCT found a lower yield with the auto-triggered ELRs compared to the entire ELR cohort (80% patient-triggered ELR), suggesting patient-triggered ELRs have a greater diagnostic yield in this population than auto-triggered ELRs.
1 study (N = 122)
Palpitations, (pre-) syncope and patients requiring therapy evaluation
MCT (PT) MCT (AT)No prior additional Dxarrhythmia 78% 6%Prior arrhythmia 47% 26%
Based on one retrospective record review, auto-triggered MCTs provide more diagnoses than patient-triggered MCTs, in patients with or without a prior diagnosis of arrhythmia.
Long-term AECG: 1 study (N = 50) Diagnostic yield One study found patient-triggered ILR
76 Diagnostic yield from Holter group in Klootwijk (1986) not included here as patients were screened with two rounds of Holter monitoring prior to study entry. One study in this group used 7-day Holter monitoring (yield 48%).
77 In Rothman (2007), 80% of patients in the ELR group used devices that were patient-activated only. Therefore, this RCT is regarded by the current Review as a comparison of patient-triggered ELR and auto- or patient-triggered MCT.
MBS Review – Ambulatory Electrocardiography Review Report Page 246

May 2016
Clinical question Evidence basePopulation
Findings Conclusions
PT vs AT/PT Palpitations or (pre-) syncope
ILR (PT) ILR (AT -additional Dx)16% 0%
diagnosed more patients with palpitations, syncope or pre, syncope than auto-triggered ILR.
Abbreviations: AECG, ambulatory electrocardiography; AT, auto triggered; Dx, diagnoses; ECG, electrocardiogram; ELR, event loop recorder; ER, event recorder; ILR, implantable loop recorder; MCT, mobile cardiac telemetry; NR, not reported; PT, patient triggered; RCT, randomised controlled trial.
7.4 Evidence for the cost-effectiveness of AECG
This section is a summary of the economic evidence with a particular focus on the studies that provided evidence to address the three economic research questions outlined in Section 2.5. The relevant body of evidence largely related to the use of AECG for two major indications: monitoring in patients with recurrent, unexplained syncope; and screening for AF in patients who have suffered from a recent stroke. Several of the economic analyses of AECG in patients with syncope are now over 10 years old.
7.4.1 What is the published evidence for the cost implications and cost-effectiveness of AECG monitoring of any duration compared with no AECG monitoring?
AECG monitoring in patients with unexplained syncopeAn MSAC Assessment Report from 2003 found ILR to be cost-effective at a cost of $45,000 per QALY compared with standard care (i.e. no further ECG monitoring in the majority of patients) in patients with unexplained recurrent syncope. In a similar population, Westby et al (2010) assessed the cost-effectiveness of several AECG technologies (24-hour Holter, 48-hour Holter, ELR and ILR) compared with no further testing from the perspective of the NHS and personal social services. The economic evaluation found that all of the AECG technologies had a very high likelihood (88% to 100%) of being cost-effective at a threshold of £20,000 per QALY. On the basis of the Westby (2010) analysis, NICE accepted that the use of ILR in patients with infrequent episodes of suspected arrhythmic or unexplained syncope is cost-effective and recommended its use in this population.
A financial impact study from the perspective of the Ontario healthcare system compared ILR with conventional testing in patients with unexplained syncope (Sadri, 2014). Based on the assumption that 2,174 patients had unexplained syncope in Ontario in 2011, the study found that conventional testing would cost $8,800 per diagnosed case compared with $3,500 per case diagnosed with ILR.
AECG to direct pacing therapyWestby (2010) showed that TT testing alone is likely to be the most cost-effective strategy to direct pacing therapy in patients with recurrent episodes of syncope that are suspected to be vasovagal and adversely affect their quality of life or represent a high risk of injury. ILR alone was extendedly dominated by the other strategies, meaning that it is never the most cost-effective option. Therefore, the 2010 NICE guideline recommended the use of TT testing in this population because it considers it to be a more cost-effective use of NHS resources than alternative strategies which include ILR monitoring.
AECG to detect AF in patients with recent strokeIn a Swedish study by Levin et al (2015), 24-hour Holter monitoring was associated with slightly fewer strokes and small gains in life-years and QALYs compared with no screening; however, the incremental cost per QALY of 24-hour Holter monitoring was relatively high at MBS Review – Ambulatory Electrocardiography Review Report Page 247

May 2016
approximately €33,500. In a separate analysis, 24-hour Holter monitoring was shown to have lower sensitivity and higher costs than handheld ER in patients being screened for AF after recent IS/TIA.
Kamel et al (2010) found that outpatient cardiac monitoring (using an auto-triggered ELR) is cost-effective compared with standard care (i.e. aspirin with no outpatient monitoring) for the detection of AF in patients with recent ischaemic stroke (US$13,000 per QALY); however, the authors emphasised that the optimal duration of monitoring is unclear.
7.4.2 What is the published evidence for the cost implications and cost-effectiveness of AECG monitoring of one duration compared with AECG monitoring of a different duration?
AECG monitoring in patients with unexplained syncopeWestby et al (2010) found long-term monitoring with ILR to have a low likelihood (24%) of being cost-effective compared with shorter-term conventional monitoring at a threshold of £20,000 per QALY, but a higher likelihood (72%) at a threshold of £30,000 per QALY. In this comparison, conventional monitoring included both Holter monitoring and ELR, based on the Farwell (2004, 2006) RCT.
A Canadian RCT by Krahn et al (2003) compared long-term monitoring (ILR for 1 year) with conventional monitoring in patients with recurrent unexplained syncope. In this instance, the conventional monitoring strategy involved 2 to 4 weeks of ELR, as well as TT and EPS. Patients in both arms were permitted to cross over to the alternate strategy if they remained undiagnosed after their assigned strategy. The incremental cost per additional diagnosis for ILR versus conventional monitoring (including crossover) was –$22,380 Canadian dollars, indicating a cost savings with a primary strategy of ILR monitoring.
A CEA conducted from a hospital perspective in Italy compared long-term monitoring (ILR for 1 year) with a conventional monitoring strategy in patients with infrequent syncope, defined as one or fewer episodes per month (Giada, 2007). The conventional monitoring strategy incorporated short-term monitoring (24-hour Holter), medium-term monitoring (four weeks of external recorder monitoring), and EPS when the other tests yielded negative results. Despite higher initial costs, the cost per diagnosis of long-term monitoring with ILR was significantly lower than the shorter-term conventional monitoring (€3,056 versus €6,768, respectively; p=0.012).
Finally, Rockx et al (2005) conducted a CEA from the Canadian healthcare system perspective comparing short-term monitoring (48-hour Holter) with medium-term monitoring (ELR for one month) in patients with syncope or presyncope. Medium-term monitoring was associated with an addition cost of US$358 but also a 40% increase in symptom-rhythm correlation during monitoring. The incremental cost of medium-term monitoring was US$902 per additional diagnosis.
AECG to detect AF in patients with recent strokeMayer et al (2013) conducted a CUA to assess the difference between short-term monitoring (24-hour Holter) and medium-term monitoring (7-day Holter) in patients with cerebral ischaemia undergoing screening for AF. The base case analysis and a wide range of sensitivity analyses found that short-term (24-hour) Holter monitoring was dominated by medium-term (7-day) Holter monitoring, due to higher lifelong costs and lower QALYs.
MBS Review – Ambulatory Electrocardiography Review Report Page 248

May 2016
7.4.3 What is the published evidence for the cost implications and cost-effectiveness of auto-triggered AECG monitoring compared with patient-triggered AECG monitoring of the same duration?
No studies were identified that examined the cost-effectiveness of auto-triggered AECG monitoring compared with patient-triggered AECG monitoring of any duration.
7.5 Conclusions
The increase in services for MBS item 11708 can be partly attributed to increased use by GPs, increased dispersion of the technology into regional Australia, and an increase in the frequency of services per patient (which may indicate repeat services to cover longer-term monitoring). The increase in services for other AECG items are not explained by these factors.
AECG monitoring is recommended in CPGs for investigation of a large range of presentations and indications. The choice of monitoring technique in different clinical situations should be determined by the patient’s history, clinical characteristics, nature and frequency of symptoms.
The descriptors for MBS items 11708, 11709, 11710 and 11711 do not specify the intended target population for AECG monitoring, or the duration of AECG monitoring (other than 12 hours or more).
CPGs recommend broader use of ILRs than is currently permitted by the item descriptor and Explanatory Note for Item 38285.
Comparative effectiveness of AECG is primarily addressed using low-level, non-comparative evidence. The most commonly reported outcome is diagnostic yield; only a minority of studies reported intermediate outcomes (e.g. change in patient management) or longer-term patient-relevant outcomes.
The clinical evidence suggests that: for the detection of AF after cryptogenic stroke, long-term AECG is superior to
no further AECG, and medium-term AECG is superior to short-term AECG; for the evaluation of palpitations, medium-term AECG is superior to short-
term AECG, and long-term AECG is superior to medium-term AECG; for the evaluation of syncope, medium-term AECG and long-term AECG have
higher diagnostic yields than short-term AECG, but the evidence is insufficient regarding the relative yields for medium-term and long-term AECG.
MBS Review – Ambulatory Electrocardiography Review Report Page 249
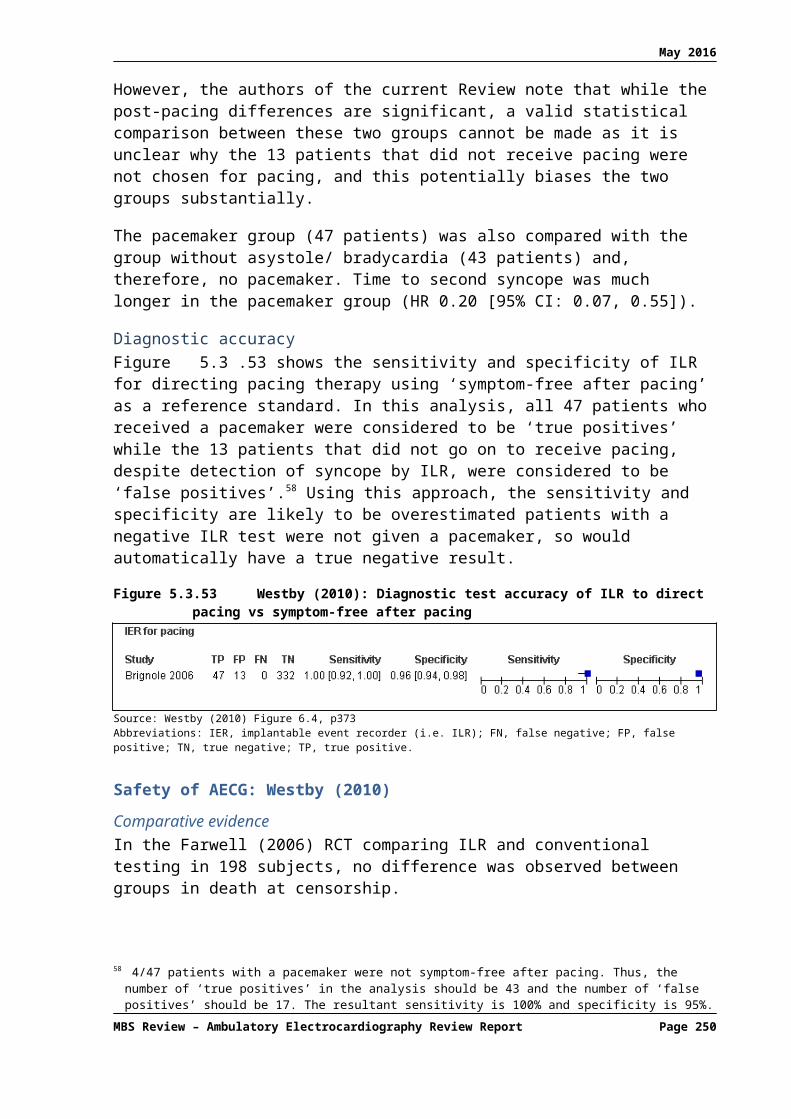
May 2016
APPENDIX 1: REFERENCES
Afzal, M. R., S. Gunda, et al. (2015). "Role of Outpatient Cardiac Rhythm Monitoring in Cryptogenic Stroke: A Systematic Review and Meta-Analysis." Pacing Clin Electrophysiol 38(10): 1236-1245.
AHRQ (2007). Remote Cardiac Monitoring: A Systematic Review. Rockville MD.American Academy of Paediatrics (AAP). (2005). Cardiovascular health supervision for individuals affected by Duchenne or
Becker muscular dystrophy. Pediatrics, 116(6):1569-73.American Society of Anesthesiologists (ASA). (2011). Practice advisory for the perioperative management of patients with
cardiac implantable electronic devices: pacemakers and implantable cardioverter-defibrillators: an updated report by the American Society of Anesthesiologists task force on perioperative management of patients with cardiac implantable electronic devices. Anesthesiology, 114(2):247-61.
Andrade JP, Marin-Neto JA, Paola AA, Vilas-Boas F, Oliveira GM, Bacal F, Bocchi EA, Almeida DR, Fragata Filho AA, Moreira M da C, Xavier SS, Oliveira Junior WA, Dias JC; Sociedade Brasileira de Cardiologia. I Diretriz Latino Americana para o Diagnóstico e Tratamento da Cardiopatia Chagásica (Latin American guideline for the diagnosis and treatment of Chagas’ heart disease). Arq bras Cardiol 2011; 97(2 Suppl 3):1-48.
Angelis GD, C., K Cipriano L, Farrah K, Garland S, Cairns J, Baranchuk A. (2015). Monitoring for Atrial Fibrillation in Discharged Stroke and Transient Ischemic Attack Patients. CADTH Optimal use reports.
Arrocha A, Klein GJ, Benditt DG et al. (2010). Remote electrocardiographic monitoring with a wireless implantable loop recorder: minimizing the data review burden. Pacing & Clinical Electrophysiology 33: 1347–52.
Baumgartner H, Bonhoeffer P, De Groot NMS, De Haan F, Deanfield JE, Galie N, et al. (2010). ESC Guidelines for the management of grown-up congenital heart disease (new version 2010). European Heart Journal, 31(23):2915-57.
Bell, C. and M. Kapral (2000). "Use of ambulatory electrocardiography for the detection of paroxysmal atrial fibrillation in patients with stroke. Canadian Task Force on Preventive Health Care." Can J Neurol Sci 27(1): 25-31.
Bonow RO, Carabello BA, Chatterjee K, de Leon Jr AC, Freed MD, Gaasch WH, et al. (2006). ACC/AHA 2006 Practice guidelines for the management of Patients with valvular heart disease: Executive Summary. A Report of the American College of Cardiology/ American Heart Association Task Force on Practice Guidelines (Writing Committee to Revise the 1998 Guidelines for the Management of Patients With Valvular Heart Disease). Journal of the American College of Cardiology, 48(3):598-675.
Brachmann, J., C. A. Morillo, et al. (2016). "Uncovering atrial fibrillation beyond short-term monitoring in cryptogenic stroke patients: Three-year results from the cryptogenic stroke and underlying atrial fibrillation trial." Circulation: Arrhythmia and Electrophysiology 9 (1) (no pagination) (DOI: 10.1161/CIRCEP.115.003333.).
Brignole M, Sutton R, Menozzi C, et al. Lack of correlation between the responses to tilt testing and adenosine triphosphate test and the mechanism of spontaneous neutrally mediated syncope. Eur Heart J, 2006; 27:2232-9.
Brignole M, Vardas P, Hoffman E, Huikuri H, Moya A, Ricci R, et al. (2009). Indications for the use of diagnostic implantable and external ECG loop recorders. Europace, 11(5):671-87.
British Columbia Medical Association (BCMA). (2013). Ambulatory ECG Monitoring (Holter Monitor and Other Devices).Burstrom K, Johannesson M, Diderichsen F. Health-related quality of life by disease and socio-economic group in the
general population in Sweden. Health Policy, 2001; 55:51–69.Burstrom K, Johannesson M, Diderichsen F. Swedish population health-related quality of life results using the eq-5d. Qual
Life Res, 2001; 10:621–35.Calkins H, Kuck KH, Cappato R, Brugada J, Camm AJ, Chen SA, et al. (2012). 2012 HRS/EHRA/ECAS expert consensus
statement on catheter and surgical ablation of atrial fibrillation: recommendations for patient selection, procedural techniques, patient management and follow-up, definitions, endpoints, and research trial design: a report of the Heart Rhythm Society (HRS) Task Force on Catheter and Surgical Ablation of Atrial Fibrillation. Developed in partnership with the European Heart Rhythm Association (EHRA), a registered branch of the European Society of Cardiology (ESC) and the European Cardiac Arrhythmia Society (ECAS); and in collaboration with the American College of Cardiology (ACC), American Heart Association (AHA), the Asia Pacific Heart Rhythm Society (APHRS), and the Society of Thoracic Surgeons (STS). Endorsed by the governing bodies of the American College of Cardiology Foundation, the American Heart Association, the European Cardiac Arrhythmia Society, the European Heart Rhythm Association, the Society of Thoracic Surgeons, the Asia Pacific Heart Rhythm Society, and the Heart Rhythm Society. Heart Rhythm, 9(4):632-96 e21.
Camm AJ, Kirchhof P, Lip GY, Schotten U, Savelieva I et al; European Heart Rhythm Association; European Association for Cardio-Thoracic Surgery (2010). Guidelines for the management of atrial fibrillation: The Task Force for the management of atrial fibrillation of the European Society of Cardiology (ESC). Eur Heart J. 2010 Oct; 31(19):2369-429.
Camm AJ, Lip GYH, De Caterina R, Savelieva I, Atar D, Hohnloser SH, et al. (2012). 2012 focused update of the ESC Guidelines for the management of atrial fibrillation. European Heart Journal, 33(21):2719-47.
Cardiac Society of Australia and New Zealand (CSANZ). (2011). Guidelines for the diagnosis and management of catecholaminergic polymorphic ventricular tachycardia.
Cardiac Society of Australia and New Zealand (CSANZ). (2012). Guidelines for ambulatory electrocardiographic monitoring.
MBS Review – Ambulatory Electrocardiography Review Report Page 250

May 2016
Cardiac Society of Australia and New Zealand (CSANZ). (2013). Position statement on remote monitoring of cardiac implantable electrical devices.
Casaubon LK, Boulanger JM, Blacquiere D, Boucher S, Brown K, Goddard T, et al. (2015). Canadian Stroke Best Practice Recommendations: Hyperacute Stroke Care Guidelines, Update 2015. Int J Stroke, 10(6):924-40.
Centre, N.H.S. (2002) Insertable loop recorders for the diagnosis of syncope - horizon scanning review (Structured abstract). Health Technology Assessment Database, 5.
Centre, N.H.S. (2004) Reveal Plus (TM) implantable loop recorders for the investigation of syncope and other events - horizon scanning review (Structured abstract). Health Technology Assessment Database, 7.
Cerebral Embolism Task Force. (1989). Cardiogenic brain embolism. The second report of the Cerebral Embolism Task Force. Arch Neurol. 46: 727–43.
Choe, W. C., R. S. Passman, et al. (2015). "A Comparison of Atrial Fibrillation Monitoring Strategies after Cryptogenic Stroke (from the Cryptogenic Stroke and Underlying AF Trial)." American Journal of Cardiology 116(6): 889-893.
Connolly SJ, Ezekowitz MD, Yusuf S, Eikelboom J, Oldgren J, Parekh A et al. Dabigatran versus warfarin in patients with atrial fibrillation. New Engl J Med, 2009; 361:1139–51.
Crawford MH, Bernstein SJ, Deedwania PC, DiMarco JP, Ferrick KJ, Garson A, Jr., et al. (1999). ACC/AHA Guidelines for Ambulatory Electrocardiography. A report of the American College of Cardiology/American Heart Association Task Force on Practice Guidelines (Committee to Revise the Guidelines for Ambulatory Electrocardiography). Developed in collaboration with the North American Society for Pacing and Electrophysiology. J Am Coll Cardiol, 34(3):912-48.
Crossley GH, Poole JE, Rozner MA, Asirvatham SJ, Cheng A, Chung MK, et al. (2011). The Heart Rhythm Society (HRS)/American Society of Anesthesiologists (ASA) Expert Consensus Statement on the perioperative management of patients with implantable defibrillators, pacemakers and arrhythmia monitors: facilities and patient management: executive summary this document was developed as a joint project with the American Society of Anesthesiologists (ASA), and in collaboration with the American Heart Association (AHA), and the Society of Thoracic Surgeons (STS). Heart Rhythm, 8(7):e1-18.
Crosson JE, Callans DJ, Bradley DJ, Dubin A, Epstein M, Etheridge S, et al. (2014). PACES/HRS expert consensus statement on the evaluation and management of ventricular arrhythmias in the child with a structurally normal heart. Heart Rhythm, 11(9):e55-e78.
Czosek, R. J., J. Anderson, et al. Utility of ambulatory monitoring in patients with congenital heart disease. American Journal of Cardiology, 2013; 111(5):723-730.
Da Costa, A., P. Defaye, et al. (2013). "Clinical impact of the implantable loop recorder in patients with isolated syncope, bundle branch block and negative workup: A randomized multicentre prospective study." Archives of Cardiovascular Diseases 106 (3): 146-154.
Daubert JC, Saxon L, Adamson PB, Auricchio A, Berger RD, Beshai JF, et al. (2012). 2012 EHRA/HRS expert consensus statement on cardiac resynchronization therapy in heart failure: implant and follow-up recommendations and management. Europace, 14(9):1236-86.
Davis, S., M. Westby, et al. Implantable loop recorders are cost-effective when used to investigate transient loss of consciousness which is either suspected to be arrhythmic or remains unexplained. Europace, 2012; 14(3):402-409.
Davis, S., M. Westby, et al. Tilt testing is more cost-effective than implantable loop recorder monitoring as a means of directing pacing therapy in people with recurrent episodes of suspected vasovagal syncope that affect their quality of life or present a high risk of injury. Heart, 2013; 99(11):805-810.
de Cock CC, Elders J, van Hemel NM, van den Broek K, van Erven L, de Mol B, et al. (2012). Remote monitoring and follow-up of cardiovascular implantable electronic devices in the Netherlands: An expert consensus report of the Netherlands Society of Cardiology. Neth Heart J, 20(2):53-65.
Department of Health (2009) NHS Reference costs 2007-08. London: Department of Health. http://www.dh.gov.uk/en/Publicationsandstatistics/Publications/PublicationsPolicyAndGuidance/DH_098945
Department of Health, Western Australia. Quick reference guide: Atrial Fibrillation Information for the Health Practitioner. Perth: Health Strategy and Networks, Department of Health, Western Australia; 2014.
Dubner S, Auricchio A, Steinberg JS, Vardas P, Stone P, Brugada J, et al. (2012). ISHNE/EHRA expert consensus on remote monitoring of cardiovascular implantable electronic devices (CIEDs). Europace, 14(2):278-93.
Edvardsson N, Frykman V, van Mechelen R et al. (2011) Use of an implantable loop recorder to increase the diagnostic yield in unexplained syncope: Results from the PICTURE registry. Europace 13: 262–9.
Edvardsson, N., C. Wolff, et al. Costs of unstructured investigation of unexplained syncope: Insights from a micro-costing analysis of the observational PICTURE registry. Europace, 2015; 17(7):1141-1148.
European Atrial Fibrillation Trial (EAFT) Study Group (1993). Secondary prevention in non-rheumatic atrial fibrillation after transient ischaemic attack or minor stroke. The Lancet 342 (8882): 1255-1262
Farwell, D. J., N. Freemantle, et al. (2004a). "Use of implantable loop recorders in the diagnosis and management of syncope." European Heart Journal 25 (14): 1257-1263.
Farwell, D. J., N. Freemantle, et al. (2006). "The clinical impact of implantable loop recorders in patients with syncope." European Heart Journal 27 (3): 351-356.
Fitchet, A., M. Stirling, et al. Holter monitoring vs tilt testing in the investigation of suspected vasovagal syncope. PACE - Pacing and Clinical Electrophysiology, 2003; 26(7 I):1523-1527.
MBS Review – Ambulatory Electrocardiography Review Report Page 251

May 2016
Friberg L, Rosenqvist M, Lip GY. Net clinical benefit of warfarin in patients with atrial fibrillation: a report from the Swedish atrial fibrillation cohort study. Circulation, 2012; 125:2298–307.
Gersh BJ, Maron BJ, Bonow RO, Dearani JA, Fifer MA, Link MS, Naidu SS, Nishimura RA, Ommen SR, Rakowski H, Seidman CE, Towbin JA, Udelson JE, Yancy CW. 2011 ACCF/AHA guideline for the diagnosis and treatment of hypertrophic cardiomyopathy: a report of the American College of Cardiology Foundation/American Heart Association Task Force on Practice Guidelines. J Am Coll Cardiol 2011; 58:e212– 60.
Giada, F., M. Gulizia, et al. (2007). "Recurrent Unexplained Palpitations (RUP) Study. Comparison of Implantable Loop Recorder Versus Conventional Diagnostic Strategy." Journal of the American College of Cardiology 49 (19): 1951-1956.
Gladstone, D. J., M. Spring, et al. (2014). "Atrial fibrillation in patients with cryptogenic stroke." New England Journal of Medicine 370 (26): 2467-2477.
Gladstone, D. J., P. Dorian, et al. (2015). "Atrial premature beats predict atrial fibrillation in cryptogenic stroke: results from the EMBRACE trial." Stroke 46(4): 936-941.
Grond M, Jauss M, Hamann G, Stark E, Veltkamp R, Nabavi D et al. Improved detection of silent atrial fibrillation using 72-hour Holter ECG in patients with ischemic stroke: a prospective multicenter cohort study. Stroke 2013; 44:3357–64.
Gualandro DM, Yu PC, Calderaro D, Marques AC, Pinho C, Caramelli B et al. II Guidelines for perioperative evaluation of the Brazilian Society of Cardiology. Arq Bras Cardiol 2011; 96(3 suppl.1): 1-68.
Harris, K., D. Edwards, et al. (2012). "How can we best detect atrial fibrillation?" J R Coll Physicians Edinb 42 Suppl 18: 5-22.
Hayes Inc (2011) Mobile cardiac outpatient telemetry (MCOT) (CardioNet ambulatory ECG monitor; CardioNet Inc.) for home monitoring of cardiac patients. Available from Hayes Inc.
Hayes Inc (2016) Implantable Cardiac Loop Recorders for Diagnosis and Management of Syncope in Adults. Available from Hayes Inc.
Higgins, P., P. W. MacFarlane, et al. (2013). "Noninvasive cardiac event monitoring to detect atrial fibrillation after ischemic stroke: A randomized, controlled trial." Stroke 44 (9): 2525-2531.
Hillis LD, Smith PK, Anderson JL, Bittl JA, Bridges CR, Byrne JG, et al. (2011). 2011 ACCF/AHA Guideline for Coronary Artery Bypass Graft Surgery: a report of the American College of Cardiology Foundation/American Heart Association Task Force on Practice Guidelines. Circulation, 124(23):e652-735.
Hiratzka LF, Bakris GL, Beckman JA, Bersin RM, Carr VF, Casey DE, Jr., et al. (2010). 2010 ACCF/AHA/AATS/ACR/ASA/SCA/SCAI/SIR/STS/SVM Guidelines for the diagnosis and management of patients with thoracic aortic disease. A Report of the American College of Cardiology Foundation/American Heart Association Task Force on Practice Guidelines, American Association for Thoracic Surgery, American College of Radiology,American Stroke Association, Society of Cardiovascular Anesthesiologists, Society for Cardiovascular Angiography and Interventions, Society of Interventional Radiology, Society of Thoracic Surgeons,and Society for Vascular Medicine. J Am Coll Cardiol, 55(14):e27-e129.
Hoch JS, Rockx MA, Krahn AD. Using the net benefit regression framework to construct cost-effectiveness acceptability curves: an example using data from a trial of external loop recorders versus Holter monitoring for ambulatory monitoring of ‘community acquired’ syncope. BMC Health Serv Res. 2006; 6:68.
Hoefman, E., H. C. P. M. van Weert, et al. (2005). "Diagnostic yield of patient-activated loop recorders for detecting heart rhythm abnormalities in general practice: A randomised clinical trial." Family Practice 22 (5): 478-484.
Hoefman, E., P. J. Bindels, et al. (2010). "Efficacy of diagnostic tools for detecting cardiac arrhythmias: systematic literature search." Neth Heart J 18(11): 543-551.
January CT, Wann LS, Alpert JS, Calkins H, Cigarroa JE, Cleveland JC Jr, Conti JB, Ellinor PT, Ezekowitz MD, Field ME, Murray KT, Sacco RL, Stevenson WG, Tchou PJ, Tracy CM, Yancy CW. 2014 AHA/ACC/HRS guideline for the management of patients with atrial fibrillation: executive summary: a report of the American College of Cardiology/American Heart Association Task Force on Practice Guidelines and the Heart Rhythm Society. Circulation. 2014; 130:2071–2104.
Jessup M, Abraham WT, Casey DE, Feldman AM, Francis GS, Ganiats TG, et al. (2009). 2009 focused update: ACCF/AHA guidelines for the diagnosis and management of heart failure in adults: A report of the American College of Cardiology Foundation/American Heart Association Task Force on practice guidelines: Developed in collaboration with the International Society for Heart and Lung Transplantation. Circulation, 119(14):1977-2016.
Kalman JM, Sanders P, Brieger DB, Aggarwal A, Zwar NA, Tatoulis J, et al. (2013). National Heart Foundation of Australia consensus statement on catheter ablation as a therapy for atrial fibrillation. Med J Aust, 198(1):27-8.
Kamel, H., B. B. Navi, et al. (2013). "Pilot randomized trial of outpatient cardiac monitoring after cryptogenic stroke." Stroke 44 (2): 528-530.
Kamel, H., M. Hegde, et al. Cost-effectiveness of outpatient cardiac monitoring to detect atrial fibrillation after ischemic stroke. Stroke, 2010; 41(7):1514-1520.
Kantor PF, Lougheed J, Dancea A, McGillion M, Barbosa N, Chan C, et al. (2013). Presentation, diagnosis, and medical management of heart failure in children: Canadian cardiovascular society guidelines. Canadian Journal of Cardiology, 29(12):1535-52.
Kapa, S., A. E. Epstein, et al. (2013). "Assessing arrhythmia burden after catheter ablation of atrial fibrillation using an implantable loop recorder: The abacus study." Journal of Cardiovascular Electrophysiology 24 (8): 875-881.
MBS Review – Ambulatory Electrocardiography Review Report Page 252

May 2016
Kernan WN, Ovbiagele B, Black HR, Bravata DM, Chimowitz MI, Ezekowitz MD, et al. (2014). Guidelines for the prevention of stroke in patients with stroke and transient ischemic attack: a guideline for healthcare professionals from the American Heart Association/American Stroke Association. Stroke, 45(7): 2160-236.
Khairy P, Van Hare GF, Balaji S, Berul CI, Cecchin F, Cohen MI, et al. (2014). PACES/HRS expert consensus statement on the recognition and management of arrhythmias in adult congenital heart disease: Developed in partnership between the Pediatric and Congenital Electrophysiology Society (PACES) and the Heart Rhythm Society (HRS). Endorsed by the governing bodies of PACES, HRS, the American College of Cardiology (ACC), the American Heart Association (AHA), the European Heart Rhythm Association (EHRA), the Canadian Heart Rhythm Society (CHRS), and the International Society for Adult Congenital Heart Disease (ISACHD). Heart Rhythm, 11(10):e102-e65.
Kinlay, S., J. W. Leitch, et al. (1996). "Cardiac event recorders yield more diagnoses and are more cost-effective than 48-hour Holter monitoring in patients with palpitations. A controlled clinical trial." Ann Intern Med 124(1 Pt 1): 16-20.
Kishore, A., A. Vail, et al. (2014). "Detection of atrial fibrillation after ischemic stroke or transient ischemic attack: a systematic review and meta-analysis." Stroke 45(2): 520-526.
Knoebel SB, Williams SV, Achord JL, Reynolds WA, Fisch C, Friesinger GC, et al. (1993). Clinical competence in ambulatory electrocardiography. A statement for physicians from the AHA/ACC/ACP Task Force on Clinical Privileges in Cardiology. Circulation, 88(1): 337-41.
Krahn, A. D., G. J. Klein, et al. (2001). "Randomized assessment of syncope trial: Conventional diagnostic testing versus a prolonged monitoring strategy." Circulation 104 (1): 46-51.
Krahn, A. D., G. J. Klein, et al. (2003). "Cost implications of testing strategy in patients with syncope: Randomized assessment of syncope trial." Journal of the American College of Cardiology 42 (3): 495-501.
Krahn, A. D., G. J. Klein, et al. The high cost of syncope: Cost implications of a new insertable loop recorder in the investigation of recurrent syncope. American Heart Journal, 1999; 137(5):870-877.
Krahn, A.D., Klein, G.J., Yee, R. & Norris, C. Final results from a pilot study with an implantable loop recorder to determine the etiology of syncope in patients with negative noninvasive and invasive testing. American Journal of Cardiology, 1998; 82(1):117–119.
Landinez, S. F., C. A. Villamil, et al. (2015). Mobile ECG Systems and Cardiovascular Risk: A Systematic Review. Stud Health Technol Inform 211: 175-184.
Levin, L. A., M. Husberg, et al. A cost-effectiveness analysis of screening for silent atrial fibrillation after ischaemic stroke. Europace, 2015; 17(2):207-214.
Liao, J., Z. Khalid, et al. (2007). "Noninvasive cardiac monitoring for detecting paroxysmal atrial fibrillation or flutter after acute ischemic stroke: a systematic review." Stroke 38(11): 2935-2940.
Lopez-Jimenez F, Goldman L, Orav EJ, Ellenbogen K, Stambler B, et al. Health values before and after pacemaker implantation. Am Heart J, 2002; 144(4):687-92.
Mappilakkandy, R. and I. Edwards (2013). "Update on syncope in the older person - A clinical review." Reviews in Clinical Gerontology 23(1): 15-31.
Mayer, F., R. Stahrenberg, et al. Cost-effectiveness of 7-day-Holter monitoring alone or in combination with transthoracic echocardiography in patients with cerebral ischemia. Clinical Research in Cardiology, 2013; 102(12):875-884.
McClennen, S., P. J. Zimetbaum, et al. Holter monitoring: Are two days better than one? American Journal of Cardiology, 2000; 86(5):562-564.
McLellan (2011) Ambulatory electrocardiographic monitoring. Australian Family Physician. 40 (8): 596-8.McMurray JJV, Adamopoulos S, Anker SD, Auricchio A, Bohm M, Dickstein K, et al. (2012). ESC Guidelines for the
diagnosis and treatment of acute and chronic heart failure 2012. European Journal of Heart Failure, 14(8):803-69.Ministry of Health Malaysia (MOHM). (2012). Atrial fibrillation. Moya A, Sutton R, Ammirati F, Blanc JJ, Brignole M, Dahm JB, et al. (2009). Guidelines for the diagnosis and management
of syncope (version 2009). European Heart Journal, 30(21):2631-71.MSAC (2003) Implantation of insertable loop recorder for the diagnosis of recurrent unexplained syncope Medical Services
Advisory Committee (MSAC) Department of Health and Ageing, AustraliaNational Health and Medical Research Council (NHMRC). (2000). How to use the evidence: assessment and application of
scientific evidence. Canberra, ACT: NHMRC.National Horizon Scanning Centre. Reveal Plus (™) implantable loop recorders for the investigation of syncope and other
events - horizon scanning review, Birmingham: National Horizon Scanning Centre, 2004; (NHSC), 7.National Institute for Health and Care Excellence (NICE). (2014). Atrial fibrillation: management (NICE CG 180).National Institute of Health and Care Excellence (NICE). Costing statement: Transient loss of consciousness (‘blackouts’)
management in adults and young people. 2010. NICE clinical guideline 109. New Zealand Medical Association (NZMA). (2013). ST-elevation myocardial infarction: New Zealand management
guidelines, 2013. NZMJ. 126 (1387): 127-164.NHMRC (2009) NHMRC levels of evidence and grades for recommendations for developers of guidelines. Canberra, ACT:
National Health and Medical Research Council.NICE (2012) "Transient loss of consciousness - Evidence Update March 2012." NHS Evidence.NICE (TA324) (2014). Dual-chamber pacemakers for symptomatic bradycardia due to sick sinus syndrome without
atrioventricular block.
MBS Review – Ambulatory Electrocardiography Review Report Page 253

May 2016
Ntaios G, Papavasileiou V, Diener, H et al (2012). Nonvitamin-K-antagonist oral anticoagulants in patients with atrial fibrillation and previous stroke or transient ischemic attack. A systematic review and meta-analysis of randomized controlled trials. Stroke. 43(12): 3298-304.
O’Brien CL, Gage BF. Costs and effectiveness of ximelagatran for stroke prophylaxis in chronic atrial fibrillation. JAMA. 2005; 293:699 –706.
Oldgren J, Alings M, Darius H, Diener HC, Eikelboom J, EzekowitzMDet al. Risks for stroke, bleeding, and death in patients with atrial fibrillation receiving dabigatran or warfarin in relation to the chads2 score: a subgroup analysis of the RE-LY trial. Ann Intern Med, 2011; 155:660–7.
Parry, S. W. and M. P. Tan (2010). "An approach to the evaluation and management of syncope in adults." BMJ (Online) 340(7744): 468-473.
Pflaumer A, Davis AM (2012). Guidelines for the diagnosis and management of Catecholaminergic Polymorphic Ventricular Tachycardia. Heart Lung and Circulation, 21(2):96-100.
Podoleanu, C., A. DaCosta, et al. (2014). "Early use of an implantable loop recorder in syncope evaluation: A randomized study in the context of the French healthcare system (FRESH study)." Archives of Cardiovascular Diseases 107 (10): 546-552.
Priori SG, Blomstrom-Lundqvist C, Mazzanti A, Blom N, Borggrefe M, Camm J, et al. (2015). 2015 ESC Guidelines for the management of patients with ventricular arrhythmias and the prevention of sudden cardiac death: The Task Force for the Management of Patients with Ventricular Arrhythmias and the Prevention of Sudden Cardiac Death of the European Society of Cardiology (ESC) Endorsed by: Association for European Paediatric and Congenital Cardiology (AEPC). Eur Heart J, 36(41):2793-867.
Providencia, R., R. Candeias, et al. Financial impact of adopting implantable loop recorder diagnostic for unexplained syncope compared with conventional diagnostic pathway in Portugal. BMC Cardiovascular Disorders, 2014; 14:63.
Raviele A, Giada F, Bergfeldt L, Blanc JJ, Blomstrom-Lundqvist C, Mont L, et al. (2011). Management of patients with palpitations: a position paper from the European Heart Rhythm Association. Europace, 13(7):920-34.
Raviele A, Natale A, Calkins H, Camm JA, Cappato R, Chen SA, et al. (2012). Venice chart international consensus document on atrial fibrillation ablation: 2011 update. Journal of Cardiovascular Electrophysiology, 23(8):890-923.
Ringleb PA, Bousser MG, Ford G, Bath P, Brainin M, Caso V, et al. (2008). Guidelines for management of ischaemic stroke and transient ischaemic attack 2008. Cerebrovascular Diseases, 25(5):457-507.
Rockx, M. A., J. S. Hoch, et al. (2005). "Is ambulatory monitoring for "community-acquired" syncope economically attractive? A cost-effectiveness analysis of a randomized trial of external loop recorders versus Holter monitoring." American Heart Journal 150 (5): 1065.e1061-1065.e1065.
Rothman, S. A., J. C. Laughlin, et al. (2007). "The diagnosis of cardiac arrhythmias: A prospective multi-center randomized study comparing mobile cardiac outpatient telemetry versus standard loop event monitoring." Journal of Cardiovascular Electrophysiology 18 (3): 241-247.
Rose, M.S., Koshman, M.L., Spreng, S. & Sheldon, R. The relationship between health-related quality of life and frequency of spells in patients with syncope. Journal of Clinical Epidemiology, 2000; 53(12):1209–1216.
Sacco RL, Ellenberg JH, Mohr JP, Tatemichi TK, Hier DB, Price TR, Wolf PA. (1989) Infarcts of undetermined cause: the NINCDS Stroke Data Bank. Ann Neurol. 25(4):382-90.
Sadri, H. and P. Winsor. The effect of late adoption of Canadian innovations: A case for implantable cardiac monitors. L'effet de l'adoption tardive des innovations canadiennes: le cas des moniteurs cardiaques implantables. Healthcare Management Forum, 2014; 27(1 SUPPL.):S46-S57.
Sanna, T., H. C. Diener, et al. (2014). Cryptogenic stroke and underlying atrial fibrillation. N Engl J Med 370(26): 2478-2486.
Scalvini, S., E. Zanelli, et al. (2005). "Cardiac event recording yields more diagnoses than 24-hour Holter monitoring in patients with palpitations." Journal of Telemedicine and Telecare 11 (SUPPL. 1): 14-16.
Seidl K, Rameken M, Breunung S, Senges J, Jung W, Andresen D, van Toor A, Krahn AD, Klein GJ & Reveal I. Diagnostic assessment of recurrent unexplained syncope with a new subcutaneously implantable loop recorder. Reveal-Investigators. Europace, 2000; 2(3):256-62.
Shea B, Grimshaw J, Well GA, Boers M, Andersson N, Hamel C, et al. Development of AMSTAR: a measurement tool to assess the methodological quality of systematic reviews. BMC Medical Research Methodology 2007, 7:10.
Simpson, C. S., A. D. Krahn, et al. A cost effective approach to the investigation of syncope: relative merit of different diagnostic strategies. Canadian Journal of Cardiology, 1999; 15(5):579-584.
Sivakumaran, S., A. D. Krahn, et al. (2003). "A prospective randomized comparison of loop recorders versus Holter monitors in patients with syncope or presyncope." American Journal of Medicine 115 (1): 1-5.
Slotwiner D, Varma N, Akar JG, Annas G, Beardsall M, Fogel RI, et al. (2015). HRS expert consensus statement on remote interrogation and monitoring for cardiovascular implantable electronic devices. Heart Rhythm, 12(7):e69-e95.
Sobocinski P, Anggardh Roth E, Frykman Kull V, von Arbin M, Wallen H, Rosenqvist M. Improved screening for silent atrial fibrillation after ischaemic stroke. Europace, 2012; 14:1112–6.
Solbiati, M., G. Costantino, et al. (2015) Implantable loop recorder versus conventional diagnostic workup for unexplained recurrent syncope. Cochrane Database of Systematic Reviews DOI: 10.1002/14651858.CD011637.
Sposato, L. A., L. E. Cipriano, et al. (2015). "Diagnosis of atrial fibrillation after stroke and transient ischaemic attack: a systematic review and meta-analysis." Lancet Neurol 14(4): 377-387.
MBS Review – Ambulatory Electrocardiography Review Report Page 254

May 2016
Steg PG, James SK, Atar D, Badano LP, Blomstrom-Lundqvist C, Borger MA, et al. (2012). ESC Guidelines for the management of acute myocardial infarction in patients presenting with ST-segment elevation. Eur Heart J, 33(20):2569-619.
Strickberger SA, Benson DW, Biaggioni I, Callans DJ, Cohen MI, Ellenbogen KA, Epstein AE, Friedman P, Goldberger J, Heidenreich PA, Klein GJ, Knight BP, Morillo CA, Myerburg RJ, Sila CA, American Heart Association Councils on Clinical Cardiology, Cardiovascular, Quality of Care and Outcomes Research. AHA/ACCF scientific statement on the evaluation of syncope: from the American Heart Association Councils on Clinical Card. J Am Coll Cardiol. 2006.
Stroke Risk in Atrial Fibrillation Working Group (2007). Independent predictors of stroke in patients with atrial fibrillation: a systematic review. Neurology 69: 546–54.
Sulke, N., C. Sugihara, et al. (2015). "The benefit of a remotely monitored implantable loop recorder as a first line investigation in unexplained syncope: the EaSyAS II trial." Europace.
Thijs, V. N., J. Brachmann, et al. (2016). "Predictors for atrial fibrillation detection after cryptogenic stroke: Results from CRYSTAL AF." Neurology 86 (3): 261-269.
University of Michigan (UM) Health System. (2014). Management of acute atrial fibrillation and atrial flutter in non-pregnant hospitalised adults.
Verma A, Cairns JA, Mitchell LB, Macle L, Stiell IG, Gladstone D, et al. (2014). 2014 focused update of the Canadian cardiovascular society guidelines for the management of atrial fibrillation. Canadian Journal of Cardiology, 30(10):1114-30.
Westby M, D. S., Bullock I et al (2010). Transient loss of consciousness ('blackouts') management in adults and young people. London, National Clinical Guideline Centre for Acute and Chronic Conditions, Royal College of Physicians.
Wilkoff BL, Auricchio A, Brugada J, Cowie M, Ellenbogen KA, Gillis AM, et al. (2008). HRS/EHRA Expert Consensus on the Monitoring of Cardiovascular Implantable Electronic Devices (CIEDs). Heart Rhythm, 5(6):907-25.
Yancy CW, Jessup M, Bozkurt B, Butler J, Casey DE, Jr., Drazner MH, et al. (2013). 2013 ACCF/AHA guideline for the management of heart failure: a report of the American College of Cardiology Foundation/American Heart Association Task Force on practice guidelines. Circulation, 128(16):e240-327.
Zipes DP, Camm AJ, Borggrefe M, Buxton AE, Chaitman B, Fromer M, et al. (2006). ACC/AHA/ESC 2006 guidelines for management of patients with ventricular arrhythmias and the prevention of sudden cardiac death: a report of the American College of Cardiology/American Heart Association Task Force and the European Society of Cardiology Committee for Practice Guidelines (Writing Committee to Develop Guidelines for Management of Patients With Ventricular Arrhythmias and the Prevention of Sudden Cardiac Death). J Am Coll Cardiol, 48(5):e247-346.
MBS Review – Ambulatory Electrocardiography Review Report Page 255
May 2016
APPENDIX 2: REVIEW WORKING GROUP MEMBERS
As part of the MBS Review process, the Department of Health established a Review Working Group (RWG). The RWG is a time-limited working group of nominated representatives to provide advice to the Department on the scope of the review, clinical practice and policy issues.
Table A-2.1 Members of the RWG for the MBS Review of AECG
Name RepresentingDr Paresh Dawda Royal Australian College of General Practitioners
Dr Walid Jammal General practitionerMember of Protocol Advisory Sub-Committee (PASC) of MSACMember of Evaluation Sub-Committee (ESC) of MSAC
Dr Elizabeth Marles Royal Australian College of General Practitioners
Professor Andrew McGavigan Cardiac Society of Australia and New Zealand
Associate Professor Harry Mond Cardiologist (heart specialist)
Dr Hans Tu Consultant neurologist
Chair and Secretariat Department of Health
MBS Review – Ambulatory Electrocardiography Review Report Page 256

May 2016
APPENDIX 3: MBS ITEMS RELEVANT TO AECG SERVICES
A-3.1 MBS items relevant to AECG
The MBS item numbers for AECG in scope of this review include 11708, 11709, 11710, 11711, 38285, and 11722 (see Table A-3.1 for full descriptors). Explanatory Note T8.62 is specific to MBS item 38285 for insertion of an ILR (see Table A-3.2).
Table A-3.1 MBS item descriptors and fees relevant to AECGContinuous recorders
Item number MBS item number description
11708
Category 2 - DIAGNOSTIC PROCEDURES AND INVESTIGATIONSGroup D1 - MISCELLANEOUS DIAGNOSTIC PROCEDURES AND INVESTIGATIONS
Subgroup 6 – CARDIOVASCULAR
Continuous ECG recording of ambulatory patient for 12 or more hours (including resting ECG and the recording of parameters), not in association with ambulatory blood pressure monitoring, involving microprocessor based analysis equipment, interpretation and report of recordings by a specialist physician or consultant physician.
Not being a service to which item 11709 applies.
The changing of a tape or batteries does not constitute a separate service. Where a recording is analysed and reported on and a decision is made to undertake a further period of monitoring, the second episode is regarded as a separate service.
Fee: $127.90 Benefit: 75% = $95.95 85% = $108.75
11709
Category 2 - DIAGNOSTIC PROCEDURES AND INVESTIGATIONSGroup D1 - MISCELLANEOUS DIAGNOSTIC PROCEDURES AND INVESTIGATIONS
Subgroup 6 – CARDIOVASCULAR
Continuous ECG recording (Holter) of ambulatory patient for 12 or more hours (including resting ECG and the recording of parameters), not in association with ambulatory blood pressure monitoring, utilising a system capable of superimposition and full disclosure printout of at least 12 hours of recorded ECG data, microprocessor based scanning analysis, with interpretation and report by a specialist physician or consultant physician.
The changing of a tape or batteries does not constitute a separate service. Where a recording is analysed and reported on and a decision is made to undertake a further period of monitoring, the second episode is regarded as a separate service.
Fee: $167.45 Benefit: 75% = $125.60 85% = $142.35
External event recorders
Item number MBS item number description
11710
Category 2 - DIAGNOSTIC PROCEDURES AND INVESTIGATIONSGroup D1 - MISCELLANEOUS DIAGNOSTIC PROCEDURES AND INVESTIGATIONS
Subgroup 6 – CARDIOVASCULAR
AMBULATORY ECG MONITORING, patient activated, single or multiple event recording, utilising a looping memory recording device which is connected continuously to the patient for 12 hours or more and is capable of recording for at least 20 seconds prior to each activation and for 15 seconds after each activation, including transmission, analysis, interpretation and report - payable once in any 4 week period.
Fee: $51.90 Benefit: 75% = $38.95 85% = $44.15
MBS Review – Ambulatory Electrocardiography Review Report Page 257

May 2016
11711
Category 2 - DIAGNOSTIC PROCEDURES AND INVESTIGATIONSGroup D1 - MISCELLANEOUS DIAGNOSTIC PROCEDURES AND INVESTIGATIONS
Subgroup 6 – CARDIOVASCULAR
AMBULATORY ECG MONITORING for 12 hours or more, patient activated, single or multiple event recording, utilising a memory recording device which is capable of recording for at least 30 seconds after each activation, including transmission, analysis, interpretation and report - payable once in any 4 week period.
Fee: $28.30 Benefit: 75% = $21.25 85% = $24.10
Implantable event recorders
Item number MBS item number description
38285
Category 3 - THERAPEUTIC PROCEDURESGroup T8 - SURGICAL OPERATIONS
Subgroup 6 - CARDIO-THORACICSubheading 1 - CARDIOLOGY PROCEDURES
IMPLANTABLE ECG LOOP RECORDER, insertion of, for diagnosis of primary disorder in patients with recurrent unexplained syncope where: a diagnosis has not been achieved through all other available cardiac investigations; and a neurogenic cause is not suspected; and it has been determined that the patient does not have structural heart disease associated with a
high risk of sudden cardiac death.including initial programming and testing, as an admitted patient in an approved hospital
Multiple Services Rule(Anaes.)
Fee: $192.90 Benefit: 75% = $144.70 85% = $164.00(See para T8.62 of explanatory notes to this Category)
11722
Category 2 - DIAGNOSTIC PROCEDURES AND INVESTIGATIONSGroup D1 - MISCELLANEOUS DIAGNOSTIC PROCEDURES AND INVESTIGATIONS
Subgroup 6 – CARDIOVASCULAR
IMPLANTED ECG LOOP RECORDING, for investigation of recurrent unexplained syncope, including re-programming of device, retrieval of stored data, analysis, interpretation and report, not in association with item 38285.
Fee: $34.75 Benefit: 75% = $26.10 85% = $29.55Source: Department of Human Services – Medicare Australia, accessed 8 March 2016
Table A-3.2 Explanatory Notes relating to MBS items for AECGCategory 3 - THERAPEUTIC PROCEDURES
T8.62 Implantable ECG Loop Recorder – (item 38285)The fee for implantation of the loop recorder (item 38285) covers the initial programming and testing of the device for satisfactory rhythm capture. Benefits are payable only once per day.The term "recurrent" refers to more than one episode of syncope, where events occur at intervals of 1 week or longer. The term "other available cardiac investigations" includes the following:- a complete history and physical examination that excludes a primary neurological cause of syncope and does not exclude a cardiac cause;- (ECG) (items 11700-11702);- echocardiography (items 55113-55115);- continuous ECG recording or ambulatory ECG monitoring (items 11708-11711);- up-right tilt table test (item 11724); and- cardiac electrophysiological study, unless there is reasonable medical reason to waive this requirement (item 38209).Source: Department of Human Services – Medicare Australia, accessed 8 March 2016
MBS Review – Ambulatory Electrocardiography Review Report Page 258

May 2016
Table A-3.3 shows when the in-scope MBS item numbers were included on the MBS.
Table A-3.3 Item number, descriptor and schedule fee start dates for MBS item numbers
MBS item number Type of date Date
11708 Item Start Date 01 Jul 1993
Current Descriptor Start Date 01 Mar 2013
Current Schedule Fee Start Date 01 Nov 2012
11709 Item Start Date 01 Dec 1991
Current Descriptor Start Date 01 Mar 2013
Current Schedule Fee Start Date 01 Nov 2012
11710 Item Start Date 31 Oct 1992
Current Descriptor Start Date 01 Jul 1993
Current Schedule Fee Start Date 01 Nov 2012
11711 Item Start Date 01 Jul 1993
Current Descriptor Start Date 01 Jul 1993
Current Schedule Fee Start Date 01 Nov 2012
38285 Item Start Date 01 Nov 2004
Current Descriptor Start Date 01 Nov 2004
Current Schedule Fee Start Date 01 Nov 2012
11722 Item Start Date 01 Nov 2004
Current Descriptor Start Date 01 Nov 2004
Current Schedule Fee Start Date 01 Nov 2012Source: Department of Human Services – Medicare Australia, accessed 8 March 2016Note: item start date refers to the date when the item was allocated a 5-digit number (previously 4-digits). Hence some of these services may have been available prior to the item start date provided on MBS Australia online.
A-3.2 MBS Data analysisTable A-3.4 Growth in AECG services
MBS item Growth period Services Benefits paid
11708 1 Year Growth, 2013-14 to 2014-15 5.7% 5.8%
5 Year Growth, 2010-11 to 2014-15 160.8% 166.8%
10 Year Growth, 2004-05 to 2014-15 105.9% 135.7%
11709 1 Year Growth, 2013-14 to 2014-15 11.5% 11.4%
5 Year Growth, 2010-11 to 2014-15 56.7% 63.8%
10 Year Growth, 2004-05 to 2014-15 145.6% 191.7%
11710 1 Year Growth, 2013-14 to 2014-15 -0.6% -0.6%
5 Year Growth, 2010-11 to 2014-15 13.0% 18.6%
10 Year Growth, 2004-05 to 2014-15 69.5% 104.7%
11711 1 Year Growth, 2013-14 to 2014-15 -1.2% -0.1%
5 Year Growth, 2010-11 to 2014-15 46.5% 58.2%
10 Year Growth, 2004-05 to 2014-15 225.2% 280.2%
38285 1 Year Growth, 2013-14 to 2014-15 97.0% 96.3%
5 Year Growth, 2010-11 to 2014-15 237.5% 252.3%
10 Year Growth, 2004-05 to 2014-15 1864% 2173%
11722 1 Year Growth, 2013-14 to 2014-15 51.8% 52.3%
5 Year Growth, 2010-11 to 2014-15 193.9% 208.8%
10 Year Growth, 2004-05 to 2014-15 4087% 4913%
MBS Review – Ambulatory Electrocardiography Review Report Page 259

May 2016
Source: Department of Human Services, Medicare Australia Statistics. Accessed 8 March 2016Note: These data are determined by the date the service was processed by Medicare Australia, not the date the service was provided.
Table A-3.5 Number of AECG services by state/territory, 2014-15
MBS item NSW VIC QLD SA WA TAS ACT NT Total
11708 3,621 773 1,604 109 70 0 37 2 6,216
11709 101,966 79,029 50,865 17,903 17,067 4,389 4,215 2,209 277,643
11710 727 864 968 322 1,194 192 8 33 4,308
11711 166 139 362 4 124 10 7 1 813
11722 1,773 1,522 1,520 1,471 559 170 58 3 7,076
38285 528 380 339 300 308 49 37 3 1,944Source: Department of Human Services, Medicare Australia Statistics. Accessed 8 March 2016Note: These data are determined by the date the service was processed by Medicare Australia, not the date the service was provided.
Table A-3.6 In-hospital and out-of-hospital services for MBS item 11708, 2010-11 to 2014-15
Service location 2010-11 2011-12 2012-13 2013-14 2014-15 5-year growth
In-hospital 358 864 1,354 1,997 2,144 417%
Out-of -hospital 2,025 2,916 3,685 3,886 4,072 113%
% of services that are in hospital
15% 23% 27% 34% 34% –
Total 2383 3780 5039 5883 6216 167%Source: Department of Health, Medical Benefits Division, Medicare Financing & Listing Branch, MBS Analytics Section. Data received 21 April 2016.Note: These data are determined by the date the service was processed by Medicare Australia, not the date the service was provided.
MBS Review – Ambulatory Electrocardiography Review Report Page 260

May 2016
APPENDIX 4: LITERATURE SEARCH
A-4.1 Clinical evidence search
The literature search strategies focused on the safety and effectiveness of AECG, and the cost implications associated with AECG. The terms used to identify studies were restricted to those that identify ambulatory ECG devices, as no population or comparator restrictions are necessary. Consequently, a single search for clinical or economic studies or guidelines could be performed for each database, with a final filter specific to each study type applied at the end (EMBASE, Table A-4.1; Medline, Table A-4.2). The filter for clinical studies identified systematic reviews and meta-analyses, and an additional search in PubMed was performed for clinical studies, using the search filter for systematic reviews made available by PubMed (Table A-4.3). The Cochrane Library search strategy for HTAs and economic evaluations is shown in Table A-4.4
Table A-4.1 EMBASE search strategy for clinical studies (systematic reviews), economic studies and guidelines
# Search terms for Ovid EMBASE (19 January 2016) Citations1 exp ambulatory monitoring/ 9,5162 (ambulatory or wireless or mobile or remote or outpatient or out-patient or out patient or out-of-hospital
or handheld or hand-held or hand held).mp. [mp=title, abstract, heading word, drug trade name, original title, device manufacturer, drug manufacturer, device trade name, keyword]
494,090
3 1 or 2 494,0904 exp electrocardiography monitoring/ or exp electrocardiography/ or electrocardiography.mp. 168,3995 (AECG or ECG* or EKG* or electrocardio*).mp. [mp=title, abstract, heading word, drug trade name,
original title, device manufacturer, drug manufacturer, device trade name, keyword]280,216
6 4 or 5 290,2487 3 and 6 14,3728 exp Holter monitoring/ or exp Holter monitor/ or holter.mp. 18,6969 7 or 8 30,36410 exp electrocardiography monitoring/ or exp electrocardiography/ or electrocardiography.mp. 168,39911 (AECG or ECG* or EKG* or electrocardio*).mp. [mp=title, abstract, heading word, drug trade name,
original title, device manufacturer, drug manufacturer, device trade name, keyword]280,216
12 10 or 11 290,24813 ELR.mp. [mp=title, abstract, heading word, drug trade name, original title, device manufacturer, drug
manufacturer, device trade name, keyword]619
14 12 and 13 2215 ((ELR and loop*) or (ELR and event) or (ELR and cardiac) or (ELR and monitor*) or (ELR and
recorder*) or (ELR and recording)).mp. [mp=title, abstract, heading word, drug trade name, original title, device manufacturer, drug manufacturer, device trade name, keyword]
76
16 ((event adj2 loop*) or (event adj2 monitor*) or (event adj2 recorder*) or (event adj2 recording)).mp. [mp=title, abstract, heading word, drug trade name, original title, device manufacturer, drug manufacturer, device trade name, keyword]
2,517
17 ((external adj2 loop*) or (external adj2 monitor*) or (external adj2 recorder*) or (external adj2 recording)).mp. [mp=title, abstract, heading word, drug trade name, original title, device manufacturer, drug manufacturer, device trade name, keyword]
1,508
18 ((transtelephonic or trans-telephonic or trans telephonic) adj3 (ECG* or EKG* or electrocardio* or event or cardiac or monitor* or recorder* or recording)).mp. [mp=title, abstract, heading word, drug trade name, original title, device manufacturer, drug manufacturer, device trade name, keyword]
331
19 (MCOT or mobile cardiac telemetry or mobile cardiac outpatient telemetry).mp. [mp=title, abstract, heading word, drug trade name, original title, device manufacturer, drug manufacturer, device trade name, keyword]
62
20 (wireless adj2 ECG adj2 transmission).mp. [mp=title, abstract, heading word, drug trade name, original title, device manufacturer, drug manufacturer, device trade name, keyword]
8
MBS Review – Ambulatory Electrocardiography Review Report Page 261

May 2016
# Search terms for Ovid EMBASE (19 January 2016) Citations21 or/14-20 4,39522 ((loop* adj3 recorder*) or (loop* adj3 recording)).mp. [mp=title, abstract, heading word, drug trade
name, original title, device manufacturer, drug manufacturer, device trade name, keyword]1,125
23 (loop* adj2 monitor*).mp. [mp=title, abstract, heading word, drug trade name, original title, device manufacturer, drug manufacturer, device trade name, keyword]
182
24 22 or 23 1,25225 exp electrocardiography monitoring/ or exp electrocardiography/ or electrocardiography.mp. 168,39926 (AECG or ECG* or EKG* or electrocardio*).mp. [mp=title, abstract, heading word, drug trade name,
original title, device manufacturer, drug manufacturer, device trade name, keyword]280,216
27 25 or 26 290,24828 ILR.mp. [mp=title, abstract, heading word, drug trade name, original title, device manufacturer, drug
manufacturer, device trade name, keyword]580
29 27 and 28 25530 implantable cardiac monitor.mp. or exp implantable cardiac monitor/ 10,60431 (ILR and loop).mp. [mp=title, abstract, heading word, drug trade name, original title, device
manufacturer, drug manufacturer, device trade name, keyword]406
32 ((implant* or insert*) adj6 (cardiac or ECG* or EKG* or electrocardio* or event or realtime or real time or real-time) adj6 (record* or monitor*)).mp. [mp=title, abstract, heading word, drug trade name, original title, device manufacturer, drug manufacturer, device trade name, keyword]
11,468
33 or/29-32 11,71534 exp telemedicine/ or telemedicine.mp. or exp telemetry/ or telemetry.mp. 46,10435 exp electrocardiography monitoring/ or exp electrocardiography/ or electrocardiography.mp. or (AECG
or ECG* or EKG* or electrocardio*).mp.290,248
36 34 and 35 4,23337 (cardiac adj3 telemetry).mp. [mp=title, abstract, heading word, drug trade name, original title, device
manufacturer, drug manufacturer, device trade name, keyword]255
38 (telemetry adj3 (AECG or ECG* or EKG* or electrocardio*)).mp. [mp=title, abstract, heading word, drug trade name, original title, device manufacturer, drug manufacturer, device trade name, keyword]
494
39 (ambulatory adj2 cardiac adj2 monitor*).mp. [mp=title, abstract, heading word, drug trade name, original title, device manufacturer, drug manufacturer, device trade name, keyword]
79
40 (wireless adj2 cardiac adj2 monitor*).mp. [mp=title, abstract, heading word, drug trade name, original title, device manufacturer, drug manufacturer, device trade name, keyword]
13
41 or/36-40 4,44042 9 or 21 or 24 or 33 or 41 48,68843 limit 42 to (human and english language and yr="1999 -Current") 28,170
Systematic reviews/health technology assessments44 exp meta-analysis/ or meta-analysis.mp. or exp meta analysis/ or meta analysis.mp. or exp metaanalysis/
or metaanalysis.mp. or (exp systematic review/ or systematic review.mp.) or pooled analysis.mp. [mp=title, abstract, heading word, drug trade name, original title, device manufacturer, drug manufacturer, device trade name, keyword]
235,298
45 43 and 44 377Economic studies46 exp cost effectiveness analysis/ or cost effectiveness analysis.mp. or exp cost benefit analysis/ or cost
benefit analysis.mp. or exp economic evaluation/ or economic evaluation.mp. or exp health economics/ or health economics.mp. or exp cost minimization analysis/ or cost minimi#ation analysis.mp. or exp cost utility analysis/ or cost utility analysis.mp. or exp quality adjusted life year/ or quality adjusted life year.mp. or qaly.mp. or life year saved.mp. or exp health care cost/ or health care cost.mp.
683,355
47 43 and 46 820Guidelines48 exp practice guideline/ or practice guideline.ab,ti. or treatment guideline*.ab,ti. or management
guideline*.ab,ti. or clinical guideline*.ab,ti. or evidence based guideline*.ab,ti. or consensus guideline*.ab,ti. or consensus statement.ab,ti. or position statement.mp. or position paper.mp. or practice parameter.mp. or policy statement.mp. or guideline.ti. or white paper.mp. or clinical pathway.mp. or consensus development/
387,717
49 43 and 48 763
MBS Review – Ambulatory Electrocardiography Review Report Page 262

May 2016
# Search terms for Ovid EMBASE (19 January 2016) Citations50 limit 49 to yr="2005 -Current" 633
Level II studies a
51 crossover procedure/ or double blind procedure/ or randomized controlled trial/ or single blind procedure/ or randomly.ab,ti. or randomi*.ab,ti. or trial.ab,ti.
991,522
52 43 and 51 2,47753 (conference proceeding or conference proceeding editorial or conference proceeding note or editorial or
journal conference abstract or journal editorial or journal letter or letter or proceeding).pt. or case report/5,417,740
54 52 not 53 1,476a The search for Level II studies was performed on 17 February 2016.
Table A-4.2 Medline search strategy for clinical studies (systematic reviews), economic studies and guidelines
# Search terms for Ovid Medline (19 January 2016) Citations1 exp Electrocardiography, Ambulatory/ 9,3732 (ambulatory or wireless or mobile or remote or outpatient or out-patient or out patient or out-of-hospital
or handheld or hand-held or hand held).mp. [mp=title, abstract, original title, name of substance word, subject heading word, keyword heading word, protocol supplementary concept word, rare disease supplementary concept word, unique identifier]
322,223
3 1 or 2 322,2234 exp electrocardiography/ or electrocardiography.mp. 186,8515 (AECG or ECG* or EKG* or electrocardio*).mp. [mp=title, abstract, original title, name of substance
word, subject heading word, keyword heading word, protocol supplementary concept word, rare disease supplementary concept word, unique identifier]
214,613
6 4 or 5 218,2897 3 and 6 16,1158 exp monitoring, ambulatory/ 22,8499 8 and 6 10,05110 Holter.mp. 8,40211 7 or 9 or 10 20,23812 exp electrocardiography/ or electrocardiography.mp. 186,85113 (AECG or ECG* or EKG* or electrocardio*).mp. [mp=title, abstract, original title, name of substance
word, subject heading word, keyword heading word, protocol supplementary concept word, rare disease supplementary concept word, unique identifier]
214,613
14 12 or 13 218,28915 ELR.mp. [mp=title, abstract, original title, name of substance word, subject heading word, keyword
heading word, protocol supplementary concept word, rare disease supplementary concept word, unique identifier]
445
16 14 and 15 1117 ((ELR and loop*) or (ELR and event) or (ELR and cardiac) or (ELR and monitor*) or (ELR and
recorder*) or (ELR and recording)).mp. [mp=title, abstract, original title, name of substance word, subject heading word, keyword heading word, protocol supplementary concept word, rare disease supplementary concept word, unique identifier]
48
18 ((event adj2 loop*) or (event adj2 monitor*) or (event adj2 recorder*) or (event adj2 recording)).mp. [mp=title, abstract, original title, name of substance word, subject heading word, keyword heading word, protocol supplementary concept word, rare disease supplementary concept word, unique identifier]
1,444
19 ((external adj2 loop*) or (external adj2 monitor*) or (external adj2 recorder*) or (external adj2 recording)).mp. [mp=title, abstract, original title, name of substance word, subject heading word, keyword heading word, protocol supplementary concept word, rare disease supplementary concept word, unique identifier]
1,016
20 ((transtelephonic or trans-telephonic or trans telephonic) adj3 (ECG* or EKG* or electrocardio* or event or cardiac or monitor* or recorder* or recording)).mp. [mp=title, abstract, original title, name of substance word, subject heading word, keyword heading word, protocol supplementary concept word, rare disease supplementary concept word, unique identifier]
218
21 (MCOT or mobile cardiac telemetry or mobile cardiac outpatient telemetry).mp. [mp=title, abstract, original title, name of substance word, subject heading word, keyword heading word, protocol
27
MBS Review – Ambulatory Electrocardiography Review Report Page 263

May 2016
# Search terms for Ovid Medline (19 January 2016) Citationssupplementary concept word, rare disease supplementary concept word, unique identifier]
22 (wireless adj2 ECG adj2 transmission).mp. [mp=title, abstract, original title, name of substance word, subject heading word, keyword heading word, protocol supplementary concept word, rare disease supplementary concept word, unique identifier]
4
23 or/16-22 2,70424 ((loop* adj3 recorder*) or (loop* adj3 recording)).mp. [mp=title, abstract, original title, name of
substance word, subject heading word, keyword heading word, protocol supplementary concept word, rare disease supplementary concept word, unique identifier]
479
25 (loop* adj2 monitor*).mp. [mp=title, abstract, original title, name of substance word, subject heading word, keyword heading word, protocol supplementary concept word, rare disease supplementary concept word, unique identifier]
109
26 24 or 25 56027 exp electrocardiography/ or electrocardiography.mp. 186,85128 (AECG or ECG* or EKG* or electrocardio*).mp. [mp=title, abstract, original title, name of substance
word, subject heading word, keyword heading word, protocol supplementary concept word, rare disease supplementary concept word, unique identifier]
214,613
29 27 or 28 218,28930 ILR.mp. [mp=title, abstract, original title, name of substance word, subject heading word, keyword
heading word, protocol supplementary concept word, rare disease supplementary concept word, unique identifier]
240
31 29 and 30 12632 (ILR and loop).mp. [mp=title, abstract, original title, name of substance word, subject heading word,
keyword heading word, protocol supplementary concept word, rare disease supplementary concept word, unique identifier]
137
33 ((implant* or insert*) adj6 (cardiac or ECG* or EKG* or electrocardio* or event or realtime or real time or real-time) adj6 (record* or monitor*)).mp. [mp=title, abstract, original title, name of substance word, subject heading word, keyword heading word, protocol supplementary concept word, rare disease supplementary concept word, unique identifier]
438
34 or/31-33 56235 exp telemedicine/ or telemedicine.mp. or exp telemetry/ or telemetry.mp. 30,08436 exp electrocardiography/ or electrocardiography.mp. or (AECG or ECG* or EKG* or
electrocardio*).mp.218,289
37 35 and 36 2,75138 (cardiac adj3 telemetry).mp. [mp=title, abstract, original title, name of substance word, subject heading
word, keyword heading word, protocol supplementary concept word, rare disease supplementary concept word, unique identifier]
107
39 (telemetry adj3 (AECG or ECG* or EKG* or electrocardio*)).mp. [mp=title, abstract, original title, name of substance word, subject heading word, keyword heading word, protocol supplementary concept word, rare disease supplementary concept word, unique identifier]
238
40 (ambulatory adj2 cardiac adj2 monitor*).mp. [mp=title, abstract, original title, name of substance word, subject heading word, keyword heading word, protocol supplementary concept word, rare disease supplementary concept word, unique identifier]
44
41 (wireless adj2 cardiac adj2 monitor*).mp. [mp=title, abstract, original title, name of substance word, subject heading word, keyword heading word, protocol supplementary concept word, rare disease supplementary concept word, unique identifier]
5
42 or/37-41 2,84143 11 or 23 or 26 or 34 or 42 24,77944 limit 43 to (english language and humans and yr="1999 -Current") 10,857
Systematic reviews/health technology assessments45 exp meta-analysis/ or meta-analysis.mp. or metaanalysis.mp. or systematic review.mp. or systematic
literature review.mp. or pooled analysis.mp. or (exp review literature as topic/ and systematic.mp.)123,163
46 44 and 45 79Economic studies47 (exp costs/ and cost analysis/) or cost effectiveness analysis.mp. or cost benefit analysis.mp. or
economic evaluation.mp. or health economics.mp. or cost minimi#ation analysis.mp. or cost utility analysis.mp. or exp quality-adjusted life years/ or Quality-adjusted life year*.mp. or qaly.mp. or life year saved.mp.
112,778
MBS Review – Ambulatory Electrocardiography Review Report Page 264

May 2016
# Search terms for Ovid Medline (19 January 2016) Citations48 44 and 47 99
Guidelines49 exp guidline/ or practice guideline.ab,ti. or treatment guideline*.ab,ti. or management guideline*.ab,ti.
or clinical guideline*.ab,ti. or evidence based guideline*.ab,ti. or consensus guideline*.ab,ti. or consensus statement.ab,ti. or position statement.mp. or position paper.mp. or practice parameter.mp. or policy statement.mp. or guideline.ti. or white paper.mp. or clinical pathway.mp. or exp consensus/
45,574
50 44 and 49 5051 limit 49 to yr="2005 -Current" 42
Level II studiesa
52 randomized controlled trial.pt. or controlled clinical trial.pt. or exp Randomized Controlled Trial/ or randomi*.ab,ti. or randomly.ab,ti.
768,501
53 case reports.pt. or editorial.pt. or letter.pt. 2,821,52854 52 not 53 754,18255 54 and 44 1,465
a The search for Level II studies was performed on 17 February 2016.
Table A-4.3 PubMed search strategy for systematic reviews of clinical studies
# Queries for PubMed (02 February 2016) Citations1 ambulatory electrocardiography[MESH] 9,3752 (ambulatory OR wireless OR mobile OR remote OR outpatient OR "out-patient" OR "out-of-hospital") 391,5963 (ECG OR ECGs OR EKG OR EKGs) 208,1694 (electrocardiogram OR electrocardiograph OR electrocardiograms OR electrocardiographs or
electrocardiographic OR electrocardiography)207,628
5 (#3 OR #4) 223,9936 (#2 AND #5) 16,9897 AECG 1308 (#1 OR #6 OR #7) 17,0379 Holter 9,53310 (ELR AND loop) 2911 (ELR AND event) 712 (ELR AND cardiac) 2213 (ELR and monitor) 1314 event loop recorder 7815 event loop monitor 9916 ("event recorder" OR "event recorders" OR "event monitor" OR "event monitors") 27417 ("cardiac event monitor" OR "cardiac event recorder" OR "cardiac loop monitor" OR "cardiac loop
recorder")620
18 (transtelephonic OR trans-telephonic) 29319 (#10 OR #11 OR #12 OR #13 OR #14 OR #15 OR #16 OR #17 OR #18) 1,18620 (ILR AND loop) 16421 implantable loop recorder 32422 implantable loop monitor 29523 ("implantable cardiac monitor" OR "implantable diagnostic monitor" OR "implantable ECG" OR
"implantable EKG" OR "insertable ECG" "insertable EKG" OR "insertable cardiac recorder" OR "insertable cardiac monitor" OR "internal loop recorder")
62
24 ("implantable cardiac" AND (monitor OR recorder)) 1,50225 (#20 OR #21 OR #22 OR #23 OR #24) 1,66526 "loop recorder" 39427 "loop monitor" 1128 (#26 OR #27) 40429 telemetry 13,02230 (#29 AND #5) 2,284
MBS Review – Ambulatory Electrocardiography Review Report Page 265

May 2016
# Queries for PubMed (02 February 2016) Citations31 (#29 AND (cardiac OR cardio*)) 3,83232 MCOT 3033 ((real-time AND cardiac AND monitor) OR ("real-time AND cardio* and monitor)) 1,12434 (#30 OR #31 OR #32 OR #33) 5,51535 (#9 OR #19 OR #25 OR #28 OR #34) 16,61136 (#8 OR #9 OR #19 OR #25 OR #28 OR #34) 28,04237 #36 AND systematic[sb] 287
Table A-4.4 Cochrane Library search strategy for HTAs and economic evaluations# Queries for Cochrane Library (03 February 2016) Citations1 ambulatory ecg 5022 Holter 1,7953 MeSH descriptor: [Electrocardiography, Ambulatory] explode all trees 1,1044 electrocardiography and (mobile or remote or wireless or out-patient or handheld) 1035 (electrocardio* or ECG or EKG) and (mobile or remote or wireless or out-patient or handheld) 2696 (ELR and loop*) or (ELR and event) or (ELR and cardiac) or (ELR and monitor*) or (ELR and
recorder*) or (ELR and recording)3
7 event loop* or "event monitor*" or "event recorder*" or "event recording" 4038 MCOT or "mobile cardiac telemetry" or "mobile cardiac outpatient telemetry" 109 loop* recorder* or "loop* recording" 7410 loop* monitor* 511 implantable cardiac monitor 22212 cardiac and telemetry 14213 #1 or #2 or #3 or #4 or #5 or #6 or #7 or #8 or #9 or #10 or #11 or #12 3,47914 #14: Technology Assessments (from 1999) 2515 #15: Economic Evaluations (from 1999) 42
Abbreviations: HTA, health technology assessment
MBS Review – Ambulatory Electrocardiography Review Report Page 266

May 2016
APPENDIX 5: EVIDENCE HIERARCHY
The levels of evidence hierarchy developed by the NHMRC (Table A-5.1) were used to select studies according to study design. Preliminary searches of the literature indicated that diagnostic accuracy of AECG monitoring is addressed using studies of diagnostic yield. As such, the PICO criteria for this Review included diagnostic yield as an immediate outcome, together with the intermediate outcome of change in patient management, and patient-oriented outcomes such as survival, recurrence of symptoms and quality of life.
Table A-5.1 Designations of levels of evidence for interventional and diagnostic accuracy studies
Level Intervention Diagnostic accuracya
Ib A systematic review of Level II studies A systematic review of Level II studies
II A randomised controlled trial A study of test accuracy with: an independent, blinded comparison with a valid reference standard,c among consecutive persons with a defined clinical presentationd
III-1 A pseudo-randomised controlled trial (i.e. alternate allocation or some other method)
A study of test accuracy with: an independent, blinded comparison with a valid reference standard,c among non-consecutive persons with a defined clinical presentationd
III-2 A comparative study with concurrent controls: Non-randomised, experimental triale
Cohort study Case-control study Interrupted time series with a control group
A comparison with reference standard that does not meet the criteria required for Level II and III-1 evidence
III-3 A comparative study without concurrent controls: Historical control study Two or more single-arm studyf
Interrupted time series without a parallel control group
Diagnostic case-control studyd
IV Case series with either post-test or pre-test/post-test outcomes
Study of diagnostic yield (no reference standard)g
Source: National Health and Medical Research Council. NHMRC levels of evidence and grades for recommendations for developers of guidelines. Canberra: National Health and Medical Research Council, 2009.a These levels of evidence apply only to studies of assessing the accuracy of diagnostic or screening tests. To assess the overall effectiveness of a diagnostic test there also needs to be a consideration of the impact of the test on patient management and health outcomes. The evidence hierarchy given in the ‘Intervention’ column should be used when assessing the impact of a diagnostic test on health outcomes relative to an existing method of diagnosis/comparator test(s). b A systematic review will only be assigned a level of evidence as high as the studies it contains, excepting where those studies are of Level II evidence. Systematic reviews of Level II evidence provide more data than the individual studies and any meta-analyses will increase the precision of the overall results, reducing the likelihood that the results are affected by chance. Systematic reviews of lower level evidence present results of likely poor internal validity and thus are rated on the likelihood that the results have been affected by bias, rather than whether the systematic review itself is of good quality. Systematic review quality should be assessed separately. A systematic review should consist of at least two studies. In systematic reviews that include different study designs, the overall level of evidence should relate to each individual outcome/result, as different studies (and study designs) might contribute to each different outcome.c The validity of the reference standard should be determined in the context of the disease under review. Criteria for determining the validity of the reference standard should be pre-specified. This can include the choice of the reference standard(s) and its timing in relation to the index test. The validity of the reference standard can be determined through quality appraisal of the study.d Well-designed population based case-control studies (e.g. population based screening studies where test accuracy is assessed on all cases, with a random sample of controls) do capture a population with a representative spectrum of disease and thus fulfil the requirements for a valid assembly of patients. However, in some cases the population assembled is not representative of the use of the test in practice. In diagnostic case-control studies a selected sample of patients already known to have the disease are compared with a separate group of normal/healthy people known to be free of the disease. In this situation patients with borderline or mild expressions of the disease, and conditions mimicking the disease are excluded, which can lead to exaggeration of both sensitivity and specificity. This is called spectrum bias or spectrum effect because the spectrum of study participants will not be representative of patients seen in practice.e This also includes controlled before-and-after (pre-test/post-test) studies, as well as adjusted indirect comparisons (i.e. utilise A vs B and B vs C, to determine A vs C with statistical adjustment for B).f Comparing single-arm studies i.e. case series from two studies. This would also include unadjusted indirect comparisons (i.e. utilise A vs B and B vs C, to determine A vs C but where there is no statistical adjustment for B).g Studies of diagnostic yield provide the yield of diagnosed patients, as determined by an index test, without confirmation of the accuracy of this diagnosis by a reference standard. These may be the only alternative when there is no reliable reference standard.
MBS Review – Ambulatory Electrocardiography Review Report Page 267

May 2016
APPENDIX 6: AMSTAR QUALITY ASSESSMENT
Table A-6.1 shows the 11 items considered in the AMSTAR tool. The results of the quality assessment for the 13 included systematic reviews/HTAs are presented in Table A-6.2.
For each of the included systematic reviews/HTAs, an overall score was calculated (simply the sum of the individual item scores), with a maximum possible score of 11/11. When one or more of the AMSTAR items were not applicable to a particular publication, the denominator was reduced to reflect the number of relevant criteria. For example, if a systematic review did not conduct a meta-analysis, the item pertaining to the appropriate pooling of results was not applicable and the overall quality score was out of 10.
Table A-6.1 The AMSTAR measurement tool for assessing the methodological quality of SRs
Question Answer1. Was an 'a priori' design provided?The research question and inclusion criteria should be established before the conduct of the review.
Note: Need to refer to a protocol, ethics approval, or pre-determined/a priori published research objectives to score a “yes.”
Yes No Can’t answer Not applicable
2. Was there duplicate study selection and data extraction?There should be at least two independent data extractors and a consensus procedure for disagreements should be in place.
Note: 2 people do study selection, 2 people do data extraction, consensus process or one person checks the other’s work.
Yes No Can’t answer Not applicable
3. Was a comprehensive literature search performed?At least two electronic sources should be searched. The report must include years and databases used (e.g., Central, EMBASE, and MEDLINE). Key words and/or MESH terms must be stated and where feasible the search strategy should be provided. All searches should be supplemented by consulting current contents, reviews, textbooks, specialized registers, or experts in the particular field of study, and by reviewing the references in the studies found.
Note: If at least 2 sources + one supplementary strategy used, select “yes” (Cochrane register/Central counts as 2 sources; a grey literature search counts as supplementary).
Yes No Can’t answer Not applicable
4. Was the status of publication (i.e. grey literature) used as an inclusion criterion?The authors should state that they searched for reports regardless of their publication type. The authors should state whether or not they excluded any reports (from the systematic review), based on their publication status, language etc.
Note: If review indicates that there was a search for “grey literature” or “unpublished literature,” indicate “yes.” SIGLE database, dissertations, conference proceedings, and trial registries are all considered grey for this purpose. If searching a source that contains both grey and non-grey, must specify that they were searching for grey/unpublished lit.
Yes No Can’t answer Not applicable
5. Was a list of studies (included and excluded) provided?A list of included and excluded studies should be provided.
Note: Acceptable if the excluded studies are referenced. If there is an electronic link to the list but the link is dead, select “no.”
Yes No Can’t answer Not applicable
6. Were the characteristics of the included studies provided?In an aggregated form such as a table, data from the original studies should be provided on the participants, interventions and outcomes. The ranges of characteristics in all the studies analyzed e.g., age, race, sex, relevant socioeconomic data, disease status, duration, severity, or other diseases should be reported.
Note: Acceptable if not in table format as long as they are described as above.
Yes No Can’t answer Not applicable
7. Was the scientific quality of the included studies assessed and documented?'A priori' methods of assessment should be provided (e.g., for effectiveness studies if the author(s) chose to include only randomized, double blind, placebo controlled studies, or allocation concealment as inclusion criteria); for other types of studies alternative items will be relevant.
Yes No Can’t answer Not applicable
MBS Review – Ambulatory Electrocardiography Review Report Page 268

May 2016
Question Answer
Note: Can include use of a quality scoring tool or checklist, e.g., Jadad scale, risk of bias, sensitivity analysis, etc., or a description of quality items, with some kind of result for EACH study (“low” or “high” is fine, as long as it is clear which studies scored “low” and which scored “high”; a summary score/range for all studies is not acceptable).
8. Was the scientific quality of the included studies used appropriately in formulating conclusions?The results of the methodological rigor and scientific quality should be considered in the analysis and the conclusions of the review, and explicitly stated in formulating recommendations.
Note: Might say something such as “the results should be interpreted with caution due to poor quality of included studies.” Cannot score “yes” for this question if scored “no” for question 7.
Yes No Can’t answer Not applicable
9. Were the methods used to combine the findings of studies appropriate?For the pooled results, a test should be done to ensure the studies were combinable, to assess their homogeneity (i.e., Chi-squared test for homogeneity, I2). If heterogeneity exists a random effects model should be used and/or the clinical appropriateness of combining should be taken into consideration (i.e., is it sensible to combine?).
Note: Indicate “yes” if they mention or describe heterogeneity, i.e., if they explain that they cannot pool because of heterogeneity/variability between interventions.
Yes No Can’t answer Not applicable
10. Was the likelihood of publication bias assessed?An assessment of publication bias should include a combination of graphical aids (e.g., funnel plot, other available tests) and/or statistical tests (e.g., Egger regression test, Hedges-Olken).
Note: If no test values or funnel plot included, score “no”. Score “yes” if mentions that publication bias could not be assessed because there were fewer than 10 included studies.
Yes No Can’t answer Not applicable
11. Was the conflict of interest included?Potential sources of support should be clearly acknowledged in both the systematic review and the included studies.
Note: To get a “yes,” must indicate source of funding or support for the systematic review AND for each of the included studies.
Yes No Can’t answer Not applicable
Source: Shea et al (2007), Table 2Abbreviations: SR, systematic review.Note: Additional notes (in italics) made by Michelle Weir, Julia Worswick, and Carolyn Wayne based on conversations with Bev Shea and/or Jeremy Grimshaw in June and October 2008 and July and September 2010.
MBS Review – Ambulatory Electrocardiography Review Report Page 269
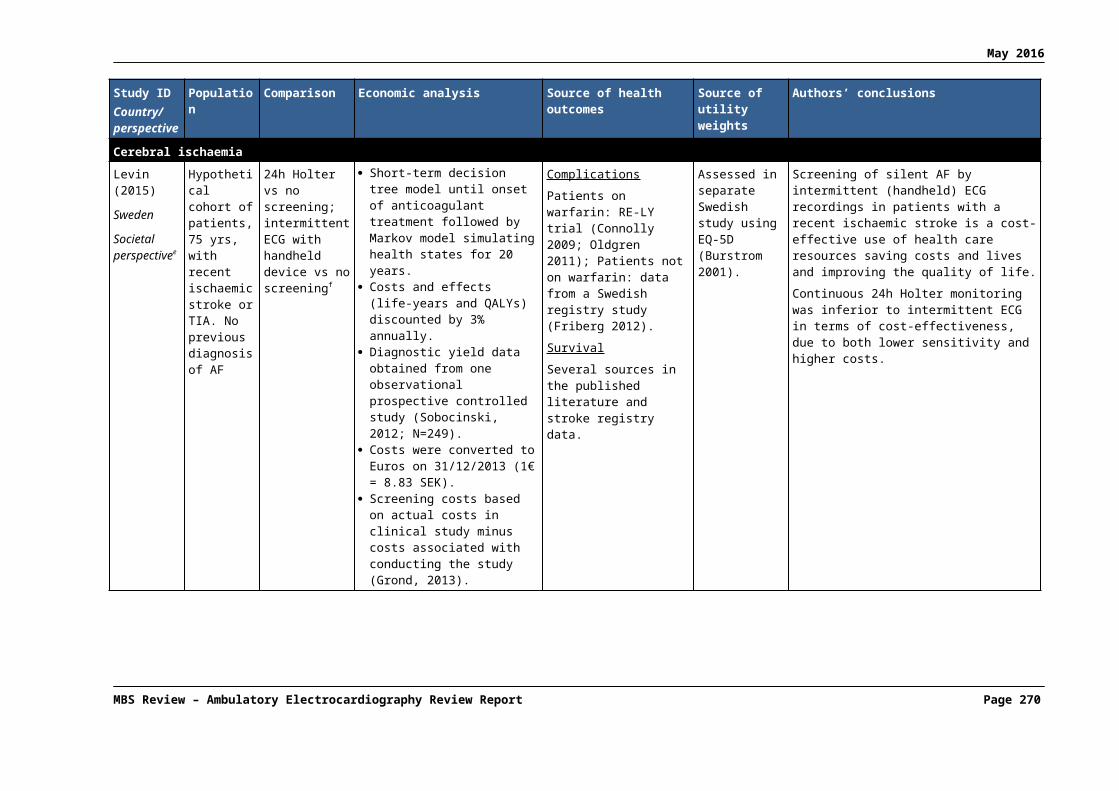
May 2016
Table A-6.2 AMSTAR scores of included systematic reviews
Author, Year
Overall AMSTAR
score a
(1)Provided
study design
(2)Duplicate
study selection
(3)Broad
literature search
(4)Considered
status of publication
(5)List of studies
(6)Provided
study character-
istics
(7)Assessed scientific quality
(8)Considered quality in
report
(9)Methods to
combine appropriate
(10)Assessed
publication bias
(11)Stated
conflict of interest
Afzal (2015) 6/11 0 1 1 0 0 1 1 1 1 0 0
AHRQ (2007)
7/11 0 CA 1 1 1 1 1 1 1 0 0
Bell (2000) 0/10 0 CA 0 0 0 0 0 0 NA 0 0
Harris (2012) 2/10 0 CA 1 0 0 1 0 0 NA 0 0
Hoefman (2010)
5/11 0 1 1 0 0 1 CAb 1 1 0 0
Kishore (2014)
7/11 0 1 1 1 1 1 0 0 1 1 0
Liao (2007) 4/11 0 1 1 0 0 1 0 0 1 0 0
Mappilakkandy (2013)
1/10 0 CA 1 0 0 0 0 0 NA 0 0
MSAC (2003)
7/10 0 1 1 1 1 1 1 1 NA 0 0
NICE (2012)Update of Westby 2010
2/10 CA CA 1 CA 0 1 0 0 NA 0 0
Parry (2010) 1/10 0 CA 1 0 0 0 0 0 NA 0 0
Sposato (2015)
8/11 1 1 1 0 0 1 1 1 1 1 0
Westby (2010)
9/11 1 1 1 1 1 1 1 1 1 0 0
Abbreviations: AHRQ, Agency for Healthcare Research and Quality; AMSTAR, Assessment of Multiple Systematic Reviews; CA, can’t answer; HTA, health technology assessment; MSAC, Medical Services Advisory Committee; NA, not applicable; NICE, National Institute for Health and Care Excellence.a 1 = Yes, 0 = No; maximum possible score is 11. Details of AMSTAR Score are described in Shea et al (2007).b Jadad used but quality assessment was not shown.
MBS Review – Ambulatory Electrocardiography Review Report Page 270

May 2016
APPENDIX 7: ACC/AHA 1999 GUIDELINE ON AECG
The 1999 ACC/AHA guideline on AECG (Crawford et al, 1999) classifies specific clinical situations according to whether there is evidence and/or general agreement that AECG is beneficial or not (see Table A-7.1 to Table A-7.4). The guideline states that the characteristics of the patient’s symptoms will often determine the choice of recording techniques. Specific indications for the different types of recorders were not defined in the guideline “because such detail would place undue limits on clinical judgment”. However, the general advice is that continuous AECG recording is particularly useful if symptoms occur daily or almost daily, and in patients who have complete loss of consciousness and would not be able to attach or activate an event recorder. Usually 24-hour recordings are performed, although yield may be increased slightly with longer recordings or repeated recordings. Many patients have symptoms occurring weekly or monthly; in these cases an event recorder is more useful.
Table A-7.1 1999 ACC/AHA indications where AECG is considered to be useful
Assess symptoms of cardiac arrhythmias
Recommendations Class of recommendation
Patients with unexplained syncope, near syncope, or episodic dizziness in whom the cause is not obvious.
I
Patients with unexplained recurrent palpitation. I
Assess antiarrhythmic therapy
Recommendations Class of recommendation
To assess antiarrhythmic drug response in individuals in whom baseline frequency of arrhythmia has been well characterised as reproducible and of sufficient frequency to permit analysis.
I
Assess pacemaker and ICD function
Recommendations Class of recommendation
Evaluation of frequent symptoms of palpitation, syncope, or near syncope to assess device function so as to exclude myopotential inhibition and pacemaker-mediated tachycardia and to assist in the programming of enhanced features such as rate responsivity and automatic mode switching.
I
Evaluation of suspected component failure or malfunction when device interrogation is not definitive in establishing a diagnosis.
I
To assess the response to adjunctive pharmacological therapy in patients receiving ICD therapy. I
Monitoring in paediatric patients
Recommendations Class of recommendation
Syncope, near syncope, or dizziness in patients with recognised heart disease, previously documented arrhythmia, or pacemaker dependency.
I
Syncope or near syncope associated with exertion when the cause is not established by other methods.
I
Evaluation of patients with hypertrophic or dilated cardiomyopathies. I
Evaluation of possible or documented long QT Syndromes. I
Palpitation in the patient with prior surgery for congenital heart disease and significant residual hemodynamic abnormalities.
I
Evaluation of antiarrhythmic drug efficacy during rapid somatic growth. I
Asymptomatic congenital complete AV block, nonpaced. I
MBS Review – Ambulatory Electrocardiography Review Report Page 271

May 2016
Source: ACC/AHA (1999), pp. 921-922, 929, 931-932, 936, 938. Refer to Appendix 9 for definitions of the Class of recommendation.Abbreviations: ACC, American College of Cardiology; AECG, ambulatory electrocardiography; AHA, American Heart Association; AV, atrioventricular; ICD, implantable cardioverter-defibrillator. Note: Class I = Conditions for which there is evidence and/or general agreement that a given procedure is useful and effective (“is recommended”).
Table A-7.2 1999 ACC/AHA indications for which AECG may be useful
Assess antiarrhythmic therapy
Recommendations Class of recommendation
To detect proarrhythmic responses to antiarrhythmic therapy in individuals at high risk. IIa
Ischaemia monitoring
Recommendations Class of recommendation
Patients with suspected variant angina. IIa
Monitoring in paediatric patients
Recommendations Class of recommendation
Syncope, near syncope, or sustained palpitation in the absence of a reasonable explanation and where there is no overt clinical evidence of heart disease.
IIa
Evaluation of cardiac rhythm after initiation of an antiarrhythmic therapy, particularly when associated with a significant proarrhythmic potential.
IIa
Evaluation of cardiac rhythm after transient AV block associated with heart surgery or catheter ablation.
IIa
Evaluation of rate-responsive or physiological pacing function in symptomatic patients. IIaSource: ACC/AHA (1999), pp. 921-922, 929, 931-932, 936, 938. Refer to Appendix 9 for definitions of the Class of recommendation.Abbreviations: ACC, American College of Cardiology; AECG, ambulatory electrocardiography; AHA, American Heart Association; AV, atrioventricular. Note: Class IIa = Clinical conditions for which AECG may be useful.
Table A-7.3 1999 ACC/AHA indications where the usefulness of AECG is less well established
Assess symptoms of cardiac arrhythmias
Recommendations Class of recommendation
Patients with episodic shortness of breath, chest pain, or fatigue that is not otherwise explained. IIb
Patients with neurological events when transient atrial fibrillation or flutter is suspected. IIb
Patients with symptoms such as syncope, near syncope, episodic dizziness, or palpitation in whom a probable cause other than an arrhythmia has been identified but in whom symptoms persist despite treatment of this other cause.
IIb
AECG arrhythmia detection to assess risk for future cardiac events in patients without symptoms from arrhythmia
Recommendations Class of recommendation
Post-MI patients with LV dysfunction IIb
Patients with CHF IIb
Patients with idiopathic hypertrophic cardiomyopathy IIb
Heart rate variability to assess risk for future cardiac events in patients without symptoms from arrhythmia
Recommendations Class of recommendation
Post-MI patients with LV dysfunction IIb
Patients with CHF IIb
Patients with idiopathic hypertrophic cardiomyopathy IIb
MBS Review – Ambulatory Electrocardiography Review Report Page 272

May 2016
Assess antiarrhythmic therapy
Recommendations Class of recommendation
To assess rate control during atrial fibrillation. IIb
To document recurrent symptomatic or asymptomatic non-sustained arrhythmias during therapy in the outpatient setting.
IIb
Assess pacemaker and ICD function
Recommendations Class of recommendation
Evaluation of immediate postoperative pacemaker function after pacemaker or ICD implantation as an alternative or adjunct to continuous telemetric monitoring.
IIb
Ischaemia monitoring
Recommendations Class of recommendation
Evaluation of patients with chest pain who cannot exercise. IIb
Preoperative evaluation for vascular surgery of patients who cannot exercise. IIb
Patients with known CAD and atypical chest pain syndrome. IIb
Monitoring in paediatric patients
Recommendations Class of recommendation
Evaluation of asymptomatic patients with prior surgery for congenital heart disease, particularly when there are either significant or residual hemodynamic abnormalities, or a significant incidence of late postoperative arrhythmias.
IIb
Evaluation of the young patient (<3 years) with a prior tachyarrhythmia to determine if unrecognised episodes of the arrhythmia recur.
IIb
Evaluation of the patient with a suspected incessant atrial tachycardia. IIb
Complex ventricular ectopy on ECG or exercise test. IIbSource: ACC/AHA (1999), pp. 921-922, 929, 931-932, 936, 938. Refer to Appendix 9 for definitions of the Class of recommendation.Abbreviations: ACC, American College of Cardiology; AECG, ambulatory electrocardiography; AF, atrial fibrillation; AHA, American Heart Association; CAD, coronary artery disease; CHF, congestive heart failure; ECG, electrocardiogram; ICD, implantable cardioverter-defibrillator; LV, left ventricular. Note: Class IIb = Clinical conditions for which there is conflicting evidence that a given procedure usefulness/efficacy is less well established.
Table A-7.4 1999 ACC/AHA indications for which AECG is not considered useful
Assess symptoms of cardiac arrhythmias
Recommendations Class of recommendation
Patients with symptoms such as syncope, near syncope, episodic dizziness, or palpitation in whom other causes have been identified by history, physical examination, or laboratory tests.
III
Patients with cerebrovascular accidents, without other evidence of arrhythmia. III
AECG arrhythmia detection to assess risk for future cardiac events in patients without symptoms from arrhythmia
Recommendations Class of recommendation
Patients who have sustained myocardial contusion III
Systemic hypertensive patients with LV hypertrophy III
Post-MI patients with normal LV function III
Preoperative arrhythmia evaluation of patients for non-cardiac surgery III
Patients with sleep apnoea III
Patients with valvular heart disease III
MBS Review – Ambulatory Electrocardiography Review Report Page 273

May 2016
Heart rate variability to assess risk for future cardiac events in patients without symptoms from arrhythmia
Recommendations Class of recommendation
Post-MI patients with normal LV function III
Diabetic subjects to evaluate for diabetic neuropathy III
Patients with rhythm disturbances that preclude heart rate variability analysis (i.e. AF) III
Assess pacemaker and ICD function
Recommendations Class of recommendation
Assessment of ICD/pacemaker malfunction when device interrogation, ECG, or other available data (chest radiography, etc) are sufficient to establish an underlying cause/diagnosis.
III
Routine follow up in asymptomatic patients. III
Ischaemia monitoring
Recommendations Class of recommendation
Initial evaluation of chest pain patients who are able to exercise. III
Routine screening of asymptomatic subjects. III
Monitoring in paediatric patients
Syncope, near syncope, or dizziness when a non-cardiac cause is present. III
Chest pain without clinical evidence of heart disease. III
Routine evaluation of asymptomatic individuals for athletic clearance. III
Brief palpitation in the absence of heart disease. III
Asymptomatic Wolff-Parkinson-White syndrome. IIISource: ACC/AHA (1999), pp. 921-922, 929, 931-932, 936, 938. Refer to Appendix 9 for definitions of the Class of recommendation.Abbreviations: ACC, American College of Cardiology; AECG, ambulatory electrocardiography; AF, atrial fibrillation; AHA, American Heart Association; ECG, electrocardiogram; ICD, implantable cardioverter-defibrillator; LV, left ventricular; MI, myocardial infarction. Note: Class III = Clinical conditions for which the procedure is not considered useful.
MBS Review – Ambulatory Electrocardiography Review Report Page 274

May 2016
APPENDIX 8: CLINICAL FEATURES AND RISK STRATIFICATION AS DEFINED BY THE 2009 ESC GUIDELINE
Table A-8.1 2009 ESC clinical features that can suggest a diagnosis of syncope on initial evaluation
Type of syncope Clinical featuresNeurally mediated syncope
Absence of heart disease
Long history of recurrent syncope
After sudden unexpected unpleasant sight, sound, smell or pain
Prolonged standing or crowded, hot places
Nausea, vomiting associated with syncope
During a meal or post prandial
With head rotation or pressure on carotid sinus (as in tumours, shaving tight collars)
After exertion
Syncope due to OH After standing up
Temporal relationship with start or changes of dosage of vasodepressive drugs leading to hypotension
Prolonged standing especially in crowded, hot places
Presence of autonomic neuropathy or Parkinsonism
Standing after exertion
Cardiovascular syncope Presence of definite structural heart disease
Family history of unexplained sudden death or channelopathy
During exertion, or supine
Abnormal ECG
Sudden onset palpitation immediately followed by syncope
ECG findings suggesting arrhythmic syncope: Bifascicular block (defined as either LBBB or RBBB combined with left anterior or left
posterior fascicular block) Other intraventricular conduction abnormalities (QRS duration ≥0.12 seconds) Mobitz I second degree AV block Asymptomatic inappropriate sinus bradycardia (<50 bpm), sinoatrial block or sinus pause ≥3
seconds in the absence of negatively chronotropic medications Non-sustained VT Pre-excited QRS complexes Long or short QT intervals Early repolarisation RBBB pattern with ST-elevation in leads V1-V3 (Brugada syndrome) Negative T waves in right precordial leads, epsilon waves and ventricular late potentials
suggestive of ARVC Q waves suggesting MI
Source: ESC (2009), Table 10, p2646Abbreviations: ARVC, arrhythmogenic right ventricular cardiomyopathy; AV, atrioventricular; bpm, beats per minute; ECG, electrocardiogram; ESC, European Society of Cardiology; LBBB, left bundle branch block; MI, myocardial infarction; OH, orthostatic hypotension; RBBB, right bundle branch block; VT, ventricular tachycardia.
MBS Review – Ambulatory Electrocardiography Review Report Page 275
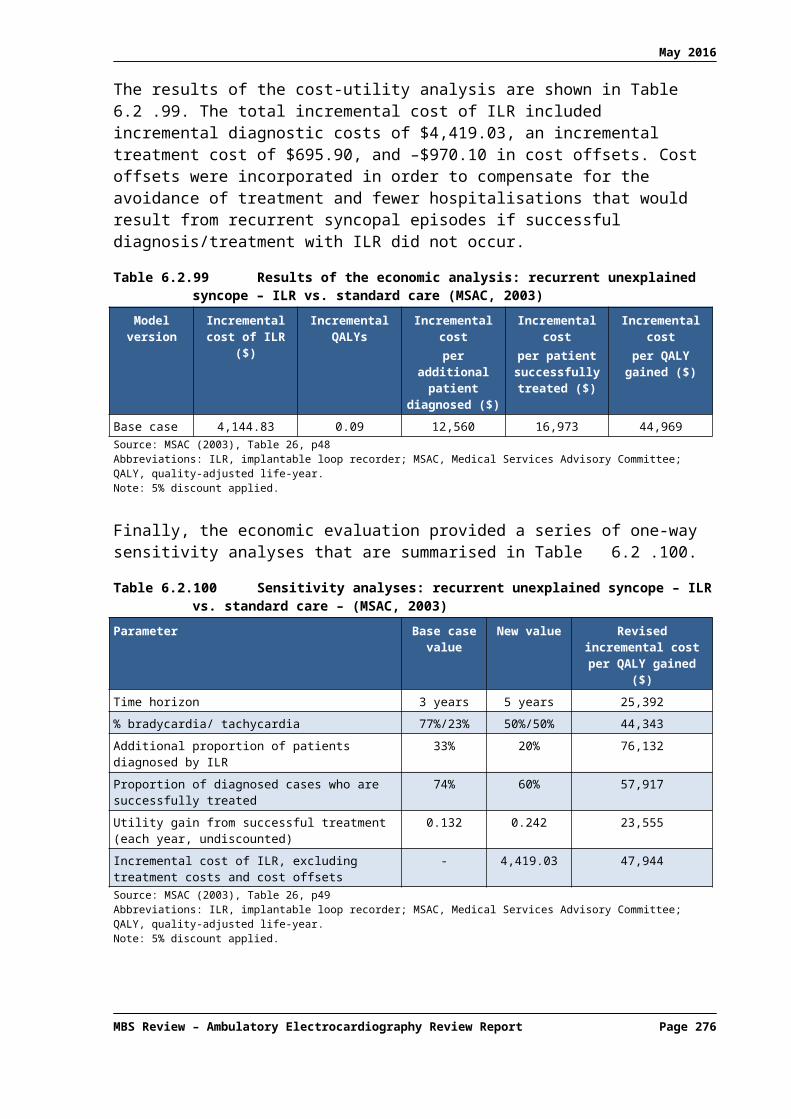
May 2016
The main high-risk features, in accordance with recent 2009 ESC guideline on syncope are listed in Table A-8.2.Table A-8.2 2009 ESC risk stratification
Short-term high-risk criteria which require prompt hospitalisation or intensive evaluationSevere structural or coronary artery disease (heart failure, low LVEF, or previous MI)Clinical or ECG features suggesting arrhythmic syncope
Syncope during exertion or supine Palpitations at the time of syncope Family history of SCD Non-sustained VT Bifascicular-block (LBBB or RBBB combined with left anterior or left posterior fascicular block) or other
intraventicular conduction abnormalities with QRS duration ≥120 ms Inadequate sinus bradycardia (<50 bpm) or sinoatrial block in absence of negative chronotropic medications or
physical training Pre-excited QRS complex Prolonged or short QT interval RBBB pattern with ST-elevation in leads V1-V3 (Brugada pattern) Negative T waves in right precordial leads, epsilon waves, and ventricular late potentials suggestive of ARVC
Important co-morbidities Severe anaemia Electrolyte disturbance
Source: ESC (2009), Table 11, p2647Abbreviations: ARVC, arrhythmogenic right ventricular cardiomyopathy; bpm., beats per minute; ECG, electrocardiogram; ESC, European Society of Cardiology; LBBB, left bundle branch block; LVEF, left ventricular ejection fraction; MI, myocardial infarction; RBBB, right bundle branch block; SCD, sudden cardiac death; VT, ventricular tachycardia.
MBS Review – Ambulatory Electrocardiography Review Report Page 276

May 2016
APPENDIX 9: CLINICAL PRACTICE GUIDELINE LEVELS OF EVIDENCE AND RECOMMENDATION GRADES
A-9.1 ACCF/AHATable A-9.1 American College of Cardiology Foundation/American Heart Association (ACCF/AHA)
Classification of recommendations and Level of evidence
Source: AHA/ACC/HRS (2014), p2249
Table A-9.2 American College of Cardiology/American Heart Association (ACC/AHA) Classes of recommendation
Class of recommendation
Interpretation
I Conditions for which there is evidence and/or general agreement that a given procedure or treatment is useful and effective (“is recommended”).
II Conditions for which there is conflicting evidence and/or a divergence of opinion about the usefulness/efficacy of a procedure or treatment.
Class IIa: Weight of evidence/opinion is in favor of usefulness/efficacy (“may be useful”) Class IIb: Usefulness/efficacy is less well established by evidence/opinion (“may be
reasonable”)
III Conditions for which there is evidence and/or general agreement that the procedure/treatment is not useful/effective, and in some cases may be harmful (“not recommended”).
Source: ACC/AHA (1999), p914
MBS Review – Ambulatory Electrocardiography Review Report Page 277

May 2016
A-9.2 HSFCTable A-9.3 Heart and Stroke Foundation of Canada (HSFC) Levels of evidence
Level of Evidence CriteriaA Evidence from a meta-analysis of randomized controlled trials or consistent findings from two or
more randomized controlled trials. Desirable effects clearly outweigh undesirable effects or undesirable effects clearly outweigh desirable effects.
B Evidence from a single randomized controlled trial or consistent findings from two or more well-designed nonrandomized and/or non-controlled trials, and large observational studies. Desirable effects outweigh or are closely balanced with undesirable effects or undesirable effects outweigh or are closely balanced with desirable effects.
C Writing group consensus and/or supported by limited research evidence. Desirable effects outweigh or are closely balanced with undesirable effects or undesirable effects outweigh or are closely balanced with desirable effects, as determined by writing group consensus. Recommendations assigned a LevelC evidence may be key system drivers supporting other recommendations, and some may be expert opinion based on common, new or emerging evidence or practice pattern.
Source: HSFA (2015), Table 1, p926
A-9.3 CCSTable A-9.4 Canadian Cardiovascular Society (CCS) Strength of recommendations and Quality of
evidence classifications
Quality of evidence DefinitionHigh Further research is very unlikely to change our confidence in the estimate of effect
Moderate Further research is likely to have an important influence on our confidence in the estimate of effect and might change the estimate.
Low Further research is very likely to have an important influence on our confidence in the estimate of effect and is likely to change the estimate.
Very low Any estimate of effect is very uncertain
Recommendation DefinitionStrong The desirable effects clearly outweigh the undesirable effects, or clearly do not
Conditional The trade-offs are less certain, either because of low-quality evidence or because evidence suggests that desirable and undesirable effects are closely balanced
Source: CCS (2013), Table 1, p1537
A-9.4 NICETable A-9.5 National Institute for Health and Care Excellence (NICE) classification of the evidence
based on GRADE
Quality of evidence DefinitionHigh Further research is very unlikely to change our confidence in the estimate of effect.
Moderate Further research is likely to have an important impact on our confidence in the estimate of effect and may change the estimate.
Low Further research is very likely to have an important impact on our confidence in the estimate of effect and is likely to change the estimate.
Very low Any estimate of effect is very uncertain.Source: NICE (2010), p70 Abbreviations: GRADE, Grading of Recommendations Assessment, Development and Evaluation.
MBS Review – Ambulatory Electrocardiography Review Report Page 278

May 2016
A-9.5 ESCTable A-9.6 The European Society of Cardiology (ESC) and the European Heart Rhythm Association
(EHRA) Classes of recommendations and Level of evidenceClasses of recommendations
Definition
I Evidence and/or general agreement that a given diagnostic procedure/treatment is beneficial, useful, and effective.
II Conflicting evidence and/or a divergence of opinion about the usefulness /efficacy of the given treatment or procedure.
IIa Weight of evidence/opinion is in favour of usefulness/efficacy.
IIb Usefulness/efficacy is less well established by evidence/opinion.
III Evidence or general agreement that the treatment is not useful/effective and in some cases may be harmful.
Level of evidence DefinitionA Data derived from multiple, randomized clinical trials or meta-analyses.
B Data derived from a single, randomized clinical trial or large non-randomized studies.
C Consensus of opinion of the experts and/or small studies, re-prospective studies, registries.Source: ESC (2009), p2634; EHRA (2009), p674
A-9.6 ESOTable A-9.7 European Stroke Organisation (ESO) Strength of recommendations and Quality of evidence
Quality of evidence DefinitionHigh Further research is very unlikely to change our confidence in the estimate of effect
Moderate Further research is likely to have an important influence on our confidence in the estimate of effect and might change the estimate.
Low Further research is very likely to have an important influence on our confidence in the estimate of effect and is likely to change the estimate.
Very low Any estimate of effect is very uncertain
Strength of recommendation
Definition
Strong for an intervention
The desirable effects of an intervention clearly outweigh its undesirable effects.
Weak for an intervention
The desirable effects of an intervention probably outweigh the undesirable effects.
Weak against anIntervention
The undesirable effects of an intervention probably outweigh the desirable effects.
Strong against anintervention
The undesirable effects of an intervention clearly outweigh its desirable effects.
Source: ESO (2008)
A-9.7 BSCTable A-9.8 Brazilian Society of Cardiology (BSC) Class of recommendations and Level of evidenceClass of recommendation
Definition
I Conditions for which there is conclusive evidence, or, if not, there is consensus that the procedure is safe and useful/effective.
II Conditions for which there is conflicting evidence and/or divergent opinions about the procedure’s safety and usefulness/effectivenessClass IIa: Weight or evidence/opinion in favour of the procedure. Approved by most professionals.Class IIb: Safety and usefulness/effectiveness less well established, with no predominance of opinions in favour of the procedure
MBS Review – Ambulatory Electrocardiography Review Report Page 279
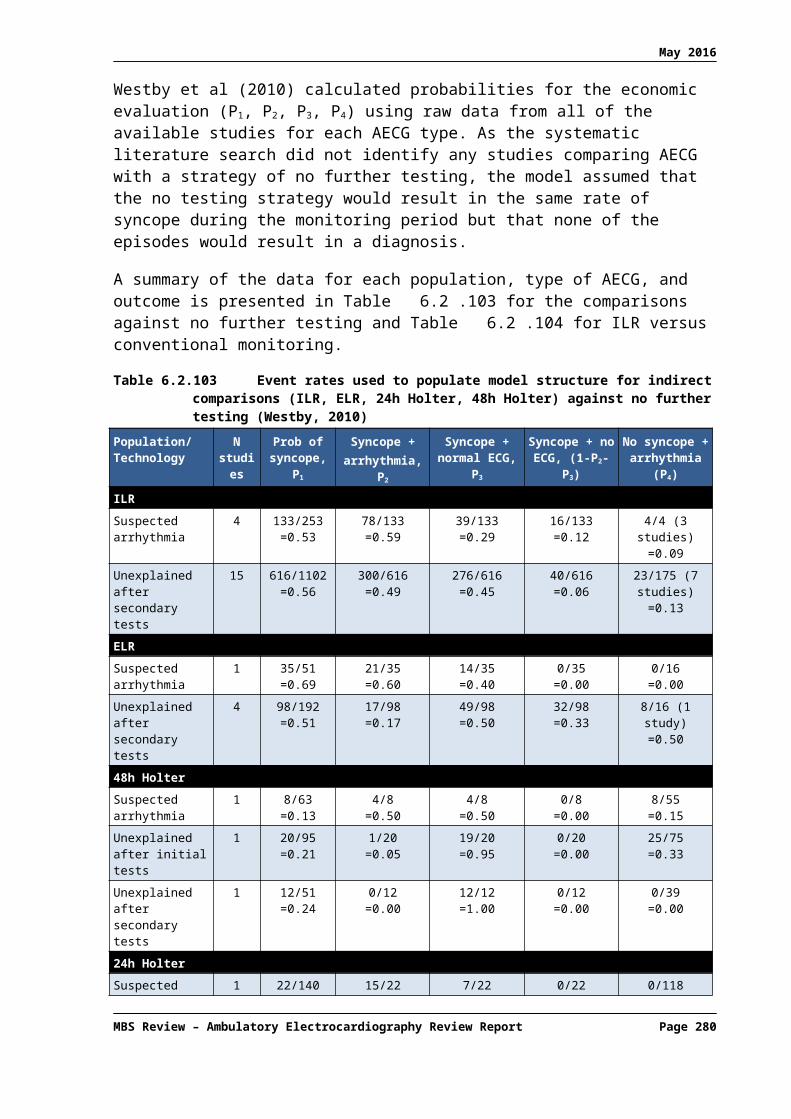
May 2016
Class of recommendation
Definition
III Conditions for which there is evidence and/or consensus that the procedure is not useful/effective and, in some cases, that it may be detrimental.
Level of evidence DefinitionA Data derived from multiple significantly sized randomized trials, consistent and/or robust meta-
analysis of randomized clinical trials
B Data derived from less robust meta-analysis, grounded on a single randomized trial or nonrandomized (observational) trials.
C Data derived from consensual opinions of experts.Source: BSC (2011)Note that the levels of evidence classified as B or C may not be interpreted as weak recommendations. There are many consensual recommendations; thus having class of recommendation I, level of evidence C (expert opinions). On the other hand, some indications considered controversial (class of recommendation II) may be grounded on randomized controlled trials (level of evidence A).
MBS Review – Ambulatory Electrocardiography Review Report Page 280

May 2016
APPENDIX 10: RISK ASSESSMENT STUDIES
A-10.1 Systematic reviews of AECG for risk assessment
Table A-10.1 lists the seven systematic reviews of AECG for risk assessment. These publications were excluded during the screening of retrieved citations as they do not report PICO outcomes. The only exception is Kertai (2003), which does report sensitivity and specificity of AECG, comparing the performance of AECG and other tests in predicting cardiac events prior to major vascular surgery. Given the exploratory nature of this use of AECG it was considered appropriate to include this study with other risk assessment studies.
Table A-10.1 Citation details for systematic reviews or HTAs investigating AECG for risk assessment
Ref IDStudy type
Variable measured
Literature search date
Citation
Range of cardiac profilesQuan (2014)SR & MA
TWA November 2014
Quan, X. Q., H. L. Zhou, et al. (2014). "Ability of ambulatory ECG-based T-wave alternans to modify risk assessment of cardiac events: a systematic review." BMC Cardiovasc Disord 14: 198.
Post MIBuccelletti (2009)SR & MA
HRV (SDNN)
NR Buccelletti, E., E. Gilardi, et al. (2009). "Heart rate variability and myocardial infarction: systematic literature review and metanalysis." Eur Rev Med Pharmacol Sci 13(4): 299-307.
Bailey (2001) HRV (any measure)
NR Bailey, J. J., A. S. Berson, et al. (2001). "Utility of current risk stratification tests for predicting major arrhythmic events after myocardial infarction." J Am Coll Cardiol 38(7): 1902-1911.
Ventricular dysfunction
de Sousa (2010)
SR
HRV(SDNN)
January 2008 de Sousa, M. R., M. P. T. Barbosa, et al. (2010). "Standard deviation of normal interbeat intervals as a risk marker in patients with left ventricular systolic dysfunction: A meta-analysis." International Journal of Cardiology 141(3): 313-316.
de Sousa (2008)SR & MA
NSVT July 2007 de Sousa, M. R., C. A. Morillo, et al. (2008). "Non-sustained ventricular tachycardia as a predictor of sudden cardiac death in patients with left ventricular dysfunction: a meta-analysis." Eur J Heart Fail 10(10): 1007-1014.
Chagas diseaseRassi (2007)SR
NSVT February 2006 Rassi, A., Jr., A. Rassi, et al. (2007). "Predictors of mortality in chronic Chagas disease: a systematic review of observational studies." Circulation 115(9): 1101-1108.
Major vascular surgeryKertai (2003)SR
ST segment April 2001 Kertai, M. D., E. Boersma, et al. (2003). "A meta-analysis comparing the prognostic accuracy of six diagnostic tests for predicting perioperative cardiac risk in patients undergoing major vascular surgery." Heart 89(11): 1327-1334.
Abbreviations: AECG, ambulatory electrocardiography; AF, atrial fibrillation; HRV, heart rate variability; HTA, health technology assessment; LVSD, left ventricular systolic dysfunction; MA, meta-analysis; MI, myocardial infarction; NR, not reported; NSVT, non-sustained ventricular tachycardia; SDNN, standard deviation normal-to-normal; SR, systematic review; TWA, T-wave alternans.
The literature search also identified an HTA (Hayes Inc, 2009) that examined the use of microvolt T-wave alternans (TWA) to assess the risk of ventricular arrhythmias and SCD. 78 This HTA it is not publicly available (available for purchase online ) ; as such, it is not included in this Review. An additional systematic review of cardiovascular risk assessment
78 80% of patients in the ELR group used devices that were patient-activated only. Therefore this RCT is regarded by the current Review as a comparison of patient-triggered ELR and auto- or patient-triggered MCT.
MBS Review – Ambulatory Electrocardiography Review Report Page 281
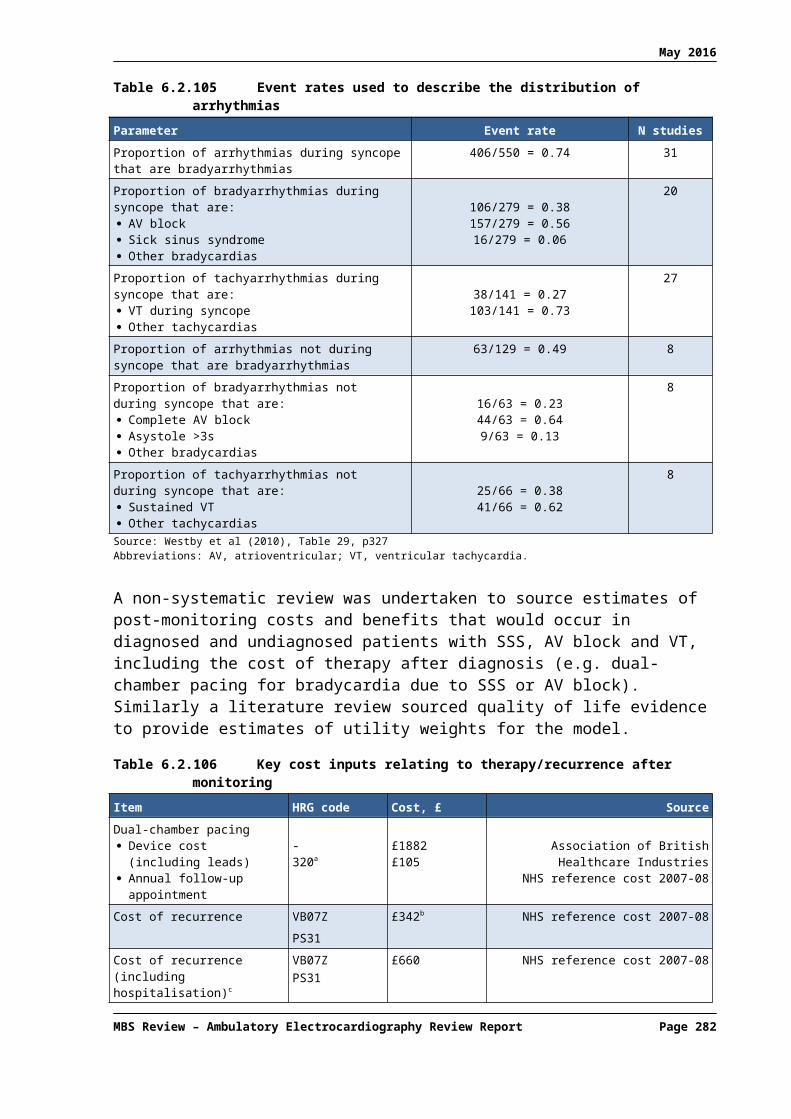
May 2016
using mobile ECG systems was retrieved (Landinez, 2015), but as risk was assessed in the general population, this study was excluded from this Review.
A-10.2 Summaries of risk assessment systematic reviews
A-10.2.1 T-wave alternans for cardiac risk stratification
One systematic review by Quan et al (2014) was identified that investigated the use of TWA to stratify cardiac risk. Any patient populations were eligible for inclusion.
The T wave of the ECG arises from repolarisation of the ventricles. TWA79 refers to a variation in the timing or shape of the T wave in an alternating beat-to-beat pattern (i.e. ABABAB pattern). TWA is associated with arrythmogenesis, and is used in risk stratification for SCD and cardiac mortality in a range of patient populations (e.g. post MI). TWA detection typically involves exercise stress testing and analysis by the frequency-domain spectral method, but results are frequently indeterminate due either to patient factors (e.g. physical or pharmacological issues prevent the patient maintaining an elevated heart rate) or to technological limitations (e.g. motion or respiration cause excessive signal noise).
24-hour Holter monitoring has been explored as an alternative platform to assess TWA (AECG-based TWA) as it does not require an elevated heart rate. Exercise-based testing typically evaluates TWA using an analysis methodology referred to as the spectral method, while AECG-based TWA typically uses the modified moving average (MMA) method, but can also use the Laplacian likelihood ratio (LLR) method. In the systematic review by Quan et al (2014), the evidence for AECG-based TWA was evaluated across a wide range of patient populations.
Five studies were identified that used AECG-based TWA in 1588 patients with ischaemic or non-ischaemic cardiomyopathy with a wide range of LVEF impairment (most patients had underlying ischaemic disease). Quan et al (2014) reported the composite endpoint of SCD, cardiac mortality and severe arrhythmic events, as well as the separate outcomes of SCD and cardiac mortality.
TWA was positive in 20% (317) of the patients. A meta-analysis of all five studies found a significantly higher risk of SCD and the composite endpoint in the positive group compared to the negative group (Table A-10.2). When only the four studies that used the MMA method to evaluate TWA were included in a subgroup meta-analysis, the composite endpoint risk increased markedly.
The authors concluded that AECG-based TWA provides an accurate means of predicting fatal cardiac events.
Table A-10.2 Results of meta-analysis of AECG-based TWA studies (Quan, 2014)
Outcome All five included studiesHazard ratio [95% CI]
Studies using MMA methodHazard ratio [95% CI]
Composite endpoint: SCD, cardiac mortality, severe arrhythmic events
5.94 [1.80, 19.63] 9.51 [4.99, 18.11]
SCD 7.49 [2.65, 21.15] NR
cardiac mortality 4.75 [0.42, 53.55] NRAbbreviations: AECG, ambulatory electrocardiography; CI, confidence interval; MMA, modified moving average; NR, not reported; SCD, sudden cardiac death; TWA, T-wave alternans.
79 Also referred to as microvolt T-wave alternans, alluding to the increased sensitivity of current methods of analysis compared to the original method of visual assessment.
MBS Review – Ambulatory Electrocardiography Review Report Page 282

May 2016
An examination of the clinical practice guidelines for cardiac diseases identified in the current Review found no evidence that TWA is routinely used for risk stratification of cardiac patients. The 2015 ESC Guidelines for the management of ventricular arrhythmias and the prevention of sudden cardiac death discusses TWA (not particularly AECG-based TWA) along with a number of other proposed noninvasive markers of risk of SCD in patients with myocardial ischaemia. The guideline claims that “despite the promising outcomes of the early studies, none of these ‘predictors’ has influenced clinical practice”. They note that for patients with MI and left ventricular dysfunction (which likely constitutes a large proportion of the population included in Quan et al, 2014), the only indicator that has consistently shown an association with increased risk of sudden death is LVEF. They also state that although LVEF is not an accurate and highly reproducible clinical parameter, it is still used to select patients for implantable cardioverter-defibrillators in the primary prevention of SCD.
A-10.2.2 Post-MI risk stratification
Two systematic reviews of risk stratification, including AECG-based testing, specifically in the post-MI population, were identified: Buccelletti et al (2009) and Bailey et al (2001). Both reviews investigated heart rate variability (HRV) as a predictor of adverse cardiac events.
HRV is assessed over a 24-hour monitoring period and a number of different measures can be used to quantify the variability in beat-to-beat intervals. A widely used measure is standard deviation normal-to-normal (SDNN). This is calculated by dividing the 24-hour monitoring period into 5-minute segments and measuring the standard deviation of the interval between normal beats (arising from the sino-atrial node), then deriving the mean of all SDNNs across the 24-hour monitoring period.
Buccelletti et al (2009) identified 21 studies of HRV in post-MI patients in which mortality or significant cardiac complications were reported. No minimum follow up was specified. Studies that included the most broadly reported measure, SDNN, and reported mortality were selected for meta-analysis, which amounted to five large trials (3,489 patients). Mean follow up was not reported although the pooled estimate from the meta-analysis was reported for three years. The cutoff of 70 milliseconds (msec) was used to stratify patients by SDNN.
Overall mortality80 at three years was 21.7% in patients with SDNN < 70 msec compared with 8.1% in patients with SDNN >70 msec, which is a statistically significant difference (OR: 3.95, 95% CI: 1.49, 10.47). Results were statistically significant for each of the five individual trials. Results from the other 16 studies were consistent with this finding. The authors note that while there is a strong association between SDNN and mortality after MI, SDNN ‘must be be considered carefully on a single patient’.
Bailey et al (2001) investigated the ability of five common tests to predict the risk of major arrythmic events (MAEs) after MI, two of which are AECG-based: HRV and serious ventricular arrhythmia (SVA). The number of true positives, true negatives, false positives and false negatives were extracted or inferred from 11 studies of HRV and 16 studies of SVA. Aggregate MAE rates at one year and two years were calculated for each test, by averaging values, weighted by the number of patients in each study. Receiver-operating characteristic (ROC) curves were constructed for each of the five tests, and the sensitivity, specificity and 95% confidence intervals derived from these curves were combined with the total MAE rate to provide estimates for predictive accuracy and risk.
80 One of these trials reported a composite outcome of mortality and other complications, and the point estimate for this study was greater than for all other studies (OR >8 versus <5 for all other studies).
MBS Review – Ambulatory Electrocardiography Review Report Page 283

May 2016
The results for all five tests are shown in Table A-10.3. The probability of an MAE after two years was 25.8% [95% CI: 25.0, 25.6] for patients with a positive HRV test, and 13.4% [95% CI: 13.0, 13.7] for patients with a positive SVA test. The OR for HRV was 6.3 while for SVA, OR was the lowest of the tests, at 3.2.
However, the authors claim no single test was sufficient to predict risk. The predictive accuracy of combining tests in three stages (which may simulate clinical practice) was also explored. This allowed stratification of 91.8% of patients into either high-risk or low-risk groups. The authors conclude that these data suggest a large prospective study, to develop a robust prediction model, is feasible and desirable.
Table A-10.3 Comparison of tests for predicting major arrhythmic events (Bailey, 2001)
Test Number of
patients
Composite Weighted Values
forSensitivity(95% CI)
Composite Weighted Values
forSpecificity(95% CI)
Two-Year Probability of a
MAE ifTest (+)
(95% CI)
Two-Year Probability of a
MAE ifTest (–)
(95% CI)
Relative Risk
(Test + / Test –)
Odds Ratio
[(TP/FP)/ (FN/TN)]
SAECG 9,883 62.4%(56.4, 67.9)
77.4%(73.6, 80.8)
77.4%(73.6, 80.8)
4.05%(3.65, 4.48)
4.8 5.7
SVA 9,564 42.8%(32.7, 53.7)
80.9%(75.0, 85.7)
80.9%(75.0, 85.7)
4.68%(4.12, 5.18)
2.9 3.2
HRV 5,719 49.8%(37.5, 62.1)
85.8%(82.1, 88.9)
85.8%(82.1, 88.9)
5.48%(4.37, 6.52)
4.7 6.3
LVEF 7,294 59.1%(53.3, 64.6)
77.8%(75.5, 79.9)
20%(19.8, 19.9)
4.7%(4.21, 5.19)
4.3 5.1
EPS 4,022 61.6%(48.2, 73.4)
84.1%(65.0, 93.8)
25.5%(15.6, 40.7)
3.88%(3.49, 4.65)
6.6 8.5
Abbreviations: CI, confidence interval; EPS, electrophysiological study; FN, false negative; FP, false positive; HRV, heart rate variability; LVEF, left ventricular ejection fraction; MAE, major arrhythmic event; SAECG, signal-averaged electrocardiogram; SVA, serious ventricular arrhythmia; TN, true negative; TP, true positive.
The 2015 ESC Guidelines for the management of ventricular arrhythmias and the prevention of sudden cardiac death does not discuss SDNN, but they list HRV as one of a number of proposed noninvasive markers that, despite promising early studies, have not influenced clinical practice. As discussed in Section , this guideline claims the only indicator that has consistently shown an association with increased risk of sudden death in the setting of MI and left ventricular dysfunction is LVEF.
A-10.2.3 Ventricular dysfunction risk assessment
Two publications were identified that investigate AECG-based risk stratification in patients with left ventricular systolic dysfunction (LVSD): de Sousa et al (2010)81 and de Sousa et al (2008).
SDNN from 24-hour Holter was explored by de Sousa (2010) as a predictor of pump failure or death. Prospective studies of patients with heart failure or dilated cardiomyopathy with LVSD were eligible for inclusion (studies that selected only patients with acute MI were excluded). Twenty-two studies were identified of which 16 reported SDNN as mean values. Mean values and standard deviation for SDNN across all 16 studies (2423 patients) were 115 ±48 msec in ‘survivors’ and 87 ±40 msec in ‘non-survivors’, with regard to death, cardiac death, transplantation or heart failure progression.
81 This systematic review was published as a letter to the editor, but is of sufficient quality to include in this Review.
MBS Review – Ambulatory Electrocardiography Review Report Page 284

May 2016
A random effects model was used to meta-analyse the standardised mean difference in SDNN between survivors and non-survivors for the end point of all-cause-death in these 16 studies. SDNN was significantly lower in non-survivors (standardised mean difference: 0.594, 95% CI: 0.385, 0.803). A meta-regression between mean LVEF and the standardised mean difference of SDNN in each study showed no siginifcant influence of ejection fraction on SDNN, showing SDNN is a predictor of mortality in LVSD patients with reduced LVEF, independent of LVEF. The authors commented that additional studies must evaluate if SDNN may be used as a decision-making tool in the choice of therapies, such as transplantation and medical treatment intensification.
In the systematic review by de Sousa et al (2008), non-sustained ventricular tachycardia (NSVT) was explored as a predictor of major arrhythmic events in patients with LVSD. Eligible studies reported NSVT data from at least 24-hour AECG in at least 100 patients, and allowed extraction or inference of true positive, false positive, false negative and true negative data, in respect of SCD-predicting NSVT. Studies of patients with a recent MI or previous sustained VT or SCD were excluded. Major arrhythmic events were defined as SCD or resuscitated ventricular fibrillation or sustained VT, and were collectively referred to as SCD.
Eleven studies were eligible for inclusion, and the authors performed a number of analyses and a range of metrics. The diagnostic odds ratio (DOR), which describes how many times higher the odds are of a positive test in diseased versus non-diseased patients, was reported for individual studies, and ranged from 1.66 to 7.71. The pooled DOR was statisticaly significant (3.031 [95% CI: 2.441, 3.763] without heterogenetiy (I2 = 7.1%). A meta-regression showed no statistically significant influence of LVEF on the DORs of NSVT as a predictor of SCD.
Patients had exclusively non-ischaemic aetiology in five studies and both ischaemic and non-ischaemic cardiomyopathy in six studies. Separate meta-analyses of these subgroups found statistically significant DORs of 3.224 [95% CI: 2.123, 4.898] for non-ishaemic patients, and 2.925 [95% CI: 2.314, 3.698] in studies with mixed populations.
A significant Spearman's correlation was detected between sensitivity and specificity, suggesting the existence of a threshold effect for the definition of NSVT (definitions varied widely across studies, from 70 bpm to over 150 bpm, although in most studies it ranged from 100 to 120 bpm). To account for a threshold effect, a summary ROC curve was constructed. The standard error for the area under the curve was 0.015, indicating that NSVT had a statistically significant diagnostic contribution to SCD risk stratification.
Despite this threshold effect, individual studies reported homogeneous true negative values (not having SCD and absence of NSVT), ranging from 89% to 97%. This prompted the authors to report the pooled negative likelihood ratio (LR). The negative LR describes how many times less likely a negative test result was in the diseased versus the non-diseased group (false negatives/true negatives). The pooled negative LR was 0.617 [95% CI: 0.550, 0.693] without heterogeneity.
The positive LR pooled estimate, on the other hand, displayed significant heterogeneity (1.858 [95% CI: 1.560, 2.213], I2 = 75.3%). This metric describes how many times more likely a positive test results was in the diseased group compared to the non-diseased group (true positive/false positive). However, in the non-ischaemic disease subgroup, the positive LR was higher, at 2.29 [95% CI: 1.61, 3.24] and showed no heterogeneity (I2 = 0.5%).
MBS Review – Ambulatory Electrocardiography Review Report Page 285

May 2016
The authors concluded that NSVT plays a consistent role in the risk stratification of SCD in LVSD patients, independed of LVEF. They noted that in each of the studies, the absence of NSVT was significantly and independently related to the absence of SCD, despite the radical changes in heart failure and LVSD treatment over this period (1989 to 2007). They claimed ‘these findings support the hypothesis that it would be desirable to build a risk score based on more than one noninvasive risk stratifier that would include LVEF and NSVT, and possibly other risk markers’.
The 2015 ESC Guidelines for the management of ventricular arrhythmias and the prevention of sudden cardiac death does not specifically recommend monitoring for NSVTs. However, the guideline does recommend AECG to detect and diagnose arrhythmias [Class of recommendation IA; Level of evidence A], and that treatment with amiodarone should be considered for patients with left ventricular dysfunction and frequent symptomatic NSVT [Class of recommendation, IIa; Level of evidence, B].
Apart from these specific recommendations, the guideline also makes the following claims regarding NSVT:
in patients with left ventricular dysfunction, runs of NSVT are common and may be the consequence or the cause of left ventricular dysfuntion;
in patients with structural heart disease, runs of NSVT are an acceptable marker of increased mortality risk;
in patients with hypertrophic cardiomyopathy, NVST occurs in ~25% of patients, and is associated with an increased risk of SCD;
in paediatric patients, the guideline recommends that severe left ventricular hypertrophy, unexplained syncope, NSVT and a family history of sudden death should be considered as major risk factors for SCD in children;
in Chagas disease, NVST is one of the most consistent, independent predictors of death.
A-10.2.4 Chagas disease
One systematic review was identified that investigated the use of AECG, among other tests, for risk stratification in patients with Chagas disease (Rassi, 2007). Studies were eligible for inclusion if they investigated patients in the chronic phase of Chagas disease, reported outcomes such as all-cause mortality, SCD or cardiovascular deaths, and performed multivariable regression models of prognosis.
Of the 12 studies eligible for inclusion, only two investigated the use of AECG measures82. NSVT was the only AECG measure found to be an independent predictor of mortality in this population; a single study by Rassi et al (2006) found the presence of NSVT was associated with a 2.15-fold increased risk of mortality. The authors of the systematic review (Rassi, 2007) concluded that there is strong evidence that NSVT on 24-hour Holter monitoring indicated an adverse prognosis.
The Brazilian Society of Cardiology (Sociedade Brasileira de Cardiologia) published Latin American guidelines for the diagnosis and treatment of Chagas’ heart disease (Andrade et al, 2011). This guideline makes specific recommendations regarding the use of Holter (as reported in Section 4.9.3 of the current Review). In addition to the initial patient assessment, Holter is indicated in chagasic patients with cardiomyopathy for prognostic stratification, and for guiding treatment and prognosis in patients with a high density of ventricular arrhythmias. 82 One of these (Rassi, 2006) investigated both HRV and NSVT on 24-hour Holter, but the AECG measures in the other
study (Carrasco et al, 1994) were not reported by the Rassi (2007) systematic review.
MBS Review – Ambulatory Electrocardiography Review Report Page 286

May 2016
The use of NSVT in risk stratification is not referred to in the specifc clinical recommendations, although some make specific recommendations for further testing and treatment if NSVT is detected, and the guideline claims that NSVT indicates worse prognosis.
An algorithm was proposed by the Rassi (2007) systematic review to guide mortality risk assessment and therapeutic decision-making for patients with Chagas disease. For patients with abnormal ECG and New York Heart Association (NYHA) functional class I/II, the last test was 24-hour Holter to detect NSVT, to further stratify patients after chest X-ray and 2-D echocardiography. This algorithm is reproduced in the clinical practice guidelines for Chagas disease.
The Rassi (2006) study also reported on the development and validation of a risk score for predicting death in Chagas; the Rassi score. This risk score is also discussed by the guidelines, but not within specific recommendations.
A-10.2.5 Perioperative cardiac risk assessment for major vascular surgery
Underlying CAD increases the risk of cardiovascular complications during and following major vascular surgery. Kertai et al (2003) performed a systematic review and meta-analysis of six diagnostic tests to identify patients with significant CAD, and to assess preoperative risk of cardiac complications. Studies were included if they reported results up to 30 days post surgery for cardiac death, non-fatal MI, or the composite of these outcomes.
Eight AECG studies of a total of 893 patients were identified, each analysing ST-segment depression greater than 1 mm (plus ST-segment elevation by more than 2mm in three studies). The ST-segment section of the ECG represents the interval between ventricular depolarisation and repolarisation. Other tests evaluated were exercise ECG, radionuclide ventriculography, myocardial perfusion scintigraphy, dobutamine stress echocardiography, and dipyridamole stress echocardiography.
Weighted, pooled summary statistics for predicting perioperative cardiac death and non-fatal MI were calculated for each test (Table A-10.4). AECG was the least sensitive test apart from radionuclide ventriculography, which had the highest specificity. The most sensitive was dobutamine stress echocardiography, followed closely by myocardial perfusion scintigraphy, although the specificities of these tests differed, being a lot lower for the latter test.
Table A-10.4 Summary of clinical characteristics and sensitivity and specificity of studies included in MA
Test No. of studies
No. of patients
Mean age (years)
Males (%)
History of CAD (%)
DM (%)
Sensitivity %(95% CI)
Specificity %(95% CI)
Radionuclide ventriculography 8 532 67 83 45 25 50 (32, 69) 91 (87, 96)
Ambulatory electrocardiography 8 893 68 72 55 32 52 (21, 84) 70 (57, 83)
Exercise electrocardiography 7 685 64.5 72 36 28 74 (60, 88) 69 (60, 78)
Dipyridamole stress echocardiography 4 850 66.8 78 28 33 74 (53, 94) 86 (80, 93)
Myocardial perfusion scintigraphy 23 3119 65.5 78 40 30 83 (77, 89) 49 (41, 57)
Dobutamine stress echocardiography 8 1877 67.3 76 37 16 85 (74, 97) 70 (62, 79)Abbreviations: CAD, coronary artery disease; CI, confidence interval; DM, diabetes mellitus.
Summary ROC curves were presented and comparison of pairs of tests using summary ROC analysis showed a trend towards better performance using dobutamine stress echocardiography. This difference was statistically significant only for the comparison of dobutamine stress echocardiography and myocardial perfusion scintigraphy. It is noted by the
MBS Review – Ambulatory Electrocardiography Review Report Page 287

May 2016
authors of the current Review that these two tests included the largest number of patients in the Kertai (2003) review.
The authors noted that AECG had a low sensitivity and higher specificity, but no significant difference in predictive performance compared to the other tests. While is is cheap and widely available, it is not reliable in patients with resting ECG changes (bundle branch block, left ventricular hypertrophy, digitalis use). They conclude that the combination of low sensitivity and resting ECG changes limit the application of this technique.
MBS Review – Ambulatory Electrocardiography Review Report Page 288