aecom us pressrelease 2
TRANSCRIPT
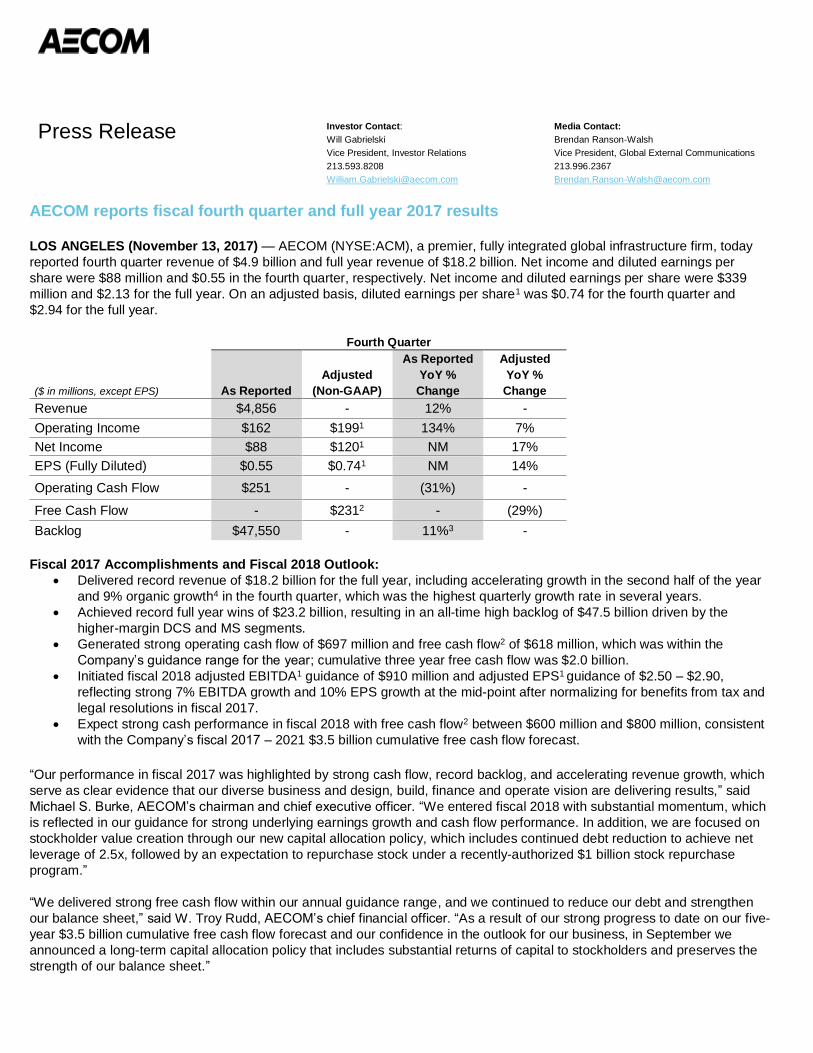
Press Release
Investor Contact:
Will Gabrielski
Vice President, Investor Relations
213.593.8208
Media Contact:
Brendan Ranson-Walsh
Vice President, Global External Communications
213.996.2367
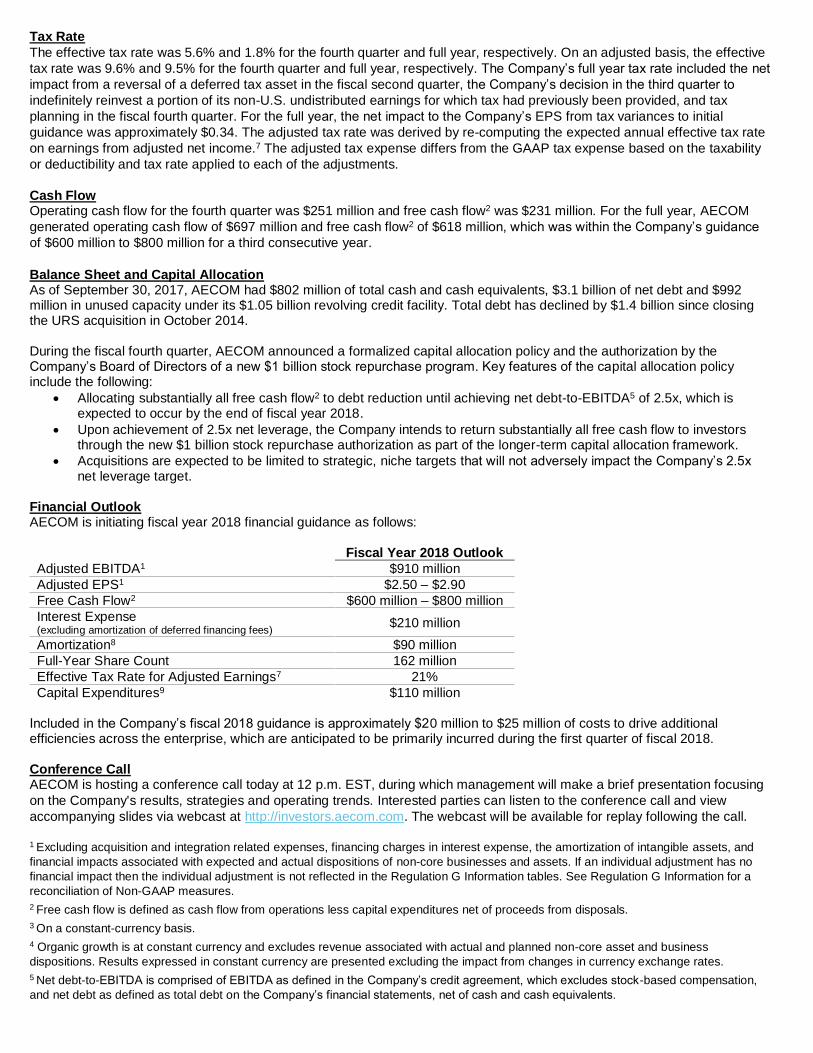
AECOM reports fiscal fourth quarter and full year 2017 results LOS ANGELES (November 13, 2017) — AECOM (NYSE:ACM), a premier, fully integrated global infrastructure firm, today
reported fourth quarter revenue of $4.9 billion and full year revenue of $18.2 billion. Net income and diluted earnings per
share were $88 million and $0.55 in the fourth quarter, respectively. Net income and diluted earnings per share were $339
million and $2.13 for the full year. On an adjusted basis, diluted earnings per share1 was $0.74 for the fourth quarter and
$2.94 for the full year.
Fourth Quarter
($ in millions, except EPS) As Reported
Adjusted
(Non-GAAP)
As Reported
YoY %
Change
Adjusted
YoY %
Change
Revenue $4,856 - 12% -
Operating Income $162 $1991 134% 7%
Net Income $88 $1201 NM 17%
EPS (Fully Diluted) $0.55 $0.741 NM 14%
Operating Cash Flow $251 - (31%) -
Free Cash Flow - $2312 - (29%)
Backlog $47,550 - 11%3 -
Fiscal 2017 Accomplishments and Fiscal 2018 Outlook:
• Delivered record revenue of $18.2 billion for the full year, including accelerating growth in the second half of the year
and 9% organic growth4 in the fourth quarter, which was the highest quarterly growth rate in several years.
• Achieved record full year wins of $23.2 billion, resulting in an all-time high backlog of $47.5 billion driven by the
higher-margin DCS and MS segments.
• Generated strong operating cash flow of $697 million and free cash flow2 of $618 million, which was within the
Company’s guidance range for the year; cumulative three year free cash flow was $2.0 billion.
• Initiated fiscal 2018 adjusted EBITDA1 guidance of $910 million and adjusted EPS1 guidance of $2.50 – $2.90,
reflecting strong 7% EBITDA growth and 10% EPS growth at the mid-point after normalizing for benefits from tax and
legal resolutions in fiscal 2017.
• Expect strong cash performance in fiscal 2018 with free cash flow2 between $600 million and $800 million, consistent
with the Company’s fiscal 2017 – 2021 $3.5 billion cumulative free cash flow forecast.
“Our performance in fiscal 2017 was highlighted by strong cash flow, record backlog, and accelerating revenue growth, which
serve as clear evidence that our diverse business and design, build, finance and operate vision are delivering results,” said
Michael S. Burke, AECOM’s chairman and chief executive officer. “We entered fiscal 2018 with substantial momentum, which
is reflected in our guidance for strong underlying earnings growth and cash flow performance. In addition, we are focused on
stockholder value creation through our new capital allocation policy, which includes continued debt reduction to achieve net
leverage of 2.5x, followed by an expectation to repurchase stock under a recently-authorized $1 billion stock repurchase
program.”
“We delivered strong free cash flow within our annual guidance range, and we continued to reduce our debt and strengthen
our balance sheet,” said W. Troy Rudd, AECOM’s chief financial officer. “As a result of our strong progress to date on our five-
year $3.5 billion cumulative free cash flow forecast and our confidence in the outlook for our business, in September we
announced a long-term capital allocation policy that includes substantial returns of capital to stockholders and preserves the
strength of our balance sheet.”

Wins and Backlog
Full year wins were $23.2 billion, which set a new high, and resulted in a book-to-burn ratio6 of 1.2, as the Company’s fully
integrated offering, leading capabilities and scale created competitive advantages on large pursuits, including the San Onofre
nuclear decommissioning project and a large, global design-build win in the fourth quarter for a multi-national pharmaceutical
company. Wins were $4.9 billion in the fourth quarter, which resulted in a book-to-burn ratio6 of 0.9, highlighted by strong
contributions from the DCS Americas and Management Services businesses.
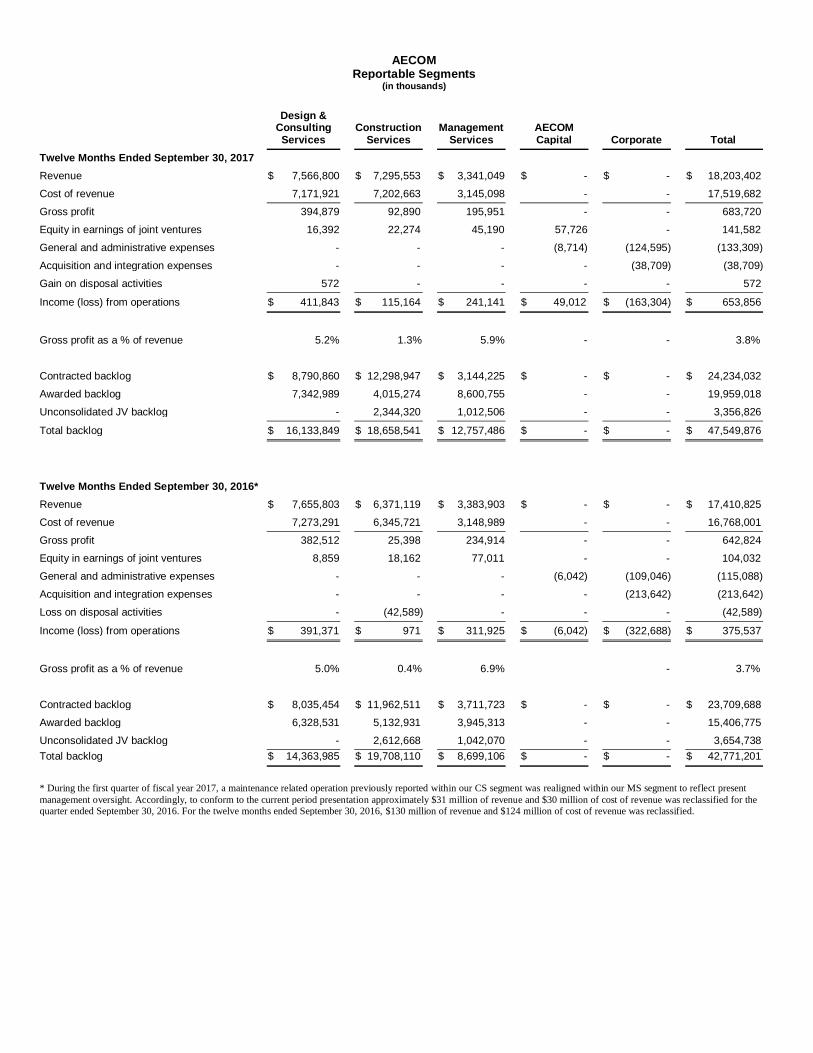
Total backlog increased 11%3 over the prior-year period to $47.5 billion, including a record high backlog level in the DCS
segment, 47% growth in Management Services and the addition of $1.4 billion in the fourth quarter from the Shimmick
acquisition.
Business Segments In addition to providing consolidated financial results, AECOM reports separate financial information for its four segments: Design & Consulting Services, Construction Services, Management Services, and AECOM Capital. Design & Consulting Services (DCS)
The DCS segment delivers planning, consulting, architectural and engineering design services to commercial and government
clients worldwide in markets such as transportation, facilities, environmental, energy, water and government.
Revenue in the fourth quarter was $2.0 billion. Constant-currency organic4 revenue increased by 4%. Full year revenue was $7.6 billion, and constant-currency organic4 revenue was unchanged over the prior year. Performance reflects improving trends in the Americas driven by transportation and water markets. Fourth quarter and full year operating income was $106 million and $412 million, respectively. On an adjusted basis, fourth quarter and full year operating income1 was $116 million and $448 million, respectively, resulting from solid underlying execution and revenue growth, partially offset by increased investment in business development that resulted in strong backlog growth. Construction Services (CS)
The CS segment provides construction services for energy, sports, commercial, industrial, and public and private
infrastructure clients.
Revenue in the fourth quarter was $2.0 billion. Constant-currency organic4 revenue increased by 21%. Full year revenue was $7.3 billion, and constant-currency organic4 revenue increased by 11%, highlighted by the third-consecutive year of double-digit growth in the Building Construction business and strong growth in the Power business. Fourth quarter and full year operating income was $38 million and $115 million, respectively. On an adjusted basis, fourth quarter and full year operating income1 was $49 million and $150 million, respectively, which was driven by strong performance in the Building Construction and Power businesses and improved performance in the Oil & Gas business. Management Services (MS)
The MS segment provides program and facilities management and maintenance, training, logistics, consulting, technical
assistance and systems-integration services and information technology services, primarily for agencies of the U.S.
government, national governments around the world and commercial customers.
Revenue in the fourth quarter was $890 million. Organic4 revenue was up slightly over the prior year period. Full year revenue
was $3.3 billion, and organic4 revenue decreased by 1%.
Operating income was $48 million and $241 million in the fourth quarter and full year, respectively. On an adjusted basis,
operating income1 was $61 million and $293 million in the fourth quarter and full year, respectively.
Revenue and operating income in the prior year included a significant positive impact from the accelerated recovery of a
government pension entitlement resulting from the harmonization of the Company’s benefit programs. Excluding this benefit,
full year revenue and adjusted operating income increased slightly over the prior year, reflecting strong execution across the
Company’s vast and diverse portfolio of projects.
AECOM Capital (ACAP)
The ACAP segment invests in real estate, public-private partnerships (P3), and infrastructure. Operating income in the fourth
quarter was $7 million. Full year operating income was $49 million, driven by the Company’s first investment monetization,
which closed during the fiscal third quarter. ACAP manages a diverse portfolio that includes numerous active investments and
$230 million of committed capital.
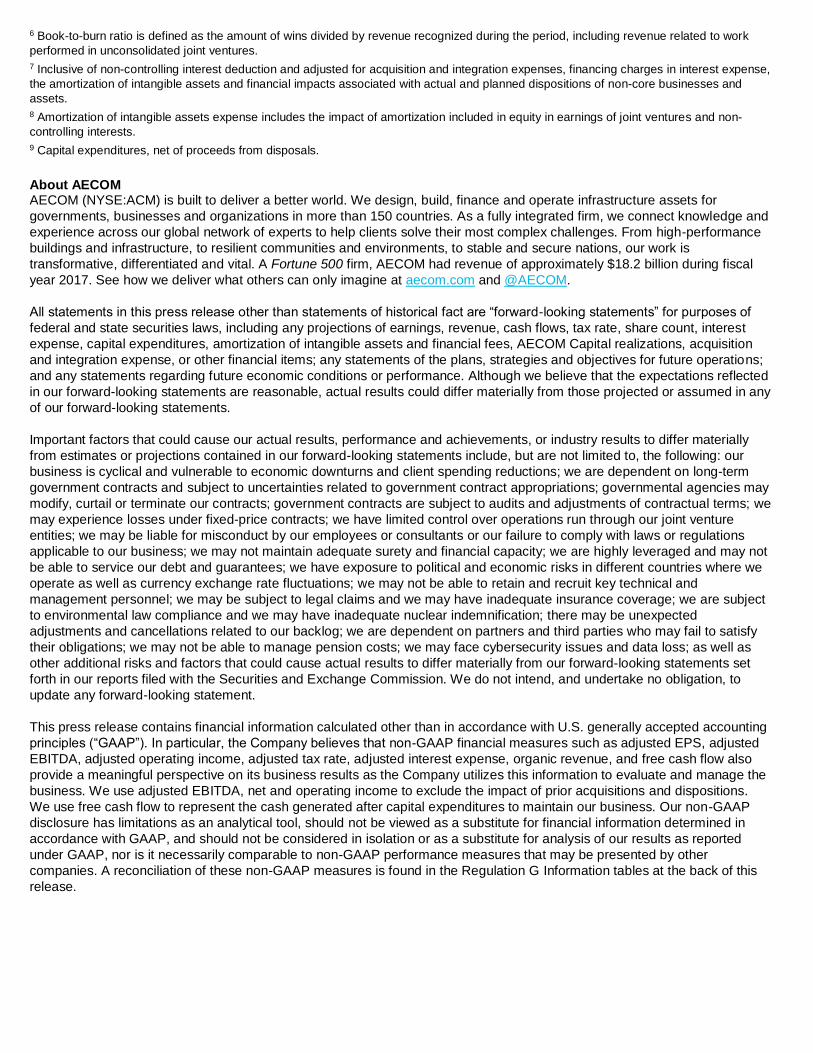
Tax Rate
The effective tax rate was 5.6% and 1.8% for the fourth quarter and full year, respectively. On an adjusted basis, the effective
tax rate was 9.6% and 9.5% for the fourth quarter and full year, respectively. The Company’s full year tax rate included the net
impact from a reversal of a deferred tax asset in the fiscal second quarter, the Company’s decision in the third quarter to
indefinitely reinvest a portion of its non-U.S. undistributed earnings for which tax had previously been provided, and tax
planning in the fiscal fourth quarter. For the full year, the net impact to the Company’s EPS from tax variances to initial
guidance was approximately $0.34. The adjusted tax rate was derived by re-computing the expected annual effective tax rate
on earnings from adjusted net income.7 The adjusted tax expense differs from the GAAP tax expense based on the taxability
or deductibility and tax rate applied to each of the adjustments.
Cash Flow Operating cash flow for the fourth quarter was $251 million and free cash flow2 was $231 million. For the full year, AECOM
generated operating cash flow of $697 million and free cash flow2 of $618 million, which was within the Company’s guidance
of $600 million to $800 million for a third consecutive year.
Balance Sheet and Capital Allocation As of September 30, 2017, AECOM had $802 million of total cash and cash equivalents, $3.1 billion of net debt and $992 million in unused capacity under its $1.05 billion revolving credit facility. Total debt has declined by $1.4 billion since closing the URS acquisition in October 2014. During the fiscal fourth quarter, AECOM announced a formalized capital allocation policy and the authorization by the Company’s Board of Directors of a new $1 billion stock repurchase program. Key features of the capital allocation policy include the following:
• Allocating substantially all free cash flow2 to debt reduction until achieving net debt-to-EBITDA5 of 2.5x, which is expected to occur by the end of fiscal year 2018.
• Upon achievement of 2.5x net leverage, the Company intends to return substantially all free cash flow to investors through the new $1 billion stock repurchase authorization as part of the longer-term capital allocation framework.
• Acquisitions are expected to be limited to strategic, niche targets that will not adversely impact the Company’s 2.5x net leverage target.
Financial Outlook AECOM is initiating fiscal year 2018 financial guidance as follows: Fiscal Year 2018 Outlook
Adjusted EBITDA1 $910 million
Adjusted EPS1 $2.50 – $2.90
Free Cash Flow2 $600 million – $800 million
Interest Expense (excluding amortization of deferred financing fees)
$210 million
Amortization8 $90 million
Full-Year Share Count 162 million
Effective Tax Rate for Adjusted Earnings7 21%
Capital Expenditures9 $110 million Included in the Company’s fiscal 2018 guidance is approximately $20 million to $25 million of costs to drive additional efficiencies across the enterprise, which are anticipated to be primarily incurred during the first quarter of fiscal 2018. Conference Call AECOM is hosting a conference call today at 12 p.m. EST, during which management will make a brief presentation focusing
on the Company's results, strategies and operating trends. Interested parties can listen to the conference call and view
accompanying slides via webcast at http://investors.aecom.com. The webcast will be available for replay following the call.
1 Excluding acquisition and integration related expenses, financing charges in interest expense, the amortization of intangible assets, and
financial impacts associated with expected and actual dispositions of non-core businesses and assets. If an individual adjustment has no
financial impact then the individual adjustment is not reflected in the Regulation G Information tables. See Regulation G Information for a
reconciliation of Non-GAAP measures.
2 Free cash flow is defined as cash flow from operations less capital expenditures net of proceeds from disposals.
3 On a constant-currency basis.
4 Organic growth is at constant currency and excludes revenue associated with actual and planned non-core asset and business
dispositions. Results expressed in constant currency are presented excluding the impact from changes in currency exchange rates.
5 Net debt-to-EBITDA is comprised of EBITDA as defined in the Company’s credit agreement, which excludes stock-based compensation,
and net debt as defined as total debt on the Company’s financial statements, net of cash and cash equivalents.
6 Book-to-burn ratio is defined as the amount of wins divided by revenue recognized during the period, including revenue related to work
performed in unconsolidated joint ventures.
7 Inclusive of non-controlling interest deduction and adjusted for acquisition and integration expenses, financing charges in interest expense,
the amortization of intangible assets and financial impacts associated with actual and planned dispositions of non-core businesses and
assets.
8 Amortization of intangible assets expense includes the impact of amortization included in equity in earnings of joint ventures and non-
controlling interests.
9 Capital expenditures, net of proceeds from disposals.
About AECOM AECOM (NYSE:ACM) is built to deliver a better world. We design, build, finance and operate infrastructure assets for
governments, businesses and organizations in more than 150 countries. As a fully integrated firm, we connect knowledge and
experience across our global network of experts to help clients solve their most complex challenges. From high-performance
buildings and infrastructure, to resilient communities and environments, to stable and secure nations, our work is
transformative, differentiated and vital. A Fortune 500 firm, AECOM had revenue of approximately $18.2 billion during fiscal
year 2017. See how we deliver what others can only imagine at aecom.com and @AECOM.
All statements in this press release other than statements of historical fact are “forward-looking statements” for purposes of
federal and state securities laws, including any projections of earnings, revenue, cash flows, tax rate, share count, interest
expense, capital expenditures, amortization of intangible assets and financial fees, AECOM Capital realizations, acquisition
and integration expense, or other financial items; any statements of the plans, strategies and objectives for future operations;
and any statements regarding future economic conditions or performance. Although we believe that the expectations reflected
in our forward-looking statements are reasonable, actual results could differ materially from those projected or assumed in any
of our forward-looking statements.
Important factors that could cause our actual results, performance and achievements, or industry results to differ materially
from estimates or projections contained in our forward-looking statements include, but are not limited to, the following: our
business is cyclical and vulnerable to economic downturns and client spending reductions; we are dependent on long-term
government contracts and subject to uncertainties related to government contract appropriations; governmental agencies may
modify, curtail or terminate our contracts; government contracts are subject to audits and adjustments of contractual terms; we
may experience losses under fixed-price contracts; we have limited control over operations run through our joint venture
entities; we may be liable for misconduct by our employees or consultants or our failure to comply with laws or regulations
applicable to our business; we may not maintain adequate surety and financial capacity; we are highly leveraged and may not
be able to service our debt and guarantees; we have exposure to political and economic risks in different countries where we
operate as well as currency exchange rate fluctuations; we may not be able to retain and recruit key technical and
management personnel; we may be subject to legal claims and we may have inadequate insurance coverage; we are subject
to environmental law compliance and we may have inadequate nuclear indemnification; there may be unexpected
adjustments and cancellations related to our backlog; we are dependent on partners and third parties who may fail to satisfy
their obligations; we may not be able to manage pension costs; we may face cybersecurity issues and data loss; as well as
other additional risks and factors that could cause actual results to differ materially from our forward-looking statements set
forth in our reports filed with the Securities and Exchange Commission. We do not intend, and undertake no obligation, to
update any forward-looking statement.
This press release contains financial information calculated other than in accordance with U.S. generally accepted accounting
principles (“GAAP”). In particular, the Company believes that non-GAAP financial measures such as adjusted EPS, adjusted
EBITDA, adjusted operating income, adjusted tax rate, adjusted interest expense, organic revenue, and free cash flow also
provide a meaningful perspective on its business results as the Company utilizes this information to evaluate and manage the
business. We use adjusted EBITDA, net and operating income to exclude the impact of prior acquisitions and dispositions.
We use free cash flow to represent the cash generated after capital expenditures to maintain our business. Our non-GAAP
disclosure has limitations as an analytical tool, should not be viewed as a substitute for financial information determined in
accordance with GAAP, and should not be considered in isolation or as a substitute for analysis of our results as reported
under GAAP, nor is it necessarily comparable to non-GAAP performance measures that may be presented by other
companies. A reconciliation of these non-GAAP measures is found in the Regulation G Information tables at the back of this
release.

AECOM
Consolidated Statements of Income (in thousands, except per share data)
Three Months Ended Twelve Months Ended
Sep 30,
2016
Sep 30, 2017
%
Change
Sep 30, 2016
Sep 30,
2017
% Change
Revenue $ 4,323,096 $ 4,856,388 12.3 % $ 17,410,825 $ 18,203,402 4.6 % Cost of revenue 4,175,917 4,686,261 12.2 % 16,768,001 17,519,682 4.5 %
Gross profit 147,179 170,127 15.6 % 642,824 683,720 6.4 % Equity in earnings of joint ventures 21,240 31,915 50.3 % 104,032 141,582 36.1 % General and administrative expenses (28,131 ) (36,882 ) 31.1 % (115,088 ) (133,309 ) 15.8 % Acquisition and integration expenses (71,215 ) (3,300 ) (95.4)% (213,642 ) (38,709 ) (81.9)% (Loss) gain on disposal activities — — 0.0 % (42,589 ) 572 (101.3)%
Income from operations 69,073 161,860 134.3 % 375,537 653,856 74.1 % Other income 2,894 2,399 (17.1)% 8,180 6,636 (18.9)% Interest expense (73,405 ) (54,325 ) (26.0)% (258,162 ) (231,310 ) (10.4)%
(Loss) income before income tax expense (1,438 ) 109,934 NM 125,555 429,182 241.8 %
Income tax (benefit) expense (14,325 ) 6,150 (142.9)% (37,917 ) 7,706 (120.3)%
Net income 12,887 103,784 NM 163,472 421,476 157.8 %
Noncontrolling interests in income of
consolidated subsidiaries, net of tax (5,683 ) (15,296 ) 169.2 % (67,363 ) (82,086 ) 21.9 %
Net income attributable to AECOM $ 7,204 $ 88,488 NM $ 96,109 $ 339,390 253.1 %
Net income attributable to AECOM per
share:
Basic $ 0.05 $ 0.56 NM $ 0.62 $ 2.18 251.6 %
Diluted $ 0.05 $ 0.55 NM $ 0.62 $ 2.13 243.5 %
Weighted average shares outstanding:
Basic 156,320 157,529 0.8 % 154,772 155,728 0.6 % Diluted 157,856 161,076 2.0 % 156,073 159,135 2.0 %
Balance Sheet and Cash Flow Information (in thousands)
September 30,
2016 September 30,
2017
Balance Sheet Information:
Total cash and cash equivalents $ 692,145 $ 802,362
Accounts receivable – net 4,531,460 5,127,743
Working capital 696,015 1,103,843
Total debt, excluding unamortized debt issuance costs 4,125,290 3,896,398
Total assets 13,669,936 14,396,956
Total AECOM stockholders’ equity 3,366,921 3,996,126
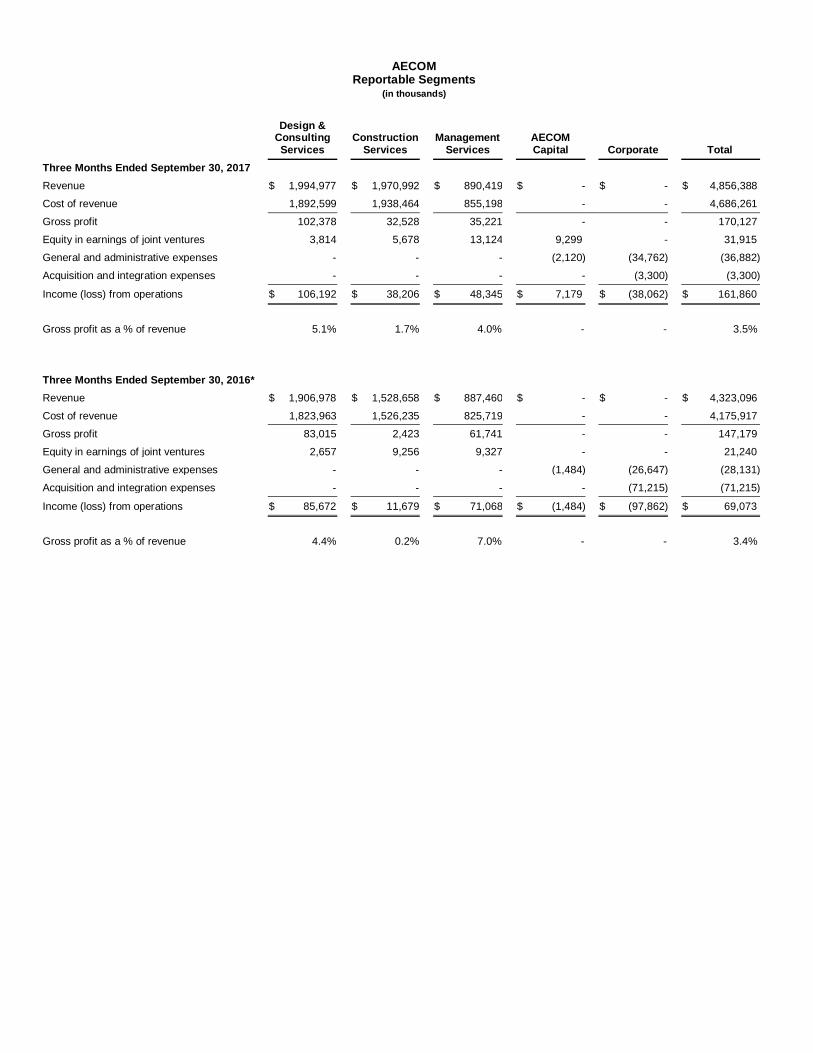
AECOM Reportable Segments
(in thousands)
Design & Consulting Services
Construction Services
Management Services
AECOM Capital
Corporate Total
Three Months Ended September 30, 2017
Revenue $ 1,994,977 $ 1,970,992 $ 890,419 $ - $ - $ 4,856,388
Cost of revenue 1,892,599 1,938,464 855,198 - - 4,686,261
Gross profit 102,378 32,528 35,221 - - 170,127
Equity in earnings of joint ventures 3,814 5,678 13,124 9,299 - 31,915
General and administrative expenses - - - (2,120) (34,762) (36,882)
Acquisition and integration expenses - - - - (3,300) (3,300)
Income (loss) from operations $ 106,192 $ 38,206 $ 48,345 $ 7,179 $ (38,062) $ 161,860
Gross profit as a % of revenue 5.1% 1.7% 4.0% - - 3.5%
Three Months Ended September 30, 2016*
Revenue $ 1,906,978 $ 1,528,658 $ 887,460 $ - $ - $ 4,323,096
Cost of revenue 1,823,963 1,526,235 825,719 - - 4,175,917
Gross profit 83,015 2,423 61,741 - - 147,179
Equity in earnings of joint ventures 2,657 9,256 9,327 - - 21,240
General and administrative expenses - - - (1,484) (26,647) (28,131)
Acquisition and integration expenses - - - - (71,215) (71,215)
Income (loss) from operations $ 85,672 $ 11,679 $ 71,068 $ (1,484) $ (97,862) $ 69,073
Gross profit as a % of revenue 4.4% 0.2% 7.0% - - 3.4%
AECOM Reportable Segments
(in thousands)
Design & Consulting Services
Construction Services
Management Services
AECOM Capital Corporate Total
Twelve Months Ended September 30, 2017
Revenue $ 7,566,800 $ 7,295,553 $ 3,341,049 $ - $ - $ 18,203,402
Cost of revenue 7,171,921 7,202,663 3,145,098 - - 17,519,682
Gross profit 394,879 92,890 195,951 - - 683,720
Equity in earnings of joint ventures 16,392 22,274 45,190 57,726 - 141,582
General and administrative expenses - - - (8,714) (124,595) (133,309)
Acquisition and integration expenses - - - - (38,709) (38,709)
Gain on disposal activities 572 - - - - 572
Income (loss) from operations $ 411,843 $ 115,164 $ 241,141 $ 49,012 $ (163,304) $ 653,856
Gross profit as a % of revenue 5.2% 1.3% 5.9% - - 3.8%
Contracted backlog $ 8,790,860 $ 12,298,947 $ 3,144,225 $ - $ - $ 24,234,032
Awarded backlog 7,342,989 4,015,274 8,600,755 - - 19,959,018
Unconsolidated JV backlog - 2,344,320 1,012,506 - - 3,356,826
Total backlog $ 16,133,849 $ 18,658,541 $ 12,757,486 $ - $ - $ 47,549,876
Twelve Months Ended September 30, 2016*
Revenue $ 7,655,803 $ 6,371,119 $ 3,383,903 $ - $ - $ 17,410,825
Cost of revenue 7,273,291 6,345,721 3,148,989 - - 16,768,001
Gross profit 382,512 25,398 234,914 - - 642,824
Equity in earnings of joint ventures 8,859 18,162 77,011 - - 104,032
General and administrative expenses - - - (6,042) (109,046) (115,088)
Acquisition and integration expenses - - - - (213,642) (213,642)
Loss on disposal activities - (42,589) - - - (42,589)
Income (loss) from operations $ 391,371 $ 971 $ 311,925 $ (6,042) $ (322,688) $ 375,537
Gross profit as a % of revenue 5.0% 0.4% 6.9% - 3.7%
Contracted backlog $ 8,035,454 $ 11,962,511 $ 3,711,723 $ - $ - $ 23,709,688
Awarded backlog 6,328,531 5,132,931 3,945,313 - - 15,406,775
Unconsolidated JV backlog - 2,612,668 1,042,070 - - 3,654,738
Total backlog $ 14,363,985 $ 19,708,110 $ 8,699,106 $ - $ - $ 42,771,201
* During the first quarter of fiscal year 2017, a maintenance related operation previously reported within our CS segment was realigned within our MS segment to reflect present
management oversight. Accordingly, to conform to the current period presentation approximately $31 million of revenue and $30 million of cost of revenue was reclassified for the quarter ended September 30, 2016. For the twelve months ended September 30, 2016, $130 million of revenue and $124 million of cost of revenue was reclassified.
AECOM
Regulation G Information (in millions)
Reconciliation of Amounts Provided by Acquired Companies
Three Months Ended
September 30, 2017
Twelve Months Ended
September 30, 2017
Total
Provided by Acquired
Companies
Excluding Effect of Acquired
Companies Total
Provided by Acquired
Companies
Excluding Effect of Acquired
Companies
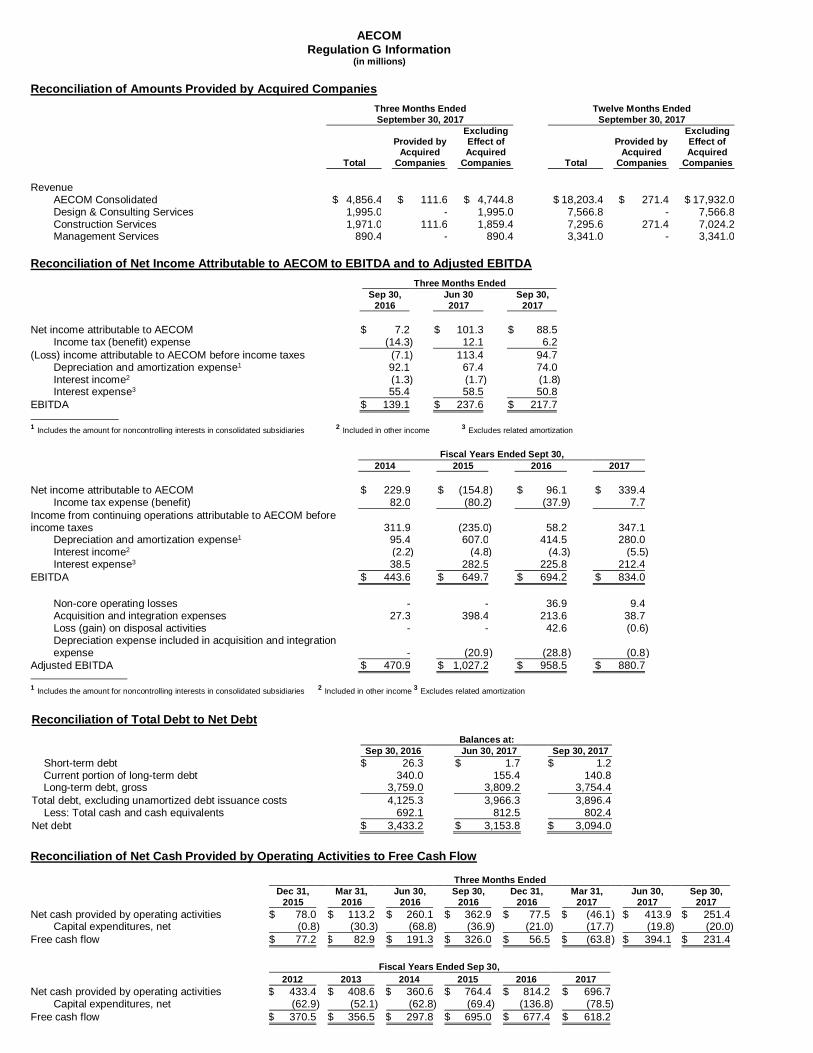
Revenue AECOM Consolidated $ 4,856.4 $ 111.6 $ 4,744.8 $ 18,203.4 $ 271.4 $ 17,932.0 Design & Consulting Services 1,995.0 - 1,995.0 7,566.8 - 7,566.8 Construction Services 1,971.0 111.6 1,859.4 7,295.6 271.4 7,024.2 Management Services 890.4 - 890.4 3,341.0 - 3,341.0
Reconciliation of Net Income Attributable to AECOM to EBITDA and to Adjusted EBITDA
Three Months Ended
Sep 30,
2016
Jun 30
2017
Sep 30,
2017
Net income attributable to AECOM $ 7.2 $ 101.3 $ 88.5 Income tax (benefit) expense (14.3 ) 12.1 6.2
(Loss) income attributable to AECOM before income taxes (7.1 ) 113.4 94.7 Depreciation and amortization expense1 92.1 67.4 74.0 Interest income2 (1.3 ) (1.7 ) (1.8 ) Interest expense3 55.4 58.5 50.8
EBITDA $ 139.1 $ 237.6 $ 217.7
1 Includes the amount for noncontrolling interests in consolidated subsidiaries 2 Included in other income 3 Excludes related amortization
Fiscal Years Ended Sept 30,
2014 2015 2016 2017
Net income attributable to AECOM $ 229.9 $ (154.8 ) $ 96.1 $ 339.4 Income tax expense (benefit) 82.0 (80.2 ) (37.9 ) 7.7
Income from continuing operations attributable to AECOM before income taxes 311.9 (235.0 ) 58.2 347.1
Depreciation and amortization expense1 95.4 607.0 414.5 280.0 Interest income2 (2.2 ) (4.8 ) (4.3 ) (5.5 ) Interest expense3 38.5 282.5 225.8 212.4
EBITDA $ 443.6 $ 649.7 $ 694.2 $ 834.0
Non-core operating losses - - 36.9 9.4 Acquisition and integration expenses 27.3 398.4 213.6 38.7 Loss (gain) on disposal activities - - 42.6 (0.6 ) Depreciation expense included in acquisition and integration
expense - (20.9 ) (28.8 ) (0.8 )
Adjusted EBITDA $ 470.9 $ 1,027.2 $ 958.5 $ 880.7
1 Includes the amount for noncontrolling interests in consolidated subsidiaries 2 Included in other income 3 Excludes related amortization
Reconciliation of Total Debt to Net Debt
Balances at:
Sep 30, 2016 Jun 30, 2017 Sep 30, 2017
Short-term debt $ 26.3 $ 1.7 $ 1.2 Current portion of long-term debt 340.0 155.4 140.8 Long-term debt, gross 3,759.0 3,809.2 3,754.4
Total debt, excluding unamortized debt issuance costs 4,125.3 3,966.3 3,896.4 Less: Total cash and cash equivalents 692.1 812.5 802.4
Net debt $ 3,433.2 $ 3,153.8 $ 3,094.0
Reconciliation of Net Cash Provided by Operating Activities to Free Cash Flow
Three Months Ended
Dec 31,
2015
Mar 31,
2016
Jun 30,
2016
Sep 30,
2016
Dec 31,
2016
Mar 31,
2017
Jun 30,
2017
Sep 30,
2017
Net cash provided by operating activities $ 78.0 $ 113.2 $ 260.1 $ 362.9 $ 77.5 $ (46.1 ) $ 413.9 $ 251.4 Capital expenditures, net (0.8 ) (30.3 ) (68.8 ) (36.9 ) (21.0 ) (17.7 ) (19.8 ) (20.0 )
Free cash flow $ 77.2 $ 82.9 $ 191.3 $ 326.0 $ 56.5 $ (63.8 ) $ 394.1 $ 231.4
Fiscal Years Ended Sep 30,
2012 2013 2014 2015 2016 2017
Net cash provided by operating activities $ 433.4 $ 408.6 $ 360.6 $ 764.4 $ 814.2 $ 696.7 Capital expenditures, net (62.9 ) (52.1 ) (62.8 ) (69.4 ) (136.8 ) (78.5 )
Free cash flow $ 370.5 $ 356.5 $ 297.8 $ 695.0 $ 677.4 $ 618.2
AECOM
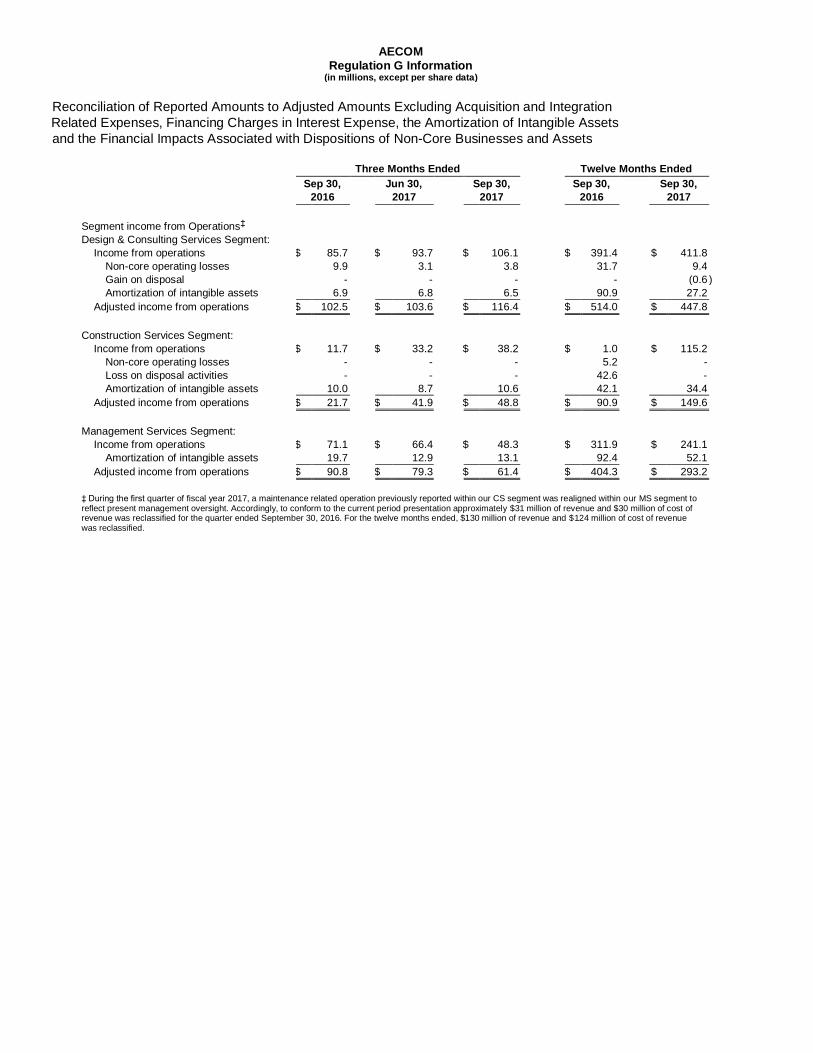
Regulation G Information (in millions, except per share data)
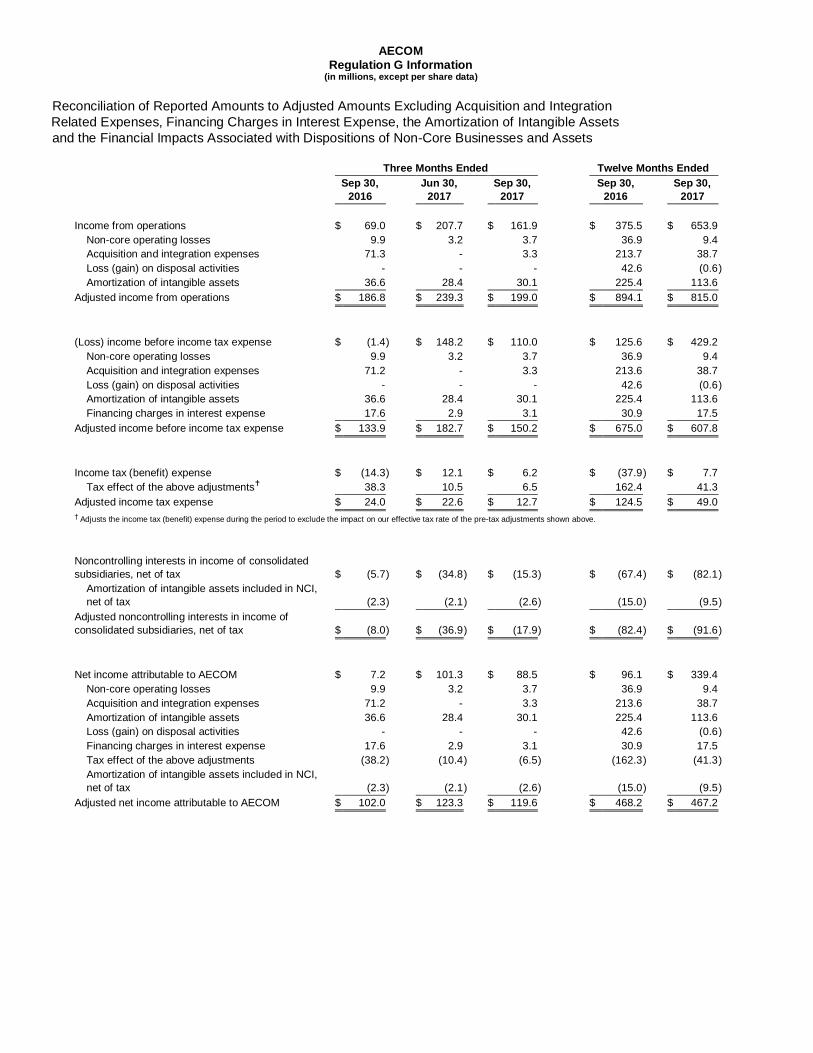
Reconciliation of Reported Amounts to Adjusted Amounts Excluding Acquisition and Integration
Related Expenses, Financing Charges in Interest Expense, the Amortization of Intangible Assets
and the Financial Impacts Associated with Dispositions of Non-Core Businesses and Assets
Three Months Ended Twelve Months Ended
Sep 30,
2016
Jun 30,
2017
Sep 30,
2017
Sep 30,
2016
Sep 30,
2017
Income from operations $ 69.0 $ 207.7 $ 161.9 $ 375.5 $ 653.9
Non-core operating losses 9.9 3.2 3.7 36.9 9.4
Acquisition and integration expenses 71.3 - 3.3 213.7 38.7
Loss (gain) on disposal activities - - - 42.6 (0.6 )
Amortization of intangible assets 36.6 28.4 30.1 225.4 113.6
Adjusted income from operations $ 186.8 $ 239.3 $ 199.0 $ 894.1 $ 815.0
(Loss) income before income tax expense $ (1.4 ) $ 148.2 $ 110.0 $ 125.6 $ 429.2
Non-core operating losses 9.9 3.2 3.7 36.9 9.4
Acquisition and integration expenses 71.2 - 3.3 213.6 38.7
Loss (gain) on disposal activities - - - 42.6 (0.6 )
Amortization of intangible assets 36.6 28.4 30.1 225.4 113.6
Financing charges in interest expense 17.6 2.9 3.1 30.9 17.5
Adjusted income before income tax expense $ 133.9 $ 182.7 $ 150.2 $ 675.0 $ 607.8
Income tax (benefit) expense $ (14.3 ) $ 12.1 $ 6.2 $ (37.9 ) $ 7.7
Tax effect of the above adjustments 38.3 10.5 6.5 162.4 41.3
Adjusted income tax expense $ 24.0 $ 22.6 $ 12.7 $ 124.5 $ 49.0
† Adjusts the income tax (benefit) expense during the period to exclude the impact on our effective tax rate of the pre-tax adjustments shown above.
Noncontrolling interests in income of consolidated
subsidiaries, net of tax $ (5.7 ) $ (34.8 ) $ (15.3 ) $ (67.4 ) $ (82.1 )
Amortization of intangible assets included in NCI,
net of tax (2.3 ) (2.1 ) (2.6 ) (15.0 ) (9.5 )
Adjusted noncontrolling interests in income of
consolidated subsidiaries, net of tax $ (8.0 ) $ (36.9 ) $ (17.9 ) $ (82.4 ) $ (91.6 )
Net income attributable to AECOM $ 7.2 $ 101.3 $ 88.5 $ 96.1 $ 339.4
Non-core operating losses 9.9 3.2 3.7 36.9 9.4
Acquisition and integration expenses 71.2 - 3.3 213.6 38.7
Amortization of intangible assets 36.6 28.4 30.1 225.4 113.6
Loss (gain) on disposal activities - - - 42.6 (0.6 )
Financing charges in interest expense 17.6 2.9 3.1 30.9 17.5
Tax effect of the above adjustments (38.2 ) (10.4 ) (6.5 ) (162.3 ) (41.3 )
Amortization of intangible assets included in NCI,
net of tax (2.3 ) (2.1 ) (2.6 ) (15.0 ) (9.5 )
Adjusted net income attributable to AECOM $ 102.0 $ 123.3 $ 119.6 $ 468.2 $ 467.2
AECOM
Regulation G Information (in millions, except per share data)
Reconciliation of Reported Amounts to Adjusted Amounts Excluding Acquisition and Integration
Related Expenses, Financing Charges in Interest Expense, the Amortization of Intangible Assets
and the Financial Impacts Associated with Dispositions of Non-Core Businesses and Assets
Three Months Ended Twelve Months Ended
Sep 30,
2016
Jun 30,
2017
Sep 30,
2017
Sep 30,
2016
Sep 30,
2017
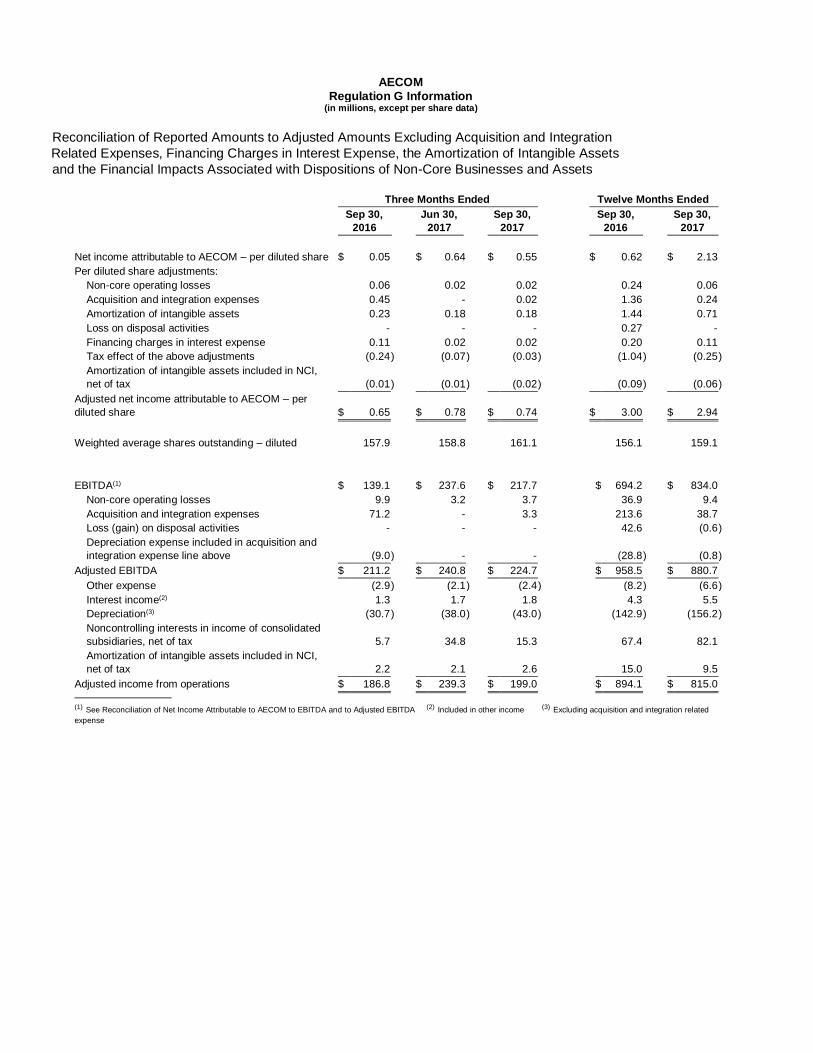
Net income attributable to AECOM – per diluted share $ 0.05 $ 0.64 $ 0.55 $ 0.62 $ 2.13
Per diluted share adjustments:
Non-core operating losses 0.06 0.02 0.02 0.24 0.06
Acquisition and integration expenses 0.45 - 0.02 1.36 0.24
Amortization of intangible assets 0.23 0.18 0.18 1.44 0.71
Loss on disposal activities - - - 0.27 -
Financing charges in interest expense 0.11 0.02 0.02 0.20 0.11
Tax effect of the above adjustments (0.24 ) (0.07 ) (0.03 ) (1.04 ) (0.25 )
Amortization of intangible assets included in NCI,
net of tax (0.01 ) (0.01 ) (0.02 ) (0.09 ) (0.06 )
Adjusted net income attributable to AECOM – per
diluted share $ 0.65 $ 0.78 $ 0.74 $ 3.00 $ 2.94
Weighted average shares outstanding – diluted 157.9 158.8 161.1 156.1 159.1
EBITDA(1) $ 139.1 $ 237.6 $ 217.7 $ 694.2 $ 834.0
Non-core operating losses 9.9 3.2 3.7 36.9 9.4
Acquisition and integration expenses 71.2 - 3.3 213.6 38.7
Loss (gain) on disposal activities - - - 42.6 (0.6 )
Depreciation expense included in acquisition and
integration expense line above (9.0 ) - - (28.8 ) (0.8 )
Adjusted EBITDA $ 211.2 $ 240.8 $ 224.7 $ 958.5 $ 880.7
Other expense (2.9 ) (2.1 ) (2.4 ) (8.2 ) (6.6 )
Interest income(2) 1.3 1.7 1.8 4.3 5.5
Depreciation(3) (30.7 ) (38.0 ) (43.0 ) (142.9 ) (156.2 )
Noncontrolling interests in income of consolidated
subsidiaries, net of tax 5.7 34.8 15.3 67.4 82.1
Amortization of intangible assets included in NCI,
net of tax 2.2 2.1 2.6 15.0 9.5
Adjusted income from operations $ 186.8 $ 239.3 $ 199.0 $ 894.1 $ 815.0
(1) See Reconciliation of Net Income Attributable to AECOM to EBITDA and to Adjusted EBITDA (2) Included in other income (3) Excluding acquisition and integration related
expense
AECOM
Regulation G Information (in millions, except per share data)
Reconciliation of Reported Amounts to Adjusted Amounts Excluding Acquisition and Integration
Related Expenses, Financing Charges in Interest Expense, the Amortization of Intangible Assets
and the Financial Impacts Associated with Dispositions of Non-Core Businesses and Assets
Three Months Ended Twelve Months Ended
Sep 30,
2016
Jun 30,
2017
Sep 30,
2017
Sep 30,
2016
Sep 30,
2017
Segment income from Operations‡
Design & Consulting Services Segment:
Income from operations $ 85.7 $ 93.7 $ 106.1 $ 391.4 $ 411.8
Non-core operating losses 9.9 3.1 3.8 31.7 9.4
Gain on disposal - - - - (0.6 )
Amortization of intangible assets 6.9 6.8 6.5 90.9 27.2
Adjusted income from operations $ 102.5 $ 103.6 $ 116.4 $ 514.0 $ 447.8
Construction Services Segment:
Income from operations $ 11.7 $ 33.2 $ 38.2 $ 1.0 $ 115.2
Non-core operating losses - - - 5.2 -
Loss on disposal activities - - - 42.6 -
Amortization of intangible assets 10.0 8.7 10.6 42.1 34.4
Adjusted income from operations $ 21.7 $ 41.9 $ 48.8 $ 90.9 $ 149.6
Management Services Segment:
Income from operations $ 71.1 $ 66.4 $ 48.3 $ 311.9 $ 241.1
Amortization of intangible assets 19.7 12.9 13.1 92.4 52.1
Adjusted income from operations $ 90.8 $ 79.3 $ 61.4 $ 404.3 $ 293.2
‡ During the first quarter of fiscal year 2017, a maintenance related operation previously reported within our CS segment was realigned within our MS segment to reflect present management oversight. Accordingly, to conform to the current period presentation approximately $31 million of revenue and $30 million of cost of revenue was reclassified for the quarter ended September 30, 2016. For the twelve months ended, $130 million of revenue and $124 million of cost of revenue was reclassified.
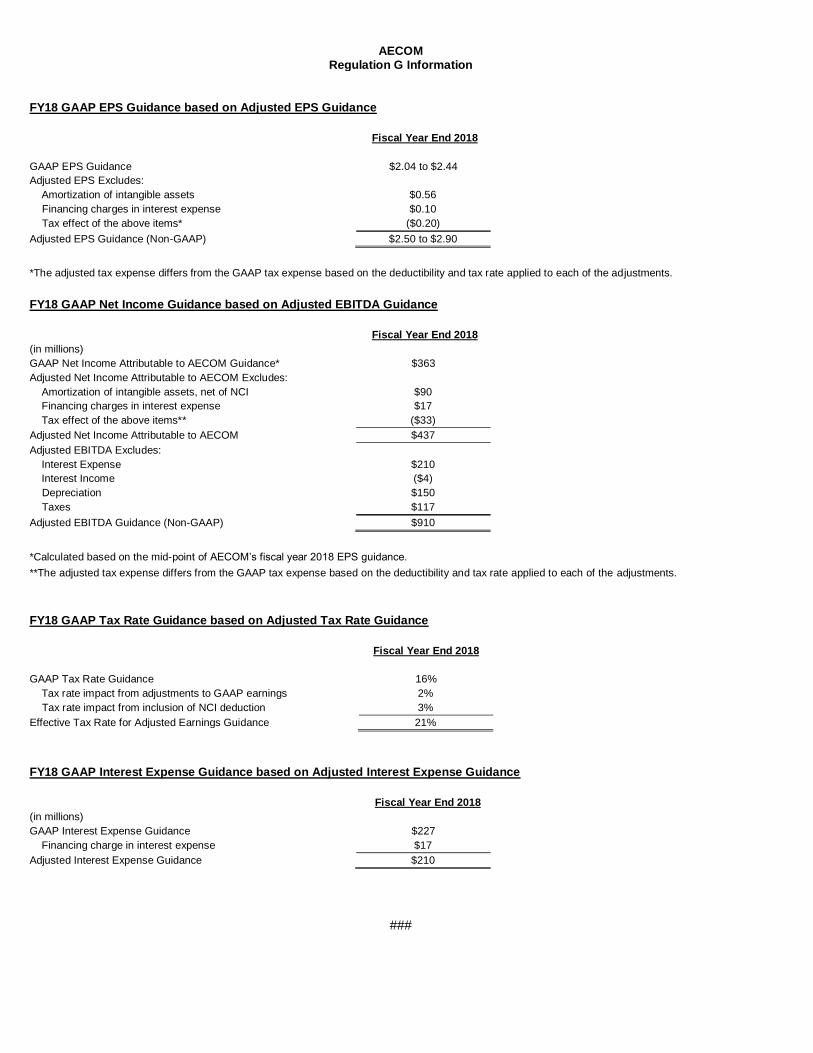
AECOM
Regulation G Information
FY18 GAAP EPS Guidance based on Adjusted EPS Guidance
Fiscal Year End 2018
GAAP EPS Guidance $2.04 to $2.44
Adjusted EPS Excludes:
Amortization of intangible assets $0.56
Financing charges in interest expense $0.10
Tax effect of the above items* ($0.20)
Adjusted EPS Guidance (Non-GAAP) $2.50 to $2.90
*The adjusted tax expense differs from the GAAP tax expense based on the deductibility and tax rate applied to each of the adjustments.
FY18 GAAP Net Income Guidance based on Adjusted EBITDA Guidance
Fiscal Year End 2018
(in millions)
GAAP Net Income Attributable to AECOM Guidance* $363
Adjusted Net Income Attributable to AECOM Excludes:
Amortization of intangible assets, net of NCI $90
Financing charges in interest expense $17
Tax effect of the above items** ($33)
Adjusted Net Income Attributable to AECOM $437
Adjusted EBITDA Excludes:
Interest Expense $210
Interest Income ($4)
Depreciation $150
Taxes $117
Adjusted EBITDA Guidance (Non-GAAP) $910
*Calculated based on the mid-point of AECOM’s fiscal year 2018 EPS guidance.
**The adjusted tax expense differs from the GAAP tax expense based on the deductibility and tax rate applied to each of the adjustments.
FY18 GAAP Tax Rate Guidance based on Adjusted Tax Rate Guidance
Fiscal Year End 2018
GAAP Tax Rate Guidance 16%
Tax rate impact from adjustments to GAAP earnings 2%
Tax rate impact from inclusion of NCI deduction 3%
Effective Tax Rate for Adjusted Earnings Guidance 21%
FY18 GAAP Interest Expense Guidance based on Adjusted Interest Expense Guidance
Fiscal Year End 2018
(in millions)
GAAP Interest Expense Guidance $227
Financing charge in interest expense $17
Adjusted Interest Expense Guidance $210
###