aegilops tauschii chromosome 3ds - springer · makes use of bac libraries constructed from dna of...
TRANSCRIPT

Fleury et al. BMC Genomics 2010, 11:382http://www.biomedcentral.com/1471-2164/11/382
Open AccessR E S E A R C H A R T I C L E
Research articlePhysical mapping of a large plant genome using global high-information-content-fingerprinting: the distal region of the wheat ancestor Aegilops tauschii chromosome 3DSDelphine Fleury*1, Ming-Cheng Luo2, Jan Dvorak2, Luke Ramsay3, Bikram S Gill4, Olin D Anderson5, Frank M You2, Zahra Shoaei1, Karin R Deal2 and Peter Langridge1
AbstractBackground: Physical maps employing libraries of bacterial artificial chromosome (BAC) clones are essential for comparative genomics and sequencing of large and repetitive genomes such as those of the hexaploid bread wheat. The diploid ancestor of the D-genome of hexaploid wheat (Triticum aestivum), Aegilops tauschii, is used as a resource for wheat genomics. The barley diploid genome also provides a good model for the Triticeae and T. aestivum since it is only slightly larger than the ancestor wheat D genome. Gene co-linearity between the grasses can be exploited by extrapolating from rice and Brachypodium distachyon to Ae. tauschii or barley, and then to wheat.
Results: We report the use of Ae. tauschii for the construction of the physical map of a large distal region of chromosome arm 3DS. A physical map of 25.4 Mb was constructed by anchoring BAC clones of Ae. tauschii with 85 EST on the Ae. tauschii and barley genetic maps. The 24 contigs were aligned to the rice and B. distachyon genomic sequences and a high density SNP genetic map of barley. As expected, the mapped region is highly collinear to the orthologous chromosome 1 in rice, chromosome 2 in B. distachyon and chromosome 3H in barley. However, the chromosome scale of the comparative maps presented provides new insights into grass genome organization. The disruptions of the Ae. tauschii-rice and Ae. tauschii-Brachypodium syntenies were identical. We observed chromosomal rearrangements between Ae. tauschii and barley. The comparison of Ae. tauschii physical and genetic maps showed that the recombination rate across the region dropped from 2.19 cM/Mb in the distal region to 0.09 cM/Mb in the proximal region. The size of the gaps between contigs was evaluated by comparing the recombination rate along the map with the local recombination rates calculated on single contigs.
Conclusions: The physical map reported here is the first physical map using fingerprinting of a complete Triticeae genome. This study demonstrates that global fingerprinting of the large plant genomes is a viable strategy for generating physical maps. Physical maps allow the description of the co-linearity between wheat and grass genomes and provide a powerful tool for positional cloning of new genes.
BackgroundAlthough wheat is a major food for the world populationand the most extensively grown crop, progress in genom-ics had been slowed due to the size and the complexity ofthe genome. The hexaploid genome of common wheat(Triticum aestivum) contains 16,000 Mb of DNA orga-
nized into three genomes, A, B and D, with 7 chromo-somes each. This makes the wheat genome far larger thanthe sequenced rice genome at 430 Mb [1] and Brachypo-dium genome at 271 Mb [2]. T. aestivum evolved via twohybridization events. The first event combined the A andB genomes into tetraploid wheat while the second hybrid-ization event, which took place only about 8,500 yearsago [3] and involved tetraploid wheat and diploid Ae.tauschii [4], contributed the D genome. Due to the recent
* Correspondence: [email protected] Australian Centre for Plant Functional Genomics, University of Adelaide, PMB1, Glen Osmond SA 5064, AustraliaFull list of author information is available at the end of the article
© 2010 Fleury et al; licensee BioMed Central Ltd. This is an Open Access article distributed under the terms of the Creative CommonsAttribution License (http://creativecommons.org/licenses/by/2.0), which permits unrestricted use, distribution, and reproduction inany medium, provided the original work is properly cited.

Fleury et al. BMC Genomics 2010, 11:382http://www.biomedcentral.com/1471-2164/11/382
Page 2 of 10
origin of T. aestivum and limited gene-flow from Ae.tauschii [5], the D genome shows low polymorphism, andthe genetic maps of the D genome chromosomes stilltend to be poor.
Physical mapping strategies employing libraries of bac-terial artificial chromosome (BAC) clones can potentiallygenerate maps of a genome without extensive polymor-phism and facilitate studying the structure of the genome,comparison with other genomes and map-based cloningof genes. Physical maps are also the prerequisite step forthe sequencing and assembly of large and repetitivegenomes such as those of wheat. Most physical mappingin wheat has generally targeted small regions covered by afew BAC clones. Two recent studies presenting physicalmap of the wheat chromosome 3B [6] and the short armof chromosome 3AS and 3DS [7] exemplify a strategyadopted by the International Wheat Genome SequencingConsortium http://www.wheatgenome.org/ for physicalmapping of the 21 wheat chromosomes. The strategymakes use of BAC libraries constructed from DNA of sin-gle chromosomes or single chromosome arms isolated bychromosome or chromosome arm flow sorting [8]. Acomplementary approach is to construct physical maps ofwheat diploid relatives and use the maps for the construc-tion of the physical maps of the wheat chromosomes. Ofthe three diploid ancestors of T. aestivum, this strategy isthe most applicable to Ae. tauschii because of highhomology between its chromosomes and those of thewheat D genome. To further enhance the utility of Ae.tauschii physical map for using it as a resource for wheatD-genome genomics, an accession from the presumptivearea of the origin of T. aestivum [5] showing a shortgenetic distance to the wheat D genome was used for theconstruction of Ae. tauschii BAC libraries [9] and BACcontigs [10]. This accession has also been used recentlyfor the construction of extensive comparative map of Ae.tauschii based on ESTs (expressed-sequence-tags) withthe rice and sorghum genome sequences [11].
The barley diploid genome is only slightly larger thanthe wheat D genome and, like Ae. tauschii, genetic mapsare well populated with molecular markers making itanother good model for the Triticeae and T. aestivum.Barley and Ae. tauschii comparative mapping have shownthat the grass genomes are highly collinear and geneorder is conserved across chromosomes [11,12]. Gene co-linearity can be exploited by extrapolating the knowledgeobtained on simpler model species to more complex spe-cies: from rice or sorghum to Ae. tauschii or barley, andthen from them to wheat.
Here we report the construction of the physical map ofa large portion of Ae. tauschii chromosome arm 3DSdelineated by an X-ray induced deletion mutation calledpairing homoeologous 2a (ph2a) and initially located onthe distal 20 cM of the arm [13]. We describe here the
assembly of Ae. tauschii BACs into contigs and theirordering based on the Ae. tauschii comparative geneticmap [11]. By superimposing the physical map of the 3DSregion on the Ae. tauschii recombination map, we esti-mate recombination rates along the chromosome armand the gaps in the physical map. We also describe itssynteny with Brachypodium and rice genomic sequencesand the barley genetic map.
ResultsPhysical map of a distal region of chromosome 3DS in Ae. tauschiiUsing the southern blot data from a previous study [13],we first identified the wheat deletion bins [14] overlap-ping the ph2a deletion. Among 53 ESTs mapped into theregion deleted in ph2a, 8 EST mapped to 6 deletion binsof group 3 chromosomes: the telomeric bin 3AS4-0.45-1.00; the 3 bins 3BS8, 3BS9 and 3BS1 covering the chro-mosome arm from 0.33 to 1.00 (ratio of chromosome armlength); the bins 3DS6 and 3DS3 from position 0.24 to1.00 [14]. The GrainGenes database http://wheat.pw.usda.gov contained a total of 591 ESTs that hadbeen mapped to these 6 bins. These ESTs including 53EST mapped within the ph2a deletion were assembledinto 151 unigenes according to the DFCI wheat geneindex database http://compbio.dfci.harvard.edu/tgi andused for BAC anchoring. To decrease the chance ofhybridizing repeat elements, probes used for the BAClibrary screening contained only exon sequence. PCRproducts for 110 unigenes of wheat were verified bydirect sequencing and used as markers. Eighty probesgave clean results by hybridization onto restricted DNAof nullisomic-tetrasomic wheat lines and were then usedfor hybridization to the Ae. tauschii BAC high densityscreening membranes.
Using 68 such probes identified 278 positive BACclones. These clones had been previously assembledbased on fingerprints into contigs containing 3,289 BACshttp://wheatdb.ucdavis.edu/. We screened the 3,289clones with 42 additional PCR markers which could notbe used for hybridization because of the poor probe qual-ity. After validation of marker presence on clones by PCR,1,802 BAC clones were re-assembled into 24 contigs witha size that ranged from 188 to 3,935 kb (Table 1). Thephysical map covered 25.4 Mb which is about one third ofthe target region initially estimated to be about 80 Mb bycomparison with rice genomic sequence [13]. The physi-cal map included a total of 90 loci, composed of 85 unige-nes and 5 genomic based markers (See Additional File 1).A contig contained an average of 3.7 markers (rangingfrom 1 to 17 markers). The genes were organized in 54gene islands defined by the presence of at least 1 gene onone BAC. Among those, 19 different gene islands were

Fleury et al. BMC Genomics 2010, 11:382http://www.biomedcentral.com/1471-2164/11/382
Page 3 of 10
identified with at least 2 genes and up to 5 genes on a sin-gle clone.
Due to the low polymorphism of the T. aestivum Dgenome, the wheat genetic maps are poorly populatedwith molecular markers and not informative enough foranchoring BAC contigs on a map. Therefore, wheneverpossible we have anchored the BAC contigs onto the Ae.tauschii genetic map built from AL8/78 × AS75 F2 map-ping population [11]. The fact that one of the parents(AL8/78) was also used for the construction of the BAClibraries greatly assisted the anchoring of contigs on thegenetic map. A contig was anchored only when a clone inthe contig and a marker on the map contributed by AL8/78 had exactly the same phenotype. Eleven EST markersand one ISBP marker were used to align 14 contigs ontothe Ae. tauschii genetic map (Figure 1 and Additional File2). The remaining contigs were ordered as follows. Con-tigs (ctg) 1, 2, 21, 23 and 24 were ordered according to the3B physical map [6]. Ctg 13, 14 and 20 were anchored andpositioned in the order of the barley genetic map. Ctg 15and 16 could not be anchored on a Triticeae map andwere ordered according to the order of orthologous genesin the rice genome.
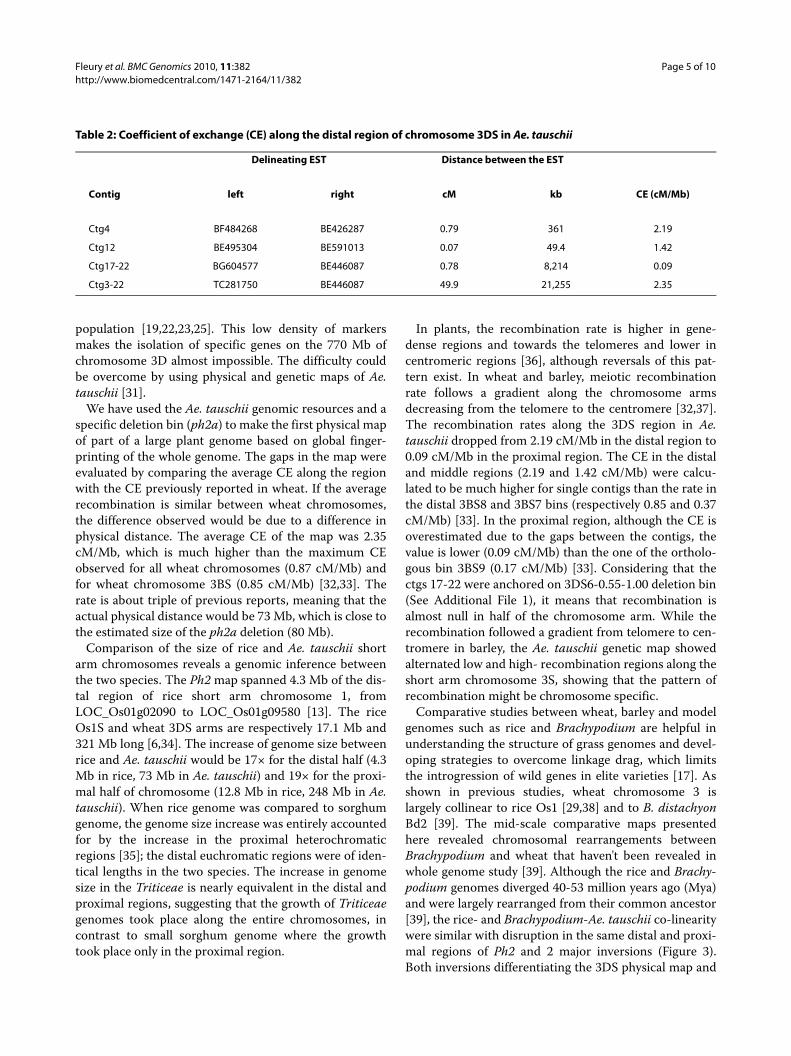
Recombination along the distal region of chromosome 3DSMeiotic recombination activity was evaluated by calculat-ing the recombination rate or coefficient of exchange(CE) in cM per Mb. Although the actual length of a contigcan not be known without BAC sequencing, the physicalsize of a contig was evaluated based on the number ofcommon bands (CB units) between BAC fingerprints.The average size of 1 CB was 1.9 kb for this Ae. tauschiilibrary http://wheatdb.ucdavis.edu. The average CE alongthe map was 2.35 cM/Mb between the most distantmarkers TC281750 of ctg3 and BE446087 of ctg22 (49.9cM and 11,187 CB) (Table 2). Local CE was also mea-sured for two pairs of markers physically linked on thectg4 and ctg12: respectively 2.19 and 1.42 cM/Mb. In theproximal region, we calculated the physical distancebetween the markers BG604577 and BE446087 by addingthe size of ctg17, 18, 19, 20, 21 and 22 neglecting the gapsbetween them. With a genetic distance of 0.78 cM, the CE
was 0.09 cM/Mb. The recombination rate decreased inAe tauschii from the distal region of ctg4, through themiddle region of ctg12 to the proximal ctg17-22.
Synteny with B. distachyon, rice and barleyBy comparing the Ae. tauschii physical map of 3DS to theB. distachyon 8× genome sequence, 53 wheat unigeneswere orthologous to B. distachyon chromosome Bd2. Adistal inversion occurred in the region between 834 and1,105 kb of Bd2 matching the ctgs 3, 4 and 5 of Ae.tauschii (Figure 2). Separated by a large conserved blockof about 2,035 kb in Brachypodium, a second large inver-sion has occurred in the proximal region between thectgs 17 to 24 of Ae. tauschii and Bd2-3,140 and Bd2-4,211kb. Compared to the rice genomic sequence, the Ae.tauschii map is highly collinear to chromosome 1 with 70wheat unigenes of the Ph2 physical map orthologous to59 rice genes of Os1 (See Additional File 1). They showedthe same chromosomal rearrangements between 3DSand Os1 that have been previously described by using thesame Ae. tauschii genetic map [11]. The synteny profile ofAe. tauschii-B. distachyon is almost identical to the one ofAe. tauschii-rice, showing the same inverted and con-served blocks (See Additional File 2).
A comparison was made with the genetic map of barley3HS derived from the Steptoe x Morex doubled haploidpopulation populated with gene-based SNP [15] andTranscript Derived Markers [16] loci. A total of 24 unige-nes homologous between wheat and barley were used tointegrate the Ae. tauschii physical map and the barleygenetic map. Sixteen contigs were therefore anchoredonto 15 barley genetic map positions (Figure 2). Syntenywas conserved on a large block between the two species,from ctg 8 to 24. A region of 8.1 cM in length in barleyhas been rearranged in Ae. tauschii between ctgs 3, 4 and5. This observation is supported by the anchoring of 3markers of ctg4, which was oriented and positioned ontothe Ae. tauschii genetic map. This rearrangement over-lapped the distal rice-Ae. tauschii inversion previouslydescribed. It could either be due to an inversion betweenAe. tauschii and barley leading to the translocation ofctg6 and 7 in a more distal region in barley, or to the
Table 1: Characteristics of the Ae. tauschii physical map of the distal region of chromosome 3DS
Total Average/contig Minimum Maximum
Contigs 24
Clones 1802 76 8 322
Loci 90 3.7 1 17
CB* 13,355 566.4 99 2,071
kb 25,374 1,057 188 3,935
* consensus band

Fleury et al. BMC Genomics 2010, 11:382http://www.biomedcentral.com/1471-2164/11/382
Page 4 of 10
proximal translocation of ctg 3-distal part of ctg4 inbarley.
The disruption of co-linearity between genomes is dueto chromosomal rearrangements which occurred after
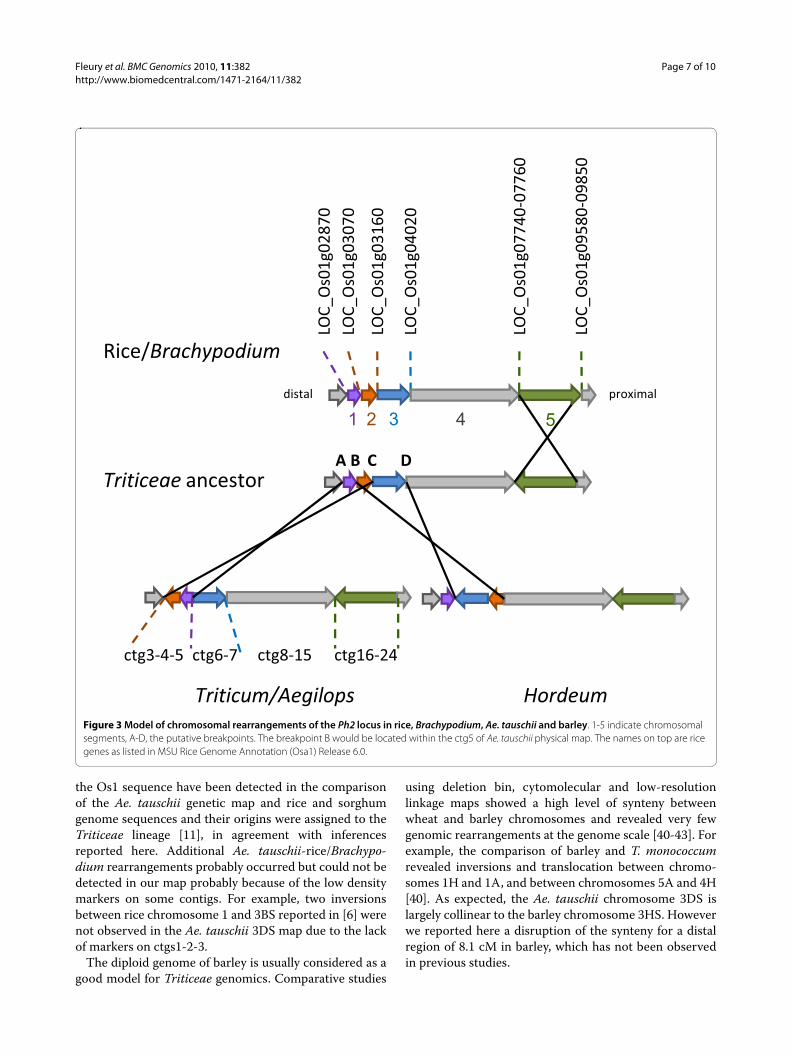
the divergence of the two species from their commonancestor [17]. With the hypothesis of minimum chromo-somal rearrangements occurring before speciation, wepropose a model explaining the discontinuities in rice, B.distachyon, barley and Ae. tauschii synteny along the dis-tal region of chromosome 3DS (Figure 3). The segment 5(corresponding to ctg 17-24) was conserved between Ae.tauschii and barley while it appeared inverted betweenAe. tauschii and rice/B. distachyon, and between barleyand rice/B. distachyon (Figure 2). This proximal inversionprobably took place in the Triticeae ancestor after itsdivergence from a common ancestor of Oryzae and Brac-hypodium lineages.
Additional rearrangements seemed to have occurred inthe distal region after the divergence of the Triticum/Aegilops lineage from the Hordeum lineage. The ctg3-4-5of the map showed inversions between Ae. tauschii andrice (LOC_Os01g02870-LOC_Os01g03160) (See Addi-tional File 2). It partially overlapped the inversionobserved between the barley region 8.9 cM-16.3 cM andthe rice sequence LOC_Os01g03070-LOC_Os01g04020(Figure 2). Thus, the segment 3 (ctg6-7) was collinearbetween rice/Brachypodium and Ae. tauschii while it wasinside the inverted block between rice and barley. Atranslocation of the ctg3-distal ctg4 segment in a moreproximal region in barley wouldn't explain the differenceof synteny of the segment 3 between Ae. tauschii, barleyand rice. A possible explanation would be some overlap-ping inversions with different chromosomal breakpointsin the Triticum/Aegilops and the Hordeum radiations(Figure 3). The block formed by segments 1 and 2 (corre-sponding to ctg3-4-5) would be inverted in the Triticum/Aegilops radiation, with the breakpoints A and C, while inHordeum, the breakpoints may have occurred in B(within ctg4) and D leading to the inversion of a blockformed by segments 2 and 3 (corresponding to a part ofctg4 and ctg5-6-7-8).
DiscussionBeside the Ph2 locus, which is a suppressor of homoeolo-gous chromosome pairing [13], other genes of interesthave been previously mapped on chromosome 3DSincluding a resistance to tan spot [18], the brittle rachisgene [19], the Gigantea gene [20] and the developmentalgene Sphaerococcoid S1 [21]. Some QTLs associated toyield components [22-24], spike length [25], black pointresistance [26], resistance to Fusarium head blight Fhb[27], and grain protein content [28] have also been identi-fied on 3DS. In addition, genes coding for several meta-bolic enzymes are located on 3DS: esterase 1, hexokinase-1,2, malic enzyme, peroxydase and triosphosphateisomerase [29]. Although a total of 57 molecular markerswere found on chromosome 3D of the consensus geneticmap of hexaploid wheat [30], the linkage group 3D usu-ally shows only 10 to 20 markers for a specific segregating
Figure 1 Ae. tauschii physical and genetic maps of chromosome 3DS. Alignment of Ae. tauschii physical map onto Ae. tauschii genetic map of chromosome 3DS. The Ae. tauschii AL8/78 × AS75 F2 genetic map used EST based markers [11].
0.0
5,000
0ctg2
ctg7
ctg3
ctg4
ctg5ctg6
ctg1
9.7
17.217.9
BF484268BE398268BE426287
17.1TC281750
9,000
ctg10
ctg8
ctg11
ctg13
ctg12
ctg14
ctg922.823.524.325.4
28.0
BF293133
BE398279isbp766
35.7TC303152
13,000
17,000
ctg16ctg15
ctg18
ctg17
41.642.442.544.9
47.948.2
53.954.054.455.058 1ctg19
BG275108
BE495304BE470848
46.9
TC283704
TC281677
TC299086
21,000
kb
ctg21
ctg20
ctg22
ctg23
ctg24
58.158.262.665.266.266.666.767.068.368.869.169.8cM
BG604577BE490164TC284450BE446087
Fleury et al. BMC Genomics 2010, 11:382http://www.biomedcentral.com/1471-2164/11/382
Page 5 of 10
population [19,22,23,25]. This low density of markersmakes the isolation of specific genes on the 770 Mb ofchromosome 3D almost impossible. The difficulty couldbe overcome by using physical and genetic maps of Ae.tauschii [31].
We have used the Ae. tauschii genomic resources and aspecific deletion bin (ph2a) to make the first physical mapof part of a large plant genome based on global finger-printing of the whole genome. The gaps in the map wereevaluated by comparing the average CE along the regionwith the CE previously reported in wheat. If the averagerecombination is similar between wheat chromosomes,the difference observed would be due to a difference inphysical distance. The average CE of the map was 2.35cM/Mb, which is much higher than the maximum CEobserved for all wheat chromosomes (0.87 cM/Mb) andfor wheat chromosome 3BS (0.85 cM/Mb) [32,33]. Therate is about triple of previous reports, meaning that theactual physical distance would be 73 Mb, which is close tothe estimated size of the ph2a deletion (80 Mb).
Comparison of the size of rice and Ae. tauschii shortarm chromosomes reveals a genomic inference betweenthe two species. The Ph2 map spanned 4.3 Mb of the dis-tal region of rice short arm chromosome 1, fromLOC_Os01g02090 to LOC_Os01g09580 [13]. The riceOs1S and wheat 3DS arms are respectively 17.1 Mb and321 Mb long [6,34]. The increase of genome size betweenrice and Ae. tauschii would be 17× for the distal half (4.3Mb in rice, 73 Mb in Ae. tauschii) and 19× for the proxi-mal half of chromosome (12.8 Mb in rice, 248 Mb in Ae.tauschii). When rice genome was compared to sorghumgenome, the genome size increase was entirely accountedfor by the increase in the proximal heterochromaticregions [35]; the distal euchromatic regions were of iden-tical lengths in the two species. The increase in genomesize in the Triticeae is nearly equivalent in the distal andproximal regions, suggesting that the growth of Triticeaegenomes took place along the entire chromosomes, incontrast to small sorghum genome where the growthtook place only in the proximal region.
In plants, the recombination rate is higher in gene-dense regions and towards the telomeres and lower incentromeric regions [36], although reversals of this pat-tern exist. In wheat and barley, meiotic recombinationrate follows a gradient along the chromosome armsdecreasing from the telomere to the centromere [32,37].The recombination rates along the 3DS region in Ae.tauschii dropped from 2.19 cM/Mb in the distal region to0.09 cM/Mb in the proximal region. The CE in the distaland middle regions (2.19 and 1.42 cM/Mb) were calcu-lated to be much higher for single contigs than the rate inthe distal 3BS8 and 3BS7 bins (respectively 0.85 and 0.37cM/Mb) [33]. In the proximal region, although the CE isoverestimated due to the gaps between the contigs, thevalue is lower (0.09 cM/Mb) than the one of the ortholo-gous bin 3BS9 (0.17 cM/Mb) [33]. Considering that thectgs 17-22 were anchored on 3DS6-0.55-1.00 deletion bin(See Additional File 1), it means that recombination isalmost null in half of the chromosome arm. While therecombination followed a gradient from telomere to cen-tromere in barley, the Ae. tauschii genetic map showedalternated low and high- recombination regions along theshort arm chromosome 3S, showing that the pattern ofrecombination might be chromosome specific.
Comparative studies between wheat, barley and modelgenomes such as rice and Brachypodium are helpful inunderstanding the structure of grass genomes and devel-oping strategies to overcome linkage drag, which limitsthe introgression of wild genes in elite varieties [17]. Asshown in previous studies, wheat chromosome 3 islargely collinear to rice Os1 [29,38] and to B. distachyonBd2 [39]. The mid-scale comparative maps presentedhere revealed chromosomal rearrangements betweenBrachypodium and wheat that haven't been revealed inwhole genome study [39]. Although the rice and Brachy-podium genomes diverged 40-53 million years ago (Mya)and were largely rearranged from their common ancestor[39], the rice- and Brachypodium-Ae. tauschii co-linearitywere similar with disruption in the same distal and proxi-mal regions of Ph2 and 2 major inversions (Figure 3).Both inversions differentiating the 3DS physical map and
Table 2: Coefficient of exchange (CE) along the distal region of chromosome 3DS in Ae. tauschii
Delineating EST Distance between the EST
Contig left right cM kb CE (cM/Mb)
Ctg4 BF484268 BE426287 0.79 361 2.19
Ctg12 BE495304 BE591013 0.07 49.4 1.42
Ctg17-22 BG604577 BE446087 0.78 8,214 0.09
Ctg3-22 TC281750 BE446087 49.9 21,255 2.35

Fleury et al. BMC Genomics 2010, 11:382http://www.biomedcentral.com/1471-2164/11/382
Page 6 of 10
Figure 2 Comparative maps of Ae. tauschii 3DS with rice, Brachypodium and barley genome. Physical map of the distal region of Ae. tauschii 3DS compared to the orthologous genomic sequences of B. distachyon Bd2 (8× release) and rice Os2, and to the genetic map of barley 3HS. The un-derlined ctg names indicate the contigs which were aligned onto the Ae. tauschii AL8/78 × AS75 F2 genetic map [11]. The names to the right are rice genes as listed in MSU Rice Genome Annotation (Osa1) Release 6.0. The barley Steptoe x Morex genetic map used gene-based SNP [15,16].
distal580
Os1�
LOC_Os01g02120�02139�02170
LOC_Os01g02310�02350�02390
LOC Os01g02600
Bd2
800
0
ctg2
3
ctg1
3DS
3HS0.0
2.32.93.7
1,080
1,580
LOC_Os01g02880�02884LOC_Os01g02920�02930
LOC_Os01g03070�03110LOC_Os01g03144
LOC_Os01g03340�03390LOC_Os01g03510�03520�03549
LOC_Os01g03680�03710LOC_Os01g03730
LOC_Os01g02600
1,000
1,200
1,400
5,000
ctg7
ctg3
ctg4
ctg5ctg6
6.0
6.7
8.2
8.99.6
10.811.712.5
2,080
LOC_Os01g04260LOC_Os01g04190
LOC_Os01g04630
LOC_Os01g04814
LOC_Os01g04950�05010
LOC_Os01g04010�04020LOC_Os01g03950
LOC_Os01g04370
LOC_Os01g04710
LOC_Os01g04900�04920
LOC Os01g05060�05070
1,600
1,800
2,0009,000
ctg8
ctg11
ctg12
ctg9
ctg10
15.616.3
19.220.0
21.7
2,580
3,080
LOC_Os01g05490�05500
LOC_Os01g05800�05840
LOC Os01g06660
LOC_Os01g05060 05070LOC_Os01g05130�05140
LOC_Os01g05420
LOC_Os01g05680
2,200
2,400
2,600 13,000
ctg13
ctg15
ctg14
ctg17ctg16
22.723.524.225.0
26.9
28.4
28.929.3
3,580
LOC_Os01g07250
_ g
LOC_Os01g07590LOC_Os01g07760
LOC_Os01g07310
LOC_Os01g07070
LOC_Os01g07370
2,800
3,000
3,20017,000
ctg19
ctg18
32.8
35.236.5
37.2
38.739.5
41.041.742.142 5
4,080
4,580
LOC_Os01g08450
LOC_Os01g08700
LOC_Os01g08814�08830�08860LOC_Os01g08930�09010
3,400
3,600
3,800
4 000
21,000
ctg21
ctg22
ctg23
ctg19
ctg20
42.543.244.044.845.546.347.1
48.6
49.4
proximal
kb LOC_Os01g09620�09640
LOC_Os01g09560
4,000
4,200kb kb
ctg24
50.2
51.0
51.7cM
LOC_Os01g09850
Fleury et al. BMC Genomics 2010, 11:382http://www.biomedcentral.com/1471-2164/11/382
Page 7 of 10
the Os1 sequence have been detected in the comparisonof the Ae. tauschii genetic map and rice and sorghumgenome sequences and their origins were assigned to theTriticeae lineage [11], in agreement with inferencesreported here. Additional Ae. tauschii-rice/Brachypo-dium rearrangements probably occurred but could not bedetected in our map probably because of the low densitymarkers on some contigs. For example, two inversionsbetween rice chromosome 1 and 3BS reported in [6] werenot observed in the Ae. tauschii 3DS map due to the lackof markers on ctgs1-2-3.
The diploid genome of barley is usually considered as agood model for Triticeae genomics. Comparative studies
using deletion bin, cytomolecular and low-resolutionlinkage maps showed a high level of synteny betweenwheat and barley chromosomes and revealed very fewgenomic rearrangements at the genome scale [40-43]. Forexample, the comparison of barley and T. monococcumrevealed inversions and translocation between chromo-somes 1H and 1A, and between chromosomes 5A and 4H[40]. As expected, the Ae. tauschii chromosome 3DS islargely collinear to the barley chromosome 3HS. Howeverwe reported here a disruption of the synteny for a distalregion of 8.1 cM in barley, which has not been observedin previous studies.
Figure 3 Model of chromosomal rearrangements of the Ph2 locus in rice, Brachypodium, Ae. tauschii and barley. 1-5 indicate chromosomal segments, A-D, the putative breakpoints. The breakpoint B would be located within the ctg5 of Ae. tauschii physical map. The names on top are rice genes as listed in MSU Rice Genome Annotation (Osa1) Release 6.0.
07760
09850
LOC_
Os01g03160
LOC_
Os01g03070
LOC_
Os01g04020
Rice/Brachypodium
LOC_
Os01g07740�0
LOC_
Os01g09580�0
LOC_
Os01g02870
1 2 3 4 5
proximaldistal
Triticeae ancestor
ctg3�4�5 ctg6�7 ctg8�15 ctg16�24
BA C D
Triticum/Aegilops Hordeum
ctg3 4 5 ctg6 7 ctg8 15 ctg16 24

Fleury et al. BMC Genomics 2010, 11:382http://www.biomedcentral.com/1471-2164/11/382
Page 8 of 10
The phylogeny of grasses suggests that the divergenceof rice and Brachypodium from Triticeae occurred about41-47 Mya and 32-39 Mya, respectively [39,44-46]. Thestructure of the orthologous Ph2 locus was almost identi-cal in Brachypodium and rice. Although it implies thatrice and Brachypodium are closer to each other than towheat, DNA sequence would indicate rice and Brachypo-dium/Triticeae lineage split much earlier, with Brachypo-dium and the Triticeae splitting later as shown in [39].The large proximal inversion of the segment 5 would haveoccurred after rice and Brachypodium diverged from acommon ancestor of the Triticeae, leading to a collinearblock between barley and Ae. tauschii (Figure 3).
The complexity of the rearrangements inside segment 5between rice/Brachypodium and Ae. tauschii showed thatthe large inversion might actually be a series of inversionsnested in each other. It might correspond to larger rear-rangements between the adjacent bins 3S-0.57-0.78 and3S-0.45-0.55 and rice chromosome 1 observed in the ESTgroup 3 chromosome bin map [29]. Other inversionevents have occurred in the distal region of Ph2 leading todifferent rearrangements of the rice/Brachypodium-bar-ley-Ae. tauschii synteny. The disruption of co-linearitybetween wheat and barley showed that inversions wouldhave occurred after the separation between Hordeum andTriticum/Aegilops species about 6-16 Mya [45]. Howeverthe inversions of segments 1 and 3 between barley andAe. tauschii would need to be validated by increasing theresolution of the barley genetic map where the markersanchored on ctg 4 and 5, and ctg 6 and 7 co-segregatedrespectively at 8.2 cM and 12.5 cM.
ConclusionsThe construction of physical maps for a 5 Gb size genomeis a complex and laborious task. Although the mapreported here is only for a portion of the wheat genome, itis nevertheless the first report using fingerprinting of acomplete Triticeae genome. It provided significant datashowing chromosomal rearrangements between wheat,Brachypodium and barley, and it will be a useful resourcefor gene cloning of chromosome 3D. Whether or not thecomposition of Triticeae genomes with 90% of repeatDNA sequence [47] precludes the assembly of BAC con-tigs from whole-genome BAC libraries, this study showedthat global fingerprinting of the large Triticeae genomesis capable of generating such physical maps despite thecomplexity of and high repeated sequence content inthese genomes. This strategy is now used by the Interna-tional Barley Sequencing Consortium which will soonrelease a physical map of barley [48].
MethodsProbe design and BAC filter hybridizationPlant material (Triticum aestivum cv Chinese Spring andnullisomic-tetrasomic derivatives) and the DNA extrac-
tion were respectively described in [13] and [49]. TheBAC libraries and assembly of Ae. tauschii AL8/78 aredescribed in [10] and http://wheatdb.ucdavis.edu.
The primers were designed to amplify unique 150-400bp fragments of unigenes defined in the DFCI wheat geneindex v11 http://compbio.dfci.harvard.edu/tgi by usingPrimer 3 program (See Additional File 3). The PCR reac-tion was carried out in 20 μl final volume with 400 nM ofboth primers, 200 μM of each dNTP, 1.5 mM of MgCl2,0.5 U Taq Platinum polymerase (Invitrogen) with its 1×buffer and 40 ng of DNA. The PCR amplification fol-lowed a touch-down procedure: 1 cycle 2 min at 94°C, 10cycles (20 sec 95°C, 20 sec Tm minus 0.5°C each cycle, 2min 72°C), 35 cycles (20 sec 95°C, 20 sec Tm minus 5°C, 2min 72°C) and an additional extension step of 10 min at72°C (See Additional File 3). Probes were purified bycleaning up the PCR product or by electrophoresis onagarose gel using the MinElute kit (Qiagen) and verifiedby Sanger's method sequencing prior hybridization. Weused the ABI PRISM® BigDye™ Terminators V 3.1 for thesequencing reaction according to the manufacturer'sinstructions. The southern blot analyses onto membranesof restricted DNA from nullisomic-tetrasomic lines andonto Ae. tauschii BAC filters were performed accordingto [49] by pooling up to 8 probes. The positive BACclones were cultivated in 96-well plates overnight in 200μl of LB medium supplemented with 15 mg/l tetracyclinefor the BB and HB clones and with 15 mg/l chloramphen-icol for HD, HI and RI clones. The cultures were centri-fuged for 10 min at 5,000 rpm, and then the supernatantwas replaced by MilliQ water. The anchoring of the mark-ers on the positive BAC clones was validated by directPCR with 1 μl of bacterial solution.
Re- assembly of the BAC from targeted regionTo minimize false assembly caused by genome-wide net-work, a subset of BAC clones including all clones of origi-nal contigs which contain positive clone(s) and singletonswere re-assembled into contigs by using the FPC program[50,51]. The contig number(s) used were results of the re-assembly.
Genetic mapping and recombination rateFor map alignments, wheat unigenes and markerssequences were compared to the 8× B. distachyongenome sequence http://www.brachypodium.org and tothe rice pseudomolecules of Rice Genome AnnotationProject - MSU Rice Genome Annotation (Osa1) Release6.0 using BLASTN and TBLASTX. The homologues wereassigned based on the best match to the rice pseudomole-cules with significant threshold for the expectation Evalue of e-10. The same wheat sequences were used toidentify the barley homologous unigenes of Har-vEST:Barley (v1.76) assembly #35 by using BLASTN. Thebest matches were selected with a cut-off E value of e-20.

Fleury et al. BMC Genomics 2010, 11:382http://www.biomedcentral.com/1471-2164/11/382
Page 9 of 10
The Ae. tauschii genetic map derived from the F2 popula-tion AL8/78 × AS75 [11] with additional markersdescribed in Table S3. The genetic map of barley derivedfrom the Steptoe x Morex doubled haploid population[52] was described in [15] and [16]. Recombination ratewas calculated as a coefficient of exchange (CE) in cM perMb.
Additional material
Authors' contributionsDF participated to the project design, designed the primers, assembled theBAC contigs based on EST anchoring, did the sequence alignment and thecomparative maps, and drafted the manuscript. MCL designed the Ae. tauschiiphysical mapping research project and assembled the contigs based on fin-gerprinting. JD designed the Ae. tauschii physical mapping research project,analyzed the comparative maps and helped to draft the manuscript. LR ana-lyzed the comparative maps and participated to the sequence alignment. BSGand ODA designed the Ae. tauschii physical mapping research project. FMYperformed the fingerprint editing of the BAC libraries of Ae. tauschii and help toassemble contigs. ZS designed a subset of primers and performed the wet-labwork of BAC screening. KRD did the Ae. tauschii genetic mapping. PL designedand coordinated the research, analyzed the comparative maps and help todraft the manuscript. All authors read and approved the final manuscript.
AcknowledgementsThis work is supported by the University of Adelaide, the Australian Research Council, the Grains Research and Development Corporation, the Government of South Australia, the International Science Linkages CG120174 and the US National Science Foundation by grant DBI-0077766. We thank Margaret Pal-lotta for supplying DNA of wheat nullisomic-tetrasomic lines and Southern blot membranes, Etienne Paux, Frédéric Choulet and Catherine Feuillet for the marker information of the chromosome 3B physical map, Alina Akhunova for providing the Ae. tauschii BAC clones, Ute Baumann and Julian Schwerdt for bioinformatics support.
Author Details1Australian Centre for Plant Functional Genomics, University of Adelaide, PMB1, Glen Osmond SA 5064, Australia, 2Department of Plant Sciences, University of California, Davis, CA 95616, USA, 3Genetics Programme, Scottish Crop Research Institute, Invergowrie, Dundee DD2 5DA, Scotland, UK, 4Department of Plant Pathology, Kansas State University, Manhattan KS 66506, USA and 5Genomics and Gene Discovery Unit, U.S. Department of Agriculture/Agricultural Research Service Western Regional Research Center, Albany, CA 94710, USA
References1. International Rice Genome Sequencing Project: The map-based
sequence of the rice genome. Nature 2005, 436:793-800.2. Gu Y, Ma Y, Huo N, Vogel J, Lazo G, Hill T, Coleman-Derr D, Hayden D,
Dvorak J, Olin Anderson, et al.: Construction of physical map for Brachypodium distachyon and its comparative analysis with rice. BMC Genomics 2009, 10:496-509.
3. Nesbitt M, Samuel D: From staple crop to extinction? The archaeology and history of hulled wheats. Hulled Wheats. Promoting the conservation and use of underutilized and neglected crops. In 1st
International Workshop on Hulled wheats Edited by: Padulosi S, Hammer K, Heller J. Rome, Italy: International Plant Genetic Resources Institute; 1996:41-100.
4. Kihara H: Discovery of the DD-analyser, one of the ancestors of Triticum vulgare. Agric and Hort Tokyo 1944, 19:13-14.
5. Dvorak J, Luo M, Yang Z, Zhang H: Genetic evidence on the origin of T. aestivum L. In The Origins of Agriculture and Crop Domestication Edited by: Damania A, Valkoun J, Willcox G, Qualset C. Aleppo, Syria: ICARDA; 1998:235-251.
6. Paux E, Sourdille P, Salse J, Saintenac C, Choulet F, Leroy P, Korol A, Michalak M, Kianian S, Spielmeyer W, et al.: A physical map of the 1-gigabase bread wheat chromosome 3B. Science 2008, 322:101-104.
7. Luo MC, Ma Y, You FM, Anderson OD, Kopecky D, Simkova H, Safar J, Dolezel J, Gill BS, McGuire PE, et al.: Feasibility of physical map construction from fingerprinted bacterial artificial chromosome libraries of polyploid plant species. BMC Genomics 2010, 11:122.
8. Dolezel J, Kubalakova M, Paux E, Bartos J, Feuillet C: Chromosome-based genomics in the cereals. Chromosome Res 2007, 15:51-66.
9. Xu Z, Deal KR, Li W, Covaleda L, Chang Y-L, Dvorak J, Luo M-C, Gill BS, Anderson OD, Zhang HB: Construction and characterization of five large-insert BAC and BIBAC libraries of Aegilops tauschii, the diploid donor of the wheat D genome. In 10th Intern Plant and Animal Genome Conference: 2002 San Diego, U.S.A.: Scherago Internatl. Inc; 2002:101.
10. Luo MC, Thomas CS, Deal KR, You FM, Anderson OD, Gu Y-Q, Li W, Kuraparthy V, Gill BS, McGuire PE, et al.: Construction of contigs of Aegilops tauschii genomic DNA fragments cloned in BAC and BiBAC vectors. In Proceedings of the 10th International Wheat Genetic Symposium: 2003 Rome, Italy: Institute Sperimentale per la Cerealicoltura; 2003:293-296.
11. Luo MC, Deal KR, Akhunov ED, Akhunova AR, Anderson OD, Anderson JA, Blake N, Clegg MT, Coleman-Derr D, Conley EJ, et al.: Genome comparisons reveal a dominant mechanism of chromosome number reduction in grasses and accelerated genome evolution in Triticeae. Proc Natl Acad Sci USA 2009, 106:15780-15785.
12. Stein N, Prasad M, Scholz U, Thiel T, Zhang H, Wolf M, Kota R, Varshney RK, Perovic D, Grosse I, et al.: A 1,000-loci transcript map of the barley genome: new anchoring points for integrative grass genomics. Theor Appl Genet 2007, 114:823-839.
13. Sutton T, Whitford R, Baumann U, Dong C, Able JA, Langridge P: The Ph2 pairing homoeologous locus of wheat (Triticum aestivum): identification of candidate meiotic genes using a comparative genetics approach. Plant J 2003, 36:443-456.
14. Qi LL, Echalier B, Chao S, Lazo GR, Butler GE, Anderson OD, Akhunov ED, Dvorak J, Linkiewicz AM, Ratnasiri A, et al.: A chromosome bin map of 16,000 expressed sequence tag loci and distribution of genes among the three genomes of polyploid wheat. Genetics 2004, 168(2):701-712.
15. Close TJ, Close T, Bhat P, Lonardi S, Wu Y, Rostoks N, Ramsay L, Druka A, Stein N, Svensson J, et al.: Development and implementation of high-throughput SNP genotyping in barley. BMC Genomics 2009, 10:. 1186/1471-2164-1110-1582
16. Potokina E, Druka A, Luo Z, Wise R, Waugh R, Kearsey M: eQTL analysis of 16,000 barley genes reveals a complex pattern of genome wide transcriptional regulation. Plant J 2008, 53:90-101.
17. Feuillet C, Langridge P, Waugh R: Cereal breeding takes a walk on the wild side. Trends Genet 2008, 24:24-32.
18. Tadesse W, Schmolke M, Hsam SLK, Mohler V, Wenzel G, Zeller FJ: Molecular mapping of resistance genes to tan spot (Pyrenophora tritici-repentis race 1) in synthetic wheat lines. Theor Appl Genet 2007, 114:855-862.
19. Watanabe N, Fujii Y, Kato N, Ban T, Martinek P: Microsatellite mapping of the genes for brittle rachis on homoeologous group 3 chromosomes in tetraploid and hexaploid wheats. J Appl Genet 2006, 47(2):93-98.
20. Zhao XY, Liu MS, Li JR, Guan CM, Zhang XS: The wheat TaGI1, involved in photoperiodic flowering, encodes an Arabidopsis GI ortholog. Plant Mol Biol 2005, 58:53-64.
21. Salina E, Borner A, Leonova I, Korzun V, Laikova L, Maystrenko O, Roder MS: Microsatellite mapping of the induced sphaerococcoid mutation genes in Triticum aestivum. Theor Appl Genet 2000, 100(5):686-689.
22. McCartney CA, Somers DJ, Humphreys DG, Lukow O, Ames N, Noll J, Cloutier S, McCallum BD: Mapping quantitative trait loci controlling agronomic traits in the spring wheat cross RL4452 × 'AC Domain'. Genome 2005, 48:870-883.
Additional file 1 Description of the markers mapped onto Ae. tauschii physical map of distal region of chromosome 3DS.Additional file 2 Primer sequences and Tm used for the touch-down PCR of the wheat markers.Additional file 3 Physical map of the Ph2 locus in Ae. tauschii com-pared to the orthologous genomic sequence of rice Os1 and B. dis-tachyon Bd2 (8× release). The names to the left are rice genes as listed in MSU Rice Genome Annotation (Osa1) Release 6.0.
Received: 10 March 2010 Accepted: 17 June 2010 Published: 17 June 2010This article is available from: http://www.biomedcentral.com/1471-2164/11/382© 2010 Fleury et al; licensee BioMed Central Ltd. This is an Open Access article distributed under the terms of the Creative Commons Attribution License (http://creativecommons.org/licenses/by/2.0), which permits unrestricted use, distribution, and reproduction in any medium, provided the original work is properly cited.BMC Genomics 2010, 11:382

Fleury et al. BMC Genomics 2010, 11:382http://www.biomedcentral.com/1471-2164/11/382
Page 10 of 10
23. Quarrie SA, Steed A, Calestani C, Semikhodskii A, Lebreton C, Chinoy C, Steele N, Pljevljakusic D, Waterman E, Weyen J, et al.: A high-density genetic map of hexaploid wheat (Triticum aestivum L.) from the cross Chinese Spring X SQ1 and its use to compare QTLs for grain yield across a range of environments. Theor Appl Genet 2005, 110:865-880.
24. Pestsova EG, Borner A, Roder MS: Development and QTL assessment of Triticum aestivum-Aegilops tauschii introgression lines. Theor Appl Genet 2006, 112:634-647.
25. Chu CG, Xu SS, Friesen TL, Faris JD: Whole genome mapping in a wheat doubled haploid population using SSRs and TRAPs and the identification of QTL for agronomic traits. Mol Breed 2008, 22:251-266.
26. Christopher MJ, Williamson PM, Michalowitz M, Jennings R, Lehmensiek A, Sheppard J, Banks P: Simple sequence repeat markers associated with three quantitative trait loci for black point resistance can be used to enrich selection populations in bread wheat. Aust J Agric Res 2007, 58:867-873.
27. Shen XR, Ittu M, Ohm HW: Quantitative trait loci conditioning resistance to Fusarium head blight in wheat line F201R. Crop Sci 2003, 43:850-857.
28. Prasad M, Kumar N, Kulwal PL, Roder MS, Balyan HS, Dhaliwal HS, Gupta PK: QTL analysis for grain protein content using SSR markers and validation studies using NILs in bread wheat. Theor Appl Genet 2003, 106:659-667.
29. Munkvold JD, Greene RA, Bertmudez-Kandianis CE, La Rota CM, Edwards H, Sorrells SF, Dake T, Benscher D, Kantety R, Linkiewicz AM, et al.: Group 3 chromosome bin maps of wheat and their relationship to rice chromosome 1. Genetics 2004, 168:639-650.
30. Somers D, Isaac P, Edwards K: A high-density microsatellite consensus map for bread wheat (Triticum aestivum L.). Theor Appl Genet 2004, 109:1105-1114.
31. Caldwell KS, Dvorak J, Lagudah ES, Akhunov E, Luo MC, Wolters P, Powell W: Sequence polymorphism in polyploid wheat and their D-genome diploid ancestor. Genetics 2004, 167:941-947.
32. Akhunov ED, Goodyear AW, Geng S, Qi LL, Echalier B, Gill BS, Miftahudin Gustafson JP, Lazo G, Chao SM, et al.: The organization and rate of evolution of wheat genomes are correlated with recombination rates along chromosome arms. Genome Res 2003, 13:753-763.
33. Saintenac C, Falque M, Martin O, Paux E, Feuillet C, Sourdille P: Detailed recombination studies along chromosome 3B provide new insights on crossover distribution in wheat (Triticum aestivum L.). Genetics 2009, 181:393-403.
34. Matsumoto T, Wu JZ, Kanamori H, Katayose Y, Fujisawa M, Namiki N, Mizuno H, Yamamoto K, Antonio BA, Baba T, et al.: The map-based sequence of the rice genome. Nature 2005, 436:793-800.
35. Paterson AH, Bowers JE, Bruggmann R, Dubchak I, Grimwood J, Gundlach H, Haberer G, Hellsten U, Mitros T, Poliakov A, et al.: The Sorghum bicolor genome and the diversification of grasses. Nature 2009, 457:551-556.
36. Mezard C: Meiotic recombination hotspots in plants. Biochem Soc Trans 2006, 34:531-534.
37. See DR, Brooks S, Nelson JC, Brown-Guedira G, Friebe B, Gill BS: Gene evolution at the ends of wheat chromosomes. Proc Natl Acad Sci USA 2006, 103:6775-6775.
38. Sorrells ME, La Rota CM, Bermudez-Kandianis CE, Greene RA, Kantety R, Munkvold JD, Miftahudin Mahmoud A, Gustafson JP, Qi LL, et al.: Comparative DNA sequence analysis of wheat and rice genomes. Genome Res 2003, 13:1818-1827.
39. The International Brachypodium Initiative: Genome sequencing and analysis of the model grass Brachypodium distachyon. Nature 2010, 463:763-768.
40. Dubcovsky J, Luo MC, Zhong GY, Bransteitter R, Desai A, Kilian A, Kleinhofs A, Dvorak J: Genetic map of diploid wheat, Triticum monococcum L, and its comparison with maps of Hordeum vulgare L. Genetics 1996, 143:983-999.
41. Weng Y, Lazar MD: Comparison of homoeologous group-6 short arm physical maps of wheat and barley reveals a similar distribution of recombinogenic and gene-rich regions. Theor Appl Genet 2002, 104:1078-1085.
42. Dilbirligi M, Erayman M, Gill KS: Analysis of recombination and gene distribution in the 2L1.0 region of wheat (Triticum aestivum L.) and barley (Hordeum vulgare L.). Genomics 2005, 86:47-54.
43. Mochida K, Saisho D, Yoshida T, Sakurai T, Shinozaki K: TriMEDB: A database to integrate transcribed markers and facilitate genetic studies of the tribe Triticeae. BMC Plant Biol 2008, 8:72-80.
44. Paterson AH, Bowers JE, Chapman BA: Ancient polyploidization predating divergence of the cereals, and its consequences for comparative genomics. Proc Natl Acad Sci USA 2004, 101:9903-9908.
45. Chalupska D, Lee HY, Faris JD, Evrard A, Chalhoub B, Haselkorn R, Gornicki P: Acc homoeoloci and the evolution of wheat genomes. Proc Natl Acad Sci USA 2008, 105:9691-9696.
46. Bossolini E, Wicker T, Knobel PA, Keller B: Comparison of orthologous loci from small grass genomes Brachypodium and rice: implications for wheat genomics and grass genome annotation. Plant J 2007, 49:704-717.
47. Dvorak J: Triticeae genome structure and evolution. In Genetics and Genomics of the Triticeae Edited by: Feuillet C, Muehlbauer G. New York: Springer; 2009:685-711.
48. Schulte D, Close TJ, Graner A, Langridge P, Matsumoto T, Muehlbauer G, Sato K, Schulman AH, Waugh R, Wise RP, et al.: The International Barley Sequencing Consortium - at the threshold of efficient access to the barley genome. Plant Physiol 2009, 149:142-147.
49. Pallotta M, Graham R, Langridge P, Sparrow D, Barker S: RFLP mapping of manganese efficiency in barley. Theor Appl Genet 2000, 101:1100-1108.
50. Soderlund C, Humphrey S, Dunhum A, French L: Contigs built with fingerprints, markers and FPC V4.7. Genome Res 2000, 10:1772-1787.
51. Luo M, Thomas C, You F, Hsiao J, Ouyang S, Buell C, Malandro M, McGuire P, Anderson O, Dvorak J: High-throughput fingerprinting of bacterial artificial chromosomes using the snapshot labeling kit and sizing of restriction fragments by capillary electrophoresis. Genomics 2003, 82:378-389.
52. Kleinhofs A, Kilian A, Saghai Maroof MA, Biyashev RM, Hayes P: Molecular, isozyme and morphological map of the barley (Hordeum vulgare) genome. Theor Appl Genet 1993, 86:705-712.
doi: 10.1186/1471-2164-11-382Cite this article as: Fleury et al., Physical mapping of a large plant genome using global high-information-content-fingerprinting: the distal region of the wheat ancestor Aegilops tauschii chromosome 3DS BMC Genomics 2010, 11:382