aegion corporation: construction and engineering · 3 valuation summary recommendation summary...
TRANSCRIPT

1
Aegion Corporation: Construction and Engineering
April 19th, 2017Sector: IndustrialsSenior Analyst: Shreyash GoyalJunior Analysts: Hector Menses, Maciej Leleniewski Minh Tuan Nguyen, Shrey Shah, Xuantong Guo

2
Agenda
Aegion Corporation - Investment Research Presentation: Spring 2017
Valuation Summary
Industry Definition
Industry Structure and Segmentation
Aegion Snapshot & Leadership
Aegion Value Generation
Industry Trends
Company Trends
Valuation: Comparable Companies Analysis
Valuation: Discounted Cash Flow Model
Valuation: Summary and Recommendation
Question and Answers

3
Valuation SummaryRecommendation Summary
Company (Ticker) AEGNCurrent Trading Price (04-16-2017) $21.97 Recommendation HOLDTarget Price $23.74Upside Potential 8.00%
Valuation SummaryMethod Price Weight
Discounted Cash Flow 60%Perpetuity Growth Method $14.73 40%Exit Multiple Method $31.22 20%Comparable Company Analysis 40%P/E $20.95 20%EV/EBITDA $37.05 20%Target Price $23.74
Summary Recommendation: HOLD• Strong intrinsic competitive advantage• Poor performance in the past years due to harsh climate and energy downturn• Value dependent on near term operational excellence • $40 million share buyback reflects managements confidence• Buy if price drops below $20.81 ( 52 week Range: $17.18 – $26.68)

4
Industry Definition: Pipeline Construction & MaintenanceCompanies in this industry construct and rehabilitatewater mains, sewers,drains,aqueducts,pumping stations, treatmentplants, oil & gas pipelines and downstream transportation structures. Also includes construction management and specialtrade contractors integral tounderground pipeline infrastructure.
Major Players and Influencers
AECOM: $5.37BNYSE: ACM
Fluor Corporation: $7.19BNYSE: FLR
Peter Kiewit Sons INC.Omaha, NE
MWH GlobalBroomfield, CO
Source: InvestSnips, Google Finance, IBIS World
Tetra Tech: $2.33BNASDAQ: TTEK
Aegion: $762.67MNASDAQ: AEGN

5
Industry Structure & Segmentation
Non-Residential Construction $ 690.50 Billion
Source: US Census “Construction Spending”, IBIS World
Industrials$ 71,213 Billion
Construction & Engineering$1,150 Billion
Non-Residential Construction$690 Billion
9%
43%
48%
Oil and Gas Pipeline Construction 2017
Public Sector Clients
Private Sector Natural Gas
Private Sector Oil Interests
92%
2%6%
Water & Sewer Line Construction 2017
State and Local Government
Private Sector
Federal Government

6
Aegion Fundamentals
Ticker AEGN
Trading Price $21.97*
Market Cap 762.7 Million*
P/E 25.9x**
EPS $0.85**
EV/EBITDA 9.8x**
Backlog 689.6 Million**
Aegion Corporation: A Snapshot of the Company
Provider of global rehabilitation, maintenance and engineering solutions for water, energy, refining, miningand wastewater industries. Leader in using technological expertise and patented technology to completecomplex projects at higher efficiencyand lowercosts than competitors.
47%
33%
20%
Business Segments by Revenue
Infrastructure SolutionsCorrosion ProtectionEnergy Services
Aegion and its subsidiaries are:ØOperational in 80 + countriesØOwners of 88 domestic and 152 international patents across its three segments
*As of 04/16/17 **As of 12/31/16

7
Experienced Leadership Driving Innovation
Chief Executive Officer: Charles R. Gordon• CEO since October 2016• Director at Aegion since July 2009• 25 years of managerial experience in water and wastewater industry• Held executive roles Siemens Water technologies from 2003 – 2010
Chief Financial Officer: David A. Martin• CFO since August 2007• Worked at Insitufrom Technologies from 1993 – 2007, starting as senior
accountant• CPA
Chief Strategy Officer: John D. Huhn• CSO since 2016• At Aegion since 2008• Responsible for identification, analysis, and completion of multiple
transactions that have increased Aegion’s presence in the industry

8
Generating Value in a Standardized Market
Seek and Submit Competitive
Public Tenders
Seek and Submit Competitive
Private Tenders
Receive Subcontracting
Tender
Engage Required Material, Machinery
and Labour
Complete Planned Construction Efficiently
Subcontract Portion of the Project
Actively Manage Project
Handover to Inspection - $$$
Margin and Profitability
Analysis
Source: Company 10k’s, IBIS World

9
Industry Trends
Investment in Water
Infrastructure
Recovering Energy Industry
Healthy Municipal
Bond Markets

10
Water Mains Replacement Critical to America’s Future
$92,218 $146,997
$204,357 $82,866
$16,525 $25,222
$302,782 $153,756
0%
10%
20%
30%
40%
50%
60%
70%
80%
90%
100%
Northeast Midwest South West
2010-2035 Underground Infrastructure Needs
Replacement Growth
• Large proportions of underground infrastructure is in need of replacement
• The Safe Drinking Water Act (SDWA) ensures safe drinking water for the public and calls for timely replacement of water infrastructure
• It is estimated that between $400B and $600B is needed for safe drinking water and wastewater treatment over the next 20 years
• The Water Resources Development Act will provide critical investment for replacement programs meeting standards defined under the SDWA
Source: EPA, AGC of America

11
Recovering Energy Industry will Increase Infrastructure Spending
Source: EIA, IBIS World
40.0
50.0
60.0
70.0
80.0
90.0
100.0
110.0
20.0
30.0
40.0
50.0
60.0
70.0
80.0
90.0
2008 2009 2010 2011 2012 2013 2014 2015 2016 2017 2018 2019 2020 2021 2022
Dollars per Barrel
Dollars in Billions
Energy Construction Industry Revenues vs Oil Prices per Barrel
Revenue ($m) World price of crude oil ($ per barrel)
Energy Recovery will Spur Investment
• Prices of Oil and Natural Gas are forecasted to rise allowing for increased capital expenditure
• Increasing rig count and fracking activities allow for development of newer infrastructure
• Older energies facilities need to be maintained at intensive levels for greater downstream traffic
• Relaxed energy regulations under the Trump administration may increase infrastructure investments

12
Healthy Municipal Bond Market Necessary for Stability
Source: S&P Indices by Asset Class, Charles Schwab, Moody’s
200
210
220
230
240
250
260
100
110
120
130
140
150
160
April-‐12 April-‐13 April-‐14 April-‐15 April-‐16 April-‐17
US Municipal Bond Health Indicators
S&P Municipal Bond Defaulted Index S&P Municipal Bond Insured Index
• Stability in Municipal bonds guarantees investment of allocated funds into construction projects
• Local and State investment have grown to pre-recession level increasing traction for the industry
• Decreasing unemployment and rising wages over the outlook period - basis for investment growth
• Both high-yield and tax exempt municipal bonds are showing signs of increased stability with
higher average ratings and lower default rates
Municipal Bonds showing signs of stability

13
Company Trends
Efficient Cash Generation
Operational Efficiency
and Margins
Strategic M&A
Activity

14
Aegion Continues to Efficiently Generate Cash
111 Days103 Days
95 Days
86 Days79 Days
50
60
70
80
90
100
110
120
2012 2013 2014 2015 2016
Days
AEGION Days Sales Outstanding Trend 2012-2016
• Reduced DSO due to standardization in project planning, execution and billing policies for the CIPP operation in North America of Infrastructure Solutions segment
• DSO Target – 70 Days by 2019; Reduction in DSO is a main priority to generate cash• Cash Priorities:
1. Pay down debt ($70M over the next 3 years)2. Resources for fueling growth through M&A transactions3. Grow investor earnings through share buybacks ($40M share buyback for 2017)4. Target stock repurchases for future set around 3-5% of total outstanding shares
Source: Company 10K’s, Aegion Investor Presentation Feb ‘17, Sell Side Research

15
Operational Efficiency is the Key to Aegion’s Success
-2.0%
0.0%
2.0%
4.0%
6.0%
8.0%
10.0%
0
200
400
600
800
1000
1200
1400
1600
2012 2013 2014 2015 2016 2017F 2018F 2019F
Mill
ions
of U
SD
Operating Margins
Revenue Operating Expense Operating Margins
• Reengineered processes and technologies are improving operating margins• Introduction of LEAN operational guidelines titled “The Aegion Way”• The Aegion Way is:
• Standardizing operations across the three segments• Minimizing safety incidents and therefore, lost time• Minimizing waste generation through retraining and supervising • Optimizing labor requisitioning and reducing expensive part time employment
Source: Company 10K’s, Aegion Investor Presentation Feb ‘17, Sell Side Research

16
M&A Processes: Expanding Markets and Technologies
0
1000
2000
3000
4000
5000
6000
7000
2013 2014 2015 2016
Acquisition Expenditure Thousands of Dollars
• Aegion has used acquisitions to gather patented technology, trade secrets and skilled labor
• Entry into untapped or undeveloped markets positioning for first mover advantage
• “Strategic acquisitions are one of our top goals for the coming years” – Charles R. Gordon
• Strategic M&A’s are improving synergies for Aegion and reducing operational costs
Key Acquisition Target Markets:• Asia-Pacific: Fyfe Asia Pte. Ltd.• Middle East: Hockway• Europe: LMJ, Insituform Tech• Americas: Underground Solutions,
United Pipeline de Mexico
Technological Additions to Portfolio:Fusible PVC®, Tyfo Fiberwrap®, Fiberwrap®, Insituform CIPP®
Source: Company 10K’s, Aegion Investor Presentation Feb ’17, Aegion Earnings Call FY 2016

17
Comparable Companies Analysis omp
Source: Company 10K’s, Google Finance, Bloomberg, Invest Snips
Company Ticker EV Market Cap Revenue EBITDA Net
Income P/E EV/EBITDA EV/Revenue P/Revenue
Aegion Corporation AEGN 1,002.3 762.7 1,221.9 102.8 29.5 25.9x 9.8x 0.8x 0.6x
MYR Group Inc. MYRG 706.2 664.9 1,142.5 78.8 21.4 31.0x 9.0x 0.6x 0.6x
Primoris Services Corp PRIM 1,350.0 1,224.1 1,996.9 118.5 62.6 19.5x 11.4x 0.7x 0.6x
KBR Inc. KBR 1,929.8 2,026.0 4,268.0 130.0 183.1 11.1x 14.8x 0.5x 0.5x
Mastec Inc. MTZ 4,103.1 3,108.8 5,134.7 443.4 142.3 21.8x 9.3x 0.8x 0.6x
Quanta Services Inc. PWR 5,711.8 5,459.6 7,651.3 544.2 221.4 24.7x 10.5x 0.7x 0.7x
High 31.0x 14.8x 0.8x 0.7x
Mean 21.6x 11.0x 0.7x 0.6x
Median 21.8x 10.5x 0.7x 0.6x
75th Percentile 24.7x 11.4x 0.7x 0.6x
Low 11.1x 9.0x 0.5x 0.5x
18
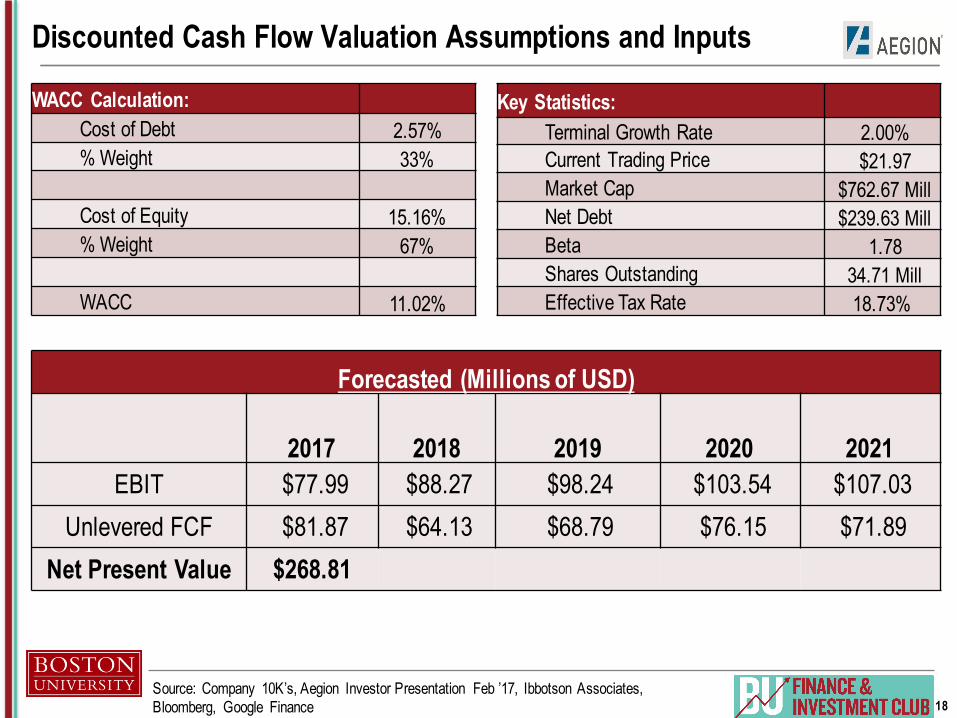
Discounted Cash Flow Valuation Assumptions and Inputs
Source: Company 10K’s, Aegion Investor Presentation Feb ’17, Ibbotson Associates, Bloomberg, Google Finance
WACC Calculation:Cost of Debt 2.57%% Weight 33%
Cost of Equity 15.16%% Weight 67%
WACC 11.02%
Key Statistics:Terminal Growth Rate 2.00%Current Trading Price $21.97 Market Cap $762.67 MillNet Debt $239.63 MillBeta 1.78 Shares Outstanding 34.71 Mill Effective Tax Rate 18.73%
Forecasted (Millions of USD)
2017 2018 2019 2020 2021EBIT $77.99 $88.27 $98.24 $103.54 $107.03
Unlevered FCF $81.87 $64.13 $68.79 $76.15 $71.89 Net Present Value $268.81

19
Valuation Summary and Recommendation
Summary Recommendation: HOLD• Current one year target price $23.74• Buy if price drops below $20.81 ( 52 week Range: $17.18 – $26.68)Despite the HOLD recommendation we strongly believe that Aegion has the right tools and expertise to succeed and can deliver significant upside in the long term.
Recommendation SummaryCompany (Ticker) AEGNCurrent Trading Price (04-16-2017) $21.97 Recommendation HOLDTarget Price $23.74Upside Potential 8.00%
Valuation SummaryMethod Price Weight
Discounted Cash Flow 60%Perpetuity Growth Method $14.73 40%Exit Multiple Method $31.22 20%Comparable Company Analysis 40%P/E $20.95 20%EV/EBITDA $37.05 20%Target Price $23.74

20
Backup Slides
Tornado Chart
Sensitivity Analysis
Income Statement
Balance Sheet
Cash Flow Statement
Links
21
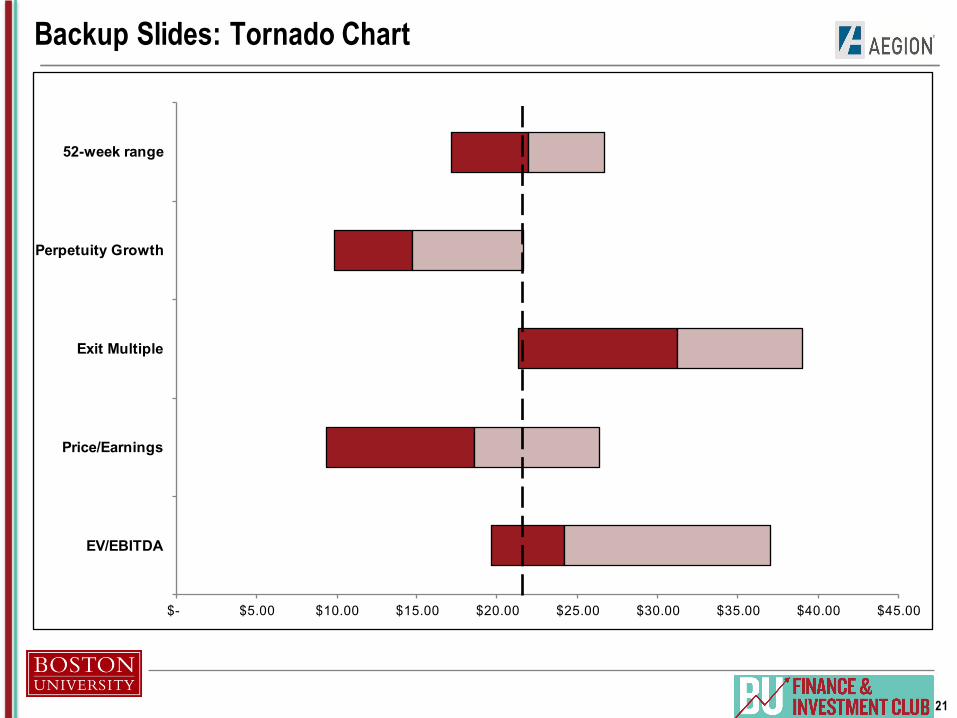
Backup Slides: Tornado Chart
$- $5.00 $10.00 $15.00 $20.00 $25.00 $30.00 $35.00 $40.00 $45.00
52-week range
Perpetuity Growth
Exit Multiple
Price/Earnings
EV/EBITDA

22
Backup Slides: Sensitivity Analysis
DCF -‐ Perpetuity Growth Sensitivity
WACC
– 9.5% 10.0% 10.5% 11.0% 11.5% 12.0% 12.5% 13.0%
Term
inal Growth Rate
3.0% $21.61 $19.70 $18.05 $16.61 $15.36 $14.25 $13.27 $12.39
2.5% $20.04 $18.36 $16.90 $15.62 $14.49 $13.48 $12.59 $11.78
2.0% $18.67 $17.18 $15.88 $14.73 $13.71 $12.79 $11.98 $11.24
1.5% $17.48 $16.15 $14.98 $13.93 $13.00 $12.17 $11.42 $10.74
1.0% $16.42 $15.23 $14.17 $13.22 $12.37 $11.60 $10.91 $10.28
0.5% $15.49 $14.41 $13.44 $12.57 $11.79 $11.08 $10.44 $9.86
DCF -‐ EV/EBITDA Exit Multiple Sensitivity
WACC– 9.5% 10.0% 10.5% 11.0% 11.5% 12.0% 12.5% 13.0%
Term
inal EBITD
A Multiple 13.4 x $39.07 $38.21 $37.37 $36.55 $35.76 $34.99 $34.23 $33.50
12.4 x $36.21 $35.42 $34.64 $33.89 $33.15 $32.44 $31.74 $31.06
11.4 x $33.36 $32.63 $31.91 $31.22 $30.55 $29.89 $29.25 $28.63
10.4 x $30.51 $29.84 $29.19 $28.56 $27.94 $27.34 $26.76 $26.19
9.4 x $27.65 $27.05 $26.46 $25.89 $25.33 $24.79 $24.26 $23.75
8.4 x $24.80 $24.26 $23.74 $23.22 $22.73 $22.24 $21.77 $21.31

23
Backup Slides: Income Statement

24
Backup Slides: Balance Sheet
25
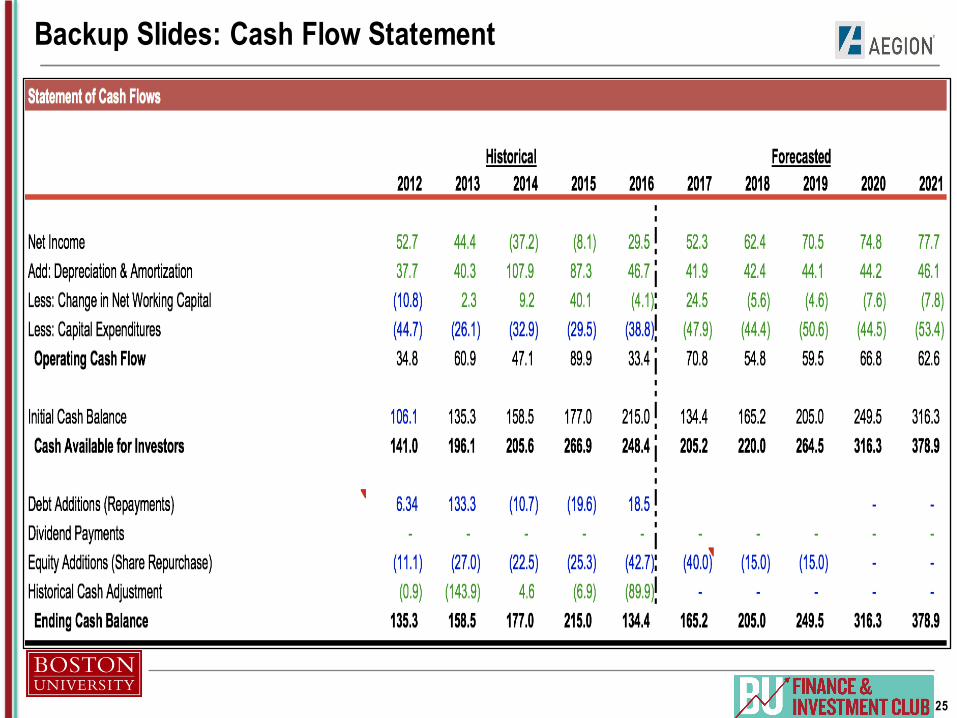
Backup Slides: Cash Flow Statement

26
Backup: Navigation Links
1. Cover
2. Agenda
3. Valuation Summary
4. Industry Definition
5. Industry Structure & Segmentation
6. Aegion Corporation
7. Leadership
8. Value Generation
9. Trends Page Break
10. Water Mains Investment
11. Recovering Energy Industry
12. Healthy Municipal Bond Market
13. Company Trends Page Break
14. Cash Generation
15. Operational Margins
16. Strategic M&A
17. Comparable Companies
18. DCF Inputs
19. Valuation Summary
20. Backup Cover