aegon americas: executing our strategy › globalassets › corporate-2018 › ... ·...
TRANSCRIPT

aegon.com
Mark Mullin Michiel van Katwijk
Management Board Member Chief Financial Officer – Americas
Chief Executive Officer – Americas
Americas
Executing our strategy
Analyst & Investor Conference, London – June 19, 2013
2 2
Key messages
Delivering on core business objectives
► Catering to client needs through diverse product mix
► Successful expansion of distribution driving new business volumes
► Investing in product innovation to fuel future growth
Balanced risk profile
► Growth in fee-based businesses replaces decline in spread business
► Hedge programs in place to reduce capital volatility
Accelerating profitable growth
► Maintaining pricing discipline results in increasing profitability of new sales
► Outperforming the market in core areas, such as variable annuities and pensions

3
Execution of Aegon strategy
Customer centricity
Expanding distribution
Product innovation
Balanced risk profile
Profitable sales mix
Investing in and leveraging technology
Restructured 14 business units into three
core businesses
New senior leadership team
Completed TARe divestiture
Executed FA co-insurance deals
Business model fee-based – capital light
Product design changes and repricing
Reduced exposure to US credit markets
80% delta hedged
Repositioned and strengthened
Transamerica brand
Wind down institutional spread business
Exited automotive credit market
Exited BOLI/COLI
Merged broker / dealers
De-emphasized fixed annuities
Closed Louisville location
Monumental Life securitization
Unhedged delta
Reflections on strategic transformation
Phase 3: 2012 and future Profitable, sustainable growth Phase 2: 2010 – 2011
Rebasing and positioning for growth Phase 1: 2008 – 2010
Decisions made to exit or de-emphasize part of earnings base
Ongoing commitment to strategy yields profitable, sustainable growth
Profitable, sustainable growth
4
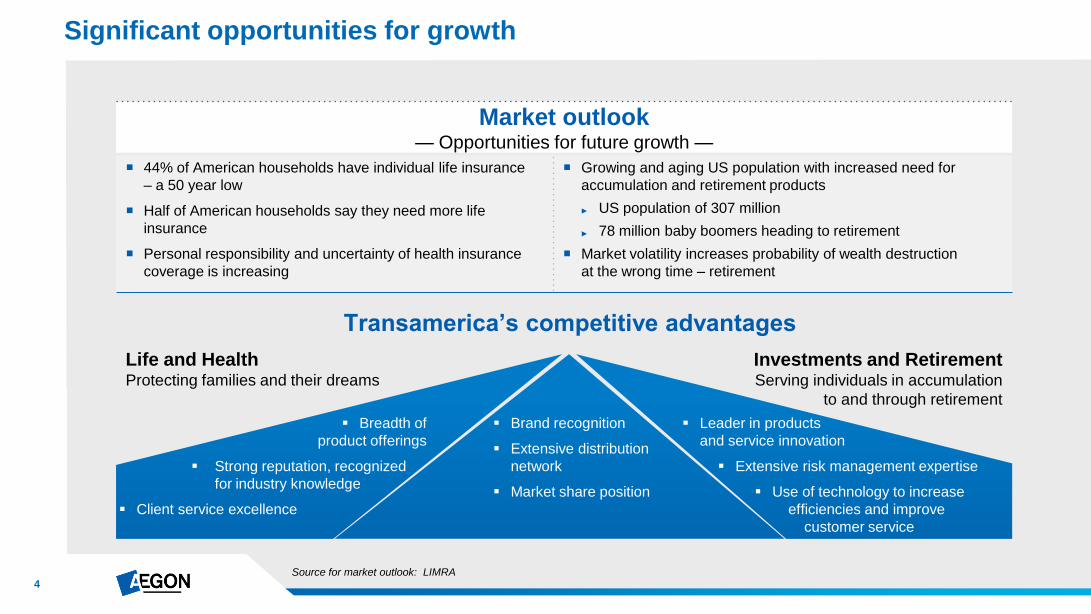
Significant opportunities for growth
44% of American households have individual life insurance
– a 50 year low
Half of American households say they need more life
insurance
Personal responsibility and uncertainty of health insurance
coverage is increasing
Growing and aging US population with increased need for
accumulation and retirement products
► US population of 307 million
► 78 million baby boomers heading to retirement
Market volatility increases probability of wealth destruction
at the wrong time – retirement
Life and Health Protecting families and their dreams
Investments and Retirement Serving individuals in accumulation
to and through retirement
Transamerica’s competitive advantages
Breadth of
product offerings
Strong reputation, recognized
for industry knowledge
Client service excellence
Brand recognition
Extensive distribution
network
Market share position
Leader in products
and service innovation
Extensive risk management expertise
Use of technology to increase
efficiencies and improve
customer service
Market outlook — Opportunities for future growth —
Source for market outlook: LIMRA

5
Executing our core growth strategy in Life and Health
Growing through . . .
Broadening existing distribution
Adding new distribution, including direct
Introducing less capital
intensive products
Diverse product mix
Maintaining pricing discipline
for profitability
Investing in technology and innovation
Leveraging technology to
increase efficiencies and improve
customer service
Strong and steady growth is key . . .
Industry ranking source: LIMRA
US Industry Ranking - Transamerica
2009 2010 2011 2012
Individual life sales 9 6 8 5
Voluntary permanent life
sales 7 7 5 4
Voluntary health sales 7 5 5 5

6
Broadening existing distribution
through diverse product mix
Launched universal life with secondary guarantee
products in 1Q 13 with first-to-market, real time pricing
Increasing sales of supplemental health
and specialty lines, such as Medical Supplement,
Medicare Part D, student health and travel
Expanding product offerings in voluntary life
and health at worksite
Leveraging expertise in recruiting
new distribution
~ 25% of 1Q 13 Life & Protection sales
gained through distribution added post 2008
~ 20% increase in Life & Protection distribution
through General Agencies and World Financial Group
in 1Q 13 compared to 1Q 12
Growth driven by expanding distribution and product diversity
Total sales* (USD million)
567 582 668 157 145
773 812 905
231 264
2010 2011 2012 1Q 12 1Q 13
Life
Accident and health 1,340 1,394
1,573
388 409
* Life sales are standardized = recurring premium + 1/10 of single premium; health sales are not standardized
+5%
Launched direct to consumer initiative
Directing consumers to digital platform and providing
access to an agent via telephone, e-mail or click-to-chat
Providing on-line life insurance education, as well as
product recommendations via a Personal Plan Builder
Significant improvement in profitability of new business on a market consistent basis
7
0%
100%
200%
300%
400%
2003 2004 2005 2006 2007 2008 2009 2010 2011 2012*
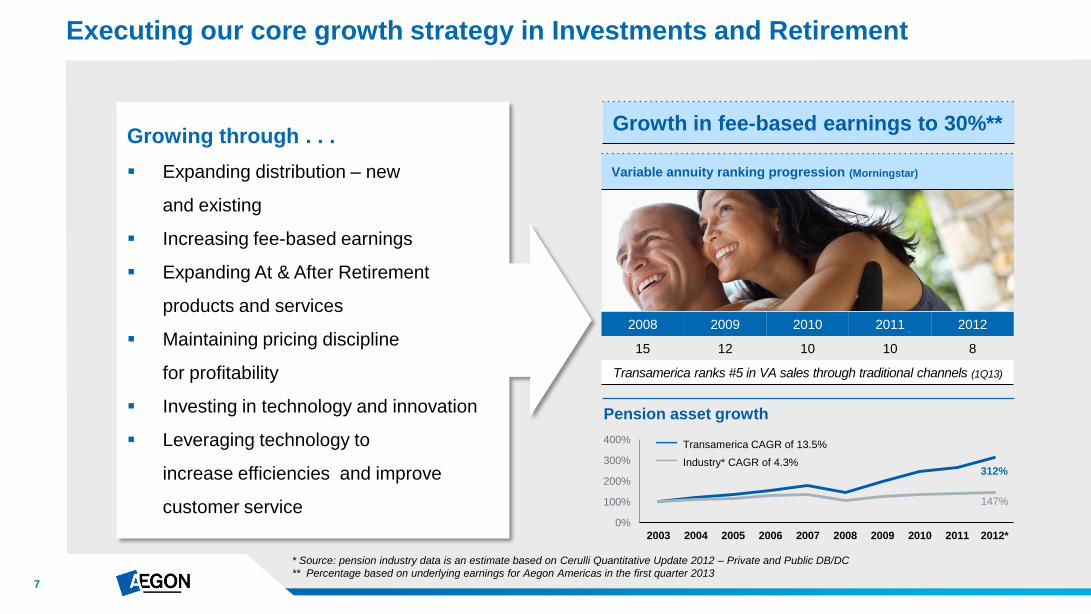
Executing our core growth strategy in Investments and Retirement
Growth in fee-based earnings to 30%**
* Source: pension industry data is an estimate based on Cerulli Quantitative Update 2012 – Private and Public DB/DC
** Percentage based on underlying earnings for Aegon Americas in the first quarter 2013
— Transamerica CAGR of 13.5%
— Industry* CAGR of 4.3%
Pension asset growth
Growing through . . .
Expanding distribution – new
and existing
Increasing fee-based earnings
Expanding At & After Retirement
products and services
Maintaining pricing discipline
for profitability
Investing in technology and innovation
Leveraging technology to
increase efficiencies and improve
customer service
312%
147%
Variable annuity ranking progression (Morningstar)
2008 2009 2010 2011 2012
15 12 10 10 8
Transamerica ranks #5 in VA sales through traditional channels (1Q13)

8
Growth in fee-based business driven by:
Solutions focused, high caliber wholesaling force
Leveraging targeted firms to expand production
Utilizing Advisor Targeting System to increase productivity
Continuing to expand diversity of client base in traditional channels
Partnering with large firms to provide VA solutions
in both traditional and alternative channels
Launched private label VA with Voya (ING U.S.) in May 2013,
increasing number of private label partners to 8
Recent launch of co-created, simplified VA product with select partners
Expanding value-added services to
advisors/clients and increasing internal asset
allocation competencies
Rounding out mutual fund platform, including
launch of 13 new funds in the last 15 months
5 consecutive quarters of positive net flows for funds
~35% of 1Q 13 sales from funds launched in last 3 years
43% of VA sales and 54% mutual fund sales to funds
managed by Aegon Asset Management in 1Q 13
Variable annuity sales (USD billion)
Increasing market penetration in Individual Savings & Retirement
* Variable annuities margin adjusted for one-offs
** 1Q 2013 earnings annualized
38 42 43 48 51 0.0%
0.5%
1.0%
2009 2010 2011 2012 1Q13 —— Margin (UEBT** / Assets) - - - Targeted margin
VA balances and margin* (%, USD billion)
2.9 3.4 4.6 4.5 1.1 1.4
0.4 0.4
0.7 0.9
0.1 0.2
2009 2010 2011 2012 1Q12 1Q13 Traditional channels Alternative channels
Account balances (USD billion)
38 42 43 48 51
10 12 11
13 14
2009 2010 2011 2012 1Q13 Variable annuities Mutual funds
9
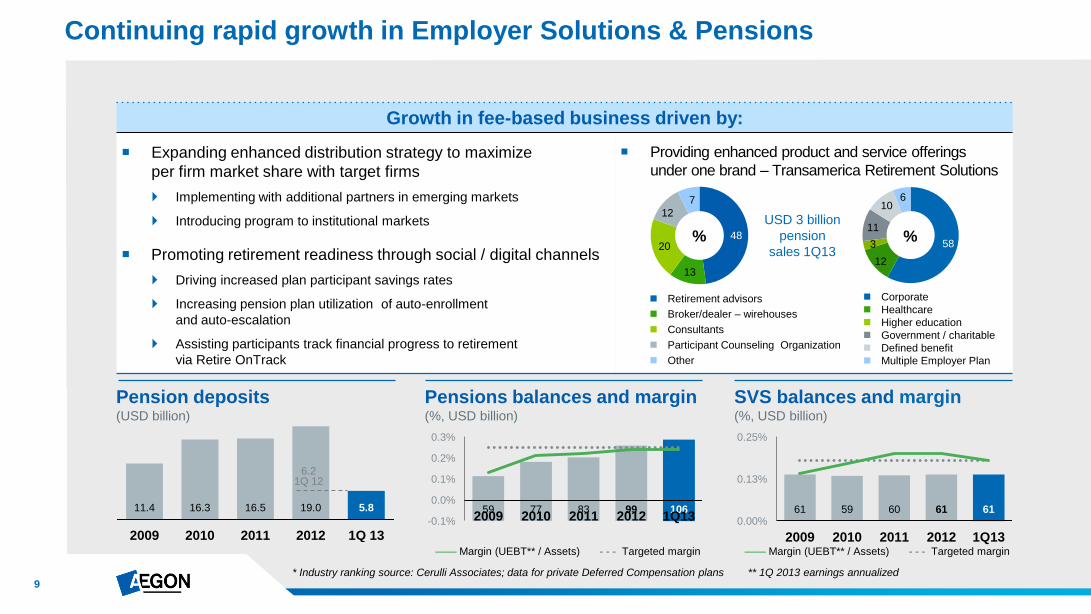
Growth in fee-based business driven by:
Expanding enhanced distribution strategy to maximize
per firm market share with target firms
Implementing with additional partners in emerging markets
Introducing program to institutional markets
Promoting retirement readiness through social / digital channels
Driving increased plan participant savings rates
Increasing pension plan utilization of auto-enrollment
and auto-escalation
Assisting participants track financial progress to retirement
via Retire OnTrack
Providing enhanced product and service offerings
under one brand – Transamerica Retirement Solutions
Continuing rapid growth in Employer Solutions & Pensions
Pensions balances and margin (%, USD billion)
59 77 83 99 106 -0.1%
0.0%
0.1%
0.2%
0.3%
2009 2010 2011 2012 1Q13
* Industry ranking source: Cerulli Associates; data for private Deferred Compensation plans ** 1Q 2013 earnings annualized
11.4 16.3 16.5 19.0 5.8
2009 2010 2011 2012 1Q 13
6.2 1Q 12
Pension deposits (USD billion)
—— Margin (UEBT** / Assets) - - - Targeted margin
SVS balances and margin (%, USD billion)
61 59 60 61 61 0.00%
0.13%
0.25%
2009 2010 2011 2012 1Q13 —— Margin (UEBT** / Assets) - - - Targeted margin
Retirement advisors
Broker/dealer – wirehouses
Consultants
Participant Counseling Organization
Other
Corporate
Healthcare
Higher education
Government / charitable
Defined benefit
Multiple Employer Plan
48
13
20
12
7
% 58
12
3
11
10
%
6
USD 3 billion
pension
sales 1Q13

10
Growing value of new business through management action
Improving profitability and increasing
value on a market consistent basis
Responsive to market conditions through
product repricing, redesign, withdrawal,
as well as introduction of new products
Pricing discipline maintained – value
over volume
Innovation led to significant
improvements in MCVNB
Variable annuities: speed to market
repricing, first-to-market with tiered equity
pricing by fund risk level and volatility
adjusted funds
Universal life with secondary guarantees:
product withdrawals in 2012 with launch
of new product with first-to-market,
real-time pricing in 1Q 2013
2010 2011 2012 1Q 2012 1Q 2013 L&P IS&R - VA IS&R - MF IS&R - FA ES&P Other markets
MCVNB by line of business (USD million)
159
236
294
125
62
Americas MCVNB relative to 10-year US Treasury
-70
0
70
140
-2.5
0
2.5
5
1Q 2013
4Q 2012
3Q 2012
2Q 2012
1Q 2012
4Q 2011
3Q 2011
2Q 2011
1Q 2011
4Q 2010
3Q 2010
2Q 2010
1Q 2010
10 Y
r U
S T
reasury
rate
s A
egon A
meric
as M
CV
NB
2010 2011 2012 2013

11
Capitalization level based on the most stringent of
► Local regulatory requirements
► Rating agency requirements and / or
► Internal management criteria
Financial flexibility must be deemed strong under normal,
adverse and extreme circumstances
Governance process over capital adequacy, capital
efficiency and fungibility of capital in place at Americas
level with escalation thresholds to holding company
Managing capital across multiple frameworks
United
States
RBC ratio
~485%
S&P ‘AA’
excess capital
+ USD ~900 million
Local solvency ratios per 1Q 2013 = current binding constraint
Stabilized capital volatility through extensive asset-liability management and hedging programs
12
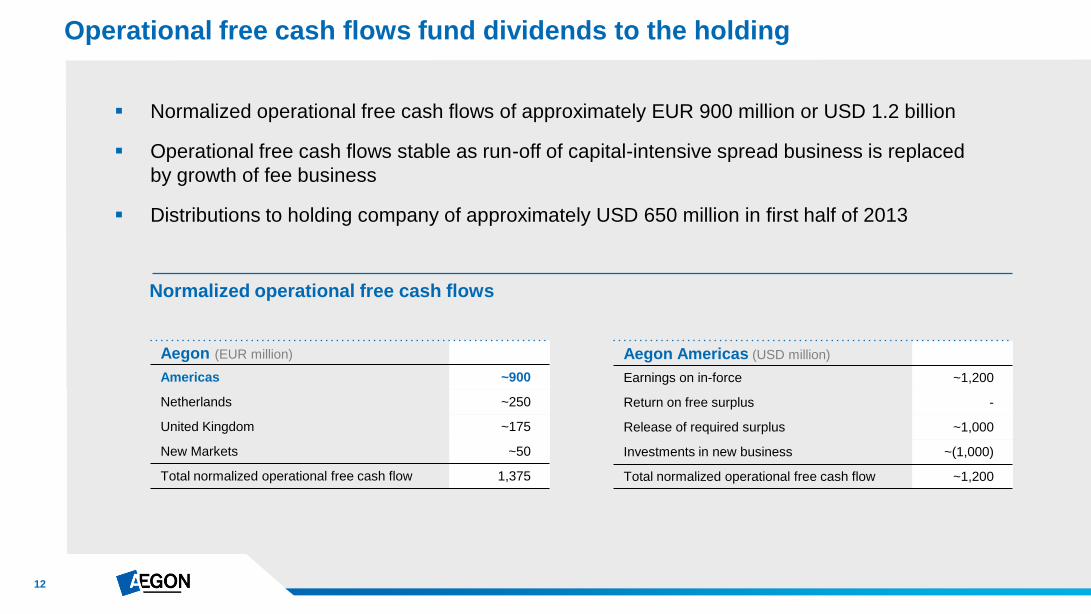
Normalized operational free cash flows of approximately EUR 900 million or USD 1.2 billion
Operational free cash flows stable as run-off of capital-intensive spread business is replaced
by growth of fee business
Distributions to holding company of approximately USD 650 million in first half of 2013
Operational free cash flows fund dividends to the holding
Normalized operational free cash flows
Aegon (EUR million)
Americas ~900
Netherlands ~250
United Kingdom ~175
New Markets ~50
Total normalized operational free cash flow 1,375
Aegon Americas (USD million)
Earnings on in-force ~1,200
Return on free surplus -
Release of required surplus ~1,000
Investments in new business ~(1,000)
Total normalized operational free cash flow ~1,200

13
Clear targets to support overall Group targets
Achieve return on capital* of
8.5% (8.2% geography adjusted**)
by 2015
Grow underlying earnings
before tax by
3-5%
of underlying earnings
by 2015
30-35%
Double fee-based earnings to
between 2010 and 2015
Increase annual
operational free cash flow by
25%
on average per annum
between 2010 and 2015
* Excludes leverage benefit at holding
** Geography adjustments as disclosed in 1Q 2012

14
Increasing presence across social media channels Strengthening connection with customers through engaging
thought leadership across multiple social media channels
Getting closer to the people who depend on us
Transforming transamerica.com into an integrated web, mobile and social experience
Unifying customer service experience Moving towards a single point of contact through phone, email and live
chat enabling customers to use their preferred method of communication
Improving navigation across devices Refreshing the digital customer experience to give customers
what they want to see, hear, and learn from us
Personalizing experience and products Using customer data to personalize customer experience resulting
in brand loyalty and retention
®
15 15
Summary
Delivering on core business objectives
► Catering to client needs through diverse product mix
► Successful expansion of distribution driving new business volumes
► Investing in product innovation to fuel future growth
Balanced risk profile
► Growth in fee-based businesses replaces decline in spread business
► Hedge programs in place to reduce capital volatility
Accelerating profitable growth
► Maintaining pricing discipline results in increasing profitability of new sales
► Outperforming the market in core areas, such as variable annuities and pensions

16
Appendix

17
Life & Protection at a glance
* Life sales are standardized = recurring premium + 1/10 of single premium; health sales are not standardized
31%
69%
Health
Life
38% 62%
L&P
61% 39%
L&P
Other
Americas
businesses
1Q 2013 L&P sales
Life vs. Health* (USD million)
1Q 2013 Aegon Americas
Inforce premium (USD billion)
1Q 2013 Aegon Americas
Underlying earnings (USD million)
383 2.6 413 Other
Americas
businesses
including
run-off
Diverse distribution with target market focus
Agency Employee Benefits
Affinity Markets Brokerage
Business profile
Life, health and specialty products
Stable market with solid earnings growth
Top 10 player in individual life,
supplemental health and voluntary worksite
High quality, low risk earnings
Lower capital markets leverage
Strong distributable earnings
18
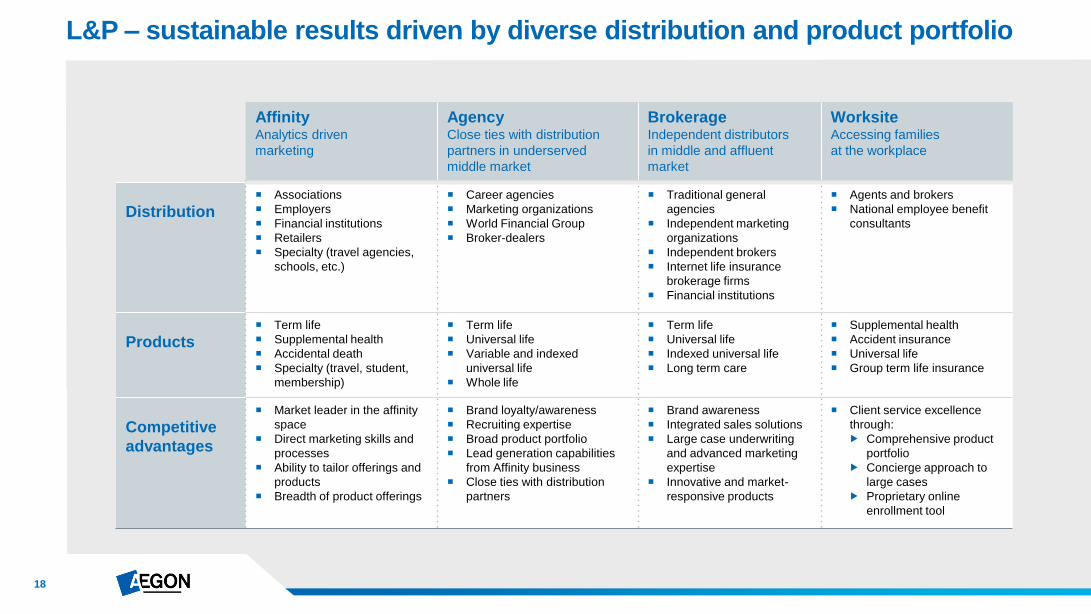
L&P – sustainable results driven by diverse distribution and product portfolio
Affinity Analytics driven
marketing
Agency Close ties with distribution
partners in underserved
middle market
Brokerage Independent distributors
in middle and affluent
market
Worksite Accessing families
at the workplace
Distribution
Associations
Employers
Financial institutions
Retailers
Specialty (travel agencies,
schools, etc.)
Career agencies
Marketing organizations
World Financial Group
Broker-dealers
Traditional general
agencies
Independent marketing
organizations
Independent brokers
Internet life insurance
brokerage firms
Financial institutions
Agents and brokers
National employee benefit
consultants
Products
Term life
Supplemental health
Accidental death
Specialty (travel, student,
membership)
Term life
Universal life
Variable and indexed
universal life
Whole life
Term life
Universal life
Indexed universal life
Long term care
Supplemental health
Accident insurance
Universal life
Group term life insurance
Competitive
advantages
Market leader in the affinity
space
Direct marketing skills and
processes
Ability to tailor offerings and
products
Breadth of product offerings
Brand loyalty/awareness
Recruiting expertise
Broad product portfolio
Lead generation capabilities
from Affinity business
Close ties with distribution
partners
Brand awareness
Integrated sales solutions
Large case underwriting
and advanced marketing
expertise
Innovative and market-
responsive products
Client service excellence
through:
Comprehensive product
portfolio
Concierge approach to
large cases
Proprietary online
enrollment tool

19
Employer Solutions & Pensions at a glance
Comprehensive solutions for over 23,000
American employers and 3.1 million plan participants
All pension markets covered: DB, DC, small
to large, private and public, bundled and unbundled
Extensive product portfolio: Corporate, Not-for-
Profit, Multiple Employer Plan, Retirement Plan
Exchange, Third Party Administration
Insuring stable value investments for DC market
Some capital markets leverage (fee-based)
Business profile Industry validation
Pension margin Revenue-generating investments (USD billion)
50 60 61 59 60 61 61
55 46 59 77 83 99 106
2007 2008 2009 2010 2011 2012 1Q 2013 Retirement Solutions Stable Value Solutions
0.29% 0.26% 0.13% 0.21% 0.22% 0.24% 0.24%
2007 2008 2009 2010 2011 2012 Q1 13 2015p
Fee revenue / AUM
Operating expense / AUM
Pre-tax underlying earnings / AUM
1Q 2013

20
ES&P – diverse business model designed for sustainable growth
Retirement Solutions Serving 23,000 employers and 3.1 million individuals
to and through retirement
Stable Value Solutions Insuring stable value investments
for America’s defined contribution market
Products Defined contribution plans
Defined benefit plans
Full service record keeping
Multiple employer plans
Retirement plan exchange
Not-for-profit solutions
Total Retirement Outsourcing (TRO)
Third Party Administrator (TPA)
solutions
Non qualified defined
contribution plans
Administrative Services
Only (ASO)
Full service and
brokerage Individual
Retirement Account
(IRA) capabilities
Synthetic Guaranteed Investment Contracts (GICs)
► Individual plans
► Pooled funds
Investment only contracts
Administrative Services Only (ASO)
Transamerica maintaining target notional balance
of $58 - $60 billion
Distribution
Wirehouses
Banks
Consultants
Retirement advisors
Third Party Administrators
57 external wholesalers
– Emerging Markets
16 external wholesalers
– Institutional Markets
Stable value investment managers
Dedicated client management team
Competitive
advantages
Extensive distribution network
Leader in products and service innovation
Industry leading operational platform
Award winning customer service
Among highest levels of customer loyalty
191 field education specialists
#2 market share position
Industry leading operational platform
and use of technology
Extensive risk management expertise
Strong reputation, recognized for industry knowledge

21
Individual Savings & Retirement at a glance
Annuity and mutual fund products
Strong growth potential due to scale, diversity
of distribution and technical requirements
Fee-based quality earnings
Some capital markets leverage post hedging
Gross deposits FY 2011 (USD billion)
Business profile
Gross deposits FY 2008 (USD billion)
Gross deposits FY 2012 (USD billion)
63%
33%
4%
Growing fee business
8.4 58%
38%
4%
9.2
Fixed annuities
Variable annuities
Retail mutual funds
28%
23%
49% 12.1
0%
20%
40%
60%
80%
100%
2010 2011 2012 1Q 2013 Retail mutual funds Variable annuities Fixed annuities
IS&R underlying earnings mix shift
from FA to VA and mutual funds

22
IS&R – positioned to capitalize on significant market opportunities
Annuities – variable and fixed Wealth accumulation, preservation and retirement income
Retail mutual funds Wealth accumulation and asset allocation
Overview
Transamerica Capital Management (TCM) ► Manufactures variable and fixed annuities ► Distributes variable and fixed annuities
Variable annuities: ► Dedicated wholesaling team ► Fee-based earnings retain some capital markets leverage post-
hedging Fixed annuities (business is de-emphasized):
► Profitability managed over time through rate setting ► Back book management through select reinsurance transactions
Transamerica Asset Management (TAM) ► Investment advisor to all AEGON USA mutual funds ► Manufactures mutual funds ► Provides asset allocation ► Offers a continuum of asset allocation
and partner funds/asset management – effectively a ―manager of managers‖
Dedicated wholesaling team and award winning shareholder servicing
Fee-based earnings with low required capital
Distribution
Focused on third-party distribution (advisors) ► Banks ► Wires ► Independent broker dealers
Adding new channels
Focused on third party distribution (advisors) ► Banks ► Wires ► Independent broker dealers
Adding new channels
Competitive
advantages
Highly recognized brand – Transamerica Distribution capabilities and execution Customer service Advanced Markets support for advisors on complex
planning concepts and strategies Advisor Targeting System (ATS) Low maintenance costs Innovative approach: speed to market, pricing discipline
and back book management
Open architecture - focus on ―Best in Class‖ Manager research and selection capabilities Diversified channels with strong wholesaling distribution Advisor Targeting System (ATS) Highly recognized brands - Transamerica
and Morningstar Customer service focus - 10 consecutive
DALBAR awards and 13 overall Asset allocation capabilities
23
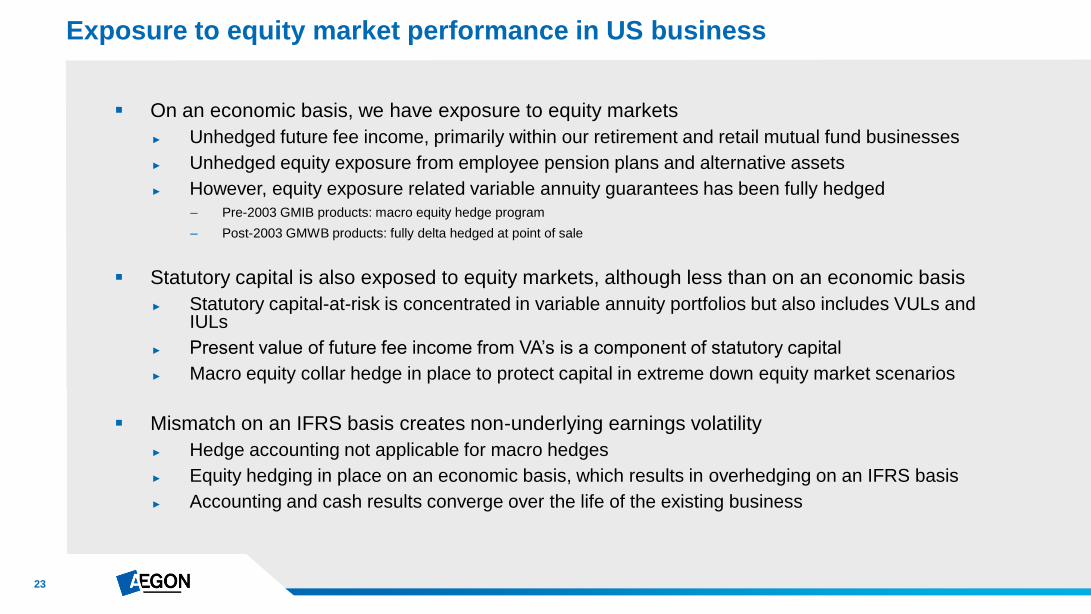
On an economic basis, we have exposure to equity markets
► Unhedged future fee income, primarily within our retirement and retail mutual fund businesses
► Unhedged equity exposure from employee pension plans and alternative assets
► However, equity exposure related variable annuity guarantees has been fully hedged
– Pre-2003 GMIB products: macro equity hedge program
– Post-2003 GMWB products: fully delta hedged at point of sale
Statutory capital is also exposed to equity markets, although less than on an economic basis
► Statutory capital-at-risk is concentrated in variable annuity portfolios but also includes VULs and IULs
► Present value of future fee income from VA’s is a component of statutory capital
► Macro equity collar hedge in place to protect capital in extreme down equity market scenarios
Mismatch on an IFRS basis creates non-underlying earnings volatility
► Hedge accounting not applicable for macro hedges
► Equity hedging in place on an economic basis, which results in overhedging on an IFRS basis
► Accounting and cash results converge over the life of the existing business
Exposure to equity market performance in US business

24
GMIB equity guarantees have been hedged with a macro hedge program to protect capital
► Hedge program in place since 2009; hedging against multiple equity indices
► Equity return swapped into Libor rate
Underlying earnings assume 9% equity market return; hedges carried at Fair Value with results
reflected in Fair Value Items (outside of underlying earnings)
► Current low Libor rates result in expected quarterly loss of ~USD 70 million per quarter
Volatility around expected quarterly loss is the result of accounting mismatch as hedge accounting
is not applicable
► GMIB liability carried at amortized cost (SOP 03-1); whereas, hedges are carried at fair value
► Higher equity markets leads to accelerated losses on hedges exceeding partial offset in liabilities, and vice versa
► Equity indices rose on average 10% during 1Q 2013 resulting in USD (147) million in fair value items
► Macro hedge results in line with expectations based on cumulative average since inception
Macro equity hedge program covering US GMIB equity exposure
(160)
(120)
(80)
(40)
0
40
1Q 10 2Q 10 3Q 10 4Q 10 1Q 11 2Q 11 3Q 11 4Q 11 1Q 12 2Q 12 3Q 12 4Q 12 1Q 13
IFRS equity macro hedge results (USD million)
Quarterly results macro hedge Cumulative average macro hedge results

25
— Collar protection sold —
— Collar protection bought —
900
1000
1100
1200
1300
1400
1500
1600
1700
1800
1900
4Q 2012 1Q 2013 2Q 2013 3Q 2013 4Q 2013
S&
P 5
00 In
dex
05/31/2013
= 1631
One-year protection from equity collar macro hedge
Equity collar macro hedge added
in 4Q 2012 to protect US statutory capital
► Present value of future fee income from
VAs is a component of statutory capital
► Sold upside to pay for downside protection
The options are marked-to-market with quarterly
changes reflected in fair value items
Additional estimated impact to fair value
items through year-end when options
mature under multiple scenarios:
S&P 500 Estimated impact to
movement* Fair Value Items (in millions)
+20% USD (272)
+10% USD (112)
0% USD 18
(10)% USD 128
(20)% USD 143
* From S&P level of 1569 at April 1, 2013
Strike zones for collar protection
— S&P 500 performance
1810
1520
1270
1090

26
Aegon Americas – Investments general account
(USD million)
March 31,
2013 December 31,
2012 September 30,
2012 June 30,
2012 March 31,
2012
Cash / Treasuries / Agencies 19,965 22,503 22,610 22,153 20,115
Investment grade corporates 50,435 50,019 50,711 49,865 49,937
High yield (and other) corporates 3,152 3,276 3,319 3,140 2,995
Emerging markets debt 2,094 2,089 2,054 1,986 1,992
Commercial MBS 6,848 6,891 6,963 7,134 7,574
Residential MBS 6,519 6,703 6,941 6,771 7,019
Non-housing related ABS 4,064 3,932 4,090 4,568 4,757
Subtotal 93,077 95,413 96,688 95,617 94,389
Residential mortgage loans 41 44 46 47 48
Commercial mortgage loans 8,778 8,970 9,412 9,678 10,324
Total mortgages 8,819 9,014 9,458 9,725 10,372
Convertibles & preferred stock 437 430 449 436 390
Common equity & bond funds 1,627 1,542 1,495 1,409 1,488
Private equity & hedge funds 1,786 1,847 1,853 1,878 1,893
Total equity like 3,850 3,819 3,797 3,723 3,771
Real estate 2,010 1,956 2,031 2,007 1,899
Other 1,008 1,053 1,030 1,012 917
Investments general account (excluding policy loans) 108,764 111,255 113,004 112,084 111,348
Policyholder loans 2,714 2,733 2,755 2,755 2,769
Investments general account 111,478 113,988 115,759 114,839 114,117

27
44 44
37
27
9
25
1 2 4
8 17
64
82
48
17
-6
-2
2
91
120
52
33
17
1
Credit losses in the US trending down
1990 1991 1992 1993 1994 1995 1996 1997 1998 1999 2000 2001 2002 2003 2004 2005 2006 2007 2008 2009 2010 2011 2012 1Q
2013
average of 32 bps
since 1990
Periods prior to 2005 are based on Dutch Accounting Principles (DAP)
Periods 2005 and later are based on International Financial Reporting Standards (IFRS)
US credit losses in bps of fixed income assets

Thank you
For questions please contact Investor Relations
+31 70 344 8305
P.O. Box 85
2501 CB The Hague
The Netherlands

29
Disclaimer
Cautionary note regarding non-IFRS measures This document includes the non-IFRS financial measures: underlying earnings before tax, income tax, income before tax and market consistent value of new business. These non-IFRS measures are calculated by consolidating on a proportionate basis Aegon’s joint ventures and associated companies. The reconciliation of these measures, except for market consistent value of new business, to the most comparable IFRS measure is provided in note 3 "Segment information" of Aegon’s condensed consolidated interim financial statements. Market consistent value of new business is not based on IFRS, which are used to report Aegon’s primary financial statements and should not be viewed as a substitute for IFRS financial measures. Aegon may define and calculate market consistent value of new business differently than other companies. Aegon believes that its non-IFRS measures, together with the IFRS information, provide meaningful information about the underlying operating results of Aegon’s business including insight into the financial measures that senior management uses in managing the business.
Local currencies and constant currency exchange rates This document contains certain information about Aegon’s results, financial condition and revenue generating investments presented in USD for the Americas and GBP for the United Kingdom, because those businesses operate and are managed primarily in those currencies. Certain comparative information presented on a constant currency basis eliminates the effects of changes in currency exchange rates. None of this information is a substitute for or superior to financial information about Aegon presented in EUR, which is the currency of Aegon’s primary financial statements.
Forward-looking statements The statements contained in this document that are not historical facts are forward-looking statements as defined in the US Private Securities Litigation Reform Act of 1995. The following are words that identify such forward-looking statements: aim, believe, estimate, target, intend, may, expect, anticipate, predict, project, counting on, plan, continue, want, forecast, goal, should, would, is confident, will, and similar expressions as they relate to Aegon. These statements are not guarantees of future performance and involve risks, uncertainties and assumptions that are difficult to predict. Aegon undertakes no obligation to publicly update or revise any forward-looking statements. Readers are cautioned not to place undue reliance on these forward-looking statements, which merely reflect company expectations at the time of writing. Actual results may differ materially from expectations conveyed in forward-looking statements due to changes caused by various risks and uncertainties. Such risks and uncertainties include but are not limited to the following:
Changes in general economic conditions, particularly in the United States, the Netherlands and the United Kingdom;
Changes in the performance of financial markets, including emerging markets, such as with regard to:
– The frequency and severity of defaults by issuers in Aegon’s fixed income investment portfolios;
– The effects of corporate bankruptcies and/or accounting restatements on the financial markets and the resulting decline in the value of equity and debt securities Aegon holds; and
– The effects of declining creditworthiness of certain private sector securities and the resulting decline in the value of sovereign exposure that Aegon holds;
Changes in the performance of Aegon’s investment portfolio and decline in ratings of Aegon’s counterparties;
Consequences of a potential (partial) break-up of the euro;
The frequency and severity of insured loss events;
Changes affecting mortality, morbidity, persistence and other factors that may impact the profitability of Aegon’s insurance products;
Reinsurers to whom Aegon has ceded significant underwriting risks may fail to meet their obligations;
Changes affecting interest rate levels and continuing low or rapidly changing interest rate levels;
Changes affecting currency exchange rates, in particular the EUR/USD and EUR/GBP exchange rates;
Changes in the availability of, and costs associated with, liquidity sources such as bank and capital markets funding, as wel l as conditions in the credit markets in general such as changes in borrower and counterparty creditworthiness;
Increasing levels of competition in the United States, the Netherlands, the United Kingdom and emerging markets;
Changes in laws and regulations, particularly those affecting Aegon’s operations, ability to hire and retain key personnel, the products Aegon sells, and the attractiveness of certain products to its consumers;
Regulatory changes relating to the insurance industry in the jurisdictions in which Aegon operates;
Changes in customer behavior and public opinion in general related to, among other things, the type of products also Aegon sells, including legal, regulatory or commercial necessity to meet changing customer expectations;
Acts of God, acts of terrorism, acts of war and pandemics;
Changes in the policies of central banks and/or governments;
Lowering of one or more of Aegon’s debt ratings issued by recognized rating organizations and the adverse impact such action may have on Aegon’s ability to raise capital and on its liquidity and financial condition;
Lowering of one or more of insurer financial strength ratings of Aegon’s insurance subsidiaries and the adverse impact such action may have on the premium writings, policy retention, profitability and liquidity of its insurance subsidiaries;
The effect of the European Union’s Solvency II requirements and other regulations in other jurisdictions affecting the capita l Aegon is required to maintain;
Litigation or regulatory action that could require Aegon to pay significant damages or change the way Aegon does business;
As Aegon’s operations support complex transactions and are highly dependent on the proper functioning of information technology, a computer system failure or security breach may disrupt Aegon’s business, damage its reputation and adversely affect its
results of operations, financial condition and cash flows;
Customer responsiveness to both new products and distribution channels;
Competitive, legal, regulatory, or tax changes that affect profitability, the distribution cost of or demand for Aegon’s products;
Changes in accounting regulations and policies may affect Aegon’s reported results and shareholders’ equity;
The impact of acquisitions and divestitures, restructurings, product withdrawals and other unusual items, including Aegon’s ability to integrate acquisitions and to obtain the anticipated results and synergies from acquisitions;
Catastrophic events, either manmade or by nature, could result in material losses and significantly interrupt Aegon’s business; and
Aegon’s failure to achieve anticipated levels of earnings or operational efficiencies as well as other cost saving initiatives.
Further details of potential risks and uncertainties affecting Aegon are described in its filings with the Netherlands Authority for the Financial Markets and the US Securities and Exchange Commission, including the Annual Report. These forward-looking statements speak only as of the date of this document. Except as required by any applicable law or regulation, Aegon expressly disclaims any obligation or undertaking to release publicly any updates or revisions to any forward-looking statements contained herein to reflect any change in Aegon’s expectations with regard thereto or any change in events, conditions or circumstances on which any such statement is based.