aeon delight / 9787 · aeon delight / 9787 coverage initiated on: 2013.06.06 last update:...
TRANSCRIPT
Aeon Delight / 9787
COVERAGE INITIATED ON: 2013.06.06
LAST UPDATE: 2018.07.04
Shared Research Inc. has produced this report by request from the company discussed in the report. The aim is to
provide an “owner’s manual” to investors. We at Shared Research Inc. make every effort to provide an accurate,
objective, and neutral analysis. In order to highlight any biases, we clearly attribute our data and findings. We will
always present opinions from company management as such. Our views are ours where stated. We do not try to
convince or influence, only inform. We appreciate your suggestions and feedback. Write to us at
[email protected] or find us on Bloomberg.
Research Coverage Report by Shared Research Inc.
Aeon Delight / 9787 LAST UPDATE: 2018.07.04 Research Coverage Report by Shared Research Inc. | www.sharedresearch.jp
02/77
R Coverage
INDEX
How to read a Shared Research report: This report begins with the trends and outlook section, which discusses the company’s most recent
earnings. First-time readers should start at the business section later in the report.
Key financial indicators ------------------------------------------------------------------------------------------------------------------------------ 3 Recent updates ---------------------------------------------------------------------------------------------------------------------------------------- 4
Highlights ------------------------------------------------------------------------------------------------------------------------------------------------------------ 4 Trends and outlook ----------------------------------------------------------------------------------------------------------------------------------- 5
Quarterly trends and results ----------------------------------------------------------------------------------------------------------------------------------- 5 Full-year company forecasts --------------------------------------------------------------------------------------------------------------------------------- 14
Business ------------------------------------------------------------------------------------------------------------------------------------------------ 34 Business description -------------------------------------------------------------------------------------------------------------------------------------------- 34 Business overview ----------------------------------------------------------------------------------------------------------------------------------------------- 35 Strengths and weaknesses ------------------------------------------------------------------------------------------------------------------------------------ 42 Market and value chain ---------------------------------------------------------------------------------------------------------------------------------------- 43
Financial Statements ------------------------------------------------------------------------------------------------------------------------------- 46 Income statement ----------------------------------------------------------------------------------------------------------------------------------------------- 46 Balance sheet ----------------------------------------------------------------------------------------------------------------------------------------------------- 48 Statement of cash flows --------------------------------------------------------------------------------------------------------------------------------------- 50 ROE and dividends ---------------------------------------------------------------------------------------------------------------------------------------------- 51
Other information ---------------------------------------------------------------------------------------------------------------------------------- 53 History -------------------------------------------------------------------------------------------------------------------------------------------------------------- 53 Major shareholders --------------------------------------------------------------------------------------------------------------------------------------------- 53 Top management ----------------------------------------------------------------------------------------------------------------------------------------------- 53 Employees --------------------------------------------------------------------------------------------------------------------------------------------------------- 54 Investor relations ------------------------------------------------------------------------------------------------------------------------------------------------ 54 By the way --------------------------------------------------------------------------------------------------------------------------------------------------------- 54
Historical financial statements and news ---------------------------------------------------------------------------------------------------- 56 Historical financial statements ------------------------------------------------------------------------------------------------------------------------------- 56 News & topics ---------------------------------------------------------------------------------------------------------------------------------------------------- 75
Company profile ------------------------------------------------------------------------------------------------------------------------------------- 76
Aeon Delight / 9787 LAST UPDATE: 2018.07.04 Research Coverage Report by Shared Research Inc. | www.sharedresearch.jp
03/77
R Coverage
Key financial indicators
Source: Shared Research based on company data
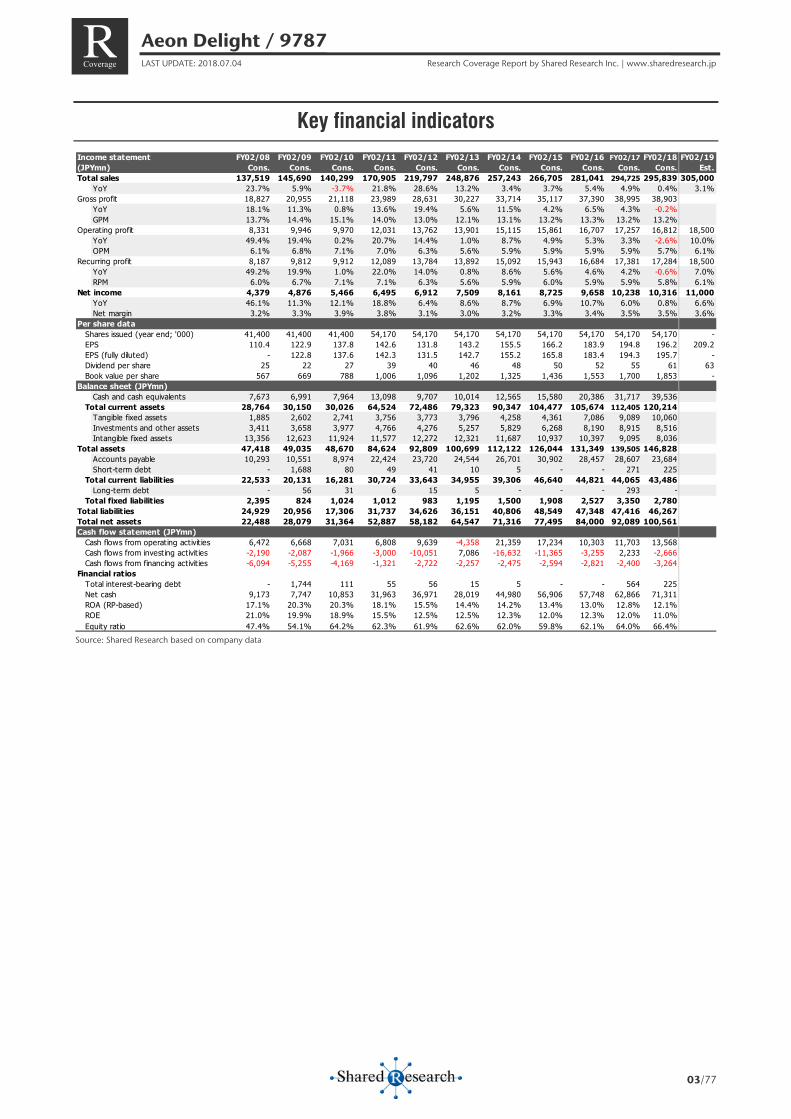
Income statement FY02/08 FY02/09 FY02/10 FY02/11 FY02/12 FY02/13 FY02/14 FY02/15 FY02/16 FY02/17 FY02/18 FY02/19(JPYmn) Cons. Cons. Cons. Cons. Cons. Cons. Cons. Cons. Cons. Cons. Cons. Est.Total sales 137,519 145,690 140,299 170,905 219,797 248,876 257,243 266,705 281,041 294,725 295,839 305,000
YoY 23.7% 5.9% -3.7% 21.8% 28.6% 13.2% 3.4% 3.7% 5.4% 4.9% 0.4% 3.1%Gross profit 18,827 20,955 21,118 23,989 28,631 30,227 33,714 35,117 37,390 38,995 38,903
YoY 18.1% 11.3% 0.8% 13.6% 19.4% 5.6% 11.5% 4.2% 6.5% 4.3% -0.2% GPM 13.7% 14.4% 15.1% 14.0% 13.0% 12.1% 13.1% 13.2% 13.3% 13.2% 13.2%
Operating profit 8,331 9,946 9,970 12,031 13,762 13,901 15,115 15,861 16,707 17,257 16,812 18,500YoY 49.4% 19.4% 0.2% 20.7% 14.4% 1.0% 8.7% 4.9% 5.3% 3.3% -2.6% 10.0%OPM 6.1% 6.8% 7.1% 7.0% 6.3% 5.6% 5.9% 5.9% 5.9% 5.9% 5.7% 6.1%
Recurring profit 8,187 9,812 9,912 12,089 13,784 13,892 15,092 15,943 16,684 17,381 17,284 18,500YoY 49.2% 19.9% 1.0% 22.0% 14.0% 0.8% 8.6% 5.6% 4.6% 4.2% -0.6% 7.0%RPM 6.0% 6.7% 7.1% 7.1% 6.3% 5.6% 5.9% 6.0% 5.9% 5.9% 5.8% 6.1%
Net income 4,379 4,876 5,466 6,495 6,912 7,509 8,161 8,725 9,658 10,238 10,316 11,000YoY 46.1% 11.3% 12.1% 18.8% 6.4% 8.6% 8.7% 6.9% 10.7% 6.0% 0.8% 6.6%Net margin 3.2% 3.3% 3.9% 3.8% 3.1% 3.0% 3.2% 3.3% 3.4% 3.5% 3.5% 3.6%
Per share data Shares issued (year end; '000) 41,400 41,400 41,400 54,170 54,170 54,170 54,170 54,170 54,170 54,170 54,170 -EPS 110.4 122.9 137.8 142.6 131.8 143.2 155.5 166.2 183.9 194.8 196.2 209.2EPS (fully diluted) - 122.8 137.6 142.3 131.5 142.7 155.2 165.8 183.4 194.3 195.7 -Dividend per share 25 22 27 39 40 46 48 50 52 55 61 63Book value per share 567 669 788 1,006 1,096 1,202 1,325 1,436 1,553 1,700 1,853 -
Balance sheet (JPYmn) Cash and cash equivalents 7,673 6,991 7,964 13,098 9,707 10,014 12,565 15,580 20,386 31,717 39,536
Total current assets 28,764 30,150 30,026 64,524 72,486 79,323 90,347 104,477 105,674 112,405 120,214 Tangible fixed assets 1,885 2,602 2,741 3,756 3,773 3,796 4,258 4,361 7,086 9,089 10,060 Investments and other assets 3,411 3,658 3,977 4,766 4,276 5,257 5,829 6,268 8,190 8,915 8,516 Intangible fixed assets 13,356 12,623 11,924 11,577 12,272 12,321 11,687 10,937 10,397 9,095 8,036
Total assets 47,418 49,035 48,670 84,624 92,809 100,699 112,122 126,044 131,349 139,505 146,828 Accounts payable 10,293 10,551 8,974 22,424 23,720 24,544 26,701 30,902 28,457 28,607 23,684 Short-term debt - 1,688 80 49 41 10 5 - - 271 225
Total current liabilities 22,533 20,131 16,281 30,724 33,643 34,955 39,306 46,640 44,821 44,065 43,486 Long-term debt - 56 31 6 15 5 - - - 293 -
Total fixed liabilities 2,395 824 1,024 1,012 983 1,195 1,500 1,908 2,527 3,350 2,780 Total liabilities 24,929 20,956 17,306 31,737 34,626 36,151 40,806 48,549 47,348 47,416 46,267 Total net assets 22,488 28,079 31,364 52,887 58,182 64,547 71,316 77,495 84,000 92,089 100,561 Cash flow statement (JPYmn)
Cash flows from operating activit ies 6,472 6,668 7,031 6,808 9,639 -4,358 21,359 17,234 10,303 11,703 13,568 Cash flows from investing activit ies -2,190 -2,087 -1,966 -3,000 -10,051 7,086 -16,632 -11,365 -3,255 2,233 -2,666 Cash flows from financing activit ies -6,094 -5,255 -4,169 -1,321 -2,722 -2,257 -2,475 -2,594 -2,821 -2,400 -3,264
Financial ratios Total interest-bearing debt - 1,744 111 55 56 15 5 - - 564 225 Net cash 9,173 7,747 10,853 31,963 36,971 28,019 44,980 56,906 57,748 62,866 71,311 ROA (RP-based) 17.1% 20.3% 20.3% 18.1% 15.5% 14.4% 14.2% 13.4% 13.0% 12.8% 12.1% ROE 21.0% 19.9% 18.9% 15.5% 12.5% 12.5% 12.3% 12.0% 12.3% 12.0% 11.0% Equity ratio 47.4% 54.1% 64.2% 62.3% 61.9% 62.6% 62.0% 59.8% 62.1% 64.0% 66.4%
Aeon Delight / 9787 LAST UPDATE: 2018.07.04 Research Coverage Report by Shared Research Inc. | www.sharedresearch.jp
04/77
R Coverage
Recent updates
Highlights On July 4, 2018, Aeon Delight, Co., Ltd announced earnings results for Q1 FY02/19; see the results section for details.
On April 27, 2018, Shared Research updated the report following interviews with the company.
On April 11, 2018, the company announced earnings results for full-year FY02/18.
For previous releases and developments, please refer to the News and topics section
Aeon Delight / 9787 LAST UPDATE: 2018.07.04 Research Coverage Report by Shared Research Inc. | www.sharedresearch.jp
05/77
R Coverage
Trends and outlook
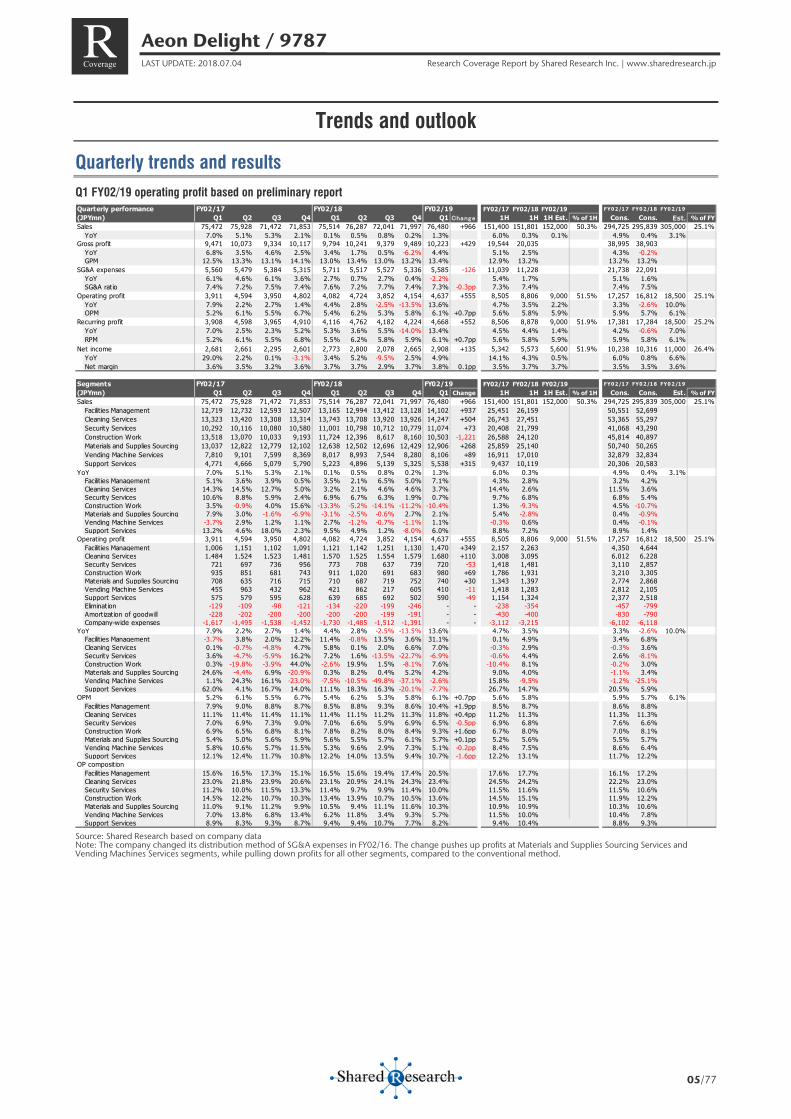
Quarterly trends and results Q1 FY02/19 operating profit based on preliminary report
Source: Shared Research based on company data Note: The company changed its distribution method of SG&A expenses in FY02/16. The change pushes up profits at Materials and Supplies Sourcing Services and Vending Machines Services segments, while pulling down profits for all other segments, compared to the conventional method.
Quarterly performance FY02/17 FY02/18 FY02/19 FY02/17 FY02/18 FY02/19 FY0 2/1 7 FY0 2/1 8 FY0 2/1 9
(JPYmn) Q1 Q2 Q3 Q4 Q1 Q2 Q3 Q4 Q1 Change 1H 1H 1H Est. % of 1H Cons. Cons. Est. % of FYSales 75,472 75,928 71,472 71,853 75,514 76,287 72,041 71,997 76,480 +966 151,400 151,801 152,000 50.3% 294,725 295,839 305,000 25.1%
YoY 7.0% 5.1% 5.3% 2.1% 0.1% 0.5% 0.8% 0.2% 1.3% 6.0% 0.3% 0.1% 4.9% 0.4% 3.1% Gross profit 9,471 10,073 9,334 10,117 9,794 10,241 9,379 9,489 10,223 +429 19,544 20,035 38,995 38,903
YoY 6.8% 3.5% 4.6% 2.5% 3.4% 1.7% 0.5% -6.2% 4.4% 5.1% 2.5% 4.3% -0.2% GPM 12.5% 13.3% 13.1% 14.1% 13.0% 13.4% 13.0% 13.2% 13.4% 12.9% 13.2% 13.2% 13.2%
SG&A expenses 5,560 5,479 5,384 5,315 5,711 5,517 5,527 5,336 5,585 -126 11,039 11,228 21,738 22,091 YoY 6.1% 4.6% 6.1% 3.6% 2.7% 0.7% 2.7% 0.4% -2.2% 5.4% 1.7% 5.1% 1.6% SG&A ratio 7.4% 7.2% 7.5% 7.4% 7.6% 7.2% 7.7% 7.4% 7.3% -0.3pp 7.3% 7.4% 7.4% 7.5%
Operating profit 3,911 4,594 3,950 4,802 4,082 4,724 3,852 4,154 4,637 +555 8,505 8,806 9,000 51.5% 17,257 16,812 18,500 25.1%YoY 7.9% 2.2% 2.7% 1.4% 4.4% 2.8% -2.5% -13.5% 13.6% 4.7% 3.5% 2.2% 3.3% -2.6% 10.0% OPM 5.2% 6.1% 5.5% 6.7% 5.4% 6.2% 5.3% 5.8% 6.1% +0.7pp 5.6% 5.8% 5.9% 5.9% 5.7% 6.1%
Recurring profit 3,908 4,598 3,965 4,910 4,116 4,762 4,182 4,224 4,668 +552 8,506 8,878 9,000 51.9% 17,381 17,284 18,500 25.2%YoY 7.0% 2.5% 2.3% 5.2% 5.3% 3.6% 5.5% -14.0% 13.4% 4.5% 4.4% 1.4% 4.2% -0.6% 7.0% RPM 5.2% 6.1% 5.5% 6.8% 5.5% 6.2% 5.8% 5.9% 6.1% +0.7pp 5.6% 5.8% 5.9% 5.9% 5.8% 6.1%
Net income 2,681 2,661 2,295 2,601 2,773 2,800 2,078 2,665 2,908 +135 5,342 5,573 5,600 51.9% 10,238 10,316 11,000 26.4%YoY 29.0% 2.2% 0.1% -3.1% 3.4% 5.2% -9.5% 2.5% 4.9% 14.1% 4.3% 0.5% 6.0% 0.8% 6.6% Net margin 3.6% 3.5% 3.2% 3.6% 3.7% 3.7% 2.9% 3.7% 3.8% 0.1pp 3.5% 3.7% 3.7% 3.5% 3.5% 3.6%
Segments FY02/17 FY02/18 FY02/19 FY02/17 FY02/18 FY02/19 FY0 2/1 7 FY0 2/1 8 FY0 2/1 9
(JPYmn) Q1 Q2 Q3 Q4 Q1 Q2 Q3 Q4 Q1 Change 1H 1H 1H Est. % of 1H Cons. Cons. Est. % of FYSales 75,472 75,928 71,472 71,853 75,514 76,287 72,041 71,997 76,480 +966 151,400 151,801 152,000 50.3% 294,725 295,839 305,000 25.1%
Facilities Management 12,719 12,732 12,593 12,507 13,165 12,994 13,412 13,128 14,102 +937 25,451 26,159 50,551 52,699 Cleaning Services 13,323 13,420 13,308 13,314 13,743 13,708 13,920 13,926 14,247 +504 26,743 27,451 53,365 55,297 Security Services 10,292 10,116 10,080 10,580 11,001 10,798 10,712 10,779 11,074 +73 20,408 21,799 41,068 43,290 Construction Work 13,518 13,070 10,033 9,193 11,724 12,396 8,617 8,160 10,503 -1,221 26,588 24,120 45,814 40,897 Materials and Supplies Sourcing 13,037 12,822 12,779 12,102 12,638 12,502 12,696 12,429 12,906 +268 25,859 25,140 50,740 50,265 Vending Machine Services 7,810 9,101 7,599 8,369 8,017 8,993 7,544 8,280 8,106 +89 16,911 17,010 32,879 32,834 Support Services 4,771 4,666 5,079 5,790 5,223 4,896 5,139 5,325 5,538 +315 9,437 10,119 20,306 20,583
YoY 7.0% 5.1% 5.3% 2.1% 0.1% 0.5% 0.8% 0.2% 1.3% 6.0% 0.3% 4.9% 0.4% 3.1% Facilities Management 5.1% 3.6% 3.9% 0.5% 3.5% 2.1% 6.5% 5.0% 7.1% 4.3% 2.8% 3.2% 4.2% Cleaning Services 14.3% 14.5% 12.7% 5.0% 3.2% 2.1% 4.6% 4.6% 3.7% 14.4% 2.6% 11.5% 3.6% Security Services 10.6% 8.8% 5.9% 2.4% 6.9% 6.7% 6.3% 1.9% 0.7% 9.7% 6.8% 6.8% 5.4% Construction Work 3.5% -0.9% 4.0% 15.6% -13.3% -5.2% -14.1% -11.2% -10.4% 1.3% -9.3% 4.5% -10.7% Materials and Supplies Sourcing 7.9% 3.0% -1.6% -6.9% -3.1% -2.5% -0.6% 2.7% 2.1% 5.4% -2.8% 0.4% -0.9% Vending Machine Services -3.7% 2.9% 1.2% 1.1% 2.7% -1.2% -0.7% -1.1% 1.1% -0.3% 0.6% 0.4% -0.1% Support Services 13.2% 4.6% 18.0% 2.3% 9.5% 4.9% 1.2% -8.0% 6.0% 8.8% 7.2% 8.9% 1.4%
Operating profit 3,911 4,594 3,950 4,802 4,082 4,724 3,852 4,154 4,637 +555 8,505 8,806 9,000 51.5% 17,257 16,812 18,500 25.1%Facilities Management 1,006 1,151 1,102 1,091 1,121 1,142 1,251 1,130 1,470 +349 2,157 2,263 4,350 4,644 Cleaning Services 1,484 1,524 1,523 1,481 1,570 1,525 1,554 1,579 1,680 +110 3,008 3,095 6,012 6,228 Security Services 721 697 736 956 773 708 637 739 720 -53 1,418 1,481 3,110 2,857 Construction Work 935 851 681 743 911 1,020 691 683 980 +69 1,786 1,931 3,210 3,305 Materials and Supplies Sourcing 708 635 716 715 710 687 719 752 740 +30 1,343 1,397 2,774 2,868 Vending Machine Services 455 963 432 962 421 862 217 605 410 -11 1,418 1,283 2,812 2,105 Support Services 575 579 595 628 639 685 692 502 590 -49 1,154 1,324 2,377 2,518 Elimination -129 -109 -98 -121 -134 -220 -199 -246 - - -238 -354 -457 -799 Amortization of goodwill -228 -202 -200 -200 -200 -200 -199 -191 - - -430 -400 -830 -790 Company-wide expenses -1,617 -1,495 -1,538 -1,452 -1,730 -1,485 -1,512 -1,391 - - -3,112 -3,215 -6,102 -6,118
YoY 7.9% 2.2% 2.7% 1.4% 4.4% 2.8% -2.5% -13.5% 13.6% 4.7% 3.5% 3.3% -2.6% 10.0% Facilities Management -3.7% 3.8% 2.0% 12.2% 11.4% -0.8% 13.5% 3.6% 31.1% 0.1% 4.9% 3.4% 6.8% Cleaning Services 0.1% -0.7% -4.8% 4.7% 5.8% 0.1% 2.0% 6.6% 7.0% -0.3% 2.9% -0.3% 3.6% Security Services 3.6% -4.7% -5.9% 16.2% 7.2% 1.6% -13.5% -22.7% -6.9% -0.6% 4.4% 2.6% -8.1% Construction Work 0.3% -19.8% -3.9% 44.0% -2.6% 19.9% 1.5% -8.1% 7.6% -10.4% 8.1% -0.2% 3.0% Materials and Supplies Sourcing 24.6% -4.4% 6.9% -20.9% 0.3% 8.2% 0.4% 5.2% 4.2% 9.0% 4.0% -1.1% 3.4% Vending Machine Services 1.1% 24.3% 16.1% -23.0% -7.5% -10.5% -49.8% -37.1% -2.6% 15.8% -9.5% -1.2% -25.1% Support Services 62.0% 4.1% 16.7% 14.0% 11.1% 18.3% 16.3% -20.1% -7.7% 26.7% 14.7% 20.5% 5.9%
OPM 5.2% 6.1% 5.5% 6.7% 5.4% 6.2% 5.3% 5.8% 6.1% +0.7pp 5.6% 5.8% 5.9% 5.7% 6.1% Facilities Management 7.9% 9.0% 8.8% 8.7% 8.5% 8.8% 9.3% 8.6% 10.4% +1.9pp 8.5% 8.7% 8.6% 8.8% Cleaning Services 11.1% 11.4% 11.4% 11.1% 11.4% 11.1% 11.2% 11.3% 11.8% +0.4pp 11.2% 11.3% 11.3% 11.3% Security Services 7.0% 6.9% 7.3% 9.0% 7.0% 6.6% 5.9% 6.9% 6.5% -0.5pp 6.9% 6.8% 7.6% 6.6% Construction Work 6.9% 6.5% 6.8% 8.1% 7.8% 8.2% 8.0% 8.4% 9.3% +1.6pp 6.7% 8.0% 7.0% 8.1% Materials and Supplies Sourcing 5.4% 5.0% 5.6% 5.9% 5.6% 5.5% 5.7% 6.1% 5.7% +0.1pp 5.2% 5.6% 5.5% 5.7% Vending Machine Services 5.8% 10.6% 5.7% 11.5% 5.3% 9.6% 2.9% 7.3% 5.1% -0.2pp 8.4% 7.5% 8.6% 6.4% Support Services 12.1% 12.4% 11.7% 10.8% 12.2% 14.0% 13.5% 9.4% 10.7% -1.6pp 12.2% 13.1% 11.7% 12.2%
OP composition Facilities Management 15.6% 16.5% 17.3% 15.1% 16.5% 15.6% 19.4% 17.4% 20.5% 17.6% 17.7% 16.1% 17.2% Cleaning Services 23.0% 21.8% 23.9% 20.6% 23.1% 20.9% 24.1% 24.3% 23.4% 24.5% 24.2% 22.2% 23.0% Security Services 11.2% 10.0% 11.5% 13.3% 11.4% 9.7% 9.9% 11.4% 10.0% 11.5% 11.6% 11.5% 10.6% Construction Work 14.5% 12.2% 10.7% 10.3% 13.4% 13.9% 10.7% 10.5% 13.6% 14.5% 15.1% 11.9% 12.2% Materials and Supplies Sourcing 11.0% 9.1% 11.2% 9.9% 10.5% 9.4% 11.1% 11.6% 10.3% 10.9% 10.9% 10.3% 10.6% Vending Machine Services 7.0% 13.8% 6.8% 13.4% 6.2% 11.8% 3.4% 9.3% 5.7% 11.5% 10.0% 10.4% 7.8% Support Services 8.9% 8.3% 9.3% 8.7% 9.4% 9.4% 10.7% 7.7% 8.2% 9.4% 10.4% 8.8% 9.3%
Aeon Delight / 9787 LAST UPDATE: 2018.07.04 Research Coverage Report by Shared Research Inc. | www.sharedresearch.jp
06/77
R Coverage
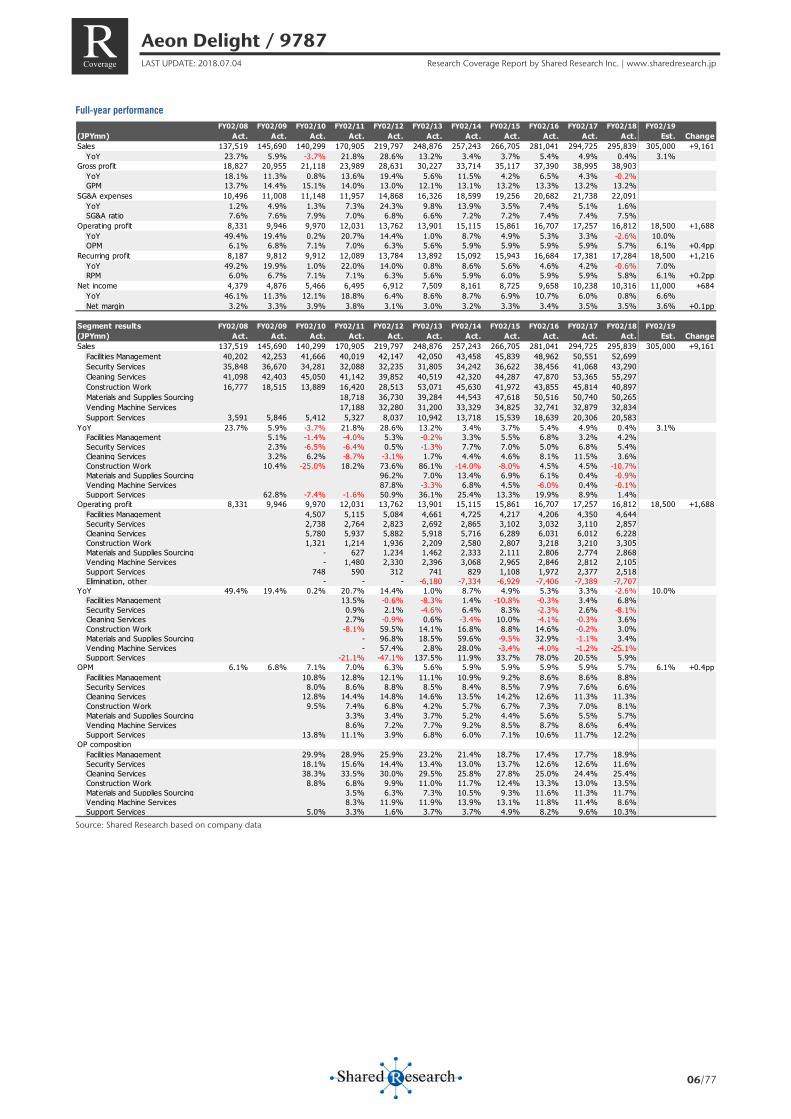
Full-year performance
Source: Shared Research based on company data
FY02/08 FY02/09 FY02/10 FY02/11 FY02/12 FY02/13 FY02/14 FY02/15 FY02/16 FY02/17 FY02/18 FY02/19(JPYmn) Act. Act. Act. Act. Act. Act. Act. Act. Act. Act. Act. Est. ChangeSales 137,519 145,690 140,299 170,905 219,797 248,876 257,243 266,705 281,041 294,725 295,839 305,000 +9,161
YoY 23.7% 5.9% -3.7% 21.8% 28.6% 13.2% 3.4% 3.7% 5.4% 4.9% 0.4% 3.1% Gross profit 18,827 20,955 21,118 23,989 28,631 30,227 33,714 35,117 37,390 38,995 38,903
YoY 18.1% 11.3% 0.8% 13.6% 19.4% 5.6% 11.5% 4.2% 6.5% 4.3% -0.2% GPM 13.7% 14.4% 15.1% 14.0% 13.0% 12.1% 13.1% 13.2% 13.3% 13.2% 13.2%
SG&A expenses 10,496 11,008 11,148 11,957 14,868 16,326 18,599 19,256 20,682 21,738 22,091 YoY 1.2% 4.9% 1.3% 7.3% 24.3% 9.8% 13.9% 3.5% 7.4% 5.1% 1.6% SG&A ratio 7.6% 7.6% 7.9% 7.0% 6.8% 6.6% 7.2% 7.2% 7.4% 7.4% 7.5%
Operating profit 8,331 9,946 9,970 12,031 13,762 13,901 15,115 15,861 16,707 17,257 16,812 18,500 +1,688YoY 49.4% 19.4% 0.2% 20.7% 14.4% 1.0% 8.7% 4.9% 5.3% 3.3% -2.6% 10.0% OPM 6.1% 6.8% 7.1% 7.0% 6.3% 5.6% 5.9% 5.9% 5.9% 5.9% 5.7% 6.1% +0.4pp
Recurring profit 8,187 9,812 9,912 12,089 13,784 13,892 15,092 15,943 16,684 17,381 17,284 18,500 +1,216YoY 49.2% 19.9% 1.0% 22.0% 14.0% 0.8% 8.6% 5.6% 4.6% 4.2% -0.6% 7.0% RPM 6.0% 6.7% 7.1% 7.1% 6.3% 5.6% 5.9% 6.0% 5.9% 5.9% 5.8% 6.1% +0.2pp
Net income 4,379 4,876 5,466 6,495 6,912 7,509 8,161 8,725 9,658 10,238 10,316 11,000 +684YoY 46.1% 11.3% 12.1% 18.8% 6.4% 8.6% 8.7% 6.9% 10.7% 6.0% 0.8% 6.6% Net margin 3.2% 3.3% 3.9% 3.8% 3.1% 3.0% 3.2% 3.3% 3.4% 3.5% 3.5% 3.6% +0.1pp
Segment results FY02/08 FY02/09 FY02/10 FY02/11 FY02/12 FY02/13 FY02/14 FY02/15 FY02/16 FY02/17 FY02/18 FY02/19(JPYmn) Act. Act. Act. Act. Act. Act. Act. Act. Act. Act. Act. Est. ChangeSales 137,519 145,690 140,299 170,905 219,797 248,876 257,243 266,705 281,041 294,725 295,839 305,000 +9,161
Facilit ies Management 40,202 42,253 41,666 40,019 42,147 42,050 43,458 45,839 48,962 50,551 52,699Security Services 35,848 36,670 34,281 32,088 32,235 31,805 34,242 36,622 38,456 41,068 43,290Cleaning Services 41,098 42,403 45,050 41,142 39,852 40,519 42,320 44,287 47,870 53,365 55,297Construction Work 16,777 18,515 13,889 16,420 28,513 53,071 45,630 41,972 43,855 45,814 40,897Materials and Supplies Sourcing 18,718 36,730 39,284 44,543 47,618 50,516 50,740 50,265Vending Machine Services 17,188 32,280 31,200 33,329 34,825 32,741 32,879 32,834Support Services 3,591 5,846 5,412 5,327 8,037 10,942 13,718 15,539 18,639 20,306 20,583
YoY 23.7% 5.9% -3.7% 21.8% 28.6% 13.2% 3.4% 3.7% 5.4% 4.9% 0.4% 3.1%Facilit ies Management 5.1% -1.4% -4.0% 5.3% -0.2% 3.3% 5.5% 6.8% 3.2% 4.2%Security Services 2.3% -6.5% -6.4% 0.5% -1.3% 7.7% 7.0% 5.0% 6.8% 5.4%Cleaning Services 3.2% 6.2% -8.7% -3.1% 1.7% 4.4% 4.6% 8.1% 11.5% 3.6%Construction Work 10.4% -25.0% 18.2% 73.6% 86.1% -14.0% -8.0% 4.5% 4.5% -10.7%Materials and Supplies Sourcing 96.2% 7.0% 13.4% 6.9% 6.1% 0.4% -0.9%Vending Machine Services 87.8% -3.3% 6.8% 4.5% -6.0% 0.4% -0.1%Support Services 62.8% -7.4% -1.6% 50.9% 36.1% 25.4% 13.3% 19.9% 8.9% 1.4%
Operating profit 8,331 9,946 9,970 12,031 13,762 13,901 15,115 15,861 16,707 17,257 16,812 18,500 +1,688Facilit ies Management 4,507 5,115 5,084 4,661 4,725 4,217 4,206 4,350 4,644Security Services 2,738 2,764 2,823 2,692 2,865 3,102 3,032 3,110 2,857Cleaning Services 5,780 5,937 5,882 5,918 5,716 6,289 6,031 6,012 6,228Construction Work 1,321 1,214 1,936 2,209 2,580 2,807 3,218 3,210 3,305Materials and Supplies Sourcing - 627 1,234 1,462 2,333 2,111 2,806 2,774 2,868Vending Machine Services - 1,480 2,330 2,396 3,068 2,965 2,846 2,812 2,105Support Services 748 590 312 741 829 1,108 1,972 2,377 2,518Elimination, other - - - -6,180 -7,334 -6,929 -7,406 -7,389 -7,707
YoY 49.4% 19.4% 0.2% 20.7% 14.4% 1.0% 8.7% 4.9% 5.3% 3.3% -2.6% 10.0%Facilit ies Management 13.5% -0.6% -8.3% 1.4% -10.8% -0.3% 3.4% 6.8%Security Services 0.9% 2.1% -4.6% 6.4% 8.3% -2.3% 2.6% -8.1%Cleaning Services 2.7% -0.9% 0.6% -3.4% 10.0% -4.1% -0.3% 3.6%Construction Work -8.1% 59.5% 14.1% 16.8% 8.8% 14.6% -0.2% 3.0%Materials and Supplies Sourcing - 96.8% 18.5% 59.6% -9.5% 32.9% -1.1% 3.4%Vending Machine Services - 57.4% 2.8% 28.0% -3.4% -4.0% -1.2% -25.1%Support Services -21.1% -47.1% 137.5% 11.9% 33.7% 78.0% 20.5% 5.9%
OPM 6.1% 6.8% 7.1% 7.0% 6.3% 5.6% 5.9% 5.9% 5.9% 5.9% 5.7% 6.1% +0.4ppFacilit ies Management 10.8% 12.8% 12.1% 11.1% 10.9% 9.2% 8.6% 8.6% 8.8%Security Services 8.0% 8.6% 8.8% 8.5% 8.4% 8.5% 7.9% 7.6% 6.6%Cleaning Services 12.8% 14.4% 14.8% 14.6% 13.5% 14.2% 12.6% 11.3% 11.3%Construction Work 9.5% 7.4% 6.8% 4.2% 5.7% 6.7% 7.3% 7.0% 8.1%Materials and Supplies Sourcing 3.3% 3.4% 3.7% 5.2% 4.4% 5.6% 5.5% 5.7%Vending Machine Services 8.6% 7.2% 7.7% 9.2% 8.5% 8.7% 8.6% 6.4%Support Services 13.8% 11.1% 3.9% 6.8% 6.0% 7.1% 10.6% 11.7% 12.2%
OP composition Facilit ies Management 29.9% 28.9% 25.9% 23.2% 21.4% 18.7% 17.4% 17.7% 18.9%Security Services 18.1% 15.6% 14.4% 13.4% 13.0% 13.7% 12.6% 12.6% 11.6%Cleaning Services 38.3% 33.5% 30.0% 29.5% 25.8% 27.8% 25.0% 24.4% 25.4%Construction Work 8.8% 6.8% 9.9% 11.0% 11.7% 12.4% 13.3% 13.0% 13.5%Materials and Supplies Sourcing 3.5% 6.3% 7.3% 10.5% 9.3% 11.6% 11.3% 11.7%Vending Machine Services 8.3% 11.9% 11.9% 13.9% 13.1% 11.8% 11.4% 8.6%Support Services 5.0% 3.3% 1.6% 3.7% 3.7% 4.9% 8.2% 9.6% 10.3%
Aeon Delight / 9787 LAST UPDATE: 2018.07.04 Research Coverage Report by Shared Research Inc. | www.sharedresearch.jp
07/77
R Coverage
Q1 FY02/19 results (announced July 4, 2018)
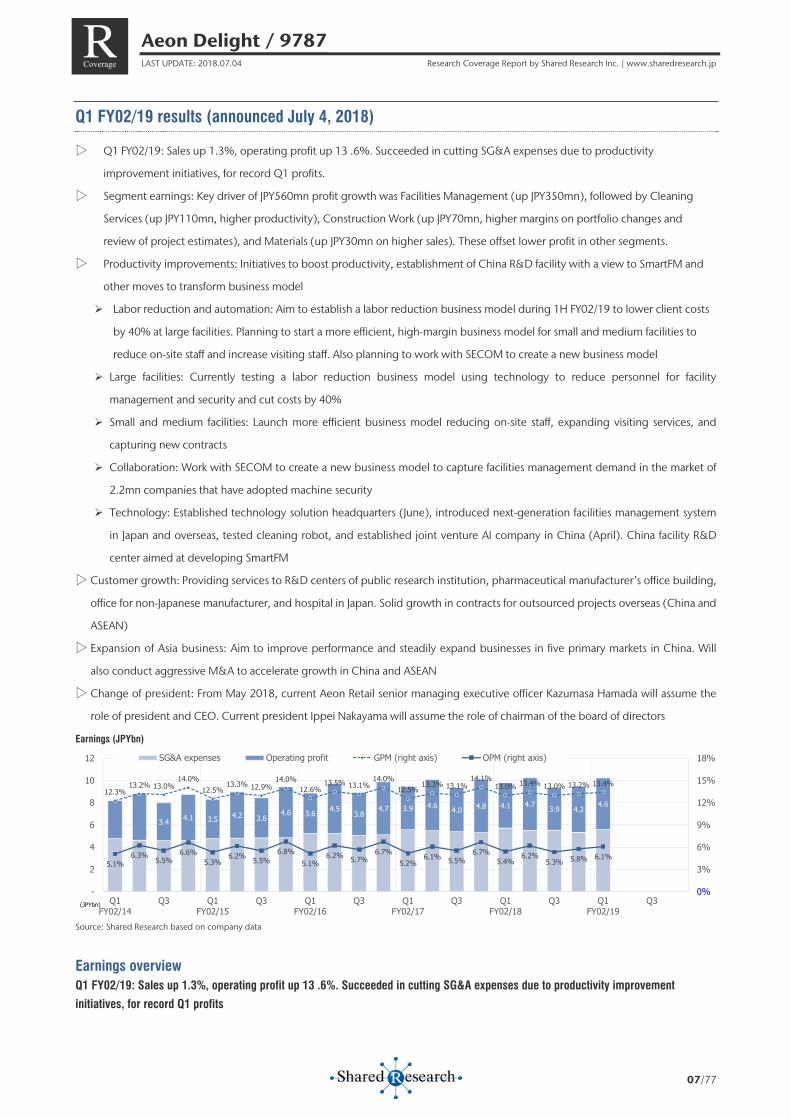
▷ Q1 FY02/19: Sales up 1.3%, operating profit up 13 .6%. Succeeded in cutting SG&A expenses due to productivity
improvement initiatives, for record Q1 profits.
▷ Segment earnings: Key driver of JPY560mn profit growth was Facilities Management (up JPY350mn), followed by Cleaning
Services (up JPY110mn, higher productivity), Construction Work (up JPY70mn, higher margins on portfolio changes and
review of project estimates), and Materials (up JPY30mn on higher sales). These offset lower profit in other segments.
▷ Productivity improvements: Initiatives to boost productivity, establishment of China R&D facility with a view to SmartFM and
other moves to transform business model
Labor reduction and automation: Aim to establish a labor reduction business model during 1H FY02/19 to lower client costs
by 40% at large facilities. Planning to start a more efficient, high-margin business model for small and medium facilities to
reduce on-site staff and increase visiting staff. Also planning to work with SECOM to create a new business model
Large facilities: Currently testing a labor reduction business model using technology to reduce personnel for facility
management and security and cut costs by 40%
Small and medium facilities: Launch more efficient business model reducing on-site staff, expanding visiting services, and
capturing new contracts
Collaboration: Work with SECOM to create a new business model to capture facilities management demand in the market of
2.2mn companies that have adopted machine security
Technology: Established technology solution headquarters (June), introduced next-generation facilities management system
in Japan and overseas, tested cleaning robot, and established joint venture AI company in China (April). China facility R&D
center aimed at developing SmartFM
▷ Customer growth: Providing services to R&D centers of public research institution, pharmaceutical manufacturer’s office building,
office for non-Japanese manufacturer, and hospital in Japan. Solid growth in contracts for outsourced projects overseas (China and
ASEAN)
▷ Expansion of Asia business: Aim to improve performance and steadily expand businesses in five primary markets in China. Will
also conduct aggressive M&A to accelerate growth in China and ASEAN
▷ Change of president: From May 2018, current Aeon Retail senior managing executive officer Kazumasa Hamada will assume the
role of president and CEO. Current president Ippei Nakayama will assume the role of chairman of the board of directors
Earnings (JPYbn)
Source: Shared Research based on company data
Earnings overview Q1 FY02/19: Sales up 1.3%, operating profit up 13 .6%. Succeeded in cutting SG&A expenses due to productivity improvement
initiatives, for record Q1 profits
3.4 4.1 3.5 4.2 3.6 4.6 3.6 4.5
3.8 4.7 3.9 4.6 4.0 4.8 4.1 4.7 3.9 4.2
4.6 12.3%
13.2% 13.0%14.0%
12.5%13.3% 12.9%
14.0%12.6%
13.5% 13.1%14.0%
12.5% 13.3% 13.1%14.1%
13.0% 13.4% 13.0% 13.2% 13.4%
5.1%6.3% 5.5%
6.6%5.3%
6.2% 5.5%6.8%
5.1%6.2% 5.7%
6.7%5.2%
6.1% 5.5%6.7%
5.4%6.2%
5.3% 5.8% 6.1%
0%
3%
6%
9%
12%
15%
18%
-
2
4
6
8
10
12
Q1FY02/14
Q3 Q1FY02/15
Q3 Q1FY02/16
Q3 Q1FY02/17
Q3 Q1FY02/18
Q3 Q1FY02/19
Q3
SG&A expenses Operating profit GPM (right axis) OPM (right axis)
(JPYbn)
Aeon Delight / 9787 LAST UPDATE: 2018.07.04 Research Coverage Report by Shared Research Inc. | www.sharedresearch.jp
08/77
R Coverage
In Q1 FY02/19, Aeon Delight reported sales of JPY76.5bn (+ 1.3%, +JPY1.0bn YoY) and operating profit of JPY4.6bn (13.6%, +
JPY600mn). In Japan the labor shortage due to the declining working-age population and aging of society is a social issue, and
labor shortages are also becoming apparent in China. The company is taking a number of initiatives to improve productivity in
Japan and overseas. It has also continued to strengthen activities to market IFM to fulfill its customers’ outsourcing needs.
The company has established a joint venture with leading IT company DeepBlue Technology (Shanghai) Co., Ltd., which has
strengths in basic research into artificial intelligence and applications development in China. This will become an R&D center for
the company, and aims to develop SmartFM by fusing expertise Aeon Delight has developed in Japan in facilities management
with advanced technologies in AI, IoT, and robotics. Aeon Delight says that SmartFM would improve convenience for facilities
users and yield significant gains in productivity (cost cuts for customers and the company itself).
Progress on high priority initiatives under medium-term business plan
Under its medium-term business plan, the impact of personnel shortages is becoming increasingly evident and the introduction
of labor-saving measures (to increase efficiency and create a high-margin business model) is becoming an increasingly large and
pressing problem. As the biggest challenge for Aeon Delight in FY02/19 and subsequent years will be overcoming manpower
shortages, it is essential that the Facilities Management business move to a business model that requires either fewer workers or
full automation as soon as possible.
In Japan, during the course of 1H the company is looking to establish a labor-saving model for large commercial facilities that will
reduce the cost to the client by 40% and reduce its own on-site staffing costs by 50%, and begin putting that model to use in
several facilities during 2H. For the visiting services for small and medium-sized facilities, the company is looking at working with
SECOM to create a new business model. While reducing on-site staffing requirements on the one hand, Aeon Delight is looking
to create a more efficient and higher-margin business model by expanding its network of offices that can provide visiting facilities
management services while at the same time holding down personnel costs and increasing its unit billing rate.
In China, amid the country's rapid move to digital technology, the company plans to establish a labor-saving/fully automated
business model ("smart facilities management") and find new ways to add value that make the facilities under management more
appealing.
The company has initiatives to boost productivity in the following areas. Large facilities in Japan: trial runs of remote monitoring
and automatic control for facilities management using sensing technologies. Small and medium-sized facilities in Japan:
labor-saving initiatives in 30 staffed locations through process streamlining and standardization, enabling it to redeploy personnel
to visiting locations and expand sales opportunities. Collaborations: the company is collaborating with SECOM to develop a new
business model that supports regional communities.
The company is also growing business in Asia. China: focusing marketing activities on its priority targets of medium- and
high-end facilities, winning new contracts for overall management of large commercial and transport infrastructure facilities.
ASEAN: strengthened sales organization in Vietnam, expanding services offered to local companies that are rolling out chains and
winning contracts for factory cleaning services from Japanese corporations.
On the technology utilization front, the company has set up an R&D center in Shanghai, launching its efforts to develop SmartFM,
as discussed previously.
For FY02/19, the company is forecasting sales of JPY305.0bn (+3.5% or +JPY9.2bn YoY), operating profit of JPY18.5bn (+10.0% or
+JPY1.7bn), and a net income of JPY11.0bn (+6.6% or +JPY700mn). This works out to an operating profit margin of 6.1% and net
income margin of 3.6%. The projected JPY1.7bn increase in operating profit reflects expected growth in gross profit of JPY3.0bn
versus a JPY1.2bn increase in SG&A expenses. The projected increase in gross profit is based on 1) a JPY800mn increase in gross
profit from new IFM clients, 2) JPY300mn from the Construction Work segment, 3) JPY600mn from business expansion in Asia, 4)

Aeon Delight / 9787 LAST UPDATE: 2018.07.04 Research Coverage Report by Shared Research Inc. | www.sharedresearch.jp
09/77
R Coverage
JPY700mn from labor-saving measures and an accompanying improvement in margins, and 5) JPY600mn from growth at
domestic subsidiaries.
Segment overview Operating profit by segment (JPYbn)
Source: Shared Research based on company data
Facilities Management (operating profit JPY1.5bn, +JPY350mn YoY): In addition to new contracts, the company won
increased orders for scheduled fire safety equipment testing and emergency generator load testing to support customer
compliance efforts, as well as associated fault repairs.
Security Services (JPY720mn, -JPY50mn): Aeon Delight conducted ongoing initiatives to reform workstyles starting with
improving the workplace environment to facilitate recruitment, and made progress on systematizing services such as
building access control and security patrols, but profit was impacted by higher outsourcing costs.
Cleaning Services (JPY1.7bn, +JPY110mn): In addition to new contracts, the company made further progress on the
development and sale of environmentally friendly materials, and ongoing efforts to reduce labor and improve productivity
drove profit growth.
Construction Work (JPY980mn, +JPY70mn): The company became more aggressive in marketing renovation work to
shopping centers and malls accompanying tenant turnover, and thoroughly reviewed estimates for individual projects to
boost margins. Portfolio changes and improved margins enabled profit growth despite lower sales.
Materials and Supplies Sourcing Services (JPY740mn, +JPY30mn): More contracts to provide Aeon private brand packaging
materials, and trial installations of inventory management systems to support customers’ cost-cutting efforts and strengthen
relationships.
Vending Machine Services (JPY410mn, -JPY10mn): More terminals handling WAON electronic money and more digital
signage, but profit down as company in process of altering revenue model.
Support Services (JPY590mn, -JPY50mn): Consolidated subsidiaries such as Kajitaku that provide housework and small
business support services contributed to sales growth.
1.2 1.3 1.2 1.1 1.0 1.1 1.1 1.0 1.0 1.1 1.1 1.0 1.0 1.2 1.1 1.1 1.1 1.1 1.3 1.1 1.5
1.4 1.4 1.4 1.5 1.5 1.6 1.6 1.7 1.5 1.5 1.6 1.4 1.5 1.5 1.5 1.5 1.6 1.5 1.6 1.61.7
0.6 0.7 0.8 0.8 0.7 0.7 0.8 0.9 0.7 0.7 0.8 0.8 0.7 0.7 0.7 1.0 0.8 0.7 0.6 0.70.70.9 0.8 0.5 0.5 0.7 0.8 0.7 0.6 0.9 1.1 0.7
0.5 0.9 0.9 0.7 0.7 0.9 1.0 0.7 0.71.00.2 0.4 0.4 0.2 0.4 0.4 0.2 0.4 0.4
0.6 0.50.6
0.6 0.6 0.6 0.6 0.6 0.7 0.7 0.5
0.60.6
0.60.5 0.6 0.5 0.5 0.4
0.7 0.60.7
0.7 0.90.7 0.6 0.7 0.7 0.7 0.7 0.7 0.8
0.7
0.50.8
0.41.3 0.6
0.90.5
1.00.5
0.80.4 1.2 0.5 1.0
0.41.0 0.4 0.9
0.2 0.60.4
-1.9 -1.8 -1.8 -1.8 -1.8 -1.8 -1.7 -1.8 -1.9 -1.9 -1.9 -1.7 -2.0 -1.8 -1.8 -1.8 -2.1 -1.9 -1.9 -1.8 -2.0
-2-101234567
Q1FY02/14
Q1FY02/15
Q1FY02/16
Q1FY02/17
Q1FY02/18
Q1FY02/19
Facilities Management Cleaning Services Security Services Construction Work Support Services Materials and Supplies Sourcing Vending Machine Services Eliminations(JPYbn)
Aeon Delight / 9787 LAST UPDATE: 2018.07.04 Research Coverage Report by Shared Research Inc. | www.sharedresearch.jp
10/77
R Coverage
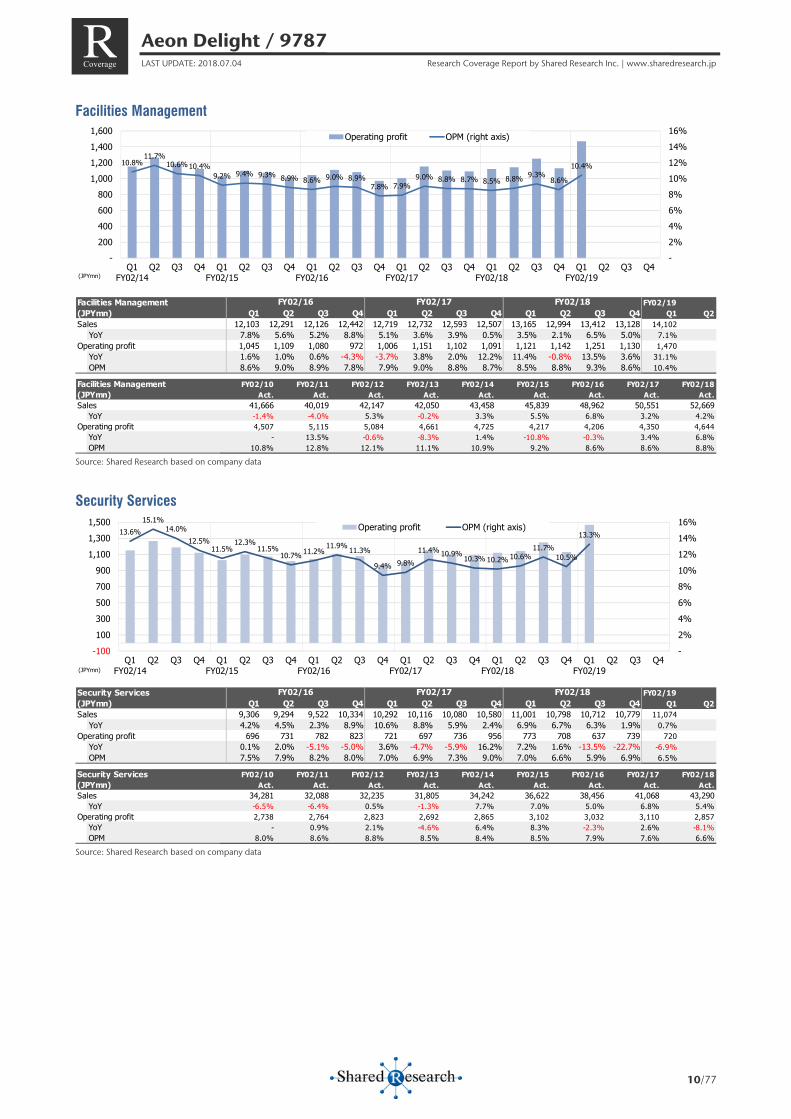
Facilities Management
Source: Shared Research based on company data
Security Services
Source: Shared Research based on company data
10.8%11.7%
10.6%10.4%9.2% 9.4% 9.3% 8.9% 8.6% 9.0% 8.9%
7.8% 7.9%9.0% 8.8% 8.7% 8.5% 8.8% 9.3%
8.6%
10.4%
-2%4%6%8%10%12%14%16%
-200400600800
1,0001,2001,4001,600
Q1FY02/14
Q2 Q3 Q4 Q1FY02/15
Q2 Q3 Q4 Q1FY02/16
Q2 Q3 Q4 Q1FY02/17
Q2 Q3 Q4 Q1FY02/18
Q2 Q3 Q4 Q1FY02/19
Q2 Q3 Q4
Operating profit OPM (right axis)
(JPYmn)
Facilities Management FY02/19(JPYmn) Q1 Q2 Q3 Q4 Q1 Q2 Q3 Q4 Q1 Q2 Q3 Q4 Q1 Q2Sales 12,103 12,291 12,126 12,442 12,719 12,732 12,593 12,507 13,165 12,994 13,412 13,128 14,102
YoY 7.8% 5.6% 5.2% 8.8% 5.1% 3.6% 3.9% 0.5% 3.5% 2.1% 6.5% 5.0% 7.1% Operating profit 1,045 1,109 1,080 972 1,006 1,151 1,102 1,091 1,121 1,142 1,251 1,130 1,470
YoY 1.6% 1.0% 0.6% -4.3% -3.7% 3.8% 2.0% 12.2% 11.4% -0.8% 13.5% 3.6% 31.1% OPM 8.6% 9.0% 8.9% 7.8% 7.9% 9.0% 8.8% 8.7% 8.5% 8.8% 9.3% 8.6% 10.4%
FY02/18FY02/17FY02/16
Facilities Management FY02/10 FY02/11 FY02/12 FY02/13 FY02/14 FY02/15 FY02/16 FY02/17 FY02/18(JPYmn) Act. Act. Act. Act. Act. Act. Act. Act. Act.Sales 41,666 40,019 42,147 42,050 43,458 45,839 48,962 50,551 52,669
YoY -1.4% -4.0% 5.3% -0.2% 3.3% 5.5% 6.8% 3.2% 4.2%Operating profit 4,507 5,115 5,084 4,661 4,725 4,217 4,206 4,350 4,644
YoY - 13.5% -0.6% -8.3% 1.4% -10.8% -0.3% 3.4% 6.8%OPM 10.8% 12.8% 12.1% 11.1% 10.9% 9.2% 8.6% 8.6% 8.8%
13.6%15.1%
14.0%12.5%
11.5%12.3%
11.5%10.7% 11.2%
11.9% 11.3%
9.4% 9.8%11.4% 10.9% 10.3% 10.2% 10.6%
11.7%10.5%
13.3%
-2%4%6%8%10%12%14%16%
-100100300500700900
1,1001,3001,500
Q1FY02/14
Q2 Q3 Q4 Q1FY02/15
Q2 Q3 Q4 Q1FY02/16
Q2 Q3 Q4 Q1FY02/17
Q2 Q3 Q4 Q1FY02/18
Q2 Q3 Q4 Q1FY02/19
Q2 Q3 Q4
Operating profit OPM (right axis)
(JPYmn)
Security Services FY02/19(JPYmn) Q1 Q2 Q3 Q4 Q1 Q2 Q3 Q4 Q1 Q2 Q3 Q4 Q1 Q2Sales 9,306 9,294 9,522 10,334 10,292 10,116 10,080 10,580 11,001 10,798 10,712 10,779 11,074
YoY 4.2% 4.5% 2.3% 8.9% 10.6% 8.8% 5.9% 2.4% 6.9% 6.7% 6.3% 1.9% 0.7% Operating profit 696 731 782 823 721 697 736 956 773 708 637 739 720
YoY 0.1% 2.0% -5.1% -5.0% 3.6% -4.7% -5.9% 16.2% 7.2% 1.6% -13.5% -22.7% -6.9% OPM 7.5% 7.9% 8.2% 8.0% 7.0% 6.9% 7.3% 9.0% 7.0% 6.6% 5.9% 6.9% 6.5%
FY02/18FY02/17FY02/16
Security Services FY02/10 FY02/11 FY02/12 FY02/13 FY02/14 FY02/15 FY02/16 FY02/17 FY02/18(JPYmn) Act. Act. Act. Act. Act. Act. Act. Act. Act.Sales 34,281 32,088 32,235 31,805 34,242 36,622 38,456 41,068 43,290
YoY -6.5% -6.4% 0.5% -1.3% 7.7% 7.0% 5.0% 6.8% 5.4%Operating profit 2,738 2,764 2,823 2,692 2,865 3,102 3,032 3,110 2,857
YoY - 0.9% 2.1% -4.6% 6.4% 8.3% -2.3% 2.6% -8.1%OPM 8.0% 8.6% 8.8% 8.5% 8.4% 8.5% 7.9% 7.6% 6.6%
Aeon Delight / 9787 LAST UPDATE: 2018.07.04 Research Coverage Report by Shared Research Inc. | www.sharedresearch.jp
11/77
R Coverage
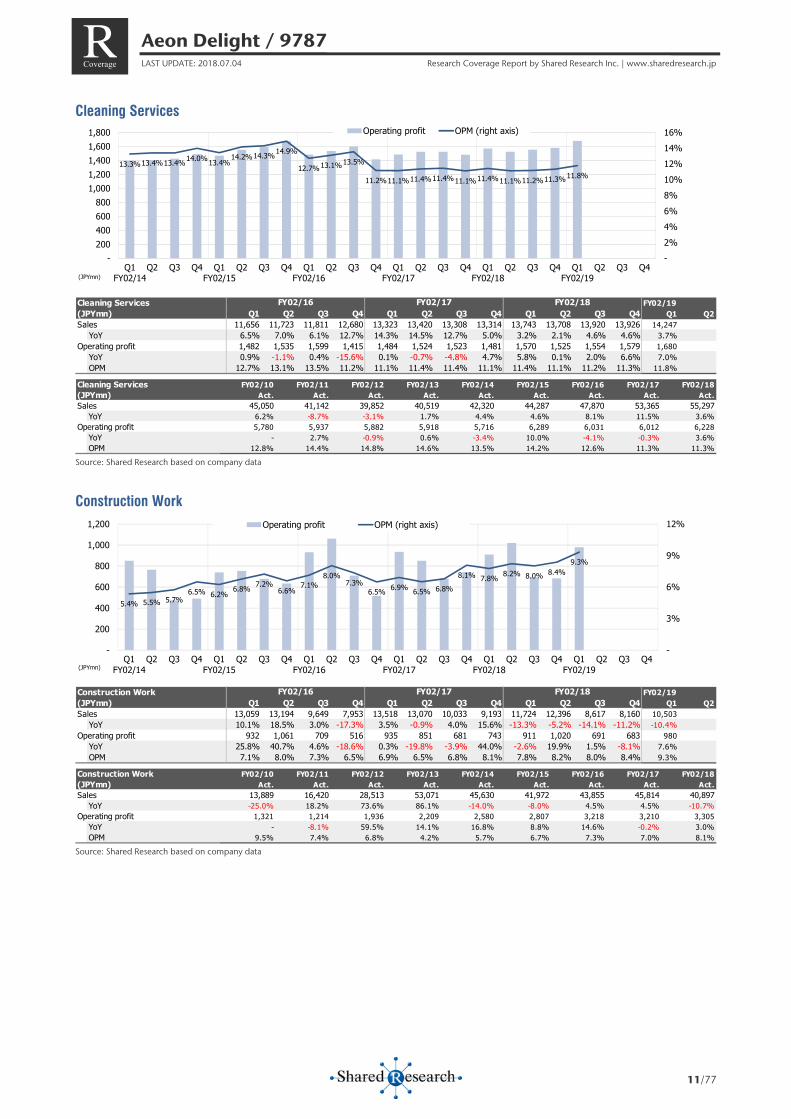
Cleaning Services
Source: Shared Research based on company data
Construction Work
Source: Shared Research based on company data
13.3%13.4%13.4%14.0%13.4%14.2%14.3%14.9%
12.7%13.1%13.5%
11.2%11.1%11.4%11.4%11.1%11.4%11.1%11.2%11.3%11.8%
-2%4%6%8%10%12%14%16%
-200400600800
1,0001,2001,4001,6001,800
Q1FY02/14
Q2 Q3 Q4 Q1FY02/15
Q2 Q3 Q4 Q1FY02/16
Q2 Q3 Q4 Q1FY02/17
Q2 Q3 Q4 Q1FY02/18
Q2 Q3 Q4 Q1FY02/19
Q2 Q3 Q4
Operating profit OPM (right axis)
(JPYmn)
Cleaning Services FY02/19(JPYmn) Q1 Q2 Q3 Q4 Q1 Q2 Q3 Q4 Q1 Q2 Q3 Q4 Q1 Q2Sales 11,656 11,723 11,811 12,680 13,323 13,420 13,308 13,314 13,743 13,708 13,920 13,926 14,247
YoY 6.5% 7.0% 6.1% 12.7% 14.3% 14.5% 12.7% 5.0% 3.2% 2.1% 4.6% 4.6% 3.7% Operating profit 1,482 1,535 1,599 1,415 1,484 1,524 1,523 1,481 1,570 1,525 1,554 1,579 1,680
YoY 0.9% -1.1% 0.4% -15.6% 0.1% -0.7% -4.8% 4.7% 5.8% 0.1% 2.0% 6.6% 7.0% OPM 12.7% 13.1% 13.5% 11.2% 11.1% 11.4% 11.4% 11.1% 11.4% 11.1% 11.2% 11.3% 11.8%
FY02/18FY02/17FY02/16
Cleaning Services FY02/10 FY02/11 FY02/12 FY02/13 FY02/14 FY02/15 FY02/16 FY02/17 FY02/18(JPYmn) Act. Act. Act. Act. Act. Act. Act. Act. Act.Sales 45,050 41,142 39,852 40,519 42,320 44,287 47,870 53,365 55,297
YoY 6.2% -8.7% -3.1% 1.7% 4.4% 4.6% 8.1% 11.5% 3.6%Operating profit 5,780 5,937 5,882 5,918 5,716 6,289 6,031 6,012 6,228
YoY - 2.7% -0.9% 0.6% -3.4% 10.0% -4.1% -0.3% 3.6%OPM 12.8% 14.4% 14.8% 14.6% 13.5% 14.2% 12.6% 11.3% 11.3%
5.4% 5.5% 5.7%6.5% 6.2%
6.8% 7.2%6.6%
7.1%8.0%
7.3%6.5% 6.9% 6.5% 6.8%
8.1% 7.8% 8.2% 8.0% 8.4%9.3%
-
3%
6%
9%
12%
-
200
400
600
800
1,000
1,200
Q1FY02/14
Q2 Q3 Q4 Q1FY02/15
Q2 Q3 Q4 Q1FY02/16
Q2 Q3 Q4 Q1FY02/17
Q2 Q3 Q4 Q1FY02/18
Q2 Q3 Q4 Q1FY02/19
Q2 Q3 Q4
Operating profit OPM (right axis)
(JPYmn)
Construction Work FY02/19(JPYmn) Q1 Q2 Q3 Q4 Q1 Q2 Q3 Q4 Q1 Q2 Q3 Q4 Q1 Q2Sales 13,059 13,194 9,649 7,953 13,518 13,070 10,033 9,193 11,724 12,396 8,617 8,160 10,503
YoY 10.1% 18.5% 3.0% -17.3% 3.5% -0.9% 4.0% 15.6% -13.3% -5.2% -14.1% -11.2% -10.4% Operating profit 932 1,061 709 516 935 851 681 743 911 1,020 691 683 980
YoY 25.8% 40.7% 4.6% -18.6% 0.3% -19.8% -3.9% 44.0% -2.6% 19.9% 1.5% -8.1% 7.6% OPM 7.1% 8.0% 7.3% 6.5% 6.9% 6.5% 6.8% 8.1% 7.8% 8.2% 8.0% 8.4% 9.3%
FY02/18FY02/17FY02/16
Construction Work FY02/10 FY02/11 FY02/12 FY02/13 FY02/14 FY02/15 FY02/16 FY02/17 FY02/18(JPYmn) Act. Act. Act. Act. Act. Act. Act. Act. Act.Sales 13,889 16,420 28,513 53,071 45,630 41,972 43,855 45,814 40,897
YoY -25.0% 18.2% 73.6% 86.1% -14.0% -8.0% 4.5% 4.5% -10.7%Operating profit 1,321 1,214 1,936 2,209 2,580 2,807 3,218 3,210 3,305
YoY - -8.1% 59.5% 14.1% 16.8% 8.8% 14.6% -0.2% 3.0%OPM 9.5% 7.4% 6.8% 4.2% 5.7% 6.7% 7.3% 7.0% 8.1%
Aeon Delight / 9787 LAST UPDATE: 2018.07.04 Research Coverage Report by Shared Research Inc. | www.sharedresearch.jp
12/77
R Coverage
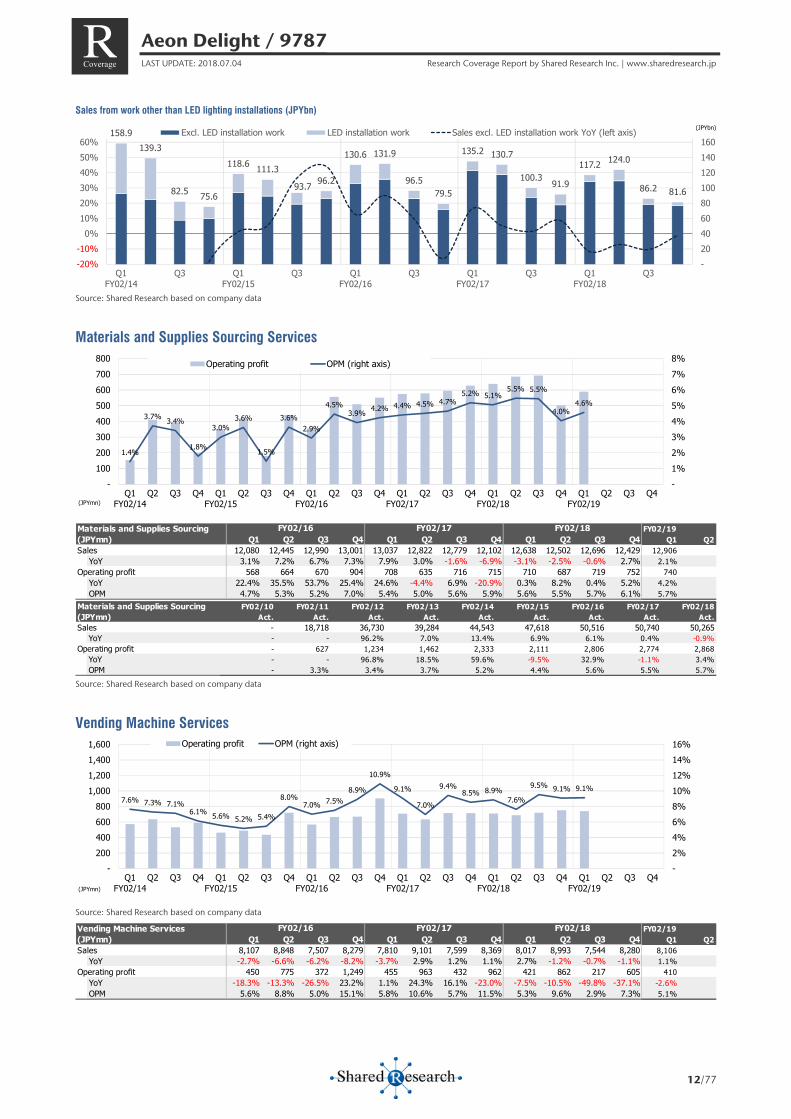
Sales from work other than LED lighting installations (JPYbn)
Source: Shared Research based on company data
Materials and Supplies Sourcing Services
Source: Shared Research based on company data
Vending Machine Services
Source: Shared Research based on company data
158.9139.3
82.5 75.6
118.6 111.3
93.7 96.2
130.6 131.9
96.579.5
135.2 130.7
100.3 91.9
117.2 124.0
86.2 81.6
-20406080100120140160
-20%-10%
0%10%20%30%40%50%60%
Q1FY02/14
Q3 Q1FY02/15
Q3 Q1FY02/16
Q3 Q1FY02/17
Q3 Q1FY02/18
Q3
Excl. LED installation work LED installation work Sales excl. LED installation work YoY (left axis) (JPYbn)
1.4%
3.7% 3.4%
1.8%
3.0%3.6%
1.5%
3.6%2.9%
4.5%3.9% 4.2% 4.4% 4.5% 4.7%
5.2% 5.1%5.5% 5.5%
4.0%4.6%
-1%2%3%4%5%6%7%8%
-100200300400500600700800
Q1FY02/14
Q2 Q3 Q4 Q1FY02/15
Q2 Q3 Q4 Q1FY02/16
Q2 Q3 Q4 Q1FY02/17
Q2 Q3 Q4 Q1FY02/18
Q2 Q3 Q4 Q1FY02/19
Q2 Q3 Q4
Operating profit OPM (right axis)
(JPYmn)
Materials and Supplies Sourcing FY02/19(JPYmn) Q1 Q2 Q3 Q4 Q1 Q2 Q3 Q4 Q1 Q2 Q3 Q4 Q1 Q2Sales 12,080 12,445 12,990 13,001 13,037 12,822 12,779 12,102 12,638 12,502 12,696 12,429 12,906
YoY 3.1% 7.2% 6.7% 7.3% 7.9% 3.0% -1.6% -6.9% -3.1% -2.5% -0.6% 2.7% 2.1% Operating profit 568 664 670 904 708 635 716 715 710 687 719 752 740
YoY 22.4% 35.5% 53.7% 25.4% 24.6% -4.4% 6.9% -20.9% 0.3% 8.2% 0.4% 5.2% 4.2% OPM 4.7% 5.3% 5.2% 7.0% 5.4% 5.0% 5.6% 5.9% 5.6% 5.5% 5.7% 6.1% 5.7%
FY02/18FY02/17FY02/16
Materials and Supplies Sourcing FY02/10 FY02/11 FY02/12 FY02/13 FY02/14 FY02/15 FY02/16 FY02/17 FY02/18(JPYmn) Act. Act. Act. Act. Act. Act. Act. Act. Act.Sales - 18,718 36,730 39,284 44,543 47,618 50,516 50,740 50,265
YoY - - 96.2% 7.0% 13.4% 6.9% 6.1% 0.4% -0.9%Operating profit - 627 1,234 1,462 2,333 2,111 2,806 2,774 2,868
YoY - - 96.8% 18.5% 59.6% -9.5% 32.9% -1.1% 3.4%OPM - 3.3% 3.4% 3.7% 5.2% 4.4% 5.6% 5.5% 5.7%
7.6% 7.3% 7.1%6.1% 5.6% 5.2% 5.4%
8.0%7.0% 7.5%
8.9%
10.9%
9.1%
7.0%
9.4%8.5% 8.9%
7.6%
9.5% 9.1% 9.1%
-2%4%6%8%10%12%14%16%
-200400600800
1,0001,2001,4001,600
Q1FY02/14
Q2 Q3 Q4 Q1FY02/15
Q2 Q3 Q4 Q1FY02/16
Q2 Q3 Q4 Q1FY02/17
Q2 Q3 Q4 Q1FY02/18
Q2 Q3 Q4 Q1FY02/19
Q2 Q3 Q4
Operating profit OPM (right axis)
(JPYmn)
Vending Machine Services FY02/19(JPYmn) Q1 Q2 Q3 Q4 Q1 Q2 Q3 Q4 Q1 Q2 Q3 Q4 Q1 Q2Sales 8,107 8,848 7,507 8,279 7,810 9,101 7,599 8,369 8,017 8,993 7,544 8,280 8,106
YoY -2.7% -6.6% -6.2% -8.2% -3.7% 2.9% 1.2% 1.1% 2.7% -1.2% -0.7% -1.1% 1.1% Operating profit 450 775 372 1,249 455 963 432 962 421 862 217 605 410
YoY -18.3% -13.3% -26.5% 23.2% 1.1% 24.3% 16.1% -23.0% -7.5% -10.5% -49.8% -37.1% -2.6% OPM 5.6% 8.8% 5.0% 15.1% 5.8% 10.6% 5.7% 11.5% 5.3% 9.6% 2.9% 7.3% 5.1%
FY02/18FY02/17FY02/16
Aeon Delight / 9787 LAST UPDATE: 2018.07.04 Research Coverage Report by Shared Research Inc. | www.sharedresearch.jp
13/77
R Coverage
Source: Shared Research based on company data
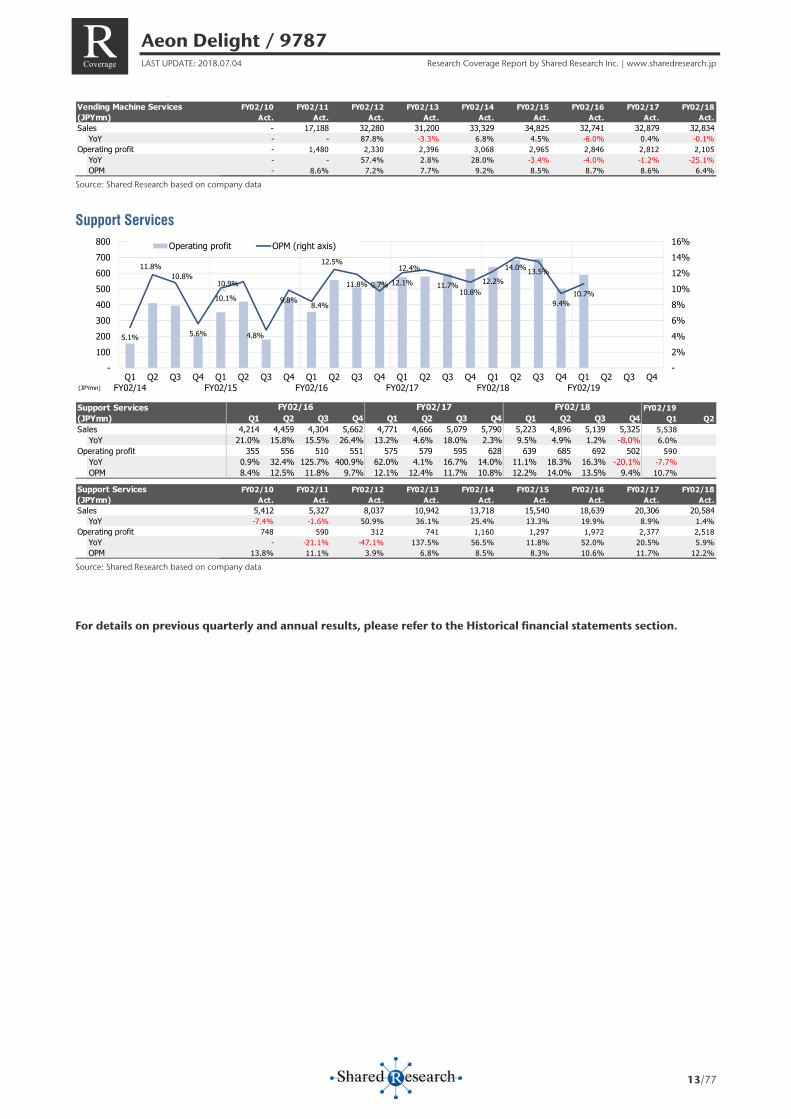
Support Services
Source: Shared Research based on company data
For details on previous quarterly and annual results, please refer to the Historical financial statements section.
Vending Machine Services FY02/10 FY02/11 FY02/12 FY02/13 FY02/14 FY02/15 FY02/16 FY02/17 FY02/18(JPYmn) Act. Act. Act. Act. Act. Act. Act. Act. Act.Sales - 17,188 32,280 31,200 33,329 34,825 32,741 32,879 32,834
YoY - - 87.8% -3.3% 6.8% 4.5% -6.0% 0.4% -0.1%Operating profit - 1,480 2,330 2,396 3,068 2,965 2,846 2,812 2,105
YoY - - 57.4% 2.8% 28.0% -3.4% -4.0% -1.2% -25.1%OPM - 8.6% 7.2% 7.7% 9.2% 8.5% 8.7% 8.6% 6.4%
5.1%
11.8%10.8%
5.6%
10.1%
10.9%
4.8%
9.8% 8.4%
12.5%
11.8% 9.7% 12.1%
12.4%
11.7%10.8%
12.2%
14.0% 13.5%
9.4%10.7%
-2%4%6%8%10%12%14%16%
-100200300400500600700800
Q1FY02/14
Q2 Q3 Q4 Q1FY02/15
Q2 Q3 Q4 Q1FY02/16
Q2 Q3 Q4 Q1FY02/17
Q2 Q3 Q4 Q1FY02/18
Q2 Q3 Q4 Q1FY02/19
Q2 Q3 Q4
Operating profit OPM (right axis)
(JPYmn)
Support Services FY02/19(JPYmn) Q1 Q2 Q3 Q4 Q1 Q2 Q3 Q4 Q1 Q2 Q3 Q4 Q1 Q2Sales 4,214 4,459 4,304 5,662 4,771 4,666 5,079 5,790 5,223 4,896 5,139 5,325 5,538
YoY 21.0% 15.8% 15.5% 26.4% 13.2% 4.6% 18.0% 2.3% 9.5% 4.9% 1.2% -8.0% 6.0% Operating profit 355 556 510 551 575 579 595 628 639 685 692 502 590
YoY 0.9% 32.4% 125.7% 400.9% 62.0% 4.1% 16.7% 14.0% 11.1% 18.3% 16.3% -20.1% -7.7% OPM 8.4% 12.5% 11.8% 9.7% 12.1% 12.4% 11.7% 10.8% 12.2% 14.0% 13.5% 9.4% 10.7%
FY02/18FY02/17FY02/16
Support Services FY02/10 FY02/11 FY02/12 FY02/13 FY02/14 FY02/15 FY02/16 FY02/17 FY02/18(JPYmn) Act. Act. Act. Act. Act. Act. Act. Act. Act.Sales 5,412 5,327 8,037 10,942 13,718 15,540 18,639 20,306 20,584
YoY -7.4% -1.6% 50.9% 36.1% 25.4% 13.3% 19.9% 8.9% 1.4%Operating profit 748 590 312 741 1,160 1,297 1,972 2,377 2,518
YoY - -21.1% -47.1% 137.5% 56.5% 11.8% 52.0% 20.5% 5.9%OPM 13.8% 11.1% 3.9% 6.8% 8.5% 8.3% 10.6% 11.7% 12.2%
Aeon Delight / 9787 LAST UPDATE: 2018.07.04 Research Coverage Report by Shared Research Inc. | www.sharedresearch.jp
14/77
R Coverage
Full-year company forecasts
Source: Shared Research based on company data
Medium-term business plan (FY02/18–FY02/20)
Source: Shared Research based on company data
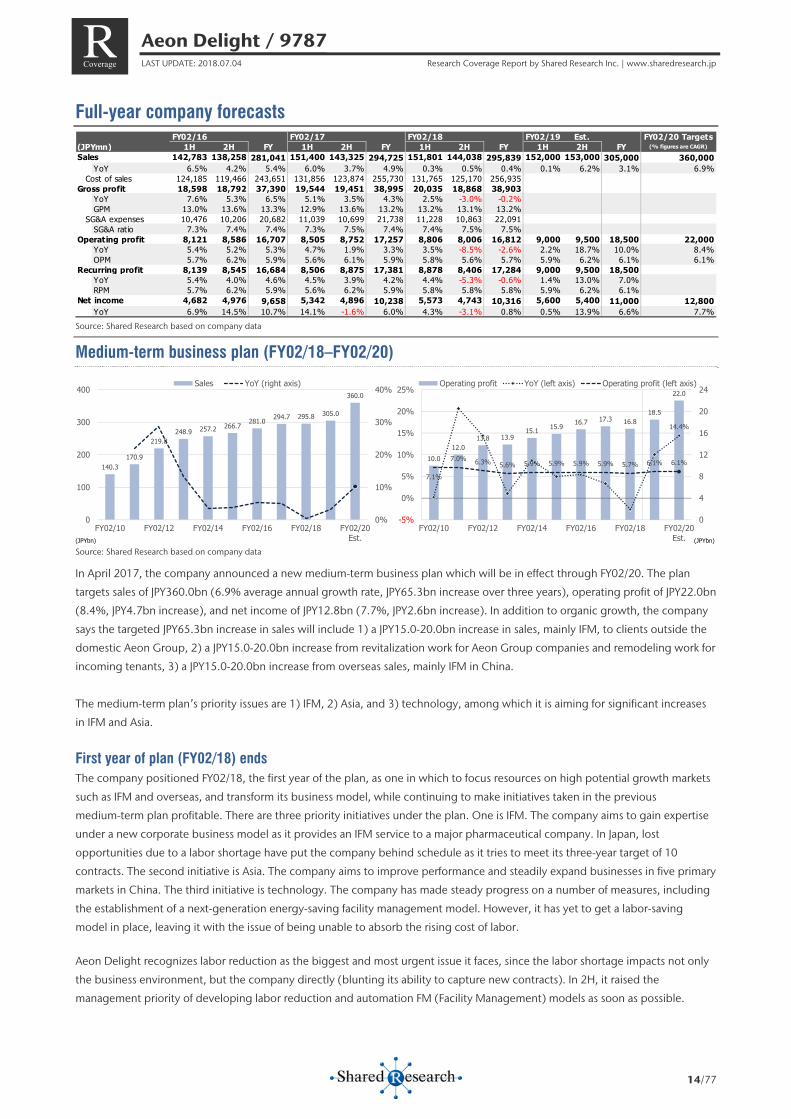
In April 2017, the company announced a new medium-term business plan which will be in effect through FY02/20. The plan
targets sales of JPY360.0bn (6.9% average annual growth rate, JPY65.3bn increase over three years), operating profit of JPY22.0bn
(8.4%, JPY4.7bn increase), and net income of JPY12.8bn (7.7%, JPY2.6bn increase). In addition to organic growth, the company
says the targeted JPY65.3bn increase in sales will include 1) a JPY15.0-20.0bn increase in sales, mainly IFM, to clients outside the
domestic Aeon Group, 2) a JPY15.0-20.0bn increase from revitalization work for Aeon Group companies and remodeling work for
incoming tenants, 3) a JPY15.0-20.0bn increase from overseas sales, mainly IFM in China.
The medium-term plan’s priority issues are 1) IFM, 2) Asia, and 3) technology, among which it is aiming for significant increases
in IFM and Asia.
First year of plan (FY02/18) ends The company positioned FY02/18, the first year of the plan, as one in which to focus resources on high potential growth markets
such as IFM and overseas, and transform its business model, while continuing to make initiatives taken in the previous
medium-term plan profitable. There are three priority initiatives under the plan. One is IFM. The company aims to gain expertise
under a new corporate business model as it provides an IFM service to a major pharmaceutical company. In Japan, lost
opportunities due to a labor shortage have put the company behind schedule as it tries to meet its three-year target of 10
contracts. The second initiative is Asia. The company aims to improve performance and steadily expand businesses in five primary
markets in China. The third initiative is technology. The company has made steady progress on a number of measures, including
the establishment of a next-generation energy-saving facility management model. However, it has yet to get a labor-saving
model in place, leaving it with the issue of being unable to absorb the rising cost of labor.
Aeon Delight recognizes labor reduction as the biggest and most urgent issue it faces, since the labor shortage impacts not only
the business environment, but the company directly (blunting its ability to capture new contracts). In 2H, it raised the
management priority of developing labor reduction and automation FM (Facility Management) models as soon as possible.
FY02/16 FY02/17 FY02/18 FY02/19 Est. FY02/20 Targets(JPYmn) 1H 2H FY 1H 2H FY 1H 2H FY 1H 2H FY (% figures are CAGR)
Sales 142,783 138,258 281,041 151,400 143,325 294,725 151,801 144,038 295,839 152,000 153,000 305,000 360,000YoY 6.5% 4.2% 5.4% 6.0% 3.7% 4.9% 0.3% 0.5% 0.4% 0.1% 6.2% 3.1% 6.9%
Cost of sales 124,185 119,466 243,651 131,856 123,874 255,730 131,765 125,170 256,935 Gross profit 18,598 18,792 37,390 19,544 19,451 38,995 20,035 18,868 38,903
YoY 7.6% 5.3% 6.5% 5.1% 3.5% 4.3% 2.5% -3.0% -0.2% GPM 13.0% 13.6% 13.3% 12.9% 13.6% 13.2% 13.2% 13.1% 13.2%
SG&A expenses 10,476 10,206 20,682 11,039 10,699 21,738 11,228 10,863 22,091 SG&A ratio 7.3% 7.4% 7.4% 7.3% 7.5% 7.4% 7.4% 7.5% 7.5%
Operating profit 8,121 8,586 16,707 8,505 8,752 17,257 8,806 8,006 16,812 9,000 9,500 18,500 22,000YoY 5.4% 5.2% 5.3% 4.7% 1.9% 3.3% 3.5% -8.5% -2.6% 2.2% 18.7% 10.0% 8.4%OPM 5.7% 6.2% 5.9% 5.6% 6.1% 5.9% 5.8% 5.6% 5.7% 5.9% 6.2% 6.1% 6.1%
Recurring profit 8,139 8,545 16,684 8,506 8,875 17,381 8,878 8,406 17,284 9,000 9,500 18,500 YoY 5.4% 4.0% 4.6% 4.5% 3.9% 4.2% 4.4% -5.3% -0.6% 1.4% 13.0% 7.0% RPM 5.7% 6.2% 5.9% 5.6% 6.2% 5.9% 5.8% 5.8% 5.8% 5.9% 6.2% 6.1%
Net income 4,682 4,976 9,658 5,342 4,896 10,238 5,573 4,743 10,316 5,600 5,400 11,000 12,800YoY 6.9% 14.5% 10.7% 14.1% -1.6% 6.0% 4.3% -3.1% 0.8% 0.5% 13.9% 6.6% 7.7%
140.3170.9
219.8248.9 257.2 266.7 281.0 294.7 295.8 305.0
360.0
0%
10%
20%
30%
40%
0
100
200
300
400
FY02/10 FY02/12 FY02/14 FY02/16 FY02/18 FY02/20Est.
Sales YoY (right axis)
(JPYbn)
10.012.0
13.8 13.915.1 15.9 16.7 17.3 16.8
18.5
22.0
14.4%
7.1%
7.0% 6.3% 5.6% 5.9% 5.9% 5.9% 5.9% 5.7% 6.1% 6.1%
0
4
8
12
16
20
24
-5%
0%
5%
10%
15%
20%
25%
FY02/10 FY02/12 FY02/14 FY02/16 FY02/18 FY02/20Est.
Operating profit YoY (left axis) Operating profit (left axis)
(JPYbn)
Aeon Delight / 9787 LAST UPDATE: 2018.07.04 Research Coverage Report by Shared Research Inc. | www.sharedresearch.jp
15/77
R Coverage
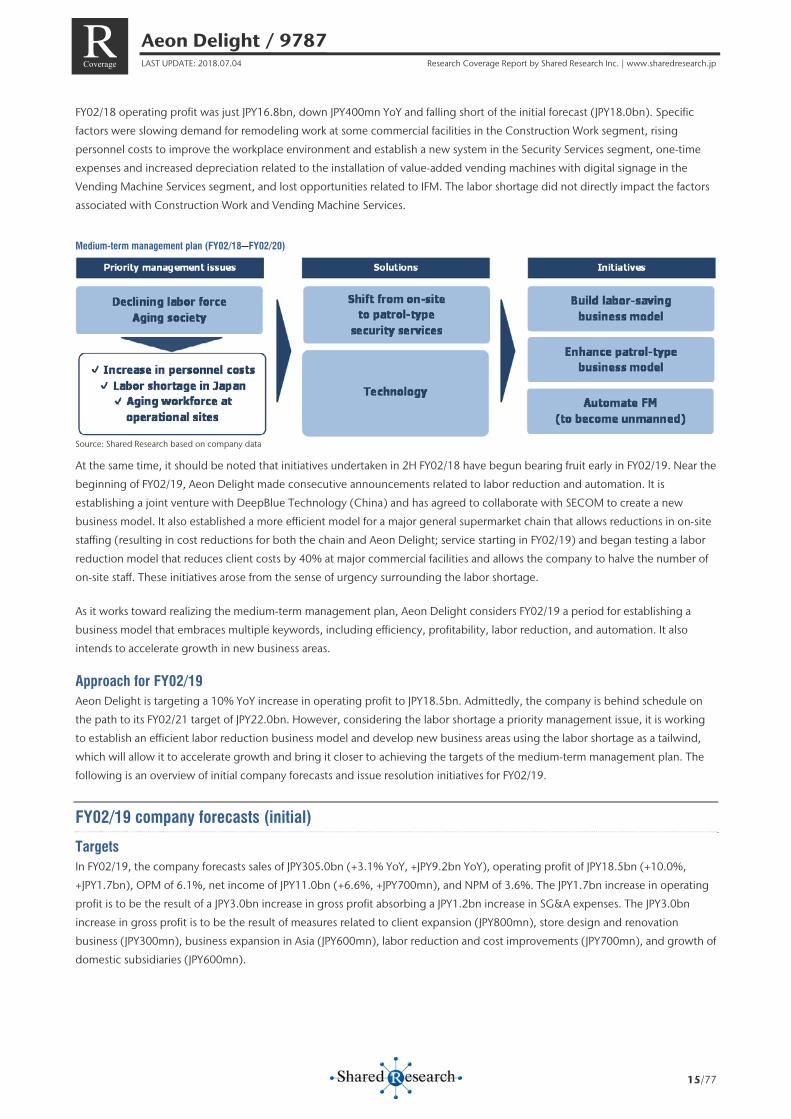
FY02/18 operating profit was just JPY16.8bn, down JPY400mn YoY and falling short of the initial forecast (JPY18.0bn). Specific
factors were slowing demand for remodeling work at some commercial facilities in the Construction Work segment, rising
personnel costs to improve the workplace environment and establish a new system in the Security Services segment, one-time
expenses and increased depreciation related to the installation of value-added vending machines with digital signage in the
Vending Machine Services segment, and lost opportunities related to IFM. The labor shortage did not directly impact the factors
associated with Construction Work and Vending Machine Services.
Medium-term management plan (FY02/18–FY02/20)
Source: Shared Research based on company data
At the same time, it should be noted that initiatives undertaken in 2H FY02/18 have begun bearing fruit early in FY02/19. Near the
beginning of FY02/19, Aeon Delight made consecutive announcements related to labor reduction and automation. It is
establishing a joint venture with DeepBlue Technology (China) and has agreed to collaborate with SECOM to create a new
business model. It also established a more efficient model for a major general supermarket chain that allows reductions in on-site
staffing (resulting in cost reductions for both the chain and Aeon Delight; service starting in FY02/19) and began testing a labor
reduction model that reduces client costs by 40% at major commercial facilities and allows the company to halve the number of
on-site staff. These initiatives arose from the sense of urgency surrounding the labor shortage.
As it works toward realizing the medium-term management plan, Aeon Delight considers FY02/19 a period for establishing a
business model that embraces multiple keywords, including efficiency, profitability, labor reduction, and automation. It also
intends to accelerate growth in new business areas.
Approach for FY02/19 Aeon Delight is targeting a 10% YoY increase in operating profit to JPY18.5bn. Admittedly, the company is behind schedule on
the path to its FY02/21 target of JPY22.0bn. However, considering the labor shortage a priority management issue, it is working
to establish an efficient labor reduction business model and develop new business areas using the labor shortage as a tailwind,
which will allow it to accelerate growth and bring it closer to achieving the targets of the medium-term management plan. The
following is an overview of initial company forecasts and issue resolution initiatives for FY02/19.
FY02/19 company forecasts (initial)
Targets In FY02/19, the company forecasts sales of JPY305.0bn (+3.1% YoY, +JPY9.2bn YoY), operating profit of JPY18.5bn (+10.0%,
+JPY1.7bn), OPM of 6.1%, net income of JPY11.0bn (+6.6%, +JPY700mn), and NPM of 3.6%. The JPY1.7bn increase in operating
profit is to be the result of a JPY3.0bn increase in gross profit absorbing a JPY1.2bn increase in SG&A expenses. The JPY3.0bn
increase in gross profit is to be the result of measures related to client expansion (JPY800mn), store design and renovation
business (JPY300mn), business expansion in Asia (JPY600mn), labor reduction and cost improvements (JPY700mn), and growth of
domestic subsidiaries (JPY600mn).
Aeon Delight / 9787 LAST UPDATE: 2018.07.04 Research Coverage Report by Shared Research Inc. | www.sharedresearch.jp
16/77
R Coverage
Measures to increase gross profit
▷ Client expansion: Based on lost opportunities in FY02/18, Aeon Delight believes there are numerous contracts it could win if it
could secure personnel with the required skills, and it aims to win clients outside the Aeon Group by proposing labor-saving and
energy-saving solutions.
▷ Store design and renovation business: The company expects to see more restorative construction work to be done when
tenants are replaced in shopping malls. Including such work, it forecasts JPY9.2bn (+JPY2.3bn YoY) in gross profit from
revitalization demand.
▷ Business expansion in Asia: The company plans to expand in Asia, with two thirds of the expansion in China and the other
third in ASEAN.
▷ Labor reduction and cost improvements: This is related to client expansion, but Aeon Delight expects to achieve labor
reduction and cost improvements by establishing a labor reduction business model and conducting various initiatives utilizing
technology to achieve cost improvements.
▷ Growth of domestic subsidiaries: The company expects to achieve improvement across all of its subsidiaries, including
growth at AZS, which handles non-core businesses (including call center services and facility management) under contract for
small stores, recovery at Kajitaku, improved earnings at Hakuseisha, and continued profit growth at Aeon Compass.
Initiatives related to priority management issues Aeon Delight aims to establish highly efficient labor reduction, automation, and visiting-type FM business models in FY02/19 to
resolve priority management issues. Specifically, the company says it plans to establish two models to enhance services for small
and medium facilities in Japan, a labor reduction model for large commercial facilities in Japan, and an automated FM model
(SmartFM) for China.
Services for small and medium facilities in Japan
The company aims to establish two business models with distinct characters for small and medium domestic facilities. The first is a
new FM business model created in collaboration with SECOM (TSE1: 9735). The second is a highly efficient, high-margin model
that reduces the number of on-site staff, adds staff at visiting service offices, and strengthens sales.
Collaboration with SECOM
In April 2018, Aeon Delight announced a collaborative effort with SECOM to develop a new FM business model that can capture
FM demand from the 2.2mn companies in Japan that have adopted machine security (remote security using sensors). This
demand amounts to 2.2mn companies × JPY30,000/month (an amount similar to the fee for machine security). For example, if the
company can win contracts with 2.2mn companies × 10% market share × JPY30,000/month × 12 months, sales would be about
JPY80.0bn. A 20% market share would mean about JPY160.0bn in sales. The nature of the collaboration is unclear, but a 50:50
split would mean JPY40.0bn or JPY80.0bn respectively for Aeon Delight. At a briefing, the company said the sales teams of both
companies would try to capture demand for safety and security at medium-sized facilities (20,000 sqm and smaller) and together
they are targeting a market share of about 20% by FY02/21. We will be watching related developments.
Collaboration with SECOM: On April 10, 2018, Aeon Delight agreed to collaborate with SECOM to establish a new FM business model. The content
of the collaboration includes 1) by leveraging the service bases, technologies, and expertise of both companies, realizing labor reduction and
automation for the management and operation of large facilities conventionally handled by on-site guards; 2) developing a one-stop service for small
and medium facilities to resolve issues related to safety, security, comfort, and convenience; 3) coordinating client development by leveraging the sales
abilities of both companies; and 4) promoting coordination on the development of overseas businesses by both companies, starting in China, where
the market is growing fast.
Establishment of more efficient, high-margin business model
Shared Research believes that with the new model, the company can anticipate improved profitability of the conventional on-site
model through labor reduction and of the visiting model through business expansion and development of a dominant position.
Aeon Delight operates through about 600 sites around the country, with a total of some 20,000 qualified staff members assigned
Aeon Delight / 9787 LAST UPDATE: 2018.07.04 Research Coverage Report by Shared Research Inc. | www.sharedresearch.jp
17/77
R Coverage
to those sites (along with a network of about 10,000 cooperating companies). Of the 600 sites, about 450 are involved in FM,
and about 80 of those conduct visiting services. When FM staff members are assigned to work on-site, this increases costs, ties up
qualified staff, and keeps earnings from growing. Establishing a business model that reduces the number of on-site staff would
improve profitability. The reduction can be achieved by consolidating administrative work (the aim is to reduce a four to five
person team by one).
This sort of service is already being used in commercial facilities. It seems that although sales decline, expenses decline even more,
leading to improved profitability. Clients receive the benefit of cost reduction, so if a more efficient, high-margin model is
established that still guarantees quality, Aeon Delight can anticipate horizontal expansion. It plans to develop the model in
earnest starting in FY02/19.
The excess staff members resulting from such labor reduction would then be assigned to sites providing visiting services or to
new projects. Capturing demand in areas near sites providing visiting services helps the company strengthen its dominance,
increasing sales and improving profitability. The synergistic effect is sizeable.
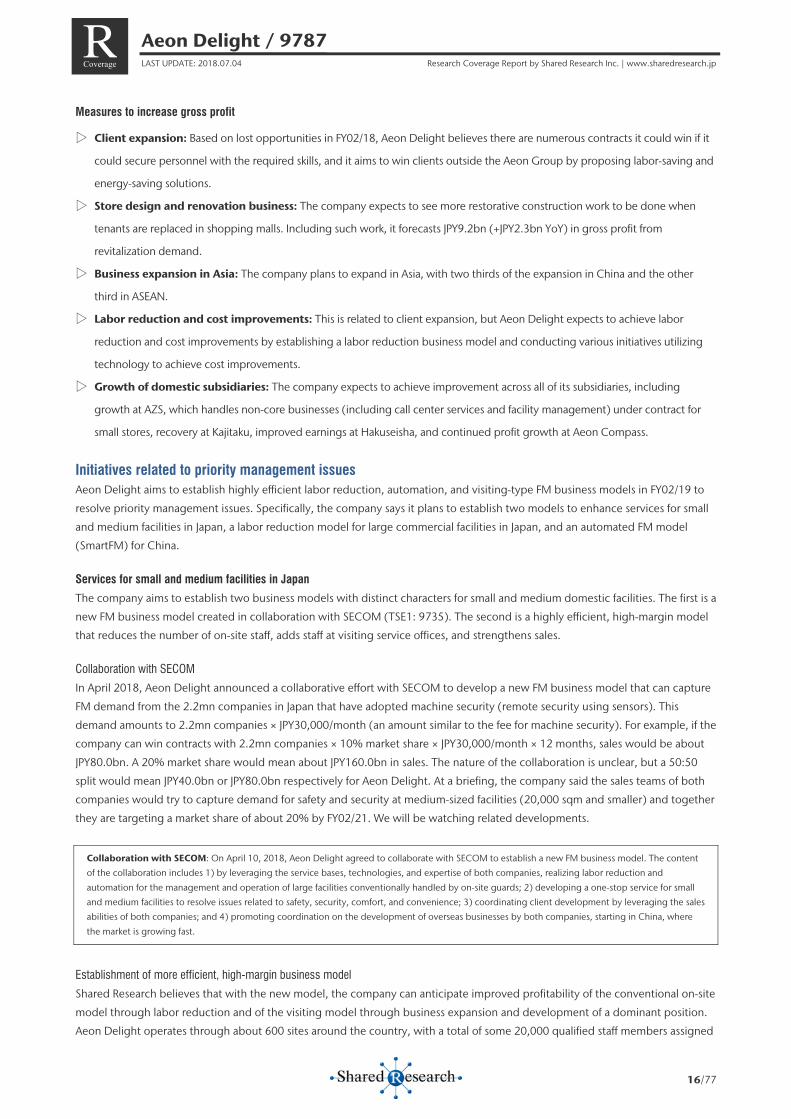
More efficient, high-margin model for small and medium facilities (left), labor reduction model for large commercial facilities (right)
Source: Shared Research based on company data
Establishment of labor reduction model for large commercial facilities in Japan
Aeon Delight is considering a labor reduction model for large commercial facilities that is similar to the one for small and medium
facilities (in terms of reducing labor through improved efficiency), but in combination with cutting-edge technology. It plans to
establish a model during 1H FY02/19 for deployment at multiple facilities in 2H. This labor reduction model will have initial costs
for sensors and other equipment, but halving the number of on-site staff will result in a 40% reduction in facility costs for clients.
The model is already being tested both inside and outside Japan. An energy saving FM model was tested during FY02/18 as a
next-generation FM model, and has now been integrated into the labor reduction model being tested at Aeon Mall Tokoname
(total leased area of 86,700 sqm). As the model nears its completed form, the company is working to determine the results of
each of a variety of labor reduction initiatives and to satisfy clients on the safety and security of the model.
A 40% reduction in client costs naturally means a 40% reduction in related sales for Aeon Delight, but the company plans to
secure profit with the establishment of a labor reduction model leveraging technology. In addition, it plans to shift staff released
from on-site duties to new projects. The company feels it had at least 20 lost opportunities in FY02/18 due to the labor shortage.
Being able to respond to such demand will help it generate sales and profit.
Establishment of automated FM model (SmartFM) for China
The aforementioned labor reduction model also anticipates the ultimate move to full automation. In March 2018, the company
announced it plans to establish AeonDelight DeepBlue Technology (Shanghai) Co., Ltd., a joint venture with IT company
DeepBlue Technology (Shanghai) Co., Ltd. (China) on April 26, 2018. Aeon Delight will have a 65% stake in the new company,
while DeepBlue Technology (Shanghai) will have 35%. Aeon Delight says it has a good feeling about the venture’s potential
technological development speed and hopes to have SmartFM up and running in China in about a year. It is also considering
using technology from DeepBlue Technology in its labor reduction model.
Introducelabor-saving
system
Under demonstration test
【Customers】Reduce facility costs by
40%
【Aeon Delight】Reduce on-site staff by
50%
<Before> <After>Higher unit price
Less on-site staffSales
Costs
Personnelcosts
Sales
Costs
Personnelcosts
Sales
Costs
Personnel costs
Aeon Delight / 9787 LAST UPDATE: 2018.07.04 Research Coverage Report by Shared Research Inc. | www.sharedresearch.jp
18/77
R Coverage
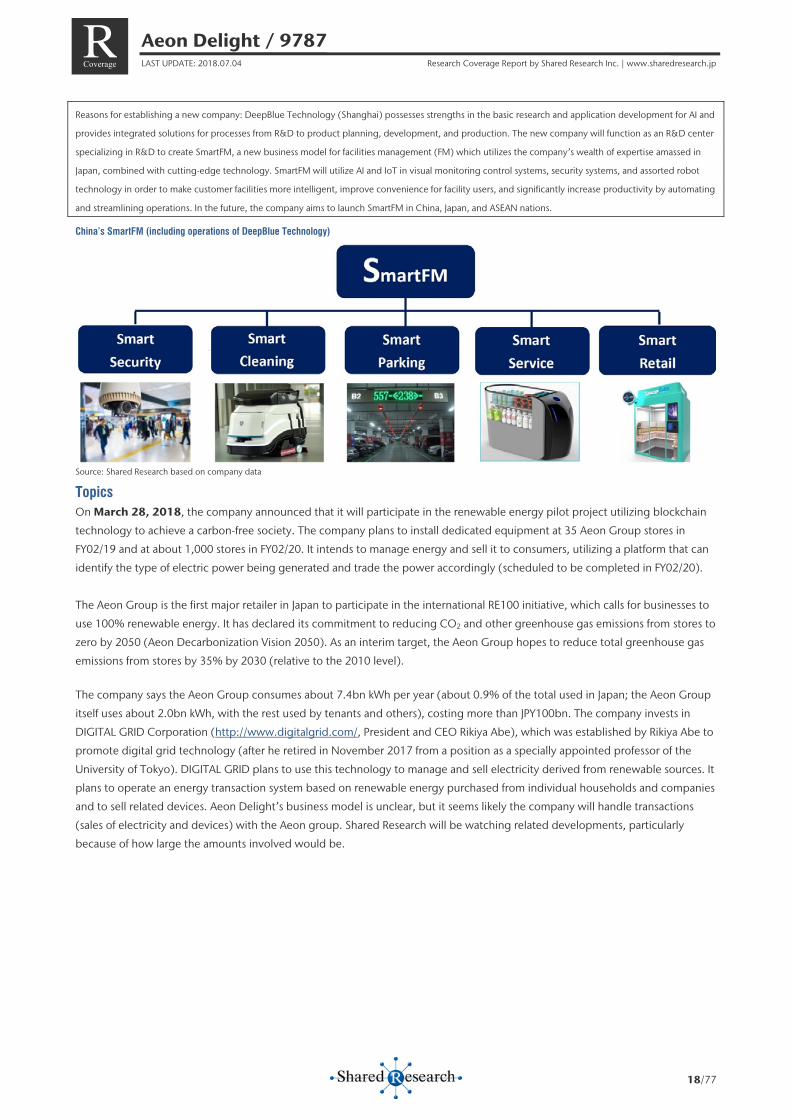
Reasons for establishing a new company: DeepBlue Technology (Shanghai) possesses strengths in the basic research and application development for AI and
provides integrated solutions for processes from R&D to product planning, development, and production. The new company will function as an R&D center
specializing in R&D to create SmartFM, a new business model for facilities management (FM) which utilizes the company’s wealth of expertise amassed in
Japan, combined with cutting-edge technology. SmartFM will utilize AI and IoT in visual monitoring control systems, security systems, and assorted robot
technology in order to make customer facilities more intelligent, improve convenience for facility users, and significantly increase productivity by automating
and streamlining operations. In the future, the company aims to launch SmartFM in China, Japan, and ASEAN nations.
China’s SmartFM (including operations of DeepBlue Technology)
Source: Shared Research based on company data
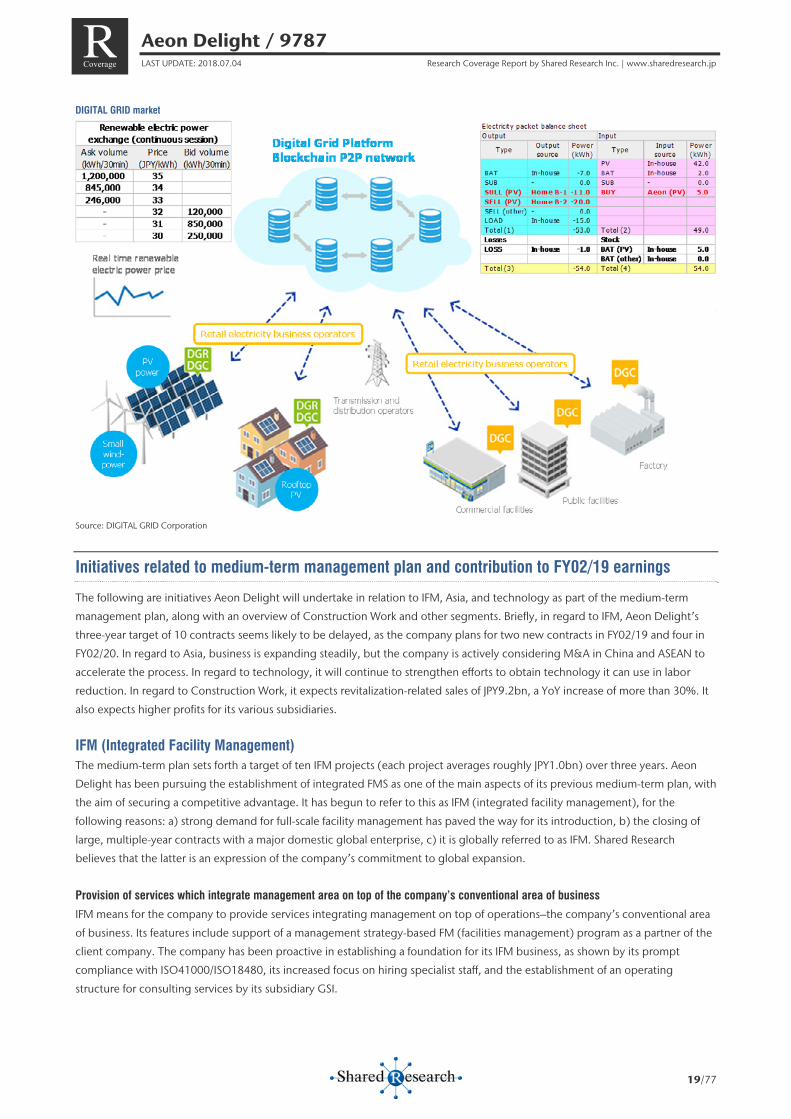
Topics On March 28, 2018, the company announced that it will participate in the renewable energy pilot project utilizing blockchain
technology to achieve a carbon-free society. The company plans to install dedicated equipment at 35 Aeon Group stores in
FY02/19 and at about 1,000 stores in FY02/20. It intends to manage energy and sell it to consumers, utilizing a platform that can
identify the type of electric power being generated and trade the power accordingly (scheduled to be completed in FY02/20).
The Aeon Group is the first major retailer in Japan to participate in the international RE100 initiative, which calls for businesses to
use 100% renewable energy. It has declared its commitment to reducing CO2 and other greenhouse gas emissions from stores to
zero by 2050 (Aeon Decarbonization Vision 2050). As an interim target, the Aeon Group hopes to reduce total greenhouse gas
emissions from stores by 35% by 2030 (relative to the 2010 level).
The company says the Aeon Group consumes about 7.4bn kWh per year (about 0.9% of the total used in Japan; the Aeon Group
itself uses about 2.0bn kWh, with the rest used by tenants and others), costing more than JPY100bn. The company invests in
DIGITAL GRID Corporation (http://www.digitalgrid.com/, President and CEO Rikiya Abe), which was established by Rikiya Abe to
promote digital grid technology (after he retired in November 2017 from a position as a specially appointed professor of the
University of Tokyo). DIGITAL GRID plans to use this technology to manage and sell electricity derived from renewable sources. It
plans to operate an energy transaction system based on renewable energy purchased from individual households and companies
and to sell related devices. Aeon Delight’s business model is unclear, but it seems likely the company will handle transactions
(sales of electricity and devices) with the Aeon group. Shared Research will be watching related developments, particularly
because of how large the amounts involved would be.
Aeon Delight / 9787 LAST UPDATE: 2018.07.04 Research Coverage Report by Shared Research Inc. | www.sharedresearch.jp
19/77
R Coverage
DIGITAL GRID market
Source: DIGITAL GRID Corporation
Initiatives related to medium-term management plan and contribution to FY02/19 earnings
The following are initiatives Aeon Delight will undertake in relation to IFM, Asia, and technology as part of the medium-term
management plan, along with an overview of Construction Work and other segments. Briefly, in regard to IFM, Aeon Delight’s
three-year target of 10 contracts seems likely to be delayed, as the company plans for two new contracts in FY02/19 and four in
FY02/20. In regard to Asia, business is expanding steadily, but the company is actively considering M&A in China and ASEAN to
accelerate the process. In regard to technology, it will continue to strengthen efforts to obtain technology it can use in labor
reduction. In regard to Construction Work, it expects revitalization-related sales of JPY9.2bn, a YoY increase of more than 30%. It
also expects higher profits for its various subsidiaries.
IFM (Integrated Facility Management) The medium-term plan sets forth a target of ten IFM projects (each project averages roughly JPY1.0bn) over three years. Aeon
Delight has been pursuing the establishment of integrated FMS as one of the main aspects of its previous medium-term plan, with
the aim of securing a competitive advantage. It has begun to refer to this as IFM (integrated facility management), for the
following reasons: a) strong demand for full-scale facility management has paved the way for its introduction, b) the closing of
large, multiple-year contracts with a major domestic global enterprise, c) it is globally referred to as IFM. Shared Research
believes that the latter is an expression of the company’s commitment to global expansion.
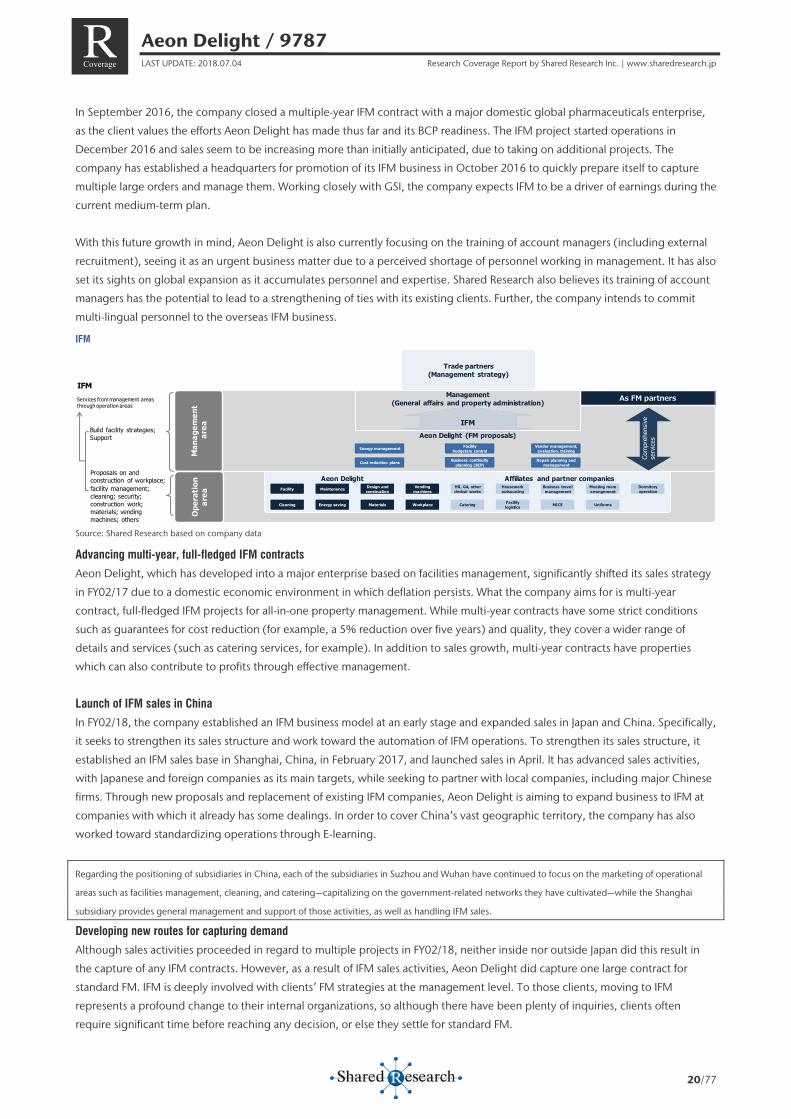
Provision of services which integrate management area on top of the company’s conventional area of business
IFM means for the company to provide services integrating management on top of operations–the company’s conventional area
of business. Its features include support of a management strategy-based FM (facilities management) program as a partner of the
client company. The company has been proactive in establishing a foundation for its IFM business, as shown by its prompt
compliance with ISO41000/ISO18480, its increased focus on hiring specialist staff, and the establishment of an operating
structure for consulting services by its subsidiary GSI.
Aeon Delight / 9787 LAST UPDATE: 2018.07.04 Research Coverage Report by Shared Research Inc. | www.sharedresearch.jp
20/77
R Coverage
In September 2016, the company closed a multiple-year IFM contract with a major domestic global pharmaceuticals enterprise,
as the client values the efforts Aeon Delight has made thus far and its BCP readiness. The IFM project started operations in
December 2016 and sales seem to be increasing more than initially anticipated, due to taking on additional projects. The
company has established a headquarters for promotion of its IFM business in October 2016 to quickly prepare itself to capture
multiple large orders and manage them. Working closely with GSI, the company expects IFM to be a driver of earnings during the
current medium-term plan.
With this future growth in mind, Aeon Delight is also currently focusing on the training of account managers (including external
recruitment), seeing it as an urgent business matter due to a perceived shortage of personnel working in management. It has also
set its sights on global expansion as it accumulates personnel and expertise. Shared Research also believes its training of account
managers has the potential to lead to a strengthening of ties with its existing clients. Further, the company intends to commit
multi-lingual personnel to the overseas IFM business.
IFM
Source: Shared Research based on company data
Advancing multi-year, full-fledged IFM contracts
Aeon Delight, which has developed into a major enterprise based on facilities management, significantly shifted its sales strategy
in FY02/17 due to a domestic economic environment in which deflation persists. What the company aims for is multi-year
contract, full-fledged IFM projects for all-in-one property management. While multi-year contracts have some strict conditions
such as guarantees for cost reduction (for example, a 5% reduction over five years) and quality, they cover a wider range of
details and services (such as catering services, for example). In addition to sales growth, multi-year contracts have properties
which can also contribute to profits through effective management.
Launch of IFM sales in China
In FY02/18, the company established an IFM business model at an early stage and expanded sales in Japan and China. Specifically,
it seeks to strengthen its sales structure and work toward the automation of IFM operations. To strengthen its sales structure, it
established an IFM sales base in Shanghai, China, in February 2017, and launched sales in April. It has advanced sales activities,
with Japanese and foreign companies as its main targets, while seeking to partner with local companies, including major Chinese
firms. Through new proposals and replacement of existing IFM companies, Aeon Delight is aiming to expand business to IFM at
companies with which it already has some dealings. In order to cover China’s vast geographic territory, the company has also
worked toward standardizing operations through E-learning.
Regarding the positioning of subsidiaries in China, each of the subsidiaries in Suzhou and Wuhan have continued to focus on the marketing of operational
areas such as facilities management, cleaning, and catering—capitalizing on the government-related networks they have cultivated—while the Shanghai
subsidiary provides general management and support of those activities, as well as handling IFM sales.
Developing new routes for capturing demand
Although sales activities proceeded in regard to multiple projects in FY02/18, neither inside nor outside Japan did this result in
the capture of any IFM contracts. However, as a result of IFM sales activities, Aeon Delight did capture one large contract for
standard FM. IFM is deeply involved with clients’ FM strategies at the management level. To those clients, moving to IFM
represents a profound change to their internal organizations, so although there have been plenty of inquiries, clients often
require significant time before reaching any decision, or else they settle for standard FM.
IFM
IFM
Trade partners(Management strategy)
Management (General affairs and property administration)
Aeon Delight (FM proposals)
Aeon Delight Affiliates and partner companies
As FM partners
Energy management Facilitybudgetary control
Cost reduction plans Business continuity planning (BCP)
Repair planning and management
Vendor management, evaluation, training
Cleaning
Facility Maintenance
Energy saving
Design and construction
Materials
Vending machines
Workplace
HR, GA, other clerical works
Catering
Houseworkoutsourcing
Facility logistics
Business travel management
MICE
Meeting room arrangement
Uniforms
Dormitory operation
Man
agem
ent
area
Ope
rati
onar
ea
Services from management areas through operation areas
Build facility strategies;Support
Proposals on and construction of workplace; facility management; cleaning; security; construction work; materials; vending machines; others
Com
preh
ensiv
ese
rvice
s
Aeon Delight / 9787 LAST UPDATE: 2018.07.04 Research Coverage Report by Shared Research Inc. | www.sharedresearch.jp
21/77
R Coverage
That said, the company will focus on developing new sales routes in FY02/19 in order to achieve its three-year target of 10
contracts. In Hong Kong and Singapore, the market is being established by companies that introduce IFM contractors to
companies desiring IFM. Aeon Delight plans to make use of this sort of market (by submitting bids) in order to accumulate
overseas contracts. In Japan, it is teaming up with trust banks. Through these measures, the company is targeting two new IFM
contracts in FY02/19 and four in FY02/20.
Aiming for sales of JPY700.0bn in FY02/28
As an IFM company that maximizes client profits through the use of technology, the company aims for sales of JPY700.0bn in
FY02/28. In the first five years, the company will focus its efforts on areas such as a) after winning a facilities management contract,
the division of services which Aeon Delight can handle in-house and those for which it will form an alliance, b) cost reductions
and returns to clients, and c) strengthening its ability to estimate the costs of each business. In the latter five years, the company
says it will further accelerate expansion based on the results of the first five years. The winning of ten IFM projects over three years
under the current medium-term plan is just a first step. In an effort to expand further after that, the company plans to invest
aggressively, especially in personnel.
Initiatives to increase sales per region With the abovementioned IFM in mind, the company seeks to also increase sales per region for existing FM business as follows: 1)
Japan: expand construction work (such as revitalization of commercial facilities), 2) China: expand catering business and share of
top five priority markets, 3) ASEAN: enter the Cambodian market and conduct M&A in Indonesia, where market growth is
anticipated.
In Japan, the company is focusing on capturing demand for revitalization of commercial facilities. It aimed to increase
revitalization-related sales by JPY3.0bn in FY02/18 but achieved an increase of just JPY100mn after slowed demand for remodeling
of supermarkets and general supermarkets. However, the company is targeting JPY9.2bn in sales (+JPY2.3bn) in FY02/19.
Revitalization demand is high priority and holds a key place, along with IFM, in the company’s target of a JPY15.0–20.0bn
increase in non-Aeon group sales under its medium-term plan.
Japan: Expansion of renovation work, demand for revitalization of commercial facilities
Regarding demand for revitalization of commercial facilities, in addition to securing a steady flow of renovation projects from
Aeon group companies such as Aeon Mall (TSE1: 8905) and Aeon Retail, Aeon Delight is also looking at expanding into new
business areas in order to maximize its business opportunities. Although there is only JPY20.0-30.0bn worth of demand for
renovations from roughly 350 shopping malls across Japan, when including construction work for replacement tenants, the
company estimates that the market expands to JPY200.0bn. Aeon Delight aimed to capture this market under the previous
medium-term plan and advanced the reinforcement of its personnel. Under the current medium-term plan, with a favorable
market environment, the company aims to reap those rewards.
Demand for construction work for replacement tenants
For example, when malls undergo renewals, there is restorative construction work to be done when a tenant moves out,
remodeling work to be done to accommodate the new tenant moving in, and there is of course renovation work on the mall itself.
By acquiring experience and expertise in all these different types of construction work, Aeon Delight has put itself in a position to
not only do the actual work but also supervise the entire construction process. Going forward, Aeon Delight plans to capture
even more of the value-added in the store renovation process by moving into other areas such as architecture and store design.
Toward this end, Aeon Delight had been beefing up its workforce since the beginning of FY02/18, and making itself more cost
competitive versus major interior design companies and general contractors. In FY02/18, with small- and medium-sized tenants
as its targets, the company steadily capitalized on related demand.
FY02/19
Aeon Delight plans to further expand related sales in FY02/19. In April 2018, it made U-COM (JPY550mn in sales in
FY2016; http://www.ucom-web.co.jp/) a wholly owned subsidiary. Aeon Delight says this store design specialist is strong in

Aeon Delight / 9787 LAST UPDATE: 2018.07.04 Research Coverage Report by Shared Research Inc. | www.sharedresearch.jp
22/77
R Coverage
China and it hopes U-COM will help it gain traction in capturing demand in Asia. Construction management is now the
company’s only weakness. Aeon Delight says that if it can plug that hole through acquisitions, its Construction Work segment
(FY02/18 sales of JPY40.9bn) could target sales on a level with competing companies (for example, Tanseisha Co., Ltd. [TSE1:
9743], which had FY02/18 sales of JPY75.2bn).
Construction work process for commercial facility tenant replacement
Source: Shared Research based on company data
Aeon group-related demand
In terms of the Aeon group, projects targeting Aeon Mall are expected to continue to expand. Over the three years from FY02/18
to FY02/20, Aeon Mall plans to invest JPY100.0bn in the revitalization of existing malls in Japan, of which JPY30.0bn was planned
for FY02/18. In fact, it invested JPY70.0bn in FY02/18, JPY40.0bn more than planned, and increased the three-year plan to
JPY140.0bn, with JPY30.0bn to be spent in FY02/19 and JPY40.0bn in FY02/20. Aeon Mall generally does major renovations of
existing malls once every six years and renovated 12 malls (versus 15 planned) and expanded two in FY02/18. It plans to renovate
eight malls and expand two in FY02/19 and renovate 10 and expand four in FY02/20.
One reason for the shortfall in FY02/18 was projects for Aeon Retail, but Aeon Delight believes FY02/18 represented a bottoming
out and there will be no further decline in FY02/19.
Retail sales at malls tend to peak three years after the opening and slow in the fourth and fifth years. Therefore, Aeon Mall renovates its malls when
six-year regular lease agreements with specialty store tenants expire. The company’s planning takes into account changes in the commercial area, and
introduces new specialty stores and renovates and removes existing specialty stores at malls. Changing almost all of the specialty stores helps to remake
the entire mall. Spending is JPY300mn– JPY500mn per mall.
Number of renovated Aeon Malls
Source: Shared Research based on company data
Expansion of overseas businesses
Aeon Delight is targeting JPY30.0bn in total sales from overseas businesses in FY02/20. Of the JPY18.0bn increase over FY02/17
sales, the company is looking for JPY11.0bn from China (including IFM; representing an average annual growth rate of roughly
30%) and JPY7.0bn from ASEAN countries (where sales are expected to grow at 40–50% per annum). This compares with
estimated sales of roughly JPY12.0bn in FY02/17 (representing growth of 13.5% YoY), of which an estimated JPY8.0–9.0bn was
from China and JPY3.0–4.0bn was from ASEAN. FY02/18 results included sales of JPY12.9bn (+7%), of which more than JPY9.0bn
Moving out
Moving in
01Temporary enclosure
construction work
04Preliminary research
02Restoration
construction workZoning
03Peripheral work
related to temporary enclosure and
restoration
05Development
plan
06Planning
and design outline
08Interior
construction management
09Construction
and management
10Transfer
11Maintenance
12Facility mgmt.,
cleaning,security
07Design &
constructionZoning and
restoration work
56
12
9
1311
8
12
20
14
10
14
0
5
10
15
20
0
1,000
2,000
3,000
4,000
FY02/09 FY02/10 FY02/11 FY02/12 FY02/13 FY02/14 FY02/15 FY02/16 FY02/17 FY02/18 FY02/19Plan
FY02/20Plan
No. of specialty stores Renovated tenants Renovation and expansion of existing malls in Japan (right axis)
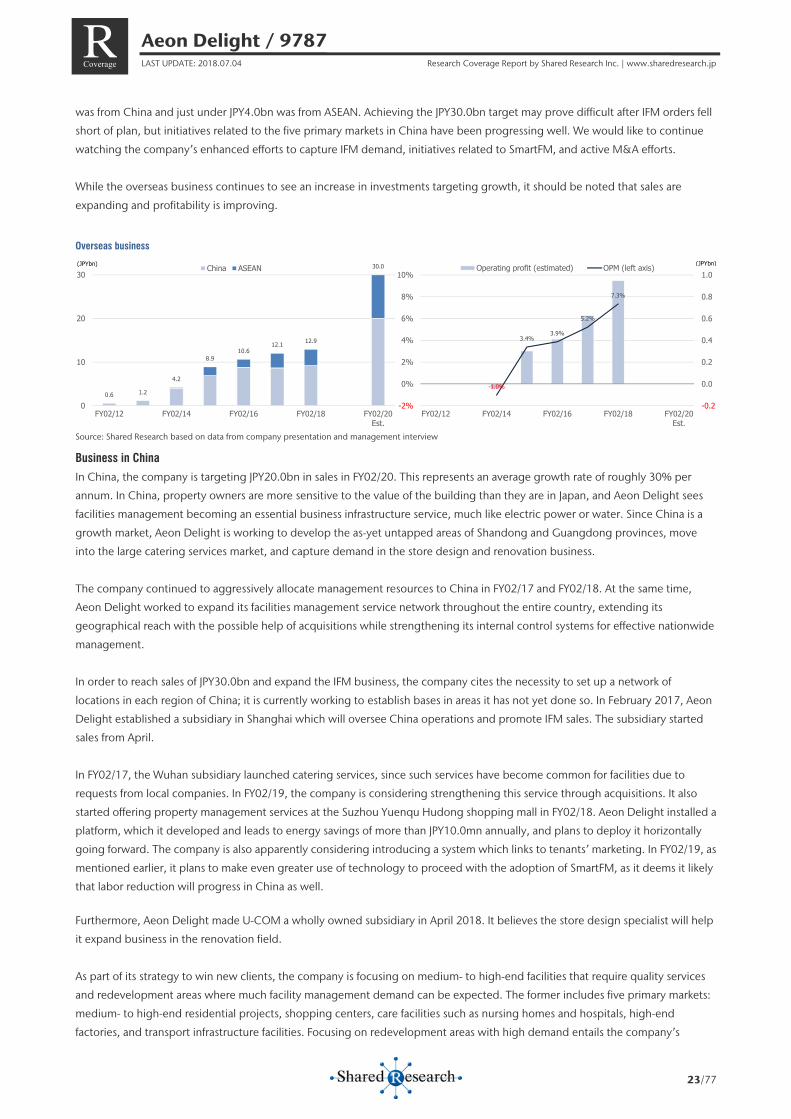
Aeon Delight / 9787 LAST UPDATE: 2018.07.04 Research Coverage Report by Shared Research Inc. | www.sharedresearch.jp
23/77
R Coverage
was from China and just under JPY4.0bn was from ASEAN. Achieving the JPY30.0bn target may prove difficult after IFM orders fell
short of plan, but initiatives related to the five primary markets in China have been progressing well. We would like to continue
watching the company’s enhanced efforts to capture IFM demand, initiatives related to SmartFM, and active M&A efforts.
While the overseas business continues to see an increase in investments targeting growth, it should be noted that sales are
expanding and profitability is improving.
Overseas business
Source: Shared Research based on data from company presentation and management interview
Business in China
In China, the company is targeting JPY20.0bn in sales in FY02/20. This represents an average growth rate of roughly 30% per
annum. In China, property owners are more sensitive to the value of the building than they are in Japan, and Aeon Delight sees
facilities management becoming an essential business infrastructure service, much like electric power or water. Since China is a
growth market, Aeon Delight is working to develop the as-yet untapped areas of Shandong and Guangdong provinces, move
into the large catering services market, and capture demand in the store design and renovation business.
The company continued to aggressively allocate management resources to China in FY02/17 and FY02/18. At the same time,
Aeon Delight worked to expand its facilities management service network throughout the entire country, extending its
geographical reach with the possible help of acquisitions while strengthening its internal control systems for effective nationwide
management.
In order to reach sales of JPY30.0bn and expand the IFM business, the company cites the necessity to set up a network of
locations in each region of China; it is currently working to establish bases in areas it has not yet done so. In February 2017, Aeon
Delight established a subsidiary in Shanghai which will oversee China operations and promote IFM sales. The subsidiary started
sales from April.
In FY02/17, the Wuhan subsidiary launched catering services, since such services have become common for facilities due to
requests from local companies. In FY02/19, the company is considering strengthening this service through acquisitions. It also
started offering property management services at the Suzhou Yuenqu Hudong shopping mall in FY02/18. Aeon Delight installed a
platform, which it developed and leads to energy savings of more than JPY10.0mn annually, and plans to deploy it horizontally
going forward. The company is also apparently considering introducing a system which links to tenants’ marketing. In FY02/19, as
mentioned earlier, it plans to make even greater use of technology to proceed with the adoption of SmartFM, as it deems it likely
that labor reduction will progress in China as well.
Furthermore, Aeon Delight made U-COM a wholly owned subsidiary in April 2018. It believes the store design specialist will help
it expand business in the renovation field.
As part of its strategy to win new clients, the company is focusing on medium- to high-end facilities that require quality services
and redevelopment areas where much facility management demand can be expected. The former includes five primary markets:
medium- to high-end residential projects, shopping centers, care facilities such as nursing homes and hospitals, high-end
factories, and transport infrastructure facilities. Focusing on redevelopment areas with high demand entails the company’s
0.6 1.2
4.2
8.910.6
12.1 12.9
30.0
0
10
20
30
FY02/12 FY02/14 FY02/16 FY02/18 FY02/20Est.
China ASEAN(JPYbn)
-1.0%
3.4%3.9%
5.2%
7.3%
-0.2
0.0
0.2
0.4
0.6
0.8
1.0
-2%
0%
2%
4%
6%
8%
10%
FY02/12 FY02/14 FY02/16 FY02/18 FY02/20Est.
Operating profit (estimated) OPM (left axis) (JPYbn)
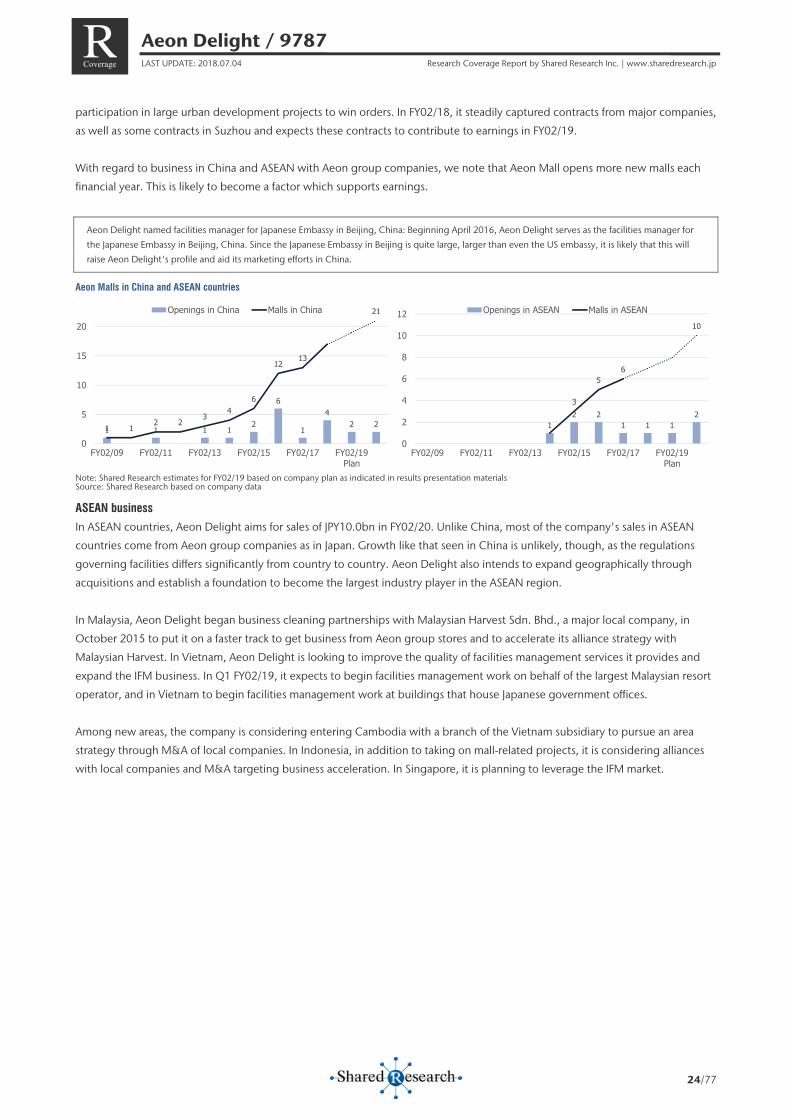
Aeon Delight / 9787 LAST UPDATE: 2018.07.04 Research Coverage Report by Shared Research Inc. | www.sharedresearch.jp
24/77
R Coverage
participation in large urban development projects to win orders. In FY02/18, it steadily captured contracts from major companies,
as well as some contracts in Suzhou and expects these contracts to contribute to earnings in FY02/19.
With regard to business in China and ASEAN with Aeon group companies, we note that Aeon Mall opens more new malls each
financial year. This is likely to become a factor which supports earnings.
Aeon Delight named facilities manager for Japanese Embassy in Beijing, China: Beginning April 2016, Aeon Delight serves as the facilities manager for
the Japanese Embassy in Beijing, China. Since the Japanese Embassy in Beijing is quite large, larger than even the US embassy, it is likely that this will
raise Aeon Delight's profile and aid its marketing efforts in China.
Aeon Malls in China and ASEAN countries
Note: Shared Research estimates for FY02/19 based on company plan as indicated in results presentation materials Source: Shared Research based on company data
ASEAN business
In ASEAN countries, Aeon Delight aims for sales of JPY10.0bn in FY02/20. Unlike China, most of the company's sales in ASEAN
countries come from Aeon group companies as in Japan. Growth like that seen in China is unlikely, though, as the regulations
governing facilities differs significantly from country to country. Aeon Delight also intends to expand geographically through
acquisitions and establish a foundation to become the largest industry player in the ASEAN region.
In Malaysia, Aeon Delight began business cleaning partnerships with Malaysian Harvest Sdn. Bhd., a major local company, in
October 2015 to put it on a faster track to get business from Aeon group stores and to accelerate its alliance strategy with
Malaysian Harvest. In Vietnam, Aeon Delight is looking to improve the quality of facilities management services it provides and
expand the IFM business. In Q1 FY02/19, it expects to begin facilities management work on behalf of the largest Malaysian resort
operator, and in Vietnam to begin facilities management work at buildings that house Japanese government offices.
Among new areas, the company is considering entering Cambodia with a branch of the Vietnam subsidiary to pursue an area
strategy through M&A of local companies. In Indonesia, in addition to taking on mall-related projects, it is considering alliances
with local companies and M&A targeting business acceleration. In Singapore, it is planning to leverage the IFM market.
12 2
1 1 12
3
56
10
0
2
4
6
8
10
12
FY02/09 FY02/11 FY02/13 FY02/15 FY02/17 FY02/19Plan
Openings in ASEAN Malls in ASEAN
1 1 1 12
6
1
42 21 1
2 23
46
1213
21
0
5
10
15
20
FY02/09 FY02/11 FY02/13 FY02/15 FY02/17 FY02/19Plan
Openings in China Malls in China
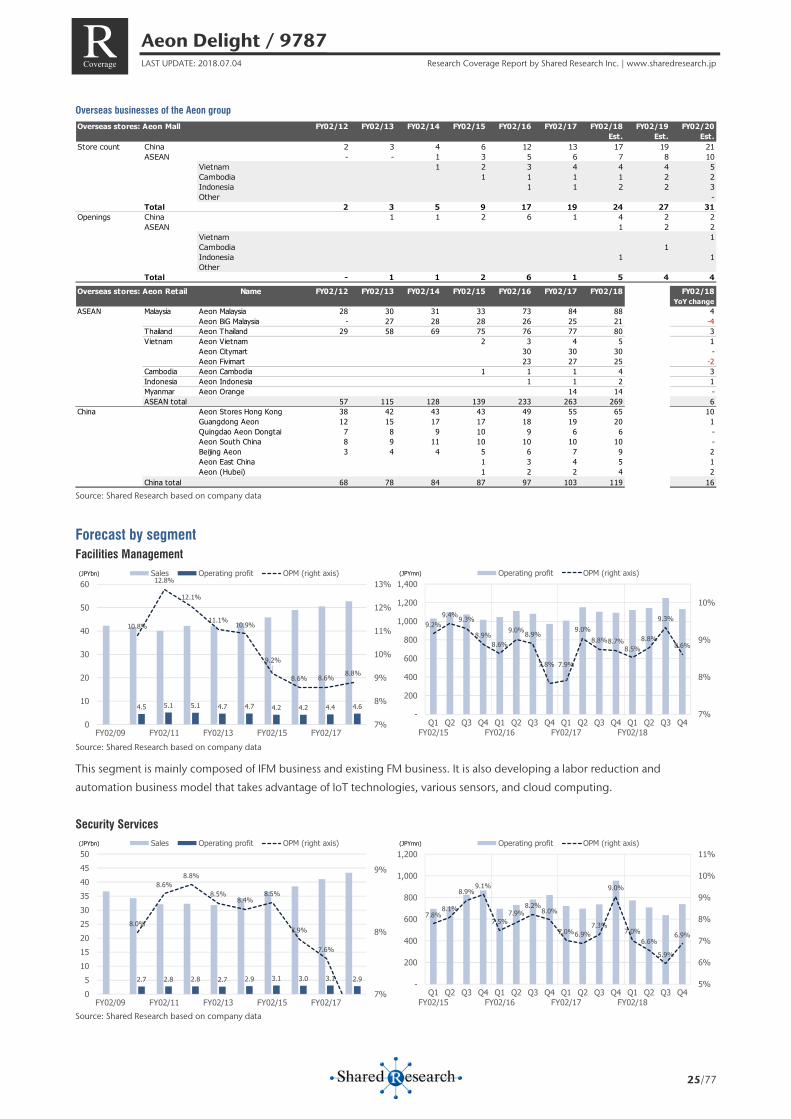
Aeon Delight / 9787 LAST UPDATE: 2018.07.04 Research Coverage Report by Shared Research Inc. | www.sharedresearch.jp
25/77
R Coverage
Overseas businesses of the Aeon group
Source: Shared Research based on company data
Forecast by segment Facilities Management
Source: Shared Research based on company data
This segment is mainly composed of IFM business and existing FM business. It is also developing a labor reduction and
automation business model that takes advantage of IoT technologies, various sensors, and cloud computing.
Security Services
Source: Shared Research based on company data
Overseas stores: Aeon Mall FY02/12 FY02/13 FY02/14 FY02/15 FY02/16 FY02/17 FY02/18 FY02/19 FY02/20Est. Est. Est.
Store count China 2 3 4 6 12 13 17 19 21ASEAN - - 1 3 5 6 7 8 10
Vietnam 1 2 3 4 4 4 5Cambodia 1 1 1 1 2 2Indonesia 1 1 2 2 3Other -
Total 2 3 5 9 17 19 24 27 31Openings China 1 1 2 6 1 4 2 2
ASEAN 1 2 2Vietnam 1Cambodia 1 Indonesia 1 1Other
Total - 1 1 2 6 1 5 4 4Overseas stores: Aeon Retail Name FY02/12 FY02/13 FY02/14 FY02/15 FY02/16 FY02/17 FY02/18 FY02/18
YoY changeASEAN Malaysia Aeon Malaysia 28 30 31 33 73 84 88 4
Aeon BiG Malaysia - 27 28 28 26 25 21 -4Thailand Aeon Thailand 29 58 69 75 76 77 80 3Vietnam Aeon Vietnam 2 3 4 5 1
Aeon Citymart 30 30 30 -Aeon Fivimart 23 27 25 -2
Cambodia Aeon Cambodia 1 1 1 4 3Indonesia Aeon Indonesia 1 1 2 1Myanmar Aeon Orange 14 14 -ASEAN total 57 115 128 139 233 263 269 6
China Aeon Stores Hong Kong 38 42 43 43 49 55 65 10Guangdong Aeon 12 15 17 17 18 19 20 1Quingdao Aeon Dongtai 7 8 9 10 9 6 6 -Aeon South China 8 9 11 10 10 10 10 -Beijing Aeon 3 4 4 5 6 7 9 2Aeon East China 1 3 4 5 1Aeon (Hubei) 1 2 2 4 2
China total 68 78 84 87 97 103 119 16
9.2%9.4%9.3%
8.9%8.6%
9.0%8.9%
7.8% 7.9%
9.0%8.8%8.7%
8.5%8.8%
9.3%
8.6%
7%
8%
9%
10%
-
200
400
600
800
1,000
1,200
1,400
Q1FY02/15
Q2 Q3 Q4 Q1FY02/16
Q2 Q3 Q4 Q1FY02/17
Q2 Q3 Q4 Q1FY02/18
Q2 Q3 Q4
Operating profit OPM (right axis)(JPYmn)
4.5 5.1 5.1 4.7 4.7 4.2 4.2 4.4 4.6
10.8%
12.8%
12.1%
11.1%10.9%
9.2%
8.6% 8.6% 8.8%
7%
8%
9%
10%
11%
12%
13%
0
10
20
30
40
50
60
FY02/09 FY02/11 FY02/13 FY02/15 FY02/17
Sales Operating profit OPM (right axis)(JPYbn)
7.8%8.1%
8.9%9.1%
7.5%7.9%
8.2%8.0%
7.0%6.9%7.3%
9.0%
7.0%6.6%
5.9%
6.9%
5%
6%
7%
8%
9%
10%
11%
-
200
400
600
800
1,000
1,200
Q1FY02/15
Q2 Q3 Q4 Q1FY02/16
Q2 Q3 Q4 Q1FY02/17
Q2 Q3 Q4 Q1FY02/18
Q2 Q3 Q4
Operating profit OPM (right axis)(JPYmn)
2.7 2.8 2.8 2.7 2.9 3.1 3.0 3.1 2.9
8.0%
8.6%8.8%
8.5%8.4%
8.5%
7.9%
7.6%
7%
8%
9%
05
101520253035404550
FY02/09 FY02/11 FY02/13 FY02/15 FY02/17
Sales Operating profit OPM (right axis)(JPYbn)
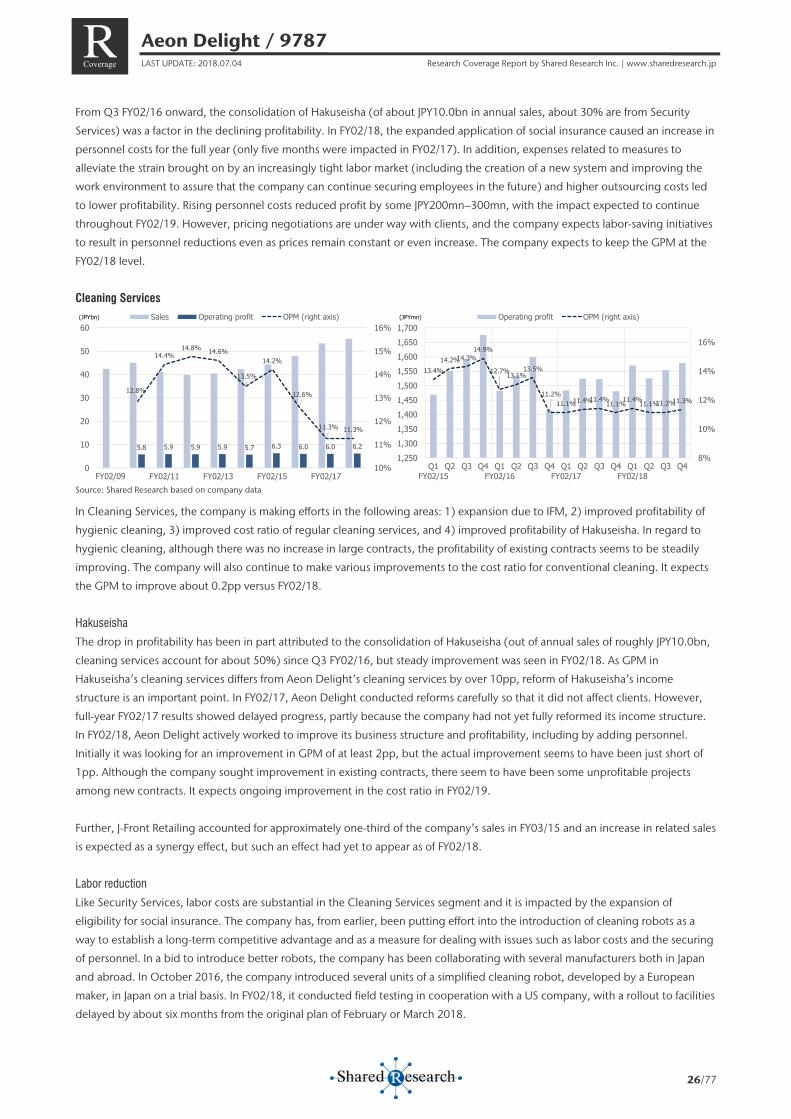
Aeon Delight / 9787 LAST UPDATE: 2018.07.04 Research Coverage Report by Shared Research Inc. | www.sharedresearch.jp
26/77
R Coverage
From Q3 FY02/16 onward, the consolidation of Hakuseisha (of about JPY10.0bn in annual sales, about 30% are from Security
Services) was a factor in the declining profitability. In FY02/18, the expanded application of social insurance caused an increase in
personnel costs for the full year (only five months were impacted in FY02/17). In addition, expenses related to measures to
alleviate the strain brought on by an increasingly tight labor market (including the creation of a new system and improving the
work environment to assure that the company can continue securing employees in the future) and higher outsourcing costs led
to lower profitability. Rising personnel costs reduced profit by some JPY200mn–300mn, with the impact expected to continue
throughout FY02/19. However, pricing negotiations are under way with clients, and the company expects labor-saving initiatives
to result in personnel reductions even as prices remain constant or even increase. The company expects to keep the GPM at the
FY02/18 level.
Cleaning Services
Source: Shared Research based on company data
In Cleaning Services, the company is making efforts in the following areas: 1) expansion due to IFM, 2) improved profitability of
hygienic cleaning, 3) improved cost ratio of regular cleaning services, and 4) improved profitability of Hakuseisha. In regard to
hygienic cleaning, although there was no increase in large contracts, the profitability of existing contracts seems to be steadily
improving. The company will also continue to make various improvements to the cost ratio for conventional cleaning. It expects
the GPM to improve about 0.2pp versus FY02/18.
Hakuseisha
The drop in profitability has been in part attributed to the consolidation of Hakuseisha (out of annual sales of roughly JPY10.0bn,
cleaning services account for about 50%) since Q3 FY02/16, but steady improvement was seen in FY02/18. As GPM in
Hakuseisha’s cleaning services differs from Aeon Delight’s cleaning services by over 10pp, reform of Hakuseisha’s income
structure is an important point. In FY02/17, Aeon Delight conducted reforms carefully so that it did not affect clients. However,
full-year FY02/17 results showed delayed progress, partly because the company had not yet fully reformed its income structure.
In FY02/18, Aeon Delight actively worked to improve its business structure and profitability, including by adding personnel.
Initially it was looking for an improvement in GPM of at least 2pp, but the actual improvement seems to have been just short of
1pp. Although the company sought improvement in existing contracts, there seem to have been some unprofitable projects
among new contracts. It expects ongoing improvement in the cost ratio in FY02/19.
Further, J-Front Retailing accounted for approximately one-third of the company’s sales in FY03/15 and an increase in related sales
is expected as a synergy effect, but such an effect had yet to appear as of FY02/18.
Labor reduction
Like Security Services, labor costs are substantial in the Cleaning Services segment and it is impacted by the expansion of
eligibility for social insurance. The company has, from earlier, been putting effort into the introduction of cleaning robots as a
way to establish a long-term competitive advantage and as a measure for dealing with issues such as labor costs and the securing
of personnel. In a bid to introduce better robots, the company has been collaborating with several manufacturers both in Japan
and abroad. In October 2016, the company introduced several units of a simplified cleaning robot, developed by a European
maker, in Japan on a trial basis. In FY02/18, it conducted field testing in cooperation with a US company, with a rollout to facilities
delayed by about six months from the original plan of February or March 2018.
13.4%14.2%14.3%
14.9%
12.7%13.1%13.5%
11.2%11.1%11.4%11.4%11.1%11.4%11.1%11.2%11.3%
8%
10%
12%
14%
16%
1,2501,3001,3501,4001,4501,5001,5501,6001,6501,700
Q1FY02/15
Q2 Q3 Q4 Q1FY02/16
Q2 Q3 Q4 Q1FY02/17
Q2 Q3 Q4 Q1FY02/18
Q2 Q3 Q4
Operating profit OPM (right axis)(JPYmn)
5.8 5.9 5.9 5.9 5.7 6.3 6.0 6.0 6.2
12.8%
14.4%14.8% 14.6%
13.5%
14.2%
12.6%
11.3% 11.3%
10%
11%
12%
13%
14%
15%
16%
0
10
20
30
40
50
60
FY02/09 FY02/11 FY02/13 FY02/15 FY02/17
Sales Operating profit OPM (right axis)(JPYbn)
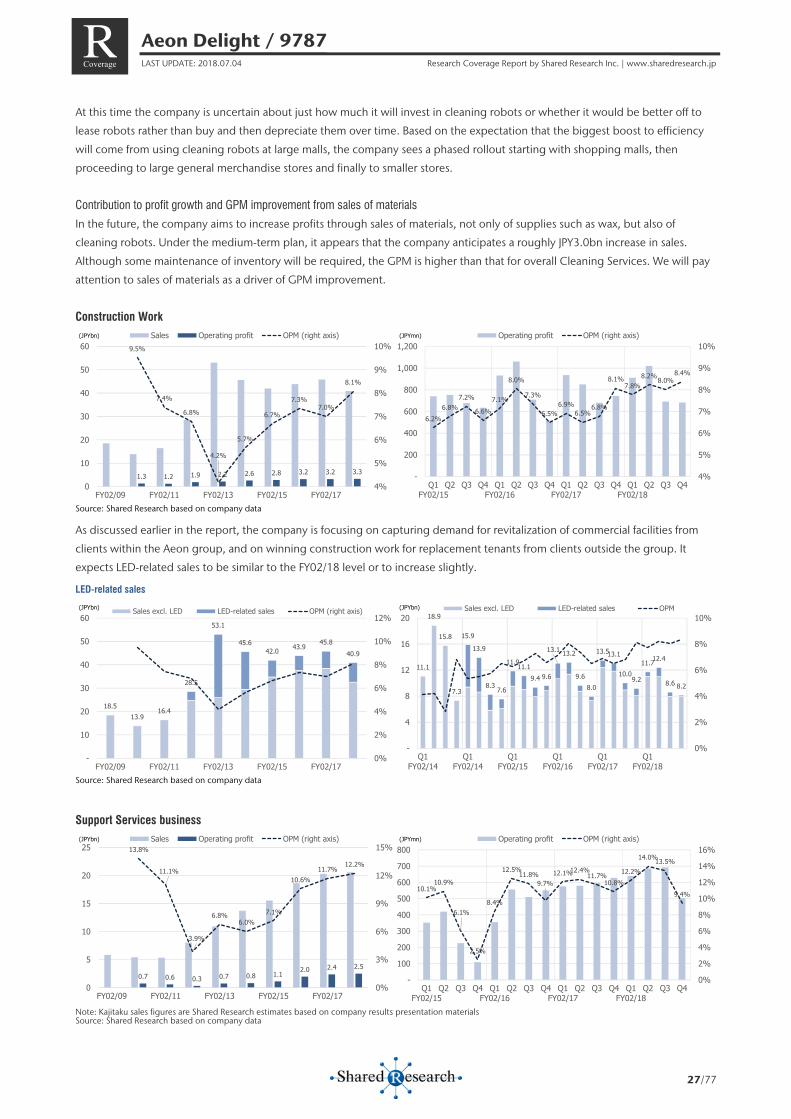
Aeon Delight / 9787 LAST UPDATE: 2018.07.04 Research Coverage Report by Shared Research Inc. | www.sharedresearch.jp
27/77
R Coverage
At this time the company is uncertain about just how much it will invest in cleaning robots or whether it would be better off to
lease robots rather than buy and then depreciate them over time. Based on the expectation that the biggest boost to efficiency
will come from using cleaning robots at large malls, the company sees a phased rollout starting with shopping malls, then
proceeding to large general merchandise stores and finally to smaller stores.
Contribution to profit growth and GPM improvement from sales of materials
In the future, the company aims to increase profits through sales of materials, not only of supplies such as wax, but also of
cleaning robots. Under the medium-term plan, it appears that the company anticipates a roughly JPY3.0bn increase in sales.
Although some maintenance of inventory will be required, the GPM is higher than that for overall Cleaning Services. We will pay
attention to sales of materials as a driver of GPM improvement.
Construction Work
Source: Shared Research based on company data
As discussed earlier in the report, the company is focusing on capturing demand for revitalization of commercial facilities from
clients within the Aeon group, and on winning construction work for replacement tenants from clients outside the group. It
expects LED-related sales to be similar to the FY02/18 level or to increase slightly.
LED-related sales
Source: Shared Research based on company data
Support Services business
Note: Kajitaku sales figures are Shared Research estimates based on company results presentation materials Source: Shared Research based on company data
6.2%6.8%
7.2%
6.6%7.1%
8.0%
7.3%
6.5%6.9%
6.5%6.8%
8.1%7.8%
8.2%8.0%8.4%
4%
5%
6%
7%
8%
9%
10%
-
200
400
600
800
1,000
1,200
Q1FY02/15
Q2 Q3 Q4 Q1FY02/16
Q2 Q3 Q4 Q1FY02/17
Q2 Q3 Q4 Q1FY02/18
Q2 Q3 Q4
Operating profit OPM (right axis)(JPYmn)
1.3 1.2 1.9 2.2 2.6 2.8 3.2 3.2 3.3
9.5%
7.4%
6.8%
4.2%
5.7%
6.7%
7.3%7.0%
8.1%
4%
5%
6%
7%
8%
9%
10%
0
10
20
30
40
50
60
FY02/09 FY02/11 FY02/13 FY02/15 FY02/17
Sales Operating profit OPM (right axis)(JPYbn)
18.513.9
16.4
28.5
53.1
45.642.0 43.9 45.8
40.9
0%
2%
4%
6%
8%
10%
12%
-
10
20
30
40
50
60
FY02/09 FY02/11 FY02/13 FY02/15 FY02/17
Sales excl. LED LED-related sales OPM (right axis)(JPYbn)
11.1
18.9
15.8
7.3
15.9
13.9
8.3 7.6
11.911.19.4 9.6
13.1 13.2
9.68.0
13.513.1
10.09.2
11.712.4
8.6 8.2
0%
2%
4%
6%
8%
10%
-
4
8
12
16
20
Q1FY02/14
Q1FY02/14
Q1FY02/15
Q1FY02/16
Q1FY02/17
Q1FY02/18
Sales excl. LED LED-related sales OPM(JPYbn)
10.1%10.9%
6.1%
2.5%
8.4%
12.5%11.8%
9.7%12.1%12.4%
11.7%10.8%
12.2%
14.0%13.5%
9.4%
0%
2%
4%
6%
8%
10%
12%
14%
16%
-
100
200
300
400
500
600
700
800
Q1FY02/15
Q2 Q3 Q4 Q1FY02/16
Q2 Q3 Q4 Q1FY02/17
Q2 Q3 Q4 Q1FY02/18
Q2 Q3 Q4
Operating profit OPM (right axis)(JPYmn)
0.7 0.6 0.3 0.7 0.8 1.1 2.0 2.4 2.5
13.8%
11.1%
3.9%
6.8%6.0%
7.1%
10.6%11.7%
12.2%
0%
3%
6%
9%
12%
15%
0
5
10
15
20
25
FY02/09 FY02/11 FY02/13 FY02/15 FY02/17
Sales Operating profit OPM (right axis)(JPYbn)

Aeon Delight / 9787 LAST UPDATE: 2018.07.04 Research Coverage Report by Shared Research Inc. | www.sharedresearch.jp
28/77
R Coverage
As shown in the accompanying figure, earnings at Support Services have been rising steadily, and, combined with its high
profitability, the proportion of consolidated operating profit accounted for by this segment has been increasing. Subsidiaries
Kajitaku and Aeon Compass were the main drivers of growth. The drivers at Kajitaku to date have been Kaji Cloud services and
small business support services (expanded introduction of ID photo machines and next-generation multi-function copy
machines), but in 2H FY02/18 small business support services saw a slowdown (reactionary falloff from the favorable performance
of ID photo machines in FY02/17), resulting in lower profit for full-year FY02/18. Aeon Delight expects higher profit in FY02/19
with the launch in earnest of online sales of Kaji Cloud (in a business alliance with VOYAGE GROUP). At Aeon Compass, the
company anticipates the drivers to be B2B businesses such as Business Travel Management (domestic business trips, support for
overseas assignments) and MICE (planning and management of meetings, seminars, trainings), which have continued to perform
strongly.
It should be noted that part of the IFM business is included in this segment.
Business alliance with VOYAGE GROUP:
On December 6, 2016, VOYAGE GROUP, Inc. (TSE: 3688) announced that it is entering a comprehensive operational tie-up for online sales of
housework support services with Kajitaku Co., Ltd., an Aeon Delight subsidiary (97.7% stake) that operates the Aeon group’s housework support
operations. VOYAGE also announced that on December 8, 2016 it will establish a wholly owned subsidiary, Voyage Nexus, to manage the online sales
of housework support services. The service launched in fall 2017.
Operational tie-up:
According to a presentation by the Ministry of Economy, Trade and Industry, the market size for home support services will be roughly JPY600bn. In the
midst of a growing market, Kajitaku bundled and sold its housework support services primarily to retailers, boosting its earnings.
Through the operational tie-up, Kajitaku will focus on developing housework support services and managing those services. Voyage Nexus will be
responsible for features on Kajitaku.com and the Members Personal Page, features that Kajitaku used to run. Voyage Nexus will also improve customer
relations and online sales by redesigning the website, making it smartphone compatible, and creating an app for the site. The company will assist in the
development of a housework support services system for the staff. The tie-up plans to leverage VOYAGE GROUP’s user base of roughly 8.4mn to
promote and market its housework support services. VOYAGE GROUP’s user base is primarily women in their 30s and 40s on the group’s websites such
as EC Navi, a point navigation site, and PeX, a point exchange platform.
Vending Machine Services
Source: Shared Research based on company data
In Vending Machine Services, we will continue to focus on the advertising business. Aeon Delight plans to proceed with the
introduction of equipped vending machines to expand the business (internal targets are 2,500 vending machines during 1H and
3,000 by the end of the financial year).
6.6%
9.4%
6.3%
11.2%
5.6%
8.8%
5.0%
15.1%
5.8%
10.6%
5.7%
11.5%
5.3%
9.6%
2.9%
7.3%
2%
4%
6%
8%
10%
12%
14%
16%
-
200
400
600
800
1,000
1,200
1,400
Q1FY02/15
Q2 Q3 Q4 Q1FY02/16
Q2 Q3 Q4 Q1FY02/17
Q2 Q3 Q4 Q1FY02/18
Q2 Q3 Q4
Operating profit OPM (right axis)(JPYmn)
1.5 2.3 2.4 3.1 3.0 2.8 2.8 2.1
8.6%
7.2%7.7%
9.2%
8.5%8.7% 8.6%
6.4%
6%
7%
8%
9%
10%
0
5
10
15
20
25
30
35
40
FY02/09 FY02/11 FY02/13 FY02/15 FY02/17
Sales Operating profit OPM (right axis)(JPYbn)
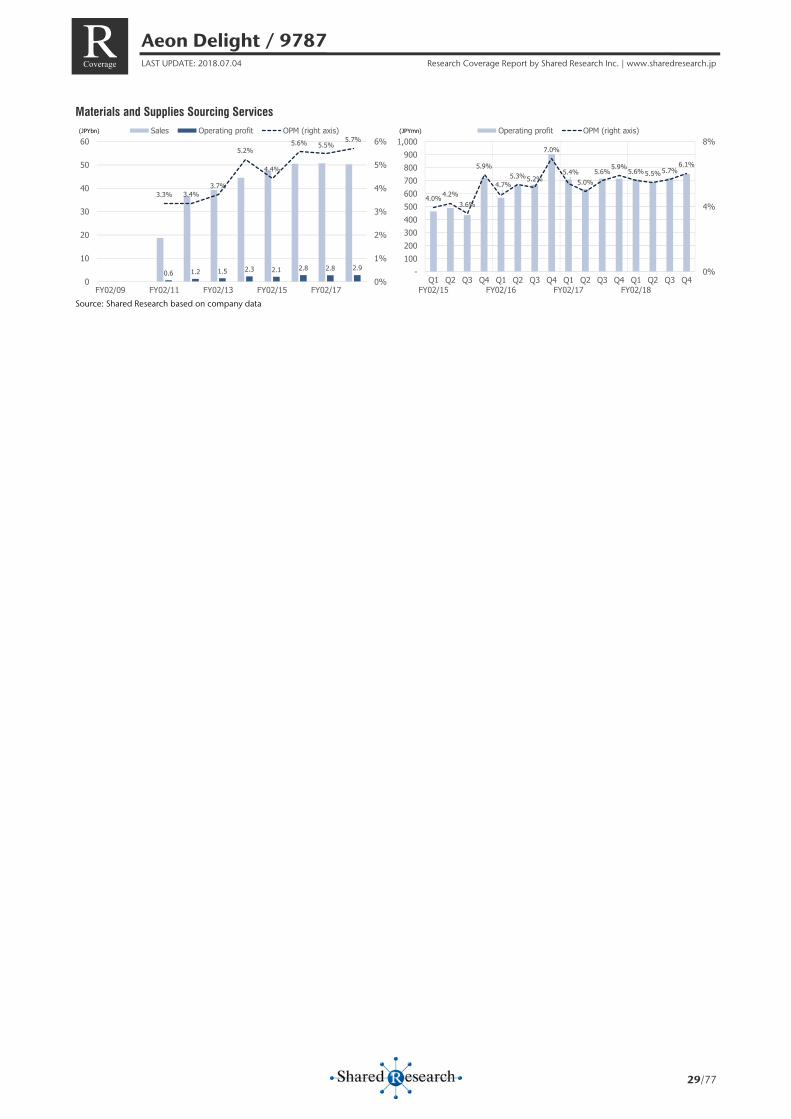
Aeon Delight / 9787 LAST UPDATE: 2018.07.04 Research Coverage Report by Shared Research Inc. | www.sharedresearch.jp
29/77
R Coverage
Materials and Supplies Sourcing Services
Source: Shared Research based on company data
4.0%4.2%3.6%
5.9%
4.7%5.3%5.2%
7.0%
5.4%5.0%
5.6%5.9%5.6%5.5%5.7%
6.1%
0%
4%
8%
-100200300400500600700800900
1,000
Q1FY02/15
Q2 Q3 Q4 Q1FY02/16
Q2 Q3 Q4 Q1FY02/17
Q2 Q3 Q4 Q1FY02/18
Q2 Q3 Q4
Operating profit OPM (right axis)(JPYmn)
0.6 1.2 1.5 2.3 2.1 2.8 2.8 2.9
3.3% 3.4%3.7%
5.2%
4.4%
5.6% 5.5%5.7%
0%
1%
2%
3%
4%
5%
6%
0
10
20
30
40
50
60
FY02/09 FY02/11 FY02/13 FY02/15 FY02/17
Sales Operating profit OPM (right axis)(JPYbn)

Aeon Delight / 9787 LAST UPDATE: 2018.07.04 Research Coverage Report by Shared Research Inc. | www.sharedresearch.jp
30/77
R Coverage
Reference: Previous medium-term plan (released April 2014)
The company’s views on increasing sales by JPY73.0bn in FY02/14 M&A not included
The new medium-term plan calls for an over JPY73.0 increase in sales compared to FY02/14. Approximately one-third of the
JPY100.0bn sales increase in the previous medium-term plan was composed of M&A activity. However, the new plan does not
include any M&A, and instead is focused on digging deeper into existing revenue sources.
Domestic Aeon group: 1/3; Overseas: 1/3; Domestic, excluding Aeon group: 1/3
Although specific figures have not been disclosed, Aeon Delight expects approximately 1/3 of the increase in sales to come from
sales toward the domestic Aeon group, 1/3 to come from overseas (including overseas Aeon group companies), and the
remaining 1/3 to come from domestic sales, excluding Aeon group companies.
Sales toward domestic Aeon group companies
Aeon Delight believes that there is about JPY50.0bn of potential for contracts with domestic Aeon group companies. In order to
acquire these contracts, the company is in the process of an organizational restructuring, which includes forming a special sales
department that will specifically target the Aeon group. Sales were concentrated primarily on large group companies in the past,
and other medium and small sized companies were not given adequate amounts of attention. Aeon Delight hopes to capitalize
on these previously untapped group companies.
Higher overseas sales: aiming to be Asia’s number one company Number of overseas facilities contracts acquired
Source: Shared Research based on company data
In the Asian market, the company has established a presence in China and ASEAN nations, and is seeking JPY30.0bn in sales from
these areas by FY02/17. The above areas accounted for about 2% of sales in FY02/14. The numbers of facilities sourced to Aeon
Delight were: China, 136; Malaysia, 45; Vietnam, 23. China is the dominant contributor to sales at this time, but the company
plans to increase sales by at least JPY10.0bn each in both China and the collective ASEAN nations.
Although competition is heating up in emerging markets with overseas companies ISS (CPH: ISS) and SODEXO (EPA: SW),
consistent population expansion in urban centers is allowing the Aeon group to maintain its momentum in shifting focus to Asia.
Aeon group plans investment of JPY400.0bn over three years ending in FY02/17
The Aeon group plans to invest JPY400.0bn over the three years ending in FY02/17 to open large shopping centers (SCs) in Asian
countries such as China, Vietnam, and Indonesia. Aeon Delight is aiming to capture opportunities for its integrated FMS business,
and believes that the Aeon group’s investments will provide further opportunities for overseas sales growth.
-
50
100
150
200
250
Q1 FY02/12 Q2 Q3 Q4 Q1 FY02/13 Q2 Q3 Q4 Q1 FY02/14 Q2 Q3 Q4 Q1 FY02/15
China Malaysia Vietnam

Aeon Delight / 9787 LAST UPDATE: 2018.07.04 Research Coverage Report by Shared Research Inc. | www.sharedresearch.jp
31/77
R Coverage
Establishing a federalized management structure in China and an integrated FMS menu in the ASEAN region
During the previous medium-term plan, the company strengthened its business fundamentals through acquisitions of promising
local firms in China and the ASEAN nations. Two focal points of the new medium-term plan is establishing a federalized
management structure in China, and an integrated FMS menu in the ASEAN region.
Under the medium-term plan, Aeon Delight will continue to press forward with its strategy of acquiring promising local firms. In
addition to current acquisitions in Beijing, Tianjin, Jiangsu, Hubei, and Guangdong, preparations are underway to expand into
Shandong. Since the 2007 establishment of a local office in Beijing, the company has expanded its business through M&A and
partnerships with major players in local markets, and the company is moving to further solidify this strategy.
Expansion in China will revolve around the company differentiating itself via strengths in areas such as the ESCO business and
elevator business. China is the world’s largest market for elevators, and the company is prepped to make inroads thanks to its
acquisition of one of the largest elevator manufacturers in Jiangsu.
As a percentage of sales, the company’s sales activities in the ASEAN region still represent only a small amount. Although the
medium-term plan includes sales to Aeon group companies, the company forecasts an increase in sales for the collective
countries on par with the forecasted sales increase in China. Specifically, Aeon Delight will aim to become the market leader in
the three businesses of cleaning services, vending machines, and energy conservation in Malaysia. In Vietnam, the company will
enhance its services lineup and bolster its sales activities to both Japanese and foreign firms. Plans are also in place for expansion
into Cambodia, Singapore, and Indonesia.
Domestic sales excluding the Aeon group: 35% of sales to outside of the Aeon group by FY02/17 As of FY02/14, the percentage of sales that occurs outside of the Aeon group was 31%. Aeon Delight aims to raise this figure to
35% by the end of FY02/17, and to 40% over the long term. Players in the integrated FMS market outside of the Aeon group have
not solidified, and there remains room for the company to enter the market with its unique expertise. Aeon Delight will continue
to expand its reach in acquiring new contracts with hotels and hospitals, much as it did in FY02/14.
The company is working to prevent employees from becoming overly accustomed to working on projects for the Aeon group. To
foster this culture, Aeon Delight is driving momentum in acquiring market share outside of the Aeon group. To this end, the
company also plans to restructure fundamental business principles such as sales, business development, employee training, and
IT investment.
Establishing integrated FMS (Creating competitive advantages) One of the focal points of the medium-term plan is establishing integrated FMS and creating competitive advantages. In order to
find new opportunities for growth, the plan calls for concentration of management resources in the cleaning services and energy
solutions businesses. Although a degree of uncertainty exists in the environment surrounding integrated FMS owing to expansion
of large western FM firms into Japan for the 2020 Tokyo Olympic Games, demand is strong. New sources of demand are led by
hospitals and nursing care facilities.
Strengthening the cleaning services business
In FY02/14, the cleaning services business saw sales of JPY42.3bn (16.5% of total sales), operating profit of JPY5.7bn (25%,
excluding eliminations, amortization of goodwill, and corporate expenses), and operating profit margin of 13.5%. The company
is aiming to generate sales in excess of JPY180.0bn in FY02/21 (including M&A). Aeon Delight values the current domestic market
at JPY1.3tn, and although it does not expect any significant growth in the market size, the company will increase sales via
expanding its market share to over 10%.
To accomplish this, the company will expand into new areas, and establish a standardized cleaning model. Primary focal points
for new areas will be hospitals and nursing care facilities. Major groups with nationwide hospital networks are eager to implement
management reforms, and Aeon Delight believes that integrated FMS is a good fit to match these customers’ needs in improving
sanitation, environmental conditions, safety, peace of mind, service improvement, and cost reductions.
Aeon Delight / 9787 LAST UPDATE: 2018.07.04 Research Coverage Report by Shared Research Inc. | www.sharedresearch.jp
32/77
R Coverage
Expanding into new areas: taking on major nationwide hospital groups
Through the organizational restructuring described below in FY02/15, the company has created a framework to tackle different
industries, such as hospitals, with differing strategies for each. It has also changed its marketing approach from a product out
model, in which the company touts the superiority of its products, to a market in model, in which the company adjusts its
products to meet the needs of the market. Budgets are also no longer set at business headquarters, but are set based on
proposals from individual sales departments, which are more in tune with the unique needs of each customer and market.
Expanding into new areas: Developing service options through cooperation with European manufacturers
To accelerate the fleshing out of its business offerings, the company will also further develop service options in cooperation with
European manufacturers and health care departments of major domestic trading firms. For instance, when expanding into
hospitals and nursing care facilities, disinfecting and sterilization techniques are essential. Aeon Delight does not hesitate to
partner with European firms and universities, which harbor advanced technology in areas such as these. The company states that
it has already partnered with a Swiss university. Although M&A will be an essential component of reaching JPY180.0bn in sales by
FY02/21, it appears that the company has already determined, to an extent, targets for future alliances.
Improving gross profit margin by establishing a standardized cleaning model
Aeon Delight has set a goal of improving the gross profit margin of its cleaning services business over 10% by FY02/21.
Developing high value-added services is an integral component, but the company believes that improvements to its cost
structure will yield the largest gains. The cleaning services business is the segment with the highest operating profit margin
(13.5% in FY02/14), but the company believes that there is still room for improvement.
To this end, the company is aiming, for the second time, to develop a standardization model (standardized quality based upon
the optimal amount of labor input). An attempt was made in FY02/10, but after four years of use, its utility decreased, and a
reassessment was deemed necessary.
Between 80-90% of sales are outsourced to external firms, and Aeon Delight is only directly involved with 10-20%. However, the
profit composition is over 20%, and there is a large variation in margins between different offices. As such, the company decided
to share its expertise with its outsourcing partners on methods to achieve high margins. The company also improved cost
structures at its internal offices that were suffering from low margins. Through the above efforts, Aeon Delight expects its gross
profit margin to rise. By increasing productivity for the roughly 30,000 persons employed in its cleaning services, the company
will improve profitability as a whole. By reassessing its cost of sales on a fundamental level, the process has already begun at 93
directly operated locations. SR will keep watch on how these initiatives progress throughout FY02/15 and FY02/16.
Strengthening the energy solutions business
In the energy solutions business, the company seeks to establish a proprietary combined facilities management ESCO business
and be a comprehensive manager of energy across the Aeon group. During the duration of the medium-term plan, sales of
JPY10.0bn are expected from the ESCO business. Plans to join with other companies in developing a business selling electricity
are also under consideration, ahead of expected liberalization of the electricity market in 2016.
ESCO business
The ESCO business will be increasingly integrated into the combined facilities management ESCO business. Although
competition is fierce, the company has strengths in its energy conservation technologies in building maintenance. Without
merely stopping with installation of control equipment, the company stated that energy savings of 10-15% are possible through
addition of its unique facilities management expertise. Aeon Delight aims to expand its business by leveraging strengths such as
those above.
Energy management for the Aeon group
According to Aeon’s environmental sustainability report, a combined 2,113mn kWh was utilized in FY02/13 by Aeon Retail, six
MaxValu companies, Aeon Super Center, and Aeon Big. Assuming a rate of JPY22 per kWh, this equates to JPY46.5bn in electrical
Aeon Delight / 9787 LAST UPDATE: 2018.07.04 Research Coverage Report by Shared Research Inc. | www.sharedresearch.jp
33/77
R Coverage
costs for the year. Adding electrical fees for other group companies will increase this figure even further, and at the Aeon group’s
FY02/14 results presentation, electricity costs for the group were stated to be in excess of JPY80.0bn (within the Kansai Electric
Power [TSE1:9503] area, Aeon’s power usage is second only to the West Japan Railway Company [TSE1:9021]). Through
management of this extremely high amount of electrical use, the Aeon Delight will not only be able to reduce the Aeon group’s
electrical footprint, but also expand and acquire expertise.
Responding to ISO41000, the international standard in the facilities management industry
ISO announced in the first half of 2015 that it would develop a new international standard for facilities management
(FM)—ISO41000. The new standard will make possible standardized FM services worldwide.
With the spread of ISO41000 and ISO18480, contract with clients will shift to SLA (service level agreement). This means that
contract based on service quality and results is expected to be the mainstream, replacing the conventional contract based on the
number of workers, hours, and shifts. Aeon Delight has proactively begun adjusting to ISO18480, a preliminary step to ISO41000,
and has already incorporated its content to the company’s FM services. Shared Research thinks such a proactive response to
ISO41000 may well result in a competitive edge over the medium to long term.
Building an organizational base To successfully implement the above initiatives outlined in the medium-term plan, building an organizational base is outlined as
one of the top priorities. The following three points are seen as focal points:
▷ Active business development and organizational restructuring with solutions-based sales in mind;
▷ HR development with an emphasis on service quality;
▷ IT investment to realize corporate growth and a small headquarters.
In order to proceed with the cleaning services and energy solutions businesses as stated above, the company will consolidate and
restructure its organizational structure, creating a sales structure that is specialized to each customer and industry. The process
began in FY02/15, and Aeon Delight is aiming to develop a market in business model that is in tune with customer needs.
Additionally, approximately JPY3.0bn of investment in IT is planned over the three years of the medium-term plan. Investments
will be used to develop tools and systems for the cleaning services and energy solutions businesses, which will in turn drive
acceleration of the development of the company as a whole.
Aeon Delight / 9787 LAST UPDATE: 2018.07.04 Research Coverage Report by Shared Research Inc. | www.sharedresearch.jp
34/77
R Coverage
Business
Business description Aeon Delight provides maintenance services for retail facilities and office buildings. The company, formerly known as Japan
Maintenance (a subsidiary of MyCal Corp.), was established mainly to undertake maintenance at Mycal stores in November 1972.
Mycal filed for bankruptcy in September 2001 (delisted on September 17, 2001), and became a subsidiary of Aeon in 2003. Japan
Maintenance merged with Aeon Techno Service and the name was changed to Aeon Delight in September 2006. As of FY02/13,
the company derives 60-70% of sales from Aeon Retail Co., Ltd. and other Aeon group companies.
Aeon Delight handles between 80% and 90% of the facilities management work required by Aeon Retail, and about 65% of such
work required by Aeon Mall Co., Ltd. (TSE1: 8905). Facilities management work at Aeon Mall was previously done by a subsidiary
of Diamond City, a Mitsubishi Corp. (TSE1: 8058) affiliate absorbed by Aeon Mall in 2007. The company is aiming to increase the
share of work handled for Aeon Mall by following its overseas expansion in recent years and keeping a close relationship. Aeon
Delight also handles between 60% and 70% of the facilities management work at MaxValu retail stores owned the Aeon.
M&A activities
Aeon Delight has pursued growth through acquisitions, with aggressive acquisitions overseas in particular in recent years. It has
also proceeded with the establishment of subsidiaries through alliances with other companies and in 2018 announced
collaboration with SECOM to create a new business model for small and medium facilities.
Business model
Aeon Delight became a leading integrated facilities management operator through its relationship with the Aeon group. It has
also grown through acquisitions. The company derives its earnings by providing an integrated, all-in-one package of facilities
management services to large retail and commercial properties. It was able to differentiate itself from competitors by its expertise
and costs competitiveness. Competitors included Tokyu Community Corp. (TSE1: 4711), Biru Daiko Co., Ltd., Nihon Housing Co.,
Ltd. (TSE1: 4781), and Nippon Kanzai Co., Ltd. (TSE1: 9728).
There are three type of property management, residential, commercial, and office buildings. Most of these competitors were
mainly involved in residential management of condominiums. Few other large companies were focused on commercial facilities
and building management due the high costs involved.
The company was able to gain expertise in commercial property management through servicing large retail facilities such as
shopping malls and supermarkets. The property maintenance industry includes over 5,000 companies, most of which are small-
and medium-sized businesses.
The structure of the building maintenance industry resembles that of the construction industry, with second- and third-tier
subcontractors working under prime contractors. Aeon Delight, a prime contractor, uses a number of subcontractors. Most of its
contracts are signed on an annual basis, which are almost always renewed. In other words, it has a recurring-revenue structure.
The company renegotiates contracts once a year, a process that regularly challenges its pricing, quality, and ability to offer clients
attractive packages. For example, the parent company Aeon conducts a competitive bidding to keep the process fair and open.
However, Aeon Delight is able to provide competitive bids given its knowledge of the client’s needs, and know-how. Its superior
position as a large company with comprehensive reliable services will be further enhanced as the size of buildings expands. The
company is able to handle large facilities maintenance given its size and economy of scale, which further reinforces its strength
and position. Thus, Shared Research believes that Aeon Delight’s position within the commercial facilities industry is likely to
improve, as the company has know-how and expertise.
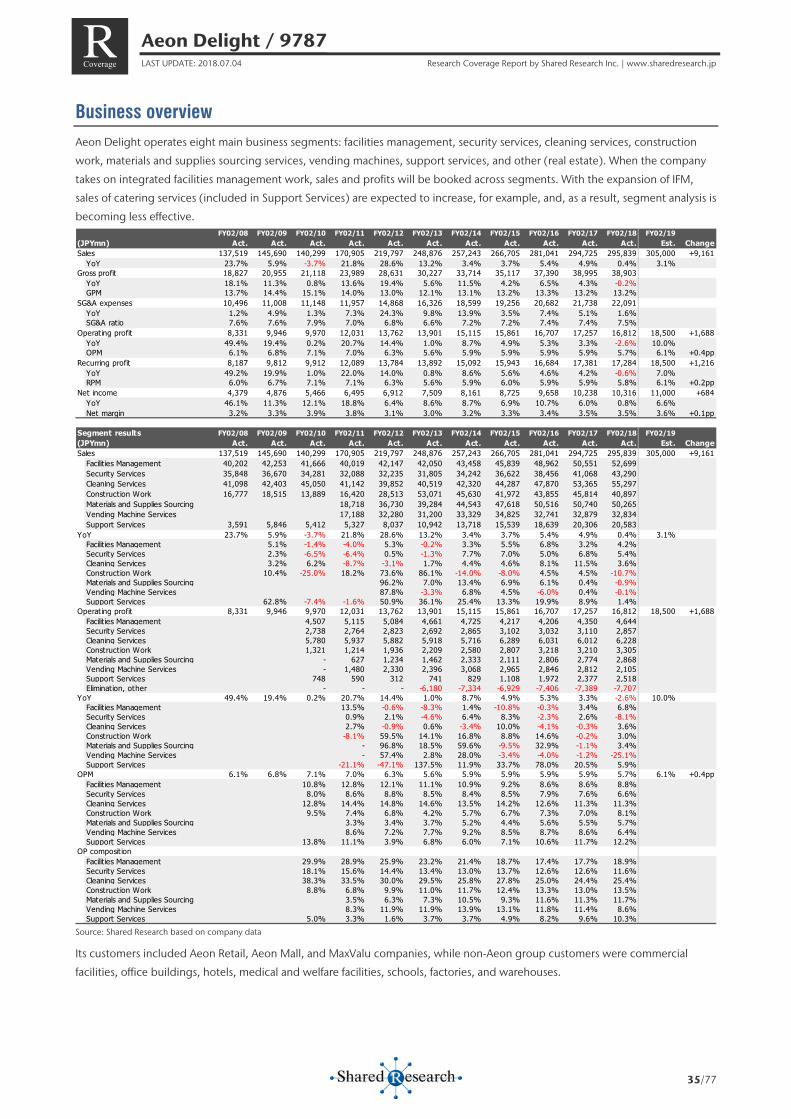
Aeon Delight / 9787 LAST UPDATE: 2018.07.04 Research Coverage Report by Shared Research Inc. | www.sharedresearch.jp
35/77
R Coverage
Business overview Aeon Delight operates eight main business segments: facilities management, security services, cleaning services, construction
work, materials and supplies sourcing services, vending machines, support services, and other (real estate). When the company
takes on integrated facilities management work, sales and profits will be booked across segments. With the expansion of IFM,
sales of catering services (included in Support Services) are expected to increase, for example, and, as a result, segment analysis is
becoming less effective.
Source: Shared Research based on company data
Its customers included Aeon Retail, Aeon Mall, and MaxValu companies, while non-Aeon group customers were commercial
facilities, office buildings, hotels, medical and welfare facilities, schools, factories, and warehouses.
FY02/08 FY02/09 FY02/10 FY02/11 FY02/12 FY02/13 FY02/14 FY02/15 FY02/16 FY02/17 FY02/18 FY02/19(JPYmn) Act. Act. Act. Act. Act. Act. Act. Act. Act. Act. Act. Est. ChangeSales 137,519 145,690 140,299 170,905 219,797 248,876 257,243 266,705 281,041 294,725 295,839 305,000 +9,161
YoY 23.7% 5.9% -3.7% 21.8% 28.6% 13.2% 3.4% 3.7% 5.4% 4.9% 0.4% 3.1% Gross profit 18,827 20,955 21,118 23,989 28,631 30,227 33,714 35,117 37,390 38,995 38,903
YoY 18.1% 11.3% 0.8% 13.6% 19.4% 5.6% 11.5% 4.2% 6.5% 4.3% -0.2% GPM 13.7% 14.4% 15.1% 14.0% 13.0% 12.1% 13.1% 13.2% 13.3% 13.2% 13.2%
SG&A expenses 10,496 11,008 11,148 11,957 14,868 16,326 18,599 19,256 20,682 21,738 22,091 YoY 1.2% 4.9% 1.3% 7.3% 24.3% 9.8% 13.9% 3.5% 7.4% 5.1% 1.6% SG&A ratio 7.6% 7.6% 7.9% 7.0% 6.8% 6.6% 7.2% 7.2% 7.4% 7.4% 7.5%
Operating profit 8,331 9,946 9,970 12,031 13,762 13,901 15,115 15,861 16,707 17,257 16,812 18,500 +1,688YoY 49.4% 19.4% 0.2% 20.7% 14.4% 1.0% 8.7% 4.9% 5.3% 3.3% -2.6% 10.0% OPM 6.1% 6.8% 7.1% 7.0% 6.3% 5.6% 5.9% 5.9% 5.9% 5.9% 5.7% 6.1% +0.4pp
Recurring profit 8,187 9,812 9,912 12,089 13,784 13,892 15,092 15,943 16,684 17,381 17,284 18,500 +1,216YoY 49.2% 19.9% 1.0% 22.0% 14.0% 0.8% 8.6% 5.6% 4.6% 4.2% -0.6% 7.0% RPM 6.0% 6.7% 7.1% 7.1% 6.3% 5.6% 5.9% 6.0% 5.9% 5.9% 5.8% 6.1% +0.2pp
Net income 4,379 4,876 5,466 6,495 6,912 7,509 8,161 8,725 9,658 10,238 10,316 11,000 +684YoY 46.1% 11.3% 12.1% 18.8% 6.4% 8.6% 8.7% 6.9% 10.7% 6.0% 0.8% 6.6% Net margin 3.2% 3.3% 3.9% 3.8% 3.1% 3.0% 3.2% 3.3% 3.4% 3.5% 3.5% 3.6% +0.1pp
Segment results FY02/08 FY02/09 FY02/10 FY02/11 FY02/12 FY02/13 FY02/14 FY02/15 FY02/16 FY02/17 FY02/18 FY02/19(JPYmn) Act. Act. Act. Act. Act. Act. Act. Act. Act. Act. Act. Est. ChangeSales 137,519 145,690 140,299 170,905 219,797 248,876 257,243 266,705 281,041 294,725 295,839 305,000 +9,161
Facilit ies Management 40,202 42,253 41,666 40,019 42,147 42,050 43,458 45,839 48,962 50,551 52,699Security Services 35,848 36,670 34,281 32,088 32,235 31,805 34,242 36,622 38,456 41,068 43,290Cleaning Services 41,098 42,403 45,050 41,142 39,852 40,519 42,320 44,287 47,870 53,365 55,297Construction Work 16,777 18,515 13,889 16,420 28,513 53,071 45,630 41,972 43,855 45,814 40,897Materials and Supplies Sourcing 18,718 36,730 39,284 44,543 47,618 50,516 50,740 50,265Vending Machine Services 17,188 32,280 31,200 33,329 34,825 32,741 32,879 32,834Support Services 3,591 5,846 5,412 5,327 8,037 10,942 13,718 15,539 18,639 20,306 20,583
YoY 23.7% 5.9% -3.7% 21.8% 28.6% 13.2% 3.4% 3.7% 5.4% 4.9% 0.4% 3.1%Facilit ies Management 5.1% -1.4% -4.0% 5.3% -0.2% 3.3% 5.5% 6.8% 3.2% 4.2%Security Services 2.3% -6.5% -6.4% 0.5% -1.3% 7.7% 7.0% 5.0% 6.8% 5.4%Cleaning Services 3.2% 6.2% -8.7% -3.1% 1.7% 4.4% 4.6% 8.1% 11.5% 3.6%Construction Work 10.4% -25.0% 18.2% 73.6% 86.1% -14.0% -8.0% 4.5% 4.5% -10.7%Materials and Supplies Sourcing 96.2% 7.0% 13.4% 6.9% 6.1% 0.4% -0.9%Vending Machine Services 87.8% -3.3% 6.8% 4.5% -6.0% 0.4% -0.1%Support Services 62.8% -7.4% -1.6% 50.9% 36.1% 25.4% 13.3% 19.9% 8.9% 1.4%
Operating profit 8,331 9,946 9,970 12,031 13,762 13,901 15,115 15,861 16,707 17,257 16,812 18,500 +1,688Facilit ies Management 4,507 5,115 5,084 4,661 4,725 4,217 4,206 4,350 4,644Security Services 2,738 2,764 2,823 2,692 2,865 3,102 3,032 3,110 2,857Cleaning Services 5,780 5,937 5,882 5,918 5,716 6,289 6,031 6,012 6,228Construction Work 1,321 1,214 1,936 2,209 2,580 2,807 3,218 3,210 3,305Materials and Supplies Sourcing - 627 1,234 1,462 2,333 2,111 2,806 2,774 2,868Vending Machine Services - 1,480 2,330 2,396 3,068 2,965 2,846 2,812 2,105Support Services 748 590 312 741 829 1,108 1,972 2,377 2,518Elimination, other - - - -6,180 -7,334 -6,929 -7,406 -7,389 -7,707
YoY 49.4% 19.4% 0.2% 20.7% 14.4% 1.0% 8.7% 4.9% 5.3% 3.3% -2.6% 10.0%Facilit ies Management 13.5% -0.6% -8.3% 1.4% -10.8% -0.3% 3.4% 6.8%Security Services 0.9% 2.1% -4.6% 6.4% 8.3% -2.3% 2.6% -8.1%Cleaning Services 2.7% -0.9% 0.6% -3.4% 10.0% -4.1% -0.3% 3.6%Construction Work -8.1% 59.5% 14.1% 16.8% 8.8% 14.6% -0.2% 3.0%Materials and Supplies Sourcing - 96.8% 18.5% 59.6% -9.5% 32.9% -1.1% 3.4%Vending Machine Services - 57.4% 2.8% 28.0% -3.4% -4.0% -1.2% -25.1%Support Services -21.1% -47.1% 137.5% 11.9% 33.7% 78.0% 20.5% 5.9%
OPM 6.1% 6.8% 7.1% 7.0% 6.3% 5.6% 5.9% 5.9% 5.9% 5.9% 5.7% 6.1% +0.4ppFacilit ies Management 10.8% 12.8% 12.1% 11.1% 10.9% 9.2% 8.6% 8.6% 8.8%Security Services 8.0% 8.6% 8.8% 8.5% 8.4% 8.5% 7.9% 7.6% 6.6%Cleaning Services 12.8% 14.4% 14.8% 14.6% 13.5% 14.2% 12.6% 11.3% 11.3%Construction Work 9.5% 7.4% 6.8% 4.2% 5.7% 6.7% 7.3% 7.0% 8.1%Materials and Supplies Sourcing 3.3% 3.4% 3.7% 5.2% 4.4% 5.6% 5.5% 5.7%Vending Machine Services 8.6% 7.2% 7.7% 9.2% 8.5% 8.7% 8.6% 6.4%Support Services 13.8% 11.1% 3.9% 6.8% 6.0% 7.1% 10.6% 11.7% 12.2%
OP composition Facilit ies Management 29.9% 28.9% 25.9% 23.2% 21.4% 18.7% 17.4% 17.7% 18.9%Security Services 18.1% 15.6% 14.4% 13.4% 13.0% 13.7% 12.6% 12.6% 11.6%Cleaning Services 38.3% 33.5% 30.0% 29.5% 25.8% 27.8% 25.0% 24.4% 25.4%Construction Work 8.8% 6.8% 9.9% 11.0% 11.7% 12.4% 13.3% 13.0% 13.5%Materials and Supplies Sourcing 3.5% 6.3% 7.3% 10.5% 9.3% 11.6% 11.3% 11.7%Vending Machine Services 8.3% 11.9% 11.9% 13.9% 13.1% 11.8% 11.4% 8.6%Support Services 5.0% 3.3% 1.6% 3.7% 3.7% 4.9% 8.2% 9.6% 10.3%
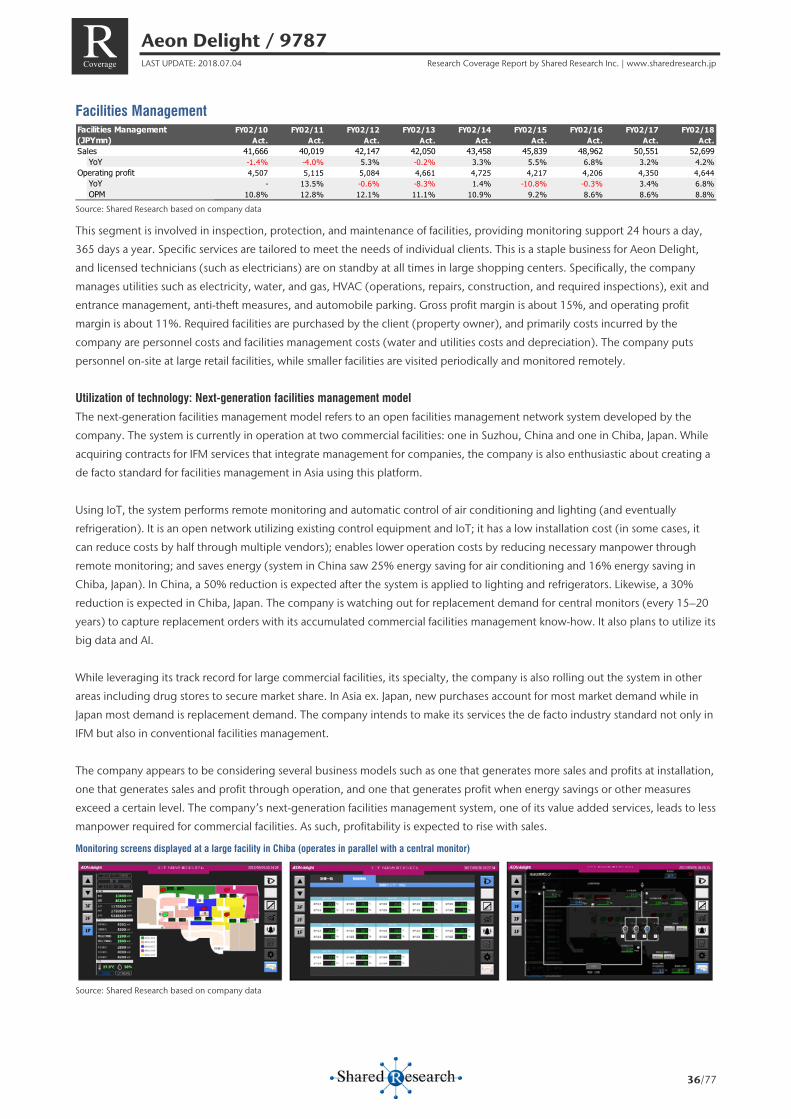
Aeon Delight / 9787 LAST UPDATE: 2018.07.04 Research Coverage Report by Shared Research Inc. | www.sharedresearch.jp
36/77
R Coverage
Facilities Management
Source: Shared Research based on company data
This segment is involved in inspection, protection, and maintenance of facilities, providing monitoring support 24 hours a day,
365 days a year. Specific services are tailored to meet the needs of individual clients. This is a staple business for Aeon Delight,
and licensed technicians (such as electricians) are on standby at all times in large shopping centers. Specifically, the company
manages utilities such as electricity, water, and gas, HVAC (operations, repairs, construction, and required inspections), exit and
entrance management, anti-theft measures, and automobile parking. Gross profit margin is about 15%, and operating profit
margin is about 11%. Required facilities are purchased by the client (property owner), and primarily costs incurred by the
company are personnel costs and facilities management costs (water and utilities costs and depreciation). The company puts
personnel on-site at large retail facilities, while smaller facilities are visited periodically and monitored remotely.
Utilization of technology: Next-generation facilities management model
The next-generation facilities management model refers to an open facilities management network system developed by the
company. The system is currently in operation at two commercial facilities: one in Suzhou, China and one in Chiba, Japan. While
acquiring contracts for IFM services that integrate management for companies, the company is also enthusiastic about creating a
de facto standard for facilities management in Asia using this platform.
Using IoT, the system performs remote monitoring and automatic control of air conditioning and lighting (and eventually
refrigeration). It is an open network utilizing existing control equipment and IoT; it has a low installation cost (in some cases, it
can reduce costs by half through multiple vendors); enables lower operation costs by reducing necessary manpower through
remote monitoring; and saves energy (system in China saw 25% energy saving for air conditioning and 16% energy saving in
Chiba, Japan). In China, a 50% reduction is expected after the system is applied to lighting and refrigerators. Likewise, a 30%
reduction is expected in Chiba, Japan. The company is watching out for replacement demand for central monitors (every 15–20
years) to capture replacement orders with its accumulated commercial facilities management know-how. It also plans to utilize its
big data and AI.
While leveraging its track record for large commercial facilities, its specialty, the company is also rolling out the system in other
areas including drug stores to secure market share. In Asia ex. Japan, new purchases account for most market demand while in
Japan most demand is replacement demand. The company intends to make its services the de facto industry standard not only in
IFM but also in conventional facilities management.
The company appears to be considering several business models such as one that generates more sales and profits at installation,
one that generates sales and profit through operation, and one that generates profit when energy savings or other measures
exceed a certain level. The company’s next-generation facilities management system, one of its value added services, leads to less
manpower required for commercial facilities. As such, profitability is expected to rise with sales.
Monitoring screens displayed at a large facility in Chiba (operates in parallel with a central monitor)
Source: Shared Research based on company data
Facilities Management FY02/10 FY02/11 FY02/12 FY02/13 FY02/14 FY02/15 FY02/16 FY02/17 FY02/18(JPYmn) Act. Act. Act. Act. Act. Act. Act. Act. Act.Sales 41,666 40,019 42,147 42,050 43,458 45,839 48,962 50,551 52,699
YoY -1.4% -4.0% 5.3% -0.2% 3.3% 5.5% 6.8% 3.2% 4.2%Operating profit 4,507 5,115 5,084 4,661 4,725 4,217 4,206 4,350 4,644
YoY - 13.5% -0.6% -8.3% 1.4% -10.8% -0.3% 3.4% 6.8%OPM 10.8% 12.8% 12.1% 11.1% 10.9% 9.2% 8.6% 8.6% 8.8%
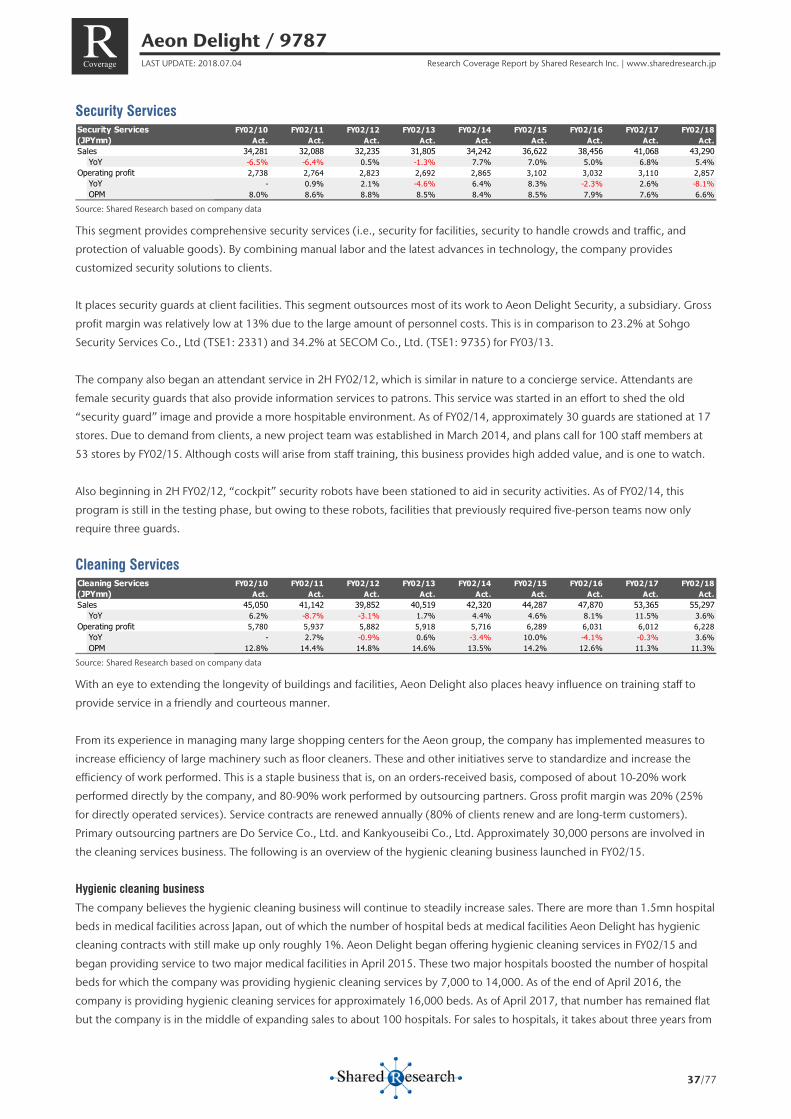
Aeon Delight / 9787 LAST UPDATE: 2018.07.04 Research Coverage Report by Shared Research Inc. | www.sharedresearch.jp
37/77
R Coverage
Security Services
Source: Shared Research based on company data
This segment provides comprehensive security services (i.e., security for facilities, security to handle crowds and traffic, and
protection of valuable goods). By combining manual labor and the latest advances in technology, the company provides
customized security solutions to clients.
It places security guards at client facilities. This segment outsources most of its work to Aeon Delight Security, a subsidiary. Gross
profit margin was relatively low at 13% due to the large amount of personnel costs. This is in comparison to 23.2% at Sohgo
Security Services Co., Ltd (TSE1: 2331) and 34.2% at SECOM Co., Ltd. (TSE1: 9735) for FY03/13.
The company also began an attendant service in 2H FY02/12, which is similar in nature to a concierge service. Attendants are
female security guards that also provide information services to patrons. This service was started in an effort to shed the old
“security guard” image and provide a more hospitable environment. As of FY02/14, approximately 30 guards are stationed at 17
stores. Due to demand from clients, a new project team was established in March 2014, and plans call for 100 staff members at
53 stores by FY02/15. Although costs will arise from staff training, this business provides high added value, and is one to watch.
Also beginning in 2H FY02/12, “cockpit” security robots have been stationed to aid in security activities. As of FY02/14, this
program is still in the testing phase, but owing to these robots, facilities that previously required five-person teams now only
require three guards.
Cleaning Services
Source: Shared Research based on company data
With an eye to extending the longevity of buildings and facilities, Aeon Delight also places heavy influence on training staff to
provide service in a friendly and courteous manner.
From its experience in managing many large shopping centers for the Aeon group, the company has implemented measures to
increase efficiency of large machinery such as floor cleaners. These and other initiatives serve to standardize and increase the
efficiency of work performed. This is a staple business that is, on an orders-received basis, composed of about 10-20% work
performed directly by the company, and 80-90% work performed by outsourcing partners. Gross profit margin was 20% (25%
for directly operated services). Service contracts are renewed annually (80% of clients renew and are long-term customers).
Primary outsourcing partners are Do Service Co., Ltd. and Kankyouseibi Co., Ltd. Approximately 30,000 persons are involved in
the cleaning services business. The following is an overview of the hygienic cleaning business launched in FY02/15.
Hygienic cleaning business
The company believes the hygienic cleaning business will continue to steadily increase sales. There are more than 1.5mn hospital
beds in medical facilities across Japan, out of which the number of hospital beds at medical facilities Aeon Delight has hygienic
cleaning contracts with still make up only roughly 1%. Aeon Delight began offering hygienic cleaning services in FY02/15 and
began providing service to two major medical facilities in April 2015. These two major hospitals boosted the number of hospital
beds for which the company was providing hygienic cleaning services by 7,000 to 14,000. As of the end of April 2016, the
company is providing hygienic cleaning services for approximately 16,000 beds. As of April 2017, that number has remained flat
but the company is in the middle of expanding sales to about 100 hospitals. For sales to hospitals, it takes about three years from
Security Services FY02/10 FY02/11 FY02/12 FY02/13 FY02/14 FY02/15 FY02/16 FY02/17 FY02/18(JPYmn) Act. Act. Act. Act. Act. Act. Act. Act. Act.Sales 34,281 32,088 32,235 31,805 34,242 36,622 38,456 41,068 43,290
YoY -6.5% -6.4% 0.5% -1.3% 7.7% 7.0% 5.0% 6.8% 5.4%Operating profit 2,738 2,764 2,823 2,692 2,865 3,102 3,032 3,110 2,857
YoY - 0.9% 2.1% -4.6% 6.4% 8.3% -2.3% 2.6% -8.1%OPM 8.0% 8.6% 8.8% 8.5% 8.4% 8.5% 7.9% 7.6% 6.6%
Cleaning Services FY02/10 FY02/11 FY02/12 FY02/13 FY02/14 FY02/15 FY02/16 FY02/17 FY02/18(JPYmn) Act. Act. Act. Act. Act. Act. Act. Act. Act.Sales 45,050 41,142 39,852 40,519 42,320 44,287 47,870 53,365 55,297
YoY 6.2% -8.7% -3.1% 1.7% 4.4% 4.6% 8.1% 11.5% 3.6%Operating profit 5,780 5,937 5,882 5,918 5,716 6,289 6,031 6,012 6,228
YoY - 2.7% -0.9% 0.6% -3.4% 10.0% -4.1% -0.3% 3.6%OPM 12.8% 14.4% 14.8% 14.6% 13.5% 14.2% 12.6% 11.3% 11.3%
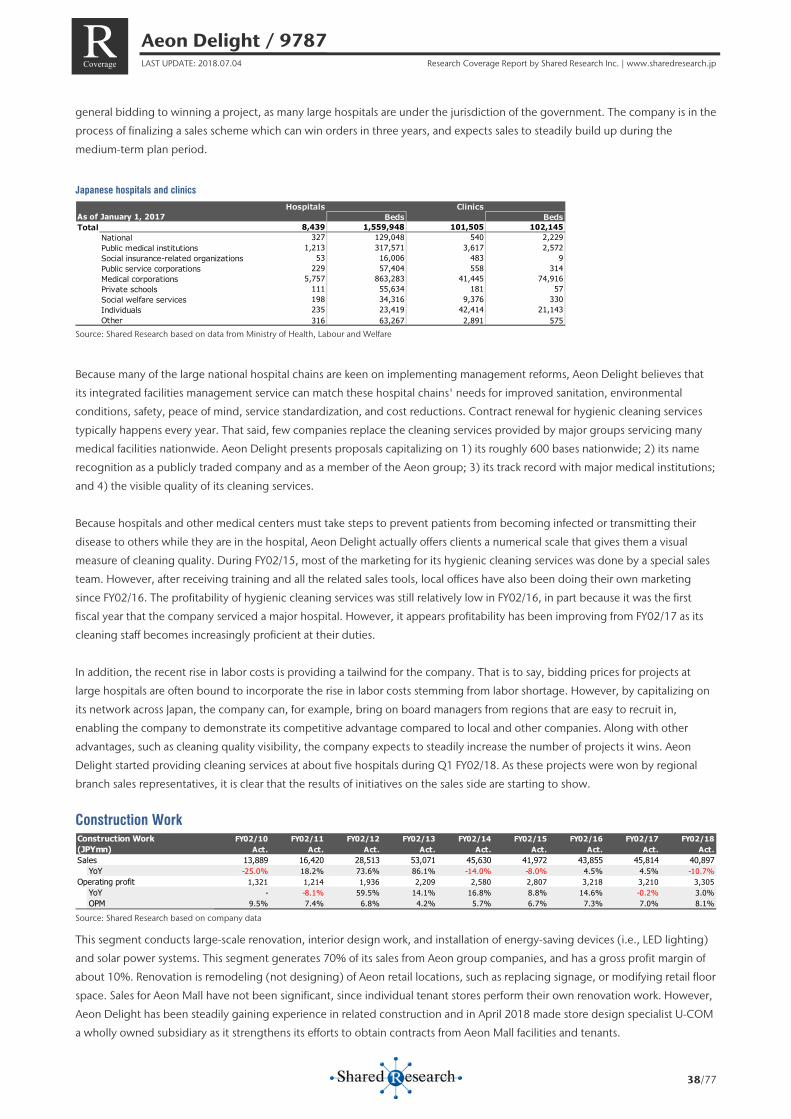
Aeon Delight / 9787 LAST UPDATE: 2018.07.04 Research Coverage Report by Shared Research Inc. | www.sharedresearch.jp
38/77
R Coverage
general bidding to winning a project, as many large hospitals are under the jurisdiction of the government. The company is in the
process of finalizing a sales scheme which can win orders in three years, and expects sales to steadily build up during the
medium-term plan period.
Japanese hospitals and clinics
Source: Shared Research based on data from Ministry of Health, Labour and Welfare
Because many of the large national hospital chains are keen on implementing management reforms, Aeon Delight believes that
its integrated facilities management service can match these hospital chains' needs for improved sanitation, environmental
conditions, safety, peace of mind, service standardization, and cost reductions. Contract renewal for hygienic cleaning services
typically happens every year. That said, few companies replace the cleaning services provided by major groups servicing many
medical facilities nationwide. Aeon Delight presents proposals capitalizing on 1) its roughly 600 bases nationwide; 2) its name
recognition as a publicly traded company and as a member of the Aeon group; 3) its track record with major medical institutions;
and 4) the visible quality of its cleaning services.
Because hospitals and other medical centers must take steps to prevent patients from becoming infected or transmitting their
disease to others while they are in the hospital, Aeon Delight actually offers clients a numerical scale that gives them a visual
measure of cleaning quality. During FY02/15, most of the marketing for its hygienic cleaning services was done by a special sales
team. However, after receiving training and all the related sales tools, local offices have also been doing their own marketing
since FY02/16. The profitability of hygienic cleaning services was still relatively low in FY02/16, in part because it was the first
fiscal year that the company serviced a major hospital. However, it appears profitability has been improving from FY02/17 as its
cleaning staff becomes increasingly proficient at their duties.
In addition, the recent rise in labor costs is providing a tailwind for the company. That is to say, bidding prices for projects at
large hospitals are often bound to incorporate the rise in labor costs stemming from labor shortage. However, by capitalizing on
its network across Japan, the company can, for example, bring on board managers from regions that are easy to recruit in,
enabling the company to demonstrate its competitive advantage compared to local and other companies. Along with other
advantages, such as cleaning quality visibility, the company expects to steadily increase the number of projects it wins. Aeon
Delight started providing cleaning services at about five hospitals during Q1 FY02/18. As these projects were won by regional
branch sales representatives, it is clear that the results of initiatives on the sales side are starting to show.
Construction Work
Source: Shared Research based on company data
This segment conducts large-scale renovation, interior design work, and installation of energy-saving devices (i.e., LED lighting)
and solar power systems. This segment generates 70% of its sales from Aeon group companies, and has a gross profit margin of
about 10%. Renovation is remodeling (not designing) of Aeon retail locations, such as replacing signage, or modifying retail floor
space. Sales for Aeon Mall have not been significant, since individual tenant stores perform their own renovation work. However,
Aeon Delight has been steadily gaining experience in related construction and in April 2018 made store design specialist U-COM
a wholly owned subsidiary as it strengthens its efforts to obtain contracts from Aeon Mall facilities and tenants.
Hospitals ClinicsAs of January 1, 2017 Beds BedsTotal 8,439 1,559,948 101,505 102,145
National 327 129,048 540 2,229Public medical institutions 1,213 317,571 3,617 2,572Social insurance-related organizations 53 16,006 483 9Public service corporations 229 57,404 558 314Medical corporations 5,757 863,283 41,445 74,916Private schools 111 55,634 181 57Social welfare services 198 34,316 9,376 330Individuals 235 23,419 42,414 21,143Other 316 63,267 2,891 575
Construction Work FY02/10 FY02/11 FY02/12 FY02/13 FY02/14 FY02/15 FY02/16 FY02/17 FY02/18(JPYmn) Act. Act. Act. Act. Act. Act. Act. Act. Act.Sales 13,889 16,420 28,513 53,071 45,630 41,972 43,855 45,814 40,897
YoY -25.0% 18.2% 73.6% 86.1% -14.0% -8.0% 4.5% 4.5% -10.7%Operating profit 1,321 1,214 1,936 2,209 2,580 2,807 3,218 3,210 3,305
YoY - -8.1% 59.5% 14.1% 16.8% 8.8% 14.6% -0.2% 3.0%OPM 9.5% 7.4% 6.8% 4.2% 5.7% 6.7% 7.3% 7.0% 8.1%

Aeon Delight / 9787 LAST UPDATE: 2018.07.04 Research Coverage Report by Shared Research Inc. | www.sharedresearch.jp
39/77
R Coverage
LED installation is the primary source of orders in the environmental business. Revenues from LED installation work were
JPY26.0bn in FY02/13 (JPY7.4bn in FY02/12). LED lighting is sourced from suppliers, and sales are recorded once installations are
complete at client locations. Personnel costs account for about 30% of overall costs, and the materials ratio is around 70%.
LED-related sales (JPYbn)
Source: Shared Research based on company data
Materials and Supplies Sourcing Services
Source: Shared Research based on company data
Through efficient logistics, this business reduces costs for intermediate materials used in offices and retail stores. The segment
deals in items such as plastic bags, gift bags, clothing, and other consumables (employee stationery, cleaning materials, etc.). In
this business, stock must be maintained at all times, and the company undertakes logistics functions on behalf of the customer as
well. Aeon Delight aims to use efficient logistics to reduce costs for intermediate materials and increase process efficiency. Gross
profit margin is about 7% to 8%.
Vending Machine Services
Source: Shared Research based on company data
This segment operates soft drink vending machines. It also creates relaxation areas with foliage plants and air purification
equipment.
The company’s vending machines stock a variety of products from different manufacturers. Aeon Delight operates approximately
40,000 vending machines (as of the end of FY02/16). About 80% of vending machine sales come from machine in supermarkets
belonging to the Aeon group. The remaining 20% of sales came from machines in shopping malls operated by Aeon group and
non-Aeon companies. Aeon Delight acquired Certo Corp. (delisted from JASDAQ after being acquired) in September 2010, a
vending machine operator 66.4% owned by Aeon.
Also, aiming for a business model change, the company seeks to increase the number of vending machines equipped with digital
signage functionality (about 1,500 machines at end-FY02/17) and capture advertising revenues.
18.513.9
16.4
28.5
53.1
45.642.0 43.9 45.8
40.9
0%
2%
4%
6%
8%
10%
12%
-
10
20
30
40
50
60
FY02/09 FY02/11 FY02/13 FY02/15 FY02/17
Sales excl. LED LED-related sales OPM (right axis)(JPYbn)
11.1
18.9
15.8
7.3
15.9
13.9
8.3 7.6
11.911.19.4 9.6
13.1 13.2
9.68.0
13.513.1
10.09.2
11.712.4
8.6 8.2
0%
2%
4%
6%
8%
10%
-
4
8
12
16
20
Q1FY02/14
Q1FY02/14
Q1FY02/15
Q1FY02/16
Q1FY02/17
Q1FY02/18
Sales excl. LED LED-related sales OPM(JPYbn)
Materials and Supplies Sourcing FY02/10 FY02/11 FY02/12 FY02/13 FY02/14 FY02/15 FY02/16 FY02/17 FY02/18(JPYmn) Act. Act. Act. Act. Act. Act. Act. Act. Act.Sales - 18,718 36,730 39,284 44,543 47,618 50,516 50,740 50,265
YoY - - 96.2% 7.0% 13.4% 6.9% 6.1% 0.4% -0.9%Operating profit - 627 1,234 1,462 2,333 2,111 2,806 2,774 2,868
YoY - - 96.8% 18.5% 59.6% -9.5% 32.9% -1.1% 3.4%OPM - 3.3% 3.4% 3.7% 5.2% 4.4% 5.6% 5.5% 5.7%
Vending Machine Services FY02/10 FY02/11 FY02/12 FY02/13 FY02/14 FY02/15 FY02/16 FY02/17 FY02/18(JPYmn) Act. Act. Act. Act. Act. Act. Act. Act. Act.Sales - 17,188 32,280 31,200 33,329 34,825 32,741 32,879 32,834
YoY - - 87.8% -3.3% 6.8% 4.5% -6.0% 0.4% -0.1%Operating profit - 1,480 2,330 2,396 3,068 2,965 2,846 2,812 2,105
YoY - - 57.4% 2.8% 28.0% -3.4% -4.0% -1.2% -25.1%OPM - 8.6% 7.2% 7.7% 9.2% 8.5% 8.7% 8.6% 6.4%
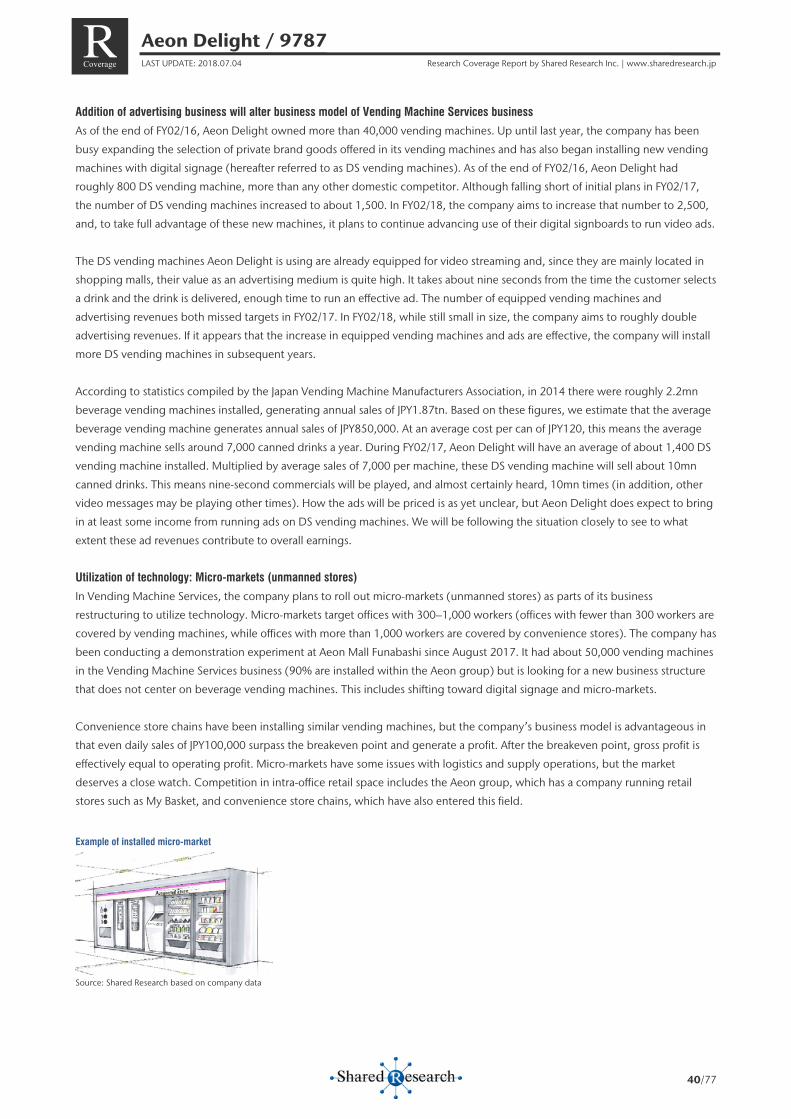
Aeon Delight / 9787 LAST UPDATE: 2018.07.04 Research Coverage Report by Shared Research Inc. | www.sharedresearch.jp
40/77
R Coverage
Addition of advertising business will alter business model of Vending Machine Services business
As of the end of FY02/16, Aeon Delight owned more than 40,000 vending machines. Up until last year, the company has been
busy expanding the selection of private brand goods offered in its vending machines and has also began installing new vending
machines with digital signage (hereafter referred to as DS vending machines). As of the end of FY02/16, Aeon Delight had
roughly 800 DS vending machine, more than any other domestic competitor. Although falling short of initial plans in FY02/17,
the number of DS vending machines increased to about 1,500. In FY02/18, the company aims to increase that number to 2,500,
and, to take full advantage of these new machines, it plans to continue advancing use of their digital signboards to run video ads.
The DS vending machines Aeon Delight is using are already equipped for video streaming and, since they are mainly located in
shopping malls, their value as an advertising medium is quite high. It takes about nine seconds from the time the customer selects
a drink and the drink is delivered, enough time to run an effective ad. The number of equipped vending machines and
advertising revenues both missed targets in FY02/17. In FY02/18, while still small in size, the company aims to roughly double
advertising revenues. If it appears that the increase in equipped vending machines and ads are effective, the company will install
more DS vending machines in subsequent years.
According to statistics compiled by the Japan Vending Machine Manufacturers Association, in 2014 there were roughly 2.2mn
beverage vending machines installed, generating annual sales of JPY1.87tn. Based on these figures, we estimate that the average
beverage vending machine generates annual sales of JPY850,000. At an average cost per can of JPY120, this means the average
vending machine sells around 7,000 canned drinks a year. During FY02/17, Aeon Delight will have an average of about 1,400 DS
vending machine installed. Multiplied by average sales of 7,000 per machine, these DS vending machine will sell about 10mn
canned drinks. This means nine-second commercials will be played, and almost certainly heard, 10mn times (in addition, other
video messages may be playing other times). How the ads will be priced is as yet unclear, but Aeon Delight does expect to bring
in at least some income from running ads on DS vending machines. We will be following the situation closely to see to what
extent these ad revenues contribute to overall earnings.
Utilization of technology: Micro-markets (unmanned stores)
In Vending Machine Services, the company plans to roll out micro-markets (unmanned stores) as parts of its business
restructuring to utilize technology. Micro-markets target offices with 300–1,000 workers (offices with fewer than 300 workers are
covered by vending machines, while offices with more than 1,000 workers are covered by convenience stores). The company has
been conducting a demonstration experiment at Aeon Mall Funabashi since August 2017. It had about 50,000 vending machines
in the Vending Machine Services business (90% are installed within the Aeon group) but is looking for a new business structure
that does not center on beverage vending machines. This includes shifting toward digital signage and micro-markets.
Convenience store chains have been installing similar vending machines, but the company’s business model is advantageous in
that even daily sales of JPY100,000 surpass the breakeven point and generate a profit. After the breakeven point, gross profit is
effectively equal to operating profit. Micro-markets have some issues with logistics and supply operations, but the market
deserves a close watch. Competition in intra-office retail space includes the Aeon group, which has a company running retail
stores such as My Basket, and convenience store chains, which have also entered this field.
Example of installed micro-market
Source: Shared Research based on company data
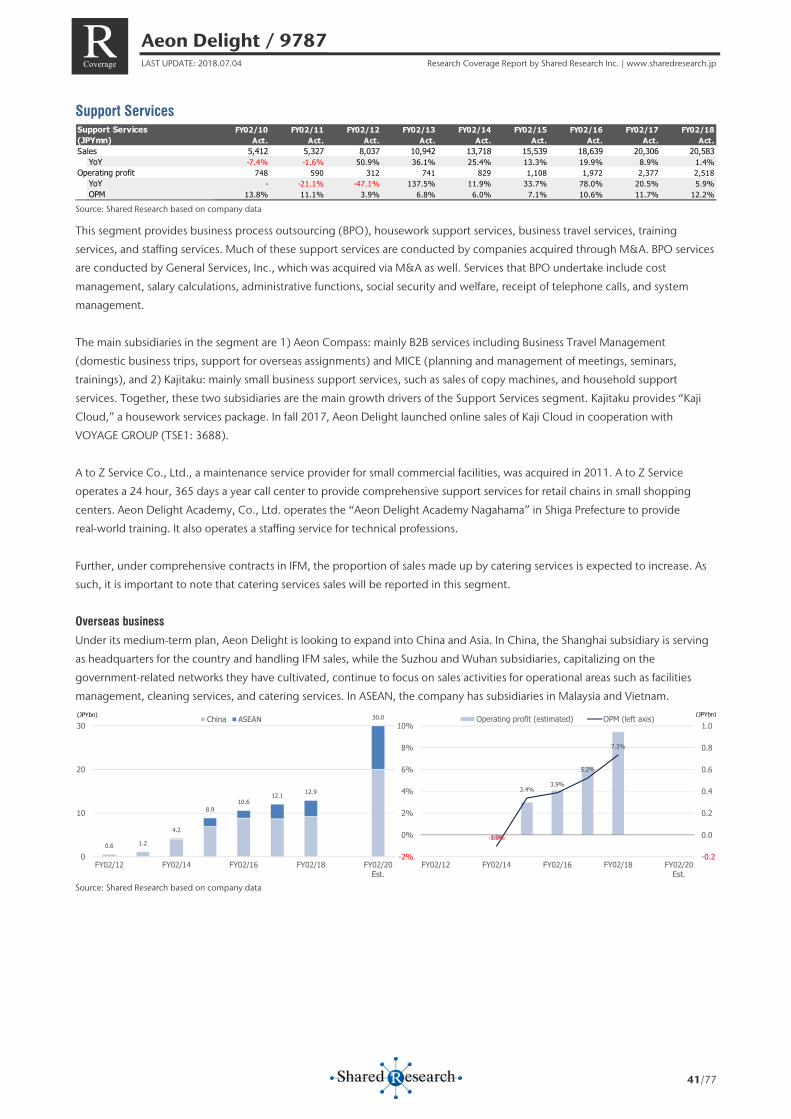
Aeon Delight / 9787 LAST UPDATE: 2018.07.04 Research Coverage Report by Shared Research Inc. | www.sharedresearch.jp
41/77
R Coverage
Support Services
Source: Shared Research based on company data
This segment provides business process outsourcing (BPO), housework support services, business travel services, training
services, and staffing services. Much of these support services are conducted by companies acquired through M&A. BPO services
are conducted by General Services, Inc., which was acquired via M&A as well. Services that BPO undertake include cost
management, salary calculations, administrative functions, social security and welfare, receipt of telephone calls, and system
management.
The main subsidiaries in the segment are 1) Aeon Compass: mainly B2B services including Business Travel Management
(domestic business trips, support for overseas assignments) and MICE (planning and management of meetings, seminars,
trainings), and 2) Kajitaku: mainly small business support services, such as sales of copy machines, and household support
services. Together, these two subsidiaries are the main growth drivers of the Support Services segment. Kajitaku provides “Kaji
Cloud,” a housework services package. In fall 2017, Aeon Delight launched online sales of Kaji Cloud in cooperation with
VOYAGE GROUP (TSE1: 3688).
A to Z Service Co., Ltd., a maintenance service provider for small commercial facilities, was acquired in 2011. A to Z Service
operates a 24 hour, 365 days a year call center to provide comprehensive support services for retail chains in small shopping
centers. Aeon Delight Academy, Co., Ltd. operates the “Aeon Delight Academy Nagahama” in Shiga Prefecture to provide
real-world training. It also operates a staffing service for technical professions.
Further, under comprehensive contracts in IFM, the proportion of sales made up by catering services is expected to increase. As
such, it is important to note that catering services sales will be reported in this segment.
Overseas business
Under its medium-term plan, Aeon Delight is looking to expand into China and Asia. In China, the Shanghai subsidiary is serving
as headquarters for the country and handling IFM sales, while the Suzhou and Wuhan subsidiaries, capitalizing on the
government-related networks they have cultivated, continue to focus on sales activities for operational areas such as facilities
management, cleaning services, and catering services. In ASEAN, the company has subsidiaries in Malaysia and Vietnam.
Source: Shared Research based on company data
Support Services FY02/10 FY02/11 FY02/12 FY02/13 FY02/14 FY02/15 FY02/16 FY02/17 FY02/18(JPYmn) Act. Act. Act. Act. Act. Act. Act. Act. Act.Sales 5,412 5,327 8,037 10,942 13,718 15,539 18,639 20,306 20,583
YoY -7.4% -1.6% 50.9% 36.1% 25.4% 13.3% 19.9% 8.9% 1.4%Operating profit 748 590 312 741 829 1,108 1,972 2,377 2,518
YoY - -21.1% -47.1% 137.5% 11.9% 33.7% 78.0% 20.5% 5.9%OPM 13.8% 11.1% 3.9% 6.8% 6.0% 7.1% 10.6% 11.7% 12.2%
0.6 1.2
4.2
8.910.6
12.1 12.9
30.0
0
10
20
30
FY02/12 FY02/14 FY02/16 FY02/18 FY02/20Est.
China ASEAN(JPYbn)
-1.0%
3.4%3.9%
5.2%
7.3%
-0.2
0.0
0.2
0.4
0.6
0.8
1.0
-2%
0%
2%
4%
6%
8%
10%
FY02/12 FY02/14 FY02/16 FY02/18 FY02/20Est.
Operating profit (estimated) OPM (left axis) (JPYbn)
Aeon Delight / 9787 LAST UPDATE: 2018.07.04 Research Coverage Report by Shared Research Inc. | www.sharedresearch.jp
42/77
R Coverage
Strengths and weaknesses
Strengths
◤ Strong ties with the Aeon group: Aeon Delight is a subsidiary of Aeon Co., Ltd., and almost 70% of sales are generated
form the Aeon group. This provides for stable sales, and the Aeon group’s expansion into Asia is also proving to be a positive
factor for Aeon Delight’s growth. The company is able to leverage economies of scale from the Aeon group, and has
accumulated expertise in integrated FMS from its transactions with Aeon. This provides for a stable recurring-revenue model.
◤ Industry leader in comprehensive commercial maintenance services: Aeon Delight is the industry leader capable of
providing integrated all-in-one building maintenance services such as facilities management, security, cleaning, and
renovations. Its competitors can only provide one to two of these services (i.e., security or cleaning). Owners of large
commercial facilities and buildings are would prefer to contract such services to one service provider rather than negotiate
with each individual service provider based on their specialty. The company’s ability to provide such integrated service is a
competitive advantage over its competitors.
◤ Financial strength to buy growth: Aeon Delight has a very strong balance sheet. Shared Research believes that this balance
sheet could be used aggressively to buy growth. According to the Japan Building Maintenance Association, there are currently
over 5,000 property maintenance service providers throughout Japan. This market is relatively mature, and a realignment of
the industry is possible. Aeon Delight, with its financial strength and industry prowess, would be able to acquire smaller firms
with specialized services in local areas. This could lead to further growth and expansion. The company is able to benefit from
economies of scale. It can leverage its balance to buy growth since it has a recurring stable source of revenue from the Aeon
group. The company could take on debt to expand its business since it has an under leveraged balance sheet.
Weaknesses
◤ Organic growth challenging: Aeon Delight has grown through acquisitions. Therefore, organic growth may be a challenge
because the market is relatively mature. There is limited domestic growth and overseas offers one avenue of expansion. M&A
activities could dry up, and this could have an impact on earnings. The company has been able to buy growth using its strong
financial position.
◤ Overly dependent on the Aeon group: Aeon Delight is a consolidated subsidiary of Aeon, and derives almost 70% of its
sales from the Aeon group. A drawback from such a strong relationship is that the parent company may ask for support in
pursuing its agenda. Recently, Aeon acquired 50% of Tesco Japan, the U.K. supermarket chain operator’s Japan retail business.
A joint venture company, Aeon Every Co., Ltd. is in charge of supermarket operations. The parent Aeon could ask the
company for support in future acquisitions.
◤ Mature property management market: The property management market is relatively mature. However, small retail stores
in urban areas offer growth opportunities given the greater number of customer volume. Many small retailers are renovating
their stores and upgrading facilities. Aeon Delight’s expertise has been in large facilities, mainly supporting the Aeon group
retail stores such as shopping centers and supermarkets. As smaller commercial facilities emerge in large urban areas, the
question remains whether the company can successfully adapt its facilities maintenance know-how to this segment of the
market. The company may need to look at this segment for growth.
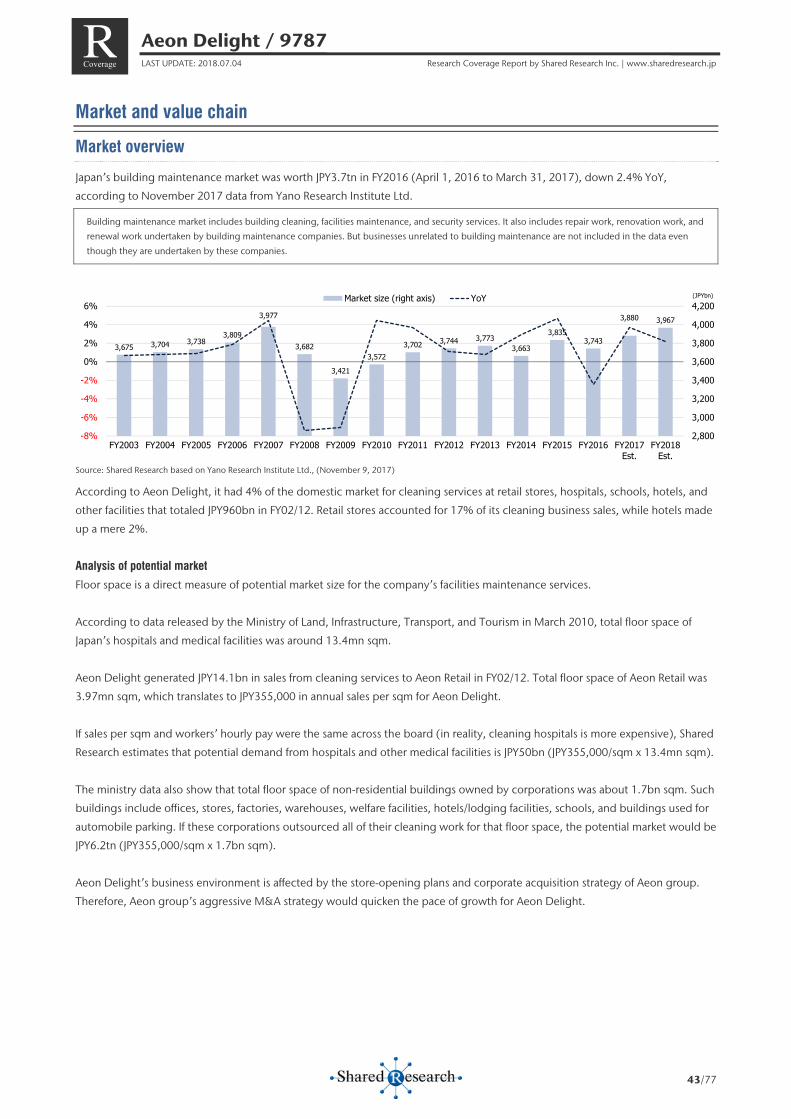
Aeon Delight / 9787 LAST UPDATE: 2018.07.04 Research Coverage Report by Shared Research Inc. | www.sharedresearch.jp
43/77
R Coverage
Market and value chain
Market overview
Japan’s building maintenance market was worth JPY3.7tn in FY2016 (April 1, 2016 to March 31, 2017), down 2.4% YoY,
according to November 2017 data from Yano Research Institute Ltd.
Building maintenance market includes building cleaning, facilities maintenance, and security services. It also includes repair work, renovation work, and
renewal work undertaken by building maintenance companies. But businesses unrelated to building maintenance are not included in the data even
though they are undertaken by these companies.
Source: Shared Research based on Yano Research Institute Ltd., (November 9, 2017)
According to Aeon Delight, it had 4% of the domestic market for cleaning services at retail stores, hospitals, schools, hotels, and
other facilities that totaled JPY960bn in FY02/12. Retail stores accounted for 17% of its cleaning business sales, while hotels made
up a mere 2%.
Analysis of potential market
Floor space is a direct measure of potential market size for the company’s facilities maintenance services.
According to data released by the Ministry of Land, Infrastructure, Transport, and Tourism in March 2010, total floor space of
Japan’s hospitals and medical facilities was around 13.4mn sqm.
Aeon Delight generated JPY14.1bn in sales from cleaning services to Aeon Retail in FY02/12. Total floor space of Aeon Retail was
3.97mn sqm, which translates to JPY355,000 in annual sales per sqm for Aeon Delight.
If sales per sqm and workers’ hourly pay were the same across the board (in reality, cleaning hospitals is more expensive), Shared
Research estimates that potential demand from hospitals and other medical facilities is JPY50bn (JPY355,000/sqm x 13.4mn sqm).
The ministry data also show that total floor space of non-residential buildings owned by corporations was about 1.7bn sqm. Such
buildings include offices, stores, factories, warehouses, welfare facilities, hotels/lodging facilities, schools, and buildings used for
automobile parking. If these corporations outsourced all of their cleaning work for that floor space, the potential market would be
JPY6.2tn (JPY355,000/sqm x 1.7bn sqm).
Aeon Delight’s business environment is affected by the store-opening plans and corporate acquisition strategy of Aeon group.
Therefore, Aeon group’s aggressive M&A strategy would quicken the pace of growth for Aeon Delight.
3,675 3,704 3,7383,809
3,977
3,682
3,421
3,5723,702 3,744 3,773
3,663
3,8353,743
3,880 3,967
2,800
3,000
3,200
3,400
3,600
3,800
4,000
4,200
-8%
-6%
-4%
-2%
0%
2%
4%
6%
FY2003 FY2004 FY2005 FY2006 FY2007 FY2008 FY2009 FY2010 FY2011 FY2012 FY2013 FY2014 FY2015 FY2016 FY2017Est.
FY2018Est.
Market size (right axis) YoY (JPYbn)
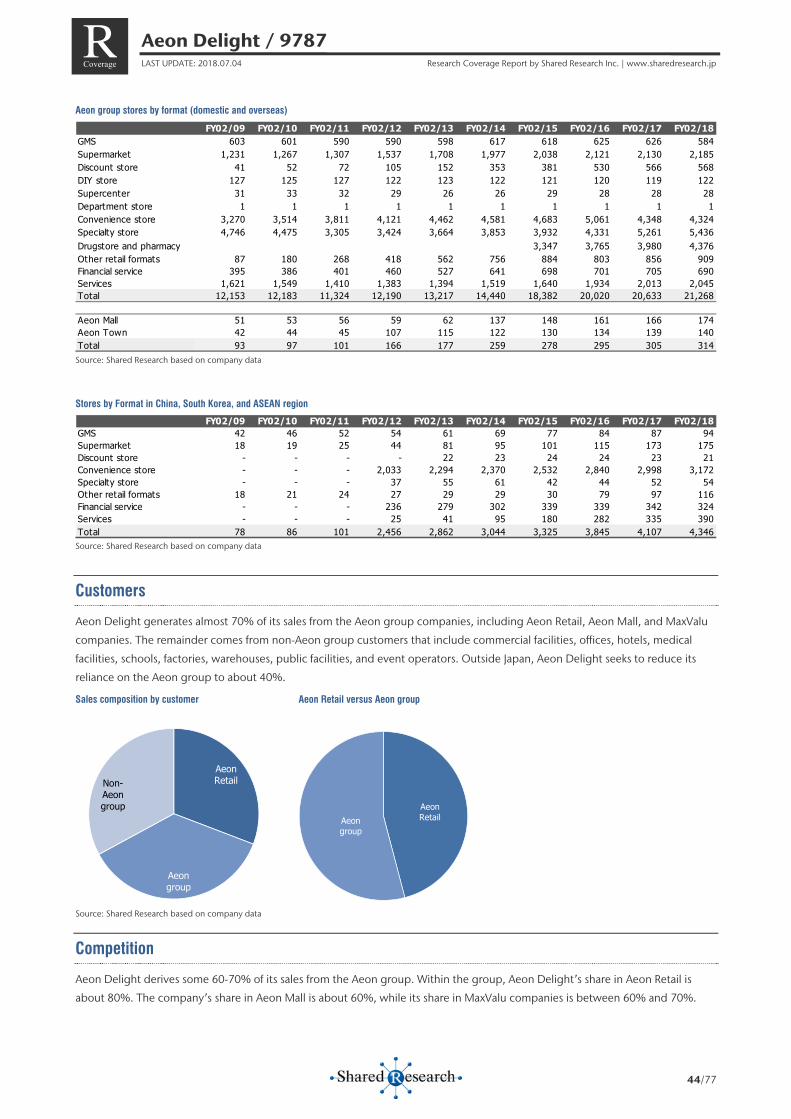
Aeon Delight / 9787 LAST UPDATE: 2018.07.04 Research Coverage Report by Shared Research Inc. | www.sharedresearch.jp
44/77
R Coverage
Aeon group stores by format (domestic and overseas)
Source: Shared Research based on company data
Stores by Format in China, South Korea, and ASEAN region
Source: Shared Research based on company data
Customers
Aeon Delight generates almost 70% of its sales from the Aeon group companies, including Aeon Retail, Aeon Mall, and MaxValu
companies. The remainder comes from non-Aeon group customers that include commercial facilities, offices, hotels, medical
facilities, schools, factories, warehouses, public facilities, and event operators. Outside Japan, Aeon Delight seeks to reduce its
reliance on the Aeon group to about 40%.
Sales composition by customer Aeon Retail versus Aeon group
Source: Shared Research based on company data
Competition
Aeon Delight derives some 60-70% of its sales from the Aeon group. Within the group, Aeon Delight’s share in Aeon Retail is
about 80%. The company’s share in Aeon Mall is about 60%, while its share in MaxValu companies is between 60% and 70%.
FY02/09 FY02/10 FY02/11 FY02/12 FY02/13 FY02/14 FY02/15 FY02/16 FY02/17 FY02/18GMS 603 601 590 590 598 617 618 625 626 584Supermarket 1,231 1,267 1,307 1,537 1,708 1,977 2,038 2,121 2,130 2,185Discount store 41 52 72 105 152 353 381 530 566 568DIY store 127 125 127 122 123 122 121 120 119 122Supercenter 31 33 32 29 26 26 29 28 28 28Department store 1 1 1 1 1 1 1 1 1 1Convenience store 3,270 3,514 3,811 4,121 4,462 4,581 4,683 5,061 4,348 4,324Specialty store 4,746 4,475 3,305 3,424 3,664 3,853 3,932 4,331 5,261 5,436Drugstore and pharmacy 3,347 3,765 3,980 4,376Other retail formats 87 180 268 418 562 756 884 803 856 909Financial service 395 386 401 460 527 641 698 701 705 690Services 1,621 1,549 1,410 1,383 1,394 1,519 1,640 1,934 2,013 2,045Total 12,153 12,183 11,324 12,190 13,217 14,440 18,382 20,020 20,633 21,268
Aeon Mall 51 53 56 59 62 137 148 161 166 174Aeon Town 42 44 45 107 115 122 130 134 139 140Total 93 97 101 166 177 259 278 295 305 314
FY02/09 FY02/10 FY02/11 FY02/12 FY02/13 FY02/14 FY02/15 FY02/16 FY02/17 FY02/18GMS 42 46 52 54 61 69 77 84 87 94Supermarket 18 19 25 44 81 95 101 115 173 175Discount store - - - - 22 23 24 24 23 21Convenience store - - - 2,033 2,294 2,370 2,532 2,840 2,998 3,172Specialty store - - - 37 55 61 42 44 52 54Other retail formats 18 21 24 27 29 29 30 79 97 116Financial service - - - 236 279 302 339 339 342 324Services - - - 25 41 95 180 282 335 390Total 78 86 101 2,456 2,862 3,044 3,325 3,845 4,107 4,346
Aeon Retail
Aeon group
Non-Aeon group Aeon
RetailAeon group
Aeon Delight / 9787 LAST UPDATE: 2018.07.04 Research Coverage Report by Shared Research Inc. | www.sharedresearch.jp
45/77
R Coverage
Aeon Delight’s competitors include SECOM Co., Ltd. (TSE1: 9735) and Sohgo Security Services Co., Ltd. (TSE1: 2331) in security
services. It competes with Azbil Corporation (TSE1: 6845), Nippon Kanzai Co. Ltd. (TSE1: 9728), and Tokyu Community
Corporation (TSE1: 4711) in property management services. There are no major competitors that offer cleaning services; Aeon
Delight competes with smaller, regional cleaning operators. In construction-related work, Aeon Delight competes with Azbil in
the environmental solutions business, while in the energy-saving business, major rivals are NTT Facilities, Inc. and Hitachi, Ltd.
(TSE1: 6501).
Barriers to entry
Property management for residential and small office buildings has relatively low barriers to entry. However, the barriers are high
for large facilities given the comprehensive services required.
Smaller residential or office building owners are less concerned about having total package of services and usually focus on
cleaning or security. However, large facilities require comprehensive services such as maintenance, cleaning, and security,
all-in-one. Instead of hiring a contractor for each service, large building owners prefer to contract out these services to one
company that is able to provide all of these services in package. Consequently, this enables Aeon Delight to enjoy a relatively
high barrier of entry in its market niche, namely servicing large retail stores and office buildings, due to its expertise in providing
an all-in-one package of services.
The company’s market share within the Aeon group is high. Being a group company, Aeon Delight is well aware of the business
practices and facility characteristics that are common throughout the Aeon group and the risk of its competitors gaining a
significant portion of the market share is fairly slim.
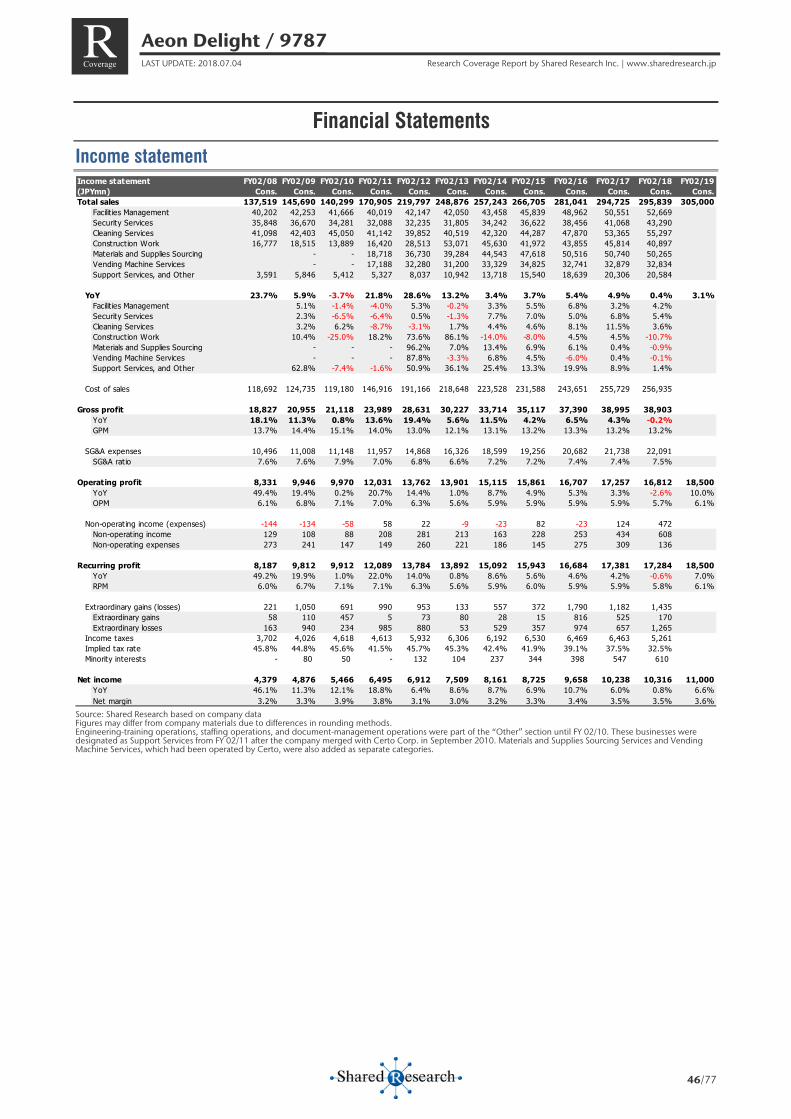
Aeon Delight / 9787 LAST UPDATE: 2018.07.04 Research Coverage Report by Shared Research Inc. | www.sharedresearch.jp
46/77
R Coverage
Financial Statements
Income statement
Source: Shared Research based on company data Figures may differ from company materials due to differences in rounding methods. Engineering-training operations, staffing operations, and document-management operations were part of the “Other” section until FY 02/10. These businesses were designated as Support Services from FY 02/11 after the company merged with Certo Corp. in September 2010. Materials and Supplies Sourcing Services and Vending Machine Services, which had been operated by Certo, were also added as separate categories.
Income statement FY02/08 FY02/09 FY02/10 FY02/11 FY02/12 FY02/13 FY02/14 FY02/15 FY02/16 FY02/17 FY02/18 FY02/19(JPYmn) Cons. Cons. Cons. Cons. Cons. Cons. Cons. Cons. Cons. Cons. Cons. Cons.Total sales 137,519 145,690 140,299 170,905 219,797 248,876 257,243 266,705 281,041 294,725 295,839 305,000
Facilit ies Management 40,202 42,253 41,666 40,019 42,147 42,050 43,458 45,839 48,962 50,551 52,669 Security Services 35,848 36,670 34,281 32,088 32,235 31,805 34,242 36,622 38,456 41,068 43,290 Cleaning Services 41,098 42,403 45,050 41,142 39,852 40,519 42,320 44,287 47,870 53,365 55,297 Construction Work 16,777 18,515 13,889 16,420 28,513 53,071 45,630 41,972 43,855 45,814 40,897 Materials and Supplies Sourcing - - 18,718 36,730 39,284 44,543 47,618 50,516 50,740 50,265 Vending Machine Services - - 17,188 32,280 31,200 33,329 34,825 32,741 32,879 32,834 Support Services, and Other 3,591 5,846 5,412 5,327 8,037 10,942 13,718 15,540 18,639 20,306 20,584
YoY 23.7% 5.9% -3.7% 21.8% 28.6% 13.2% 3.4% 3.7% 5.4% 4.9% 0.4% 3.1%
Facilit ies Management 5.1% -1.4% -4.0% 5.3% -0.2% 3.3% 5.5% 6.8% 3.2% 4.2% Security Services 2.3% -6.5% -6.4% 0.5% -1.3% 7.7% 7.0% 5.0% 6.8% 5.4% Cleaning Services 3.2% 6.2% -8.7% -3.1% 1.7% 4.4% 4.6% 8.1% 11.5% 3.6% Construction Work 10.4% -25.0% 18.2% 73.6% 86.1% -14.0% -8.0% 4.5% 4.5% -10.7% Materials and Supplies Sourcing - - - 96.2% 7.0% 13.4% 6.9% 6.1% 0.4% -0.9% Vending Machine Services - - - 87.8% -3.3% 6.8% 4.5% -6.0% 0.4% -0.1% Support Services, and Other 62.8% -7.4% -1.6% 50.9% 36.1% 25.4% 13.3% 19.9% 8.9% 1.4%
Cost of sales 118,692 124,735 119,180 146,916 191,166 218,648 223,528 231,588 243,651 255,729 256,935
Gross profit 18,827 20,955 21,118 23,989 28,631 30,227 33,714 35,117 37,390 38,995 38,903
YoY 18.1% 11.3% 0.8% 13.6% 19.4% 5.6% 11.5% 4.2% 6.5% 4.3% -0.2% GPM 13.7% 14.4% 15.1% 14.0% 13.0% 12.1% 13.1% 13.2% 13.3% 13.2% 13.2%
SG&A expenses 10,496 11,008 11,148 11,957 14,868 16,326 18,599 19,256 20,682 21,738 22,091
SG&A ratio 7.6% 7.6% 7.9% 7.0% 6.8% 6.6% 7.2% 7.2% 7.4% 7.4% 7.5%
Operating profit 8,331 9,946 9,970 12,031 13,762 13,901 15,115 15,861 16,707 17,257 16,812 18,500YoY 49.4% 19.4% 0.2% 20.7% 14.4% 1.0% 8.7% 4.9% 5.3% 3.3% -2.6% 10.0%OPM 6.1% 6.8% 7.1% 7.0% 6.3% 5.6% 5.9% 5.9% 5.9% 5.9% 5.7% 6.1%
Non-operating income (expenses) -144 -134 -58 58 22 -9 -23 82 -23 124 472
Non-operating income 129 108 88 208 281 213 163 228 253 434 608 Non-operating expenses 273 241 147 149 260 221 186 145 275 309 136
Recurring profit 8,187 9,812 9,912 12,089 13,784 13,892 15,092 15,943 16,684 17,381 17,284 18,500
YoY 49.2% 19.9% 1.0% 22.0% 14.0% 0.8% 8.6% 5.6% 4.6% 4.2% -0.6% 7.0%RPM 6.0% 6.7% 7.1% 7.1% 6.3% 5.6% 5.9% 6.0% 5.9% 5.9% 5.8% 6.1%
Extraordinary gains (losses) 221 1,050 691 990 953 133 557 372 1,790 1,182 1,435
Extraordinary gains 58 110 457 5 73 80 28 15 816 525 170 Extraordinary losses 163 940 234 985 880 53 529 357 974 657 1,265
Income taxes 3,702 4,026 4,618 4,613 5,932 6,306 6,192 6,530 6,469 6,463 5,261 Implied tax rate 45.8% 44.8% 45.6% 41.5% 45.7% 45.3% 42.4% 41.9% 39.1% 37.5% 32.5% Minority interests - 80 50 - 132 104 237 344 398 547 610
Net income 4,379 4,876 5,466 6,495 6,912 7,509 8,161 8,725 9,658 10,238 10,316 11,000
YoY 46.1% 11.3% 12.1% 18.8% 6.4% 8.6% 8.7% 6.9% 10.7% 6.0% 0.8% 6.6%Net margin 3.2% 3.3% 3.9% 3.8% 3.1% 3.0% 3.2% 3.3% 3.4% 3.5% 3.5% 3.6%
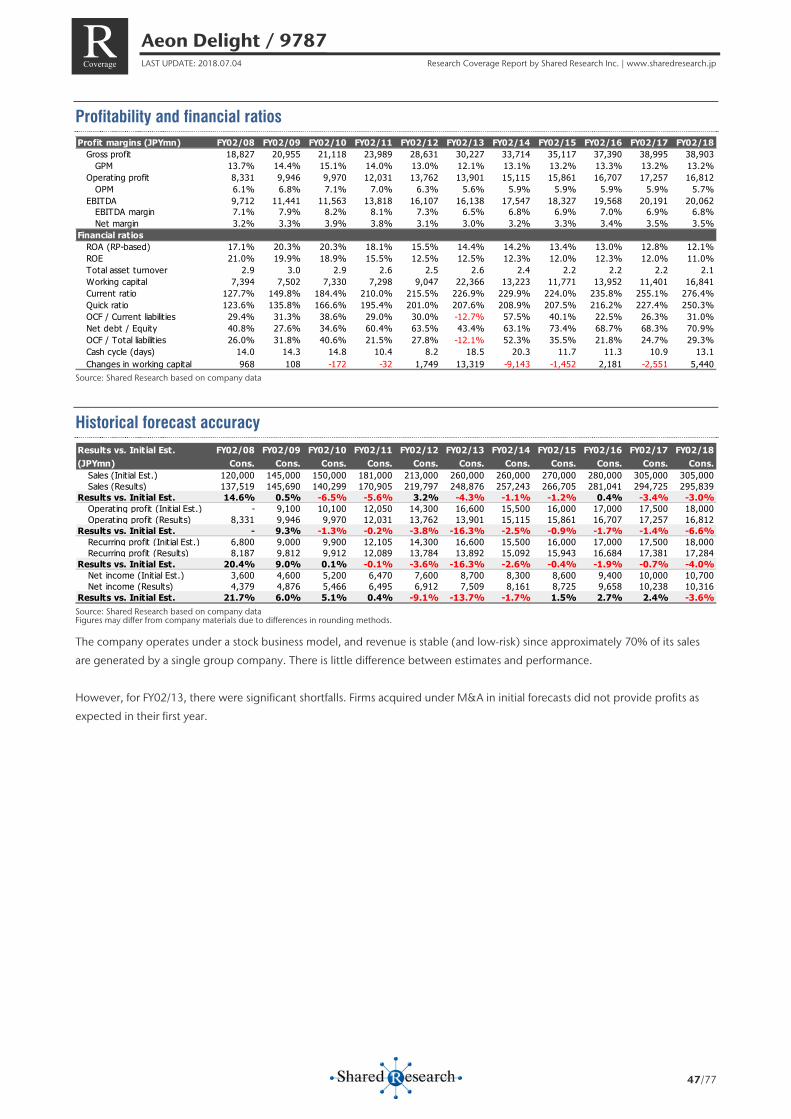
Aeon Delight / 9787 LAST UPDATE: 2018.07.04 Research Coverage Report by Shared Research Inc. | www.sharedresearch.jp
47/77
R Coverage
Profitability and financial ratios
Source: Shared Research based on company data
Historical forecast accuracy
Source: Shared Research based on company data Figures may differ from company materials due to differences in rounding methods.
The company operates under a stock business model, and revenue is stable (and low-risk) since approximately 70% of its sales
are generated by a single group company. There is little difference between estimates and performance.
However, for FY02/13, there were significant shortfalls. Firms acquired under M&A in initial forecasts did not provide profits as
expected in their first year.
Profit margins (JPYmn) FY02/08 FY02/09 FY02/10 FY02/11 FY02/12 FY02/13 FY02/14 FY02/15 FY02/16 FY02/17 FY02/18Gross profit 18,827 20,955 21,118 23,989 28,631 30,227 33,714 35,117 37,390 38,995 38,903
GPM 13.7% 14.4% 15.1% 14.0% 13.0% 12.1% 13.1% 13.2% 13.3% 13.2% 13.2%Operating profit 8,331 9,946 9,970 12,031 13,762 13,901 15,115 15,861 16,707 17,257 16,812
OPM 6.1% 6.8% 7.1% 7.0% 6.3% 5.6% 5.9% 5.9% 5.9% 5.9% 5.7%EBITDA 9,712 11,441 11,563 13,818 16,107 16,138 17,547 18,327 19,568 20,191 20,062
EBITDA margin 7.1% 7.9% 8.2% 8.1% 7.3% 6.5% 6.8% 6.9% 7.0% 6.9% 6.8%Net margin 3.2% 3.3% 3.9% 3.8% 3.1% 3.0% 3.2% 3.3% 3.4% 3.5% 3.5%
Financial ratios ROA (RP-based) 17.1% 20.3% 20.3% 18.1% 15.5% 14.4% 14.2% 13.4% 13.0% 12.8% 12.1%ROE 21.0% 19.9% 18.9% 15.5% 12.5% 12.5% 12.3% 12.0% 12.3% 12.0% 11.0%Total asset turnover 2.9 3.0 2.9 2.6 2.5 2.6 2.4 2.2 2.2 2.2 2.1Working capital 7,394 7,502 7,330 7,298 9,047 22,366 13,223 11,771 13,952 11,401 16,841Current ratio 127.7% 149.8% 184.4% 210.0% 215.5% 226.9% 229.9% 224.0% 235.8% 255.1% 276.4%Quick ratio 123.6% 135.8% 166.6% 195.4% 201.0% 207.6% 208.9% 207.5% 216.2% 227.4% 250.3%OCF / Current liabilit ies 29.4% 31.3% 38.6% 29.0% 30.0% -12.7% 57.5% 40.1% 22.5% 26.3% 31.0%Net debt / Equity 40.8% 27.6% 34.6% 60.4% 63.5% 43.4% 63.1% 73.4% 68.7% 68.3% 70.9%OCF / Total liabilit ies 26.0% 31.8% 40.6% 21.5% 27.8% -12.1% 52.3% 35.5% 21.8% 24.7% 29.3%Cash cycle (days) 14.0 14.3 14.8 10.4 8.2 18.5 20.3 11.7 11.3 10.9 13.1Changes in working capital 968 108 -172 -32 1,749 13,319 -9,143 -1,452 2,181 -2,551 5,440
Results vs. Initial Est. FY02/08 FY02/09 FY02/10 FY02/11 FY02/12 FY02/13 FY02/14 FY02/15 FY02/16 FY02/17 FY02/18(JPYmn) Cons. Cons. Cons. Cons. Cons. Cons. Cons. Cons. Cons. Cons. Cons.
Sales (Initial Est.) 120,000 145,000 150,000 181,000 213,000 260,000 260,000 270,000 280,000 305,000 305,000Sales (Results) 137,519 145,690 140,299 170,905 219,797 248,876 257,243 266,705 281,041 294,725 295,839
Results vs. Initial Est. 14.6% 0.5% -6.5% -5.6% 3.2% -4.3% -1.1% -1.2% 0.4% -3.4% -3.0%Operating profit (Initial Est.) - 9,100 10,100 12,050 14,300 16,600 15,500 16,000 17,000 17,500 18,000Operating profit (Results) 8,331 9,946 9,970 12,031 13,762 13,901 15,115 15,861 16,707 17,257 16,812
Results vs. Initial Est. - 9.3% -1.3% -0.2% -3.8% -16.3% -2.5% -0.9% -1.7% -1.4% -6.6%Recurring profit (Initial Est.) 6,800 9,000 9,900 12,105 14,300 16,600 15,500 16,000 17,000 17,500 18,000Recurring profit (Results) 8,187 9,812 9,912 12,089 13,784 13,892 15,092 15,943 16,684 17,381 17,284
Results vs. Initial Est. 20.4% 9.0% 0.1% -0.1% -3.6% -16.3% -2.6% -0.4% -1.9% -0.7% -4.0%Net income (Initial Est.) 3,600 4,600 5,200 6,470 7,600 8,700 8,300 8,600 9,400 10,000 10,700Net income (Results) 4,379 4,876 5,466 6,495 6,912 7,509 8,161 8,725 9,658 10,238 10,316
Results vs. Initial Est. 21.7% 6.0% 5.1% 0.4% -9.1% -13.7% -1.7% 1.5% 2.7% 2.4% -3.6%
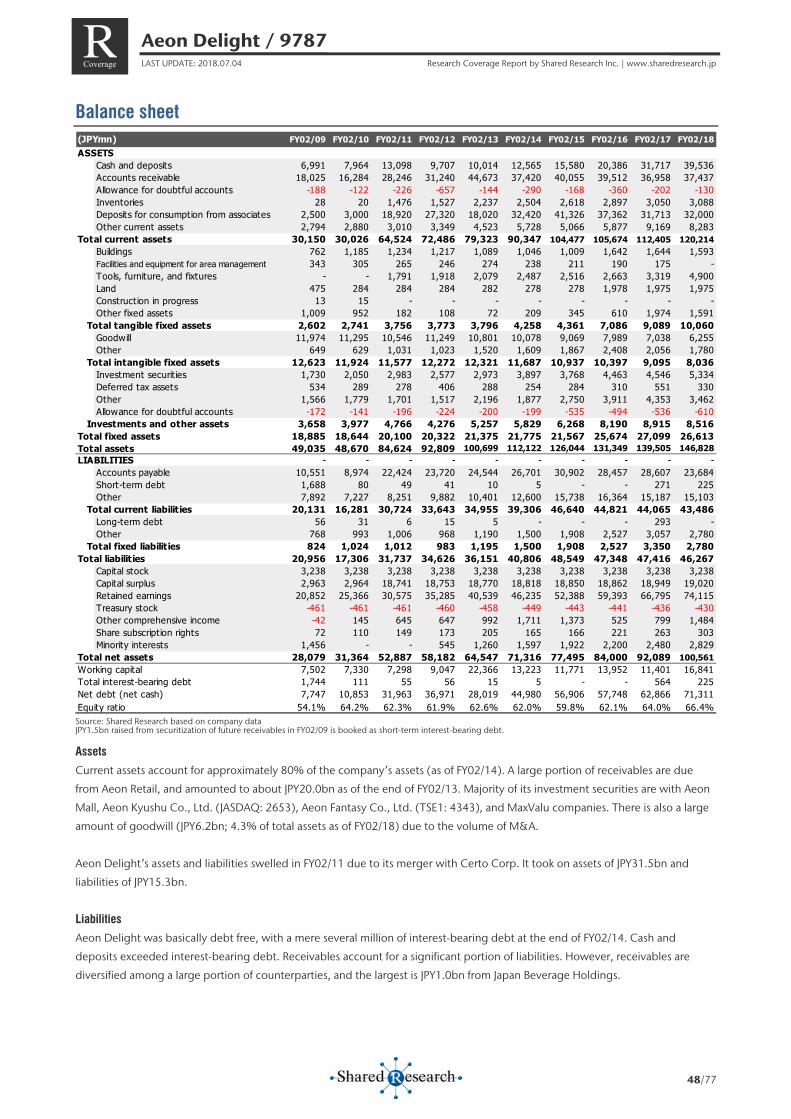
Aeon Delight / 9787 LAST UPDATE: 2018.07.04 Research Coverage Report by Shared Research Inc. | www.sharedresearch.jp
48/77
R Coverage
Balance sheet
Source: Shared Research based on company data JPY1.5bn raised from securitization of future receivables in FY02/09 is booked as short-term interest-bearing debt.
Assets
Current assets account for approximately 80% of the company’s assets (as of FY02/14). A large portion of receivables are due
from Aeon Retail, and amounted to about JPY20.0bn as of the end of FY02/13. Majority of its investment securities are with Aeon
Mall, Aeon Kyushu Co., Ltd. (JASDAQ: 2653), Aeon Fantasy Co., Ltd. (TSE1: 4343), and MaxValu companies. There is also a large
amount of goodwill (JPY6.2bn; 4.3% of total assets as of FY02/18) due to the volume of M&A.
Aeon Delight’s assets and liabilities swelled in FY02/11 due to its merger with Certo Corp. It took on assets of JPY31.5bn and
liabilities of JPY15.3bn.
Liabilities
Aeon Delight was basically debt free, with a mere several million of interest-bearing debt at the end of FY02/14. Cash and
deposits exceeded interest-bearing debt. Receivables account for a significant portion of liabilities. However, receivables are
diversified among a large portion of counterparties, and the largest is JPY1.0bn from Japan Beverage Holdings.
(JPYmn) FY02/09 FY02/10 FY02/11 FY02/12 FY02/13 FY02/14 FY02/15 FY02/16 FY02/17 FY02/18ASSETS
Cash and deposits 6,991 7,964 13,098 9,707 10,014 12,565 15,580 20,386 31,717 39,536Accounts receivable 18,025 16,284 28,246 31,240 44,673 37,420 40,055 39,512 36,958 37,437Allowance for doubtful accounts -188 -122 -226 -657 -144 -290 -168 -360 -202 -130Inventories 28 20 1,476 1,527 2,237 2,504 2,618 2,897 3,050 3,088Deposits for consumption from associates 2,500 3,000 18,920 27,320 18,020 32,420 41,326 37,362 31,713 32,000Other current assets 2,794 2,880 3,010 3,349 4,523 5,728 5,066 5,877 9,169 8,283
Total current assets 30,150 30,026 64,524 72,486 79,323 90,347 104,477 105,674 112,405 120,214Buildings 762 1,185 1,234 1,217 1,089 1,046 1,009 1,642 1,644 1,593Facilities and equipment for area management 343 305 265 246 274 238 211 190 175 -Tools, furniture, and fixtures - - 1,791 1,918 2,079 2,487 2,516 2,663 3,319 4,900Land 475 284 284 284 282 278 278 1,978 1,975 1,975Construction in progress 13 15 - - - - - - - -Other fixed assets 1,009 952 182 108 72 209 345 610 1,974 1,591
Total tangible fixed assets 2,602 2,741 3,756 3,773 3,796 4,258 4,361 7,086 9,089 10,060Goodwill 11,974 11,295 10,546 11,249 10,801 10,078 9,069 7,989 7,038 6,255Other 649 629 1,031 1,023 1,520 1,609 1,867 2,408 2,056 1,780
Total intangible fixed assets 12,623 11,924 11,577 12,272 12,321 11,687 10,937 10,397 9,095 8,036Investment securities 1,730 2,050 2,983 2,577 2,973 3,897 3,768 4,463 4,546 5,334Deferred tax assets 534 289 278 406 288 254 284 310 551 330Other 1,566 1,779 1,701 1,517 2,196 1,877 2,750 3,911 4,353 3,462Allowance for doubtful accounts -172 -141 -196 -224 -200 -199 -535 -494 -536 -610
Investments and other assets 3,658 3,977 4,766 4,276 5,257 5,829 6,268 8,190 8,915 8,516Total fixed assets 18,885 18,644 20,100 20,322 21,375 21,775 21,567 25,674 27,099 26,613Total assets 49,035 48,670 84,624 92,809 100,699 112,122 126,044 131,349 139,505 146,828LIABILITIES - - - - - - - - - -
Accounts payable 10,551 8,974 22,424 23,720 24,544 26,701 30,902 28,457 28,607 23,684Short-term debt 1,688 80 49 41 10 5 - - 271 225Other 7,892 7,227 8,251 9,882 10,401 12,600 15,738 16,364 15,187 15,103
Total current liabilities 20,131 16,281 30,724 33,643 34,955 39,306 46,640 44,821 44,065 43,486Long-term debt 56 31 6 15 5 - - - 293 -Other 768 993 1,006 968 1,190 1,500 1,908 2,527 3,057 2,780
Total fixed liabilities 824 1,024 1,012 983 1,195 1,500 1,908 2,527 3,350 2,780Total liabilities 20,956 17,306 31,737 34,626 36,151 40,806 48,549 47,348 47,416 46,267
Capital stock 3,238 3,238 3,238 3,238 3,238 3,238 3,238 3,238 3,238 3,238Capital surplus 2,963 2,964 18,741 18,753 18,770 18,818 18,850 18,862 18,949 19,020Retained earnings 20,852 25,366 30,575 35,285 40,539 46,235 52,388 59,393 66,795 74,115Treasury stock -461 -461 -461 -460 -458 -449 -443 -441 -436 -430Other comprehensive income -42 145 645 647 992 1,711 1,373 525 799 1,484Share subscription rights 72 110 149 173 205 165 166 221 263 303Minority interests 1,456 - - 545 1,260 1,597 1,922 2,200 2,480 2,829
Total net assets 28,079 31,364 52,887 58,182 64,547 71,316 77,495 84,000 92,089 100,561Working capital 7,502 7,330 7,298 9,047 22,366 13,223 11,771 13,952 11,401 16,841Total interest-bearing debt 1,744 111 55 56 15 5 - - 564 225Net debt (net cash) 7,747 10,853 31,963 36,971 28,019 44,980 56,906 57,748 62,866 71,311Equity ratio 54.1% 64.2% 62.3% 61.9% 62.6% 62.0% 59.8% 62.1% 64.0% 66.4%

Aeon Delight / 9787 LAST UPDATE: 2018.07.04 Research Coverage Report by Shared Research Inc. | www.sharedresearch.jp
49/77
R Coverage
Shareholders’ equity
Equity ratio rose to 64.2% at the end of FY02/10 from 39.9% in FY02/07 due to growth in equity as a result of acquisitions. The
company has maintained a relatively high equity capital ratio for the past four years. However, Shared Research believes that the
company could use financial leverage (i.e., use of debt to acquire additional assets) to expand business and its equity.
Shareholder returns
Aeon Delight aims to provide dividends that correspond to its financial performance in a stable and continuous manner. It aims to
provide a 20% dividend payout ratio, while keeping a close watch on its net asset ratio.
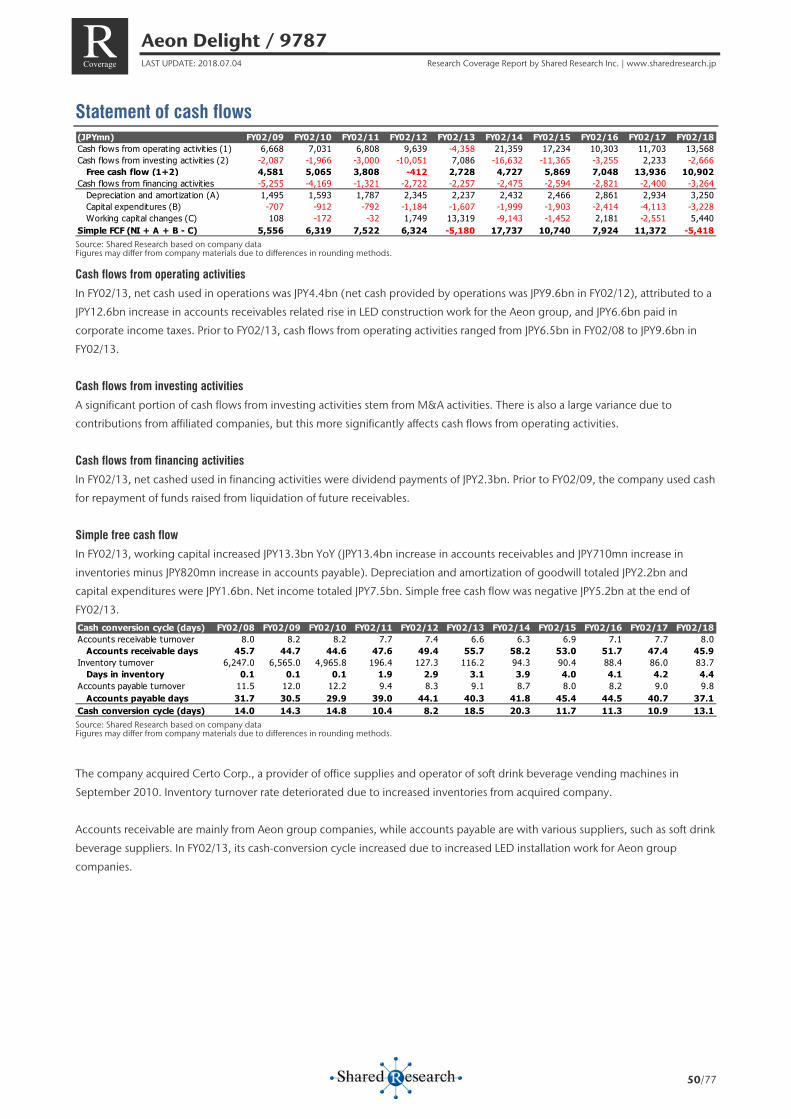
Aeon Delight / 9787 LAST UPDATE: 2018.07.04 Research Coverage Report by Shared Research Inc. | www.sharedresearch.jp
50/77
R Coverage
Statement of cash flows
Source: Shared Research based on company data Figures may differ from company materials due to differences in rounding methods.
Cash flows from operating activities
In FY02/13, net cash used in operations was JPY4.4bn (net cash provided by operations was JPY9.6bn in FY02/12), attributed to a
JPY12.6bn increase in accounts receivables related rise in LED construction work for the Aeon group, and JPY6.6bn paid in
corporate income taxes. Prior to FY02/13, cash flows from operating activities ranged from JPY6.5bn in FY02/08 to JPY9.6bn in
FY02/13.
Cash flows from investing activities
A significant portion of cash flows from investing activities stem from M&A activities. There is also a large variance due to
contributions from affiliated companies, but this more significantly affects cash flows from operating activities.
Cash flows from financing activities
In FY02/13, net cashed used in financing activities were dividend payments of JPY2.3bn. Prior to FY02/09, the company used cash
for repayment of funds raised from liquidation of future receivables.
Simple free cash flow
In FY02/13, working capital increased JPY13.3bn YoY (JPY13.4bn increase in accounts receivables and JPY710mn increase in
inventories minus JPY820mn increase in accounts payable). Depreciation and amortization of goodwill totaled JPY2.2bn and
capital expenditures were JPY1.6bn. Net income totaled JPY7.5bn. Simple free cash flow was negative JPY5.2bn at the end of
FY02/13.
Source: Shared Research based on company data Figures may differ from company materials due to differences in rounding methods.
The company acquired Certo Corp., a provider of office supplies and operator of soft drink beverage vending machines in
September 2010. Inventory turnover rate deteriorated due to increased inventories from acquired company.
Accounts receivable are mainly from Aeon group companies, while accounts payable are with various suppliers, such as soft drink
beverage suppliers. In FY02/13, its cash-conversion cycle increased due to increased LED installation work for Aeon group
companies.
(JPYmn) FY02/09 FY02/10 FY02/11 FY02/12 FY02/13 FY02/14 FY02/15 FY02/16 FY02/17 FY02/18Cash flows from operating activit ies (1) 6,668 7,031 6,808 9,639 -4,358 21,359 17,234 10,303 11,703 13,568Cash flows from investing activities (2) -2,087 -1,966 -3,000 -10,051 7,086 -16,632 -11,365 -3,255 2,233 -2,666
Free cash flow (1+2) 4,581 5,065 3,808 -412 2,728 4,727 5,869 7,048 13,936 10,902Cash flows from financing activities -5,255 -4,169 -1,321 -2,722 -2,257 -2,475 -2,594 -2,821 -2,400 -3,264
Depreciation and amortization (A) 1,495 1,593 1,787 2,345 2,237 2,432 2,466 2,861 2,934 3,250Capital expenditures (B) -707 -912 -792 -1,184 -1,607 -1,999 -1,903 -2,414 -4,113 -3,228Working capital changes (C) 108 -172 -32 1,749 13,319 -9,143 -1,452 2,181 -2,551 5,440
Simple FCF (NI + A + B - C) 5,556 6,319 7,522 6,324 -5,180 17,737 10,740 7,924 11,372 -5,418
Cash conversion cycle (days) FY02/08 FY02/09 FY02/10 FY02/11 FY02/12 FY02/13 FY02/14 FY02/15 FY02/16 FY02/17 FY02/18Accounts receivable turnover 8.0 8.2 8.2 7.7 7.4 6.6 6.3 6.9 7.1 7.7 8.0
Accounts receivable days 45.7 44.7 44.6 47.6 49.4 55.7 58.2 53.0 51.7 47.4 45.9Inventory turnover 6,247.0 6,565.0 4,965.8 196.4 127.3 116.2 94.3 90.4 88.4 86.0 83.7
Days in inventory 0.1 0.1 0.1 1.9 2.9 3.1 3.9 4.0 4.1 4.2 4.4Accounts payable turnover 11.5 12.0 12.2 9.4 8.3 9.1 8.7 8.0 8.2 9.0 9.8
Accounts payable days 31.7 30.5 29.9 39.0 44.1 40.3 41.8 45.4 44.5 40.7 37.1Cash conversion cycle (days) 14.0 14.3 14.8 10.4 8.2 18.5 20.3 11.7 11.3 10.9 13.1
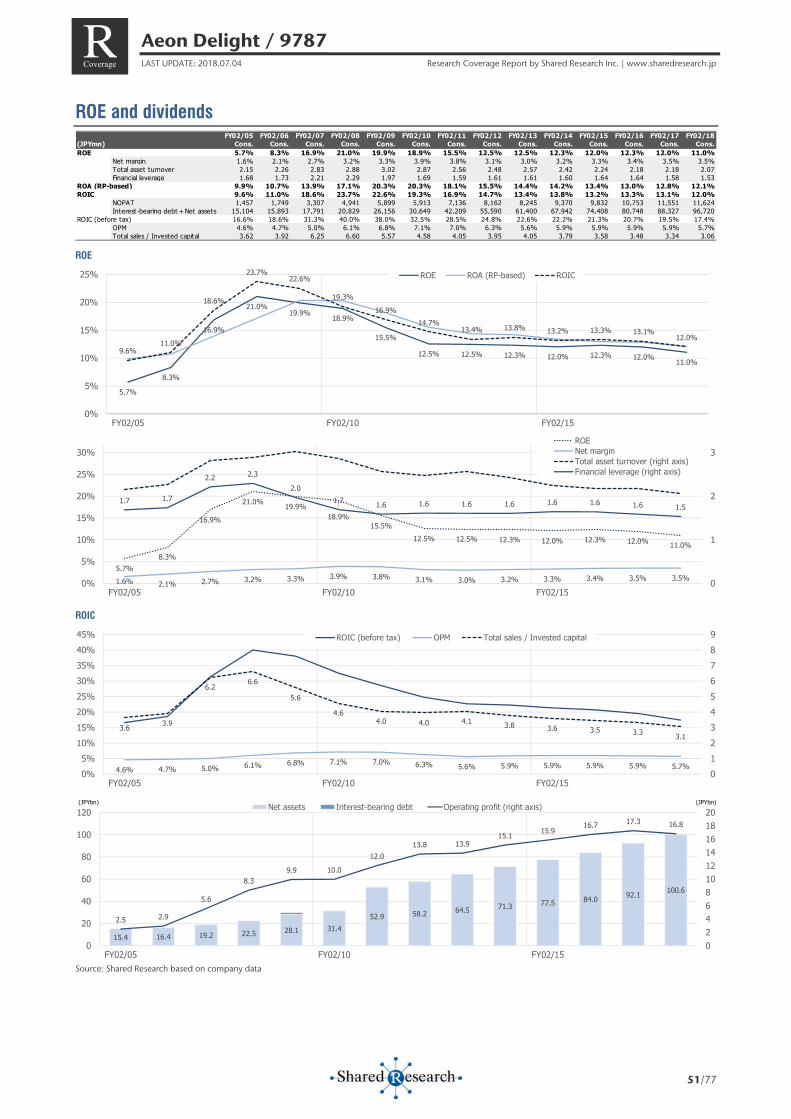
Aeon Delight / 9787 LAST UPDATE: 2018.07.04 Research Coverage Report by Shared Research Inc. | www.sharedresearch.jp
51/77
R Coverage
ROE and dividends
ROE
ROIC
Source: Shared Research based on company data
FY02/05 FY02/06 FY02/07 FY02/08 FY02/09 FY02/10 FY02/11 FY02/12 FY02/13 FY02/14 FY02/15 FY02/16 FY02/17 FY02/18(JPYmn) Cons. Cons. Cons. Cons. Cons. Cons. Cons. Cons. Cons. Cons. Cons. Cons. Cons. Cons.ROE 5.7% 8.3% 16.9% 21.0% 19.9% 18.9% 15.5% 12.5% 12.5% 12.3% 12.0% 12.3% 12.0% 11.0%
Net margin 1.6% 2.1% 2.7% 3.2% 3.3% 3.9% 3.8% 3.1% 3.0% 3.2% 3.3% 3.4% 3.5% 3.5%Total asset turnover 2.15 2.26 2.83 2.88 3.02 2.87 2.56 2.48 2.57 2.42 2.24 2.18 2.18 2.07Financial leverage 1.68 1.73 2.21 2.29 1.97 1.69 1.59 1.61 1.61 1.60 1.64 1.64 1.58 1.53
ROA (RP-based) 9.9% 10.7% 13.9% 17.1% 20.3% 20.3% 18.1% 15.5% 14.4% 14.2% 13.4% 13.0% 12.8% 12.1%ROIC 9.6% 11.0% 18.6% 23.7% 22.6% 19.3% 16.9% 14.7% 13.4% 13.8% 13.2% 13.3% 13.1% 12.0%
NOPAT 1,457 1,749 3,307 4,941 5,899 5,913 7,136 8,162 8,245 9,370 9,832 10,753 11,551 11,624Interest-bearing debt+Net assets 15,104 15,893 17,791 20,829 26,156 30,649 42,209 55,590 61,400 67,942 74,408 80,748 88,327 96,720
ROIC (before tax) 16.6% 18.6% 31.3% 40.0% 38.0% 32.5% 28.5% 24.8% 22.6% 22.2% 21.3% 20.7% 19.5% 17.4%OPM 4.6% 4.7% 5.0% 6.1% 6.8% 7.1% 7.0% 6.3% 5.6% 5.9% 5.9% 5.9% 5.9% 5.7%Total sales / Invested capital 3.62 3.92 6.25 6.60 5.57 4.58 4.05 3.95 4.05 3.79 3.58 3.48 3.34 3.06
5.7%
8.3%
16.9%
21.0%19.9%
18.9%
15.5%
12.5% 12.5% 12.3% 12.0% 12.3% 12.0% 11.0%9.6%
11.0%
18.6%
23.7%22.6%
19.3%16.9%
14.7%13.4% 13.8% 13.2% 13.3% 13.1%
12.0%
0%
5%
10%
15%
20%
25%
FY02/05 FY02/10 FY02/15
ROE ROA (RP-based) ROIC
5.7%8.3%
16.9%
21.0% 19.9%18.9%
15.5%12.5% 12.5% 12.3% 12.0% 12.3% 12.0% 11.0%
1.6% 2.1% 2.7% 3.2% 3.3% 3.9% 3.8% 3.1% 3.0% 3.2% 3.3% 3.4% 3.5% 3.5%
1.7 1.7
2.2 2.3
2.01.7 1.6 1.6 1.6 1.6 1.6 1.6 1.6 1.5
0
1
2
3
0%
5%
10%
15%
20%
25%
30%
FY02/05 FY02/10 FY02/15
ROENet marginTotal asset turnover (right axis)Financial leverage (right axis)
4.6% 4.7% 5.0% 6.1% 6.8% 7.1% 7.0% 6.3% 5.6% 5.9% 5.9% 5.9% 5.9% 5.7%
3.6 3.9
6.26.6
5.6
4.64.0 4.0 4.1 3.8 3.6 3.5 3.3 3.1
0123456789
0%5%
10%15%20%25%30%35%40%45%
FY02/05 FY02/10 FY02/15
ROIC (before tax) OPM Total sales / Invested capital
15.4 16.4 19.2 22.5 28.1 31.452.9 58.2 64.5 71.3 77.5 84.0 92.1 100.6
2.5 2.9
5.6
8.39.9 10.0
12.013.8 13.9
15.1 15.916.7 17.3 16.8
02468101214161820
0
20
40
60
80
100
120
FY02/05 FY02/10 FY02/15
Net assets Interest-bearing debt Operating profit (right axis)(JPYbn) (JPYbn)
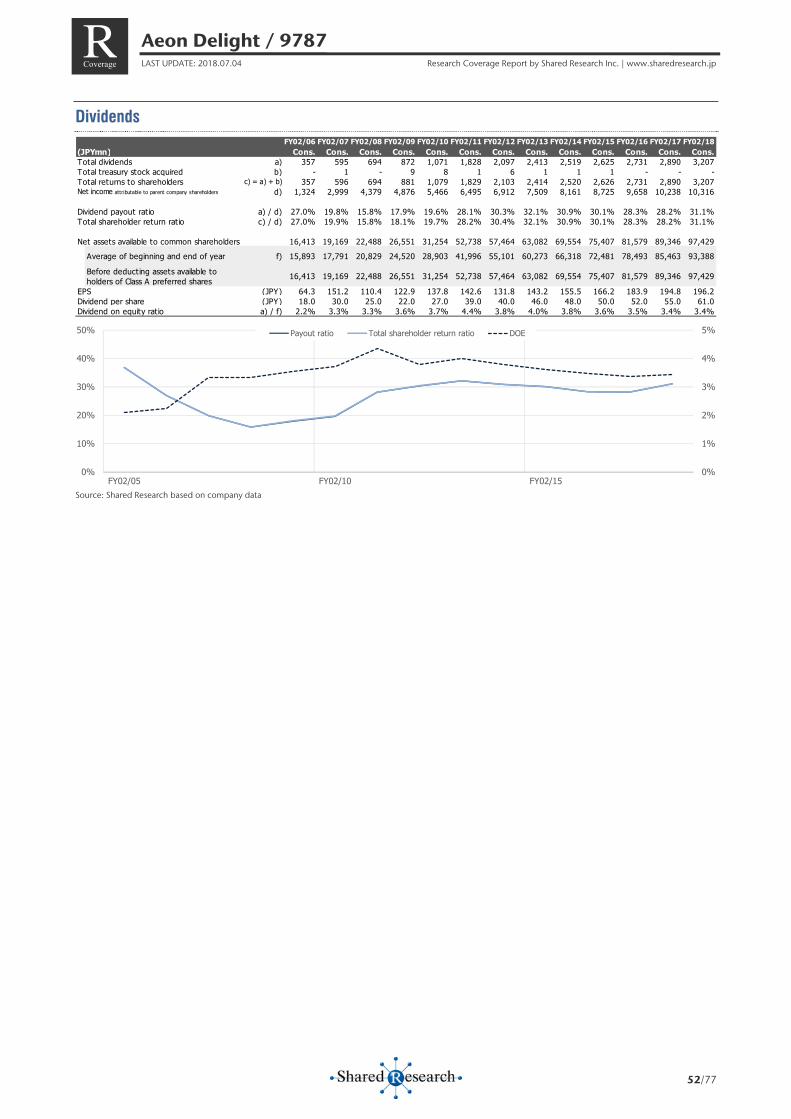
Aeon Delight / 9787 LAST UPDATE: 2018.07.04 Research Coverage Report by Shared Research Inc. | www.sharedresearch.jp
52/77
R Coverage
Dividends
Source: Shared Research based on company data
FY02/06 FY02/07 FY02/08 FY02/09 FY02/10 FY02/11 FY02/12 FY02/13 FY02/14 FY02/15 FY02/16 FY02/17 FY02/18(JPYmn) Cons. Cons. Cons. Cons. Cons. Cons. Cons. Cons. Cons. Cons. Cons. Cons. Cons.Total dividends a) 357 595 694 872 1,071 1,828 2,097 2,413 2,519 2,625 2,731 2,890 3,207Total treasury stock acquired b) - 1 - 9 8 1 6 1 1 1 - - -Total returns to shareholders c) = a) + b) 357 596 694 881 1,079 1,829 2,103 2,414 2,520 2,626 2,731 2,890 3,207Net income attributable to parent company shareholders d) 1,324 2,999 4,379 4,876 5,466 6,495 6,912 7,509 8,161 8,725 9,658 10,238 10,316
Dividend payout ratio a) / d) 27.0% 19.8% 15.8% 17.9% 19.6% 28.1% 30.3% 32.1% 30.9% 30.1% 28.3% 28.2% 31.1%Total shareholder return ratio c) / d) 27.0% 19.9% 15.8% 18.1% 19.7% 28.2% 30.4% 32.1% 30.9% 30.1% 28.3% 28.2% 31.1%
Net assets available to common shareholders 16,413 19,169 22,488 26,551 31,254 52,738 57,464 63,082 69,554 75,407 81,579 89,346 97,429
Average of beginning and end of year f) 15,893 17,791 20,829 24,520 28,903 41,996 55,101 60,273 66,318 72,481 78,493 85,463 93,388
Before deducting assets available toholders of Class A preferred shares 16,413 19,169 22,488 26,551 31,254 52,738 57,464 63,082 69,554 75,407 81,579 89,346 97,429
EPS (JPY) 64.3 151.2 110.4 122.9 137.8 142.6 131.8 143.2 155.5 166.2 183.9 194.8 196.2Dividend per share (JPY) 18.0 30.0 25.0 22.0 27.0 39.0 40.0 46.0 48.0 50.0 52.0 55.0 61.0Dividend on equity ratio a) / f) 2.2% 3.3% 3.3% 3.6% 3.7% 4.4% 3.8% 4.0% 3.8% 3.6% 3.5% 3.4% 3.4%
0%
1%
2%
3%
4%
5%
0%
10%
20%
30%
40%
50%
FY02/05 FY02/10 FY02/15
Payout ratio Total shareholder return ratio DOE
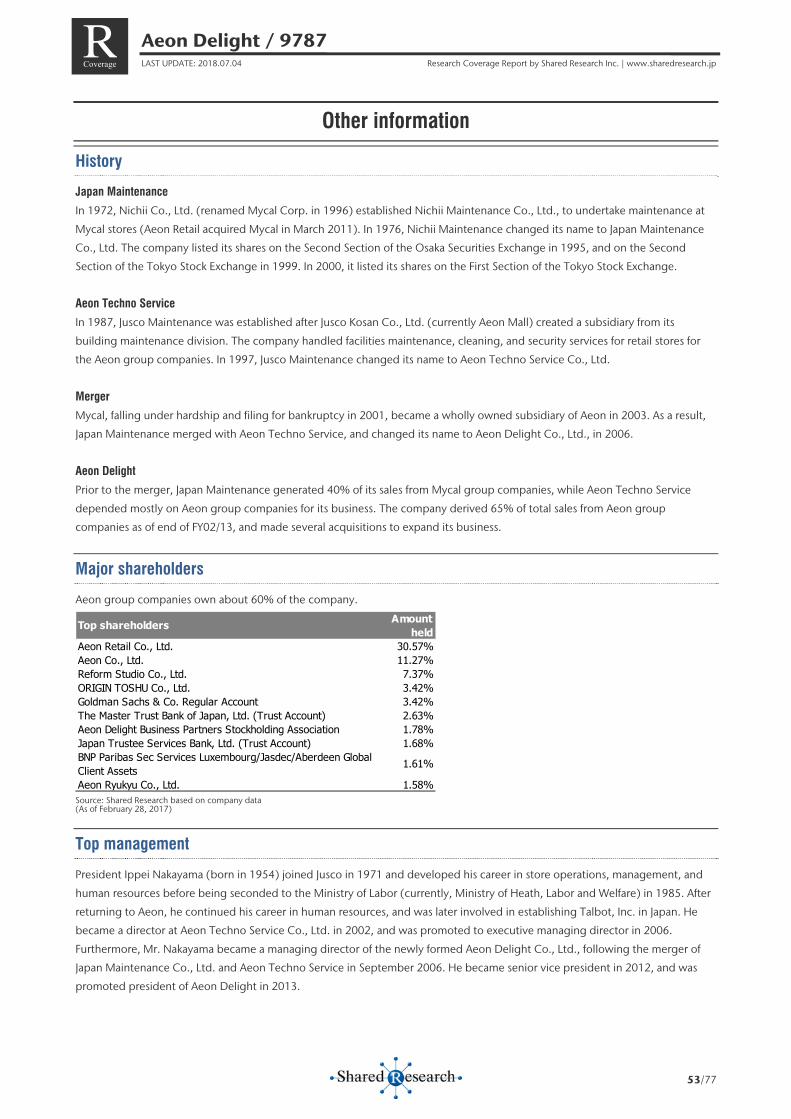
Aeon Delight / 9787 LAST UPDATE: 2018.07.04 Research Coverage Report by Shared Research Inc. | www.sharedresearch.jp
53/77
R Coverage
Other information
History
Japan Maintenance
In 1972, Nichii Co., Ltd. (renamed Mycal Corp. in 1996) established Nichii Maintenance Co., Ltd., to undertake maintenance at
Mycal stores (Aeon Retail acquired Mycal in March 2011). In 1976, Nichii Maintenance changed its name to Japan Maintenance
Co., Ltd. The company listed its shares on the Second Section of the Osaka Securities Exchange in 1995, and on the Second
Section of the Tokyo Stock Exchange in 1999. In 2000, it listed its shares on the First Section of the Tokyo Stock Exchange.
Aeon Techno Service
In 1987, Jusco Maintenance was established after Jusco Kosan Co., Ltd. (currently Aeon Mall) created a subsidiary from its
building maintenance division. The company handled facilities maintenance, cleaning, and security services for retail stores for
the Aeon group companies. In 1997, Jusco Maintenance changed its name to Aeon Techno Service Co., Ltd.
Merger
Mycal, falling under hardship and filing for bankruptcy in 2001, became a wholly owned subsidiary of Aeon in 2003. As a result,
Japan Maintenance merged with Aeon Techno Service, and changed its name to Aeon Delight Co., Ltd., in 2006.
Aeon Delight
Prior to the merger, Japan Maintenance generated 40% of its sales from Mycal group companies, while Aeon Techno Service
depended mostly on Aeon group companies for its business. The company derived 65% of total sales from Aeon group
companies as of end of FY02/13, and made several acquisitions to expand its business.
Major shareholders
Aeon group companies own about 60% of the company.
Source: Shared Research based on company data (As of February 28, 2017)
Top management
President Ippei Nakayama (born in 1954) joined Jusco in 1971 and developed his career in store operations, management, and
human resources before being seconded to the Ministry of Labor (currently, Ministry of Heath, Labor and Welfare) in 1985. After
returning to Aeon, he continued his career in human resources, and was later involved in establishing Talbot, Inc. in Japan. He
became a director at Aeon Techno Service Co., Ltd. in 2002, and was promoted to executive managing director in 2006.
Furthermore, Mr. Nakayama became a managing director of the newly formed Aeon Delight Co., Ltd., following the merger of
Japan Maintenance Co., Ltd. and Aeon Techno Service in September 2006. He became senior vice president in 2012, and was
promoted president of Aeon Delight in 2013.
Top shareholders Amountheld
Aeon Retail Co., Ltd. 30.57%Aeon Co., Ltd. 11.27%Reform Studio Co., Ltd. 7.37%ORIGIN TOSHU Co., Ltd. 3.42%Goldman Sachs & Co. Regular Account 3.42%The Master Trust Bank of Japan, Ltd. (Trust Account) 2.63%Aeon Delight Business Partners Stockholding Association 1.78%Japan Trustee Services Bank, Ltd. (Trust Account) 1.68%BNP Paribas Sec Services Luxembourg/Jasdec/Aberdeen GlobalClient Assets 1.61%
Aeon Ryukyu Co., Ltd. 1.58%
Aeon Delight / 9787 LAST UPDATE: 2018.07.04 Research Coverage Report by Shared Research Inc. | www.sharedresearch.jp
54/77
R Coverage
Employees
Aeon Delight had 12,558 employees and an average of 6,791 temporary employees on a consolidated basis as of FY02/17. At the
parent level, there were 4,004 employees and 2,398 temporary employees. The average age, average length of employment,
and average annual salary on a parent basis are as follows:
▷ Average age: 46 years and 2 months
▷ Average length of employment: 10.5 years
▷ Average annual salary: JPY4.8mn
Investor relations
Aeon Delight holds earnings briefings twice a year (following half-year and full-year business results).
By the way
Corporate Social Responsibility (CSR) Activities
Aeon Delight is pursuing corporate social responsibility (CSR) activities by strengthening its efforts to protect the environment
with a management principle of creating “environmental value” for clients.
The following are examples of the company’s environmental initiatives:
Promotion of energy-saving lighting equipment
The company is promoting energy-saving lighting devices, such as light emitting diode (LED) lamps, that significantly reduce
electricity consumption. The company seeks to help clients cut carbon dioxide emissions and reduce expenses by selecting the
most suitable source of lighting depending on the situation and intended use, such as lighting for room interior or a parking
space, and for illuminating a billboard.
Proposal for environmentally friendly packaging
The company proposes a variety of packaging materials, including biomass materials obtained during the growth process of
plants that do not increase carbon dioxide when burned, as well as water based gravure printing that has low environmental
impact.
Introduction of environmentally friendly vending machines
The company introduced environmentally friendly vending machines that can reduce electricity consumption by as much as 45%
a year with the use of heat pumps and LED lighting. The company unveiled heat-pump vending machines in 2008, and those
equipped with LED lighting in 2011.
Participation in Aeon 1% Club
Aeon 1% Club supports projects to protect the environment, boost international cultural and human exchange, promote regional
cultural and social activities, and donate to welfare projects. It is an initiative under which group companies contribute 1% of
their pretax profits so that these activities can be maintained regardless of the companies’ business performances.
Tree planting through Aeon Environmental Foundation
The company participated in a tree-planting event in Beijing, China in fiscal year 2010, took part in a similar project in Jakarta,
Indonesia in fiscal year 2011 and 2012, respectively. For the tree planting event in Jakarta held during fiscal year 2012, the
company sponsored participation of endorsing companies, in addition to having its employees from Japan volunteering for the
event
Aeon Delight / 9787 LAST UPDATE: 2018.07.04 Research Coverage Report by Shared Research Inc. | www.sharedresearch.jp
55/77
R Coverage
“Clean Day” on the 11th Day of Each Month
The company designated the 11th day of each month as “Clean Day,” where employees clean streets around their workplaces
before the start of the working day.
The company also conducts a number of social contributions as part of its CSR activities:
Volunteering at social welfare facilities
The company conducts volunteer activities at nationwide welfare facilities once a year, using the system of the Aeon Social
Welfare Foundation.
Shopping basket cleaning outsourced to vocational aid facilities
The company outsources cleaning of its shopping baskets to vocational aid centers. Shopping baskets used at its stores are sent
to six “washing centers” within the vocational facilities, where the baskets are washed and applied with anti-bacterial coating.
Construction of a school in Laos (completed in June 2008)
The Aeon Delight group conducted fund raising activities, and through the Aeon 1% Club and the Japan Committee for UNICEF,
constructed and donated a school in Laos named “Aeon Good-Job School.”
In addition, Aeon Delight’s logo is a mascot named “Gu Jo-Kun,” derived from “a good job!” and symbolizes that the company
wishes to make all people happy.
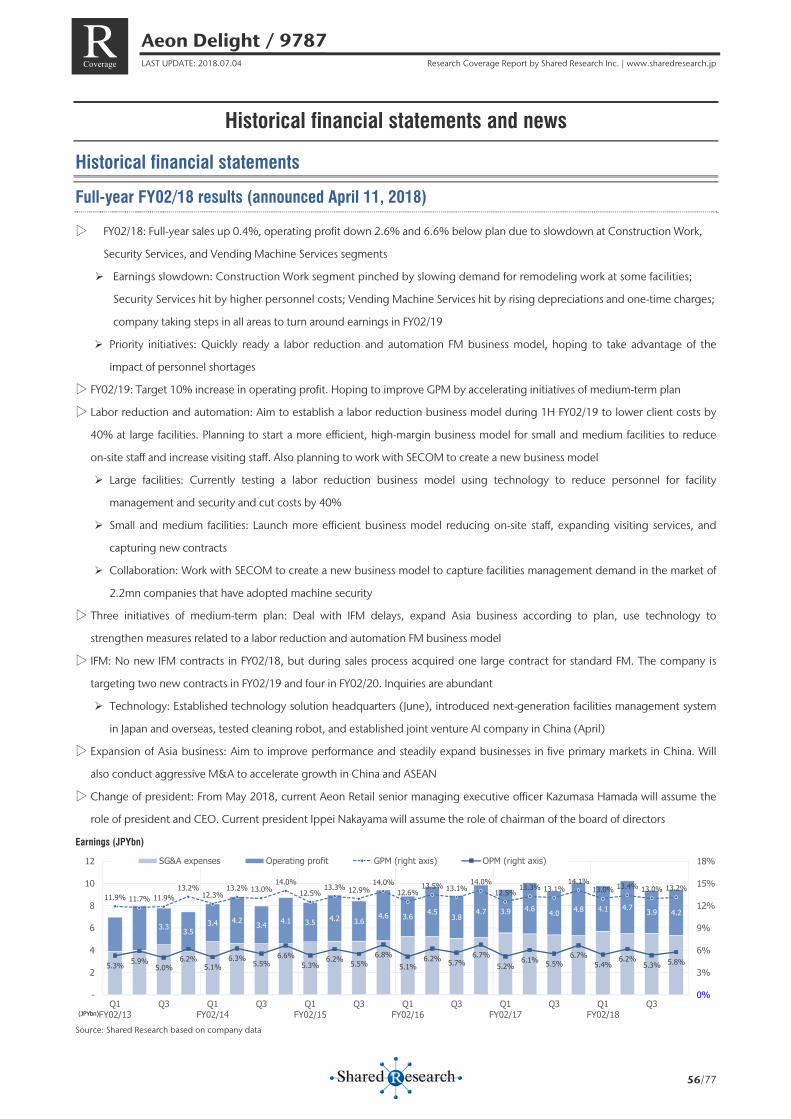
Aeon Delight / 9787 LAST UPDATE: 2018.07.04 Research Coverage Report by Shared Research Inc. | www.sharedresearch.jp
56/77
R Coverage
Historical financial statements and news
Historical financial statements
Full-year FY02/18 results (announced April 11, 2018)
▷ FY02/18: Full-year sales up 0.4%, operating profit down 2.6% and 6.6% below plan due to slowdown at Construction Work,
Security Services, and Vending Machine Services segments
Earnings slowdown: Construction Work segment pinched by slowing demand for remodeling work at some facilities;
Security Services hit by higher personnel costs; Vending Machine Services hit by rising depreciations and one-time charges;
company taking steps in all areas to turn around earnings in FY02/19
Priority initiatives: Quickly ready a labor reduction and automation FM business model, hoping to take advantage of the
impact of personnel shortages
▷ FY02/19: Target 10% increase in operating profit. Hoping to improve GPM by accelerating initiatives of medium-term plan
▷ Labor reduction and automation: Aim to establish a labor reduction business model during 1H FY02/19 to lower client costs by
40% at large facilities. Planning to start a more efficient, high-margin business model for small and medium facilities to reduce
on-site staff and increase visiting staff. Also planning to work with SECOM to create a new business model
Large facilities: Currently testing a labor reduction business model using technology to reduce personnel for facility
management and security and cut costs by 40%
Small and medium facilities: Launch more efficient business model reducing on-site staff, expanding visiting services, and
capturing new contracts
Collaboration: Work with SECOM to create a new business model to capture facilities management demand in the market of
2.2mn companies that have adopted machine security
▷ Three initiatives of medium-term plan: Deal with IFM delays, expand Asia business according to plan, use technology to
strengthen measures related to a labor reduction and automation FM business model
▷ IFM: No new IFM contracts in FY02/18, but during sales process acquired one large contract for standard FM. The company is
targeting two new contracts in FY02/19 and four in FY02/20. Inquiries are abundant
Technology: Established technology solution headquarters (June), introduced next-generation facilities management system
in Japan and overseas, tested cleaning robot, and established joint venture AI company in China (April)
▷ Expansion of Asia business: Aim to improve performance and steadily expand businesses in five primary markets in China. Will
also conduct aggressive M&A to accelerate growth in China and ASEAN
▷ Change of president: From May 2018, current Aeon Retail senior managing executive officer Kazumasa Hamada will assume the
role of president and CEO. Current president Ippei Nakayama will assume the role of chairman of the board of directors
Earnings (JPYbn)
Source: Shared Research based on company data
3.3 3.5 3.4 4.2 3.4 4.1 3.5 4.2 3.6
4.6 3.6 4.5 3.8
4.7 3.9 4.6 4.0 4.8 4.1 4.7 3.9 4.2
11.9% 11.7% 11.9%13.2%
12.3%13.2% 13.0%
14.0%12.5%
13.3% 12.9%14.0%
12.6%13.5% 13.1%
14.0%12.5% 13.3% 13.1%
14.1%13.0% 13.4% 13.0% 13.2%
5.3% 5.9%5.0%
6.2%5.1%
6.3% 5.5%6.6%
5.3%6.2% 5.5%
6.8%5.1%
6.2% 5.7%6.7%
5.2%6.1% 5.5%
6.7%5.4%
6.2%5.3% 5.8%
0%
3%
6%
9%
12%
15%
18%
-
2
4
6
8
10
12
Q1FY02/13
Q3 Q1FY02/14
Q3 Q1FY02/15
Q3 Q1FY02/16
Q3 Q1FY02/17
Q3 Q1FY02/18
Q3
SG&A expenses Operating profit GPM (right axis) OPM (right axis)
(JPYbn)
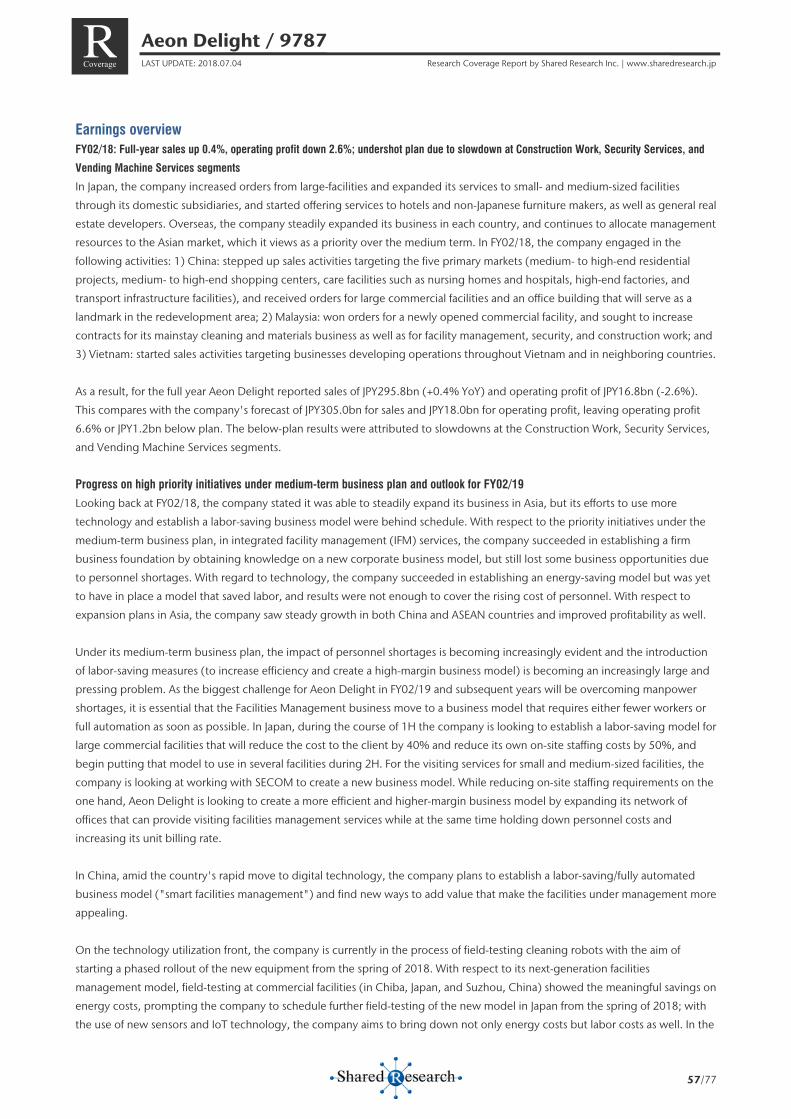
Aeon Delight / 9787 LAST UPDATE: 2018.07.04 Research Coverage Report by Shared Research Inc. | www.sharedresearch.jp
57/77
R Coverage
Earnings overview FY02/18: Full-year sales up 0.4%, operating profit down 2.6%; undershot plan due to slowdown at Construction Work, Security Services, and
Vending Machine Services segments
In Japan, the company increased orders from large-facilities and expanded its services to small- and medium-sized facilities
through its domestic subsidiaries, and started offering services to hotels and non-Japanese furniture makers, as well as general real
estate developers. Overseas, the company steadily expanded its business in each country, and continues to allocate management
resources to the Asian market, which it views as a priority over the medium term. In FY02/18, the company engaged in the
following activities: 1) China: stepped up sales activities targeting the five primary markets (medium- to high-end residential
projects, medium- to high-end shopping centers, care facilities such as nursing homes and hospitals, high-end factories, and
transport infrastructure facilities), and received orders for large commercial facilities and an office building that will serve as a
landmark in the redevelopment area; 2) Malaysia: won orders for a newly opened commercial facility, and sought to increase
contracts for its mainstay cleaning and materials business as well as for facility management, security, and construction work; and
3) Vietnam: started sales activities targeting businesses developing operations throughout Vietnam and in neighboring countries.
As a result, for the full year Aeon Delight reported sales of JPY295.8bn (+0.4% YoY) and operating profit of JPY16.8bn (-2.6%).
This compares with the company's forecast of JPY305.0bn for sales and JPY18.0bn for operating profit, leaving operating profit
6.6% or JPY1.2bn below plan. The below-plan results were attributed to slowdowns at the Construction Work, Security Services,
and Vending Machine Services segments.
Progress on high priority initiatives under medium-term business plan and outlook for FY02/19
Looking back at FY02/18, the company stated it was able to steadily expand its business in Asia, but its efforts to use more
technology and establish a labor-saving business model were behind schedule. With respect to the priority initiatives under the
medium-term business plan, in integrated facility management (IFM) services, the company succeeded in establishing a firm
business foundation by obtaining knowledge on a new corporate business model, but still lost some business opportunities due
to personnel shortages. With regard to technology, the company succeeded in establishing an energy-saving model but was yet
to have in place a model that saved labor, and results were not enough to cover the rising cost of personnel. With respect to
expansion plans in Asia, the company saw steady growth in both China and ASEAN countries and improved profitability as well.
Under its medium-term business plan, the impact of personnel shortages is becoming increasingly evident and the introduction
of labor-saving measures (to increase efficiency and create a high-margin business model) is becoming an increasingly large and
pressing problem. As the biggest challenge for Aeon Delight in FY02/19 and subsequent years will be overcoming manpower
shortages, it is essential that the Facilities Management business move to a business model that requires either fewer workers or
full automation as soon as possible. In Japan, during the course of 1H the company is looking to establish a labor-saving model for
large commercial facilities that will reduce the cost to the client by 40% and reduce its own on-site staffing costs by 50%, and
begin putting that model to use in several facilities during 2H. For the visiting services for small and medium-sized facilities, the
company is looking at working with SECOM to create a new business model. While reducing on-site staffing requirements on the
one hand, Aeon Delight is looking to create a more efficient and higher-margin business model by expanding its network of
offices that can provide visiting facilities management services while at the same time holding down personnel costs and
increasing its unit billing rate.
In China, amid the country's rapid move to digital technology, the company plans to establish a labor-saving/fully automated
business model ("smart facilities management") and find new ways to add value that make the facilities under management more
appealing.
On the technology utilization front, the company is currently in the process of field-testing cleaning robots with the aim of
starting a phased rollout of the new equipment from the spring of 2018. With respect to its next-generation facilities
management model, field-testing at commercial facilities (in Chiba, Japan, and Suzhou, China) showed the meaningful savings on
energy costs, prompting the company to schedule further field-testing of the new model in Japan from the spring of 2018; with
the use of new sensors and IoT technology, the company aims to bring down not only energy costs but labor costs as well. In the
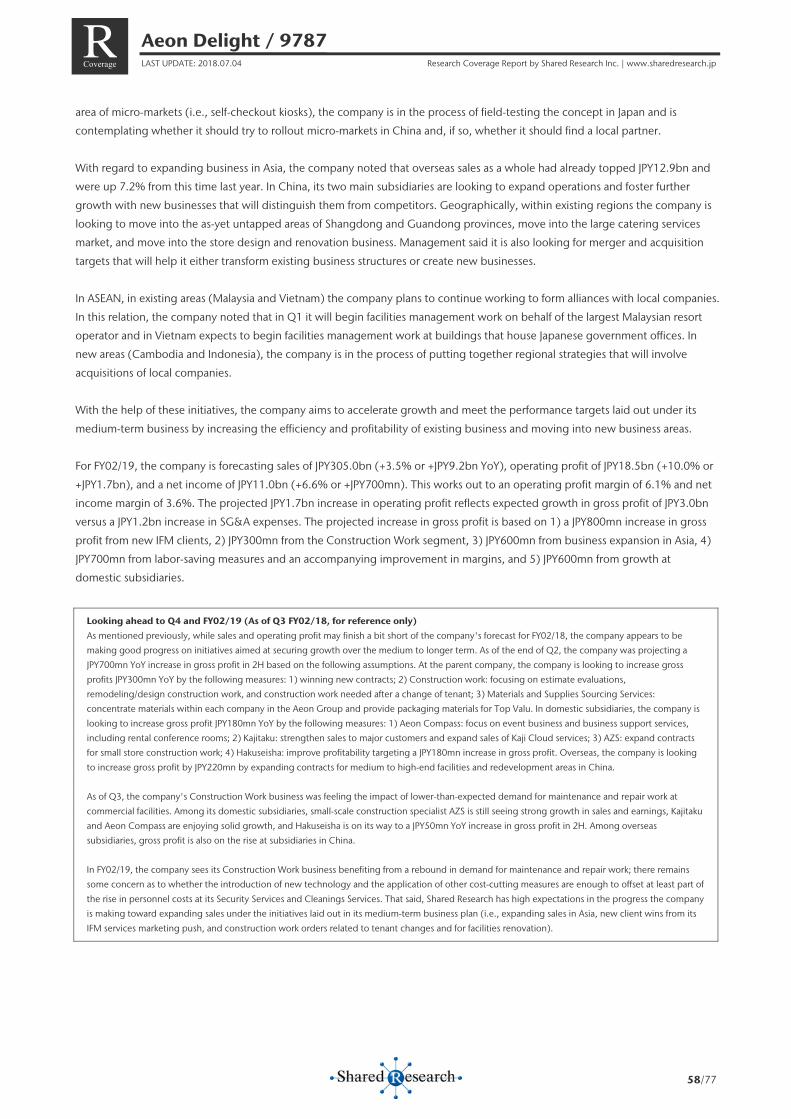
Aeon Delight / 9787 LAST UPDATE: 2018.07.04 Research Coverage Report by Shared Research Inc. | www.sharedresearch.jp
58/77
R Coverage
area of micro-markets (i.e., self-checkout kiosks), the company is in the process of field-testing the concept in Japan and is
contemplating whether it should try to rollout micro-markets in China and, if so, whether it should find a local partner.
With regard to expanding business in Asia, the company noted that overseas sales as a whole had already topped JPY12.9bn and
were up 7.2% from this time last year. In China, its two main subsidiaries are looking to expand operations and foster further
growth with new businesses that will distinguish them from competitors. Geographically, within existing regions the company is
looking to move into the as-yet untapped areas of Shangdong and Guandong provinces, move into the large catering services
market, and move into the store design and renovation business. Management said it is also looking for merger and acquisition
targets that will help it either transform existing business structures or create new businesses.
In ASEAN, in existing areas (Malaysia and Vietnam) the company plans to continue working to form alliances with local companies.
In this relation, the company noted that in Q1 it will begin facilities management work on behalf of the largest Malaysian resort
operator and in Vietnam expects to begin facilities management work at buildings that house Japanese government offices. In
new areas (Cambodia and Indonesia), the company is in the process of putting together regional strategies that will involve
acquisitions of local companies.
With the help of these initiatives, the company aims to accelerate growth and meet the performance targets laid out under its
medium-term business by increasing the efficiency and profitability of existing business and moving into new business areas.
For FY02/19, the company is forecasting sales of JPY305.0bn (+3.5% or +JPY9.2bn YoY), operating profit of JPY18.5bn (+10.0% or
+JPY1.7bn), and a net income of JPY11.0bn (+6.6% or +JPY700mn). This works out to an operating profit margin of 6.1% and net
income margin of 3.6%. The projected JPY1.7bn increase in operating profit reflects expected growth in gross profit of JPY3.0bn
versus a JPY1.2bn increase in SG&A expenses. The projected increase in gross profit is based on 1) a JPY800mn increase in gross
profit from new IFM clients, 2) JPY300mn from the Construction Work segment, 3) JPY600mn from business expansion in Asia, 4)
JPY700mn from labor-saving measures and an accompanying improvement in margins, and 5) JPY600mn from growth at
domestic subsidiaries.
Looking ahead to Q4 and FY02/19 (As of Q3 FY02/18, for reference only)
As mentioned previously, while sales and operating profit may finish a bit short of the company's forecast for FY02/18, the company appears to be
making good progress on initiatives aimed at securing growth over the medium to longer term. As of the end of Q2, the company was projecting a
JPY700mn YoY increase in gross profit in 2H based on the following assumptions. At the parent company, the company is looking to increase gross
profits JPY300mn YoY by the following measures: 1) winning new contracts; 2) Construction work: focusing on estimate evaluations,
remodeling/design construction work, and construction work needed after a change of tenant; 3) Materials and Supplies Sourcing Services:
concentrate materials within each company in the Aeon Group and provide packaging materials for Top Valu. In domestic subsidiaries, the company is
looking to increase gross profit JPY180mn YoY by the following measures: 1) Aeon Compass: focus on event business and business support services,
including rental conference rooms; 2) Kajitaku: strengthen sales to major customers and expand sales of Kaji Cloud services; 3) AZS: expand contracts
for small store construction work; 4) Hakuseisha: improve profitability targeting a JPY180mn increase in gross profit. Overseas, the company is looking
to increase gross profit by JPY220mn by expanding contracts for medium to high-end facilities and redevelopment areas in China.
As of Q3, the company's Construction Work business was feeling the impact of lower-than-expected demand for maintenance and repair work at
commercial facilities. Among its domestic subsidiaries, small-scale construction specialist AZS is still seeing strong growth in sales and earnings, Kajitaku
and Aeon Compass are enjoying solid growth, and Hakuseisha is on its way to a JPY50mn YoY increase in gross profit in 2H. Among overseas
subsidiaries, gross profit is also on the rise at subsidiaries in China.
In FY02/19, the company sees its Construction Work business benefiting from a rebound in demand for maintenance and repair work; there remains
some concern as to whether the introduction of new technology and the application of other cost-cutting measures are enough to offset at least part of
the rise in personnel costs at its Security Services and Cleanings Services. That said, Shared Research has high expectations in the progress the company
is making toward expanding sales under the initiatives laid out in its medium-term business plan (i.e., expanding sales in Asia, new client wins from its
IFM services marketing push, and construction work orders related to tenant changes and for facilities renovation).
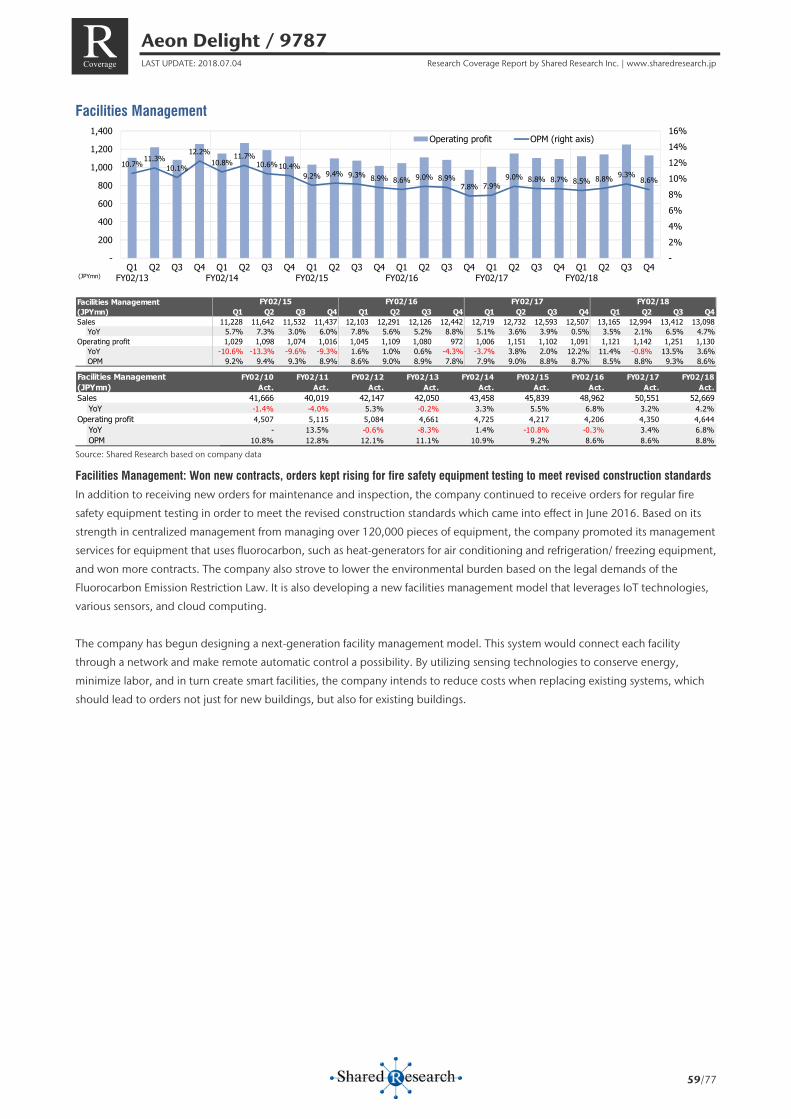
Aeon Delight / 9787 LAST UPDATE: 2018.07.04 Research Coverage Report by Shared Research Inc. | www.sharedresearch.jp
59/77
R Coverage
Facilities Management
Source: Shared Research based on company data
Facilities Management: Won new contracts, orders kept rising for fire safety equipment testing to meet revised construction standards
In addition to receiving new orders for maintenance and inspection, the company continued to receive orders for regular fire
safety equipment testing in order to meet the revised construction standards which came into effect in June 2016. Based on its
strength in centralized management from managing over 120,000 pieces of equipment, the company promoted its management
services for equipment that uses fluorocarbon, such as heat-generators for air conditioning and refrigeration/ freezing equipment,
and won more contracts. The company also strove to lower the environmental burden based on the legal demands of the
Fluorocarbon Emission Restriction Law. It is also developing a new facilities management model that leverages IoT technologies,
various sensors, and cloud computing.
The company has begun designing a next-generation facility management model. This system would connect each facility
through a network and make remote automatic control a possibility. By utilizing sensing technologies to conserve energy,
minimize labor, and in turn create smart facilities, the company intends to reduce costs when replacing existing systems, which
should lead to orders not just for new buildings, but also for existing buildings.
10.7%11.3%
10.1%
12.2%10.8%
11.7%10.6%10.4%
9.2% 9.4% 9.3% 8.9% 8.6% 9.0% 8.9%7.8% 7.9%
9.0% 8.8% 8.7% 8.5% 8.8% 9.3%8.6%
-2%4%6%8%10%12%14%16%
-
200
400
600
800
1,000
1,200
1,400
Q1FY02/13
Q2 Q3 Q4 Q1FY02/14
Q2 Q3 Q4 Q1FY02/15
Q2 Q3 Q4 Q1FY02/16
Q2 Q3 Q4 Q1FY02/17
Q2 Q3 Q4 Q1FY02/18
Q2 Q3 Q4
Operating profit OPM (right axis)
(JPYmn)
Facilities Management(JPYmn) Q1 Q2 Q3 Q4 Q1 Q2 Q3 Q4 Q1 Q2 Q3 Q4 Q1 Q2 Q3 Q4Sales 11,228 11,642 11,532 11,437 12,103 12,291 12,126 12,442 12,719 12,732 12,593 12,507 13,165 12,994 13,412 13,098
YoY 5.7% 7.3% 3.0% 6.0% 7.8% 5.6% 5.2% 8.8% 5.1% 3.6% 3.9% 0.5% 3.5% 2.1% 6.5% 4.7%Operating profit 1,029 1,098 1,074 1,016 1,045 1,109 1,080 972 1,006 1,151 1,102 1,091 1,121 1,142 1,251 1,130
YoY -10.6% -13.3% -9.6% -9.3% 1.6% 1.0% 0.6% -4.3% -3.7% 3.8% 2.0% 12.2% 11.4% -0.8% 13.5% 3.6%OPM 9.2% 9.4% 9.3% 8.9% 8.6% 9.0% 8.9% 7.8% 7.9% 9.0% 8.8% 8.7% 8.5% 8.8% 9.3% 8.6%
FY02/18FY02/17FY02/16FY02/15
Facilities Management FY02/10 FY02/11 FY02/12 FY02/13 FY02/14 FY02/15 FY02/16 FY02/17 FY02/18(JPYmn) Act. Act. Act. Act. Act. Act. Act. Act. Act.Sales 41,666 40,019 42,147 42,050 43,458 45,839 48,962 50,551 52,669
YoY -1.4% -4.0% 5.3% -0.2% 3.3% 5.5% 6.8% 3.2% 4.2%Operating profit 4,507 5,115 5,084 4,661 4,725 4,217 4,206 4,350 4,644
YoY - 13.5% -0.6% -8.3% 1.4% -10.8% -0.3% 3.4% 6.8%OPM 10.8% 12.8% 12.1% 11.1% 10.9% 9.2% 8.6% 8.6% 8.8%
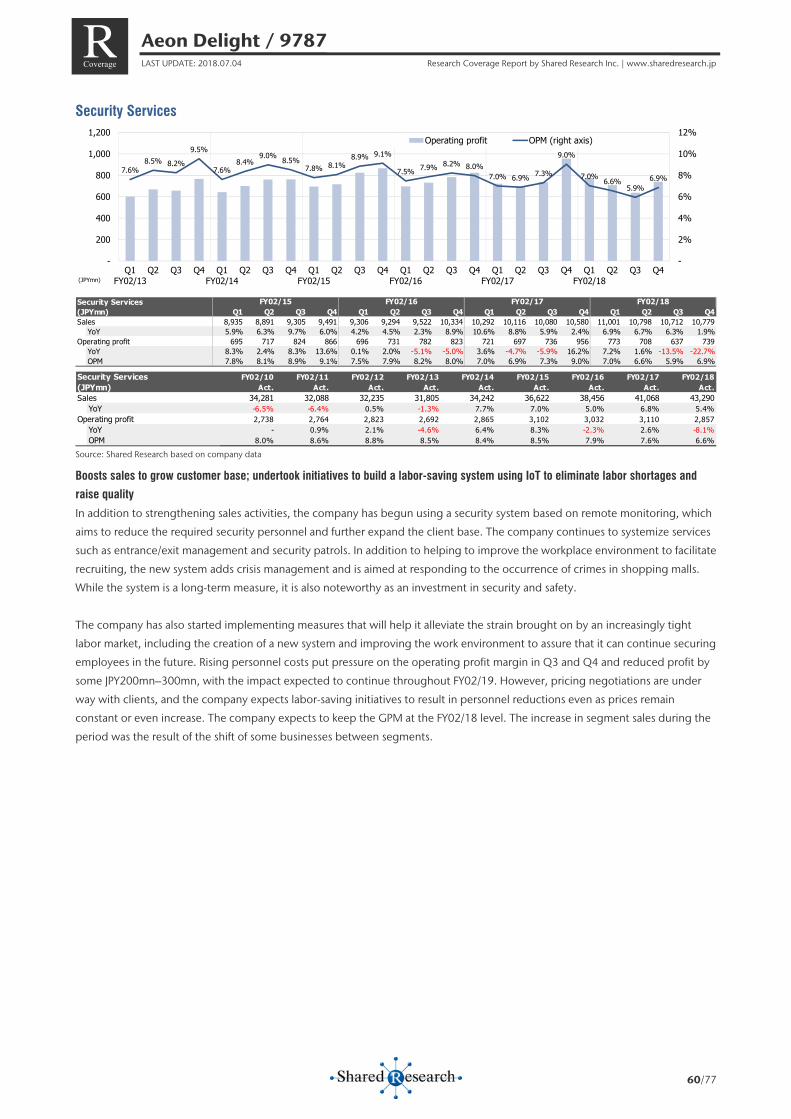
Aeon Delight / 9787 LAST UPDATE: 2018.07.04 Research Coverage Report by Shared Research Inc. | www.sharedresearch.jp
60/77
R Coverage
Security Services
Source: Shared Research based on company data
Boosts sales to grow customer base; undertook initiatives to build a labor-saving system using IoT to eliminate labor shortages and
raise quality
In addition to strengthening sales activities, the company has begun using a security system based on remote monitoring, which
aims to reduce the required security personnel and further expand the client base. The company continues to systemize services
such as entrance/exit management and security patrols. In addition to helping to improve the workplace environment to facilitate
recruiting, the new system adds crisis management and is aimed at responding to the occurrence of crimes in shopping malls.
While the system is a long-term measure, it is also noteworthy as an investment in security and safety.
The company has also started implementing measures that will help it alleviate the strain brought on by an increasingly tight
labor market, including the creation of a new system and improving the work environment to assure that it can continue securing
employees in the future. Rising personnel costs put pressure on the operating profit margin in Q3 and Q4 and reduced profit by
some JPY200mn–300mn, with the impact expected to continue throughout FY02/19. However, pricing negotiations are under
way with clients, and the company expects labor-saving initiatives to result in personnel reductions even as prices remain
constant or even increase. The company expects to keep the GPM at the FY02/18 level. The increase in segment sales during the
period was the result of the shift of some businesses between segments.
7.6%8.5% 8.2%
9.5%
7.6%8.4%
9.0% 8.5%7.8% 8.1%
8.9% 9.1%
7.5% 7.9% 8.2% 8.0%7.0% 6.9% 7.3%
9.0%
7.0% 6.6%5.9%
6.9%
-
2%
4%
6%
8%
10%
12%
-
200
400
600
800
1,000
1,200
Q1FY02/13
Q2 Q3 Q4 Q1FY02/14
Q2 Q3 Q4 Q1FY02/15
Q2 Q3 Q4 Q1FY02/16
Q2 Q3 Q4 Q1FY02/17
Q2 Q3 Q4 Q1FY02/18
Q2 Q3 Q4
Operating profit OPM (right axis)
(JPYmn)
Security Services(JPYmn) Q1 Q2 Q3 Q4 Q1 Q2 Q3 Q4 Q1 Q2 Q3 Q4 Q1 Q2 Q3 Q4Sales 8,935 8,891 9,305 9,491 9,306 9,294 9,522 10,334 10,292 10,116 10,080 10,580 11,001 10,798 10,712 10,779
YoY 5.9% 6.3% 9.7% 6.0% 4.2% 4.5% 2.3% 8.9% 10.6% 8.8% 5.9% 2.4% 6.9% 6.7% 6.3% 1.9%Operating profit 695 717 824 866 696 731 782 823 721 697 736 956 773 708 637 739
YoY 8.3% 2.4% 8.3% 13.6% 0.1% 2.0% -5.1% -5.0% 3.6% -4.7% -5.9% 16.2% 7.2% 1.6% -13.5% -22.7%OPM 7.8% 8.1% 8.9% 9.1% 7.5% 7.9% 8.2% 8.0% 7.0% 6.9% 7.3% 9.0% 7.0% 6.6% 5.9% 6.9%
FY02/18FY02/17FY02/16FY02/15
Security Services FY02/10 FY02/11 FY02/12 FY02/13 FY02/14 FY02/15 FY02/16 FY02/17 FY02/18(JPYmn) Act. Act. Act. Act. Act. Act. Act. Act. Act.Sales 34,281 32,088 32,235 31,805 34,242 36,622 38,456 41,068 43,290
YoY -6.5% -6.4% 0.5% -1.3% 7.7% 7.0% 5.0% 6.8% 5.4%Operating profit 2,738 2,764 2,823 2,692 2,865 3,102 3,032 3,110 2,857
YoY - 0.9% 2.1% -4.6% 6.4% 8.3% -2.3% 2.6% -8.1%OPM 8.0% 8.6% 8.8% 8.5% 8.4% 8.5% 7.9% 7.6% 6.6%
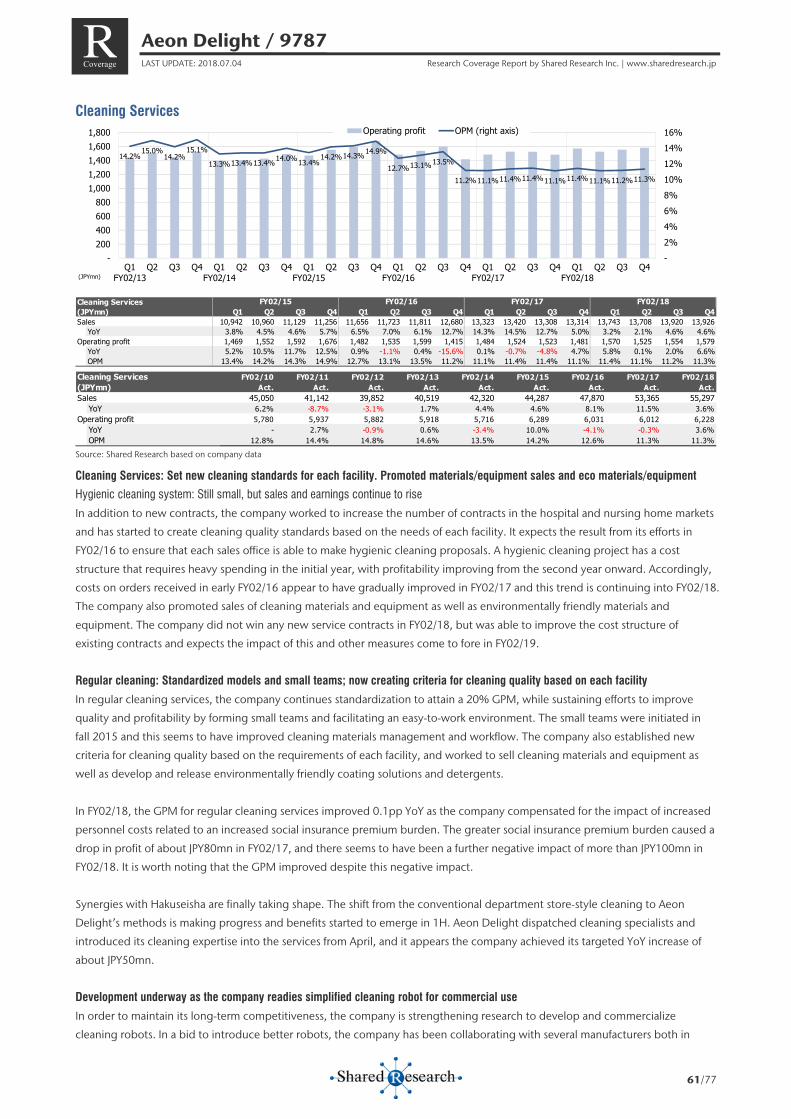
Aeon Delight / 9787 LAST UPDATE: 2018.07.04 Research Coverage Report by Shared Research Inc. | www.sharedresearch.jp
61/77
R Coverage
Cleaning Services
Source: Shared Research based on company data
Cleaning Services: Set new cleaning standards for each facility. Promoted materials/equipment sales and eco materials/equipment
Hygienic cleaning system: Still small, but sales and earnings continue to rise
In addition to new contracts, the company worked to increase the number of contracts in the hospital and nursing home markets
and has started to create cleaning quality standards based on the needs of each facility. It expects the result from its efforts in
FY02/16 to ensure that each sales office is able to make hygienic cleaning proposals. A hygienic cleaning project has a cost
structure that requires heavy spending in the initial year, with profitability improving from the second year onward. Accordingly,
costs on orders received in early FY02/16 appear to have gradually improved in FY02/17 and this trend is continuing into FY02/18.
The company also promoted sales of cleaning materials and equipment as well as environmentally friendly materials and
equipment. The company did not win any new service contracts in FY02/18, but was able to improve the cost structure of
existing contracts and expects the impact of this and other measures come to fore in FY02/19.
Regular cleaning: Standardized models and small teams; now creating criteria for cleaning quality based on each facility In regular cleaning services, the company continues standardization to attain a 20% GPM, while sustaining efforts to improve
quality and profitability by forming small teams and facilitating an easy-to-work environment. The small teams were initiated in
fall 2015 and this seems to have improved cleaning materials management and workflow. The company also established new
criteria for cleaning quality based on the requirements of each facility, and worked to sell cleaning materials and equipment as
well as develop and release environmentally friendly coating solutions and detergents.
In FY02/18, the GPM for regular cleaning services improved 0.1pp YoY as the company compensated for the impact of increased
personnel costs related to an increased social insurance premium burden. The greater social insurance premium burden caused a
drop in profit of about JPY80mn in FY02/17, and there seems to have been a further negative impact of more than JPY100mn in
FY02/18. It is worth noting that the GPM improved despite this negative impact.
Synergies with Hakuseisha are finally taking shape. The shift from the conventional department store-style cleaning to Aeon
Delight’s methods is making progress and benefits started to emerge in 1H. Aeon Delight dispatched cleaning specialists and
introduced its cleaning expertise into the services from April, and it appears the company achieved its targeted YoY increase of
about JPY50mn.
Development underway as the company readies simplified cleaning robot for commercial use
In order to maintain its long-term competitiveness, the company is strengthening research to develop and commercialize
cleaning robots. In a bid to introduce better robots, the company has been collaborating with several manufacturers both in
14.2%15.0%
14.2%15.1%
13.3%13.4%13.4%14.0%13.4%14.2%14.3%14.9%
12.7%13.1%13.5%
11.2%11.1%11.4%11.4%11.1%11.4%11.1%11.2%11.3%
-2%4%6%8%10%12%14%16%
-200400600800
1,0001,2001,4001,6001,800
Q1FY02/13
Q2 Q3 Q4 Q1FY02/14
Q2 Q3 Q4 Q1FY02/15
Q2 Q3 Q4 Q1FY02/16
Q2 Q3 Q4 Q1FY02/17
Q2 Q3 Q4 Q1FY02/18
Q2 Q3 Q4
Operating profit OPM (right axis)
(JPYmn)
Cleaning Services(JPYmn) Q1 Q2 Q3 Q4 Q1 Q2 Q3 Q4 Q1 Q2 Q3 Q4 Q1 Q2 Q3 Q4Sales 10,942 10,960 11,129 11,256 11,656 11,723 11,811 12,680 13,323 13,420 13,308 13,314 13,743 13,708 13,920 13,926
YoY 3.8% 4.5% 4.6% 5.7% 6.5% 7.0% 6.1% 12.7% 14.3% 14.5% 12.7% 5.0% 3.2% 2.1% 4.6% 4.6%Operating profit 1,469 1,552 1,592 1,676 1,482 1,535 1,599 1,415 1,484 1,524 1,523 1,481 1,570 1,525 1,554 1,579
YoY 5.2% 10.5% 11.7% 12.5% 0.9% -1.1% 0.4% -15.6% 0.1% -0.7% -4.8% 4.7% 5.8% 0.1% 2.0% 6.6%OPM 13.4% 14.2% 14.3% 14.9% 12.7% 13.1% 13.5% 11.2% 11.1% 11.4% 11.4% 11.1% 11.4% 11.1% 11.2% 11.3%
FY02/18FY02/17FY02/16FY02/15
Cleaning Services FY02/10 FY02/11 FY02/12 FY02/13 FY02/14 FY02/15 FY02/16 FY02/17 FY02/18(JPYmn) Act. Act. Act. Act. Act. Act. Act. Act. Act.Sales 45,050 41,142 39,852 40,519 42,320 44,287 47,870 53,365 55,297
YoY 6.2% -8.7% -3.1% 1.7% 4.4% 4.6% 8.1% 11.5% 3.6%Operating profit 5,780 5,937 5,882 5,918 5,716 6,289 6,031 6,012 6,228
YoY - 2.7% -0.9% 0.6% -3.4% 10.0% -4.1% -0.3% 3.6%OPM 12.8% 14.4% 14.8% 14.6% 13.5% 14.2% 12.6% 11.3% 11.3%
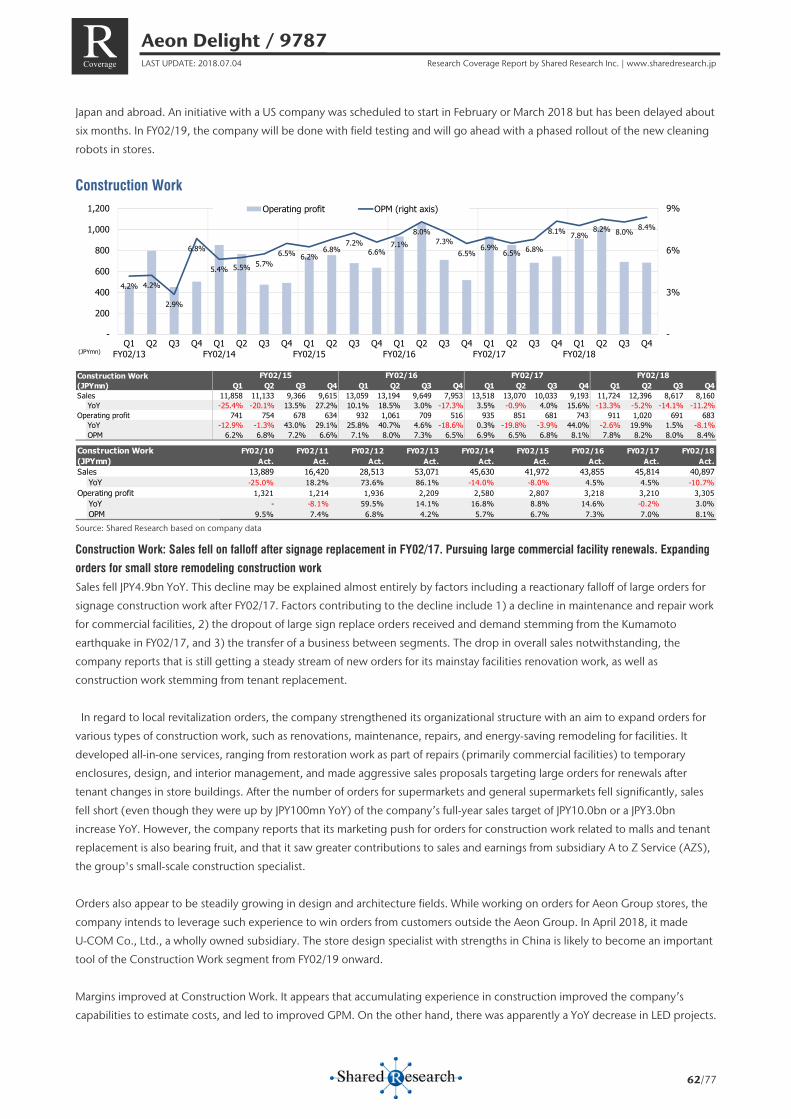
Aeon Delight / 9787 LAST UPDATE: 2018.07.04 Research Coverage Report by Shared Research Inc. | www.sharedresearch.jp
62/77
R Coverage
Japan and abroad. An initiative with a US company was scheduled to start in February or March 2018 but has been delayed about
six months. In FY02/19, the company will be done with field testing and will go ahead with a phased rollout of the new cleaning
robots in stores.
Construction Work
Source: Shared Research based on company data
Construction Work: Sales fell on falloff after signage replacement in FY02/17. Pursuing large commercial facility renewals. Expanding
orders for small store remodeling construction work
Sales fell JPY4.9bn YoY. This decline may be explained almost entirely by factors including a reactionary falloff of large orders for
signage construction work after FY02/17. Factors contributing to the decline include 1) a decline in maintenance and repair work
for commercial facilities, 2) the dropout of large sign replace orders received and demand stemming from the Kumamoto
earthquake in FY02/17, and 3) the transfer of a business between segments. The drop in overall sales notwithstanding, the
company reports that is still getting a steady stream of new orders for its mainstay facilities renovation work, as well as
construction work stemming from tenant replacement.
In regard to local revitalization orders, the company strengthened its organizational structure with an aim to expand orders for
various types of construction work, such as renovations, maintenance, repairs, and energy-saving remodeling for facilities. It
developed all-in-one services, ranging from restoration work as part of repairs (primarily commercial facilities) to temporary
enclosures, design, and interior management, and made aggressive sales proposals targeting large orders for renewals after
tenant changes in store buildings. After the number of orders for supermarkets and general supermarkets fell significantly, sales
fell short (even though they were up by JPY100mn YoY) of the company’s full-year sales target of JPY10.0bn or a JPY3.0bn
increase YoY. However, the company reports that its marketing push for orders for construction work related to malls and tenant
replacement is also bearing fruit, and that it saw greater contributions to sales and earnings from subsidiary A to Z Service (AZS),
the group's small-scale construction specialist.
Orders also appear to be steadily growing in design and architecture fields. While working on orders for Aeon Group stores, the
company intends to leverage such experience to win orders from customers outside the Aeon Group. In April 2018, it made
U-COM Co., Ltd., a wholly owned subsidiary. The store design specialist with strengths in China is likely to become an important
tool of the Construction Work segment from FY02/19 onward.
Margins improved at Construction Work. It appears that accumulating experience in construction improved the company’s
capabilities to estimate costs, and led to improved GPM. On the other hand, there was apparently a YoY decrease in LED projects.
4.2% 4.2%
2.9%
6.8%
5.4% 5.5% 5.7%6.5% 6.2%
6.8%7.2%
6.6%7.1%
8.0%7.3%
6.5%6.9%
6.5% 6.8%
8.1% 7.8%8.2% 8.0% 8.4%
-
3%
6%
9%
-
200
400
600
800
1,000
1,200
Q1FY02/13
Q2 Q3 Q4 Q1FY02/14
Q2 Q3 Q4 Q1FY02/15
Q2 Q3 Q4 Q1FY02/16
Q2 Q3 Q4 Q1FY02/17
Q2 Q3 Q4 Q1FY02/18
Q2 Q3 Q4
Operating profit OPM (right axis)
(JPYmn)
Construction Work(JPYmn) Q1 Q2 Q3 Q4 Q1 Q2 Q3 Q4 Q1 Q2 Q3 Q4 Q1 Q2 Q3 Q4Sales 11,858 11,133 9,366 9,615 13,059 13,194 9,649 7,953 13,518 13,070 10,033 9,193 11,724 12,396 8,617 8,160
YoY -25.4% -20.1% 13.5% 27.2% 10.1% 18.5% 3.0% -17.3% 3.5% -0.9% 4.0% 15.6% -13.3% -5.2% -14.1% -11.2%Operating profit 741 754 678 634 932 1,061 709 516 935 851 681 743 911 1,020 691 683
YoY -12.9% -1.3% 43.0% 29.1% 25.8% 40.7% 4.6% -18.6% 0.3% -19.8% -3.9% 44.0% -2.6% 19.9% 1.5% -8.1%OPM 6.2% 6.8% 7.2% 6.6% 7.1% 8.0% 7.3% 6.5% 6.9% 6.5% 6.8% 8.1% 7.8% 8.2% 8.0% 8.4%
FY02/18FY02/17FY02/16FY02/15
Construction Work FY02/10 FY02/11 FY02/12 FY02/13 FY02/14 FY02/15 FY02/16 FY02/17 FY02/18(JPYmn) Act. Act. Act. Act. Act. Act. Act. Act. Act.Sales 13,889 16,420 28,513 53,071 45,630 41,972 43,855 45,814 40,897
YoY -25.0% 18.2% 73.6% 86.1% -14.0% -8.0% 4.5% 4.5% -10.7%Operating profit 1,321 1,214 1,936 2,209 2,580 2,807 3,218 3,210 3,305
YoY - -8.1% 59.5% 14.1% 16.8% 8.8% 14.6% -0.2% 3.0%OPM 9.5% 7.4% 6.8% 4.2% 5.7% 6.7% 7.3% 7.0% 8.1%

Aeon Delight / 9787 LAST UPDATE: 2018.07.04 Research Coverage Report by Shared Research Inc. | www.sharedresearch.jp
63/77
R Coverage
Sales from work other than LED lighting installations (JPYbn)
Source: Shared Research based on company data
Materials and Supplies Sourcing Services
Source: Shared Research based on company data
Materials and Supplies Sourcing: Reorganized to expand sales. Won orders to provide packaging materials for Aeon’s private brands
The company reorganized the structure to boost sales, and expanded its contracts for packaging materials of Aeon’s private
brand, Top Valu. The company also began selling packaging materials for commissary kitchens (concentrated cooking facilities).
Aeon also worked on increasing its profitability by reducing storage costs through improving accuracy of demand forecast
systems and by cutting logistics costs.
Vending Machine Services
Source: Shared Research based on company data
158.9139.3
82.5 75.6
118.6 111.3
93.7 96.2
130.6 131.9
96.579.5
135.2 130.7
100.3 91.9
117.2 124.0
86.2 81.6
-20406080100120140160
-20%-10%
0%10%20%30%40%50%60%
Q1FY02/14
Q3 Q1FY02/15
Q3 Q1FY02/16
Q3 Q1FY02/17
Q3 Q1FY02/18
Q3
Excl. LED installation work LED installation work Sales excl. LED installation work YoY (left axis) (JPYbn)
2.9%3.3%
3.8%
4.9%5.3%
5.8%
4.6%5.3%
4.0% 4.2%3.6%
5.9%
4.7%5.3% 5.2%
7.0%
5.4%5.0%
5.6% 5.9% 5.6% 5.5% 5.7%6.1%
-1%2%3%4%5%6%7%8%
-100200300400500600700800900
1,000
Q1FY02/13
Q2 Q3 Q4 Q1FY02/14
Q2 Q3 Q4 Q1FY02/15
Q2 Q3 Q4 Q1FY02/16
Q2 Q3 Q4 Q1FY02/17
Q2 Q3 Q4 Q1FY02/18
Q2 Q3 Q4
Operating profit OPM (right axis)
(JPYmn)
Materials and Supplies Sourcing(JPYmn) Q1 Q2 Q3 Q4 Q1 Q2 Q3 Q4 Q1 Q2 Q3 Q4 Q1 Q2 Q3 Q4Sales 11,713 11,609 12,175 12,121 12,080 12,445 12,990 13,001 13,037 12,822 12,779 12,102 12,638 12,502 12,696 12,429
YoY 9.3% 5.3% 5.5% 7.7% 3.1% 7.2% 6.7% 7.3% 7.9% 3.0% -1.6% -6.9% -3.1% -2.5% -0.6% 2.7%Operating profit 464 490 436 721 568 664 670 904 708 635 716 715 710 687 719 752
YoY -19.0% -23.0% -18.2% 22.0% 22.4% 35.5% 53.7% 25.4% 24.6% -4.4% 6.9% -20.9% 0.3% 8.2% 0.4% 5.2%OPM 4.0% 4.2% 3.6% 5.9% 4.7% 5.3% 5.2% 7.0% 5.4% 5.0% 5.6% 5.9% 5.6% 5.5% 5.7% 6.1%
FY02/18FY02/17FY02/16FY02/15
Materials and Supplies Sourcing FY02/10 FY02/11 FY02/12 FY02/13 FY02/14 FY02/15 FY02/16 FY02/17 FY02/18(JPYmn) Act. Act. Act. Act. Act. Act. Act. Act. Act.Sales - 18,718 36,730 39,284 44,543 47,618 50,516 50,740 50,265
YoY - - 96.2% 7.0% 13.4% 6.9% 6.1% 0.4% -0.9%Operating profit - 627 1,234 1,462 2,333 2,111 2,806 2,774 2,868
YoY - - 96.8% 18.5% 59.6% -9.5% 32.9% -1.1% 3.4%OPM - 3.3% 3.4% 3.7% 5.2% 4.4% 5.6% 5.5% 5.7%
6.0%
8.5%
5.8%
10.2%
7.1%
9.3%
5.8%
13.4%
6.6%
9.4%
6.3%
11.2%
5.6%
8.8%
5.0%
15.1%
5.8%
10.6%
5.7%
11.5%
5.3%
9.6%
2.9%
7.3%
-2%4%6%8%10%12%14%16%
-200400600800
1,0001,2001,4001,600
Q1FY02/13
Q2 Q3 Q4 Q1FY02/14
Q2 Q3 Q4 Q1FY02/15
Q2 Q3 Q4 Q1FY02/16
Q2 Q3 Q4 Q1FY02/17
Q2 Q3 Q4 Q1FY02/18
Q2 Q3 Q4
Operating profit OPM (right axis)
(JPYmn)
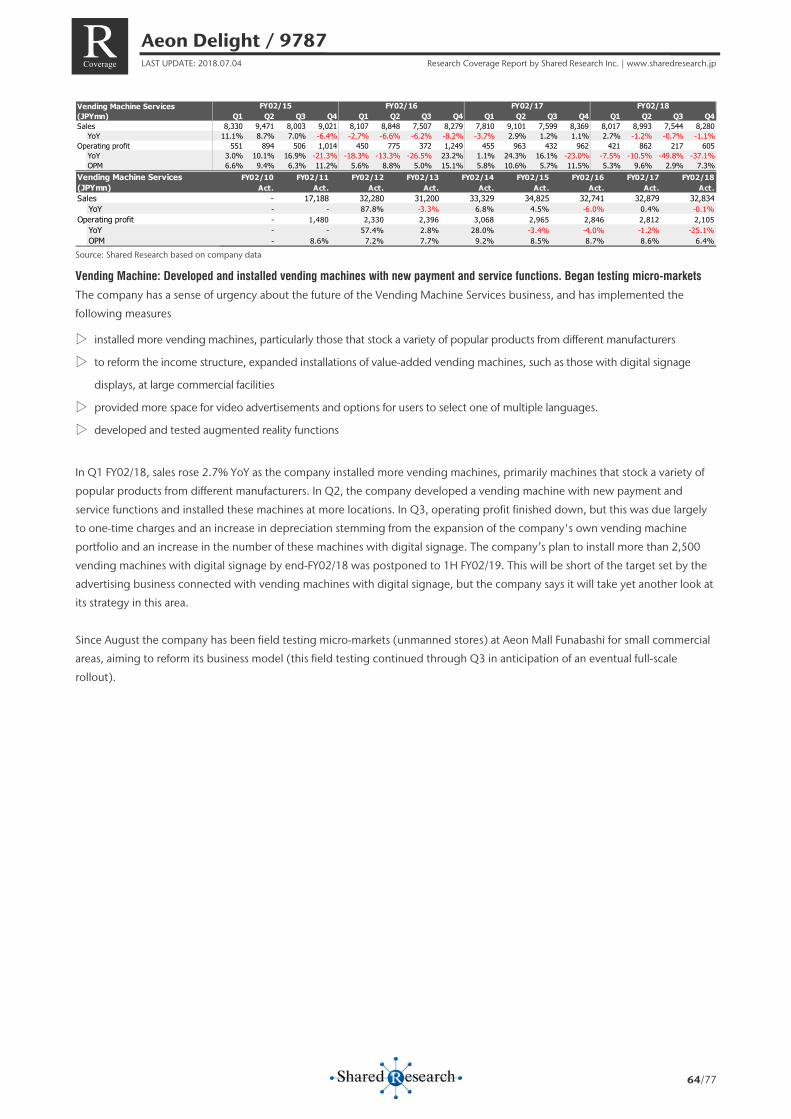
Aeon Delight / 9787 LAST UPDATE: 2018.07.04 Research Coverage Report by Shared Research Inc. | www.sharedresearch.jp
64/77
R Coverage
Source: Shared Research based on company data
Vending Machine: Developed and installed vending machines with new payment and service functions. Began testing micro-markets
The company has a sense of urgency about the future of the Vending Machine Services business, and has implemented the
following measures
▷ installed more vending machines, particularly those that stock a variety of popular products from different manufacturers
▷ to reform the income structure, expanded installations of value-added vending machines, such as those with digital signage
displays, at large commercial facilities
▷ provided more space for video advertisements and options for users to select one of multiple languages.
▷ developed and tested augmented reality functions
In Q1 FY02/18, sales rose 2.7% YoY as the company installed more vending machines, primarily machines that stock a variety of
popular products from different manufacturers. In Q2, the company developed a vending machine with new payment and
service functions and installed these machines at more locations. In Q3, operating profit finished down, but this was due largely
to one-time charges and an increase in depreciation stemming from the expansion of the company's own vending machine
portfolio and an increase in the number of these machines with digital signage. The company’s plan to install more than 2,500
vending machines with digital signage by end-FY02/18 was postponed to 1H FY02/19. This will be short of the target set by the
advertising business connected with vending machines with digital signage, but the company says it will take yet another look at
its strategy in this area.
Since August the company has been field testing micro-markets (unmanned stores) at Aeon Mall Funabashi for small commercial
areas, aiming to reform its business model (this field testing continued through Q3 in anticipation of an eventual full-scale
rollout).
Vending Machine Services(JPYmn) Q1 Q2 Q3 Q4 Q1 Q2 Q3 Q4 Q1 Q2 Q3 Q4 Q1 Q2 Q3 Q4Sales 8,330 9,471 8,003 9,021 8,107 8,848 7,507 8,279 7,810 9,101 7,599 8,369 8,017 8,993 7,544 8,280
YoY 11.1% 8.7% 7.0% -6.4% -2.7% -6.6% -6.2% -8.2% -3.7% 2.9% 1.2% 1.1% 2.7% -1.2% -0.7% -1.1%Operating profit 551 894 506 1,014 450 775 372 1,249 455 963 432 962 421 862 217 605
YoY 3.0% 10.1% 16.9% -21.3% -18.3% -13.3% -26.5% 23.2% 1.1% 24.3% 16.1% -23.0% -7.5% -10.5% -49.8% -37.1%OPM 6.6% 9.4% 6.3% 11.2% 5.6% 8.8% 5.0% 15.1% 5.8% 10.6% 5.7% 11.5% 5.3% 9.6% 2.9% 7.3%
FY02/18FY02/17FY02/16FY02/15
Vending Machine Services FY02/10 FY02/11 FY02/12 FY02/13 FY02/14 FY02/15 FY02/16 FY02/17 FY02/18(JPYmn) Act. Act. Act. Act. Act. Act. Act. Act. Act.Sales - 17,188 32,280 31,200 33,329 34,825 32,741 32,879 32,834
YoY - - 87.8% -3.3% 6.8% 4.5% -6.0% 0.4% -0.1%Operating profit - 1,480 2,330 2,396 3,068 2,965 2,846 2,812 2,105
YoY - - 57.4% 2.8% 28.0% -3.4% -4.0% -1.2% -25.1%OPM - 8.6% 7.2% 7.7% 9.2% 8.5% 8.7% 8.6% 6.4%
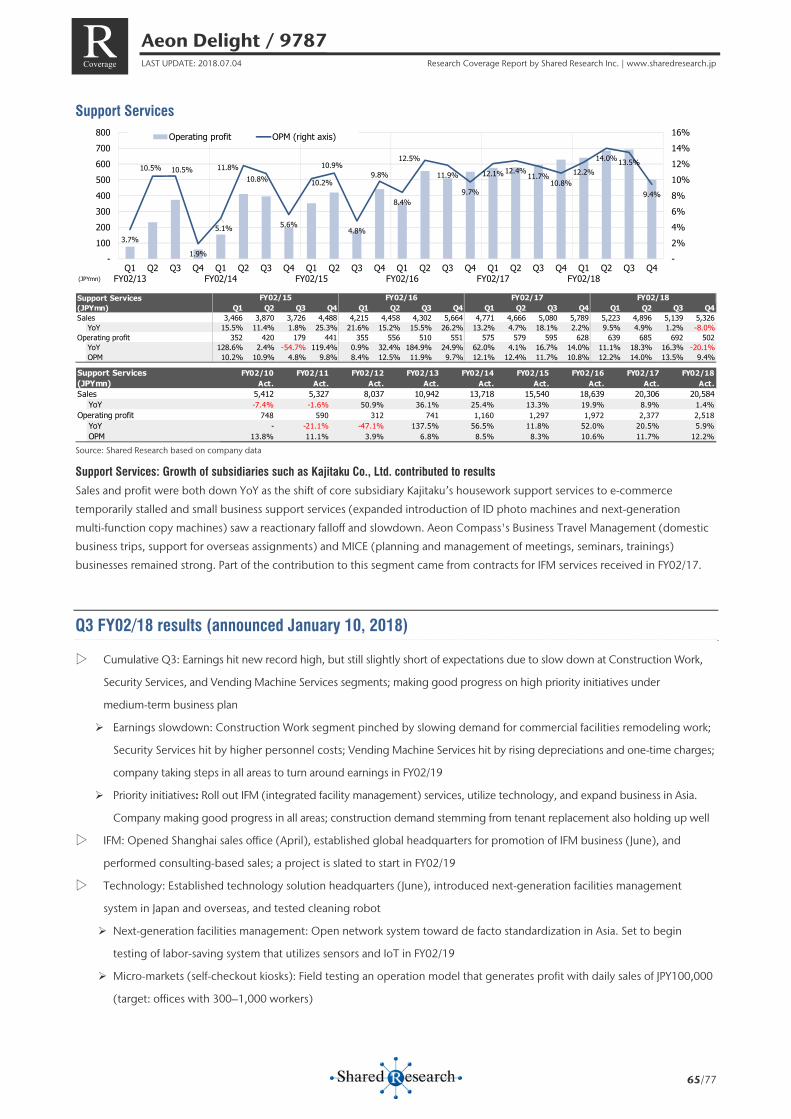
Aeon Delight / 9787 LAST UPDATE: 2018.07.04 Research Coverage Report by Shared Research Inc. | www.sharedresearch.jp
65/77
R Coverage
Support Services
Source: Shared Research based on company data
Support Services: Growth of subsidiaries such as Kajitaku Co., Ltd. contributed to results
Sales and profit were both down YoY as the shift of core subsidiary Kajitaku’s housework support services to e-commerce
temporarily stalled and small business support services (expanded introduction of ID photo machines and next-generation
multi-function copy machines) saw a reactionary falloff and slowdown. Aeon Compass's Business Travel Management (domestic
business trips, support for overseas assignments) and MICE (planning and management of meetings, seminars, trainings)
businesses remained strong. Part of the contribution to this segment came from contracts for IFM services received in FY02/17.
Q3 FY02/18 results (announced January 10, 2018)
▷ Cumulative Q3: Earnings hit new record high, but still slightly short of expectations due to slow down at Construction Work,
Security Services, and Vending Machine Services segments; making good progress on high priority initiatives under
medium-term business plan
Earnings slowdown: Construction Work segment pinched by slowing demand for commercial facilities remodeling work;
Security Services hit by higher personnel costs; Vending Machine Services hit by rising depreciations and one-time charges;
company taking steps in all areas to turn around earnings in FY02/19
Priority initiatives: Roll out IFM (integrated facility management) services, utilize technology, and expand business in Asia.
Company making good progress in all areas; construction demand stemming from tenant replacement also holding up well
▷ IFM: Opened Shanghai sales office (April), established global headquarters for promotion of IFM business (June), and
performed consulting-based sales; a project is slated to start in FY02/19
▷ Technology: Established technology solution headquarters (June), introduced next-generation facilities management
system in Japan and overseas, and tested cleaning robot
Next-generation facilities management: Open network system toward de facto standardization in Asia. Set to begin
testing of labor-saving system that utilizes sensors and IoT in FY02/19
Micro-markets (self-checkout kiosks): Field testing an operation model that generates profit with daily sales of JPY100,000
(target: offices with 300–1,000 workers)
3.7%
10.5% 10.5%
1.9%
5.1%
11.8%10.8%
5.6%
10.2%
10.9%
4.8%
9.8%
8.4%
12.5%
11.9%
9.7%
12.1% 12.4%11.7%
10.8%12.2%
14.0%13.5%
9.4%
-2%4%6%8%10%12%14%16%
-100200300400500600700800
Q1FY02/13
Q2 Q3 Q4 Q1FY02/14
Q2 Q3 Q4 Q1FY02/15
Q2 Q3 Q4 Q1FY02/16
Q2 Q3 Q4 Q1FY02/17
Q2 Q3 Q4 Q1FY02/18
Q2 Q3 Q4
Operating profit OPM (right axis)
(JPYmn)
Support Services(JPYmn) Q1 Q2 Q3 Q4 Q1 Q2 Q3 Q4 Q1 Q2 Q3 Q4 Q1 Q2 Q3 Q4Sales 3,466 3,870 3,726 4,488 4,215 4,458 4,302 5,664 4,771 4,666 5,080 5,789 5,223 4,896 5,139 5,326
YoY 15.5% 11.4% 1.8% 25.3% 21.6% 15.2% 15.5% 26.2% 13.2% 4.7% 18.1% 2.2% 9.5% 4.9% 1.2% -8.0%Operating profit 352 420 179 441 355 556 510 551 575 579 595 628 639 685 692 502
YoY 128.6% 2.4% -54.7% 119.4% 0.9% 32.4% 184.9% 24.9% 62.0% 4.1% 16.7% 14.0% 11.1% 18.3% 16.3% -20.1%OPM 10.2% 10.9% 4.8% 9.8% 8.4% 12.5% 11.9% 9.7% 12.1% 12.4% 11.7% 10.8% 12.2% 14.0% 13.5% 9.4%
FY02/18FY02/17FY02/16FY02/15
Support Services FY02/10 FY02/11 FY02/12 FY02/13 FY02/14 FY02/15 FY02/16 FY02/17 FY02/18(JPYmn) Act. Act. Act. Act. Act. Act. Act. Act. Act.Sales 5,412 5,327 8,037 10,942 13,718 15,540 18,639 20,306 20,584
YoY -7.4% -1.6% 50.9% 36.1% 25.4% 13.3% 19.9% 8.9% 1.4%Operating profit 748 590 312 741 1,160 1,297 1,972 2,377 2,518
YoY - -21.1% -47.1% 137.5% 56.5% 11.8% 52.0% 20.5% 5.9%OPM 13.8% 11.1% 3.9% 6.8% 8.5% 8.3% 10.6% 11.7% 12.2%
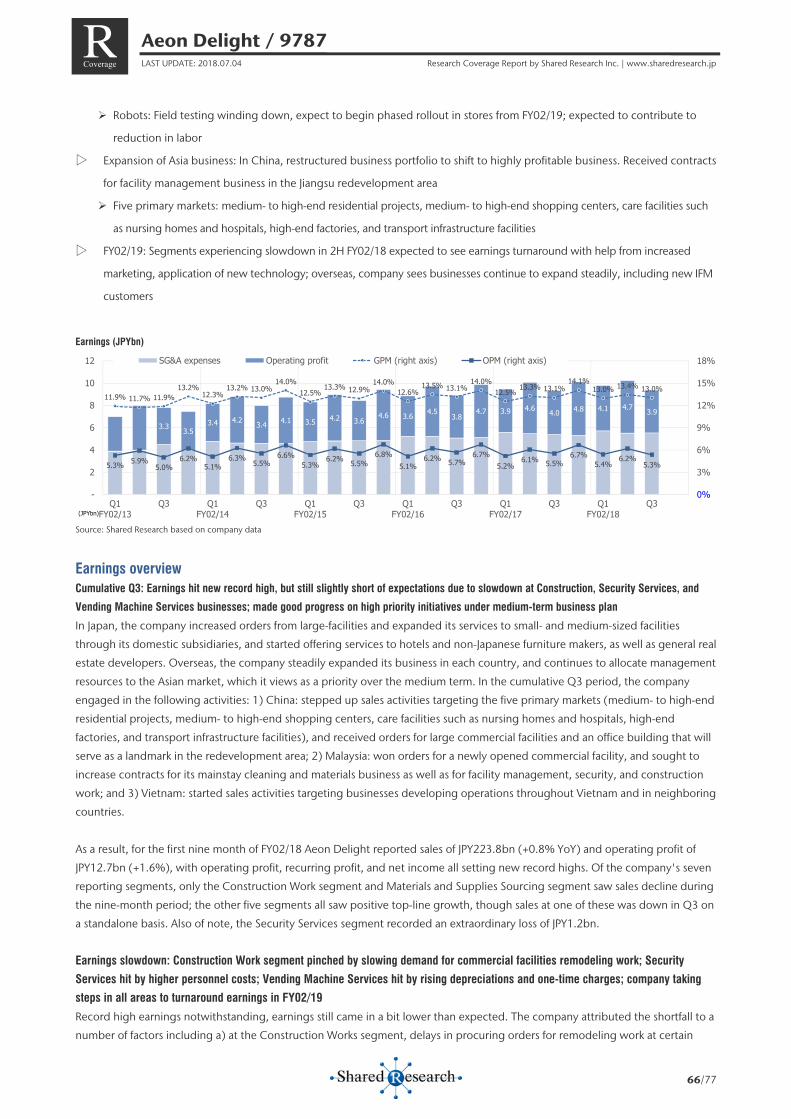
Aeon Delight / 9787 LAST UPDATE: 2018.07.04 Research Coverage Report by Shared Research Inc. | www.sharedresearch.jp
66/77
R Coverage
Robots: Field testing winding down, expect to begin phased rollout in stores from FY02/19; expected to contribute to
reduction in labor
▷ Expansion of Asia business: In China, restructured business portfolio to shift to highly profitable business. Received contracts
for facility management business in the Jiangsu redevelopment area
Five primary markets: medium- to high-end residential projects, medium- to high-end shopping centers, care facilities such
as nursing homes and hospitals, high-end factories, and transport infrastructure facilities
▷ FY02/19: Segments experiencing slowdown in 2H FY02/18 expected to see earnings turnaround with help from increased
marketing, application of new technology; overseas, company sees businesses continue to expand steadily, including new IFM
customers Earnings (JPYbn)
Source: Shared Research based on company data
Earnings overview Cumulative Q3: Earnings hit new record high, but still slightly short of expectations due to slowdown at Construction, Security Services, and
Vending Machine Services businesses; made good progress on high priority initiatives under medium-term business plan
In Japan, the company increased orders from large-facilities and expanded its services to small- and medium-sized facilities
through its domestic subsidiaries, and started offering services to hotels and non-Japanese furniture makers, as well as general real
estate developers. Overseas, the company steadily expanded its business in each country, and continues to allocate management
resources to the Asian market, which it views as a priority over the medium term. In the cumulative Q3 period, the company
engaged in the following activities: 1) China: stepped up sales activities targeting the five primary markets (medium- to high-end
residential projects, medium- to high-end shopping centers, care facilities such as nursing homes and hospitals, high-end
factories, and transport infrastructure facilities), and received orders for large commercial facilities and an office building that will
serve as a landmark in the redevelopment area; 2) Malaysia: won orders for a newly opened commercial facility, and sought to
increase contracts for its mainstay cleaning and materials business as well as for facility management, security, and construction
work; and 3) Vietnam: started sales activities targeting businesses developing operations throughout Vietnam and in neighboring
countries.
As a result, for the first nine month of FY02/18 Aeon Delight reported sales of JPY223.8bn (+0.8% YoY) and operating profit of
JPY12.7bn (+1.6%), with operating profit, recurring profit, and net income all setting new record highs. Of the company's seven
reporting segments, only the Construction Work segment and Materials and Supplies Sourcing segment saw sales decline during
the nine-month period; the other five segments all saw positive top-line growth, though sales at one of these was down in Q3 on
a standalone basis. Also of note, the Security Services segment recorded an extraordinary loss of JPY1.2bn.
Earnings slowdown: Construction Work segment pinched by slowing demand for commercial facilities remodeling work; Security
Services hit by higher personnel costs; Vending Machine Services hit by rising depreciations and one-time charges; company taking
steps in all areas to turnaround earnings in FY02/19
Record high earnings notwithstanding, earnings still came in a bit lower than expected. The company attributed the shortfall to a
number of factors including a) at the Construction Works segment, delays in procuring orders for remodeling work at certain
3.3 3.5 3.4 4.2 3.4 4.1 3.5 4.2 3.6
4.6 3.6 4.5 3.8
4.7 3.9 4.6 4.0 4.8 4.1 4.7 3.9
11.9% 11.7% 11.9%13.2%
12.3%13.2% 13.0%
14.0%12.5%
13.3% 12.9%14.0%
12.6%13.5% 13.1%
14.0%12.5% 13.3% 13.1%
14.1%13.0% 13.4% 13.0%
5.3% 5.9%5.0%
6.2%5.1%
6.3% 5.5%6.6%
5.3%6.2% 5.5%
6.8%5.1%
6.2% 5.7%6.7%
5.2%6.1% 5.5%
6.7%5.4%
6.2%5.3%
0%
3%
6%
9%
12%
15%
18%
-
2
4
6
8
10
12
Q1FY02/13
Q3 Q1FY02/14
Q3 Q1FY02/15
Q3 Q1FY02/16
Q3 Q1FY02/17
Q3 Q1FY02/18
Q3
SG&A expenses Operating profit GPM (right axis) OPM (right axis)
(JPYbn)
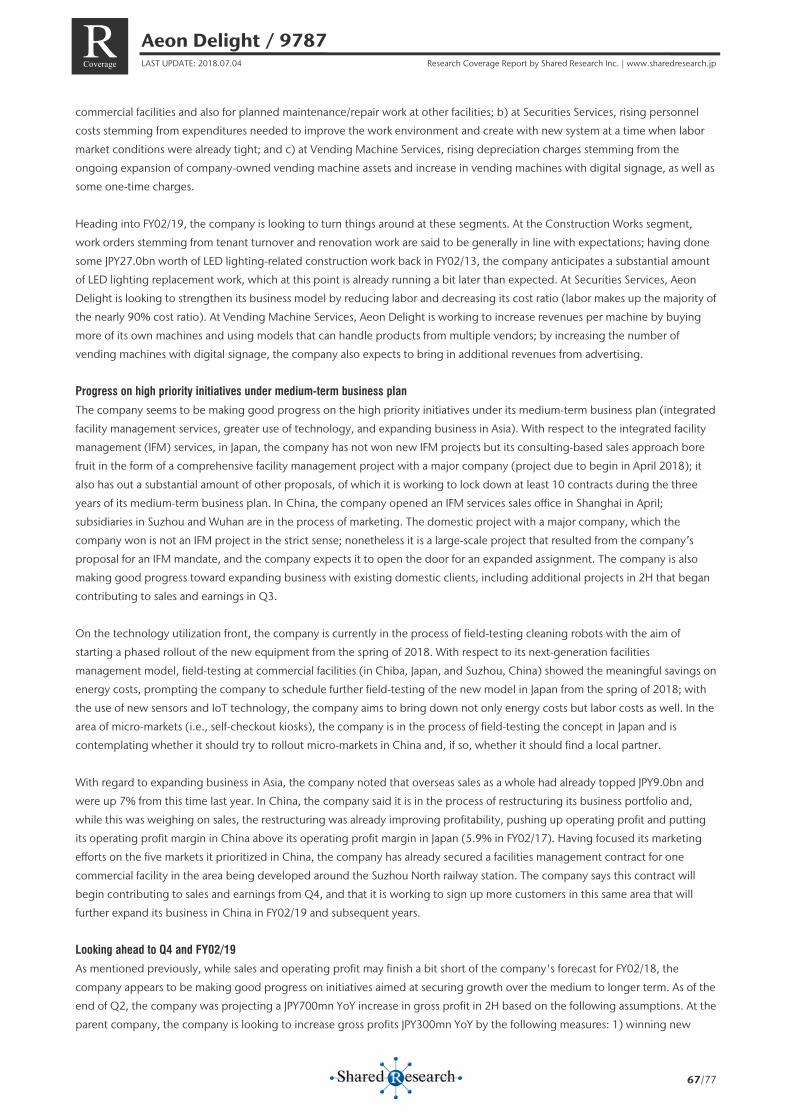
Aeon Delight / 9787 LAST UPDATE: 2018.07.04 Research Coverage Report by Shared Research Inc. | www.sharedresearch.jp
67/77
R Coverage
commercial facilities and also for planned maintenance/repair work at other facilities; b) at Securities Services, rising personnel
costs stemming from expenditures needed to improve the work environment and create with new system at a time when labor
market conditions were already tight; and c) at Vending Machine Services, rising depreciation charges stemming from the
ongoing expansion of company-owned vending machine assets and increase in vending machines with digital signage, as well as
some one-time charges.
Heading into FY02/19, the company is looking to turn things around at these segments. At the Construction Works segment,
work orders stemming from tenant turnover and renovation work are said to be generally in line with expectations; having done
some JPY27.0bn worth of LED lighting-related construction work back in FY02/13, the company anticipates a substantial amount
of LED lighting replacement work, which at this point is already running a bit later than expected. At Securities Services, Aeon
Delight is looking to strengthen its business model by reducing labor and decreasing its cost ratio (labor makes up the majority of
the nearly 90% cost ratio). At Vending Machine Services, Aeon Delight is working to increase revenues per machine by buying
more of its own machines and using models that can handle products from multiple vendors; by increasing the number of
vending machines with digital signage, the company also expects to bring in additional revenues from advertising.
Progress on high priority initiatives under medium-term business plan
The company seems to be making good progress on the high priority initiatives under its medium-term business plan (integrated
facility management services, greater use of technology, and expanding business in Asia). With respect to the integrated facility
management (IFM) services, in Japan, the company has not won new IFM projects but its consulting-based sales approach bore
fruit in the form of a comprehensive facility management project with a major company (project due to begin in April 2018); it
also has out a substantial amount of other proposals, of which it is working to lock down at least 10 contracts during the three
years of its medium-term business plan. In China, the company opened an IFM services sales office in Shanghai in April;
subsidiaries in Suzhou and Wuhan are in the process of marketing. The domestic project with a major company, which the
company won is not an IFM project in the strict sense; nonetheless it is a large-scale project that resulted from the company’s
proposal for an IFM mandate, and the company expects it to open the door for an expanded assignment. The company is also
making good progress toward expanding business with existing domestic clients, including additional projects in 2H that began
contributing to sales and earnings in Q3.
On the technology utilization front, the company is currently in the process of field-testing cleaning robots with the aim of
starting a phased rollout of the new equipment from the spring of 2018. With respect to its next-generation facilities
management model, field-testing at commercial facilities (in Chiba, Japan, and Suzhou, China) showed the meaningful savings on
energy costs, prompting the company to schedule further field-testing of the new model in Japan from the spring of 2018; with
the use of new sensors and IoT technology, the company aims to bring down not only energy costs but labor costs as well. In the
area of micro-markets (i.e., self-checkout kiosks), the company is in the process of field-testing the concept in Japan and is
contemplating whether it should try to rollout micro-markets in China and, if so, whether it should find a local partner.
With regard to expanding business in Asia, the company noted that overseas sales as a whole had already topped JPY9.0bn and
were up 7% from this time last year. In China, the company said it is in the process of restructuring its business portfolio and,
while this was weighing on sales, the restructuring was already improving profitability, pushing up operating profit and putting
its operating profit margin in China above its operating profit margin in Japan (5.9% in FY02/17). Having focused its marketing
efforts on the five markets it prioritized in China, the company has already secured a facilities management contract for one
commercial facility in the area being developed around the Suzhou North railway station. The company says this contract will
begin contributing to sales and earnings from Q4, and that it is working to sign up more customers in this same area that will
further expand its business in China in FY02/19 and subsequent years.
Looking ahead to Q4 and FY02/19
As mentioned previously, while sales and operating profit may finish a bit short of the company's forecast for FY02/18, the
company appears to be making good progress on initiatives aimed at securing growth over the medium to longer term. As of the
end of Q2, the company was projecting a JPY700mn YoY increase in gross profit in 2H based on the following assumptions. At the
parent company, the company is looking to increase gross profits JPY300mn YoY by the following measures: 1) winning new
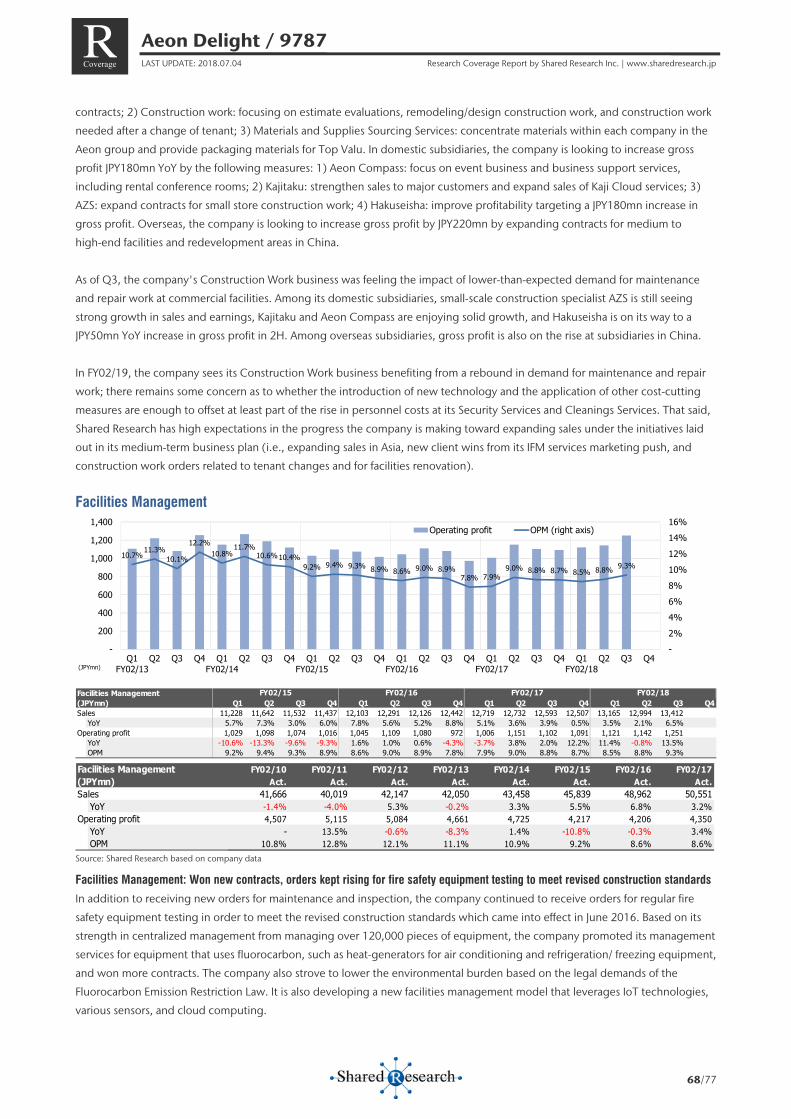
Aeon Delight / 9787 LAST UPDATE: 2018.07.04 Research Coverage Report by Shared Research Inc. | www.sharedresearch.jp
68/77
R Coverage
contracts; 2) Construction work: focusing on estimate evaluations, remodeling/design construction work, and construction work
needed after a change of tenant; 3) Materials and Supplies Sourcing Services: concentrate materials within each company in the
Aeon group and provide packaging materials for Top Valu. In domestic subsidiaries, the company is looking to increase gross
profit JPY180mn YoY by the following measures: 1) Aeon Compass: focus on event business and business support services,
including rental conference rooms; 2) Kajitaku: strengthen sales to major customers and expand sales of Kaji Cloud services; 3)
AZS: expand contracts for small store construction work; 4) Hakuseisha: improve profitability targeting a JPY180mn increase in
gross profit. Overseas, the company is looking to increase gross profit by JPY220mn by expanding contracts for medium to
high-end facilities and redevelopment areas in China.
As of Q3, the company's Construction Work business was feeling the impact of lower-than-expected demand for maintenance
and repair work at commercial facilities. Among its domestic subsidiaries, small-scale construction specialist AZS is still seeing
strong growth in sales and earnings, Kajitaku and Aeon Compass are enjoying solid growth, and Hakuseisha is on its way to a
JPY50mn YoY increase in gross profit in 2H. Among overseas subsidiaries, gross profit is also on the rise at subsidiaries in China.
In FY02/19, the company sees its Construction Work business benefiting from a rebound in demand for maintenance and repair
work; there remains some concern as to whether the introduction of new technology and the application of other cost-cutting
measures are enough to offset at least part of the rise in personnel costs at its Security Services and Cleanings Services. That said,
Shared Research has high expectations in the progress the company is making toward expanding sales under the initiatives laid
out in its medium-term business plan (i.e., expanding sales in Asia, new client wins from its IFM services marketing push, and
construction work orders related to tenant changes and for facilities renovation).
Facilities Management
Source: Shared Research based on company data
Facilities Management: Won new contracts, orders kept rising for fire safety equipment testing to meet revised construction standards
In addition to receiving new orders for maintenance and inspection, the company continued to receive orders for regular fire
safety equipment testing in order to meet the revised construction standards which came into effect in June 2016. Based on its
strength in centralized management from managing over 120,000 pieces of equipment, the company promoted its management
services for equipment that uses fluorocarbon, such as heat-generators for air conditioning and refrigeration/ freezing equipment,
and won more contracts. The company also strove to lower the environmental burden based on the legal demands of the
Fluorocarbon Emission Restriction Law. It is also developing a new facilities management model that leverages IoT technologies,
various sensors, and cloud computing.
10.7%11.3%
10.1%
12.2%10.8%
11.7%10.6%10.4%
9.2% 9.4% 9.3% 8.9% 8.6% 9.0% 8.9%7.8% 7.9%
9.0% 8.8% 8.7% 8.5% 8.8% 9.3%
-2%4%6%8%10%12%14%16%
-
200
400
600
800
1,000
1,200
1,400
Q1FY02/13
Q2 Q3 Q4 Q1FY02/14
Q2 Q3 Q4 Q1FY02/15
Q2 Q3 Q4 Q1FY02/16
Q2 Q3 Q4 Q1FY02/17
Q2 Q3 Q4 Q1FY02/18
Q2 Q3 Q4
Operating profit OPM (right axis)
(JPYmn)
Facilities Management(JPYmn) Q1 Q2 Q3 Q4 Q1 Q2 Q3 Q4 Q1 Q2 Q3 Q4 Q1 Q2 Q3 Q4Sales 11,228 11,642 11,532 11,437 12,103 12,291 12,126 12,442 12,719 12,732 12,593 12,507 13,165 12,994 13,412
YoY 5.7% 7.3% 3.0% 6.0% 7.8% 5.6% 5.2% 8.8% 5.1% 3.6% 3.9% 0.5% 3.5% 2.1% 6.5% Operating profit 1,029 1,098 1,074 1,016 1,045 1,109 1,080 972 1,006 1,151 1,102 1,091 1,121 1,142 1,251
YoY -10.6% -13.3% -9.6% -9.3% 1.6% 1.0% 0.6% -4.3% -3.7% 3.8% 2.0% 12.2% 11.4% -0.8% 13.5% OPM 9.2% 9.4% 9.3% 8.9% 8.6% 9.0% 8.9% 7.8% 7.9% 9.0% 8.8% 8.7% 8.5% 8.8% 9.3%
FY02/15 FY02/16 FY02/17 FY02/18
Facilities Management FY02/10 FY02/11 FY02/12 FY02/13 FY02/14 FY02/15 FY02/16 FY02/17(JPYmn) Act. Act. Act. Act. Act. Act. Act. Act.Sales 41,666 40,019 42,147 42,050 43,458 45,839 48,962 50,551
YoY -1.4% -4.0% 5.3% -0.2% 3.3% 5.5% 6.8% 3.2%Operating profit 4,507 5,115 5,084 4,661 4,725 4,217 4,206 4,350
YoY - 13.5% -0.6% -8.3% 1.4% -10.8% -0.3% 3.4%OPM 10.8% 12.8% 12.1% 11.1% 10.9% 9.2% 8.6% 8.6%
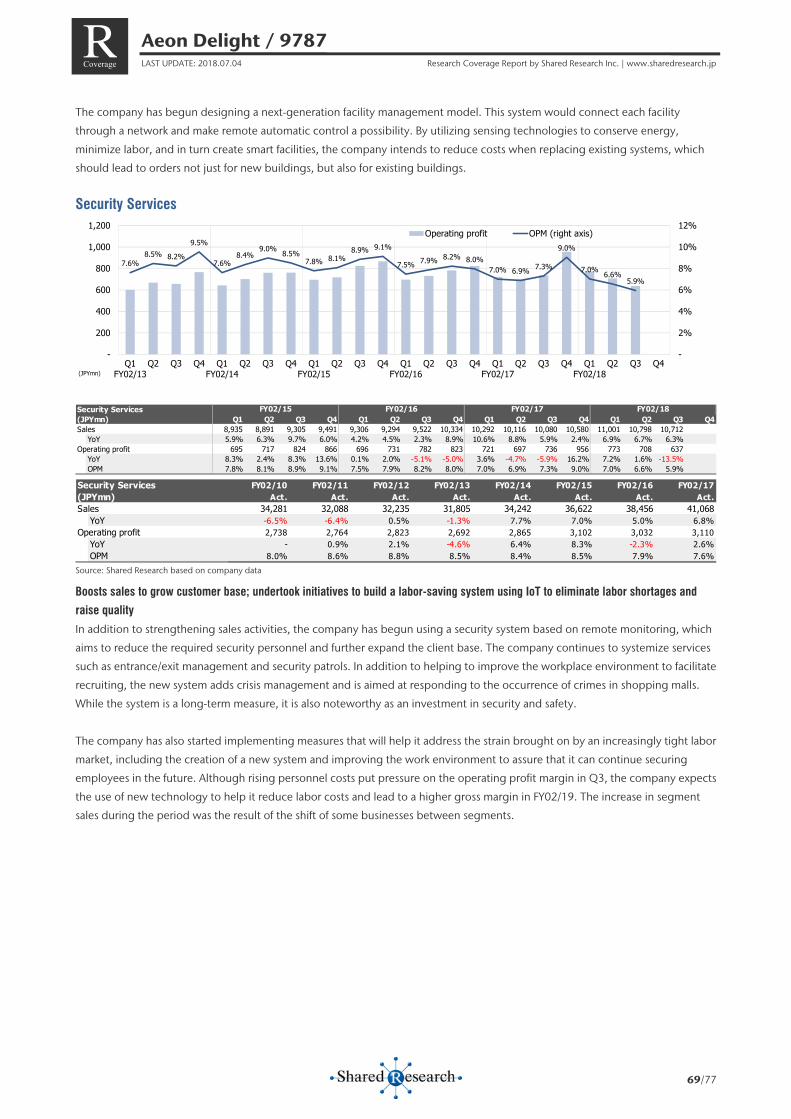
Aeon Delight / 9787 LAST UPDATE: 2018.07.04 Research Coverage Report by Shared Research Inc. | www.sharedresearch.jp
69/77
R Coverage
The company has begun designing a next-generation facility management model. This system would connect each facility
through a network and make remote automatic control a possibility. By utilizing sensing technologies to conserve energy,
minimize labor, and in turn create smart facilities, the company intends to reduce costs when replacing existing systems, which
should lead to orders not just for new buildings, but also for existing buildings.
Security Services
Source: Shared Research based on company data
Boosts sales to grow customer base; undertook initiatives to build a labor-saving system using IoT to eliminate labor shortages and
raise quality
In addition to strengthening sales activities, the company has begun using a security system based on remote monitoring, which
aims to reduce the required security personnel and further expand the client base. The company continues to systemize services
such as entrance/exit management and security patrols. In addition to helping to improve the workplace environment to facilitate
recruiting, the new system adds crisis management and is aimed at responding to the occurrence of crimes in shopping malls.
While the system is a long-term measure, it is also noteworthy as an investment in security and safety.
The company has also started implementing measures that will help it address the strain brought on by an increasingly tight labor
market, including the creation of a new system and improving the work environment to assure that it can continue securing
employees in the future. Although rising personnel costs put pressure on the operating profit margin in Q3, the company expects
the use of new technology to help it reduce labor costs and lead to a higher gross margin in FY02/19. The increase in segment
sales during the period was the result of the shift of some businesses between segments.
7.6%8.5% 8.2%
9.5%
7.6%8.4%
9.0% 8.5%7.8% 8.1%
8.9% 9.1%
7.5% 7.9% 8.2% 8.0%7.0% 6.9% 7.3%
9.0%
7.0% 6.6%5.9%
-
2%
4%
6%
8%
10%
12%
-
200
400
600
800
1,000
1,200
Q1FY02/13
Q2 Q3 Q4 Q1FY02/14
Q2 Q3 Q4 Q1FY02/15
Q2 Q3 Q4 Q1FY02/16
Q2 Q3 Q4 Q1FY02/17
Q2 Q3 Q4 Q1FY02/18
Q2 Q3 Q4
Operating profit OPM (right axis)
(JPYmn)
Security Services(JPYmn) Q1 Q2 Q3 Q4 Q1 Q2 Q3 Q4 Q1 Q2 Q3 Q4 Q1 Q2 Q3 Q4Sales 8,935 8,891 9,305 9,491 9,306 9,294 9,522 10,334 10,292 10,116 10,080 10,580 11,001 10,798 10,712
YoY 5.9% 6.3% 9.7% 6.0% 4.2% 4.5% 2.3% 8.9% 10.6% 8.8% 5.9% 2.4% 6.9% 6.7% 6.3% Operating profit 695 717 824 866 696 731 782 823 721 697 736 956 773 708 637
YoY 8.3% 2.4% 8.3% 13.6% 0.1% 2.0% -5.1% -5.0% 3.6% -4.7% -5.9% 16.2% 7.2% 1.6% -13.5% OPM 7.8% 8.1% 8.9% 9.1% 7.5% 7.9% 8.2% 8.0% 7.0% 6.9% 7.3% 9.0% 7.0% 6.6% 5.9%
FY02/15 FY02/16 FY02/17 FY02/18
Security Services FY02/10 FY02/11 FY02/12 FY02/13 FY02/14 FY02/15 FY02/16 FY02/17(JPYmn) Act. Act. Act. Act. Act. Act. Act. Act.Sales 34,281 32,088 32,235 31,805 34,242 36,622 38,456 41,068
YoY -6.5% -6.4% 0.5% -1.3% 7.7% 7.0% 5.0% 6.8%Operating profit 2,738 2,764 2,823 2,692 2,865 3,102 3,032 3,110
YoY - 0.9% 2.1% -4.6% 6.4% 8.3% -2.3% 2.6%OPM 8.0% 8.6% 8.8% 8.5% 8.4% 8.5% 7.9% 7.6%
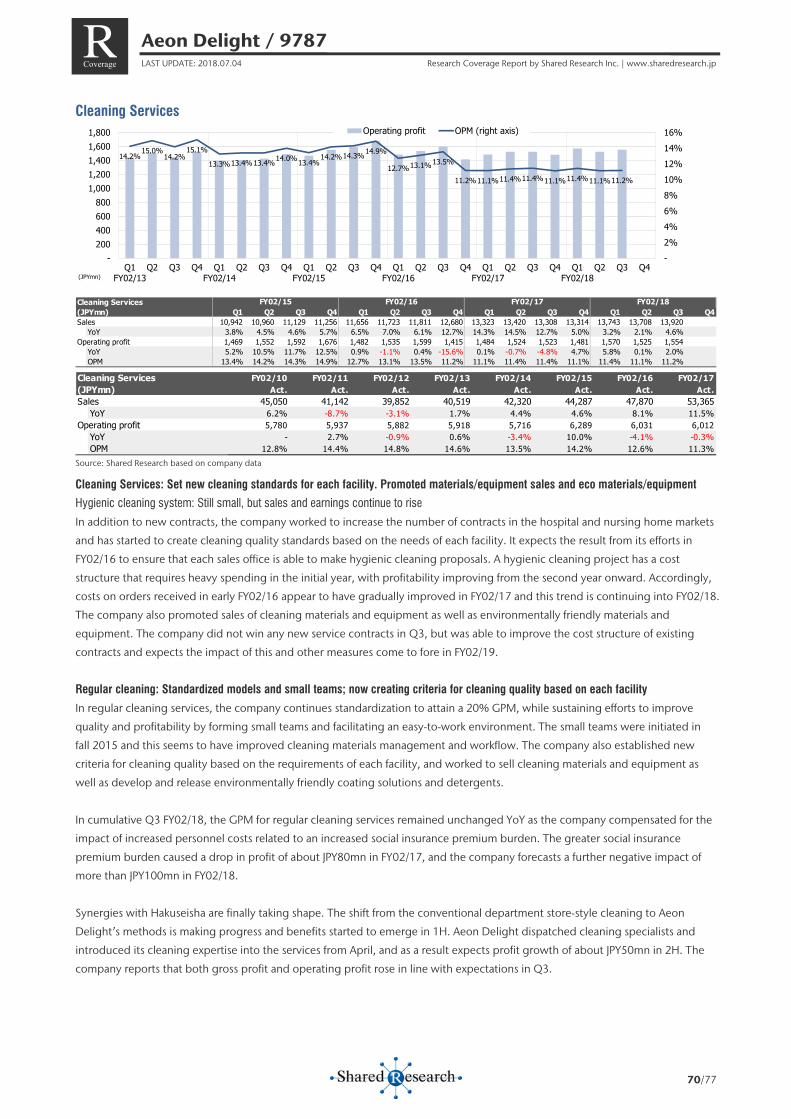
Aeon Delight / 9787 LAST UPDATE: 2018.07.04 Research Coverage Report by Shared Research Inc. | www.sharedresearch.jp
70/77
R Coverage
Cleaning Services
Source: Shared Research based on company data
Cleaning Services: Set new cleaning standards for each facility. Promoted materials/equipment sales and eco materials/equipment
Hygienic cleaning system: Still small, but sales and earnings continue to rise
In addition to new contracts, the company worked to increase the number of contracts in the hospital and nursing home markets
and has started to create cleaning quality standards based on the needs of each facility. It expects the result from its efforts in
FY02/16 to ensure that each sales office is able to make hygienic cleaning proposals. A hygienic cleaning project has a cost
structure that requires heavy spending in the initial year, with profitability improving from the second year onward. Accordingly,
costs on orders received in early FY02/16 appear to have gradually improved in FY02/17 and this trend is continuing into FY02/18.
The company also promoted sales of cleaning materials and equipment as well as environmentally friendly materials and
equipment. The company did not win any new service contracts in Q3, but was able to improve the cost structure of existing
contracts and expects the impact of this and other measures come to fore in FY02/19.
Regular cleaning: Standardized models and small teams; now creating criteria for cleaning quality based on each facility In regular cleaning services, the company continues standardization to attain a 20% GPM, while sustaining efforts to improve
quality and profitability by forming small teams and facilitating an easy-to-work environment. The small teams were initiated in
fall 2015 and this seems to have improved cleaning materials management and workflow. The company also established new
criteria for cleaning quality based on the requirements of each facility, and worked to sell cleaning materials and equipment as
well as develop and release environmentally friendly coating solutions and detergents.
In cumulative Q3 FY02/18, the GPM for regular cleaning services remained unchanged YoY as the company compensated for the
impact of increased personnel costs related to an increased social insurance premium burden. The greater social insurance
premium burden caused a drop in profit of about JPY80mn in FY02/17, and the company forecasts a further negative impact of
more than JPY100mn in FY02/18.
Synergies with Hakuseisha are finally taking shape. The shift from the conventional department store-style cleaning to Aeon
Delight’s methods is making progress and benefits started to emerge in 1H. Aeon Delight dispatched cleaning specialists and
introduced its cleaning expertise into the services from April, and as a result expects profit growth of about JPY50mn in 2H. The
company reports that both gross profit and operating profit rose in line with expectations in Q3.
14.2%15.0%
14.2%15.1%
13.3%13.4%13.4%14.0%13.4%14.2%14.3%14.9%
12.7%13.1%13.5%
11.2%11.1%11.4%11.4%11.1%11.4%11.1%11.2%
-2%4%6%8%10%12%14%16%
-200400600800
1,0001,2001,4001,6001,800
Q1FY02/13
Q2 Q3 Q4 Q1FY02/14
Q2 Q3 Q4 Q1FY02/15
Q2 Q3 Q4 Q1FY02/16
Q2 Q3 Q4 Q1FY02/17
Q2 Q3 Q4 Q1FY02/18
Q2 Q3 Q4
Operating profit OPM (right axis)
(JPYmn)
Cleaning Services(JPYmn) Q1 Q2 Q3 Q4 Q1 Q2 Q3 Q4 Q1 Q2 Q3 Q4 Q1 Q2 Q3 Q4Sales 10,942 10,960 11,129 11,256 11,656 11,723 11,811 12,680 13,323 13,420 13,308 13,314 13,743 13,708 13,920
YoY 3.8% 4.5% 4.6% 5.7% 6.5% 7.0% 6.1% 12.7% 14.3% 14.5% 12.7% 5.0% 3.2% 2.1% 4.6% Operating profit 1,469 1,552 1,592 1,676 1,482 1,535 1,599 1,415 1,484 1,524 1,523 1,481 1,570 1,525 1,554
YoY 5.2% 10.5% 11.7% 12.5% 0.9% -1.1% 0.4% -15.6% 0.1% -0.7% -4.8% 4.7% 5.8% 0.1% 2.0% OPM 13.4% 14.2% 14.3% 14.9% 12.7% 13.1% 13.5% 11.2% 11.1% 11.4% 11.4% 11.1% 11.4% 11.1% 11.2%
FY02/15 FY02/16 FY02/17 FY02/18
Cleaning Services FY02/10 FY02/11 FY02/12 FY02/13 FY02/14 FY02/15 FY02/16 FY02/17(JPYmn) Act. Act. Act. Act. Act. Act. Act. Act.Sales 45,050 41,142 39,852 40,519 42,320 44,287 47,870 53,365
YoY 6.2% -8.7% -3.1% 1.7% 4.4% 4.6% 8.1% 11.5%Operating profit 5,780 5,937 5,882 5,918 5,716 6,289 6,031 6,012
YoY - 2.7% -0.9% 0.6% -3.4% 10.0% -4.1% -0.3%OPM 12.8% 14.4% 14.8% 14.6% 13.5% 14.2% 12.6% 11.3%
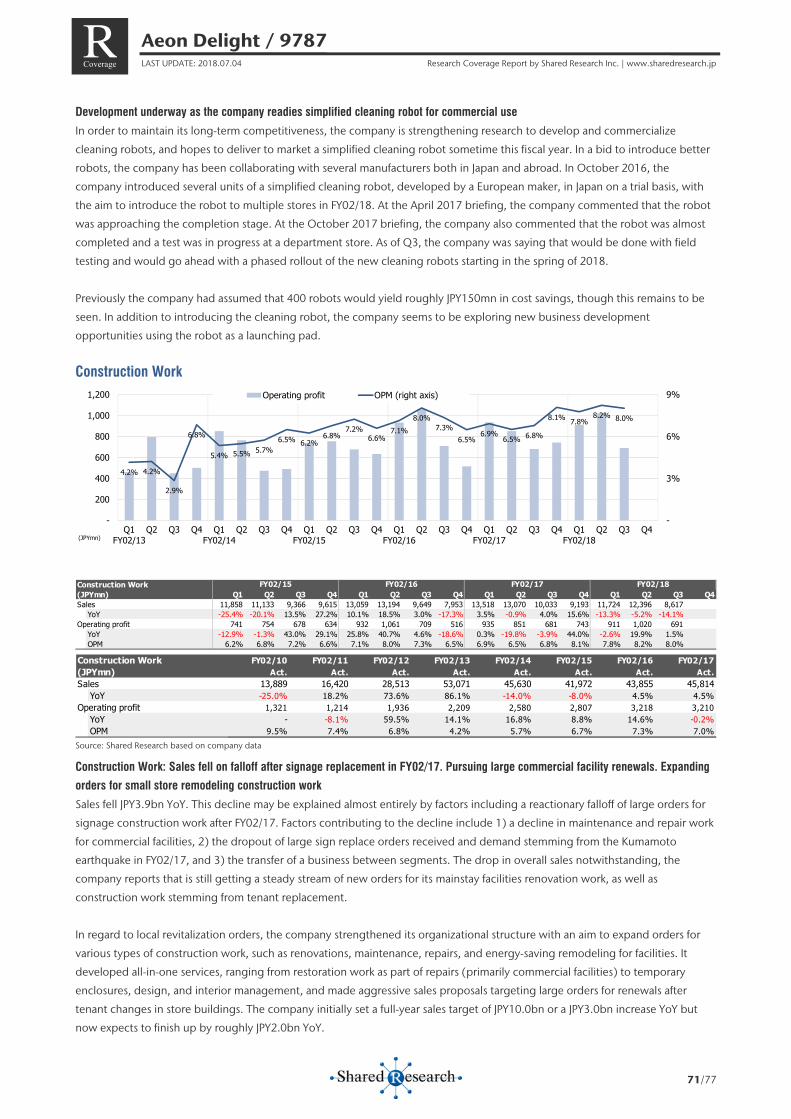
Aeon Delight / 9787 LAST UPDATE: 2018.07.04 Research Coverage Report by Shared Research Inc. | www.sharedresearch.jp
71/77
R Coverage
Development underway as the company readies simplified cleaning robot for commercial use
In order to maintain its long-term competitiveness, the company is strengthening research to develop and commercialize
cleaning robots, and hopes to deliver to market a simplified cleaning robot sometime this fiscal year. In a bid to introduce better
robots, the company has been collaborating with several manufacturers both in Japan and abroad. In October 2016, the
company introduced several units of a simplified cleaning robot, developed by a European maker, in Japan on a trial basis, with
the aim to introduce the robot to multiple stores in FY02/18. At the April 2017 briefing, the company commented that the robot
was approaching the completion stage. At the October 2017 briefing, the company also commented that the robot was almost
completed and a test was in progress at a department store. As of Q3, the company was saying that would be done with field
testing and would go ahead with a phased rollout of the new cleaning robots starting in the spring of 2018.
Previously the company had assumed that 400 robots would yield roughly JPY150mn in cost savings, though this remains to be
seen. In addition to introducing the cleaning robot, the company seems to be exploring new business development
opportunities using the robot as a launching pad.
Construction Work
Source: Shared Research based on company data
Construction Work: Sales fell on falloff after signage replacement in FY02/17. Pursuing large commercial facility renewals. Expanding
orders for small store remodeling construction work
Sales fell JPY3.9bn YoY. This decline may be explained almost entirely by factors including a reactionary falloff of large orders for
signage construction work after FY02/17. Factors contributing to the decline include 1) a decline in maintenance and repair work
for commercial facilities, 2) the dropout of large sign replace orders received and demand stemming from the Kumamoto
earthquake in FY02/17, and 3) the transfer of a business between segments. The drop in overall sales notwithstanding, the
company reports that is still getting a steady stream of new orders for its mainstay facilities renovation work, as well as
construction work stemming from tenant replacement.
In regard to local revitalization orders, the company strengthened its organizational structure with an aim to expand orders for
various types of construction work, such as renovations, maintenance, repairs, and energy-saving remodeling for facilities. It
developed all-in-one services, ranging from restoration work as part of repairs (primarily commercial facilities) to temporary
enclosures, design, and interior management, and made aggressive sales proposals targeting large orders for renewals after
tenant changes in store buildings. The company initially set a full-year sales target of JPY10.0bn or a JPY3.0bn increase YoY but
now expects to finish up by roughly JPY2.0bn YoY.
4.2% 4.2%
2.9%
6.8%
5.4% 5.5% 5.7%6.5% 6.2%
6.8%7.2%
6.6%7.1%
8.0%7.3%
6.5%6.9%
6.5% 6.8%
8.1% 7.8%8.2% 8.0%
-
3%
6%
9%
-
200
400
600
800
1,000
1,200
Q1FY02/13
Q2 Q3 Q4 Q1FY02/14
Q2 Q3 Q4 Q1FY02/15
Q2 Q3 Q4 Q1FY02/16
Q2 Q3 Q4 Q1FY02/17
Q2 Q3 Q4 Q1FY02/18
Q2 Q3 Q4
Operating profit OPM (right axis)
(JPYmn)
Construction Work(JPYmn) Q1 Q2 Q3 Q4 Q1 Q2 Q3 Q4 Q1 Q2 Q3 Q4 Q1 Q2 Q3 Q4Sales 11,858 11,133 9,366 9,615 13,059 13,194 9,649 7,953 13,518 13,070 10,033 9,193 11,724 12,396 8,617
YoY -25.4% -20.1% 13.5% 27.2% 10.1% 18.5% 3.0% -17.3% 3.5% -0.9% 4.0% 15.6% -13.3% -5.2% -14.1% Operating profit 741 754 678 634 932 1,061 709 516 935 851 681 743 911 1,020 691
YoY -12.9% -1.3% 43.0% 29.1% 25.8% 40.7% 4.6% -18.6% 0.3% -19.8% -3.9% 44.0% -2.6% 19.9% 1.5% OPM 6.2% 6.8% 7.2% 6.6% 7.1% 8.0% 7.3% 6.5% 6.9% 6.5% 6.8% 8.1% 7.8% 8.2% 8.0%
FY02/15 FY02/16 FY02/17 FY02/18
Construction Work FY02/10 FY02/11 FY02/12 FY02/13 FY02/14 FY02/15 FY02/16 FY02/17(JPYmn) Act. Act. Act. Act. Act. Act. Act. Act.Sales 13,889 16,420 28,513 53,071 45,630 41,972 43,855 45,814
YoY -25.0% 18.2% 73.6% 86.1% -14.0% -8.0% 4.5% 4.5%Operating profit 1,321 1,214 1,936 2,209 2,580 2,807 3,218 3,210
YoY - -8.1% 59.5% 14.1% 16.8% 8.8% 14.6% -0.2%OPM 9.5% 7.4% 6.8% 4.2% 5.7% 6.7% 7.3% 7.0%
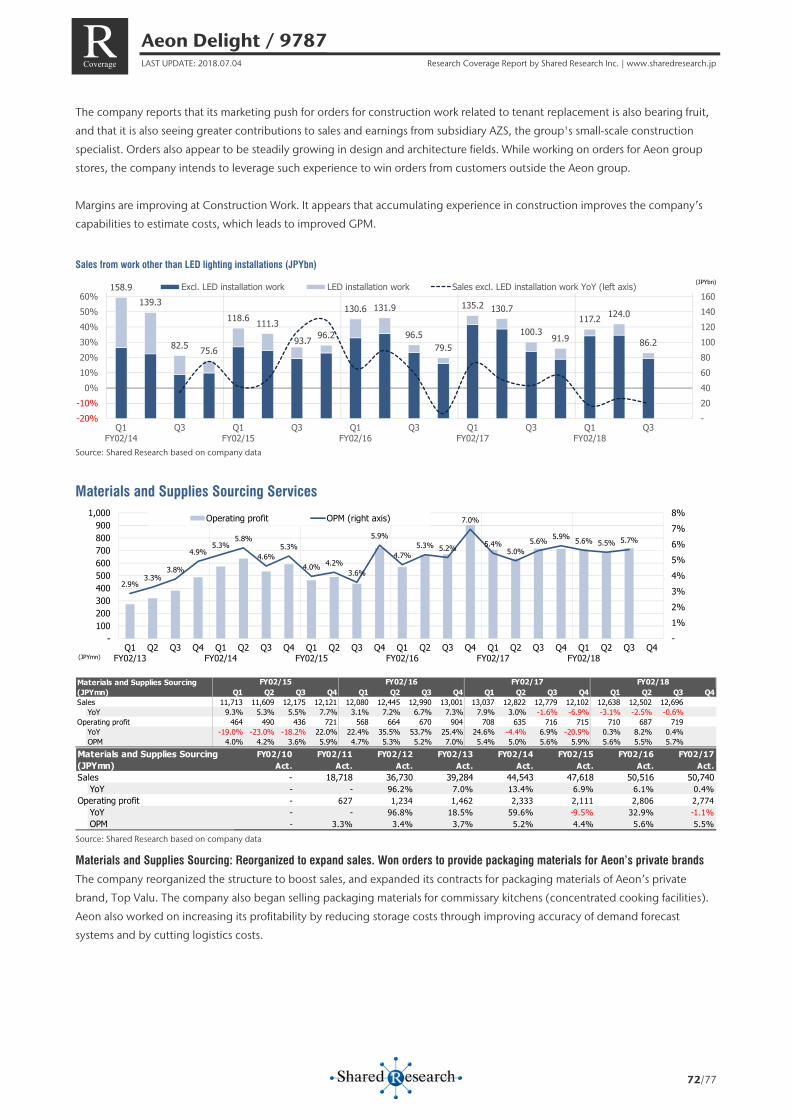
Aeon Delight / 9787 LAST UPDATE: 2018.07.04 Research Coverage Report by Shared Research Inc. | www.sharedresearch.jp
72/77
R Coverage
The company reports that its marketing push for orders for construction work related to tenant replacement is also bearing fruit,
and that it is also seeing greater contributions to sales and earnings from subsidiary AZS, the group's small-scale construction
specialist. Orders also appear to be steadily growing in design and architecture fields. While working on orders for Aeon group
stores, the company intends to leverage such experience to win orders from customers outside the Aeon group.
Margins are improving at Construction Work. It appears that accumulating experience in construction improves the company’s
capabilities to estimate costs, which leads to improved GPM.
Sales from work other than LED lighting installations (JPYbn)
Source: Shared Research based on company data
Materials and Supplies Sourcing Services
Source: Shared Research based on company data
Materials and Supplies Sourcing: Reorganized to expand sales. Won orders to provide packaging materials for Aeon’s private brands
The company reorganized the structure to boost sales, and expanded its contracts for packaging materials of Aeon’s private
brand, Top Valu. The company also began selling packaging materials for commissary kitchens (concentrated cooking facilities).
Aeon also worked on increasing its profitability by reducing storage costs through improving accuracy of demand forecast
systems and by cutting logistics costs.
158.9139.3
82.5 75.6
118.6 111.3
93.7 96.2
130.6 131.9
96.579.5
135.2 130.7
100.3 91.9
117.2 124.0
86.2
-20406080100120140160
-20%-10%
0%10%20%30%40%50%60%
Q1FY02/14
Q3 Q1FY02/15
Q3 Q1FY02/16
Q3 Q1FY02/17
Q3 Q1FY02/18
Q3
Excl. LED installation work LED installation work Sales excl. LED installation work YoY (left axis) (JPYbn)
2.9%3.3%
3.8%
4.9%5.3%
5.8%
4.6%5.3%
4.0% 4.2%3.6%
5.9%
4.7%5.3% 5.2%
7.0%
5.4%5.0%
5.6% 5.9% 5.6% 5.5% 5.7%
-1%2%3%4%5%6%7%8%
-100200300400500600700800900
1,000
Q1FY02/13
Q2 Q3 Q4 Q1FY02/14
Q2 Q3 Q4 Q1FY02/15
Q2 Q3 Q4 Q1FY02/16
Q2 Q3 Q4 Q1FY02/17
Q2 Q3 Q4 Q1FY02/18
Q2 Q3 Q4
Operating profit OPM (right axis)
(JPYmn)
Materials and Supplies Sourcing(JPYmn) Q1 Q2 Q3 Q4 Q1 Q2 Q3 Q4 Q1 Q2 Q3 Q4 Q1 Q2 Q3 Q4Sales 11,713 11,609 12,175 12,121 12,080 12,445 12,990 13,001 13,037 12,822 12,779 12,102 12,638 12,502 12,696
YoY 9.3% 5.3% 5.5% 7.7% 3.1% 7.2% 6.7% 7.3% 7.9% 3.0% -1.6% -6.9% -3.1% -2.5% -0.6% Operating profit 464 490 436 721 568 664 670 904 708 635 716 715 710 687 719
YoY -19.0% -23.0% -18.2% 22.0% 22.4% 35.5% 53.7% 25.4% 24.6% -4.4% 6.9% -20.9% 0.3% 8.2% 0.4% OPM 4.0% 4.2% 3.6% 5.9% 4.7% 5.3% 5.2% 7.0% 5.4% 5.0% 5.6% 5.9% 5.6% 5.5% 5.7%
FY02/15 FY02/16 FY02/17 FY02/18
Materials and Supplies Sourcing FY02/10 FY02/11 FY02/12 FY02/13 FY02/14 FY02/15 FY02/16 FY02/17(JPYmn) Act. Act. Act. Act. Act. Act. Act. Act.Sales - 18,718 36,730 39,284 44,543 47,618 50,516 50,740
YoY - - 96.2% 7.0% 13.4% 6.9% 6.1% 0.4%Operating profit - 627 1,234 1,462 2,333 2,111 2,806 2,774
YoY - - 96.8% 18.5% 59.6% -9.5% 32.9% -1.1%OPM - 3.3% 3.4% 3.7% 5.2% 4.4% 5.6% 5.5%
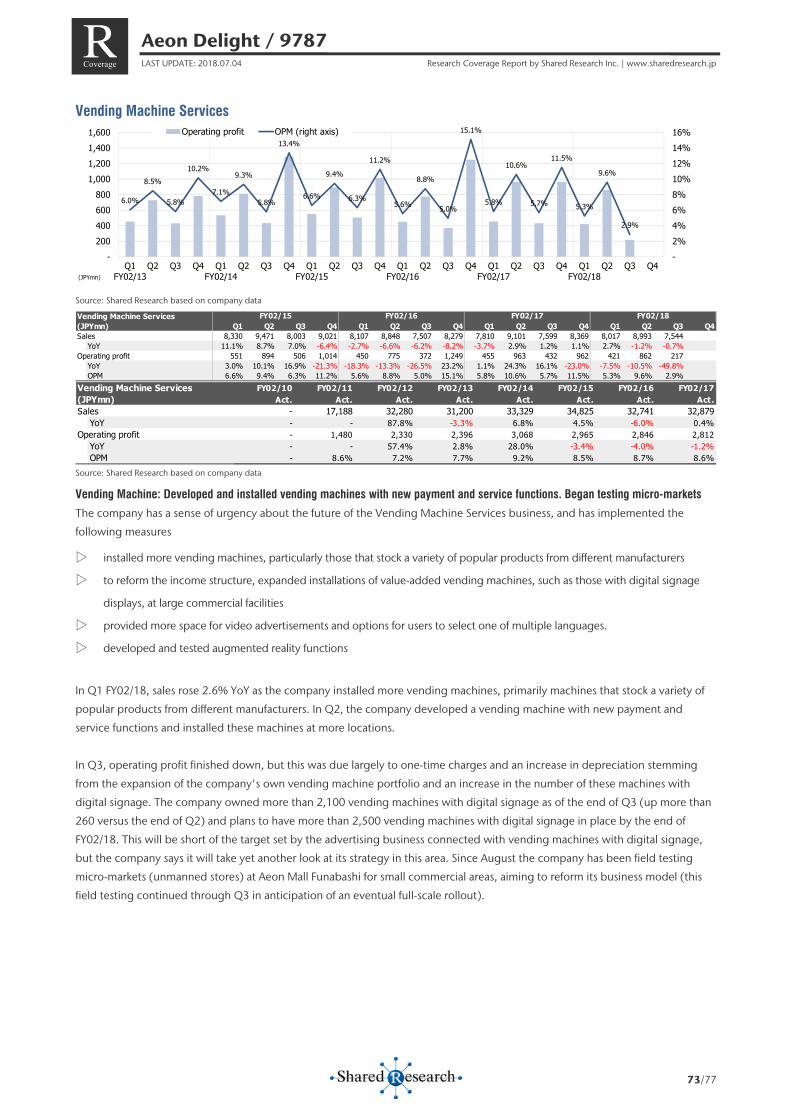
Aeon Delight / 9787 LAST UPDATE: 2018.07.04 Research Coverage Report by Shared Research Inc. | www.sharedresearch.jp
73/77
R Coverage
Vending Machine Services
Source: Shared Research based on company data
Source: Shared Research based on company data
Vending Machine: Developed and installed vending machines with new payment and service functions. Began testing micro-markets
The company has a sense of urgency about the future of the Vending Machine Services business, and has implemented the
following measures
▷ installed more vending machines, particularly those that stock a variety of popular products from different manufacturers
▷ to reform the income structure, expanded installations of value-added vending machines, such as those with digital signage
displays, at large commercial facilities
▷ provided more space for video advertisements and options for users to select one of multiple languages.
▷ developed and tested augmented reality functions
In Q1 FY02/18, sales rose 2.6% YoY as the company installed more vending machines, primarily machines that stock a variety of
popular products from different manufacturers. In Q2, the company developed a vending machine with new payment and
service functions and installed these machines at more locations.
In Q3, operating profit finished down, but this was due largely to one-time charges and an increase in depreciation stemming
from the expansion of the company's own vending machine portfolio and an increase in the number of these machines with
digital signage. The company owned more than 2,100 vending machines with digital signage as of the end of Q3 (up more than
260 versus the end of Q2) and plans to have more than 2,500 vending machines with digital signage in place by the end of
FY02/18. This will be short of the target set by the advertising business connected with vending machines with digital signage,
but the company says it will take yet another look at its strategy in this area. Since August the company has been field testing
micro-markets (unmanned stores) at Aeon Mall Funabashi for small commercial areas, aiming to reform its business model (this
field testing continued through Q3 in anticipation of an eventual full-scale rollout).
6.0%
8.5%
5.8%
10.2%
7.1%
9.3%
5.8%
13.4%
6.6%
9.4%
6.3%
11.2%
5.6%
8.8%
5.0%
15.1%
5.8%
10.6%
5.7%
11.5%
5.3%
9.6%
2.9%
-2%4%6%8%10%12%14%16%
-200400600800
1,0001,2001,4001,600
Q1FY02/13
Q2 Q3 Q4 Q1FY02/14
Q2 Q3 Q4 Q1FY02/15
Q2 Q3 Q4 Q1FY02/16
Q2 Q3 Q4 Q1FY02/17
Q2 Q3 Q4 Q1FY02/18
Q2 Q3 Q4
Operating profit OPM (right axis)
(JPYmn)
Vending Machine Services(JPYmn) Q1 Q2 Q3 Q4 Q1 Q2 Q3 Q4 Q1 Q2 Q3 Q4 Q1 Q2 Q3 Q4Sales 8,330 9,471 8,003 9,021 8,107 8,848 7,507 8,279 7,810 9,101 7,599 8,369 8,017 8,993 7,544
YoY 11.1% 8.7% 7.0% -6.4% -2.7% -6.6% -6.2% -8.2% -3.7% 2.9% 1.2% 1.1% 2.7% -1.2% -0.7% Operating profit 551 894 506 1,014 450 775 372 1,249 455 963 432 962 421 862 217
YoY 3.0% 10.1% 16.9% -21.3% -18.3% -13.3% -26.5% 23.2% 1.1% 24.3% 16.1% -23.0% -7.5% -10.5% -49.8% OPM 6.6% 9.4% 6.3% 11.2% 5.6% 8.8% 5.0% 15.1% 5.8% 10.6% 5.7% 11.5% 5.3% 9.6% 2.9%
FY02/15 FY02/16 FY02/17 FY02/18
Vending Machine Services FY02/10 FY02/11 FY02/12 FY02/13 FY02/14 FY02/15 FY02/16 FY02/17(JPYmn) Act. Act. Act. Act. Act. Act. Act. Act.Sales - 17,188 32,280 31,200 33,329 34,825 32,741 32,879
YoY - - 87.8% -3.3% 6.8% 4.5% -6.0% 0.4%Operating profit - 1,480 2,330 2,396 3,068 2,965 2,846 2,812
YoY - - 57.4% 2.8% 28.0% -3.4% -4.0% -1.2%OPM - 8.6% 7.2% 7.7% 9.2% 8.5% 8.7% 8.6%
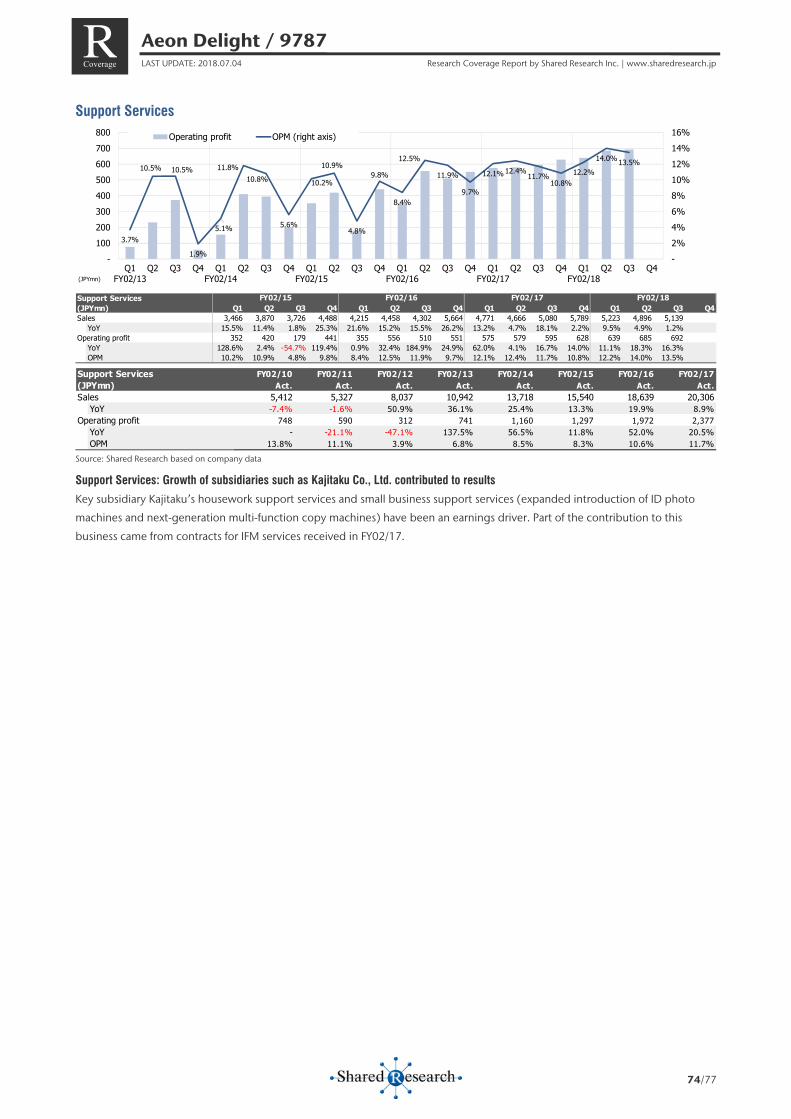
Aeon Delight / 9787 LAST UPDATE: 2018.07.04 Research Coverage Report by Shared Research Inc. | www.sharedresearch.jp
74/77
R Coverage
Support Services
Source: Shared Research based on company data
Support Services: Growth of subsidiaries such as Kajitaku Co., Ltd. contributed to results
Key subsidiary Kajitaku’s housework support services and small business support services (expanded introduction of ID photo
machines and next-generation multi-function copy machines) have been an earnings driver. Part of the contribution to this
business came from contracts for IFM services received in FY02/17.
3.7%
10.5% 10.5%
1.9%
5.1%
11.8%10.8%
5.6%
10.2%
10.9%
4.8%
9.8%
8.4%
12.5%
11.9%
9.7%
12.1% 12.4%11.7%
10.8%12.2%
14.0% 13.5%
-2%4%6%8%10%12%14%16%
-100200300400500600700800
Q1FY02/13
Q2 Q3 Q4 Q1FY02/14
Q2 Q3 Q4 Q1FY02/15
Q2 Q3 Q4 Q1FY02/16
Q2 Q3 Q4 Q1FY02/17
Q2 Q3 Q4 Q1FY02/18
Q2 Q3 Q4
Operating profit OPM (right axis)
(JPYmn)
Support Services(JPYmn) Q1 Q2 Q3 Q4 Q1 Q2 Q3 Q4 Q1 Q2 Q3 Q4 Q1 Q2 Q3 Q4Sales 3,466 3,870 3,726 4,488 4,215 4,458 4,302 5,664 4,771 4,666 5,080 5,789 5,223 4,896 5,139
YoY 15.5% 11.4% 1.8% 25.3% 21.6% 15.2% 15.5% 26.2% 13.2% 4.7% 18.1% 2.2% 9.5% 4.9% 1.2% Operating profit 352 420 179 441 355 556 510 551 575 579 595 628 639 685 692
YoY 128.6% 2.4% -54.7% 119.4% 0.9% 32.4% 184.9% 24.9% 62.0% 4.1% 16.7% 14.0% 11.1% 18.3% 16.3% OPM 10.2% 10.9% 4.8% 9.8% 8.4% 12.5% 11.9% 9.7% 12.1% 12.4% 11.7% 10.8% 12.2% 14.0% 13.5%
FY02/15 FY02/16 FY02/17 FY02/18
Support Services FY02/10 FY02/11 FY02/12 FY02/13 FY02/14 FY02/15 FY02/16 FY02/17(JPYmn) Act. Act. Act. Act. Act. Act. Act. Act.Sales 5,412 5,327 8,037 10,942 13,718 15,540 18,639 20,306
YoY -7.4% -1.6% 50.9% 36.1% 25.4% 13.3% 19.9% 8.9%Operating profit 748 590 312 741 1,160 1,297 1,972 2,377
YoY - -21.1% -47.1% 137.5% 56.5% 11.8% 52.0% 20.5%OPM 13.8% 11.1% 3.9% 6.8% 8.5% 8.3% 10.6% 11.7%
Aeon Delight / 9787 LAST UPDATE: 2018.07.04 Research Coverage Report by Shared Research Inc. | www.sharedresearch.jp
75/77
R Coverage
News & topics
March 2018
On March 28, 2018, the company announced that it will participate in the renewable energy pilot project utilizing blockchain
technology to achieve a carbon-free society. The company plans to install dedicated equipment at 35 Aeon Group stores in
FY02/19 and at about 1,000 stores in FY02/20. It intends to manage energy and sell it to consumers, utilizing a platform that can
identify the type of electric power being generated and trade the power accordingly (scheduled to be completed in FY02/20).
On March 19, 2018, the company announced changes in representative directors. Senior managing executive officer Kazumasa
Hamada will assume the role of president and current president Ippei Nakayama will assume the role of chairman of the board of
directors (effective on the day of the annual general shareholder meeting in May 2018).
On the same day, the company announced it plans to establish AeonDelight DeepBlue Technology (Shanghai) Co., Ltd., a joint
venture with DeepBlue Technology (Shanghai) Co., Ltd. (China) on April 26, 2018. The company will have a 65% stake in the
new company, while DeepBlue Technology (Shanghai) will have 35%.
Reasons for establishing a new company
DeepBlue Technology (Shanghai) possesses strengths in the basic research and application development for AI and provides
integrated solutions for the processes from R&D to product planning, development, and production. The new company will
function as an R&D center specializing in R&D to create SmartFM, a new business model for facilities management (FM) which
utilizes the company’s wealth of expertise amassed in Japan, combined with the cutting-edge technology. SmartFM will utilize AI
and IoT in visual monitoring control systems, security systems, and assorted robot technology in order to make customer facilities
more intelligent, improve the convenience of facility users, and significantly increase productivity by automating and
streamlining operations. In the future, the company aims to launch SmartFM in China, Japan, and ASEAN nations.
Aeon Delight prioritizes Integrated Facility Management (IFM), Asia, and technology in its medium-term management plan. The
establishment of the new company is one of the initiatives to achieve goals in the plan.
The company expects little impact on FY02/18 full-year results from the establishment of the joint venture and plans to disclose
promptly if it determines that there is an impact in the future.
December 2016
On December 6, 2016, VOYAGE GROUP, Inc. (TSE: 3688) announced that it is entering a comprehensive operational tie-up for
online sales of housework support services with Kajitaku Co., Ltd., an Aeon Delight subsidiary (97.7% stake) that operates the
Aeon group’s housework support operations. VOYAGE also announced that on December 8, 2016 it will establish a wholly
owned subsidiary, Voyage Nexus, to manage the online sales of housework support services. The service is planned for launch in
the middle of 2017.
Operational tie-up
According to a presentation by the Ministry of Economy, Trade and Industry, the market size for home support services will be
roughly JPY600bn. In the midst of a growing market, Kajitaku bundled and sold its housework support services primarily to
retailers, boosting its earnings.
Through the operational tie-up, Kajitaku will focus on developing housework support services and managing those services.
Voyage Nexus will be responsible for features on Kajitaku.com and the Members Personal Page, features that Kajitaku used to run.
Voyage Nexus will also improve customer relations and online sales by redesigning the website, making it smartphone
compatible, and creating an app for the site. The company will assist in the development of a housework support services system
for the staff. The tie-up plans to leverage VOYAGE GROUP’s user base of roughly 8.4mn to promote and market its housework
support services. VOYAGE GROUP’s user base is primarily women in their 30s and 40s on the group’s websites such as EC Navi, a
point navigation site, and PeX, a point exchange platform.
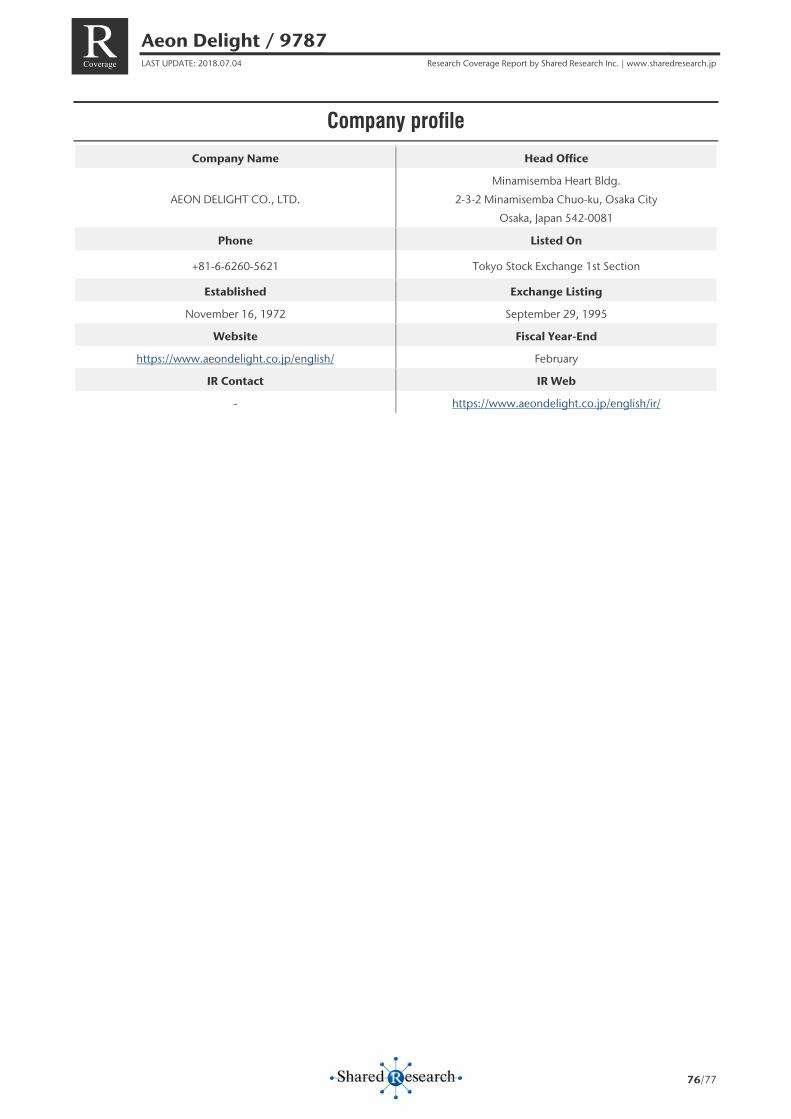
Aeon Delight / 9787 LAST UPDATE: 2018.07.04 Research Coverage Report by Shared Research Inc. | www.sharedresearch.jp
76/77
R Coverage
Company profile
Company Name Head Office
AEON DELIGHT CO., LTD.
Minamisemba Heart Bldg.
2-3-2 Minamisemba Chuo-ku, Osaka City
Osaka, Japan 542-0081
Phone Listed On
+81-6-6260-5621 Tokyo Stock Exchange 1st Section
Established Exchange Listing
November 16, 1972 September 29, 1995
Website Fiscal Year-End
https://www.aeondelight.co.jp/english/ February
IR Contact IR Web
- https://www.aeondelight.co.jp/english/ir/
About Shared Research Inc. Research Coverage Report by Shared Research Inc. | www.sharedresearch.jp
77/77
R Coverage
We offer corporate clients comprehensive report coverage, a service that allows them to better inform investors and other stakeholders by presenting a continuously
updated third-party view of business fundamentals, independent of investment biases. Shared Research can be found on the web at http://www.sharedresearch.jp.
Current Client Coverage of Shared Research Inc.
Attention: If you would like to see companies you invest in on this list, ask them to become our client, or sponsor a report yourself.
Disclaimer: This document is provided for informational purposes only. No investment opinion or advice is provided, intended, or solicited. Shared Research Inc. offers
no warranty, either expressed or implied, regarding the veracity of data or interpretations of data included in this report. We shall not be held responsible for any damage
caused by the use of this report. The copyright of this report and the rights regarding the creation and exploitation of the derivative work of this and other Shared
Research Reports belong to Shared Research. This report may be reproduced or modified for personal use; distribution, transfer, or other uses of this report are strictly
prohibited and a violation of the copyright of this report. Our officers and employees may currently, or in the future, have a position in securities of the companies
mentioned in this report, which may affect this report’s objectivity.
Japanese Financial Instruments and Exchange Law (FIEL) Disclaimer: The report has been prepared by Shared Research under a contract with the company
described in this report (“the company”). Opinions and views presented are ours where so stated. Such opinions and views attributed to the company are
interpretations made by Shared Research. We represent that if this report is deemed to include an opinion by us that could influence investment decisions in the
company, such opinion may be in exchange for consideration or promise of consideration from the company to Shared Research.
Contact Details Shared Research Inc.
3-31-12 Sendagi Bunkyo-ku Tokyo, Japan
URL: https://sharedresearch.jp
Phone: +81 (0)3 5834-8787
Email: [email protected]
Accordia Golf Trust FRONTEO, Inc. Oki Electric Industry Co., LtdAccretive Co., Ltd. Fujita Kanko Inc. ONO SOKKI Co., Ltd.Adastria Co., Ltd. FURYU CORPORATION ONWARD HOLDINGS CO.,LTD.ADJUVANT COSME JAPAN CO., LTD. Gamecard-Joyco Holdings, Inc. PARIS MIKI HOLDINGS Inc.Aeon Delight Co., Ltd. GCA Corporation PIGEON CORPORATIONAeon Fantasy Co., Ltd. Grandy House Corporation RACCOON CO., LTD.Ai Holdings Corporation Hakuto Co., Ltd. RESORTTRUST, INC.AnGes Inc. Happinet Corporation ROUND ONE CorporationAnicom Holdings, Inc. Harmonic Drive Systems Inc. RVH Inc.Anritsu Corporation Hearts United Group Co., Ltd. RYOHIN KEIKAKU CO., LTD.Apaman Co., Ltd. HOUSEDO Co., Ltd. SanBio Company LimitedArealink Co.,Ltd. IDOM Inc. SANIX INCORPORATEDArtspark Holdings Inc. IGNIS LTD. Sanrio Company, Ltd.AS ONE CORPORATION Inabata & Co., Ltd. SATO HOLDINGS CORPORATIONAteam Inc. Infocom Corporation SBS Holdings, Inc. Aucfan Co., Ltd. Infomart Corporation Seikagaku CorporationAxell Corporation Intelligent Wave, Inc. Seria Co.,Ltd.Azbil Corporation istyle Inc. SHIP HEALTHCARE HOLDINGS, INC.BEENOS Inc. Itochu Enex Co., Ltd. Showcase-Tv Inc.Bell-Park Co., Ltd. JSB Co., Ltd. SMS Co., Ltd.Benefit One Inc. J Trust Co., Ltd Snow Peak, Inc.B-lot Co.,Ltd. Japan Best Rescue System Co., Ltd. Solasia Pharma K.K.Canon Marketing Japan Inc. JINS Inc. SOURCENEXT CorporationCarna Biosciences, Inc. JP-HOLDINGS, INC. Star Mica Co., Ltd.CERES INC. KAMEDA SEIKA CO., LTD. Strike Co., Ltd.Chiyoda Co., Ltd. Kenedix, Inc. SymBio Pharmaceuticals LimitedChugoku Marine Paints, Ltd. KFC Holdings Japan, Ltd. Synchro Food Co., Ltd.cocokara fine Inc. KI-Star Real Estate Co., Ltd. TAIYO HOLDINGS CO., LTD.COMSYS Holdings Corporation Kumiai Chemical Industry Co., Ltd. Takashimaya Company, LimitedCRE, Inc. LAC Co., Ltd. Takihyo Co., Ltd.CREEK & RIVER Co., Ltd. Lasertec Corporation TAMAGAWA HOLDINGS CO., LTD.Daiseki Co., Ltd. MATSUI SECURITIES CO., LTD. TEAR CorporationDIC Corporation Medical System Network Co., Ltd. 3-D Matrix, Ltd.Digital Arts Inc. MEDINET Co., Ltd. TKC CorporationDigital Garage Inc. Milbon Co., Ltd. TOKAI Holdings CorporationDon Quijote Holdings Co., Ltd. MIRAIT Holdings Corporation Tri-Stage Inc.Dream Incubator Inc. Monex Goup Inc. VISION INC.EARTH CHEMICAL CO., LTD. NAGASE & CO., LTD VISIONARY HOLDINGS CO., LTD.Elecom Co., Ltd. NAIGAI TRANS LINE LTD. VOYAGE GROUP, INC.Emergency Assistance Japan Co., Ltd. NanoCarrier Co., Ltd. WirelessGate, Inc.en-Japan Inc. Net One Systems Co.,Ltd. YELLOW HAT LTD.euglena Co., Ltd. Nichi-Iko Pharmaceutical Co., Ltd. YUMESHIN HOLDINGS CO., LTD.Ferrotec Holdings Corporation NIPPON PARKING DEVELOPMENT Co., Ltd. Yume no Machi Souzou Iinkai Co., Ltd.FIELDS CORPORATION Nisshinbo Holdings Inc. Yushiro Chemical Industry Co., Ltd.Financial Products Group Co., Ltd. NS TOOL CO., LTD. ZAPPALLAS, INC.FreeBit Co., Ltd. NTT URBAN DEVELOPMENT CORPORATION