aerodynamics of bridge hangers in smooth and...
TRANSCRIPT
General rights Copyright and moral rights for the publications made accessible in the public portal are retained by the authors and/or other copyright owners and it is a condition of accessing publications that users recognise and abide by the legal requirements associated with these rights.
• Users may download and print one copy of any publication from the public portal for the purpose of private study or research. • You may not further distribute the material or use it for any profit-making activity or commercial gain • You may freely distribute the URL identifying the publication in the public portal
If you believe that this document breaches copyright please contact us providing details, and we will remove access to the work immediately and investigate your claim.
Downloaded from orbit.dtu.dk on: Sep 16, 2018
Aerodynamics of bridge hangers in smooth and turbulent flow and implications onaeroelastic stability
Demartino, Cristoforo; Ricciardelli, Francesco; Georgakis, Christos T.
Published in:Proceedings of International Conference on Wind Engineering 2015
Publication date:2015
Document VersionPeer reviewed version
Link back to DTU Orbit
Citation (APA):Demartino, C., Ricciardelli, F., & Georgakis, C. T. (2015). Aerodynamics of bridge hangers in smooth andturbulent flow and implications on aeroelastic stability. In Proceedings of International Conference on WindEngineering 2015 International Association for Wind Engineering (IAWE).
KEY WORDS: Bridge cables; Cable aerodynamics; Geometric imperfections; Galloping instability.
1 INTRODUCTION The aerodynamics of circular cylinders featuring geometric imperfections, such as bridge cables, has received much attention
in recent years due to the recognition that such imperfections can be the cause of large amplitude vibrations. Bridge cables are usually made of strands or wires protected by an extruded High Density PolyEthylene (HDPE) circular sheath [1]. In the last 20 years, several bridge cable manufacturers have introduced surface modifications on HDPE sheath in order to reduce the drag and to ensure the aerodynamic stability in all climatic conditions.
In the case of plain HDPE sheaths, although manufacturers put in place all efforts to obtain smooth, perfectly circular sections, superficial irregularities such as roughness, labeling and ovalling make the aerodynamic behaviour deviate from that of perfect circular cylinder. The imperfections are the result of the manufacturing process, of mechanical damage occurring during transport and installation, as well as of the ageing process due to the exposure to environmental factors.
Few experimental works are already available dealing with the effects of imperfections on the aerodynamics of bridge cables. For example, Matteoni and Georgakis and Larose et al. [2,3] confirming previous research showed that the appearance of a negative pressure bubble on one side of a real HDPE tube at the critical Reynolds number range leads to a rapid drop in the drag coefficient and the appearance of a non negligible mean lift force. Moreover, Matteoni and Georgakis, measuring roughness and shape deviation of the wind tunnel model, justified the measured aerodynamic coefficients. Flamand et al. [4], using the Proper Orthogonal Decomposition (POD), measured the spatial and temporal correlation of the pressure pattern along the HDPE tube with surface and section irregularities, to characterise a bi-stabile behaviour occurring at the critical Reynolds number regime; they showed that only three modes are sufficient to faithfully represent the fluctuation of the pressure field around the cable. Matteoni and Georgakis [5] studied the wind induced response of a full scale yawed bridge cable section model, for varying Reynolds numbers and wind angles-of-attack, using passive dynamic wind tunnel tests. They demonstrated that the in-plane aerodynamic damping of a bridge cable section and the overall dynamic response are strongly affected by changes in the angle of attack. This result is in agreement with the prediction of the quasi-steady theory using the result of static tests, although it was not possible to directly compare the regions of instability based on the static and passive dynamic tests.
However, although many authors demonstrated the effects of superficial and sectional imperfection on aerodynamics, little attention has been paid to the refined measurement of aerodynamic data of a real cable and to their use in quasi-steady stability criteria. The purpose of the research herewith is to investigate the aerodynamics of a plain bridge hanger in smooth and turbulent flow and to evaluate the prediction of aerodynamic stability using the different models in literature, correlating these results with the measured imperfections of the tested cable.
2 WIND TUNNEL TESTS Static wind tunnel tests were performed in the DTU/Force Technology Climatic Wind Tunnel (CWT) in Lyngby, Denmark. The wind tunnel is closed circuit with test section dimensions of (length × width × height) 5 m × 2 m × 2 m [6]. The maximum wind speed in the test section is 30 m/s, measured with a Pitot tube located in the centre of the test section, 1.5 m upstream the model. Tests were performed in smooth and turbulent flow.
Turbulence was obtained with a coarse grid placed 3.5 m upstream the models, as shown in Figure 1; the width and the thickness of the grid bars was 8 cm and 2.2 cm, respectively, and their spacing 24 cm. Characterization of the flow in the test chamber was carried out using a TFI Cobra probe; measurements were performed along the cable axis revealing uniform along wind turbulence intensity. In smooth flow in the center of the test section a longitudinal turbulence intensity of 0.9% (±0.2%) was found, which was increased to 10% through addition of the grid; the turbulence scale was calculated using the Taylor’s hypothesis of frozen turbulence and was equal to 0.1 m with the grid installed.
Corrections between the Pitot tube readings and mean flow velocities at the cylinder centerline position were obtained from measurements made using the Cobra probe installed upstream the model in smooth and turbulent flow.
Aerodynamics of bridge hangers in smooth and turbulent flow and implications on aeroelastic stability
Cristoforo Demartino1, Francesco Ricciardelli2, Christos T. Georgakis3
1Dept. of Structures for Engineering and Architecture, University of Naples Federico II, via Claudio 21, 80125 Naples, Italy 2DIIIES, University of Reggio Calabria, Via Graziella - Feo di Vito, 89122 Reggio Calabria, Ital
3Department of Civil Engineering, Technical University of Denmark, 2840 Kgs. Lyngby, DK.
email: [email protected], [email protected], [email protected]
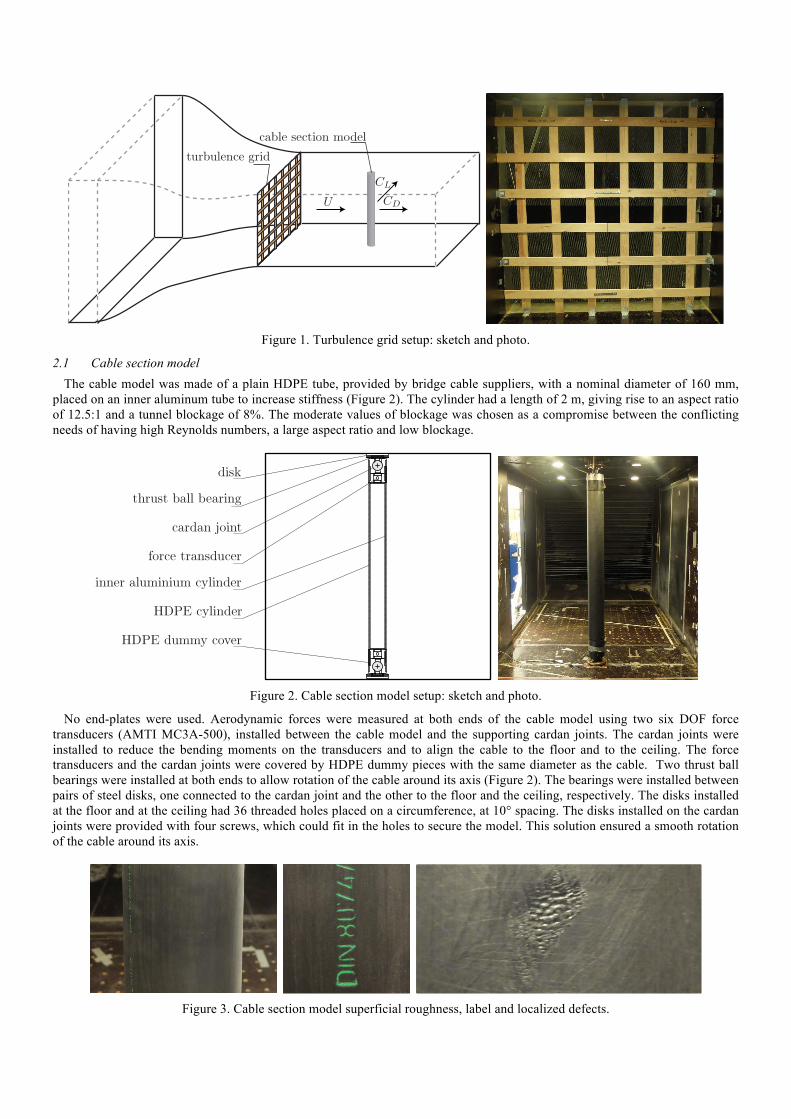
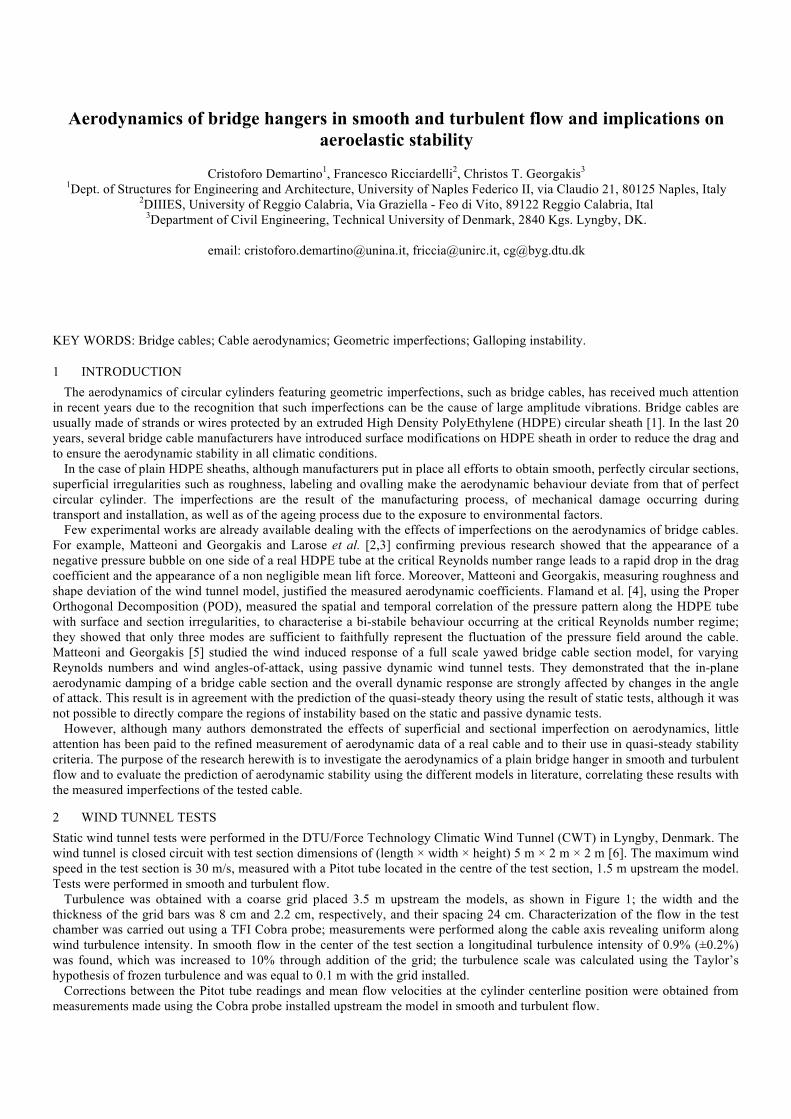
Figure 1. Turbulence grid setup: sketch and photo.
2.1 Cable section model The cable model was made of a plain HDPE tube, provided by bridge cable suppliers, with a nominal diameter of 160 mm,
placed on an inner aluminum tube to increase stiffness (Figure 2). The cylinder had a length of 2 m, giving rise to an aspect ratio of 12.5:1 and a tunnel blockage of 8%. The moderate values of blockage was chosen as a compromise between the conflicting needs of having high Reynolds numbers, a large aspect ratio and low blockage.
Figure 2. Cable section model setup: sketch and photo.
No end-plates were used. Aerodynamic forces were measured at both ends of the cable model using two six DOF force transducers (AMTI MC3A-500), installed between the cable model and the supporting cardan joints. The cardan joints were installed to reduce the bending moments on the transducers and to align the cable to the floor and to the ceiling. The force transducers and the cardan joints were covered by HDPE dummy pieces with the same diameter as the cable. Two thrust ball bearings were installed at both ends to allow rotation of the cable around its axis (Figure 2). The bearings were installed between pairs of steel disks, one connected to the cardan joint and the other to the floor and the ceiling, respectively. The disks installed at the floor and at the ceiling had 36 threaded holes placed on a circumference, at 10° spacing. The disks installed on the cardan joints were provided with four screws, which could fit in the holes to secure the model. This solution ensured a smooth rotation of the cable around its axis.
Figure 3. Cable section model superficial roughness, label and localized defects.
The surface of the cylinder has a variety of imperfections (Figure 3). In particular, widespread small scale (compared with the
diameter) imperfections, such as localized rough zones; these have a preferential extension in the direction of extrusion. Furthermore, the surface has a longitudinal label indicating the product specifications and localized defects (mainly scratches and dents) that were made with the purpose of simulating damage due to transport and installation of the cable.
α[◦]
Re·
10−
5
CD
0 45 90 135 180 225 270 315 360
1
1.5
2
2.5
3
0.3
0.4
0.5
0.6
0.7
0.8
α[◦]
Re·
10−
5
CL
0 45 90 135 180 225 270 315 360
1
1.5
2
2.5
3
−0.5
0
0.5
1
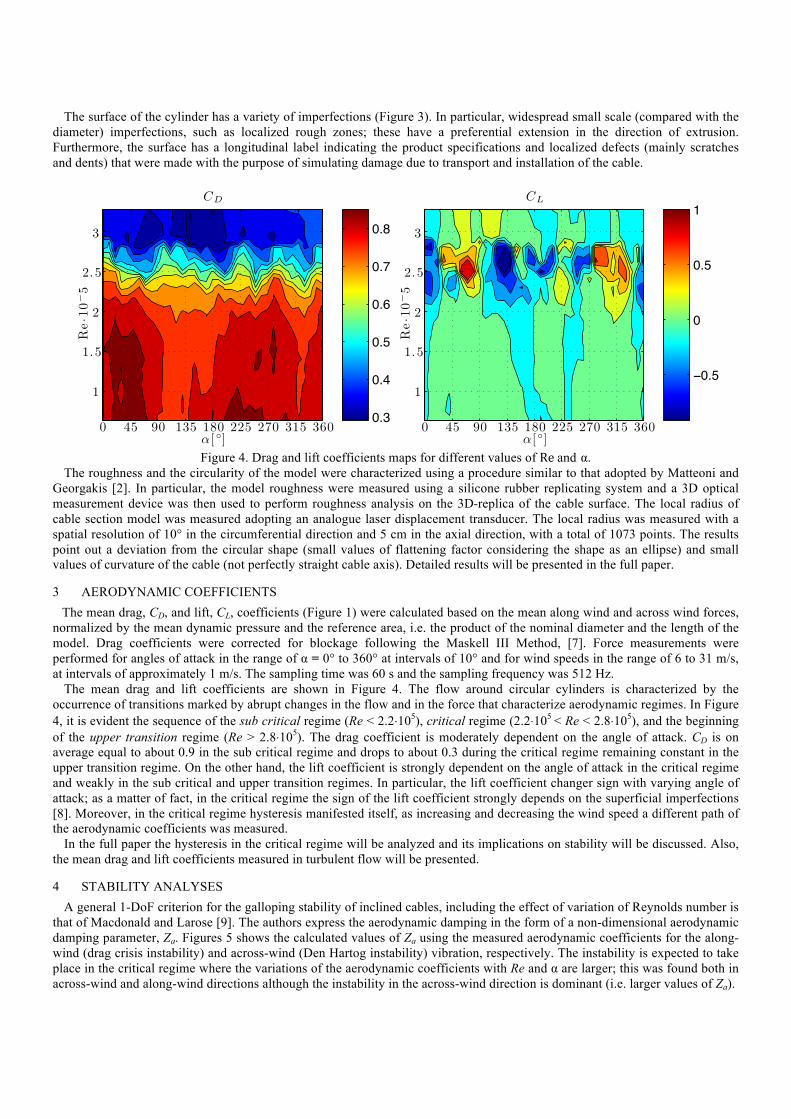
Figure 4. Drag and lift coefficients maps for different values of Re and α.
The roughness and the circularity of the model were characterized using a procedure similar to that adopted by Matteoni and Georgakis [2]. In particular, the model roughness were measured using a silicone rubber replicating system and a 3D optical measurement device was then used to perform roughness analysis on the 3D-replica of the cable surface. The local radius of cable section model was measured adopting an analogue laser displacement transducer. The local radius was measured with a spatial resolution of 10° in the circumferential direction and 5 cm in the axial direction, with a total of 1073 points. The results point out a deviation from the circular shape (small values of flattening factor considering the shape as an ellipse) and small values of curvature of the cable (not perfectly straight cable axis). Detailed results will be presented in the full paper.
3 AERODYNAMIC COEFFICIENTS The mean drag, CD, and lift, CL, coefficients (Figure 1) were calculated based on the mean along wind and across wind forces,
normalized by the mean dynamic pressure and the reference area, i.e. the product of the nominal diameter and the length of the model. Drag coefficients were corrected for blockage following the Maskell III Method, [7]. Force measurements were performed for angles of attack in the range of α = 0° to 360° at intervals of 10° and for wind speeds in the range of 6 to 31 m/s, at intervals of approximately 1 m/s. The sampling time was 60 s and the sampling frequency was 512 Hz.
The mean drag and lift coefficients are shown in Figure 4. The flow around circular cylinders is characterized by the occurrence of transitions marked by abrupt changes in the flow and in the force that characterize aerodynamic regimes. In Figure 4, it is evident the sequence of the sub critical regime (Re < 2.2⋅105), critical regime (2.2⋅105 < Re < 2.8⋅105), and the beginning of the upper transition regime (Re > 2.8⋅105). The drag coefficient is moderately dependent on the angle of attack. CD is on average equal to about 0.9 in the sub critical regime and drops to about 0.3 during the critical regime remaining constant in the upper transition regime. On the other hand, the lift coefficient is strongly dependent on the angle of attack in the critical regime and weakly in the sub critical and upper transition regimes. In particular, the lift coefficient changer sign with varying angle of attack; as a matter of fact, in the critical regime the sign of the lift coefficient strongly depends on the superficial imperfections [8]. Moreover, in the critical regime hysteresis manifested itself, as increasing and decreasing the wind speed a different path of the aerodynamic coefficients was measured.
In the full paper the hysteresis in the critical regime will be analyzed and its implications on stability will be discussed. Also, the mean drag and lift coefficients measured in turbulent flow will be presented.
4 STABILITY ANALYSES A general 1-DoF criterion for the galloping stability of inclined cables, including the effect of variation of Reynolds number is
that of Macdonald and Larose [9]. The authors express the aerodynamic damping in the form of a non-dimensional aerodynamic damping parameter, Za. Figures 5 shows the calculated values of Za using the measured aerodynamic coefficients for the along-wind (drag crisis instability) and across-wind (Den Hartog instability) vibration, respectively. The instability is expected to take place in the critical regime where the variations of the aerodynamic coefficients with Re and α are larger; this was found both in across-wind and along-wind directions although the instability in the across-wind direction is dominant (i.e. larger values of Za).
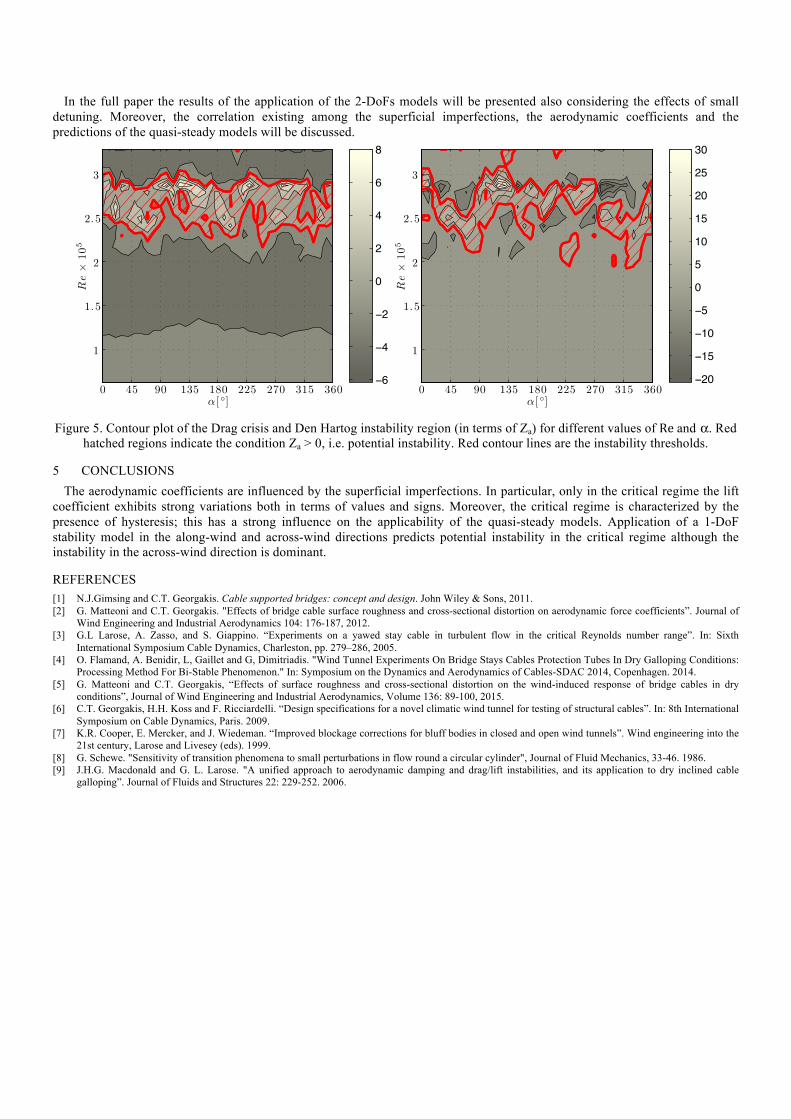
In the full paper the results of the application of the 2-DoFs models will be presented also considering the effects of small detuning. Moreover, the correlation existing among the superficial imperfections, the aerodynamic coefficients and the predictions of the quasi-steady models will be discussed.
α[◦]
Re×
105
0 45 90 135 180 225 270 315 360
1
1.5
2
2.5
3
−6
−4
−2
0
2
4
6
8
α[◦]R
e×
105
0 45 90 135 180 225 270 315 360
1
1.5
2
2.5
3
−20
−15
−10
−5
0
5
10
15
20
25
30
Figure 5. Contour plot of the Drag crisis and Den Hartog instability region (in terms of Za) for different values of Re and α. Red
hatched regions indicate the condition Za > 0, i.e. potential instability. Red contour lines are the instability thresholds.
5 CONCLUSIONS The aerodynamic coefficients are influenced by the superficial imperfections. In particular, only in the critical regime the lift
coefficient exhibits strong variations both in terms of values and signs. Moreover, the critical regime is characterized by the presence of hysteresis; this has a strong influence on the applicability of the quasi-steady models. Application of a 1-DoF stability model in the along-wind and across-wind directions predicts potential instability in the critical regime although the instability in the across-wind direction is dominant.
REFERENCES [1] N.J.Gimsing and C.T. Georgakis. Cable supported bridges: concept and design. John Wiley & Sons, 2011. [2] G. Matteoni and C.T. Georgakis. "Effects of bridge cable surface roughness and cross-sectional distortion on aerodynamic force coefficients”. Journal of
Wind Engineering and Industrial Aerodynamics 104: 176-187, 2012. [3] G.L Larose, A. Zasso, and S. Giappino. “Experiments on a yawed stay cable in turbulent flow in the critical Reynolds number range”. In: Sixth
International Symposium Cable Dynamics, Charleston, pp. 279–286, 2005. [4] O. Flamand, A. Benidir, L, Gaillet and G, Dimitriadis. "Wind Tunnel Experiments On Bridge Stays Cables Protection Tubes In Dry Galloping Conditions:
Processing Method For Bi-Stable Phenomenon." In: Symposium on the Dynamics and Aerodynamics of Cables-SDAC 2014, Copenhagen. 2014. [5] G. Matteoni and C.T. Georgakis, “Effects of surface roughness and cross-sectional distortion on the wind-induced response of bridge cables in dry
conditions”, Journal of Wind Engineering and Industrial Aerodynamics, Volume 136: 89-100, 2015. [6] C.T. Georgakis, H.H. Koss and F. Ricciardelli. “Design specifications for a novel climatic wind tunnel for testing of structural cables”. In: 8th International
Symposium on Cable Dynamics, Paris. 2009. [7] K.R. Cooper, E. Mercker, and J. Wiedeman. “Improved blockage corrections for bluff bodies in closed and open wind tunnels”. Wind engineering into the
21st century, Larose and Livesey (eds). 1999. [8] G. Schewe. "Sensitivity of transition phenomena to small perturbations in flow round a circular cylinder", Journal of Fluid Mechanics, 33-46. 1986. [9] J.H.G. Macdonald and G. L. Larose. "A unified approach to aerodynamic damping and drag/lift instabilities, and its application to dry inclined cable
galloping”. Journal of Fluids and Structures 22: 229-252. 2006.