aeronautical research consultative … · by p. h. sulzberger, b.sc. december, 1953 strength...
TRANSCRIPT

DEPARTMENT OF SUPPLY
AERONAUTICAL RESEARCH CONSULTATIVE COMMITTEE
REPORT ACA-46
THE -EFFECT OF
OF WOOD,
TEMPERATURE
PLYWOOD AND
ON THE
GLUED
By P. H. SULZBERGER, B.Sc.
DECEMBER, 1953
STRENGTH
JOINTS*
COMMUNICATED BY THE CHIEF, DIVISION OF FOREST PRODUCTS, C.S.l.R.0., MELBOURNE
Summary
This pnbl1:cation covers experjmental investigations made at the
Division of Forest Prodiwts, Council for Scientific and Industrial
Research, 111 elboitrne, dnring the period December, 1940, to January,
1946, to determine the effect of temperature on the strength of wood,
plywood and glued joints. The investigations deal with reversible
changes in_ strength, elasticity, and the like which may accompany
variations in the temperature of the material.
Results show that all properties investigated are affected by temperature
at some moisture content, in many i?Jstances to such an extent that serious
error is introduced in mechanical testing and in design where this factor
1"s not taken into accoitnt. Temperature coefficients may exceed one per
cent. of the value at 20° C. per degree centigrade. Relations are given
from which the effect of temperature on certain properties of a species can
be estimated quantitatively with considerable cor1/idence for a wide range
of temperatures and moisture contents.
*This work waR completed and presented to the Timber J\fochamcs Conference, Ottawa, Canada, in September, 1948
0.95/54.

Summary-continued
PART I. deals with compression, bending, and toughness tests on
Sitka spruce and five Australian species at nominal moisture contents of
8, 12, and 20 per cent. in the range - 20 to + 60° C. Compression
tests on these species were extended to zero moisture content and near
saturation, in respective ranges of - 20 to + 90° C. and - 20 to + 60°
0. In addition, two low density species were included in the compression
tests. Two species were also examined in bending at zero moisture content
from - 20 to + 80° 0.
PART II. covers tests made at 15 per cent. nominal moisture content
on standard size hoop pine specimens in compression and shear fr?m zero
to 40° C. and in bending at 20 and 40° 0., also on 2 in. X ~in. X ~in.
specimens of the same species in compression from - 20 to + 60° 0.
PART III. describes tests on hoop pine plywood. At nominal
moisture contents of 8, 12, and 20 per cent., tensile and crushing strengths
were examined from - 20 to + 80° C. Investigation of crushing strength
was extended to include zero moisture content. Modulus of elasticity
_was examined at all the above moisture contents, but only from - 20 to
+ 60° C.
PART IV. discusses tests on casein, phenoljormaldehyde and urea
formaldehyde glued J0
oints at temperatures from - 15 to + 60° C. in the
range 8 to 20 per cent. moisture content.
PART V. summarizes the more important features of the investigations
in general terms and gives results of independent confirmatory tests.

CONTENTS
PAGE
SmrnrARY 1
NOTATION 5
INTRODUCTION . ·' 6
, PART I. THE EFFECT OF TEMPERATURE ON THE STRENGTH PROPERTIES OF SOLID WOOD
AT VARIOUS MOISTURE CONTENTS 10
1.0 l:NTlWDUCTION 10
1.1 SPECIES, PROPERTIES, TEST CONDITIONS AND MATERIAL 10
I .
1.2 EXPERIMENTAL PlWCEDURE '11
1.3 RESULTS AND DISCUSSION 11
1.31 Compression Parallel to the Grain 11
1.311 General N aturc of the Temperature Effect 11
1.312 Temperature Effect as a Function of Strength 13
1.313 Crushing Strength of Near-Saturated Wood at - 20° C. 15
1.32 Modulus of Elasticity in Static Bending
1.321 General Nature of the Temperature Effect
1.322 Temperature Effect as a 'Function of Modulus of Elasticity at 20° C.
1.33 Modulus of Rupture in Static Bending ..
1.331 General Nature of the Temperature Effect
1.332 Temperature Effect as a Function of Strength
1.34 Fibre Stress at the Limit of Proportionality in Static Bending
1.35 Deflection to Failure in Static Bending·
1.36 Toughness ·
1.4 CONCLUSIONS
PART II. THE EFFECT OF TEMPERATURE ON STANDARD SPECIMENS OF HOOP PINE
2.0 INTRODUCTION
2.l MATERIAL, PIWPER'l'IES AND TEST CONDITIONS
2.2 EXPERDIENTAL PIWCEDURE
2.3 RESULTS AND DISCUSSION
2.4 CONCLUSIONS
C.95/54.-2 I
17
17
17
19
19
20
21
22
23
25
30
30
30
30
30
31

Contents-continued
PAGE
PART Ill. THE EFFECT OF TEMPERATURE ON THE STRENGTH PROPERTIES OF HOOP PINE PLYWOOD 32
3.0 INTRODUCTION 32
3.1 MATERIAL AND TEST CONDITIONS 32
3.2 EXPERIMENTAL PROCEDURE 33
3.3 RESUL'l'S AND DISCUSSION 33
3.31 Tensile Strength 33
3.32 Modulus of Elasticity in Tension 34
3.33 Maximum Crushing Strength 36
3.4 CONCLUSIONS 38
PART IV. THE EFFECT OF TEMPERATURE ON THE SHEAR STRENGTH OF GLUED JOINTS 39
4.0 INTRODUCTION 39
4.1 ADHESIVES, MATERIAL AND TEST CONDITIONS 39
4.2 EXPERIMENTAL PROCEDURE 40
4.3 RESULTS AND DISCUSSION 40
4.31 Effect of Temperature on Shear Strength 40
, 4.32 Wood Failure 41
4.4 CONCLUSIONS 41
PART V. GENERAL CONCLUSIONS 41
ACKNOWLEDGMENTS 43
REFERENCES 43

5
Notation
Statistical Significance
L
Q
0
B
*
**
n.s.
Property Notation
.'lJ ••
Bx;t
P,
c, b, e, f
linear component
quadratic component
cubic component
biquadratic component
significant at the 5 per cent. level of probability
significant at the 1 per cent. level of probability
not significant at the 5 per cent. level of probability
temperature 0 0.
moisture content (m.c.) per cent .
maximum crushing strength (lb./sq. in.) at m per cent. m.c., t 0 0.
modulus of rupture (lb./sq. in.) at m per cent. m.c., t 0 0.
modulus of elasticity (lb./sq. in.) at m per cent. m.c., t 0 0.
fibre stress at the limit of proportionality (lb./sq. in.) at m per cent. m.c., t 0 0.
modulus of the linear regression coefficient of strength on temperature (lb./sq. in./0 0.) at m per cent. m.c.
modulus of the linear regression coefficient of strength on temperature (per cent. of strength at .'lJ per cent. m.c., 20° 0. per °C.) at .'lJ per cent. -m.c.
suffixes used with 6,,, and p"' to differentiate between temperature coefficients of maximum crushing strength, modulus of rupture, modulus of elasticity, and fibre stress at the limit of proportionality

6 REPORT ACA-46
Introduction
This publication deals with experimental investi
gations made at the Division of Forest Products,
Council for Scientific and Industrial Research, on
the reversible changes in mechanical properties of
wood, plywood, and glued joints which may
accompany change in temperature of the material.
It covers wide and practically important ranges of
temperature and moisture content.
The first investigations were planned to determine
strength-temperature coefficients for Sitka spruce and
fifteen species of .Australian timbers at 15 per cent.
nominal moisture content m the range - 10° C. to
+ 20° C. Despite considerable masking of the results
in the early tests by moisture effects, it was concluded
that compressive strength parallel to the grain,
moduli of elasticity and rupture, and fibre stress at
limit of proporti~nality in bending increase appreciably
with decrease in temperature.
The growing use of wooden aircraft at that time
emphasized the need for information on the effect of
temperature, not only at sub-normal temperatures,
but also at high temperatures. Here it s~emed logical
to expect strength reductions with increasing tempera
ture similar in magnitude to the observed increases at
low temperatures, so that, if the latter made for
safety in aircraft, then the former would introduce
an adverse effect not to be overlooked in design.
.A study of plywood and glued joints then also
became desirable.
Consequently, tests were made on solid timber in
the range + 20° C. to + 60° C. and on plywood and
glued joints from - 10° C. to + 50° C.i still only at
15 per cent. nominal moisture content. These showed
that the strength properties of solid wood may
decrease by as much as one per cent. of its strength
at normal temperature for each degree centigrade
rise ; but with increasing temperature, toughness
increased for five species, remained constant for one,
and decreased for another.
For hoop pine plywood, reductions were observed
in maximum crushing strength parallel, perpendicular
and at 45° to the grain of the outer plies ~nd in tensile strength and modulus of elasticity in the 45° direction. The shear strength of glued joints with urea- and phenol-formaldehyde resins decreased slightly with temperature ; casein joints strengthened at both high and low temperatures.
Tests on standard size specimens in compression, bending and shear were made at the same nominal moisture content. These confirmed the effects
observed for small specimens and showed that the
shear strength of solid wood is also rflduced by
increase in temperature.
The author (Sulzberger1 ) published a short account
of these preliminary experiments at 15 per cent.
moisture content and proposed the adoption_ of a
standard temperature in routine mechanical testing.
In 1944 the temperature of, the mechanical testing·
laboratory at the Division of Forest Products, Mel- -
bourne, was standardized at approximately 20° C.
The investigations were extended to a range of
moisture contents, generally from 8 to 20 per cent.,
but in some instances from oven-dry to saturation.
The results were presented to the Timber Mechanics
Conference at Ottawa 2 in 1948, and a standard
temperature of 70° F. (21° C.) was adopted.
The present publication deals 1Yith the complete
range of investigations but does not treat in detail
the work at 15 per cent. moisture content, except
for standard size wood specimens in compression,
bending and shear.
When these investigations were originated no
report of similar investigations on plywood or glued
joints was available. .A few papers on solid wood
had been published, but for the most part these were
confined to low temperatures or to very high moisture
contents. .Apart from tests by Greenhill3, the limited
data dealing with wood in the hygroscopic range of
moisture contents indicated that the strength of
wood in this practical condition was not, or was only
slightly, dependent on its temperature. Tiemann 4
included in a United States Forest Service Bulletin observations on a small number of specimens of longleaf pine, spruce and chestnut which showed

EFFECT OF TEMPERATURE ON STRENGTH OF WOOD, PLYWOOD AND GLUED JOINTS 7'
that wet wood decreases very considerably in com·,
pressive and bending properties when raised to 127° F.
(53° C.) and to 212° F. (100° C.). He also found an
increase in strength and stiffness in compression at
mQisture contents above 20 per cent. on cooling these
same species to between 0° F. (- 18° C.) and 15° F.
Empire Forestry Journal8 and m Forestry Abstracts9•
In the former article decreases in ultimate bending '
strength and modulus of elasticity at 12 per cent.
moisture content 1vere reported in the range - 18 · 5 ° C. to + 5,0° C. Although the second artwle summarizes
tests on the relationship between six strength proper-
(- 9° C.)_. The effect did not appear in similar tests , ties, moisture content, density and temperature, the
on air-dry wood. George 5 compared the strengths of most important results are claimed by the abstract to
green and of kiln-dried hard maple, black ash, and refer to impact bending uests. Resistance to impact
white pine at temperatures from a little below freezing
point to 20° C. Although only a small number of
specimens was tested at each condition, a gl'neral
increase in strength at low temperatures was reported.
George concluded that the ·influence of cold on the
strength of wood is not sufficiently great to be taken
into consideration in designing structures, and is
always toward increased safety. As the tests were
made on· machiues surrounded by air at atmospheric
conditions, the results could not be viewed quantita
tively, for, as George observed, the specimens during
testing rapidly approached the ambient temperature.
Greenhill 3 realized the need for controlling the
temperature during test when, in 1931, he investigated
the strength of beech perpendicular to the grain :
his testing apparatus was incorporated in a condi
tioning chamber so that constant specimen tempera
ture and moisture content could be maintained
during the tests. He reported decreases in maximum
strength, modulus of elasticity, and load at the
limit of proportionality as temperature increased
from 60° F. (15~-° C.) to 180° F. (82° C.) at moisture
conditions from green to 5 per cent. moisture content.
At 15 per cent. moisture content, decreases in the
respective properties at 140° F. (60° C.) were 18, 38
and 40 per cent. of their values at 68° F. (20° C.).
Vorrciter 6 found respective increases of 50 and 100
per cent. in the compressive and bending strengths
of water-soaked spruce on freezing at - 15° C. The
strength of frozen WOQd in bending was also investi
gated in Japan (Miyai and Oshawa) 7•
Abstracts of investigations by Thunell8• 9 on
Swedish pine (P. sylvestris) were published in the 95/54.-3
bending was reported as showing constancy in the
mnge 0° C. to 50° C. at 12 per cent. moisture content,
some decreasEp between 0° C. and - 20° C., and a
threefold increase at - 60° C. At 25 per cent. moist
ure content the resistance was halved by lowering the
temperature from + 20° C. to - 17° C. Probably
the only prior investigations sufficiently extensive
to permit any general correlation being formulated
between species and effect of temperature on strength
were made by Kollmann10• It was pleasing to find
in this publication when it became available in 1945
that, -with a different set of species, Kollmann had
derived a proportional relation between temperatll!'~
effect and density_Jor oven-dry wood in compression
which was not appreciably different from that
derived by the author. The reduction of compressive
strength was found to be proportional to increase
in temperature for -oven-dry wood from - 190° C.
to + 160° C., and also for the one species investi
gated at 12 per cent. moisture content in the range
- 190° C. to + 20° C. From oven-dry to saturation
the compressive strength of beech at - 42° C. was
shown to be greater than at 20° C. Further
compression tests, also bending and impact experi
ments were made, but these were limited to low
temperatures, and to a great extent were concerned
with saturated material. Nevertheless, it was shown
for four_ species at moisture contents from 7 ·5 per
cent. to 11·2 per cent. moisture content that their
moduli of elasticity at - 35° C. were from 2 per
cent. to 10 per cent. higher- than at 20° C. ; for
laminated beech at 7 ·5 per cent. moisture content
no significant variation in impact strength occurred
in the range - 506• C. to - 6 ° C.
x
8 REPORT ACA- 4.G
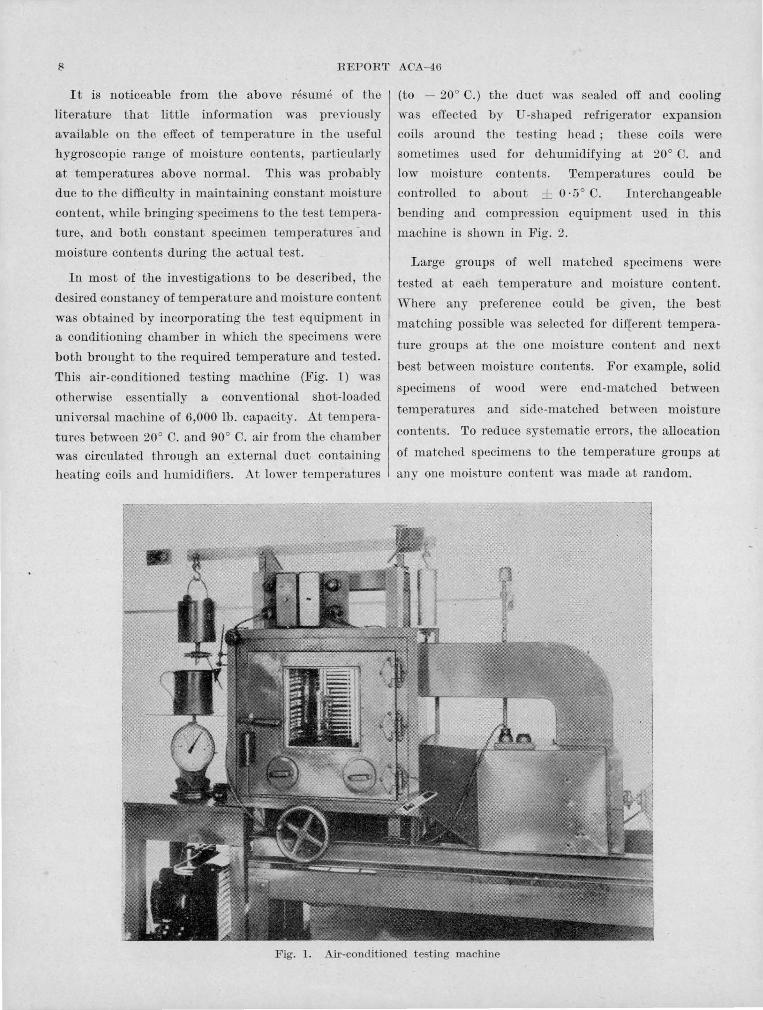
It is noticeable from the above resume of the (to - 20° 0.) the duct was sealed off and cooling
literature that little information was prev iously was effected by U-shaped refrigerator expansion
available on the effect of temperature in the u eful
hygroscopic range of moisture contents, particularly
at temperatures above normal. This was probably
due to the difficulty in maintaining constant moisture
content, while bringing specimens to the test tempera
ture, and both constant specimen temperatures ·and
moi ture contents during the actual test.
In most of the investigations to be described, the
desired constancy of temperature and moisture content
was obtained by incorporating the test equipment in
a conditioning chamber in which the specimens were
both brought to the required temperature and tested.
This air-conditioned testing machine (Fig. 1) wa
otherwise essentially a conventional shot-loaded
universal machine of 6,000 lb . capacity. At tempera
tures between 20° C. and 90° C. air from the chamber
was circulated through an external duct containing
heating coils and humidifiers. At lower temperatures
coils around the testing head; these coils were
sometimes used for dehumidifying at 20° C. and
low moisture contents. Temperatures could be
controlled to about ± 0 ·5° C. Interchangeable
bending and compression equipment used in this
machine is shown in Fig. 2.
Large groups of well matched specimens were
tested at each temperature and moisture content.
Where any preference could be given, the best
matching possible was selected for different tempera
ture groups at the one moisture content and next
best between moisture contents. For example, solid
specimens of vrnod were end-matched between
temperatures and side-matched between moisture
contents. To reduce systematic errors, the allocation
of matched specimens to the temperature groups at
any one moisture content was made at random.
Firr. 1. Air-conditioned testing machine

EFFEJ('T 01!' TEJMPEJR .\T URI') ON ''fRE:NGTH 01!' WOOD, PLYWOOD .\N"D GLUED JOINTS 9
VI 0 r. )>
. r f'l '
z N
~ro r;; -
z ~ Ill
b
]<'ig . 2. Intel'changeable equipment for specia l t esting machine
(a) Static b ending apparatus ;
(b) Compression apparatus :
(c) Compression clamp for p lywood showing specimen in position

Ib REPORT ACA-46
Part I. The Effect of Temperature on · the Strength Properties of Solid Wood at Various Moisture Contents
1.0 INTRODUCTION
The effect of temperature on the strength properties of small specimens of solid wood in compression and bending and on standard size toughness specimens was determined for a wide range of moisture contents. Although few species were tested, generalizations are derived from which temperature coefficients for some properties may be estimated with confidence from strength at one temperature.
1.1 SPECIES, PROPERTIES, TEST CONDITIONS
AND MATERIAL
Sitka spruce and five Australian species (Table 1) were investigated, the properties and test conditions examined being listed in Table 2. Balsa and the indigenous species kurrajong were also included, in compression tests, on account of their low densities.
Hoop pine, bollywood, coachwood, and silver quandong were represented by one quarter-cut board from each of ten trees. Ten boards of spruce were also used, but these came two from each of five different planks not identified in respect to trees. Mountain ash was also represented by one board
TABLE 1
Sitka spruce
Balsa
Kurra.jong
Hoop pine
Bollywood
Coach wood
Silver quandong
Mountain ash
Test
Compression
Static Bending
Toughness
SPECIES INVESTIGATED
Standard Trade Common Name
TABLE 2
Botanical Name
Picea sitchensis (Bong.) Carr.
Achroma lagopus Sw.
Sterculia discolor F. v. M.
Araucaria cunninghamii Ait.
Litsea reticulata Beuth.
Geratopetalum apetalum D. Don
Elaeocarpus grandis F. v. M.
Eucalyptus regnans F. v. M.
PROPERTIES INVESTIGATED AND TEST CONDITIONS
Property
Maximum crushing strength parallel to the grain
Nominal Moisture Content
%
}o .. 8, 12, 20 Saturation
Modulus of rupture ; modulus of elasticity ; } fibre stress at the limit of proportionality ; 8, 12, 20 deflection to failure
Radial toughness ; tangential toughness 8, 12, 20
Temperature oc.
- 20, 20, 60, 90 - 20, o, 20, 40, 60 - 20, 20, 60.
- 20, o, 20, 40, 60
- 20, o, 20, 40, 60

EFFECT OF TEMPERATURE ON STRENGTH OF WOOD, PLYWOOD AND GLUED JOINTS 11
from each of ten trees, except that at 20 per cent. moisture content approximately half the compression and bending specimens of this species were selected from additional boards from the same logs.
The specimens were, prepared in such a way that for every moisture content and species twenty randomly allocated end-matched specimens were available at each temperature for each static test and in each of the two directions for toughness. As already implied, except in the case of mountain ash at 20 per cent. moisture content, the specimens for testing at the various moisture contents were prepared from the same boards and were, in fact, side-matched.
Balsa and kurrajong (investigated only in compression), were tested at - ~o, 20, and 60° C. at nominal moisture contents of O, 8, 12, and 20 per cent. and near saturation. They were represented each by one billet only, ten specimens being tested at each temperature and moisture content.
In addition, in order to assist in the extrapolation to zero moisture content of data on bending, the moduli of rupture and elasticity of hoop pine and mountain ash were determined for oven-dry material at - 20, 30, and 80° 0. Two side-matched sticks, each containing three end-matched bending specimens, were prepared from ten boards of each species to provide twenty specimens per species at each test condition. The material was not matched with other material of the same species.
1.2 EXPERIMEN'.I.'.AL PROCEDURE
The required equilibrium moisture contents (except in the case of zero moisture content and saturation) were obtained by conditioning the specimens for several weeks in rooms controlled at the appropriate relative humidities. On occasions these rooms suffered some change, resulting in specimens at different temperatures differing approoiably in moisture content. Specimens tested in the oven-dry state were dried at 105° C. to constant weight. Approximate saturation was obtained by soaking the air-dry specimens in water under vacuum for seven days. Bollywood proved difficult to saturate, and before conditioning to - 20° C. was subjected to additional impregnation at 200 lb./sq. in. for one hour and at 500 lb./sq. in. for about ten minutes. Even this treatment left it far from saturated and still floatmg in water.
C.95/r.4.-4
Compression tests were made in the air-conditioned testing machine. Additional precautions were necessary when testing oven-dry and saturated specimens. The oven-dry specimens were kept in air-tight weighing bottles during conditioning to the test temperature, and consequently were not in contact )vith moist air except for the few minutes duration of the actual test. Change in the moisture content of the saturated specimens tested at 20° C. was also prevented in this manner. The saturated specimens tested at 60° C. were kept immersed in water at that temperature (in the testing machine conditioning chamber) until immediately before testing. One to two hours were allowed for the specimens to reach the required temperature except in the case of saturated specimens at - 20° C., which, to ensure complete freezing were' conditioned at the required temperature for from sixteen to twenty-four hours.
Prisms 2 in. x l in. x ~in. were tested in compression, at a constant loading rate of 3,000 lb./sq. in. per min. for all species except balsa and kurrajong for which, on account of their low strengths, the rate was reduced to 1,000 lb./sq. in. per min. For the weakest condition of any species, these rates corresponded to an average loading period of approximately one minute.
Static bending tests (centre-point loading) were made in the air-conditioned machine on 10 in. x i in. x i in. specimens, over an 8 in. span at a constant rate of loading of approximately 70 lb./min., the load being applied to the radial face.
The A.S.T.M. Standard11 radial and tangential toughness specimens (10 in. x ! in. x 3 in.) were tested in a toughness machine (Markwardt and Wilson12). As these tests were made outside the conditioning chamber, closely fitting wooden boxes conditioned with the specimens were used to transport the latter to the toughness tester.
1.3 RESULTS AND DISCUSSION
1.31 cmrPRESSION PARALLEL. '.I.'O '.!.'HE GRAIN
1.311 General Natiire of the Temperature Effect
The results (except for saturated wood at - 20° C.) are presented gTaphically in Fig. 3 where the observed mean values are plotted after correction to the nonunal moisture contents, using factors obtained from the experimental data. At all moisture contents up to saturation, increase in temperature has a considerable weakening effect on maximum crushing strength.

140 14000
Bollywood 0 Silver Quandong 12000 12000 12000
10000 10000
8000
6000
4000
2000
0 oz MC
• B/. MC () 12 7, M.C. () 20/,MC ® Saturated (nom)
20000 z ci Mountain Ash
4000
2000 ~ - - :-Q1$C::::===-@
Bo Isa 4000
~ 18000
...J
• :r: 16000 I-l9 z 0
w Cl:: I- 14000 <J)
coachwood 14000 14000
l9 z J: 12.000 12000 12000 <J)
::J Cl:: u
1000 10000
::? ::J
~ x 8000 <( 8000
::?
6000 6000
4000 ''~~ 4000
2000 -20 0 20 40 60 80 2000·~~--~,~o~~~oL'~~_j,1_0~~-4Lo~~__J60'---~~sLo~~__J
TEMPERATURE °C
Fig. 3. The effect of temperature on maximum crushing strength of wood in compression parallel to the grain. (2 in. x tin. x tin. specimens)

EFFECT OF TEMPERATURE ON STRENGTH OF WOOD, PLYWOOD AND GLUED JOINTS 13
In every case from zero to 20 per cent. moisture content, analysis of variance indicates a linear decrease in strength with increase in temperature which is significant at the one per cent. level of probability. At zero moisture content the only deviation (significant at the 5 per cent. level) was recorded for hoop pine ; but above this moisture content the non-linear components of the temperature effect were significant at the one per cent. level in nine cases, at the 5 per cent. level in five cases and not significant in ten cases. Nevertheless, as the non-linear components were always small (not exceedmg 6 ·7 per cent. of the total variation between temperatures and generally much less) compared with the linear components, it was co~cluded that the former could be ignored and that maxmrnm crushing strength parallel to the grain is a linear function of temperature for all species in the ranges zero to 20 per_ cent. moisture content and - 20° C. to + 60° C. ( + 90° C. at zero moisture content).
Near saturation, the reduction in strength resulting from increasing temperature from + 20° C. to + 60° C. was highly significant for all species. At - 20° C. a marked increase in strength occurs, presumably due to ice formation (see later). It may be practical to assume linearity up to saturation (above the freezing point), but insufficient temperatures were investigated near saturation to verify this assumption. In the ensuing discussion, reference to a temperature coefficient near saturation will refer to the average reduction in strength per degree centigrade obtained by dividing the difference between strength at 20 and 60° C. by the temperature interval.
The moduli of the calculated linear regression coefficients for the various - species and moisture contents are plotted in Fig. 4, temperature effect at the intersection pomt being assumed equal in ~eet above freezing point near saturation*. The effect of temperature on maximum crushing strength as measured by these coefficients varies considerably with moisture content and between species. For six species, the effect increases from zero moisture content to between 12 and 14 per cent. moisture content and then decreases, presumably
to a constant value at the intersection point. The maximum values for balsa and kurrajong are not clearly defined, probably as a result of inadequate matching between moisture contents.
u q
~ eo ,v
z
t ' '
6 MOUNTAIN ASH CD HOOP PINE Q COACHWQOO () SITKA SPAUC( e SILY ER QUANOONC. () 80LLYW000
g 20
~ ~===lt==:~==-~==:::.:...=-_-:..._-=.._-=--Q =- - e-
3 °~0~-;-~-;-~-"-:-~~,.~-,',o~--o'-~-"-~-"-~~,.~~
CONTENT /.
Fig. 4. Variation of temperature effect with moisture content for maximum crushing strength parallel to grain (2 in. x tin. x t m. specimens)
As crushing strength is considered to be a linear
function of temperature, if the modulus of the
regression coefficient at x per cent. moisture content
is Lc.v, the crushing strength O,:fti at a temperature tl 0 c. is related to the strength o.,,/t2 at a temperature
t2 ° C. at the same moisture content by the equation
0.,,1t1 = 0.,:t2 - Lc.,,("ti - t2) (1)
According to the present investigations, this equation
is valid at least from zero moisture content to 20 per cent. moisture content in the temperature range - 20
to + 60° C. and to + 90° C. at zero moisture content. Kollmann10 showed the relation to hold from - 190° C.
to + 160° C. at zero moisture content, and for one species at 12 per cent. moisture content from - 190°
C. to + 20° C. Equation (1) is therefore likely to be
vahd up to 20 per cent. moisture content in at least the range - 190° C to + 60° C.
1.312 Temperature Ejf ect as a Function of Strength
It was observed (Fig. 5) that -at each moisture content the effect of temperature on the maximum
crushing strength of the various species is reasonably proportional to strength at 20° C. and at the same moisture contentt. Thus a confident estimate of temperature coefficients for any species should be
*By drawing strength-moisture content isothermals, constancy of strength at 60° C. above the intersection point may be demonstrated. As constancy at 20° C. is already established, equality of the temperature coefficients at the intersection point and near saturation may reasonably be assumed.
t The strength values at 20° C. used to obtain equations 2A-D are linear regression means; for the intersection point (equation 2E) actual experimental values were used.

14 REPORT ACA-46
possible from these proportional relations, which are as follows :-
< u
<l
~
·':!. Cl: w a.
w a: ::J
'<
•00
eo
60
•OO
eo
60
f::.co
f::.cs
f::.c12
f::.c20
6cr P
AT o7 MOISTURE CONTENT
..
= 0 . 0033 00120
= O · 0062 0 8120 = 0 . 0082 012120
= 0. 0103 020/20
= 0 ·0073 Gr P/20
AT 81. MOISTURE CONTENT
e
Ac0 =o 0033 c0; 20
AT 124 MOISTURE CONlENT
(J)
{2A) j
(2B) j
{20);
{2D) j
(2E).
a: 100~--------- o Balsa e Silver Ouondong w a. ::; w ~ 80
•O
• KurraJong .;> Hoop Pine
9 AT zor l.AOISfURl CONTENT
CJ Srtko Spruce g Coachwood
Cl Bollywood e Mountain Ash
A"T THE INTEl?SE'CTION
9 POINT
4000 eooo 12000 16000 2Q000 4000 6000 1~000 •600o
MAXIMUM CRUSHING s TRENGTH AT 2o·c - LB/so IN·
Fig. 5. Temperature effect-strength relations (2 in. x t in. x t in. prisms) in compression parallel to grain
.A similar relation is obtained from the preliminary tests at 15 per cent. moisture content. For tests made in the range 20° C. to 60° C. and in others centred about normal temperature, the corresponding equation for this moisture content is
f::.c15 = 0 · 0095 0 15;20 (2F)
Graphing of the constants of proportionality of these equations (reduced to percentages, Fig. 6) shows that for practical purposes the percentage tempera.ture
effect, defined as Pcx = (f::.cx /0.,120)10 2 (3)
may be considered to increase linearly from O ·33 per cent. per 0 0. at zero moisture content to 0 ·97 per cent. per 0 0. at 16 per cent. moisture content. That is,
Pcx = 0·33 + 0·04x (in range 0:::::; x:::::; 16) ( 4)
Beyond 16 per cent. moisture content, the percentage temperature effect increases progressively slowly to a maximum of approximately 1 ·035 per cent. per 0 0. near 19 per cent. moisture content, thereafter decreasing towards 0 · 733 per cent. at the average intersection point.
Within the range of conditions for which strength is proportional to temperature, the values of P 0 ,,
from the curve (Fig. 6) may be used to calculate directly strength at any given moisture content and temperature from strength at any other temperature and the given mois•ture content; for elimination of f::.cx from equations (1) and (3) yields the relation
100 - P 0 ., (t1 - 20)
100 - Pcx (t2 - 20) (5)
Where strength at 20° C. is known or required, equation (5) reduces to
Gx/t = Gx/20 ll - l0- 2 • Pcx (t - 20)] {6)
or Gx12o = O.,;tf[l - 10-2 • P 0 ., (t - 20)] (7)
.As an example, equation (6) applied to data presented by Kollmann10 for red .beech reduces to
Oo;-42 = 15,645 [1 - 10-2 . 0 ·33(- 42 - 20)] = 18,846 lb./sq. in.
This calculated result is 2 · 1 per cent. less than Kollmann's experimental value of 19,260 lb./sq. in.
p ~ ?( :i: Kl ... " z .. :: .,
08 ::s .. ra ~~o-6 ~~
~~ u
~ .. <J°"' ... 0 ... -... . ~~o:z I-< :5 11.
~ 0 4 12 16 20 24 2B 32 t.IOISTURE CONTENT 7,
Fig. 6. Temperature effect-strength relations at various moisture contents. (Maximum crushing strength parallel to the grain, 2 in. x t in. x t in. prisms-average for eight species)
EFFECT 01<' TEMPERATURE ON STRENGTH OF WOOD, PLYWOOD AND GLUED JOINTS 15
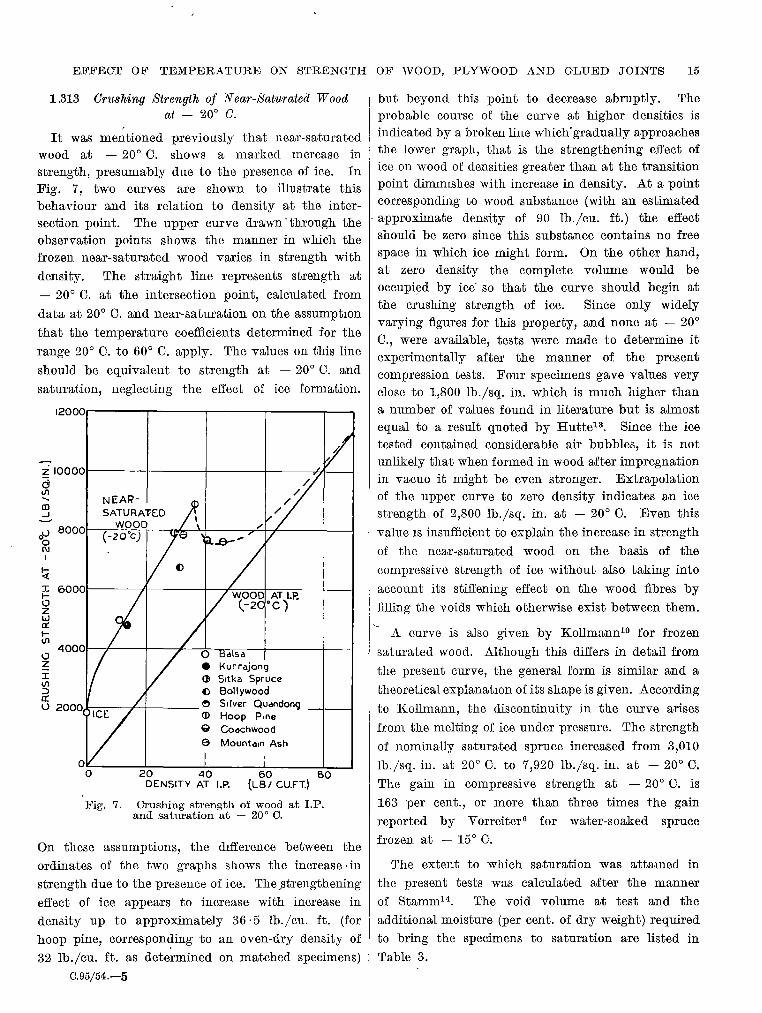
1.313 Crushing Strength of N ear-Satitrated Wood at - 20° C.
It was mentioned previously that near-saturated wood at - 20° C. shows a marked mcrease in strength, presumably due to the presence of ice. In Fig. 7, two curves are shown to illustrate this behaviour and its relation to density at the intersection point. The upper curve drawn -through the observation points shows the manner in which the frozen near-saturated wood varies in strength with
density. The straight line represents strength at
- 20° C. at the intersection point, calculated from
data at 20° C. and near-saturation on the assumpt10n
that the temperature coefficients determined for the
range 20° C. to 60° C. apply. The values on this line
should be equivalent to strength at - 20° C. and
saturation, neglecting the effect of ice formation.
12000.----~---"""T'"------..---~,--~
z1ooooi-------r-~~~t-----t-~----/llf----I a Ill
CD _J __,
NEARSATURAT-ED
WOOD og 8000t--'(-~2~0~.~C)7=r-~-tl>tl~-'-+--~-"-++--~--l---1 N I
~ ~ 6000t--------,"!-----t-----,~=-=:=l--=-:-=,-----\-~I
0 z w er 1-<ll
0 Z Kurrajong ~ Srtka Spruce ij! () Bol 1 ywood
I.) 2000.L----+--+----~ Silver Qudndong ()) Hoop Pine Q Codchwood e Mountc11n Ash
20 40 60 BO DENSITY AT l.P. (LB I CU.FT.)
Fig. 7. Crushing strength of wood at I.P. and saturation at - 20° C.
On these assumptions, the difference between the ordinates of the two graphs shows the increase· in strength due to the presence of ice. The _strengthening effect of ice appears to increase with increase in density up to approximately 36 ·5 lb./cu. ft. (for hoop pine, correspon~ing to an oven-dry density of
32 lb./cu. ft. as determined on matched specimens) C.95/54.-5
but beyond this point to decrease abruptly. The probable course of the curve at higher densities is indicated by a broken line which-gradually approaches the lower graph, that is the strengthening effect of ice on wood of densities greater than at the transition point dimnushes with increase in density. At a point corresponding to wood substance (with an estimated
- approximate density of 90 lb./cu. ft.) the effect should be zero since this substance contains no free space in which ice might form. On the other hand, at zero density the complete volume would be occupied by ice· so that the curve should begin at the crushing strength of ice. Since only widely varying figures for this property, and none at - 20° C., were available, tests were made to determine it experimentally after the manner of the present compression tests. Four specimens gave values very close to 1,800 lb./sq. in. which is much higher than a number of values found in literature but is almost equal to a result quoted by Hutte13. Since the ice tested contained considerable air bubbles, it is not unlikely that when formed in wood after impregnation in vacuo it might be even stronger. Extrapolation of the upper curve to zero density indicates an ice strength of 2,800 lb./sq. in. at - 20° C. Even this
value is insufficient to explain the increase in strength
of the near-saturated wood on the basis of the
compressive strength of ice without also taking into
account its stiffening effect on the wood fibres by filling the voids which otherwise exist between them.
_A_ curve is also given by Kollmann10 for frozen
saturated wood. Although this differs in detail from
the present curve, the general form is similar and a
theoretical explanat10n of its shape is given . .According
to Kollmann, the discontinuity in the curve arises
from the melting of ice under pressure. The strength
of nominally saturated spruce increased from 3,010
lb./sq. in. at 20° C. to 7,920 lb./sq. in. at - 20° C. The gain in compressive strength at - 20° C. is
163 per cent., or more than three times the gain reported by Vorreiter 6 for water-soaked spruce frozen at - 15° C.
The extent to which saturation was attamed in the present tests was calculated after the manner of Stamm14. The void volume at test and the additional moisture (per cent. of dry weight) required to bring the specimens to saturation are listed in
Table 3.

16 REPORT ACA-46
TABLE 3 -Vorn VOLUME AND THEORETICAL SATURATION-MOISTURE (JON'l'ENT OF SPECIMENS TESTED AT - 20° c.
IN A NOMINALLY S4TURATED CONDITION
' I Difference between Moisture Content at I Void Volume at Test Theoretical m.c. at
Species Test (Fraction ot Total Saturation and m.c. (%) Volume) at Test
(%)
I
Balsa . . . . . . .. 636·4 0·039 29·3 Kurrajong . . . . .. 486·6 0·044 25·1 Bollywood .. . . . . 137·2 0·206 52·5 Spruce . . . . . . .. 182·9 0·072 20·0 Silver quandong . . .. . . 142·8 0·147 35·9 Hoop pine . . ... .. 148·5 0·034 7·9 Coach wood .. . . . . 131·8 0·033 6·9 Mountain ash .. . . . . 101·6 0·089 16·3
I
woo·r---------------~ 1eoo,--------------~ 1soo~-------------~
1600
""
•OOO 1200
1000 OOO •000
Sitko Spruce Bollywooa Silver Ouanaong .. .,
• Q 600~--'--~--~- -~-~---' BOOL---'------~-~---'----'
x ~
0 ~
al 0•8'£MC
...J KEY e•l2'/,MC
,.. t-
®•20?,MC
0 ... ~ < ...J
' "" 2 "-0
If) 2200 3 2200 22
:::> 0 0 ::; • 2000 2000
10 C!>
"' .. 1BOO ~ ~800
1600
Sp•c:- "OI Full7 M•ti::Md ..
Vt'rt.h 1'hoH Toted "' Otio.cr "' \11011tur• CQllt ...... •---..: 1400 ••OO
'200 1200
Mounto1n Ash Hoop Pine Coachwood
0 0000 •OOO
-20 0 20 40 60 •20 0 20 40 io
TEMPERATURE ·c
Fig. 8. The effect of temperature at various moisture contents on the modulus of elasticity of wood in bending (10 in. x ~in. x §-in. specimens)

EFFECT OF TEMPERATURE ON STRENGTH OF WOOD, PLYWOOD AND GLUED JOINTS '17
1.32 MODULU~ OF ELASTICITY , IN ST.A.TIC BENDING
1.321 General N atiire of the Temperature Effect
The data (Figs. 8 and 9) · obtained from the centre-point static bending tests by application of moisture corrections derived from the experimental results show a general decrease in: modulus of elasticity with increase in temperature, the ,effect increasing with moisture content. The .trends of the curves are in accord with the indications o~ lmearity or curvilinearity obtained from statistical examination of the results corrected to the nominai moisture content.
The linear components of the temperature effect, for all species and moisture contents, were significant at the one per cent. level of probability. Neither species (hoop pine or· mountain ash) examined at zero moisture content showed ~ignificant departure
from linearity at that moisture content or at 8 per cent. moisture content ; at 12 and 20 per cent. moisture contents both showed highly significant curvilinearity. Bollywood exhibited trends similar to these species at the three higher moisture contents, while Sitka spruce gave curvilinear relations. Coachwood exhibited no significant deviation from linearity : silver quandong only at 20 per cent. moisture content. It is, therefore, difficult to generalize ; but, bearing in mind that the significance of deviations may have been obscured by large errors, visual examination of the plotted observat10n points (Figs. 8 and 9) might indicate a general trend of the strengthtemperature relation from linearity at zero -moisture content towards curvilinearity which is slight at 8 per cent. moisture content, but which increases with moisture content.
2500 .----~--~--~ u.J .3'2000 .----------~
Apeo = 2 32 x I03 lb/sq 1nfc eo = o 097 •t./ "c
2200 '-----'----'----'-----' -20 20 60 100
1900 .-----r------~
Apeo = 1•39 x 1o' lb/sq.m.f"c · eo= 0·078°/0 /
0c :
er :J t-o. J er~
Ii.~ 0 <i II)~ :i ,!! ..J~
J 0 0 2 '°'pbo = 71·8 lb/sq 1n/0c
bo = 026"/, /"C 20000 ~--~-~~---
-20 20 60 100
Mountain Ash.
26000 .----------~
Apbo c 52 2 lb/sqin/"c bo= 024%/0 c
14000 '----~---'----20 20 60 100
Hoop Pine.
Temperature 0 C.
a. -'
';( IBOOOY,.----+----t-----i Ul ,.---.
If],<:. a: er
t:i~ w~ gj '-'16000 l-----+--".---1-----l ii:
0., ...J
~
~o=39 2 lb/sq.lnj 0 c. ' Pr0 =024 %/°C J
14000'-----'----'----'.._ -20 20 60 100
16 OOO.----------~
........ ~·~ ~0001----'T--+----t------! Ck er
In~ w~ a:: ID
~ 120001-----+--__,.rl-----!
Ato=42·7 Pt=0.32
lOOOO._ __ ....__ __ _._ __ ~ -20 20 60 100
Fig. 9. The effect of temperature on oven~dry wood in static bending. (10 in. x ! in. x i in. specimens)
1.322 Temperature Effect as a Function of .1llodnl1ts of Elasticity at 20° 0.
The non-linear nature of the effect of temperature on modulus of elasticity observed in. some instances makes it undesirable to average the temperature effects for the various species by the use of linear
regression coefficients, as for maximum crushing strength. It is seen (Table 4) that the mean modulus of elasticity of the various species at each test condition are similar, within reasonable limits (spread greatest at high temperatures and moisture contents), when expressed as percentages of strength at 20° C.

TABLE 4
COMPARISON BETWEEN THE MODULI OF ELASTICITY OF SIX SPECIES AT VAR.IOUS CONDITIONS OF TEMPERATURE AND MOISTURF, CONTEN'l' EXPRESSED AS PERCENTAGE OF STRENGTH AT 20° C. AND THE SAME MOIS'l'URE CONTENT*
(Experimental data corrected to nominal moisture contents)
0 per cent. 8 per cent. 12 per cent.
I 20 per cent.
Species I
20° c. 40° o.f 60° c. -20°0. 30° 0. 80° 0. -20°0. 0° 0. 20° c. 40° o. 60° c. -20°0. 0° 0. 20° c. 40° c. 60° c. -20°0. 0° 0. -- --1--
Sitka spruce . . . . . . .. 105·9 105·9 102 ·7 93·8 91·2 112·8 109·2 104·1 92·6 81·7 121·2 111·5 104·2 '91·9 70·8
Bollywood . . . . .. . . 105·6 104·8 101·0 96·4 91·8 108·8 108·0 102·2 96·5 84·1 116·4 112·5 105·8 90·4 76·0
Silver quandong . . . . .. . . 107·8 103·0 101·0 95·5 92·7 109·7 106·8 102·5 94·6 86·0 116·5 110·8 100·9 94·3 77·9
Hoop pine .. 104·5 99·4 96·6 106·5 104·8 100·3 97·6 91·4 107·4 106·8 102·8 94·7 87·8 113·4 109·0 105·4 91·6 80·7
Coach wood . . . . . . .. 108·6 103·9 100·2 94·5 92·4 108·0 105·8 101·4 95·9 89·3 116·1 112·1 102·1 89·4 80·0
Mountain ash .. 103·8 99·6 93·7 108·9 105·0 101·6 94·2 91·5 109·8 105·6 102·7 98·1 84·0 117·8 109·9
---
109 .9, 97 ·3 68·2
I
Average . . .. 104·2 99·5 95·2 107·2 104·6 101·1 95·3 91·8 109·4 107·0 102·6 95·4 85·5 116·9 110·9 104·7 92·5 75·6 -
* At zero moisture content strength at 20° C. was taken as the linear regression mean, elsewhere as the_grand mean of the experimental means at the five temperatures.

EFFECT OF TEMPERATURE ON STRENGTH OF WOOD, PLYWOOD AND GLUED .TOINTS 19
It is, therefore, feasible to use the average of these percentage values at each moisture content and temperature to represent the' effect of temperature on modulus of elasticity of wood in general. By "Plotting the average percentage moduh of elasticity for each. moi ture content against temperature and adjusting the data fr,om the smoothed ,curves thus obtained so that modulus of elasticity at 20° C. is equal to 100 per cent., the curves of Fig. 10 (and its transfer graph, Fig. 11) are obtained. It may be significant that these curves, representing an
115 207. MC
110
I=' 105 z w 0 f5 100
.Q,
>-f-u ;:: (/)
5 w lL 0 <f)
3 ::i 0 0 2
>-5 iii 5 w lL 0 (fJ
3 ::i 0 0 2
95
90
85
80 ron1c
75
7?-'D~--~co~--~10~---:o.,.____,10~--20~-..~.,____,40.,______,,:;o,,,_-,:eor;-TEMPERATURE (°C)
95
90
85
75
70
Fig. 10. The effect of temperature on modulus of elasticity in static bendmg (average of six species)
4
w·c
6 B C ~ ~ 6 B 20
MOISTURE CONTENT (PERCENT)
Fig. ll. The effect of temperature and moisture content on modulus of elasticity
C.95/54.-6
average result for all species, conform ~o the general
trend of temperature eff.ect suggested earlier'; namely
linearity of the strength-tempera~ure' relation at
zero moisture content with _slight. curvilinearity at
8 per cent. moisture cont~nt and increasing curvi
linearity at higher moisture contents. '.I;he effect of
temperature on modulus of elasticity is slight at
zero moisture content (average linear regression
coefficient for two species equals - 0 · 09 per cent.
of value at 20° c. per 0 0.) but appreciable at, the
higher moisture contents of the hygroscopic range.
For examplf', at 20 per cent. moisture content, the
average" modulus of elasticity at 40° C. is 89·1 per
cent. of its value at 20° C.
1.33 MODULUS OF RUPTURE IN STATIC BENDING
1.331 General Nature of the Temperature Effect
T.he experimental data corrected to the nominal
moisture contents by application of factors derived
from the data (Figs. 9 and 12) reveal a considerable
reduction in modulus of rupture with increase in
temperature for all species and moisture contents
examined, the effect varying in magnitude between
species and moisture contents. As analysis of the
corrected data showed a linear regression of strength
on temperature significant at the one per cent. level
of probability m all cases and significant deviation
only in two instances (at 12 per cent. moisture content,
for mountain ash significant at the 1 per cent. level
and for silver quandong sigmficant at the 5 per cent.
level), it is concluded that modulus of rupture at
constant moisture content decreases linearly with
increase m temperature. This relation may be
written
Bxlt1 = Bx!t2 - L,.bx (t1 - t2) (8)
where B,.;t is modulus of rupture at x per cent.
moisture content and t 0 0., and L,.bx is the modulus
of the regression coefficient of modulus of rupture
on temperature. Equation (8) is valid in at least
the range - 20° C. to + 60° C. for moisture contents
from oven-dry to 20 per cent. and to + 80° C. in ,.
the oven-dry condition.

20 REPORT ACA-46
BOO
f ~ Bollywood ~ S 1tka Spruce
~ 'Q:;->2000·~~~--~~~~~~~~~~~
_J
lLJ 28000
"' ::> I-Q.
ii: 24000
l•
0
"' >aoOo
::> _J
::> 0 0 16000
:::;;
·:1.000
OOC<>
4000
Hoop Pine
-20 0 20 40 60
KEY
Coachwood
-20 0
o: 87. MC
o• 127. MC
®' 20/.MC
40 60
Silver Quandong
MHchcd W1ll'I Thotc T"ncd •t Q\lurr Mo1 nur~ Conl~nu
Mountain Ash
-20 0
"
40 60
TEMPERATURE °C
Fig. 12. The effect of temperature at various moisture contents on the modulus of rupture of wood in static bending. (10 m. x ! in. x ! in. specimens)
1.332 Temperature Effect as a Fu.nction of Strength
It may be shown for modulus of rupture (Fig. 13) that the strength-temperature coefficients, 6bx, for the various species are reasonably :proportional to strength at 20° 0., calculation of regression lines through the origin* yielding the following relations :
6bo = 0 · 0025 . B0; 20 (9A)
6bs = 0 ·0047 . B8120 (9B)
6b12 = 0 · 0062 . B12120 (9c)
6b20 = 0 · 0092 . B20; 20 (9D)
The average temperature effect increases then from 0 · 25 :per cent. of strength at 20° 0. for oven-dry wood to 0 · 92 :per cent. at 20 :per cent. moisture content. The :percentage temperature effect defined as
Pbx = (6bx/Bx120)10 2 (10)
may be estimated from Fig. 14, :plotted from equations 9A to 9D. Between 8 and 20 :per cent. moisture contents, the :percentage temperature effect
"' u ~ w ~
~
()Srtka Spruce G Hoop Prne
CO Bollywood G Coachwood 6 S1lvoi:r Quondong CS) Mountain Ash
~ 116Qr~~~~~~~~~~~
'.'l
40
6b 20 ·o 0092 s 20; 20
12 16 20 24 28 0 12 16 20 i4 26
MODULUS OF RUPTURE AT 2o"c Lo/so IN x 1d'
Fig. 13. Temperature effect-strength relations. (10 in. x ! in. x tin. specimens in centre-point bending)
* For both maximum crushing strength and modulus of rupture, passing the regression lines of temperature coefficient on strength through the origin makes no significant change:

EFFECT OF TEMPERATURE ON STRENGTH OF WOOD, PLYWOOD AND GLUED JOINTS 21
() ·o "' !<( :I: I-0 % UJ
"' I-Cll
10
08
4
only)
8
MOISTURE
Pb = 0 176 + 0 036 X xl•" ranqll a~x~20)
12 16
CONTENT PER CENT
20 24
Fig. 14. Temperature effect-strength rclat10ns at
of the linear regression coefficients of strength on temperature ( = D,1,,), that is, the slopes of the curves are in general greater for the stronger species, and for practical purposes may be shown to be proportional to strength. It follows that the moduli for the various species, expressed as percentages of strength at 20° C., and the corresponding moisture content ( = P1x), may be represented by a single average value at any moisture content (Table 5). Plotting of these average proportional temperature coefficients yields the curve of Fig. 16, from which it may be seen that, on a percentage basis, the magnitude of the temperature effect increases from a small value (0 · 28 per cent. per 0 0. average for two species) for oven-dry wood to approximately 1·0 per cent. per 0 0. at 20 per cent. moisture content.
various moiscure contents. (Modulus of rupture ;;:; m centre-point static bending. 10 in x i in. x -~ m. SI oo:x:f">-."'1---__c:~"-t----"1 specimens-average for six species) §
appears to increase lmearly, the equation to the line being
Pb~= 0·176 + 0·036x
(in range 8 ~ x ~ 20) (11)
The percentage temperature effect at 15 per cent. moisture content calculated in a similar manner for the same six species, from earlier tests in the range 20° C. to 60° C., is 0 · 66 per cent. at 20° C. This point was included in denving equat10n (11).
The following relation, useful in estimating temperature corrections for modulus of rupture, arises from equations (8) and (10) :
100 - Pbx (t1 - 20) Bx/t1 = Bxlt->. · ---------
~ 100 - Pbx (t2 - 20) (12)
1.34 FIBRE STRESS A'l' THE LIMIT OF PROPORTION
ALI'rY IN STATIC BENDING
§ ~ 2<Xx_:i·~~~o,__~~,__-,, ~ SITKA SPRUCf
~ oo:xir---,--,--,----,
b ~ ro:x*""-+-t--+--l 200:~-+-t--+--l :J
0 20 40 60 ~20 0 20 40 60 HOOP P'NE COOCHWOOD MOUNTAIN ASH
TEMPERATURE "c
Fig. 15. The effect of temperature on fibre stress at the limit of proportionality of wood m static bending at various moisture contents. (10 m. x i in. x i m. specimens)
to
Fjbre stress at the limit of proportionality of the i:l
six species investigated was found to decrease with increase in temperature at all moisture contents. Despite some ambiguity in the choice of the limit of proportionality from the stress-strain curves and the lack of statistical analyses, t:µe effect seems linear throughout the temperature ranges investigated. The results appear to be adequately represented for oven-dry wood by Fig. 9, and at other moisture contents by the smoothed curves of Fig. 15 which were obtained indirectly by transferring from freehand isothermals through the observed mean fibre stresses plotted against the mean moisture contents at test. At any given moisture content the moduli
0 '-' 2
e -e.. aa
Fig. 16. Temperature effect-strength relations at various moisture contents. (Fibre stress at lim_it of proport10nality. in centre-point bendmg, 10 m. x i in. x i in. specrmens-average for six species)

22 REPORT ACA-46
TABLE 5
LINEAR REGRESSION COEFFICIENTS OF FIBRE Snrnss AT 'l'IIE Llllffl' OP PlWPORUONAJXi y ON TEMPERATURE IN STATIC BENDING (10 IN. X % IN. X % IN. SPECIMENS)
(Experimental data at zero moisture content, data at other moisture contents from smoothed results, Fig. 15)
Species
s itka spruce
ollywood . . .
B
s ilver quandong
oop pine . . oachwood
R
0
M
A
. . ountain ash
verage . . M aximum . . Mi nimum . .
. .
. .
. .
..
..
..
..
. .
. .
Moduh of Linear Regress10n Coefficients of Strength on Temperature at the following Moisture Contents per cent. :-
u 8 12 16 20
lb./sq. %/1°0: lb./sq. %/1°0. lb./sq. %/1°0. lb./sq. %/1°0. lb./sq. %/1°0 in./l 0 0. t in./l 0 0. in./1°0. in./1°0. in./l 0 0.
. . .. 48·8 0·60 45·0 0·73 40·0 0·83 36·0 0·96
. . .. 43·8 0·67 39·6 0·71 35·4 0;78 31·2 0·88
. . .. 41·2 0·56 48·1 0·81 41·2 0·86 33·1 0·86
42 ·7* 0·32 73·1 0·76 65·1 0·86 54·8 0·92 40·0 0·95
. . . . 72·5 0·76 70·0 0·92 61·2 1·00 48·8 1·00
39·2* 0·24 85·6 0·68 100·0 1·00 92·5 1·19 71·0 1·24 -. . 0·28 . . 0·66 . . 0·84 . . 0·93 . . 0·98
. . 0·32 . . 0·76 . . 1·00 . . 1·19 .. 1·24
.. 0·24 . . 0·56 . . 0·71 . . 0·78 . . 0·86
* Specimens not matched with other moisture content groups.
t Values under this heading are moduli of linear regression coefficients of strength on temperature for the given moisture content expressed as percentage of strength at 20° C. and the same moisture cont~.
1.35 DEFLECTION TO FAILURE IN STATIC
BENDING
failure. Below 12 per cent. moisture content no great change with temperature is observed, but at higher moisture contents the deformation increases markedly with temperature. The effect varies considerably between species.
The data for two species (Table 6) illustrate ·the
general effect of temperature on deflection to
TABLE 6
THE EFFECT OF TEMPERATURE ON DEFLECTION A'l' FAIL URE IN S'l'ATIC BENDING
Species
Average Deflection (in.) to Failure in Static Bendmg at the following Nominal Moisture Contents and Temperatures (0 0.) :-
8 per cent. 12 per cent. 20 per cent.
-20 o 20 4o 60 - 20 o I 20 40 I 60 - 20 o 20 4o 60 -----1---- ________ ! _______________ _
Hoop pine ·261 ·302 ·315 ·320 ·299 ·282 ·291 ·305 ·342 ·387 ·312 ·329 ·427 ·623 ·727
Mountain ash •• J ·309 ·315 I ·337 ·312 ·331 ·300 ·318 ·329 ·341 ·383 ·329 ·337 ·357. ·401 1 ·470.
EFFECT OF TEMPERATURE ON STRENGTH OF WOOD, PLYWOOD AND GLUED JOINTS 23
1 · 36 TOUGHNESS
The mean toughness values at the various test conditions are listed in Table 7. Each value is the mean for twenty specimens except in the cases of silver quandong (sixteen specimens per condition) and bollywood (nineteen radial, seventeen tangential). The specimens omitted were complete endmatched groups so that the means are still comparable between moisture contents and temperatures. Their omission was due to defects, usually severe crossgrain. In cases of abnormal failure which did not merit the exclusion of the whole of an end-matched group, values were :fitted by the method of least squares.
Statistically dete.rmined, the significance and magnitude of the effect of temperature on toughness at the various nominal moisture contents are listed in Tables 7 and 8 respectively. No correction was made for moisture content ; but for the most part the average moisture contents of the temperature groups at any nominal moisture content were little different. It is apparent from these analyses that temperature does in general affect the toughness of wood. The effect is by no means the same for all species or even for different moisture groups of the same speoies. There is, however, a general trend from decrease in toughness with rising temperature at low moisture contents to an increase with temperature at higher moisture contents. This fact is illustrated by the change from negative linear regression coefficients of toughness on temperature near 8 per cent. moisture content to positive coefficients near 20 per cent. moisture content as shown in Table 8.
In order to gain a better picture of these effects, the results have been graphed (Figs. 17 A-L ).
The toughness-moisture content ' isothermals were first drawn freehand through the observation points, taking into consideration the results of the statistical analyses, but giving due weight to moisture differences ignored by them. From these graphs the corresponding toughness-temperature curves at 8, 12, 16, and 20 per cent. moisture contents were plotted. The tendency for toughness to decrease with rising temperature at low moisture contents and to increase with temperature at higher moisture contents is obvious from the latter group of graphs ; but it is to be noted that at the lower moisture contents the toughness of a number of species does not decrease
throughout the entire temperature range, the decrease in strength with increasing temperature in these cases· ceasmg at about 20° C. It might then be stated that sub-normal temperatures in general mcrease toughness at low moisture contents while the mam effect -of supra-normal temperatures is restricted to an increase in toughness at high moisture contents. .At moisture _contents below about 14 per cent., supra-normal temperatures have little effect, except on mountain ash. This species is unusual in its behaviour, its toughness showing no increase with temperature .except possibly above 18 per cent. moisture content in the radial direction. There is also some doubt as to whether the toughness of bollywood is affected by temperature below 14 per cent. moisture content. In neithe.r direction was significant effect found at this limiting moisture content, nor below it in the radial direction. However, a highly significant temperature effect was found at 8 per cent. moisture content in the tangential direct10n. .As further analysis of the effect into linear and non-linear components ~howed these to be significant only at the 5 per cent. level, the probable small temperature effect at 8 per cent. was ignored in the graph.
No· appreciable reduction in toughness at low
temperatures is indicated except near 20 per cent.
moisture content. .At the latter moisture content
the rate of loss of strength tapers off in the case of the two non-pored species investigated, but appears to be constant from + 60° C. to - 20° C. for the pored species. Consequently it is considered probable that much lower temperatures and high moisture contents might combine to produce toughness values considerably below those existing at normal conditions. However, reference to the results for impact strength reported by Thunell8 and mentioned earlier, indicates that the behaviour of toughness at very low temperatures cannot be predicted safely from results at other temperatures ; for despite the indication of a reduction in the impact strength of Swedish pine at 12 per cent. moisture content in the range 0° C. to - 20° C., there was a threefold increase at - 60° C. .At the same time, the reported halving of strength at 20 per cent. moisture content by lowering the temperature from + 20° C. to - 17° C. is in keeping with the observed trend towards greater reduction in strength at low temperatures with increase in moisture content . .Although at - 20° C. and /20 per cent. moisture content

T.ABLE 7 TOUGHNESS DATA AT VARIOUS TEMPERATURES AND MOISTURE CONTENTSt
' Temp. Radial Toughness (in. lb.) and Moistme Content ( %) Tangential Toughness (in. lb.) and Moisture Content ( %)
at Species Test I
(oC). R.T. M.C. R.T. M.C. I
R.T. I M.C. T.T. M.C. T.T. M.C. T.T. M.C.
I S1tka spruce .. -20 120·9 7·6 91·6 14·4 95·6 20·4 146·4 7·9 116·0 14·4 116·0 20·6 0 108·2 7·8 91·6 14·5 102·4 20·5 127·8 7·7 116·6 14·5 135·2 20·3
20 88·2 8·0 88·2 14·4 101·9 20·0 119·9 7·9 115·8 14·4 138·3 19·9 40 89·9 7·6 91·8 14·0 113·8 20·2 114·2 7·5 126·2 13·9 153·3 19·6 60 92·4 7·8 99·6 13·0 118·6 18·3 109·8 7·5 142·0 13·1 167·2 20·1
(L**Q**) (L*Q*) (L**) (L**Q**) (I.J**) (L**)
Hoop pine .. -20 125·3 7·5 100·2 13·7 98·0 20·5 133·5 7·5 104·2 13·6 102·0 20·5 0 120·8 7·7 103·5 13·8 106·6 20·1 117·0 7·8 100·0 13·8 103·9 20·0
20 96·6 8·0 87·0 13·9 127·0 19·6 95·5 7·8 97·0 13·8 118·2 19·7 40 96·8 7·4 87·3 13·2 161·9 20·0 93·8 7·4 93·3 13·5 154·0 19·4 60 92·4 7·1 99·7 12·8 212·0 19·7 95·9 6·7 105·4 12·8' 190·6 18·6
(L**B*) (Q**O**) (L**Q*) (L**Q**) (n.s.) (L**Q*)
Bollywood .. -20 79·6 7·7 76·8 13·6 64·3 19·1 76·4 7·8 67·5 13·7 64·5 19·0 0 79·3 7·7 71·8 13·3 75··1 18·7 83·2 7·7 74·1 13·7 84·2 18·5
20 70·0 7·8 74·6 13·4 88·7 18·1 65·8 7·7 85·5 13·6 92·0 18·3 40 71·8 7·3 80·8 13·2 83·8 19·2 I 67·4 7·3 73·9 13·2 92·8 19·1 60 70·7 -7 ·6 85·3 13·2 100·1 19·0 69·6 7·4 79·4 13·2 108·5 18·7
(n.s.) (n.s.) (L**) (L*O*B*) (n.s.) (L**) ~
Coach wood .. -20 159·4 7·2 128·1 12·2 126·0 20·8 144·5 7·1 127·2 12·4 115·2 20·9 0 137·1 7·2 116·6 12·0 132·8 19·1 136·8 7·0 120·1 12·3 114·4 19·5
20 121·4 7·5 123·6 12·2 139·3 18·4 116·2 7·4 124·0 12·5 118·0 17·8 40 135·9 7·1 124·1 11·8 141·0 19·5 122·2 7·0 122·6 11·9 126·8 18·8 60 131·1 7·1 132·6 11·9 140·8 19·2 122·8 6·9 127·0 12·3 126·8 19·9
(L**Q**) (Q*) (L**) (L**Q**B**) (n.s.) (L**)
Silver quandong -20 94·9 7·5 77·5 13·7 73·6 19·9 85·4 7·5 80·3 13·7 72·1 19·9 0 87·0 7·5 75·2 13·8 79·2 19·4 83·5 7·3 72·9 13·8 77·4 19·6
20 72·4 7·7 78·4 13·7 87·0 19·3 68·6 7·5 75·5 13·6 85·2 19·4 40 78·6 7·2 77·8 13·1 96·2 19·2 67·8 7·2 71·2 13·2 86·7 19·2 60 79·8 6·9 83·5 13·4 102·3 19·1 74·5 6·6 77·5 12·6 85·3 18·8
(L**Q**B*) (n.s.) (L**) (L**Q**O**) (n.s.) (L**)
Mountain ash .. -20 234·3 7·5 210·5 12·6 185·6 18·2 203·8 7·4 201·4 12·9 185·6 18·2 0 211·6 7·1 204·5 12·6 183·9 18·3 214·4 7·2 188·5 13·0 183·3 18·2
20 195·6 7·5 182·4 12·7 173·1 17·7 183·5 7·5 187·8 12·7 171·8 18·2 40 185·4 7·3 187·9 12·7 175·8 18·0 174·3 7·3 168·7 12·6 167·0 18·1 60 172·9 7·1 181·1 12·61 190·6 17·2 175·6
, 6·9 175·6 12·6 167·5 17·7
(L**) (L**) (n.s.) (L**) (L**) (L**)
t The significance of the temperatm,e effects (determined from analysis of the results before correction for m01sture content) are shown in brackets. L : Linear; Q: Quadratic; C: Cubic; B: Biquadratic. * S1gru:ficant at the 5% level of probability. **Significant at the 1 % level of probability.
n.s. Not significant at tlle 5% level of probability.

EFFECT OF TEMPERATURE ON STRENGTH OF WOOD, PLYWOOD AND GLUED JOINTS 25
T.ABLE 8
LINEAR REGRESSION COEFFICIENTS OF TOUGHNESS ON TE:iY[pERATURE
Linear regression coefficients of radial and tangential toughness on temperature (in. lb./ 0 0.) at the following nominal moisture contents:-
Species 8 per cent.
Radial Tangential
Sitka spruce . . .. - 0·38 - 0·43
Hoop pine .. . . - 0·45 - 0·49
Bollywood . . .. - 0·13 - 0·15
Coach wood . . .. - 0·29 - 0·29
Silver quandong . . .. - 0·19 - 0·19
Mountain ash . . .. -- 0·74 - 0·48
some species in the present investigations were 20 to 25 per cent. weaker than at 20° C. and 20 per cent. moisture content, these reduced strengths were not always less than the toughness of the matched specimens at 20° C. and lower moisture contents.
The varying effect of temperature on toughness is unusual in comparison with the consistent decrease in other strength properties with increasing temperature, but an explanation is possible based on specimen strength and deflection to failure. .As toughness is a combined function of these two properties, it will tend to be reduced by increasing temperature due to loss of strength ; but this reduction will tend to be offset by increased deflection. Deflection to failure during toughness tests was not recorded, but the above explanation agrees with observed deflections in static bending (Table 6). Below 12 per cent. moisture content where deflection to failure does not increase noticeably with temperature, there is httle or no increase, and often a decrease in toughness. .At higher moisture contents, larger increase in deflection with temperature is accompanied by increase in toughness or, as in the case of mountain ash for which deflection is not so greatly increased, by a reduction in the rate of decrease of toughness.
1.4 CONCLUSIONS TO PART I.
Temperature has a considerable effect on the strength properties of wood in compression, static
12 per cent. 20 per cent.
Radial Tangential Radial Tangential
+ 0·08 + 0·31 + 0·29 + 0·60
- 0·09 - 0·02 + 1·42 + 1·14
+ 0·13 + 0·12 + 0·40 + 0·48
+ 0·08 + 0·01 + 0·19 + 0·18
+ 0·07 + 0·04 + 0·37 + 0·17
- 0·38 - 0·36 + 0·01 - 0·26
bending and toughness but the effect may vary appreciably with moisture content and species.
From oven-dry to 20 per cent. moisture content, maximum crushing strength parallel to the grain, modulus of rupture and fibre stress at the limit of proportionality decrease linearly with rise in temperature. Modulus of elasticity in static bending also decreases with temperature rise. On account of systematic variation between species and moisture contents of the effect of temperature on these properties, it is possible to establish generalizations which are considered applicable to any species.
The strength of wet wood, examined only in compression, is reduced at high temperature; below freezing point it is more than proportionately increased by ice formation.
The effect of temperature on toughness varies widely between species and m01sture contents. In some instances, toughness increases with temperature, in others it remains constant, _or decreases ; but no serious reduction below toughness at some normal condition is indicated for the species and range of conditions (8 to 20 per cent. moisture content, - 20 to + 60° C.) investigated. .At the same time, there is a trend towards greater reduction in toughness with decreasing temperature and rising moisture content whwh, coupled with possible wide variation between species, suggests that each case should be separately investigated.

26 REPORT ACA-46
140 140
120 120 40°C.
20°C 100 Oooc
-20° 100
80 80
60 60 6 14 18. 22 -20 0 20 40 60
(d l SPRUCE - RADIAL TOUGHNESS
180
160
Vl 140 0 z ::> 0 120 a.
I ::r: u ;?; 100
6 10 14 18 ~ {b) SPRUCE-TANGENTIAL TOUGHNESS VI Vl w z ::r: l.9 ::> 0 I-
220
I /
200
20%MC/
v 180
/ /v /
/ v v
16%My/ --.....
C>< v / ~
_ _./' ------~ - -....... :---- 8'7..MC
~ -~ ---.......
160
140
120
JOO
80 JO 14 18 22 -20 0 20 40 60
t C' HOOP PINE- RADIAL TOUGHNESS
MOISTURE CONTENT % TEMPERATURE °C.
Fig. 17. The effect of moisture content and temperature on toughness

Vl 0 z :::> 0 c..
I ::r: u z z Vl Vl w z ::r: l7 :::> 0 I-
EFFECT OF TEMPERATURE ON STRENGTH OF WOOD, PLYWOOD AND GLUED JOINTS '27
8%MC
12°1.MC 80.._~--'~~-'-~~ ....... ~~.__~__.~~-'-~~-'-~~ 80'::-::-~--'-~~-'-~~-'-~-,,'--~---L-~-'---...I-----'
6 10 14 18 22 -20 Q 20 40 60
160
100 6 10 14
cd >HOOP PINE-TANGENTIAL TOUGHNESS
/
18 22
160
140 r--.._
~
120
100 -20
--.......
0
( e l COACHWOOD - RADIAL TOUGHNESS
...__
~·-~
r---12°i.MC 16"tMC
[%MC.
0 If l COACHWOOD -TANGENTIAL TOUGHNfSS
20
20
MOISTURE CONTENT % TEMPERATURE °C,
--40
40
Fig. 17-continued. The effect of moisture content and temperature on toughness
20%MJ
16/oMCI 8°!.MC 12%MC ,_
60
60

28 REPORT ACA-46
60°C 1001---~-+~~-l-~~+-~--j~~-+~~-J----,a~+-~--j
40°c
601:-~-'-~~-L-~~---~--'~~--'-~~-"--~~.....:::..=....:=-i 6 ~ ~
120
en 0 z 100 :J 0 c..
I ::r: 80 u z
~ 60 en en w z ::r: l'..l :J 0 I-
40 6
240
220
200
180
160 6'
0 ()
e.
10
0
10
col BOLLYWOOD- RADIAL TOUGHNESS
120
y 60°C
40°c-
~ Y< 20°c • _.......:: ~
~
100
80 e --r--_ - o·c
()
~ ro·c-
v--------60
40 14 18. 22 -20
1 h l BOLLYWOOD -TANGENTIAL TOUGHNESS
14 18 22 Ii l MOUNTAIN ASH-RADIAL TOUGHNESS
MOl?TURE CONTENT %
0 20
----------0 20
0 20
TEMPERATURE °C.
Fig . . 17-continued. The effect of moisture content and temperature on toughness
40 60
20°1.M ;.,--------167.Mr -127.MC-
8%MC
40 60
40 60

en 0 z :::> 0 D..
± u z z en en w z :r: l7 :::> 0 I-
EFFECT OF TEMPERATURE ON STRENGTH OF WOOD, PLYWOOD AND GLUED JOINTS 29
(jl MOUNTAIN ASH-TANGENTIAL IDUGHNE.SS
llO'...---r--,----,---.,..----,--,--1 llO>..---....,.----,.---r---r--,----r--...,--i
8 601L,_ _ _L. __ L__-1::----'--~-~-~ 5oL_ _ _L. _ _1. __ .j...__-::1:::--L...----:;::---1.---;;:60'
12 16 20 -20 0 20 40
(kl SILVER QUANDONG - RADIAL TOUGHNESS
60l_ _ _L __ L__.....L.. __ L::-----l----;"';::---'------:;'. 60l_ __ 8J_ _ __J. ___ 121::---......l...---;';16:---......__--;2'0 -20 0 20 40 60
t I l SILVER QUANDONG - TANGENTIAL TOUGHNESS
MOISTURE CONTENT. '1. TEMPERATURE °C
KEY -x/c--<>- ,o·c--0- ,2o·c_._;40C ~.6ot--4-
Fig. l 7-continued. The effect of moisture content and temperature on toughness

30 REPORT ACA-46
part 11. The Effect of Temperature on Standard Specimens of Hoop Pine in Compression, Bending and Shear at 15 per cent. Moisture Content
2.0 IN'l'RODUCTION
In order to verify the large temperature effects suggested by experiments on small specimens, and to find whether the coefficients obtained are applicable to larger specimens, compression and bending tests were made on solid wood specimens of sizes normally used in timber testing. Standard shear tests were also ,included as a matter of interest. All tests were generally in accordance with the British and American specificat10ns for testing small clear specimens of timber (Brit. Stand. Inst. 15, Stand. Assoc. Aust.16 ,
Great Britain, Air Ministry17, and Amer. Soc. Test Mater.11). As the only available machines of sufficient capacity were not normally air-condit10ned, the tests
·were restricted with respect to temperature and to one species, hoop pine (Araucaria cunningharnii Ait.). Carefully controlled check experiments were also made on the largest compression prisms (2 in. x ! in. x ! in.) of the same species which could be tested in the air-conditioned machine used in the experiments on small specimens.
2.1 MATERIAL, PROPERTIES AND TEST
CONDITIONS
For tests on the standard machines, end-matched specimens (8 in. x 2 in. x 2 in. and 2 in. x 1 m. x 1 in. for compression, 30 in. x 2 in. x 2 m. for bending and 2 in. x 2 in. x 2 in. for shear tests)' were prepared as shown in Fig. 18, from one board from each of
------30"
-'JslslslsJ B L LC . LC I LC
30"-----9'
KEY B ST BENDINC 3o"x2"x 2" C · COMPRESSION 2 X I X l
LC COMPRESSION SX2 X 2 S SHEAR 2X2X2
Fig. 18. Preparat10n of specimens
ten trees. It will be noted that the shear specimens were taken from an end of t~e bending specimens after the latter had ·been tested. The end-matched specimens from each board were allocated ·at random for testing at nominal temperatures of O, 13 ·3, 26 ·7, and 40° C. in compression and shear and at 20 and 40° C. in bending. For compression in the airconditioned testing machme, two groups of three
end-matched prisms (2 in. x ! in. x ! in.) of hoop pme were prepared from each of ten boards, the three specimens m each group being allocated at random for testing at - 20, + 20, and + 60° C. so that twenty well matched specimens were tested at each closely controlled temperature. All specimens were conditioned to approximately 15 per cent. equilibrium moisture content. -
2.2 EXPERilliENTAL PROCEDURE
The specimens were brought to the test temperatures in the air-conditioned testing machine cabinet or in a kiln, two hours being allowed for specimens up to 1 in. x 1 in., and upwards of four hours for 2 in. x 2 in. material. Precautions were taken to maintain reasonably constant specimen temperature during transfer to the testing machines and throughout the tests. The testing heads were surrounded by appropriately heated compartments. for experiment& on· bending, shear, and large compression specimens above freezing point. Of the experiments, only shear tests were successfully extended to 0° C., the shear block being insulated from the machine. and cooled in ice before each test. All compression specimens were insulated from the testing machines by temperature-condit10ned cardboa,rd packing pieces ; small specimens t.ested on a Dennison 30,000 lb. testing machine. were surrounded during test by a metal container at the appropriate temperature.
Rates of loading were 6,000 and 3,000 lb./sq. in. per minute respectively for large and small compression prisms, 0 · l in. /min. for static bending and 0 · 015 in. /min. for shear spec~ens.
2.3 RESULTS AND DISCUSSION
All results were corrected to 15 per cent. moisture content before analysis. Corrected results for compression and shear tests are plotted in Figs. 19 and 20.
In compression parallel to the grain, analysis showed the temperature effect on crushing strength to be highly significant with no significant deviation from linearity for either small or large prisms. For both specimen sizes tested on the Dennison testing machine the linear regression coefficients were similar'
' - 0·69 compared with - 0·67 per cent. (of strength at 20° C.) per °C. For check tests on 2 in. x ! in. x ! in. specimens in the special testing machine the regression coefficient was - l · 00 per cent. per 0 c'. The larger coefficient obtained from the carefully

EFFECT OF TEMPERATURE ON STRENGTH OF WOOD, PLYWOOD AND GLUED JOINTS 31
controlled check tests leaves little doubt that a similar result should have been obtained at least for the small specimens of approximately ,similar size (2 in. x 1 in. x 1 in.) tested on a non-conditioned standard machine ; possibly also for the large (8 in. x 2 in. x 2 in.) specimens which were tested under equally poor experimental conditions. Comparison with results from 2 in. x tin. x ~ in. specimens
z 0 7000
~ t 6000 ~~ ~ MAXIMUM CRUStilNC. ~°'t ~ S TREN~TH '"
~ 5 0
.., z I
* 6l 0
CRUSHINQ~ AT LIMIT OF PROPORTIONAUTY
MODULUS OF ELASTICITY
60 O~-...L.....---,L-----'----' -20 0 20 40
TEMPERATURE 0c
Fig. 19. The effect of temperature on the strength of hoop pine in compression parallel to the grain at 15 per cent. moisture content
KEY TO FI~ 19
Specmcn Siu P~•rly i<.y
21a..l%inX'6ln M.ucCrStr•nq\h --0--2m)( Ion)( 1., - - - --•·-
8mX21nx21n _-
Cr Str ..t LP --©----
- Mod of Elnt1clty ~
rsoo,~--------
O'
~ ,,1
t;
~ I-"'1
~ "' ..
13 0 13 3 26 7 40
TEM!'ERAT\JRE "c
Fig. 20. The effect of temperature on the shear strength or hoop pine at 15 per cent. moisture content.
shows that while the higher coefficient ( - 1·00 per cent. per °C.) is little greater than the coefficients obtained at 15 per cent. moisture content for the same species and the average of six species tested from 20 to 60° C. ( - 0 · 97 and - 0 · 95 per cent. per °C. respectively) or for the average of eight species (- 0 ·93 per cent. per °C.) obtained by interpolation from data at other moisture contents (Fig. 6), the lower coefficients obtained on the Dennison testing machines compare closely only with doubtful results of early experiments at low temperatures. It is, therefore, likely that the effect of temperature on maximum crushing strength parallel to the grain is the same for all usual sizes of specimens.
In compression parallel to the grain (8 in. x 2 in. x 2 in. specimens), crushing strength at limit of proportionality and modulus of elasticity both decrease with rising temperature, the linear effects
being highly significant. The respective regression coefficients obtained are - 0 · 77 and - 0 · 49 per cent. (of value at 20° C.) per degree Centigrade. No significant deviation from linearity was observed.
In centre point static bending (30 in. x 2 in. x 2 in. specimens, tested over a 28 in. span), modulus of rupture and fibre stress at the limit of proportionality decreased with increase in temperature, the effects being highly significant. Results were obtained only at 20° C. and 40° C. For this temperature rise, modulus of rupture decreased to 73 per cent. and fibre stress at limit of proportionality to 70 per cent. of their values at 20° C. These temperature effects are greater than for 10 in. x tin. x tin. specimens of the same species, the corresponding reductions for the small specimens being to 86 and 82 per cent. respectively, where the result for fibre stress at limit of proportionality is derived by interpolation from Fig. 15. .A decrease of modulus of elasticity to 89 per cent. of its value at 20° C. resulted from an increase of temperature to 40° C. .Although this effect was not significant at the 5 per cent. level of probability, its magnitude is little different from the highly significant reduction (at 40° C. to 86 per cent. of its value at 20° C.) which was observed for modulus of elasticity of small hoop pine specimens ; the average reduction in modulus of elasticity observed for the
, large specimens is identical with the linear regression coefficient obtained for the small specimens in the range 20 to 60° C.
The results of shear tests, both radial and tangential showed highly significant linear decreases in shear strength with increase in temperature ; there was no significant deviation from linearity. The respective regression coefficients were - 0 · 49 and - 0 ·63 per cent. (of strength at 20° C.) per degree Centigrade.
2.4 CONCLUSIONS TO PART II.
Compression and bending , tests on more usual sizes of solid hoop pine specimens at 15 per cent. moisture content show that these are affected by
temperature in much the same manner as small specimens ; but the magnitudes of the effects may
' differ .
.Appreciably lower temperature coefficients were found for maximum crushing strength of larger specimens tested on the Dennison testing machine, but check experiments suggest that better temperature

32 REPORT ACA-46
control might yield the same higher coefficient (approximately - l ·O per cent. of strength at 20° C., per degree Centigrade) established for small specimens. Modulus of elasticity appears to be affected much the same for large and small bending specimens, and for (large) compression specimens. It is, therefore, pDssible that the general relations between maximum crushing strength and temperature, and between modulus of elasticity and temperature, which were derived for sniall specimens (Part I.) may also apply to other specimen sizes. The relations for modulus of elasticity in bending may also hold for this property in compression.
Modulus of rupture and fibre stress a.t the limit of proportionality in centre-point static bending are more affected by temperature in large specimens than in small.
Examination of crushing stress at the limit of proportionality in compression parallel to the grain, and of shear strength, confirms the general weakening effect of increasing temperature. Both these properties are linearly affected.
Part Ill. The Effect of Temperature on the Strength Properties of Hoop Pine Plywood in Compression and Tension at Various Moisture Contents
3.0 INTRODUCTION
By improved matching of specimens, greater attention to moisture control, and extension of the range
of both temperature and moisture content, more extensive and reliable information on the effect of temperature on the compressive and tensile properties of hoop pine three-ply was obtamed from the later investigations than from preliminary experiments at 15 per cent. nominal moisture content (Sulz berger1).
3.1 MATERIAL AND TEST CONDITIONS
The material investigated was {6 -in. hoop pine (Araucaria cunninghamii Aft) three-ply bonded with urea-formaldehyde (Beetle cement H, hot hardener No. 12) set at 99~ C. to 104° C. at a pressure of 125 lb./sq. in. maintained for 10 minutes.
The properties investigated and the conditions at which tests were made are listed in Table 9.
A total of 180 sheets each 19 in. x 19 in. x fs- in., was prepared from eighteen logs, two from each of nine trees. Sufficient veneers were obtained from a given radius (within ± 0 · 5 in.) of each log to make nine sheets of plywood. This procedure was duplicated for two logs from one of the trees so that twenty replications of nine matched sheets were obtained.
Tension specimens (Fig. 21) were prepared from these groups in such a way that they were closely matched between moisture contents and grain directions with respect to position in the tree and, for any one grain direction and moisture content, were side-matched (within sheets) between temperatures. At nominal zero moisture content, the same tensile
TABLE 9
PROPERTillS OF PLYWOOD AND THE CONDITIONS OF TEMPERATURE AND MOISTURE CON'l'ENT INVESTIGATED
Property
Tensile Strength
Modulus of Elasticity in Tension
Compressive Strength
Direction of Test to Grain of Outer Plies
Parallel, Perpendicular, and 45°
Parallel, Perpendicular, and 45°
Parallel and Perpendicular
45° ..
Nominal M01sture Content
(%)
8, 12, 18
l_O JS, 12, 18
}~' 12, 18 22
l~, 12, 18 j 22
Temperature at Test (oC.)
- 20, o, 20, 40, 60, 80
- 20, 60 - 20, o, 20, 40, 60
- 20, 20, 60, 80 - 20, o, 20, 40, 60, 80 - 20, 20, 60, 80
- 20, 20 (duplicated), 60, 80 - 20, o, 20, 40, 60, 80 - 20, 40, 80

EFFECT OF TEMPERATURE ON STRENGTH OF WOOD, PLYWOOD AND GLUED JOINTS 33
specimens were tested at each temperature, loading being discontinued before failure occurred. As multiple compression specimens (2 in. x -~ in. x 1\; in.) were used, it was pos~ible to select these from the same sheets in such a way that for each grain direction the specimens were closely side-matched between both temperatures and moisture contents, and between grain directions were matched with respect to position in the tree.
Twenty tension and compression specimens of each grain direction were tested at each listed condition of moisture content and temperature.
1~.I ~-7,,·83__,-" Ra-d ---,-----... ,_ .---: ,. ~~r I t 2·--1---- 2i 22 .I. 2~ 2"j r--1----------12"------------~
Fig. 21. Plywood tension specimens
3.2 EXPERIMENTAL PROCEDURE
All tests were made using the air-conditioned testing machine.
The required moisture contenfa except oven-dry and above 20 per cent. were obtained by leaying t.he specimens in air at controlled humidities and approximate room temperature until equilibrium was attained. Moisture contents greater than 20 per cent. were obtained in a kiln at approximately 40° C. Tension specimens were brought to nominal zero moisture content by drying for approximately 12 hours at 105° C. This drying procedure was also followed for compression specimens tested at 20 and 60° c.,' but those tested at - 20 and + 80° C. were dried in vacuo for approximately 18 hours- at 60° C. and a duplicated group, tested at 20° C. and at 45° to the grain direction, was dried in vacuo at room temperature, first over calcium chloride, then over phosphorus pentoxide.
All specimens were brought to the required temperature in the test chamber. With the exception of oven-dry tension specimens which were conditioned for only 20 minutes, all were allowed from one to two hours in the chamber before testing. The reduced time for dry tension specimens was sufficient, as shown by thermocouple readings, to bring them very close to the required temp_erature, at the same time limiting the amount of moisture absorbed. Change in moisture content of compression specimens
near zero moisture content and above 20 per cent. moisture content during conditioning was prevented by the use of air-tight weighing bottles.
A loading rate of 4,000 lb./sq. in./min. conforming to Australian Standard Specification18 was used for tension parallel and perpendicular to the grain. In the absence of a standard rate for tension in the 45° direction, a loading rate of 2,000 lb./sq. in./min. was adopted in order to make the loading times comparable for all directions, at least at normal temperatures. Stress-strain diagrams were obtained with the aid of a dial type extensometer graduated in 0 · 0001 in. and having a gauge length of 2 in. Because of possible damage to the extensometer, modulus of elasticity was not investigated at 80° C.
Maximum crushing strength was determined at loading rates of 3,000 lb./sq. in./min. for tests parallel and perpendicular to ~he grain and 1,000 lb./sq. in./min. for tests at 45° to the grain.
3.3 RESULTS AND DISCUSSION
3.31 TENSILE STRENGTH (PARALLEL, PERPENDICULAR, AND AT 45° TO 'l'HE GRAIN)
The effect of temperature on the tensile strength of plywood may be followed from the free-hand curves (Fig. 22) drawn to the experimental points corrected to 8, 12, and 20 per cent. moisture contents, the corrections being derived from a parabola fitted to the obsenred values at the three test moisture contents.
Temperature has an effect on tensile strength at each moisture content and in each direction. The effect is by no means uniform throughout either the temperature or moisture content ranges; but there is a general t~end towards reduced strength at high temperatures and moisture contents which is most seriously manifest in the 45 ° direction.
While the main effect of temperature on tensile strength parallel to the grain is at high moisture content and temperature, there appears to be a tendency for strength to increase below freezing point, the effect increasing with moisture content. At high temperature there is a marked reduction in strength at 12 per cent. moisture content between 60 and 80° C., and a much greater reduction at 20 per cent. moisture content, between 50 and 80° C. At the most severe test condit10n (20 per cent. moisture content, 80° C.) the experimental tensile

34 REPORT ACA-46
strength parallel to the grain was 30 per cent. less than at 20° C. and the same moisture content. At 8 per cent. moisture content there is an average strength reduction from - 20 to + 80° C. of about 0·1 per cent. (of strength at 20° C. per one degree Centigrade).
l:IOOO
9dOO
8000
~
Iii 7000
~ ...J
::c ... 6oOO ~ ... a: I;;
w 5000 ... iii
"' w .... 4000
3000
2000
100
0
"
PARALLEL TO ClRAIN
PERPENDICULAR TO ClRAIN
45°TO CRAIN
B%M C -127, MC --0- ®
20/.MC. -- ®
-20 0 20 40 60 so TEMPERATURE "c
Fig. 22. The effect of temperature on the tensile strength of hoop pine plywood
In the perpendicular direction, tensile strength at 8 per cent. moisture content increased by approxi
mately 14 per cent. between - 20 and + 20° C., reduced slightly between 20 and 40° C. and remained practically constant between 40 and 80° C. At higher moisture contents strength changed little between - 20 and 0° C. but reached maximum values at 40 and 20° C. at 12 and 20 per cent. moisture content respectively. Beyond these
temperatures, strength decreased appreciably, especially at high moisture content. For example, at 20 per cent. moisture content and 80° C. tensile strength perpendicular to the grain was reduced to 56 per cent. of its value at 20° C. and the same moisture content or to 63 per cent. of its value at 20° C., 8 per cent. moisture content.
In general, either increasing temperature or moisture content reduced the tensile strength of plywood at 45° to the grain of the outer plies, but near 8 per cent. moisture content a slight gain in strength between - 20 and + 20° C. was indicated. The reduction in strength was severe at high temperature and moisture content, at 20 per cent. moisture content, the experimental value at 80° C. being 29 ·5 per cent. of the corresponding mean at 20° C.
3.32 MODULUS OF ELASTICITY IN TENSION (PARALLEL, PERPENDICULAR AND .A.T
45° TO THE GR.A.IN)
The results for modulus of elasticity of plywood in tension were corrected to 8, 12, and 20 per cent. moisture content, using a parabola fitted to the experimental values at the test_ moisture contents . The corrected data are plotted in Figs. 23 and 24,
1800
1600
1400 PARALLEL TO CiRAIN
Q 1200
)(
~
~1000 "' ...J
>-5 800
... "' < ...J w IL 600 0
"' ::> ...J
i5 400 0 ::i:
200
sf.Mc • 12{. MC 0
20J.MC. <i>
PERPENDICULAR TO CiRAIN
®
0--~~-~20,,--~~o'--~~2~0~~--'4~0~~-60..__~----'
TEMPERATURE "c
Fig. 23. The effect of temperature on the modulus of elasticity of hoop pine plywood in tension

EFFECT OF TEMPERATURE ON STRENGTH OF WOOD, PLYWOOD AND GLUED JOINTS '35
160
1200
;?;
a ~1000
.J
,. ... 2 800 "' < .J .., \L 0 600
"' 3 :::> 0 0 ~ 400
200
-2o•c ~ 0°C 0
2o•c o 4o•c 'O. 60°C f>
~~~~~ ----~
PERPENDICULAR TO GRAIN ~
OL.~--<0~~--'-4~~-L~~~12,.-~---'-;16~~~20':--~---'
MOISTURE CONTENT
Fig. 24. Variation in temperature' effect with moisture content-modulus of elasticity of hoop pme plywood in tension
the latter also containing observations on oven-dry
material. The free-hand curves do not correspond
exactly between these two :figures, smoothing of the individual curves being guided in the second case by
other curves in the family and by results near zero
moisture content.
The effect of temperature on modulus of elasticity
of plywood at zero moisture content is negligible or
even non-existent. The experimental means obtained
near the oven-dry condition, for the same specimens
at each temperature, were all less at 60° C. than at
- 20° C., but Fig. 24 suggests a residual effect,
after correction to zero moisture content, only for
the direction parallel to the grain.
is small. However, as modulus of-elasticity at 20° C. decreases with increase in moisture content frol_l?. oven-dry to 20 per cent., the temperature effects expressed as percentages of these values increase throughout the whole range. The two families of curves representing dependence of modulus of elas
ticity perpendicular and at 45° to the grain on temperature and moisture content (Fig. 24) are
almost identical in form and spread ; hence, despite
a large difference in modulus of elasticity for the two directions, this property is similarly affected in
both directions by temperature and by moisture
content, and on a percentage basis, the effect of
temperature on modulus of elasticity of plywood
at 45° to the grain is greater than for the perpendicular
direction.
This behaviour in plywood is unusual compared
with solid wood for which the temperature effects
on modulus of elasticity in bending was found to be
proportional to strength. Comparative da~a (T11ib!e 10) confirm the greater proportional effect of tem
perature for the 45° direction and show modulus
of elasticity of plywood in tension parallel and
perpendicular to the grain at 8, 12, and 20 per cent. moisture contents to be affected by temperature to
much the same extent, on the usual proportional
basis, as is the modulus of elasticity of small solid
wood specimens of the same species tested in centre
point static bending.
The graphical correlation shown in Fig. 25
illustrates, by the small spread of results about the
line Y = X, the 'very marked similarity which
exists between the effect of temperature on modulus
of elasticity of wood in static bending and of plywood
in tension parallel and perpendicular to the grain.
For the 45° direction, the equation to the .correlation
is Y = 2·6X -160 (12)
There is a de:fimte reduction in modulus of elasticity where X and Y are the respective modulus of elasticity
with mcreasing temperature at all moisture contents values at a given moisture content and temperature
above zero. In the parallel direction, this yffect for hoop pine solid. wood in static bending and for
increases noticeably with moisture content throughout hoop pine plywood in tension at 45° to the grain,
the range investigated; but in the perpendicular expressed as percentages of the corresponding values
and 45° direct10ns, any change in the temperature at 20° C. and the same moisture content. The spread
effect between 12 and 20 per cent. moisture contents of results is particularly small.

36 REPORT ACA-46
TABLE 10
COMPARISON BETWEEN THE EFFECTS OF TEMPERATURE ON MODULUS OF ELASTICITY OF Hoop PINE PLYWOOD
IN TENSION .A.ND SOLID Hoop PINE IN ST.A.TIC BENDING .A.S PERCENT.A.GE OF v .A.LUES AT 20° c . .A.ND THE
SAME MOIS'l'URE CONTENT*
(Experimental data corrected to nominal moisture content)
8 per cent. 12 per cent. 20 per cent.
Source of Result - 20° 0° c. 20°0. 40°0. 60°0. -20° 0° c. 20° c. 40°0. 60°0. -20° 0° 0. 20° c. 40° c. 60°0.
0. 0. c. -----------------------------
Hoop Pine Solid Wood in Stat.ic Bending (from Table 4-10 in. x ~in. x i in. specimens) .. 106 105 100 98 91 107 107 103 95 88 113 109 105 92 81
Hoop Pine Plywood in Tension Parallel to Grain .. 106 107 101 97 89 108 106 102 97 87 113 106 99 100 82
Hoop Pine Plywood in Tension Perpen-dicular to Grain .. 108 109 99 94 91 108 106 103 99 84 111 101 106 97 84
Hoop Pine Plywood in Tension at 45° to Grain .. 116 113 101 92 79 119 114 109 89 68 143 126 102 76 52
* Modulus of elasticity at 20° C. taken as the grand mean of the experimental means at the five temperatures.
0 "o ~0.--------------------, N .. ... g ... > .. 0 ..; & ... l; I ... ~ ·;;; c ~ c 100
"' ..:! :>
"O 0
:::t 60 80
to gr•in
• Perpendi cul dr to 9r.,jn X 45 ° to 9r4in
100 120 140
Modulu-. ot Elasticity of Solid Wood in Sl.,tic Bendin9 Per Cenl ot Vdlue dt 20°C
Fig. 25. Comparison between the effect of temperature on modulus of elasticity of hoop pine plywood in tension and hoop pine solid wood (10 in. x *in. x ~in. specimens) in static bending at 8, 12, and 20 per cent. moisture content.
3.33 MAXIl\IUl\I CRUSHING STRENGTH (PARALLEL,
PERPENDICULAR AND .A.T 45° TO 'l'HE GR.A.IN)
The effect of temperature and moisture content on the maximum crushing strength of plywood may be followed from Figs. 26 and 27 in which the experimental results are plotted against moisture content for the respective directions of test. The full smoothed curves shown in these graphs connect the observation points at similar temperatures and are, therefore, the crushing strength-moisture content curves appropriate to the temperatures indicated. It may readily be seen that in general strength decreases with increase in either temperature or moisture content. Exceptions occur in the 45° direction below about 12 per cent. moisture content, in which condition the general strength-moisture content relation is reversed, while at zero moisture content for the same direction, temperature appears to have no effect. This reduction in strength in the 45° direction with decrease in moisture content canhardly be attributed to the method of drying since matched groups tested at 20° C., and dried, one at 105° C. and the other over a desiccant at room temperature, gave practically the same result.
The strength-moisture content curves closely fit the observation points and where analyses were made (on uncorrected data), their spacing conforms to the

EFFECT OF TEMPERATURE ON STRENGTH OF WOOD, PLYWOOD AND GLUED JOINTS 37
statistical indication of linear or of non-linear temperature effects. In Fig. 26 the curves are equally spaced to indicate a uniform decrease in strength parallel to the grain with increasing temperature at all moisture contents. In the perpendicular and 45° directions (Fig. 27), the temperature effect is not uniform throughout the complete temperature range, except above approximately 16 per cent. moisture
E r:r
"' L. CIJ Cl.
"' "O c :>
& 70CO
-5 "" 6000 c CIJ L.
cil 5000
o> c
:.c Ill
4COO 0 :> ~ L. ' u ~ --E 3000 ~ ! ----:> w --§ --)(
2000 ;~ ~ ... g
~
JOC00 4 a 12 16
Moisture Content %
content. .A.t lower moisture contents the effect is more pronounced at higher temperatures. The effect of temperature at specific moisture contents is shown in Figs. 26 and 27 on transfer graphs prepared from the smoothed strength-temperature isothermals; average reduction in strength with temperature is indicated for two directions by broken lines on the strength-moisture content graphs.
20 24 IOOQ20 0 20 40 60 BO Temperdture °C
Fig. 26. The effect of moisture and temperature on the crushing strength parallel to the grain of hoop pine plywood
o> c E II)
i: u
E :> .§ x
"' ~
70CO ?ooo~-~----~-~-~
Perpendicular to Grain
3000
- --20CO --10000 4 B 20 24
4000
IOOQO IOOQ20 0 20 40 60
Moisture Content 0/0 Temperature °C
Fig. 27. The effect of moisture and temperature on the crushing strength perpendicular and at 45° to the grain of hoop pine plywood

88 REPORT ACA-46
The effect of temperature on the maximum content, tensile strength is seriously affected. Although
crushing strength parallel to the grain is compared
in Fig. 28 for plywood and solid wood. The pro
portional temperature coefficients for hoop pine
plywood are a little ~ower than for small solid
specimens of the same species, except for coincidence
at zero moisture content. From oven-dry to 12 per
cent. moisture content, the coefficients for plywood
practically coincide with the average results for
solid wood ; above 12 per cent. moisture content
the plywood coefficients are less.
:!: "' c .. ..-....
0
en .. x u
c;~ ~ u c <I .. ~C'l .. 0 0. -. .. x .. o.u ~'-' u ~o WO
N .. L ~ ; .. ~
" ... E ~
12
10
08
06
0
02 4
-o--- Hoop Pine Plywood (from Fo9 26)
-------- Hoop Pine Solid Pr"m (smdll Prrsms.,From Pdrts I&.Il)
-- Qenerdl Curvq for Wood ( Smdll Pr1sms. 1 From Pdrt I)
B 12 16 20 Mo1sturq Contgont Percent
24
~ Fig. 28. Comparison of effect of temperature on maximum crushing strength of plywood and solid wood in compression parallel to grain
3.4 CONCLUSIONS TO PART III.
All 'strength properties of hoop pine plywood
investigated are affected by temperature, the most
marked trend being towards a serious decrease at
high temperature and moisture content. Plywood
appears to be particularly temperature sensitive at
45° to the grain.
The manner in which maximum tensile strength
parallel and perpendicular to the grain varies with
temperature and moisture content is complex ; but
the interactions are such that only above 60° C. and
12 per cent. moisture content are the strengths
reduced much below those encountered at normal
temperature and some moisture content in the
hygro~copic range. At 80° C., 20 per cent. moisture
for the parallel direction, tensile strength appears to
increase slightly at sub-normal temperatures, for the
perpendicular direction it decreases. At 45° to the
grain, tensile strength of plywood at 20 per cent.
moisture content is seriously weakened by increase
in temperature.
On a proportional basis the modulus of elasticity
of hoop pine plywood parallel and perpendicular to
the grain, between 8 and 20 per cent. moisture
content, is affected to the same extent as is the
modulus of elasticity of solid hoop pine in static
bending. In the 45° direction and for the same
moisture content range, the reducing effect of rising
temperature' is proportionately greater, but also is
closely correlated with the effect of temperature on
modulus of elasticity of solid wood in bending.
Should similar relations exist for other species of
plywood, the generalizations (Part I., Figs. 10, 11)
developed for determining temperature effect on
modulus of elasticity of wood in static bending
should apply, between 8 and 20 per cent. moisture
content, directly to modulus of elasticity of plywood
parallel and perpendicular to the grain ; and
indirectly to the 45° direction through a correlation
for a number of species between perc~ntage modulus
of elasticity values for plywood in tension and for
solid wood in bending.
Maximum crushing strength of plywood parallel
to the grain decreases linearly with increase in
temperature at all conditions examined. The observed
temperature coefficients expressed as percentages of
strength at 20° C. were not very different from those
of solid wood of the same species ; at zero moisture
content they were equal, at other moisture contents
the coefficients for plywood were lower. Maximum
crushing strength in the perpendicular and 45°
directions is affected linearly by temperature above
approximately 16 per cent. moisture content; below
it there appears to be a departure from linearity,
and at zero moisture content temperature has no
effect on maximum crushing strength at 45° to the
grain.

EFFECT OF TEMPERATURE ON STRENGTH OF WOOD, PLYWOOD AND GLUED JOINTS 39
Part IV. The Effect of Temperature on the Shear Strength of Glued Joints at Various
Moisture Contents
4.0 INTRODUCTION
In preliminary investigations on shear strength of
glued joints at 15 per cent. nominal moisture content,
no seriously detrimental temperature effect was
observed. The strength of ?asein joints increased at
both high and low temperatures, while urea- and
phenol-formaldehyde joints decreased only slightly
throughout the range (- 10 to + 50° 0.) investi
gated. Nevertheless, in view of the range of conditiop.s
encountereµ. in practice, the investigations to be
described were undertaken on the same adhesives
to cover moisture contents from 8 to 20 per cent.
over as wide a temperature range as was possible
at that time.
4.1 ADHESIVES, MATERIAL, AND TEST
CONDITIONS
Hoop pine specimens 8 in. x 1 in. x t in. with
central glue-lines were used, the specimens being
notched to leave an effective glue surface of one
inch square (Fig. 29). The usual solid wood was
replaced by !-in. three-ply, bonded with phenol
formaldehyde (tego film), set at 138°-149° C. at
125 lb./sq. in. for 12 minutes.
ct5u '- 1•--l
~ \CLUE LINE UNDER TEST
Fig. 29. Glue joint test specimen
Three 20-in. square sheets of the !-in. plywood
were made from veneers from the same radius (in any one tree) from each of eleven trees. One sheet from each tree was allotted for the preparation of glued joints of each type of adhesive, namely casein, urea-formaldehyde, and phenol-formaldehyde. In effect, three well matched groups of eleven sheets were available, one for use with each glue.
These sheets were sawn centrally along the grain, the halves folded together and bonded with the
adhesives under test to form boards approximately
20 in. long x 10 in. wide x t in. thick. As illustrated
in Fig. 30, fifteen specimens 8 in. x 1 in. x t in.
were prepared from each board. The groups of
specimens 1 to 5, 6 to 10, and 11 to 15 were then
allocated at random for testing at 8, 12, and 20 per
cent. nominal moisture contents. The five specimens
within these groups were further allocated at random
for testing at - 15, 5, 20, 40, and 60° C.
g
co 2 3 4 5
II 12
9 10 6 7 8 e
co
14 15
Fig. 30. Preparation of glued joint specimens from 20 in. x 10 m. x t in. sheets
Details of the adhesives and setting conditions are given in Table 11.

40 REPORT ACA-46
TABLE 11
DETAILS OF ADHESIVES AND SETTING CONDITIONS
Type of Glue Tested
Casein Grasp No. 8
Urea-formaldehyde Beetle Cement H (Hot hardener No. 12)
Phenol-formaldehyde Tego glue film
4.2 EXPERIMENTAL PROCEDURE
In order to bring the specimens to equilibrium moisture content before testing, they were conditioned for some time in rooms at appropriate relative humidities. Owing to delay in the manufacture of special wedge grips needed for these tests, the conditioning period extended to about five months, during which time fungus attack reduced the high moisture content casein glued specimens to almost zero strength.
All tests were made at a loading rate of 750 lb./min. in the air-conditioned testing machine. Immediately
before testing, the specimens - were placed in the machine for an hour at the test temperature and at
a relative humidity adjusted to maintain their
equilibrium moisture contents.
4.3 RESULTS AND DISCUSSION
4.31 EFFECT OF TEMPERATURE ON SHEAR STRENGTH
At nearly all conditions, moisture content between temperatures was closely controlled. Nevertheless, linear corrections obtained from the results at the test moisture contents were applied to correct the individual shear strengths to 8, 12, and 18 per cent. moisture content at which it was desired to examine the temperature effects.
The corrected mean values of shear strength at the
Setting Conditions
Temperature Pressure Time Under (oC.) (lb./sq. in.) Pressure
Room 100 16} hr. tern per a ture
104 125 15 min.
138-149 125 15 min.
effect was highly significant, strength increasing with temperature. At 8 per cent. moisture content the trend deviated from linearity, at the 5 per cent. level only, strength increasing between 5° and - 15° C. The linear reg~ession coefficients of shear strength on temperature at the two moisture contents were not significantly different, their average value being 1.22 lb./sq. in. per °C.
The temperature effect was about half that reported for the preliminary tests (15 per cent. nominal moisture content), but five times the number of sheets were included in the present investigations
in order to reduce the effect of sheet-temperature interaction observed in the earlier experiments.
(b) Urea-foi·maldehyde.-The effect of temperature on the urea-formaldehyde joints varies with moisture content. At 8 per cent. and 12 per cent. moisture content the effect was not significant. At 18 per cent. moisture content, the linear component of the temperature effect was highly significant, strength decreasing on the average by 1 ·87 lb./sq. in. for one degree centigrade increase. The trend differed significantly from linearity (at the 5 per cent. level), strength decreasing more rapidly as temperature increased - above 20° C. The actual experimental means showed that although at 20 per cent. moisture content and 60° C. shear strength was 150 lb./sq. in. (or 18 · 7 per cent.) less than strength at 20° C. and the
various temperatures and moisture contents are same moisture content, it was little less than at plotted in Fig. 31. The corrected results were 8 per cent. moisture content and normal temperature.
analysed for temperature effects. (c) Phenol-formaldehyde.-Analysis of the results for
(a) Casein.-On casein bonded jomts at 8 per cent. the phenol-formaldehyde bonded joints sh9wed the and 12 per cent. moisture content, the temperature temperature effect to be non-significant at 8 per cent.
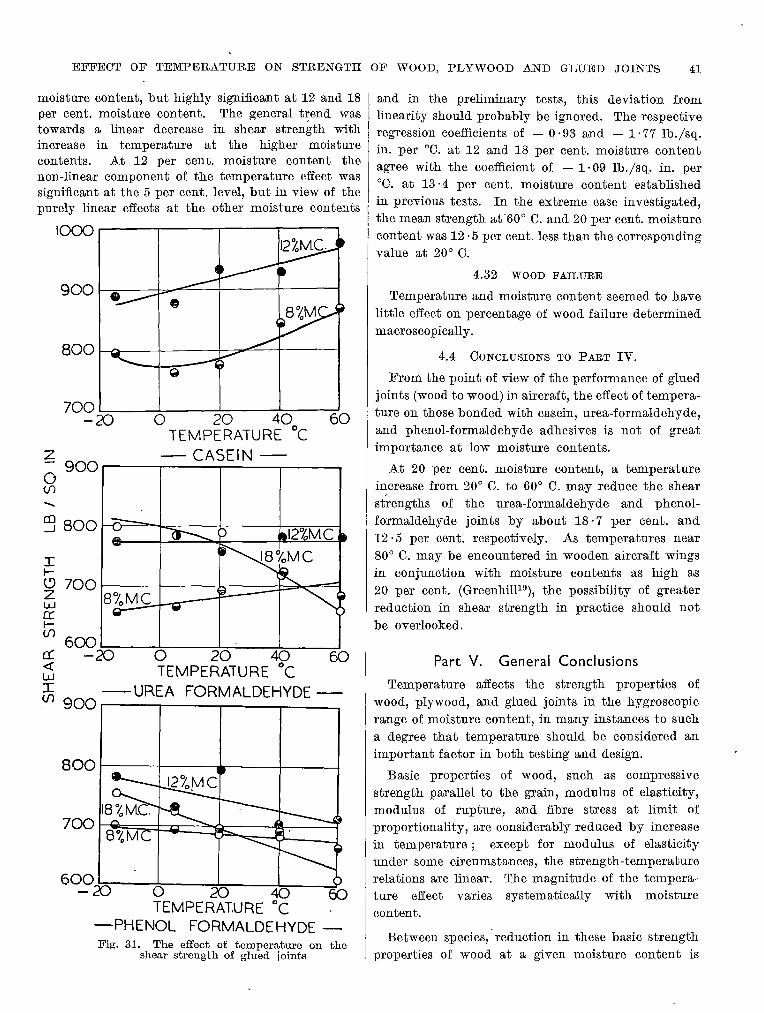
EFFEC'l' OF TEMPERATURE ON STRENGTH OF WOOD, PLYWOOD AND GLUED JOINTS 41
moisture content, but highly significant at 12 and 18 per cent. moisture content. The general t~end was towards a linear decrease in shear strength with increase in temperature at the higher moisture contents. At 12 per cent. moisture content the non-linear component of the temperature effect was significant at the 5 per cent. level, but in view of the purely linear effects at the other moisture contents
z 0 (j)
.......
co ....J
700 -20 0 20 40 60
TEMPERATURE °C
900 -CASEIN-
800
600 - 20t:::----:!:o::-----:20o!=--__,40J.,,,._ _ _;,-
TEMPE RA TU RE °C ~PHENOL FORMALDEHYDE Fig. 31. The effect of temperature on the
shear strength of glued joints
and in the preliminary tests, this deviation from linearity should probably be ignored. The respective regression coefficients of - O · 93 and - 1·77 lb./sq. in. per 0 0. at 12 and 18 per cent. moisture content agree with the coefficient of -1·09 lb./sq. in. per 0 0. at 13 ·4 per cent. moisture content established in previous tests. In the extreme case investigated, the mean strength at-60° C. and 20 per cent. moisture content was 12 · 5 per cent. less than the corresponding value at 20° C.
4.32 WOOD FAILURE
Temperature and moisture content seemed to have little effect on percentage of wood failure determined macroscopically.
4.4 CONCLUSIONS TO PART IV.
From the point of view of the performance of glued joints (wood to wood) in aircraft, the effect of temperature on those bonded with casein, urea-formaldehyde, and phenol-formaldehyde adhesives is not of great importance at low moisture contents.
At 20 per cent. moisture content, a temperature increase from 20° C. to 60° C. may reduce the shear st~engths of the urea-formaldehyde and phenolformaldehyde joints by about 18 · 7 per cent. and 12 ·5 per cent. respectively. As temperatures near 80° C. may be encountered in wooden aircraft wings in conjunction with moisture contents as high as 20 per cent. (Greenhill19 ), the possibility of greater reduction in shear strength in practice should not be overlooked.
Part V. General Conclusions
Temperature affects the strength properties of wood, plywood, and glued joints in the hygroscopic range of moisture content, in many instances to such a degree that temperature should be considered an important factor in both testing and design.
Basic properties of wood, such as compressive strength parallel to the grain, modulus of elasticity, modulus of rupture, and fibre stress at limit of proportionality, are considerably reduced by increase in temperature ; except for modulus of elasticity under some circumstances, the strength-temperature relations are linear. The magnitude of the temperature effect varies systematically with moisture content.
Between species, -reduction in these basic strength properties of wood at a given moisture content is

42 REPORT ACA-46
reasonably proportional to the value of the corresponding property at 20° C. and the same moisture content. This proportional similarity between the effect of temperature on the various species investigated has made possible the derivation of generalizations from which, at any given moisture content within the scope of these investigations, the effect of temperature on any species may confidently be calculated from knowledge of the strength value at one temperature and the given moisture content. Such general relations have been derived for each of the above-mentioned basic properties. The relation for maximum crushing strength may possibly apply to all usual sizes of test specimens, and that for modulus of elasticity to other specimen sizes and types of test. On the contrary, the relations for modulus of rupture and <fibre stress at limit of proportionality in static bending are not independent of specimen size.
The effect of temperature on toughness varies considerably with species, moisture content and temperature range. Increase or decrease in toughness with increasing temperature in some instances is very large ; but in the range of temperature and moisture content investigated there appears to be no toughness value much below that existing for the same species at normal temperature and some moisture content in the range. However, for some species, there is a trend at high moisture contents and low temperatures towards a reduction in toughness, which might suggest serious weakening at either higher moisture contents or lower temperatures than those investigated. Variation in toughness with temperature is partly explainable in terms of deflection to failure, which in (static) bending varies considerably between spe_cies and moisture contents.
The maximum crushing strength of wet wood tested parallel to the grain is reduced at high temperatures, the effect between species here also being proportional to strength ; below freezing point it is more than proportionally increased.
.Although the shear strength of solid wood decreases linearly with increasing temperature at the one moisture content investiga~ed, the shear strength of glued joints is not affected to the same extent and may even increase with temperature.
Tensile strength of plywood at 45° to the grain of the outer plies is reduced by both rising temperature and moisture content, the reduction being serious
when both are high. In directions parallel and perpendicular to the grain, the effect of temperature on tensile strength varies considerably with temperature and moisture content ; but the only serious reduction below normal strength occurs at very high temperatures and moisture contents, which are attained only in special circumstances ; for example in aircraft exposed to solar radiation in hot humid climates.
Modulus of elasticity of plywood in tension is reduced by increase in temperature, except possibly at zero moisture content where the only effect appears to be a slight reduction parallel to the grain. For the parallel and perpendicular directions between 8 and 20 per cent. moisture content, the temperature effect as a percentage of strength at 20° C. is similar for solid wood of the same species in static bending. For the 45 ° direction, the effect is proportionately greater.
Maximum crushing strength of plywood parallel to the gram is reduced linearly with increase in temperature. On a proportional basis the effect compared with that 'for solid wood of the same species is identical at zero moisture content and only little less at higher moisture contents. For the perpendicular and 45° directions there is a somewhat similar effect above about 16 per cent. moisture content, but below this the efTect appears , to be curvilinear. .At zero moisture content there is no effect at 45° to the grain direction.
.As a result of these investigations, a standard temperature has been adopted in mechanical testing. Greater accuracy in testing and less scattering of results should follow. Uncertainty in results arising from neglect of temperature effects will be appreciated when it is realized that for a seasoD:al change in temperature from 15 to 40° C. similar tests may yield results differing by some 25 per cent.
Design uncertainty may be even more marked, as under certain conditions of exposure to solar radiation, temperatures well above ambient may be eneountered . There is a natural tendency for wood to dry at high temperature, thus compensating for any weakening effect due to temperature rise ; but there will be instances, among them, that of the aircraft wing, for which high temperature and high moisture content may co-exist. In this connection, reference is again made to Greenhi1119 who found that an exposed wooden aircraft wing in a tropical location may

EFFECT OF TEMPERATURE ON STRENGTH OF WOOD, PLYWOOD AND GLUED JOINTS 43
reach at least 20 per cent. moisture content simultaneously with temperatures of 80° C. in its upper portion and 50° C. in its lower.
The magnitude of the temperature effects was confirmed in a general manner by experiments conductP.d at the Division of Aeronautics (Bailey and Richards20 ). In tests on a number of " Oxford" type aircraft tailplanes loaded to failure at normal
temperature, and on others after irradiation sufficient to bring the top-skin to approximately 82° C., the
loss of strength at the higher temperature was about
50 and 42 per cent. respectively at nominal moistme
contents of 15 and 20 per cent. Heating also reduced
the initial slope of the load-deflection curves from
973 to 793 lb.fin. and from 1,000 to 880 lb.fin. at
the respective moisture contents.
The present mvestigations could, with advantage,
be extended to other species, properties and specnnen
sizes, and to other types of plywood and glued joints.
At the same time, the quantitative information
derived is sufficiently extensive to indicate the general natme and magnitude of temperature effects
to be expected and, m a number of mstances, to
permit satisfactory estimation of these effects over a wide ran~e of moistme content and temperature.
Acknowledgments
The author wishes to acknowledge the assistance
given by the staff of the Division of Forest Products,
in particular by the Section of Timber Physics and
by its former Officer-in-Charge, W. L. Greenhill, who
initiated the investigations and by H. B. Wilson, now of the Victorian Department of Agriculture,
in translation of literature ; also by E. J. Williams and Miss N. Ditchburne of the Section of Mathematical
Statistics in statistical analyses.
References
Sulzberger-The effect of temperature on the strength properties of wood, plywood, and glued joints. J. Coun. Sci. Ind. Res. (Aust.), 16, (4):
263-265, 1943.
3. Greenhill-Strength tests perpendicular to the grain of timber at various temperatures and moisture contents. J. Coun. Sci. Ind. Res. (Aust.), 9, \ (4): 265-276, 1936.
4. Tiemann-Effect of moisture upon the strength and stiffness of wood. United States Forest
.Service, Bulletin 70, pages 120-122, 1906.
5. George-Effect of low temperature on the strength
of wood. New York .State College of Forestry,
.Syracuse, New York, Tech. Publication No. 43, 1933.
6. Vorreiter-Biege- 1tnd Druckfestigkeit gefrorenen
Fichtenholzes Tharandter forstl. Jrb. 89 : 491-
510, 1938.
7. M1yai and Ashawar-Experiments in the bending strength of frozen wood. Research Bulletin, Hokkaido Imperial University, .Sapporo, Japan. (Text in Japanese.)
8. Thunell-The effect of temperature on the bending strength of .Swedish pinewood. .Statens Provningsanstalt, .Stockholm. Meddelande 80, 1940. Abst. Empire Forestry Journal, 19: 309, 1940.
9. Thunell-Die Festigkeitseigenschaften schwedischen Kiefernholzes. Ing. Vetensk. Akad., Handl. 161: 1-45, 1941; Holz als Roh- und Werkstoff, 5 (1942) : 287. Abst. Forestry Abstracts 4 (1943) : 232.
10. Kollmann-Die mechanischen Eigenschaften verscheiden feuchten Holzer im Temperaturbereich von - 200 bis + 200° C. V.D.I. Forschungsheft 403, pages 1-17. 1940.
11. American Society for Testing Materials-Standard Methods of Testing .Small Clear Specimens of Timber. D.143-27, 1927; D.143-50, 1950.
12. Markwardt and Wilson-Strength and related properties of woods grown in the United .States. United .States Department of Agriculture, Tech. Bulletin 479, 1935.
13. Hutte-Des Ingenieurs Taschenbuch, 26 Auft., Berlin. (Ernst u. Sohn), page 890, 1936.
2. British Commonwealth Timber Mechanics Con- 14. Stamm-Calculations of the void volume in wood.
ferenr,e, Ottawa, 1948. Indust. Engng. Chem., 30: 1280-81, 1938. '

REPORT ACA-46
15. British Standards Institution-Methods of Testing Small Clear Specimens of Timber. B.S.S. No. 373, 1938.
16. Standards Association of Australia-Timber for Aircraft Construction. Emergency Series, No. (E)CD.800, 1944.
17. Great Britain, Air Ministry-Material Specification for Sitka Spruce or Approved Substitutes (as
used in Aircraft Parts). Standard Specification for Aircraft Material. D.T.D. 36B. 1939.
18. Standards Association of Australia-Australian Standard Specification for Aircraft Materials No. (E)2D: 804. Plywood. 1943.
19. Greenhill-Temperatures ancl rnoisture contents attained by wooden aircraft in service in Australia. Aust. Coun. for .Aeronautics, Report ACA-23. 1946.
20. Bailey and Richards-The effect of temperature on the strength of wooden aircraft struct1tres. Coun. ~ci. Ind. Res. (Aust.), Div. Aero. Report SM.95. 1947.
Postal Address: AERON"AUTICA~ RESEARCH CONSULTATIVE COMMITTEE, AERONAUTICAL RESEARCH LABORATO.RlES,
Box 4331, G.P.O., MELBOURNE, AUSTRALIA.