aeronautics space report - nasaaeronautics and space report of the president the national...
TRANSCRIPT
Aeronauticsand
Space Reportof the
President
Fiscal Year2001
Activities
Aeronautics and Space Report of the President • Fiscal Year 2001 Activities
NP-2000-10-259-HQ
NationalAeronautics andSpace Administration
cover.308 3/20/03 3:26 PM Page 1
aAeronautics
andSpace Report
of the President
Fiscal Year2001
ActivitiesNational Aeronautics
and Space Administration
Washington, DC 20546
Fi
sc
al
Y
ea
r
19
97
A
ct
iv
it
ie
s
2001 report 3/20/03 3:25 PM Page a
b
Ae
ro
na
ut
ic
s
an
d
Sp
ac
e
Re
po
rt
o
f
th
e
Pr
es
id
en
t
The National Aeronautics and Space Act of
1958 directed the annual Aeronautics and
Space Report to include a “comprehensive
description of the programmed activities and the
accomplishments of all agencies of the United
States in the field of aeronautics and space
activities during the preceding calendar year.”
In recent years, the reports have been prepared
on a fiscal-year basis, consistent with the
budgetary period now used in programs of the
Federal Government. This year’s report covers
activities that took place from October 1, 2000,
through September 30, 2001.
2001 report 3/20/03 3:25 PM Page b
Fi
sc
al
Y
ea
r
20
01
A
ct
iv
it
ie
s
cTABLE OF CONTENTS
National Aeronautics and Space Administration . . . . . . . . 1Department of Defense . . . . . . . . . . . . . . . . . . . . . . . . . . 29Federal Aviation Administration . . . . . . . . . . . . . . . . . . . . 33Department of Commerce . . . . . . . . . . . . . . . . . . . . . . . . 47Department of the Interior . . . . . . . . . . . . . . . . . . . . . . . . 71Federal Communications Commission . . . . . . . . . . . . . . . 85Department of Agriculture . . . . . . . . . . . . . . . . . . . . . . . . 87National Science Foundation . . . . . . . . . . . . . . . . . . . . . . 95Department of State . . . . . . . . . . . . . . . . . . . . . . . . . . . . 101Department of Energy . . . . . . . . . . . . . . . . . . . . . . . . . . 103Smithsonian Institution . . . . . . . . . . . . . . . . . . . . . . . . . . 109Appendices . . . . . . . . . . . . . . . . . . . . . . . . . . . . . . . . . . . 113
A-1 U.S. Government Spacecraft Record . . . . . . . . . . . . . . . . . . . . . . . . . . . . . . . . 114
A-2 World Record of Space Launches Successful in
Attaining Earth Orbit or Beyond . . . . . . . . . . . . . . . . . . . . . . . . . . . . . . . . . . . 115
B Successful Launches to Orbit on U.S. Launch Vehicles,
October 1, 2000–September 30, 2001 . . . . . . . . . . . . . . . . . . . . . . . . . . . . . . 116
C U.S. and Russian Human Space Flights,
1961–September 30, 2001 . . . . . . . . . . . . . . . . . . . . . . . . . . . . . . . . . . . . . . . 120
D U.S. Space Launch Vehicles . . . . . . . . . . . . . . . . . . . . . . . . . . . . . . . . . . . . . . 139
E-1A Space Activities of the U.S. Government—Historical Budget Summary–
Budget Authority (in millions of real-year dollars) . . . . . . . . . . . . . . . . . . . . . . . . . . . . . 142
E-1B Space Activities of the U.S. Government—Budget Authority in Millions of
Equivalent FY 2001 Dollars (adjusted for inflation) . . . . . . . . . . . . . . . . . . . . . . . . . . 143
E-2 Federal Space Activities Budget . . . . . . . . . . . . . . . . . . . . . . . . . . . . . . . . . . . . 144
E-3 Federal Aeronautics Budget . . . . . . . . . . . . . . . . . . . . . . . . . . . . . . . . . . . . . . . 145
Glossary and Acronyms . . . . . . . . . . . . . . . . . . . . . . . . . 147
2001 report 3/20/03 3:25 PM Page c

Ae
ro
na
ut
ic
s
an
d
Sp
ac
e
Re
po
rt
o
f
th
e
Pr
es
id
en
t
d
2001 report 3/20/03 3:25 PM Page d
In FY 2001, NASA’s safety quest continued to build momentum. In the past year,
NASA continued its successful plan for reducing injuries to a rate of 0.75 occur-
rences per 100 workers, well below the goal specified by the President’s direction
arising from the Federal Worker 2000 Presidential Initiative. To continue this pos-
itive trend, NASA’s Centers are working to be certified under the Occupational
Safety and Health Administration’s Voluntary Protection Program (VPP). NASA
has set a goal for all of its Centers to be VPP certified. By the end of FY 2001, 2 of
the 10 Centers had been certified. NASA safety and mission assurance experts
provided assessment, oversight, and critical evaluation for NASA Space Shuttle
missions, International Space Station missions and operations, and NASA space-
craft missions. In addition, NASA conducted several focused assessments
including operational and engineering reviews of the Jet Propulsion Laboratory
microdevices laboratory and Unitary Wind Tunnel at the Ames Research Center;
a critical facilities maintenance assessment to determine the safety and mission
support posture of critical facilities across NASA; an assessment of X-37 safety and
mission assurance processes and design features; the United Space Alliance
Ground Operations workforce survey; and the Boeing Seal Beach onsite assess-
ment and review. NASA instituted an Aviation Safety Board to oversee aviation
safety programs. To strengthen the Agency’s safety and mission assurance capabil-
ities, NASA introduced the following two new tools: the Systems Analysis
Program for Hands-On Integrated Reliability Evaluations (SAPHIRE), a
Probabilistic Risk Assessment (PRA) software application developed for the
Nuclear Regulatory Commission, which now serves as the baseline PRA tool for
NASA; and the Process-Based Mission Assurance Web resource, which provides
Fi
sc
al
Y
ea
r
20
01
A
ct
iv
it
ie
s
1
NATIONAL AERONAUTICSAND SPACE ADMINISTRATIONNASA
2001 report 3/20/03 3:25 PM Page 1

NASA’s program managers with the framework to help build the right level of
safety and mission assurance activity into their program.
In the human space flight area, NASA successfully accomplished seven
Space Shuttle missions in support of complex International Space Station (ISS)
assembly operations during FY 2001. From the launch of STS-98 in February 2001
to the landing of STS-105 in August 2001, NASA flew five flights in six months,
maintaining a vehicle in orbit for more than one third of that time. The ISS had
its first permanent occupants in FY 2001, beginning with the launch of the
Expedition 1 crew aboard a Russian Soyuz rocket on October 31, 2000. The
Expedition 2 and 3 crews also began their stays on the ISS during FY 2001.
The STS-92 mission, which launched on October 11, 2000, was the 100th
Shuttle mission. For STS-92, during its 12-day mission to the ISS, all assigned
objectives to install the Zenith Z1 Truss structure and the third pressurized mating
adapter (PMA3) for use as a docking port on subsequent Shuttle missions were
completed. On flight day three, Japanese astronaut Koichi Wakata deftly maneu-
vered Discovery’s robotic arm to lift the Zenith Z1 Truss from the Shuttle’s payload
bay and berthed it to a port on the Unity connecting module. Inside Unity, pilot
Pam Melroy and crewmate Jeff Wisoff opened the hatch where the new truss was
attached and installed grounding connections between the framework and the
Station. Discovery’s five mission specialists performed a total of four extravehicular
activities (EVAs) during the STS-92 mission. The crew also successfully com-
pleted testing of the four control moment gyroscopes that will be used to orient the
ISS as it orbits Earth.
On November 30, 2000, the STS-97 mission was successfully launched. For
STS-97, an 11-day mission, the astronauts completed three spacewalks to deliver
and connect the first set of U.S.-provided solar arrays to the ISS, prepare a dock-
ing port for arrival of the U.S. Laboratory Destiny, install a sophisticated
instrumentation package to measure electrical potential surrounding the Station,
install a camera cable outside the Unity module, and transfer supplies, equipment,
and refuse between Endeavour and the ISS. The successful checkout of the
extravehicular mobility units (EMUs), the Simplified Aid for EVA Rescue
(SAFER) units, the Remote Manipulator System RMS, the Orbiter Space Vision
System (OSVS), and the Orbiter Docking System (ODS) were all completed
nominally. Also, the ODS centerline camera was installed smoothly.
Ae
ro
na
ut
ic
s
an
d
Sp
ac
e
Re
po
rt
o
f
th
e
Pr
es
id
en
t
2
2001 report 3/20/03 3:25 PM Page 2
The STS-98 mission launched on February 7, 2001. On STS-98, after dock-
ing to the ISS, Station and Shuttle crews opened hatches and unloaded supplies:
bags of water, a spare computer, cables to be installed inside the Station to power
up the Destiny Laboratory, and various personal items for the Station crew. The
U.S. Laboratory Destiny was successfully installed on the ISS using the RMS and
concurrent EVAs. Shuttle and Station astronauts also activated air systems, fire
extinguishers, alarm systems, computers, and internal communications, plus con-
tinued equipment transfers from the Shuttle to the Station. They also filmed
onboard scenes using an IMAX camera.
On March 8, 2001, the STS-102 mission launched at sunrise and carried
the second resident crew (Expedition 2) to the ISS, as well as the first Multi-
Purpose Logistics Module, Leonardo, full of supplies and equipment plus science
racks for transfer to the U.S. Laboratory Destiny. Joint operations between the
Shuttle and the Station crews resulted in unloading almost 5 tons of experiments
and equipment from Leonardo and packing almost 1 ton of items for return to
Earth. Discovery’s spacewalkers—James Voss, Susan Helms, Andrew Thomas, and
Paul Richards—set the stage for continued expansion of the Station by installing
a platform that will eventually be used to mount a Canadian-built robotic arm, the
Space Station Remote Manipulator System (SSRMS), to the Station on a future
mission. They also removed a Lab Cradle Assembly from Discovery’s cargo bay and
installed it on the side of the U.S. Lab Destiny, where it will form the base for the
SSRMS that was delivered on a mission in April 2001.
The STS-100 mission launched on April 19 and docked with the ISS 2 days
later. The advanced robotic arm, called Canadarm2, was attached to a pallet on
the outside of Destiny. It later was directed to “walk off” the pallet and grab onto
an electrical grapple fixture on the Lab, which would provide data, power, and
telemetry to the arm. Days later, the arm was used to hand off the cradle, on which
it rested inside Endeavour’s payload bay during launch, to the orbiter’s arm. The
exchange of the cradle from Station arm to Shuttle arm marked the first-ever
robotic-to-robotic transfer in space. Other crew activities during the mission
included attaching an ultra-high-frequency antenna on the outside of the Station
and, inside, calibrating the Space Vision System, an alignment aid for operating
the robotic arm, plus helping repair the Space Station’s treadmill and filming for
IMAX.
Fi
sc
al
Y
ea
r
20
01
A
ct
iv
it
ie
s
3
2001 report 3/20/03 3:25 PM Page 3
For STS-104, liftoff occurred on July 12, 2001. The primary mission goal
was to deliver the joint airlock Quest module to the ISS. This mission marked the
end of the second phase of Station assembly. After docking with the ISS on July
13, both Atlantis and ISS crews prepared for the planned three EVAs. In a series of
three spacewalks, the joint airlock module was attached to the Unity Node an
high-pressure gas tanks attached to the airlock. Both Station and Shuttle crews
checked out and activated the new Quest airlock, conducting a dry run before the
inaugural event. This mission was the first launch of the Block II Space Shuttle
Main Engine. Approximately a month later, on August 10, 2001, the STS-105
mission launched. Part of the mission was to bring the next resident crew,
Expedition 3, to the ISS and return Expedition 2 to Earth. The payload included
the Early Ammonia Servicer (EAS), to be installed on the outside of the ISS, and
Multi-Purpose Logistics Module (MPLM) Leonardo. During the time docked with
the ISS, crews unloaded 7,000 pounds of supplies, equipment, and science racks
from the MPLM Leonardo, storing it on the Space Station. This was the
second flight of the Leonardo to the ISS. Mission specialists completed the
first of two EVAs to install the EAS on August 16, 2001.
The Expedition 1 crew began their stay on the ISS in November 2000, fol-
lowing an October 31 launch (Flight 2R). The outfitting of the ISS continued
with the delivery of supplies via a Russian Progress supply vehicle (2P) in mid-
November. The STS-97 crew then launched on November 30, 2000, delivering
the first U.S. solar array and radiator (Flight 4A), the 11th flight in the ISS assem-
bly sequence. Next, the Expedition 1 crew received the 12th flight in the ISS
assembly sequence, 5A, the delivery of the U.S. Lab on STS-98 in February 2001.
This mission was followed by the third Russian Progress supply mission and the
13th ISS flight (3P) on February 25, 2001. The Station’s first permanent crew
spent more than 4 months on the ISS and supported four assembly and logistics
missions before the arrival of the Expedition 2 crew.
Increment 2 crew operations were initiated on STS-102, the premier
launch of the first Italian-made MPLM Leonardo (Flight 5A.1) on March 8. It was
the first docking with the ISS under U.S. Orbital Segment (USOS) attitude con-
trol and the first ISS crew rotation. On April 16, the Progress M-244 resupply ship
(3P) was jettisoned from the Service Module (SM) aft port, after having delivered
approximately 2 metric tons of goods and propellants, and conducted three reboost
maneuvers of the ISS. On April 19, 2001, STS-100 lifted off on ISS mission 6A
Ae
ro
na
ut
ic
s
an
d
Sp
ac
e
Re
po
rt
o
f
th
e
Pr
es
id
en
t
4
2001 report 3/20/03 3:25 PM Page 4
with a crew of seven (including one Russian) to deliver the second Italian-built
MPLM “Raffaello” and the Canadian space station remote manipulator system
“Canadarm2” to the ISS. The first Soyuz (crew return vehicle) exchange (2S) was
accomplished with an April 28 launch to provide the replacement Soyuz and
return the “spent” Soyuz TM-31 (2R) to Earth.
Following this mission, the fourth Progress logistics flight (4P) was
launched to the ISS on May 20. On July 12, STS-104 was launched with five
crewmembers on assembly mission 7A to conduct joint operations with the
Expedition 2 crew and, in three spacewalks, to install the Joint Airlock “Quest”
and outfit it with four high-pressure gas tanks.
As NASA has accelerated the transition from ISS development work into
operations, all elements for ISS assembly flight elements through 12A have been
delivered either to orbit (Node 1 Unity, the FGB, the first solar arrays, thermal
radiators, the Z1 Truss, Control Moment Gyros (CMG) attitude control systems,
PMA-1, 2, and 3, and the U.S. Laboratory, Destiny) or to KSC (the remaining
truss segments, communications system, integrated electronics, and the U.S.
Airlock). NASA determined that it is in the best interest of the Government to
concentrate resources on assembly planning, operations, and utilization readiness,
and on the on-orbit assembly of the ISS.
From an operational perspective, the communications systems with Mission
Control Center (MCC)-Houston, MCC-Moscow, and the U.S.-led international
control teams have been vigorously exercised as they worked anomaly resolution,
avoidance maneuvers, Soyuz and Progress dockings, and redocking tests at differ-
ent ISS ports, as well as ISS reboosts as required. Mission Control was officially
handed over to MCC-Houston after the 5A.1 mission in March 2001.
The establishment of a permanent human presence on the ISS created
remarkable opportunities for the Space Medicine Program. While traditional sup-
port continued for astronaut healthcare, medical certification, and Shuttle
medical operations, the space medicine emphasis at the Johnson Space Center
(JSC) shifted to worldwide long-duration operations, onorbit deconditioning
countermeasures, onorbit medical certification and intervention, and comprehen-
sive rehabilitation services postflight. In addition, the planning process was begun
to integrate exciting new capabilities such as the onorbit ultrasound to improve
both astronaut healthcare and research possibilities.
Fi
sc
al
Y
ea
r
20
01
A
ct
iv
it
ie
s
5
2001 report 3/20/03 3:25 PM Page 5
The Space Medicine Program successfully implemented many changes to
medical operations that included 24-hour-per-day medical support at multiple sites
such as JSC, the Kennedy Space Center (KSC), the Gagarin Cosmonaut Training
Center, and in Kazakhstan. Preflight, inflight, and postflight medical support was
provided for seven Shuttle missions and ISS Expeditions 1, 2, and 3. Preparation
for each mission included preflight medical screening, crew training on the use of
medical, exercise, and environmental monitoring hardware, cross-cultural and iso-
lation- coping techniques training, contingency medical procedures training,
medical kit preparation, strength and endurance physical training, and ground
crew mission-specific preparation.
Initial ISS support operations were conducted from Moscow utilizing an
integrated medical team approach developed between the Russian and U.S. sup-
port staff. The integrated medical team continued daily communication and
planning when flight control shifted to Houston during Expedition 2. All of the
ISS International Partners participated in multilateral flight crew certification and
in integrated flight readiness program reviews. An integrated catalog of all Russian
and U.S. medical systems and hardware was also developed.
The Crew Health Care System (CHeCS) comprised of the Environmental
Monitoring System, Health Maintenance System, and Countermeasure System
was launched and operationally deployed. Medical systems for ISS are unique in
that components of CHeCS can be commanded from the ground. These com-
mands can implement a verification of onorbit systems or initiate data downlink
operations. Data within JSC are transferred using a file transfer protocol server
with virtual private network (VPN) connectivity to MCC-Houston and JSC
Medical Lab facilities.
Medical services were enhanced with the implementation of an electronic
medical record, replacing the paper-based system in the flight medicine clinic.
Data are now automatically entered into the Longitudinal Study of Astronaut
Health (LSAH) database. The LSAH project provides data for evidence-based
decisionmaking for the development of selection standards and appropriate Earth
and space-based prevention and treatment capabilities within the Space Medicine
Program.
A critical new part of the Space Medicine Program is the physical training,
preflight conditioning, and postflight rehabilitation of the astronauts. The
Ae
ro
na
ut
ic
s
an
d
Sp
ac
e
Re
po
rt
o
f
th
e
Pr
es
id
en
t
6
2001 report 3/20/03 3:25 PM Page 6
Astronaut Strength, Conditioning, and Rehabilitation (ASCR) program was
implemented for long-duration ISS crewmembers. EVA-assigned crewmembers
received physical training specifically to address conditioning for the required task
of EVA. ISS crewmembers exercise activities were monitored and specific exercise
prescriptions uplinked weekly. As a result, ISS crewmembers returned to Earth
with acceptable performance margins to be able to exit the Shuttle with minimal
assistance. The postflight program is designed to return the astronauts to their
normal state of health while providing safety factors to prevent injury during their
rehabilitation.
Upgrading the onboard space medicine preventive, diagnostic, and treat-
ment capabilities is an ongoing process. Among many new developments this year,
an important concept was improving telepresence techniques to optimally utilize
Earth-based resources and expertise to extend crewmember capabilities. One
example this year was the development of procedures to use ultrasound techniques
to provide high-quality diagnostic imaging with nonmedical personnel. Using this
technique, onorbit crew can be guided by a remotely located flight surgeon and
Earth-based experts via the ISS telecommunications infrastructure.
It has also become clear that the crewmembers on long-duration missions
need considerable support for psychosocial considerations. Behavioral health pro-
grams were implemented in 2001 to support the ISS crewmembers and their
families. These support elements included cross-cultural training, cognitive self-
assessment, and fatigue self-assessment tools to enable maximum performance and
safety of the crew.
The primary goal of the Space Shuttle Safety Upgrade Program continued
to be the improvement of crew flight safety and situational awareness, protect
people both during flight and on the ground, and increase the overall reliability of
the Shuttle system. During FY 2001, NASA continued working on improving
existing Space Shuttle operational mission assurance and reliability through sev-
eral safety and supportability upgrade initiatives. To improve Shuttle safety, an
effort was initiated to proactively upgrade the Shuttle elements and keep it flying
safely and efficiently through FY 2012 and beyond to meet Agency commitments
and goals for human access to space. The suite of high- priority safety upgrades
included the Cockpit Avionics Upgrade (CAU), the Space Shuttle Main Engine
(SSME), Advance Health Management System (AHMS), Electric Auxiliary
Power Unit (EAPU), and the Solid Rocket Booster Advance Thrust Vector
Fi
sc
al
Y
ea
r
20
01
A
ct
iv
it
ie
s
7
2001 report 3/20/03 3:25 PM Page 7
Control system. CAU, which will enhance crew situational awareness and reduce
crew workload by providing automated control of complex procedures, is currently
underway. The EAPU would have replaced the hydrazine-powered units by using
battery-powered electric motors, but, due to technology development required
before initiating the implementation, this project was cancelled. In addition, the
Solid Rocket Booster Advance Thrust Vector Control upgrade, which if imple-
mented could replace the hydrazine-powered turbines, was delayed due to budget
constraints.
FY 2001 included the first flight of the upgraded SSME designated Block II
on the STS-104 flight. The Block II Maine Engine configuration included a new
Pratt & Whitney high-pressure fuel turbopump. The main modification to the
engine was the elimination of welds by using a casting process for the housing and
in integral shaft/disk with thin-wall blades and ceramic bearings. These changes
doubled the reliability of the engine. This modification should increase the
number of flights between major overhauls.
The operational character of the Space Shuttle Program places a significant
burden on NASA resources. Although “operational” by NASA standards, the Space
Shuttle requires significant specialized skills and facilities to maintain and operate at
appropriate safety levels. Over the past 6 years, NASA has reduced the annual oper-
ation cost of the Space Shuttle by almost 40 percent. NASA has already made
significant strides toward privatization of the Space Shuttle by completing a series of
contract consolidations. In 1997, NASA turned over daily operations of the Shuttle
to a jointly owned corporation called United Space Alliance (USA). During FY
2001, however, the Shuttle program still required about 1,800 highly skilled civil
service personnel to carry out the remaining Government operational and oversight
responsibilities. Additionally, for continued safe operations of the Space Shuttle
until the middle of the next decade, significant investments are required to maintain
Space Shuttle flight system and aging ground infrastructure assets.
The challenges to complete Space Shuttle privatization continued to be
centered on ensuring that safety is not compromised while at the same time
achieving further cost benefit to the Government. During FY 2001, NASA began
the current Space Shuttle privatization effort by chartering an internal task team
to perform a review and assessment of options for privatizing the Shuttle, devel-
oping screening criteria for all privatization options, and providing
recommendations on the best options to senior Agency officials.
Ae
ro
na
ut
ic
s
an
d
Sp
ac
e
Re
po
rt
o
f
th
e
Pr
es
id
en
t
8
2001 report 3/20/03 3:25 PM Page 8
In the area of space communications, NASA’s Space, Deep Space, Ground,
and Wide-Area Networks successfully supported all NASA flight missions and
numerous commercial, foreign, and other U.S. Government agency missions.
Included were the launch of ISS hardware, Mars Odyssey, Microwave Anisotrophy
Probe, Genesis, Artemis, and GOES-M. Emergency support of spacecraft anom-
alies were provided to Artemis, GOES, Solar and Heliospheric Observatory, Mars
Global Surveyor, Terra, Tropical Rainfall Measuring Mission, and Cassini. Other
support included the NEAR landing on the asteroid Eros, Deep Space-1 encounter
with comet Borrelly, Astro-D re-entry with impact in the Pacific Ocean, and
Landsat-4 end-of-life maneuvers.
The Consolidated Space Operations Contract (CSOC) completed its 33rd
month of a 5-year basic period of performance. Operations support continued at
Johnson Space Center, Jet Propulsion Laboratory, Goddard Space Flight Center,
Marshall Space Flight Center, and Kennedy Space Center.
Other significant activities included installation of Ka-Band uplink capa-
bility at Goldstone Deep Space Communications Complex to support the Cassini
mission; installation of 70-meter X-Band uplink capability at the Madrid, Spain,
and Canberra, Australia, stations; completion of the mechanical life extension
study for the Deep Space Network’s 70-meter antennas; automation of the 26-
meter antenna operations at Goldstone station; automation of the packet
telemetry processing facility that supports the Hubble Space Telescope; installa-
tion of a 5-meter Ka-Band antenna at Wallops Flight Facility to support flight
demonstrations; initiation of construction of a new 34-meter antenna at Madrid,
to be operational for the armada of spacecraft arriving at Mars in late 2003/early
2004; and preparations for the launch of TDRS-I and TDRS-J.
There were 18 U.S. Expendable Launch Vehicle launches in FY 2001.
Seven of the 18 launches were NASA-managed missions, 9 were Department of
Defense (DoD)-managed missions, and 2 were FAA-licensed commercial
launches. In addition, NASA flew one payload as a secondary payload on one of
the FAA-licensed commercial launches. The last launch of the fiscal year was a
NASA-managed launch from the Alaska Spaceport on Kodiak Island, the first
orbital launch from the new commercial Spaceport. There was one launch failure
this year. An FAA-licensed launch of the Orbital Sciences Corporation (OSC)
Taurus with a NASA secondary payload onboard did not achieve orbit due to a
launch vehicle first-stage failure.
Fi
sc
al
Y
ea
r
20
01
A
ct
iv
it
ie
s
9
2001 report 3/20/03 3:25 PM Page 9

NASA began a new Spaceport and Range Technology Development
Initiative to develop and demonstrate advanced spaceport and range technologies
to keep pace with the upgrades of current and the development of new launch
vehicles. This initiative was an outgrowth of an Administration interagency study
on the primary Federal launch ranges. The Kennedy Space Center is leading the
initiative. Throughout FY 2001, NASA continued to define potential
human/robotic exploration architectures and technologies through the efforts of
an interagency planning team. As reported in FY 2000, the Decadal Planning
Team (now known as the NASA Exploration Team or NEXT) focused upon sci-
ence-driven and technology-enabled capabilities for future applications and
destinations. These studies have changed the way NASA has approached explo-
ration, and, at the end of the fiscal year, NASA planned to continue them.
To tackle the many technical challenges, the HEDS Technology and
Commercialization Initiative (HTCI) was initiated following a 6-month program
formulation involving numerous NASA Enterprises, Field Centers, universities,
and companies. The focus of this initiative was to identify new concepts and
develop new technologies to enable the future human/robotic exploration and
commercial development of space. In February 2001, HTCI issued a Cooperative
Agreement Notice that yielded 152 proposals, from which 43 were recommended
for funding in May 2001. Unfortunately, however, a few months later, HTCI funds
were frozen, and then the funds were transferred to the ISS Program to cover
budget issues.
In lieu of HTCI as a means of implementing technology research in the
near term, efforts to foster development continued by cooperative interaction
among the NASA Enterprises and Centers. The cooperation encompasses a con-
tinuing specific focus in the Small Business Innovation Research (SBIR) and
Small Business Technology Transfer (STTR) programs. The SBIR/STTR programs
in the Advanced Programs Office are geared to support HEDS technology research
with focused topics in high-priority technologies. In addition, the programs have
been given a push in nontraditional research avenues via the Historically Black
Colleges and Universities (HBCU) outreach activity. This activity resulted in a
new STTR phase one contract in FY 2001 and is expected to generate additional
contracts in FY 2002. The HBCU research institutions represent a far underuti-
lized resource that could form a new approach toward meeting the HEDS
technology challenges.
10
Ae
ro
na
ut
ic
s
an
d
Sp
ac
e
Re
po
rt
o
f
th
e
Pr
es
id
en
t
2001 report 3/20/03 3:25 PM Page 10
In the space science arena, NASA successfully launched three spacecraft in
FY 2001: the 2001 Mars Odyssey, the Microwave Anisotropy Probe (MAP), and
Genesis. In addition, the many spacecraft already operating delivered a wealth of
scientific data.
The launch of Odyssey in April 2001 represented a milestone for space sci-
ence: the rebirth of the Mars program after the devastating losses of Mars Climate
Orbiter and Mars Polar Lander in late 1999. Odyssey was the first Mars mission
designed under the newly renovated Mars program, so naturally all eyes were
focused closely on this particular mission. From the beginning, the spacecraft oper-
ated beautifully, but the proof would not come until the spacecraft successfully
achieved Mars Orbit Insertion after the close of FY 2001.
In June 2001, NASA launched the Microwave Anisotropy Probe, a mission
designed to measure the temperature of the cosmic background radiation over the
full sky with unprecedented accuracy. This map of the remnant heat from the Big
Bang will provide answers to fundamental questions about the origin and fate of
our universe. Immediately after the end of FY 2001, MAP arrived safely at its per-
manent observing station at L2 Lagrange Point, some 1.5 million kilometers from
Earth, and scientists eagerly await the data it will deliver over its 2-year prime mis-
sion.
In August 2001, NASA launched a unique Sun-Earth Connection mission
called Genesis. Genesis is designed to collect particles of solar wind in an attempt
to answer two fundamental scientific questions: What is the Sun made of? Are the
Earth and other planets made of the same stuff? At the end of FY 2001, the space-
craft was on its million-mile journey toward the Sun.
NASA’s other orbiting spacecraft continued to deliver many new scientific
discoveries and fascinating images. The Hubble Space Telescope—now in orbit for
12 years—discovered a supernova blast in the early universe that greatly bolsters
the case for the existence of a mysterious form of “dark energy” pervading the uni-
verse. The concept of dark energy, which shoves galaxies away from each other at
an ever-increasing speed, was first proposed—and then discarded—by Albert
Einstein early in the last century. The Hubble discovery also reinforces the star-
tling idea that the universe only recently began to speed up.
The Near Earth Asteroid Rendezvous (NEAR) Shoemaker spacecraft
achieved an unprecedented feat in FY 2001. It conducted the first soft landing on
Fi
sc
al
Y
ea
r
20
01
A
ct
iv
it
ie
s
11
2001 report 3/20/03 3:25 PM Page 11
an asteroid following a year-long orbital mission at the asteroid Eros, during which
the mission returned enormous quantities of scientific data and images.
The Chandra X-Ray Observatory celebrated 2 years in orbit and continued
unlocking secrets of mysterious high-energy astrophysical events. Chandra
enhanced our understanding of black holes on many fronts. It took the deepest x-
ray images ever and found the early universe teeming with black holes, it probed
the theoretical edge of a black hole known as the event horizon, and it captured
the first x-ray flare ever seen from the supermassive black hole in the center of the
Milky Way.
The Submillimeter Wave Astronomy Satellite (SWAS) made news when a
stellar apocalypse yielded the first evidence of water-bearing worlds beyond our
solar system. The SWAS observations provided the first evidence that extra-solar
planetary systems contain water, an essential ingredient for known forms of life.
The Mars Global Surveyor continued to send back tens of thousands of sur-
face images over the past year that featured dust storms, dust devils, 3-D sand
dunes, a recent image of “the face,” and dark streaks that may have been caused by
dust avalanches. Other images revealed evidence of ground ice on Mars as recently
as 10 million years ago.
With more than 30 space science missions currently in operation, these
highlights represent only a fraction of the scientific discoveries and insights that
the Office of Space Science gained over the past year. At the end of FY 2001, the
Space Science Enterprise planned to launch seven new missions before the end of
2002, covering a wide variety of new scientific objectives.
FY 2001 was the most successful year to date for NASA’s Earth Science
Enterprise (ESE) in fulfilling its mission to develop a scientific understanding of
the Earth system and its response to natural and human-induced changes so as to
enable improved prediction of climate, weather, and natural hazards for present
and future generations. ESE’s unique vantage point of space allowed unprece-
dented global views of the Earth system’s atmosphere, land, oceans, ice, and life.
ESE combines space observations with airborne and in situ measurements, data
analysis, and modeling to conduct basic research and provide validated data prod-
ucts. In FY 2001, ESE more than doubled its output of top-rated scientific
discoveries compared to previous years. Together with its partners, ESE enhanced
the availability of Earth science results to decisionmakers, providing a sound, sci-
entific basis for economic investment and policy decisions. ESE’s strategic goals in
Ae
ro
na
ut
ic
s
an
d
Sp
ac
e
Re
po
rt
o
f
th
e
Pr
es
id
en
t
12
2001 report 3/20/03 3:25 PM Page 12
FY 2001 were to expand scientific knowledge by characterizing the Earth system,
disseminate information about the Earth system, and enable the productive use of
ESE science and technology in the public and private sectors.
On November 21, 2000, ESE successfully launched the Earth Observing-1
(EO-1) technology demonstration satellite, its first New Millennium Program mis-
sion. EO-1 included the world’s first space-based hyperspectral sensor. At
one-quarter the weight and one-third the cost of traditional Landsat satellites, EO-
1 demonstrated its ability to produce Landsat-like imagery at a fraction of the
mission costs. EO-1 flies in formation with the Earth Observing System Terra
(EOS-Terra) satellite, Landsat 7, and the joint U.S.-Argentina SAC-C satellite,
and has demonstrated the satellite constellation concept in which the combined
capabilities create a super-satellite. Once validated, several of the EO-1 technolo-
gies will be turned over to the private sector for commercial development.
Two international collaborations in FY 2001 provided new tools that should
allow policymakers and scientists to identify major sources of air pollution and to
track the movement of pollution globally. ESE and its partners tracked hazardous
smoke and smog around the globe using the Total Ozone Mapping Spectrometer
Earth Probe (TOMS-EP). By examining data from Indonesian and African fires in
1997, researchers discovered that smoke and smog move through the atmosphere
in different ways. In the second collaboration, ESE developed the most complete
view of the world’s air pollution using new observations from the Canadian
Measurements of Pollution in the Troposphere (MOPITT) instrument on the
Terra spacecraft. Analysis of the new data revealed that plumes of carbon monox-
ide travel across the world, and that air pollution therefore is not just a local issue.
Early warning of pollution events can help to mitigate their potentially hazardous
effects on human health.
ESE successfully conducted an international field experiment, the Transport
and Chemical Evolution over the Pacific (TRACE-P) airborne campaign. During
the 45-day campaign in March/April 2001, ESE scientists combined data collected
by two specially equipped NASA airplanes flying near Hong Kong and Japan with
satellite and ground station measurements. By studying the seasonal airflow from
Asia across the Pacific, researchers gained insight into the way in which natural
and human-induced changes affect our global climate and contributed to our
understanding of the dynamics of atmospheric chemistry.
Fi
sc
al
Y
ea
r
20
01
A
ct
iv
it
ie
s
13
2001 report 3/20/03 3:25 PM Page 13

Using 3 years of continuous, daily observations of ocean algae and land
plants from the Sea-viewing Wide Field-of-View Sensor (SeaWiFS) launched in
1997, ESE created the most comprehensive global biological record of the Earth
ever assembled. Researchers are using the record, which ESE plans to extend to 10
years or more, to study the fate of carbon in the atmosphere, the length of grow-
ing seasons, and the vitality of the ocean’s food web. Other uses include
monitoring the health of coral reefs, tracking harmful “red tides” and algae blooms,
and improving global climate models.
In FY 2001, ESE made advances in understanding seasonal to interannual
climate change. The Clouds and Earth’s Radiation Energy System (CERES)
instrument on the Terra spacecraft provided the most accurate and first complete
year of global radiation measurements. Using Terra’s ability to collect data twice
per day over the entire planet, the new measurements captured both incoming and
outgoing energy globally. The results from a second NASA-funded study suggested
that solar activity affects the jet stream over North America, possibly causing a
change in cloud cover patterns. In years of increased solar activity, more ultravio-
let radiation is absorbed by stratospheric ozone, which warms the stratosphere and
may affect circulation in the troposphere. Researchers found that the U.S. is on
average 2 percent cloudier in years of solar maximum. Understanding the links
between solar radiation, atmospheric chemistry, cloud cover, and atmospheric cir-
culation will help narrow the uncertainties in predictions of both weather and
future climate change. ESE and the Canadian Space Agency (CSA) completed
the second Antarctic Mapping Mission that was begun in FY 2000. By precisely
navigating the CSA’s RADARSAT-1 satellite to obtain data from six passes,
researchers created detailed topographic maps and were able to measure the speed
of moving glaciers. The first-ever velocity map of the Lambert Glacier revealed
that the ice stream reaches speeds of more than 1 kilometer per year. By compar-
ing the new map of Antarctica with the first map made in 1997, researches found
that some glaciers are retreating while others are advancing. The full map should
be completed in FY 2002. ESE researchers also monitored the development of a
crack 15 miles long in Antarctica’s Pine Island Glacier—evidence of the immi-
nent birth of a massive iceberg—using images from Landsat 7, Terra, CSA’s
RADARSAT, and the European Space Agency’s radar imager. These results are
giving scientists a better understanding of long-term change in the polar regions,
a very sensitive component of the Earth system.
Ae
ro
na
ut
ic
s
an
d
Sp
ac
e
Re
po
rt
o
f
th
e
Pr
es
id
en
t
14
2001 report 3/20/03 3:25 PM Page 14
Fi
sc
al
Y
ea
r
20
01
A
ct
iv
it
ie
s
15ESE was also highly successful in disseminating Earth science data and
information. The Earth Observing System Data and Information System
(EOSDIS) manages data from NASA’s past and current Earth science research
satellites and field measurement programs. The EOSDIS network was very suc-
cessful in FY 2001, distributing more data faster as the median product delivery
time was reduced to less than 1 day. EOSDIS distributed approximately 1.2 million
data products per month in response to approximately 150,000 user requests. In
addition, ESE conducted 482 workshops training K–12 teachers on Earth science
education products, reaching 9,295 educators (K–12). Schools participating in
Global Learning and Observation to Benefit the Environment (GLOBE)
increased to 13,800, and participating countries increased to 97.
Finally, FY 2001 was also a successful year for enabling productive use of
ESE science and technology. Using a newly developed 512-node Silicon Graphics,
Inc., supercomputer, ESE researchers simulated more than 900 days of the Earth’s
climate in 1 day of computer time. Previous capability had been limited to the sim-
ulation of 70 days. Researchers demonstrated experimental seasonal climate
predictions using ESE data sets from the TOPEX/Poseidon, SeaWiFS, TRMM, and
Terra satellites. The combination of a faster computer, more accurate climate
models, and the use of more global satellite observations will result in more accu-
rate prediction of climate change for policy makers.
To improve access to and understanding of remote-sensing data, ESE hosted
five workshops around the United States. The workshops demonstrated the use of
ESE science and technology to over 550 decisionmakers representing nearly every
state. A survey conducted during the workshops found that 35 percent of respon-
dents had never used satellite data. A follow-up survey after the workshops
demonstrated that the number fell to 20 percent.
In FY 2001, ESE worked to extend the benefits of remote sensing to policy-
makers in urban and rural areas. Researchers at the Mid-Atlantic Regional Earth
Science Applications Center produced more accurate and detailed maps of major
cities around the country using Landsat-7 data. These maps should help urban
planners studying city growth and how rainfall runoff over paved surfaces impacts
regional water quality. ESE also provided imagery from the EOS-Terra satellite to
the Rapid Response Project for tracking and combating wildfires in the Western
United States. Federal, State and local Governments, and firefighters used the
data to help mitigate this natural disaster. In a third effort, ESE created a com-
2001 report 3/20/03 3:25 PM Page 15
mercial partnership that will place advanced Global Positioning Satellite tech-
nologies in tractors, giving American farmers access to precision farming
technologies. Precision farming helps farmers use less water, fertilizer, and weed
control, reducing the environmental impacts of agriculture and increasing effi-
ciencies in food and fiber production.
Through a collaborative project with the Department of Defense, ESE con-
tinued to monitor and predict disease outbreaks in an effort to reduce their impact
on society. Using near-real-time satellite vegetation measurements and associated
climate data sets, scientists developed the capability to make predictions about
emerging Rift Valley Fever (RVF) epidemics in East Africa several months before
an outbreak occurs. Additionally, ESE investigators provided data support to the
Walter Reed Army Institute for Research during an RVF outbreak in Saudi Arabia
and Yemen.
In the area of aeronautics and aerospace technology, NASA's Office of
Aerospace Technology (OAT) continued to manage a portfolio of technology
development activities designed to improve air travel, making it safer, faster, and
quieter, as well as more affordable, accessible, and environmentally sound. It also
continued working to develop more affordable, reliable, and safe access to space;
improve the way in which air and space vehicles are designed and built; and ensure
new aerospace technologies are available to benefit the public.
In the area of aviation safety, there were a number of significant accom-
plishments. NASA demonstrated a “daisy-chain flight control allocation scheme,”
based on a second-generation neural flight control architecture applied to generic
transport aircraft simulation. The daisy-chain scheme utilizes remaining opera-
tional surfaces and the propulsion system in an unconventional manner (e.g.,
symmetric ailerons or symmetric throttles for pitch control and rudder or differen-
tial throttles for yaw-based roll control) in order to compensate for more severe
failures. These simulations showed that the system provided redundant control
power in the event of the loss of actuator control, additional control authority in
the event of actuator control saturation, and demonstrated ability to provide
improved handling qualities for severe failures in a reduced flight envelope that
would otherwise result in a catastrophic event.
The aviation safety program system selected design concepts that showed
the greatest promise for accident prevention in the areas of fire prevention, fire
detection, synthetic vision, and an integrated vehicle health management for con-
Ae
ro
na
ut
ic
s
an
d
Sp
ac
e
Re
po
rt
o
f
th
e
Pr
es
id
en
t
16
2001 report 3/20/03 3:25 PM Page 16
Fi
sc
al
Y
ea
r
20
01
A
ct
iv
it
ie
s
17tinued development. One of these, the tactical Synthetic Vision System (SVS) is
a technology that has the potential to eliminate low-visibility conditions as a
causal factor to civil aircraft accidents, as well as replicate the operational benefits
of flight operations on a clear, sunny day, regardless of the outside weather condi-
tion or time of day. Flight demonstration of conventional media head-up and
head-down tactical SVS display concepts intended for retrofit in commercial and
business aircraft were conducted over a three-week period in August and
September 2001. Seven evaluation pilots representing Boeing, the FAA, and three
major airlines conducted 11 research flights for a total of 106 airport approaches.
The concepts were evaluated in flight tests designed to evaluate pilot acceptabil-
ity/usability and terrain awareness benefits. Early results indicated that pilot
terrain awareness was higher when using the selected SVS display concepts com-
pared to present-day displays.
Studies have shown that 5 to 10 percent of rotorcraft accidents are the
result of gear failure and drive train failure. NASA personnel established design
guidelines to prevent catastrophic rim fractures. This work should enable ultra-safe
gears to be designed, eliminating nearly all catastrophic failure modes for light-
weight thin-rimmed aircraft gears. The model accurately predicts crack
propagation paths and has been validated using the NASA Gear Fatigue Test Rig.
During FY 2001, NASA developed the Collaborative Arrival Planner
(CAP) tool to exchange real-time air traffic control information with Airline
Operational Control (AOC) centers such that decisions made by AOCs regarding
their aircraft operations could be based on the most up-to-date information possi-
ble. This increased arrival prediction accuracy in the AOCs has enabled airlines
to make better decisions regarding flight diversions, gate utilization, and push-back
times, leading to improved operational efficiency and financial savings. In addi-
tion, an en route decision support tool for efficient, conflict-free routing was also
developed. The “Direct-to” (D-2) decision support tool underwent field testing in
the Fort Worth Air Route Traffic Control Center. The D-2 controller tool identi-
fies aircraft that can save flight time by flying directly to a down-stream fix along
its route of flight. This technology has demonstrated the ability to save several
minutes per flight, with commensurate reductions in fuel consumption and emis-
sions. Finally, NASA personnel developed and flight tested an Air Traffic Control
(ATC)/cockpit information exchange capability. Software tools that support deci-
sionmaking by ATC require an ability to accurately predict future aircraft positions
2001 report 3/20/03 3:25 PM Page 17
during flight. To perform long-range trajectory predictions, Center TRACON
Automation System (CTAS) relies on the availability of aircraft state, aircraft per-
formance, flight plan intent, and atmospheric data. The ATC/cockpit information
exchange successfully demonstrated the capability to downlink aircraft state and
intent information from the cockpit directly to CTAS by means of a real-time air-
to-ground data link. A comparison of climb predictions at 15,000 feet to actual
radar tracks showed that the direct downlink predictions reduced the peak altitude
error by over 3,000 feet from the standard system.
NASA continued conducting a balanced effort at making major advances
in aircraft noise reduction. Previously, NASA had demonstrated technologies that
resulted in a 5-decibel reduction in aviation noise. In FY 2001, researchers tested
additional technologies including a Pratt & Whitney 4098 engine and improved
inlets. NASA personnel also conducted tests to separate and assess core noise.
Airframe noise-reduction concepts (flap edge, slat cove, flap and slat trailing edge
treatments, and landing gear modifications) were validated on the Subsonic
Technology Assessment Research model, a detailed 26 percent Boeing 777, which
was tested in the 40 x 80-foot tunnel at NASA’s Ames Research Center. Two flight
tests were conducted to validate engine system noise reduction. A “chevron”
nozzle and other jet noise-reduction concepts were validated on a Lear 25, and
both jet and fan noise-reduction concepts were validated on a Falcon 20.
A system analysis of the test results demonstrated an additional 2-decibel
reduction for large transport aircraft and 3 decibels for regional and business classes
of aircraft.
In the area of technology innovation, NASA set a new world altitude
record for a solar-powered aircraft, reaching an altitude of 96,863 feet on August
13, 2001 from the U.S. Navy’s Pacific Missile Range Facility (PMRF) on the
Hawaiian island of Kaua’i. Although short of the 100,000-foot altitude that proj-
ect officials hoped for, the altitude is the highest ever flown by a
nonrocket-powered aircraft in sustained horizontal flight and well above the cur-
rent world altitude record of 85,068 feet for sustained horizontal flight by a
conventional aircraft, set by a U.S. Air Force Lockheed SR-71A reconnaissance
aircraft in July 1976. It also surpassed the existing altitude record for propeller-
driven aircraft, 80,201 feet, set by the Helios Prototype’s predecessor, the
Pathfinder-Plus, in August 1998. The 96,863-foot record altitude remains unoffi-
cial, however, until certified by the Fédération Aéronautique Internationale.
Ae
ro
na
ut
ic
s
an
d
Sp
ac
e
Re
po
rt
o
f
th
e
Pr
es
id
en
t
18
2001 report 3/20/03 3:25 PM Page 18
Fi
sc
al
Y
ea
r
20
01
A
ct
iv
it
ie
s
19The Helios Prototype flew for more than 40 minutes above a 96,000-foot
altitude before beginning its descent. It was in the air for almost 17 hours on the
record flight, having lifted off the PMRF runway at 8:48 a.m. and landing at 1:43
a.m. the following morning after a 9.5-hour descent. Electrical power for post-
sunset flight was provided by the generating capability of the motors using the
windmill effects of the propellers as the aircraft glided down.
Production variants of Helios might see service as long-term Earth envi-
ronmental monitors, disaster monitoring, as well as communications relays,
reducing dependence on satellites and providing service in areas not covered by
satellites. The record altitude flight also provided NASA and AeroVironment
with information on how an aircraft would fly in a Mars-like atmospheric condi-
tion, since the atmosphere at that altitude above the Earth is similar to the
atmosphere near the Martian surface.
Another aircraft mission was not as successful. The X-43A is designed to be
the first scramjet-powered vehicle, capable of attaining speeds as high as Mach 10.
The X-43A mission on June 2, 2001 was lost moments after the X-43A and its
launch vehicle were released from the wing of the NASA B-52 carrier aircraft.
Following launch vehicle ignition, the combined launch vehicle and X-43A expe-
rienced structural failure, deviated from its flight path, and was deliberately
terminated. A Mishap Investigation Board (MIB) was immediately formed and
began conducting a thorough review of the failure. The MIB results were released
in April 2002 and will be addressed prior to scheduling the next X-43 flight.
With the cessation of the X-33 and the X-34 programs, the Aerospace
Technology Enterprise has taken a new approach toward developing reusable
launch vehicle (RLV) technologies to enable the eventual routine access to space.
This effort is called the Second-Generation RLV Program. In FY 2001, NASA
awarded contracts valued at $767 million to 22 contractors, including large and
small companies, to allow maximum competition. The money will be used to
develop concepts and the technologies needed to pioneer this extraordinary effort,
which is expected to make the vehicle at least 10 times safer and crew survivabil-
ity 100 times greater, all at one-tenth the cost of today’s space launch systems.
At the beginning of FY 2001, NASA created the Biological and Physical
Research Enterprise (BPR) to strengthen NASA’s interdisciplinary program of
research in space. As humans make the first steps off Earth and into space, we
enter a new realm of opportunity to explore profound questions, new and old,
2001 report 3/20/03 3:25 PM Page 19
about the laws of nature. At the same time, we enter an environment unique in
our evolutionary history that poses serious physiological, psychological, and envi-
ronmental challenges. NASA’s Biological and Physical Research Enterprise
addresses the opportunities and challenges of space flight through basic and
applied research on the ground and in space. BPR seeks to exploit the rich oppor-
tunities of space flight for fundamental research and commercial development,
while conducting research to enable efficient and effective systems for protecting
and sustaining humans in space.
The Biological and Physical Research Enterprise (BPRE) closed its first
fiscal year with a significant record of accomplishment. The Enterprise initiated a
program of research on the International Space Station to take advantage of avail-
able resources during the construction phase, released three NASA research
announcements, and strengthened its research investigator community.
BPR established a new Memorandum of Understanding with the U.S.
Department of Agriculture, conducted a joint research solicitation with the
National Cancer Institute, and continued work under 18 other agreements with
the National Institutes of Health. In a truly auspicious sign of things to come, a
BPRE investigator received the Nobel Prize in physics for ground-based research
that he plans to extend and expand on the International Space Station.
FY 2001 also included major efforts to restructure International Space
Station research. These efforts respond to substantial reductions in available budg-
ets for research equipment (facilities), support, and operations. In addition, BPR
continued working to address potential reductions in available onorbit resources
for research. While this restructuring is of central importance for the future of ISS
research, it did not materially affect resources necessary for executing BPR’s
planned research program in fiscal year 2001.
ISS outfitting for research began with the delivery of the Human Research
Facility in March 2001. NASA delivered two research equipment racks in mid-
April and an additional two at the beginning of Expedition 3 in August 2001. At
the end of the fiscal year, the Agency is on track to deliver another five research
equipment racks by the end of 2002. Despite underestimation of Station mainte-
nance requirements and a greater-than-expected volume of “off-normal” activities
during Expeditions 1 and 2, the ISS team was able to meet the minimum research
objectives of these increments.
Ae
ro
na
ut
ic
s
an
d
Sp
ac
e
Re
po
rt
o
f
th
e
Pr
es
id
en
t
20
2001 report 3/20/03 3:25 PM Page 20
The Expedition 1 crew initiated a small number of U.S. research activities,
including crew Earth observations, the Educational SEEDS experiment (plant
growth in microgravity), biological crystal growth (structural biology), space tech-
nology motion and vibration experiments, and human research baseline data
collection.
With Expedition 2, completed in July, the research program on the ISS was
underway. Eighteen experiments were conducted. The Expedition focus was on
biomedical research and included studies of biological effects of space radiation,
characterization of the ISS radiation environment, bone loss and spinal cord
response during space flight, and interpersonal influences on crewmember and
crew-ground interactions. Other experiments included plant germination and
growth; Earth observations; and experiments aimed at resolving the exact struc-
tures of important biological molecules.
Research on Expedition 3 included 8 new and 10 continuing experiments.
New Expedition 3 experiments included investigation of the mechanism that
causes space travelers to suffer from dizziness and an inability to stand on return-
ing to Earth (a condition called orthostatic intolerance); a study of heart and lung
function in space and as affected by spacewalks; a study of the risk factors associ-
ated with kidney stone formation during and after space flight; new techniques for
structural biology in space; and a study of materials passively exposed to the space
environment around the ISS to better define changes in material properties and
onorbit degradation trends.
Research results from the ISS will be forthcoming as data are collected and
analyzed. Results reported in FY 2001 based on earlier research missions and
ground-based experiments support continued progress in understanding and con-
trolling the negative effects of space travel.
Research published in 2001 suggests that the human brain contains an
internal model of gravity and that this model may be very difficult or potentially
even impossible to “unlearn.” (Nature Neuroscience, 4, 693–694, 2001).
Astronauts quickly adjust to many of the challenges of orientation and movement
associated with space flight, but the new results suggest there may be limits to this
adaptability. Astronauts attempted to catch a “falling” object moving at different
constant speeds. The test subjects proved unable to adjust to the fact that such
objects do not “fall” faster and faster in space. The expectation that a “falling”
Fi
sc
al
Y
ea
r
20
01
A
ct
iv
it
ie
s
21
2001 report 3/20/03 3:25 PM Page 21
object would accelerate proved impossible to unlearn over the course of this brief
experiment. This experiment raises the possibility that the nervous system may
contain a “hardwired” model of gravity. If confirmed, this would be a fundamental
discovery that could influence medical treatments for people with damaged or
impaired nervous systems. In addition, this finding has important implications for
the design of safe and efficient environments and systems for human space flight.
In what may be a breakthrough for astronauts and osteoporosis victims alike,
researchers were able to prevent bone loss using mild vibrations (FASEB J, October
2001). Normally, rats lose bone when their hind limbs are suspended and no longer
support the weight of the body. BPRE researchers were able to counteract this bone
loss by exposing the rats to mild vibrations. This study opens the door to a new
method for controlling the 1% per month loss of bone that astronauts experience in
space, and clinical studies are planned to determine the usefulness of vibration for
treating or preventing osteoporosis on Earth.
In addition to research aimed at controlling the physical challenges of space
flight, BPR exploits the space environment to conduct unique experiments in physics,
chemistry, and biology that would be impossible to conduct on Earth. A broader pro-
gram of ground-based research supports research progress in space and develops new
hypotheses for testing.
2001 was a banner year for BPRE basic physics research. Early in the year,
BPRE researchers reported that they had “brought light to a full stop, held it, and then
sent it on its way.” (Physical Review Letters, January 29, 2001, Vol. 86, Issue 5).
Researchers used lasers they developed under BPRE funding to bring a beam of light
to a complete stop in a specially designed trap, and then released it again.
Another team of BPRE researchers created a gas cloud riddled with tiny
whirlpools like those that cause “starquakes.” (Science, Vol. 292, No. 5516, 20 April
2001). The researchers used an ultra-cold cloud of sodium gas and quantum effects to
create a physical model of phenomena that take place deep inside distant stars.
The importance of this kind of low-temperature physics research was rein-
forced at the end of 2001 when Dr. Ketterle was awarded the Nobel Prize in physics
for his seminal BPRE-funded work on Bose-Einstein Condensate, a new state of
matter in which individual atoms merge into each other.
These experiments represent substantial milestones in physicists’ quest to study
quantum phenomena (physical phenomena that are ordinarily only observable at
Ae
ro
na
ut
ic
s
an
d
Sp
ac
e
Re
po
rt
o
f
th
e
Pr
es
id
en
t
22
2001 report 3/20/03 3:25 PM Page 22
microscopic scales) in macroscopic systems. This research could have far-reaching
implications for the future of information and communication technologies.
In biotechnology research, a research group at the Massachusetts Institute of
Technology grew heart tissue with “significantly improved” structural and electro-
physiological properties using NASA bioreactor technology (Journal of
Physiology-Heart and Circulatory Physiology, Jan. 2001). Unlike tissue grown using
more conventional technology, the tissue grown in the NASA bioreactor was actu-
ally made to beat like native heart tissue. The NASA bioreactor allows researchers to
grow tissues in the laboratory that much more faithfully reproduce the properties of
natural tissues in the body. These tissues allow researchers to explore mechanisms of
disease and may ultimately improve processes for creating engineered tissue for use in
treatment and transplant.
Twenty-four cell cultures, including colon, kidney, neuroendocrine, and ovar-
ian cell cultures, were grown aboard the ISS in 2001. This represents our first
opportunity to use a sophisticated bioreactor to grow cells in space. Bioreactor cell
growth in microgravity permits cultivation of tissue cultures of sizes and quantities not
possible on Earth. Cells may grow in low gravity more like they grow in the human
body, increasing research capability in areas pertinent to the study of human diseases.
BPR provides knowledge, policies, and technical support to facilitate industry
investment in space research. BPR enables commercial researchers to take advantage
of space flight opportunities for proprietary research. FY 2001 included continued
growth in the number of commercial partners participating in the program and an ini-
tial set of 5–6 experiments conducted aboard the ISS.
In fiscal year 2001, StelSys (a joint venture of FVI and In Vitro Technologies)
signed an agreement with NASA to explore commercial applications of bioreactor
technology research specifically in areas related to biological systems.
Bristol-Myers Squibb and the Center for BioServe Space Technologies
reported that production of antibiotics is substantially greater in microgravity than on
the ground with more antibiotic produced in flight samples. They are working to
apply this research to ground-based processes.
BPR’s Center for Biophysical Sciences and Engineering (CBSE) formed an
exclusive partnership with Athersys, Inc., a premier genomics company. Genomics is
the science of describing the proteins that are encoded by the genes in our DNA.
CBSE has developed a world-class capability to determine the exact shapes and struc-
tures of proteins through the process of protein crystallography. Precise information
Fi
sc
al
Y
ea
r
20
01
A
ct
iv
it
ie
s
23
2001 report 3/20/03 3:25 PM Page 23
on the protein structure is critical to the design of highly specific and effective new
drugs.
BPR seeks to use its research activities to encourage educational excellence
and to improve scientific literacy from primary school through the university level
and beyond. We deliver value to the American people by facilitating access to the
experience and excitement of space research. BPRE strives to involve society as a
whole in the transformations that will be brought about by research in space.
During FY 2001, BPR held its first interactive education and public out-
reach broadcast as part of a technically oriented Pan Pacific Microgravity
Workshop. BPR revamped its material on the Worldwide Web to reflect our new
NASA Enterprise status and mission, and to group material specifically for public,
educational, and technical audiences. The Enterprise had requests for and distrib-
uted over 4,000 interactive CDs explaining space flight and space research to the
layperson and educator as a result of our electric light tower exhibit touring the
country. In collaboration with the USAF Academy Department of Biology, we
completed development of an undergraduate-level course in Space Biology.
During FY 2001, NASA continued its international activities, expanding
cooperation with its partners through new agreements, discussions in multilateral
fora, and support for ongoing missions. NASA concluded over 90 cooperative and
reimbursable international agreements for projects in each of NASA’s five
Strategic Enterprises. These agreements included ground-based research, aircraft
campaigns, and satellite missions in the fields of Earth science, space science, and
human space flight and research. Significant international agreements signed
during FY 2001 include several government-to-government framework agree-
ments, under which future cooperation will be carried out, and agency-to-agency
Memoranda of Understanding for specific projects.
In the area of framework agreements, the Agreement Between the United
States of America and the Republic of Hungary on Cooperation in the Exploration
and Use of Outer Space for Peaceful Purposes was signed on May 14, 2001. This
agreement establishes the foundation for future bilateral cooperation between the
U.S. and Hungary in the areas of space science, Earth and atmospheric science,
and human space exploration. The Agreement Between NASA and the National
Commission for Space Activities of the Argentine Republic for Cooperation in
the Civil Uses of Space was extended on August 2, 2001, for an additional l5 years.
Ae
ro
na
ut
ic
s
an
d
Sp
ac
e
Re
po
rt
o
f
th
e
Pr
es
id
en
t
24
2001 report 3/20/03 3:25 PM Page 24
Fi
sc
al
Y
ea
r
20
01
A
ct
iv
it
ie
s
25This agreement provides the framework for strengthening cooperation in the uses
of space for research in Earth science and global climate change.
In space science, specifically in the area of solar system exploration, NASA
and the Russian Aviation and Space Agency (Rosaviakosmos) signed an
Implementing Agreement for Flight of the Russian High-Energy Neutron Detector
(HEND) instrument to fly on NASA’s Mars 2001 Odyssey mission. This mission was
launched by NASA on April 7, 2001 and entered the orbit of Mars after the end of
FY 2001. The HEND instrument will provide unique data to scientists to assist in the
ongoing search for water on Mars. NASA also signed project-level agreements for sci-
entific participation by Germany and Denmark in NASA’s Mars Exploration Rover
mission, to be launched in 2003. In the area of space physics, NASA signed project-
level agreements covering the participation of several nations in NASA’s planned
Solar-Terrestrial Relations Observatory mission: Germany, Italy, the United
Kingdom, France, Switzerland, and Hungary, and the European Space Agency
(ESA). In astrophysics, NASA signed initial project-level agreements with the ESA
and the Canadian Space Agency (CSA) for cooperation in the Next-Generation
Space Telescope mission, NASA’s planned follow-on to the highly successful Hubble
Space Telescope mission. In addition, NASA signed a series of project-level agree-
ments with ESA covering U.S. participation in several future ESA astrophysics and
planetary missions: the International Gamma-Ray Astrophysics Laboratory, the Laser
Interferometer Space Antenna, the International Rosetta mission (an in situ investi-
gation of the Comet Wirtanen), and Mars Express. The NASA Astrobiology
Institute accepted two new international affiliate members during FY 2001, the
United Kingdom Astrobiology Forum and the Australia Centre for Astrobiology.
In Earth science, NASA and the CSA signed a Memorandum of
Understanding (MoU) for the SciSat-1 Atmospheric Chemistry Experiment (ACE)
mission on October 24, 2000. As of the end of FY 2001, the SciSat-1 ACE mission
was scheduled for launch no earlier than December 2002. The objective of the
SciSat-1 ACE mission is to improve our understanding of the chemical processes
involved in the depletion of the ozone layer, with particular emphasis on the processes
occurring over Canada and the Arctic. On May 29, 2001, NASA and The
Netherlands Agency for Aerospace Programmes signed an MoU for the Dutch-built
Ozone Monitoring Instrument (OMI) to fly on NASA’s Earth Observing System
(EOS) Aura spacecraft, scheduled for launch in mid-2003. OMI will measure total
column ozone, ozone profiles, and other atmospheric constituents, such as clouds and
2001 report 3/20/03 3:25 PM Page 25
aerosols. These important measurements will help scientists determine how the
Earth’s ozone layer and ultraviolet radiation is responding to the phase-out of ozone-
destroying chemicals, as well as to the increasing concentrations of greenhouse gases
and atmospheric particulates (e.g., dust and soot) caused by human activity.
Also in Earth science, NASA and the Israel Space Agency signed an MOU
for cooperation related to the Mediterranean Israeli Dust Experiment (MEIDEX) in
Tel Aviv, Israel, on August 16, 2001. Both agencies are now completing work on the
Israeli instrument, which is scheduled for flight as a secondary payload on the Space
Shuttle Columbia in 2002. The primary objective of the MEIDEX payload is to inves-
tigate the geographical variation of the optical, physical, and chemical properties of
desert aerosols, including the location and temporal variation of its sinks, sources, and
transport. An Israeli payload specialist, Colonel Ilan Ramon, who will be the first
Israeli to fly in space, will conduct the MEIDEX experiment in flight. NASA estab-
lished a series of agreements with institutes from Japan, China, Taiwan, and Germany
in support of the NASA Transport and Chemical Evolution over the Pacific atmos-
pheric science experiment. This experiment, which included NASA aircraft and
ground-validation sites, was conducted in March and April 2001 in Hong Kong,
Japan, and Taiwan.
In addition, NASA and the Argentine Space Commission (CONAE) signed
an agreement for an airborne validation campaign on December 27, 2000, to com-
plement cooperation between NASA and CONAE under the Memorandum of
Understanding for the Scientific Applications Satellite-C (SAC-C) Earth Observing
Mission (signed October 28, 1996). Under this agreement, the NASA Airborne
Visible/Infrared Imaging Spectrometer (AVIRIS) was deployed to Argentina to con-
duct calibration and validation activities for the EO-1 and SAC-C satellites shortly
after their joint launch in November 2000.
In human space flight and research, the NASA Administrator led a NASA
delegation to witness the historic launch of the first crew (Expedition 1) to the
International Space Station (ISS), which took place at the Baikonur launch facility
in Kazakhstan on October 31, 2000. Following approval procedures in the U.S.,
Japan, and Russia, the Inter-Governmental Agreement (IGA) Concerning
Cooperation on the Civil International Space Station entered into force on March
28, 2001. The International Space Station Partners approved the flight of the first
space flight participant, Mr. Dennis Tito, to the ISS in April 2001 aboard a Soyuz taxi
Ae
ro
na
ut
ic
s
an
d
Sp
ac
e
Re
po
rt
o
f
th
e
Pr
es
id
en
t
26
2001 report 3/20/03 3:25 PM Page 26
Fi
sc
al
Y
ea
r
20
01
A
ct
iv
it
ie
s
27mission. In December 2000, as part of the U.S. Government team, NASA success-
fully concluded discussions with the government of Japan that clarified and updated
the 1995 Agreement Between the United States and the Government of Japan
Concerning Cross-Waiver of Liability for Cooperation in the Exploration and Use of
Space for Peaceful Purposes. This agreement ensures that Japan and the United States
agree to waive liability claims for cooperative U.S./Japan space activities.
Also during FY 2001, NASA participated in numerous multilateral fora and
meetings designed to review ongoing cooperation or to foster new cooperation.
These included: the Inter-Agency Consultative Group for Space Science and its
International Living with a Star Task Group; the Committee on Earth Observing
Satellites; the United Nations Committee on Peaceful Uses of Outer Space and its
subcommittees; the ISS IGA Triennial Review; the ISS Forum 2001; and the
International Astronautical Federation. NASA senior management engaged in
bilateral discussions with current and potential future international partners, host-
ing meetings with space officials from around the world, and visiting foreign space
officials and facilities. One of the developments in this regard was the initiation of
preliminary discussions between the U.S. Government and the government of
Turkey on potential civil space cooperation. A Turkish Space Symposium was held
in May 2001 in Ankara, Turkey, and senior NASA management participated in
this meeting. Several months later, a high-level Turkish delegation visited NASA
Headquarters and several NASA Field Centers in August 2001 to continue the
exploratory discussions.
2001 report 3/20/03 3:25 PM Page 27

2001 report 3/20/03 3:25 PM Page 28
Fi
sc
al
Y
ea
r
20
01
A
ct
iv
it
ie
s
29
DEPARTMENT OFDEFENSEDoDDuring FY 2001, the Department of Defense (DoD) engaged in a wide variety of
aerospace activities. In terms of environmental monitoring, the National Polar-
orbiting Operational Environmental Satellite System (NPOESS), a tri-agency
program of NASA, DoD, and the Department of Commerce (DoC) that con-
verges the DoD and DOC/NOAA polar-orbiting weather satellite programs,
continued to progress. In FY 2001, the NPOESS Integrated Program Office (IPO)
extended the two Program-Definition and Risk-Reduction (PDRR) contracts by 6
months and down-selected development contract awards for all remaining major
sensors. The NPOESS Preparatory Project (NPP), an IPO/NASA joint mission to
provide a crucial early-flight and risk-reduction opportunity for several major
NPOESS sensors, also continued to progress in FY 2001. The PDRR contractors
each held several promising early demonstrations of system concepts and designs
to accommodate the planned 2005 NPP mission launch.
DoD, NASA, NOAA, and other Federal agencies continued to make
good progress in FY 2001 on implementing activities for the Space Weather
Architecture Transition Plan. DoD participated in a new NASA initiative, Living
with a Star, a systems approach to studies of Sun-Earth connections. In 2001, DoD
participated fully in the LWS Science Architecture Team to help develop a defi-
nition of the LWS program. The objectives of LWS connect the scientific
understanding of the Sun-Earth system with an ultimate operational forecasting
capability, a major DoD concern.
The Geostationary Operational Environmental Satellite (GOES)-M
spacecraft was launched successfully on July 23, 2001. This DoD/NOAA/NASA
spacecraft continued a series of capabilities in weather imagery and sounding data
to support operational weather forecasting and meteorological research. New on
2001 report 3/20/03 3:25 PM Page 29
this mission was the DoD/NOAA/NASA-sponsored Solar X-ray Imager, the first
operational instrument for monitoring x rays that originate in the atmosphere of
the Sun. Solar forecasters now get a real-time downlink of images that helps them
make more accurate predictions of geomagnetic storms on Earth. Some affected
activities and impacts that benefit from these forecasts are GPS navigation errors,
radio communication blackouts, radiation danger to high-flying crews and passen-
gers, and interruptions to satellite operations.
Regarding the highly protected SatCom systems, Milstar Flight 4 was
launched from the Eastern Range during February 2001. This was the first suc-
cessful medium data rate EHF satellite on orbit for the DoD.
In the area of positioning and navigation, two Global Positioning System
(GPS) Block IIR satellites were launched and subsequently declared operational.
At the end of the fiscal year, the GPS constellation consisted of a total of 28 satel-
lites providing unprecedented levels of accuracy in support of national security, as
well as worldwide transportation safety, scientific, and commercial interests.
Development efforts continued on the GPS modernization program to add new
military signals (known as the M-code) to Block IIR and IIF satellites, a second
civil signal on IIR satellites, and a third civil signal (L5) on IIF satellites. As the
first step in a major effort over the next several years to modernize GPS to enhance
its ability to meet both military and civil needs for the foreseeable future, System
Architecture and Requirements Development (SA/RD) contracts were awarded to
Boeing and Lockheed Martin. The yearlong SA/RD contracts, also called Concept
Exploration, are intended to evaluate military and civil utility, as well as define the
system performance trade space for the subsequent phases of GPS III development.
As part of the DoD restructure of its Evolved Expendable Launch Vehicle
(EELV) program, DoD sought and won congressional approval of a Heavy Lift
Vehicle demonstration launch as a risk-reduction step. Launch was scheduled
for 2003.
In the areas of intelligence, surveillance, and reconnaissance, the Space-
Based Infrared System (SBIRS) made progress toward fielding the follow-on
system to the Nation’s Defense Support Program (DSP) missile launch early warn-
ing satellites. SBIRS is fielded in three increments. The technical difficulties in
1999 that had set back the transition to a new mission control station were
resolved. Increment 1 consolidated the DSP’s overseas ground stations, located in
Europe and Australia, with the old U.S. ground station into a single mission con-
30
Ae
ro
na
ut
ic
s
an
d
Sp
ac
e
Re
po
rt
o
f
th
e
Pr
es
id
en
t
2001 report 3/20/03 3:25 PM Page 30
Fi
sc
al
Y
ea
r
20
01
A
ct
iv
it
ie
s
31trol station located at Buckley Air Force Base, Colorado. The overseas sites were
replaced with minimally staffed relay ground stations in order to realize savings in
staffing, operations, and maintenance. The addition of the SBIRS high compo-
nent, also known as “SBIRS Increment 2,” has encountered difficulties, however,
and first launch will probably be slipped from FY 2005 to FY 2007. The Highly
Elliptical Orbit sensor payload and the mobile multimission processors both passed
successful critical design reviews, paving the way to begin fabrication of HEO
flight payloads and SBIRS mobile ground stations. The DoD has also continued
with the risk-reduction and program definition phase for SBIRS low.
The DoD Space Test Program (STP) teamed again with NASA in launch-
ing the Kodiak Star mission on an Athena I launch vehicle—the first orbital
launch out of Kodiak Island, Alaska. In addition to NASA's Starshine III space-
craft, this mission included three small DoD spacecraft (PICOSat, PCSat, and
Sapphire) which tested a variety of new space technologies, including flexible
polymer batteries, ionospheric occultation measurements, and advanced command
and control techniques. At the end of the fiscal year, STP and the Naval Research
Laboratory were progressing well toward the 2002 Titan II launch of Coriolis, a
risk-reduction effort for NPOESS, acquired under NASA’s Rapid Satellite
Acquisition process. STP awarded a contract to Spectrum Astro to build and
launch the Communication/Navigation Outage Forecasting System mission,
which will test the ability to forecast communications outages due to ionospheric
scintillation. STP teamed with the Air Force Research Laboratory’s Space
Vehicles Directorate to develop a secondary payload adapter ring for the Evolved
Expendable Launch Vehicle (EELV), which can host up to six 400-pound micro
satellites. STP also worked closely with NASA and the U.S. Navy on the
Geosynchronous Imaging Fourier Transform Spectrometer/Indian Ocean
Meteorology and Oceanography Imager project.
STP had two successful Shuttle/ISS missions in FY 2001 as well. STS-105
delivered and successfully deployed the Materials International Space Station
Experiment (MISSE) externally on the ISS. MISSE, a passive materials exposure
experiment, is the first external experiment on ISS. In addition, STS-105
retrieved and returned MACE II (Middeck Active Control Experiment II) from
the ISS. MACE II was the first experiment on ISS and was operated for nearly a
year. Through the efforts of Commander Bill Shepherd and astronaut Susan
Helms, Mace II surpassed all anticipated data results.
2001 report 3/20/03 3:25 PM Page 31
DoD continued to coordinate and oversee a wide array of space control ini-
tiatives spanning all four space control mission areas: surveillance of space;
protection of space assets; prevention; and negation. Particular emphasis was
placed on space surveillance programs leading to an approved modernization and
investment strategy that will transform the existing surveillance network from a
track-based system to a search-based system that will eventually be able to provide
true space situational awareness. Plans were also made for a new Space Situational
Awareness Integration Office within the Air Force Space Command to serve as an
advocate for space surveillance and improve program management and collabora-
tion among DoD components and other interested Government agencies. In the
area of space system protection, the U.S. Space Command led an effort to develop
a new analytic tool to assist decisionmakers in establishing protection priorities for
space systems. The results of this effort will be used to help develop a Space
Protection Roadmap that will ensure the availability of critical space capabilities
during all levels of conflict. Research also continued on a number of space pre-
vention and negation concepts in response to emerging DoD requirements.
Ae
ro
na
ut
ic
s
an
d
Sp
ac
e
Re
po
rt
o
f
th
e
Pr
es
id
en
t
32
2001 report 3/20/03 3:25 PM Page 32
Fi
sc
al
Y
ea
r
20
01
A
ct
iv
it
ie
s
33
FEDERAL AVIATIONADMINISTRATIONFAA
The FAA continued in its mission to ensure a safe, secure, efficient, and environ-
mentally friendly civil air navigation and commercial space transportation system.
During FY 2001, the agency performed and sponsored research and development
programs to enhance the effectiveness of its mission; issued regulations and guide-
lines for better flight standards, operations, and maintenance; and provided
equipment and training for a modernized air traffic control system.
In the area of airport safety and pavement technology research, the FAA
completed the first set of full-scale trafficking tests at the National Airport
Pavement Test Facility during FY 2001.These tests involved subjecting nine test
pavements to simulated B-747 and B-777 loading at speeds of 2.5 and 5 mph. The
FAA worked closely with the Boeing Company and an international working
group in planning these tests. Researchers recorded the pavement response instru-
mentation data and stored it in a database for future retrieval.
The FAA, in cooperation with the Air Force, conducted a study on vehicle
stability enhancements for heavy airport rescue and firefighting vehicles, since a
number of these vehicles have suffered rollover accidents in recent years. The
study focused on active and reactive suspension systems and shock-dampening sys-
tems. Technicians conducted testing to establish more stringent static and
dynamic testing criteria for newly manufactured vehicles. As a result, the FAA
incorporated changes into the latest revision of the advisory circular for heavy air-
port rescue vehicle design in the areas of performance testing and vehicle
suspension systems. These changes will help prevent rollover accident by ensuring
that future airport rescue and firefighting vehicles have the new suspension
technology, as well as allowing for retrofitting the existing fleet.
2001 report 3/20/03 3:25 PM Page 33
The FAA also initiated research to prevent new large aircraft wingtips from
intruding in the safety areas of adjacent taxiways, runways, and terminal areas. In
particular, the FAA selected Anchorage International Airport for this research
due to its large number of Boeing 747 traffic and availability of varying weather
conditions. FAA specialists completed the first phase of data collection in August
2001, with a second phase beginning in September 2001. The FAA expected to
begin analysis of the data in FY 2002.
In the area of fire safety research, the FAA has emphasized fuel tank safety
since the TWA flight 800 accident in July 1996. One proposed method of reduc-
ing the flammability of fuel tanks is fuel tank inerting, which is commonly used by
the military. However, the systems weight, resource requirements, and low dis-
patch reliability have indicated that military fuel tank inerting systems would not
be practical for application in transport airplanes. The Aviation Rulemaking
Advisory Committee (ARAC) Fuel Tank Harmonization Working Group, com-
missioned by the FAA to evaluate various concepts for preventing fuel tank
explosions in commercial transport aircraft, concluded that the most potentially
cost-effective method of fuel tank flammability reduction is ground-based inerting
(GBI). Ground-based inerting is defined by inerting fuel tanks during ground oper-
ations, when the threat of explosion is perceived to be the greatest.
FAA and Boeing personnel therefore performed a series of aircraft flight and
ground tests to evaluate the effectiveness of GBI as a means of reducing the flam-
mability of fuel tanks in the commercial transport fleet. Boeing made available a
model 737-700 for modification and testing. A series of 10 tests were performed
(five flight, five ground) under different ground and flight conditions to demon-
strate the ability of GBI to reduce fuel tank flammability. Results with low fuel
loads showed that, under quiescent conditions, the oxygen concentration in the
fuel tank remained somewhat constant, keeping the CWT inert (below 10- to 12-
percent oxygen by volume) for relatively long periods of time. Results were in
reasonably good agreement with predictions, and the FAA planned to continue
this research in FY 2002.
Aircraft cargo compartments’ fire-detection systems currently consist of
either ionization or photoelectric smoke detectors. However, the ratio of false
alarms to actual fires detected by U.S.-registered airlines during the previous 5
years is approximately 200 to 1. There are no certification criteria for new multi-
Ae
ro
na
ut
ic
s
an
d
Sp
ac
e
Re
po
rt
o
f
th
e
Pr
es
id
en
t
34
2001 report 3/20/03 3:25 PM Page 34
Fi
sc
al
Y
ea
r
20
01
A
ct
iv
it
ie
s
35sensor detectors employing algorithms that attempt to discriminate between real
fires and nuisance alarm sources. The FAA conducted research to standardize the
fire that cargo fire-detection systems must detect and to provide technical data to
develop certification guidelines for multisensor fire detectors.
Two fire sources were initially developed as proposed standards and the
FAA-conducted testing was done at its William J. Hughes Technical Center.
Concurrent with the development and testing of fire sources, under NASA fund-
ing, Sandia National Laboratories developed a computational fluid dynamics
(CFD) model to predict the transport of smoke, heat, and gases throughout an air-
craft cargo compartment. NASA also contributed to the research by expanding an
ongoing project on miniature gas sensors for space applications into use on aircraft.
The FAA planned to conduct further related tests to evaluate detector placement
and alarm algorithms on detection times and possibly reduce some of the required
certification tests.
Regarding suppression of inflight cargo compartment fires, FAA personnel
conducted full-scale tests to investigate the effectiveness of several types of water
spray systems. Water spray is being considered an alternative agent for Halon 1301,
which is no longer being produced because it depletes stratospheric ozone. Because
water spray technologies have proven effective in other applications and because
water is environmentally friendly, nontoxic, and abundant, it is being considered
as a halon-replacement agent for use in cargo compartments.
During FY 2001, FAA personnel also investigated ways to reduce the flam-
mability of seat cushions and other sources of rubber and foam in aircraft. New
materials that were developed with the assistance of industry such as polyphosp-
hazene and polysilphenylene-siloxane provide as much as a 50-percent reduction
in flammability compared to the best commercial semi-inorganic rubbers and an
order-of-magnitude reduction in flammability compared to the polyurethane cur-
rently used in aircraft seating. FAA specialists planned to explore the use of
relatively low-cost expandable graphite technology in semi-inorganic rubber com-
pounds to obtain a fireproof (zero heat release rate) seat cushion foam by 2005.
The FAA’s Fire Research Program continued to seek ways to predict the fire
resistance of new polymers from their chemical structure without the time and
expense (about 6 months and $50,000 per material) of synthesis, purification,
characterization, and fire testing. To this end, the FAA has been developing com-
puter programs to simulate the molecular-level fuel generation process of polymers
2001 report 3/20/03 3:25 PM Page 35
in fires. FAA scientists measured over 100 polymers of known chemical structure
for heat-release capacity using a special FAA-developed technique. A comparison
of calculated to measured heat release capacities for 80 polymers showed good
agreement, indicating that the fire hazard of a polymer in an aircraft cabin is pro-
portional to its heat-release rate in flaming combustion. Thus, the potential fire
resistance of polymers can be simply calculated a priori from the chemical struc-
ture without the need for synthesis and/or testing.
In terms of crash research, FAA researchers conducted a vertical drop test
of a B737-100 fuselage section at its Atlantic City, NJ, facility. The airframe sec-
tion was configured to simulate the load density at the maximum takeoff condition
and contained cabin seats, dummy occupants, overhead stowage bins with con-
tents, and cargo compartment luggage. The test article was fully instrumented.
The objective of the test was to evaluate the response behavior of the overhead
stowage bin installations when subjected to a severe, but survivable, impact con-
dition. Of particular interest was a comparison of the pretest static, steady state
forces to which the bins were subjected during their calibration versus the dynamic
forces generated during the impact test.
Researchers at Wichita State University used an FAA grant to study the use
of composite materials in commercial and general aviation aircraft. In particular,
scientists investigated impact damage states. It is crucial to understand the effects
of impact damage on static ultimate strength and damage tolerance criteria in
terms of safety, as well as the implications to maintenance.
The FAA also funded researchers at Syracuse University who developed a
methodology to address the problem of delamination growth, a common failure
mode in laminated composite aircraft structures. This methodology has the poten-
tial of profoundly affecting design, analysis, and certification procedures for
composite aircraft structures. First, it will allow a relatively rapid assessment at a
large number of possible locations, under a wide range of loadings, whether delam-
ination growth is likely. This will provide an early identification of possible failure
sites that may not be found by the current selective testing approach, resulting in
improved flight safety. Second, knowledge of the critical size and location of
delaminations will reduce aircraft maintenance activity as it will serve as a guide
for repair actions. Finally, this methodology may allow the implementation of a
more economic certification procedure based on a mix of analysis and testing to
Ae
ro
na
ut
ic
s
an
d
Sp
ac
e
Re
po
rt
o
f
th
e
Pr
es
id
en
t
36
2001 report 3/20/03 3:25 PM Page 36
Fi
sc
al
Y
ea
r
20
01
A
ct
iv
it
ie
s
37assure a damage-tolerant structure similar to that presently in use for
metallic structures.
A virtue of fabricating aircraft components from composite materials is that
the designer is afforded significant flexibility to vary materials and adhesives to
optimize the component’s weight and load-carrying performance. The same wide
range of variables that is so appealing to the designer, however, can cause signifi-
cant concern to the nondestructive inspection (NDI) practitioner who must buy
or fabricate calibration standards for each type of structure encountered when con-
ducting comparative-type NDI tests. Thus the FAA developed some important
new reference standards in this regard, and a number of aircraft manufacturers said
they would comply.
To predict crack growth and residual strength of riveted joints subjected to
widespread fatigue damage (WFD), accurate stress and fracture analyses of corner
and surface cracks emanating from a rivet hole are needed. To address this need,
the FAA expanded the existing database of three-dimensional stress-intensity
factor solutions and modeled bulging factors.
The FAA also developed a methodology to assess the development of WFD
and its effect on the residual strength of aircraft structure. WFD in a structure is
characterized by the simultaneous presence of cracks at multiple structural com-
ponents where the cracks are of sufficient size and density that the structure will
no longer meet its damage-tolerance requirement. The approach developed by the
FAA is a combination of analytical methodology development and experimental
validation. Advanced analytical methods were developed and validated over the
past decade by the FAA with the support and sponsorship of NASA and the U.S.
Air Force Research Laboratory.
In a related area, the FAA funded the development of an analytical
methodology to provide stress-intensity factors to predict fatigue crack growth for
rotorcraft applications. The methodology (Automated Global, Intermediate, and
Local Evaluation) is a suite of software tools developed for the automation of hier-
archical analysis of complex structures.
The FAA Operational Loads Monitoring Research Program continued to
collect and analyze both flight and landing loads data on civil transport aircraft.
FAA personnel added airplane models A-320 and Cessna-172 to the research pro-
gram in FY 2001, and models B-747 and B-777 were scheduled to be incorporated
into the program in FY 2002.
2001 report 3/20/03 3:25 PM Page 37
In partnership with the Naval Air Systems Command and the Office of
Naval Research, the FAA continued research and development of arc fault circuit
breakers (AFCB) intended to replace existing thermal circuit breakers used in air-
craft today. AFCBs detect electrical arcing and rapidly remove power to the
affected circuit, drastically reducing the chances of fire and other damage. During
FY 2001, the FAA successfully fabricated and tested these AFCB prototypes. In
addition, the FAA initiated an extensive program to evaluate the condition of
aging circuit breakers.
In the area of aviation security research, the FAA continued to develop and
deploy products that prevent explosives, weapons, and other threat material from
being introduced onto aircraft. Major areas of concentration include: certification
testing, checked and carry-on baggage screening using bulk and trace explosives
detection, human factors, aircraft hardening, aviation security technology
integration, and airport deployment of systems by the Security Equipment
Integrated Product Team.
The Aviation Security Laboratory (ASL) conducted certification tests on
the InVision CTX 9000Dsi Explosives Detection System (EDS) production unit,
the CTX-2500, and the L3 eXaminer 3DX 6000 unit. All these systems passed.
FAA researchers also continued their advanced work in bulk-detection techniques
such as x-ray diffraction. In the area of personnel screening, the FAA evaluated
several explosive detection prototypes. In the weapons detection area, the ASL
evaluated the response of metal detector systems to additional types of weapons in
anticipation of upgrading the standard. The ASL also evaluated several large cargo
inspection systems and a large bulk EDS for break-bulk cargo.
The human factors program continued to enhance the performance of
screeners through the development of Threat Image Projection software. This soft-
ware, which continued to be installed on systems for both carry-on and checked
baggage, improves screener training and enhances awareness. The program also
developed a networked Screener Readiness Test.
The Aircraft Hardening Program conducted a series of explosive tests on
737s, 747s, and Airbus aircraft under pressurized conditions for the purpose of
refining the vulnerability criteria for carry-on luggage. The program also evaluated
liners to protect the overhead bin area and performed additional tests to determine
the least risk bomb location.
Ae
ro
na
ut
ic
s
an
d
Sp
ac
e
Re
po
rt
o
f
th
e
Pr
es
id
en
t
38
2001 report 3/20/03 3:25 PM Page 38
Fi
sc
al
Y
ea
r
20
01
A
ct
iv
it
ie
s
39In FY 2001, human factors and aeromedical scientists conducted research
to provide the FAA and industry with human performance information critical to
the design, operation, regulation, and certification of equipment, training, and
procedures, thereby facilitating safe and efficient National Airspace System
(NAS) operations and reducing operator error as an accident-causation factor.
Specifically, the FAA conducted aeromedical research with a focus on improving
the health, safety, and survivability of aircraft crews and passengers.
The air transportation human factors research program conducted investi-
gations to collect and analyze data on the antecedents and responses to crew error.
The results of these investigations were used by the air carriers to modify current
line operations and pilot training programs to enhance safety. Researchers com-
pleted a survey of over 12,000 U.S. air carrier pilots regarding the effectiveness of
current pilot training programs. The results revealed that pilots view their training
as effective and important in preparing them to fly in the NAS. Researchers also
continued the development of a training analysis and development system that is
used by air carriers and local FAA offices in designing pilot training simulator
scenarios and other tests that are challenging, fair, and operationally relevant
when evaluating pilot performance. This system allows air carriers to design an
Advanced Qualification Program (AQP) using performance data collection and
analysis. Phase 2 of the Model AQP was completed in 2001.
General aviation researchers completed an analysis of causal factors in acci-
dents and incidents attributed to human error using the military Human Factors
Analysis and Classification System. Aviation maintenance researchers also con-
tinued their investigation of methods and guidelines that can be used to reduce
fatigue-producing factors in the maintenance environment. The results of both of
these research projects will facilitate development of regulatory and certification
guidance material.
In FY 2001, the FAA researched a new incident-investigation technique
that assesses underlying causal factors of operational errors in air traffic control.
This project was coordinated with a similar European project. Research also exam-
ined human-factor issues in runway incursions, including development of a new
booklet for controllers and pilots entitled “Runway Safety: It’s Everybody’s
Business,” that provides helpful information on memory, pilot-controller commu-
nication, and situational awareness.
2001 report 3/20/03 3:25 PM Page 39

In terms of aircraft occupant safety, the FAA completed the largest cabin
evacuation study ever conducted evaluating aircraft design and human factors
affecting passenger egress through Type III (over wing) emergency exits in trans-
port aircraft. The FAA also completed an altitude research study evaluating the
physiological protection provided by three different types of continuous-flow
oxygen masks used with portable oxygen bottles for flight attendants. The 747
Aircraft Environmental Research Facility was completed and is in service sup-
porting a variety of safety, security, training, and testing functions and programs.
Researchers also conducted investigations to address the FAA’s goal for an equiv-
alent level of safety for all aircraft occupants, with targeted areas including
seats/restraints/inflation devices for infants and small children, and side-facing
seats in corporate aircraft. In addition, three research studies aimed at providing
information on 1) the accessibility of under-seat life preservers on transport air-
craft, 2) the tension average passengers apply to their seatbelts during normal and
emergency conditions, and 3) the optimum lever motion for rapid seatbelt release
were completed. Researchers also continued to investigate the nature of inflight
medical emergencies and the use of defibrillators on commercial flights, as well as
perform epidemiological assessment of biochemical and toxicological factors from
fatal civilian aviation accidents.
The FAA and private industry continued to collaborate on the Safe Flight
21 Program, an initiative to validate the capabilities of advanced communication,
navigation, and surveillance technologies and related air traffic procedures. During
FY 2001, the FAA continued to demonstrate the uses of Automatic Dependent
Surveillance-Broadcast (ADS-B) technologies at various airports across the coun-
try. ADS-B has been identified in the FAA “Blueprint for NAS Modernization” as
a key surveillance technology to supplement, and possibly replace, radar. On
January 1, 2001, FAA began initial operations using ADS-B in Alaska for air
traffic control representing the first-ever use of this technology to provide radar-
like services.
To accomplish these results, the FAA conducted extensive testing to vali-
date the suitability for use of ADS-B to provide air traffic control services similar
to radar-based air traffic control services. Problems were identified and solutions
developed. New air traffic and certification procedures for using ADS-B were
developed and implemented. The FAA’s en route automated radar tracking system
in Anchorage, Alaska, was upgraded to receive, process, and display ADS-B
reports. In October 2000, an operational evaluation involving 17 aircraft from the
Ae
ro
na
ut
ic
s
an
d
Sp
ac
e
Re
po
rt
o
f
th
e
Pr
es
id
en
t
40
2001 report 3/20/03 3:25 PM Page 40
Fi
sc
al
Y
ea
r
20
01
A
ct
iv
it
ie
s
41Cargo Airline Association, the FAA, and avionics manufacturers was conducted
in Louisville, Kentucky, to demonstrate the use of ADS-B in final approach spac-
ing, airport surface situational awareness, and moving map applications. A
demonstration of surface safety applications was also conducted in Memphis,
Tennessee, in June 2001. In addition, four ADS-B safety assessments were com-
pleted in September 2001. The Alaska Capstone Program continued its work in
Bethel, Alaska, and the Yukon Kuskokwim (Y-K) Delta region, and began expan-
sion into southeast Alaska. On January 1, 2001, the Anchorage Air Route Traffic
Control Center began using ADS-B to provide radar-like services in the Bethel,
Alaska, area. During the year, avionics were installed in 140 aircraft operating in
Bethel and the Y-K Delta. Pilots use this equipment, in conjunction with six
ground stations, to receive weather data, a NEXRAD map, and other traffic data.
Program expansion to southeast Alaska also began. A useable Instrument Flight
Rules (IFR) infrastructure is planned to address the terrain challenges presented by
Juneau, Alaska, and the surrounding area. During the year, a request for proposal
(RFP) was released to solicit vendors for upgraded avionics suites. Approximately
200 commercial service airplanes and helicopters will be equipped with the
enhanced ADS-B systems in southeast Alaska.
The FAA awarded six contracts in February 2001 under the initial Surface
Technology Broad Agency Announcement which is designed to explore
new/emerging lower cost technology options to reduce runway incursions at the
Nation’s airports. Two proposed solutions, ground markers and addressable signs,
showed promise and were being considered for functional and operational testing
in an airport environment. The FAA also continued to pursue surveillance-
controlled runway status light solutions for both large and small airports.
In FY 2001, the FAA continued progress toward implementation of the
Wide Area Augmentation System (WAAS) that will provide availability,
integrity, and accuracy for the Global Positioning System (GPS) to be used for en
route navigation and precision civilian navigation. During the fiscal year, WAAS
employees performed data collection and analyses using the National Satellite Test
Bed (NSTB). The FAA developed interference detection and mitigation tech-
niques, collected and analyzed ionospheric data, analyzed satellite alternatives for
WAAS final operating capability, and researched satellite navigation issues for
Alaska. Researchers from Stanford University used FAA funding to provide key
support to the WAAS Integrity and Performance Panel and Independent Review
2001 report 3/20/03 3:25 PM Page 41
Board. The FAA continued pursuing a North American Satellite Augmentation
System with Mexico and Canada. These agreements may significantly cut the
FAA’s expenses by reducing the agency’s need to field WAAS reference stations
along the southern and northern U.S. borders.
In addition, the FAA assisted the International Civil Aviation
Organization (ICAO) with plans and strategies for the development of a WAAS-
based Global Navigation Satellite System (GNSS) test bed capability for the
Caribbean South American region. The FAA expected that the resulting South
American test bed would pave the way for an operational system in the region that
is completely compatible with the U.S. systems. This future capability, based on
U.S. technology, may also provide cost-sharing opportunities on Geostationary
Earth Orbit satellite services, significantly reducing projected FAA leasing
expenses for satellites. The successful completion of all flight tests and other activ-
ities helped to demonstrate U.S. technological leadership in satellite navigation,
ensure the seamless transfer from one regional satellite-based navigation system to
another, and promote the adoption of satellite navigation in regions where
improved navigation capability will increase the safety of flight for U.S. citizens
traveling abroad. The FAA expected it to provide the groundwork necessary to
achieve the ICAO's vision of a future, worldwide, seamless navigation capability.
In FY 2001, FAA researchers made significant progress in the quest to use the
Local Area Augmentation System to achieve Category I and Category III
precision approaches. The FAA cooperated with private companies such as
United Parcel Service (UPS) and Federal Express (FedEx) in successful tests using
this system.
During the fiscal year, the FAA worked with the aviation industry to
increase the level of detail contained in the National Airspace System Plan.
The plan provides the communities strategic plan for Air Traffic Management
through 2015. The plan is based on the “Free Flight” operational concept in which
pilots may choose the most efficient and economical routes to their destinations.
As part of these modernization efforts, the FAA delivered all the domestic
Terminal Doppler Weather Radars. The radar and its associated display are impor-
tant safety features for helping to identify hazardous weather such as wind shear
and microbursts.
During FY 2001, the FAA’s William J. Hughes Technical Center worked in
partnership with NASA's Ames Research Center as the cosponsors of a technol-
42
Ae
ro
na
ut
ic
s
an
d
Sp
ac
e
Re
po
rt
o
f
th
e
Pr
es
id
en
t
2001 report 3/20/03 3:25 PM Page 42
Fi
sc
al
Y
ea
r
20
01
A
ct
iv
it
ie
s
43ogy transition initiative. The purpose of this initiative was to acquire technical
knowledge of new technologies developed by NASA early in the concept and pro-
totype development phases. The knowledge acquired through joint development
participation will potentially assist in reducing the time it takes to go from concept
development to field implementation. In support of this effort, the team at the
Technical Center recruited and hired subject-matter experts to participate in the
technology transition initiative. The success of the technology transition initiative
was validated by an increase in the number of implementation plans, which pro-
vide the formal agreement between NASA and the FAA for collaborative joint
development and technology transition efforts.
The Technical Center team has also supported the mission of the
Interagency Air Traffic Management Integrated Product Team by providing tech-
nical experts to serve as coleads for joint research projects and project leads for
those projects that have shown some benefit for the NAS. In addition, the key
team members were active participants in the Interagency Air Traffic
Management Integrated Management Team.
In FY 2001, the FAA completed development of an advanced tool to cali-
brate and certify many secondary radars in the NAS, including the new Airport
Surveillance Radar, the Air Traffic Control Beacon Interrogator upgrade, and
existing Mode S radars. The Technical Center conducted tests verifying the per-
formance envelope and the electromagnetic inference and environmental
characteristics of this new test set. Subsequently, the FAA accepted the first five
production units for use at operational sites around the Nation.
The Hughes Technical Center also completed a study of the Airport
Movement Area Safety System intersecting runways alert parameters. The purpose
of the study was to determine a recommended set of parameters to initiate alerts of
potential runway collisions for aircraft operating on intersecting runways at vari-
ous airports. After collecting live data at these airports and thorough analysis of
the data, the study recommended a set of parameters that maximize safety benefits
while minimizing the number of nuisance alerts generated.
In partnership with the Department of Defense and the National Oceanic
and Atmospheric Administration, the Technical Center initiated research on the
feasibility of using multifunction-phased array radars to perform weather detection
and warning, and to track aircraft. The ultimate goal of this project was to provide
much earlier warning of impending severe weather conditions. The FAA expected
2001 report 3/20/03 3:25 PM Page 43
that this project would create a research facility in the aptly named “Tornado
Alley” at the National Severe Storm Laboratories in Norman, Oklahoma.
Airborne laboratories in the FAA’s Research and Development Flight
Program participated in unique flight-test and high-altitude data collection to sup-
port development of new procedures and technology to improve navigation and
safety for our Nation’s pilots and their passengers. The wide variety of programs
included GPS navigation and precision approach development, air traffic control
circuit breakers tests, human factors, WAAS, and the Traffic Alert and Collision
Avoidance System (TCAS). These tests utilized a specially modified Boeing 727,
a Sikorsky helicopter, and a Convair 580 aircraft.
The Technical Center established an advanced differential GPS test bed in
Brazil. Under a memorandum of understanding between FAA and the aviation
authority in Brazil, Technical Center engineers procured and installed
hardware and software for the test bed and provided training on the fundamental
concepts of GPS wide-area differential systems and how to operate and maintain
the test bed.
The safe operation of our Nation’s airspace depends on reliable communi-
cations and navigation signals, but radio frequency interference (RFI) can damage
or cancel those signals. The Technical Center supported several high-visibility RFI
projects such as innovative training courses for FAA inspectors and personnel
at ATC facilities. In FY 2001, FAA instructors reached out to over 300
FAA regional, flight inspection, and international technicians, inspectors,
and engineers.
The Technical Center completed the final phase of an air traffic control
simulation study designed to reduce delays into Newark International Airport.
More than 100 air traffic controllers from four facilities in the eastern region par-
ticipated in a series of simulations. They tested different procedures along existing
flight paths to better enable controllers to sequence aircraft into the busy New
York metropolitan area. The completion of this study represented more than a year
of development and testing involving hundreds of hours of simulation, and
involved airspace in four air traffic control facilities: New York Center,
Washington Center, Philadelphia Air Traffic Control Tower, and the New York
TRACON. Separate standalone simulations were conducted for each facility, and
these simulations were conducted using the high-fidelity equipment in the air traf-
fic labs at the Technical Center. The controllers, programmers, airspace specialists,
Ae
ro
na
ut
ic
s
an
d
Sp
ac
e
Re
po
rt
o
f
th
e
Pr
es
id
en
t
44
2001 report 3/20/03 3:25 PM Page 44
union representatives, and managers all worked together throughout the year to
overcome the many challenges faced by the participants, and the final phase of
simulations was completed in May 2001. The Administrator also initiated a
unique study in the fall of 2000 to identify several points of congestion in the NAS
and provide relief in an expeditious manner.
Human factors researchers at the Technical Center conducted rapid proto-
typing efforts, early user involvement events, and computer-human interface
(CHI) validation simulations on multiple new or upgraded systems for the NAS.
In addition, they revised the Human Factors Design Guide to reflect the most cur-
rent research and information.
Human factors scientists at the Technical Center also examined the effects
of automation tools on air traffic controllers’ workload and situational awareness.
The first study investigated the effect of increasing levels of decision support
automation. A second study, conducted in collaboration with the Civil
Aeromedical Institute, explored the potential benefits and information require-
ments of an operational position, airspace coordinator, which could more
strategically plan traffic through airspace sectors. Finally, researchers examined the
potential human factors issues associated with collocating three Free Flight
automation tools.
FAA’s Office of the Associate Administrator for Commercial Space
Transportation (AST) continued to license and regulate U.S. commercial space
launch activity, ensuring public health and safety, and the safety of property, and
protecting national security and foreign policy interests of the United States. AST
also licensed operation of non-Federal launch sites and facilitated and promoted
commercial space launches by the private sector.
During fiscal year 2001, AST licensed six orbital space launches. Three
launches were conducted by Sea Launch (Zenit 3SL vehicle), two by Orbital
Sciences Corporation (Pegasus and Taurus), and one by International Launch
Services (Atlas IIAS). AST also established the System Engineering and Training
division to define safety standards for existing and emerging space launch systems,
launch sites, re-entry systems, and re-entry sites. The new division responds to the
training needs of AST employees.
Several reports were released, including “The Economic Impact of
Commercial Space Transportation on the U.S. Economy.” The first-ever U.S.
study of its kind, the report showed that in a single year (1999), the U.S. com-
Fi
sc
al
Y
ea
r
20
01
A
ct
iv
it
ie
s
45
2001 report 3/20/03 3:25 PM Page 45
mercial launch industry was responsible for yielding more than $61.3 billion in
economic activity and for supporting nearly half a million jobs in the United
States. The “2001 Commercial Space Transportation Forecasts” were released by
AST and FAA’s Commercial Space Transportation Advisory Committee. The
forecasts projected an average demand for 32 worldwide commercial space
launches per year through 2010.
The Air Force and the FAA signed a Memorandum of Understanding on
Safety for Space Transportation and Range Activities. AST completed the draft
and preliminary versions of the Rulemaking Project Record for the Reusable
Launch Vehicle Operations and Maintenance Notice of Proposed Rulemaking
(NPRM). In addition, AST participated on a committee to advise NASA in
selecting initial contracts for the Space Launch Initiative (second-generation
Reusable Launch Vehicle), revised and updated its environmental guidelines, and
began preparation on licensing new Atlas V and Delta IV launch vehicles.
Ae
ro
na
ut
ic
s
an
d
Sp
ac
e
Re
po
rt
o
f
th
e
Pr
es
id
en
t
46
2001 report 3/20/03 3:25 PM Page 46
Fi
sc
al
Y
ea
r
20
01
A
ct
iv
it
ie
s
47
DEPARTMENT OFCOMMERCEDoC
In FY 2001, the Department of Commerce (DoC) engaged in a wide variety of
activities that furthered U.S. interests in aeronautics and space, including satellite
operations and licensing, technology development, trade promotion, and civilian
and commercial space policy support. Most notably, DoC joined other U.S.
Government agencies in applying airborne and space-based resources to the relief
efforts following the September 11 terrorist attacks on the World Trade Center and
the Pentagon. Specifically, a number of National Oceanic and Atmospheric
Administration (NOAA) line offices contributed significantly to these efforts,
namely the Office of Marine and Aviation Operations (OMAO), National Ocean
Service (NOS), and Oceanic and Atmospheric Research (OAR). The OMAO’s
Aircraft Operations Center (AOC) provided support to NOS’s Remote Sensing
Division. Teaming with NOS, Optech, Inc., and the University of Florida, AOC
made available and operated NOAA’s Citation jet, and coordinated its flights
with the Federal Aviation Administration (FAA) and North American
Aerospace Defense Command (NORAD). The Citation flew over both sites at the
request of the Army’s Joint Precision Strike Demonstration project, collecting
high-resolution aerial photography and LIDAR (Light Detection and Ranging)
data from a system provided by Optech, Inc., of Canada.
NOS’s National Geodetic Survey (NGS) directly supported search and
recovery efforts at both the World Trade Center and the Pentagon disaster sites by
using its mapping and remote-sensing capabilities. The Army Joint Precision
Strike Demonstration coordinated a highly detailed mapping mission at both dis-
aster sites using LIDAR technology. LIDAR is an active remote-sensing system
used to profile or scan terrain elevations. NOS, the NOAA Office of Marine and
Aviation Operations, Optech, Inc., and the University of Florida teamed up to fly
2001 report 3/20/03 3:25 PM Page 47
the LIDAR in NOAA’s Cessna Citation. The images, which were created
by the LIDAR system and produced by NOAA, were provided as digital
surface models that offered an accurate bird’s eye view of the scene. They provided
three-dimensional positioning of the building structures and the surrounding area,
at 15cm accuracy, which helped the rescuers and engineers locate original support
structures, stairwells, elevator shafts, and basements. The LIDAR data, traditional
high-resolution aerial photography, and accurate Global Positioning System
(GPS) measurements are all connected to the National Spatial Reference System
(NSRS), which serves as a base reference for location information, and proved to
be invaluable to the rescue efforts. In this way, the rescuers had one base reference
system to efficiently locate utilities and building structures, which had been ren-
dered indistinguishable as a consequence of the attacks. NOAA later returned to
the World Trade Center site to provide data for change analysis. The crews were
able to pinpoint their recovery efforts by using photographs that revealed the
degree of the damage and the distribution of debris.
LIDAR data was also used to monitor structural movement of damaged
buildings in the area of the disaster and to calculate the volume of rubble.
For example, as the recovery efforts descended into the World Trade Center Tower
basements, LIDAR images provided very accurate height measurements that
could be used to mitigate potential flooding from the surrounding rivers. NOAA
also flew a mission over the Pentagon site to map it with LIDAR for reconstruc-
tion purposes.
A NOAA pilot on temporary duty with NASA flew an aircraft equipped
with the Airborne Visible/Infrared Imaging Spectrometer (AVIRIS) system at the
request of the Environmental Protection Agency (EPA) in order to identify and
locate asbestos fallout from the WTC plume. NOAA/OAR scientists also assisted
EPA efforts to assess ground-level air pollution problems in New York that were
primarily associated with asbestos released as the buildings fell.
On July 23, 2001, NOAA’s National Environmental Satellite, Data, and
Information Service (NESDIS) launched the Nation’s newest Geostationary
Operational Environmental Satellite-12 (GOES-12). GOES-12 is the first in the
GOES series to carry a new Solar X-Ray Imager (SXI) capable of producing images
of the Sun at 1-minute intervals. The SXI provides a continuous sequence of
coronal x-ray images that will be used by NOAA’s Space Environment Center
Ae
ro
na
ut
ic
s
an
d
Sp
ac
e
Re
po
rt
o
f
th
e
Pr
es
id
en
t
48
2001 report 3/20/03 3:25 PM Page 48
Fi
sc
al
Y
ea
r
20
01
A
ct
iv
it
ie
s
49(NOAA/SEC) and the broader community to monitor solar activity for its effects
on the Earth’s upper atmosphere and near space.
GOES-8 continued to view environmental events over the East Coast of
North and South America and over the Atlantic Ocean; GOES-10 continued to
view the West Coast and the Pacific Ocean, including Hawaii. Similar to the
other operational GOES, GOES-11 and GOES-12 are in place to be used to mon-
itor Earth’s atmosphere and surface to support NOAA’s forecasting and warning
programs.
GOES-2 was de-orbited in May 2001 after 24 years of onorbit operations.
Launched in 1977, the satellite was initially used for imaging operations and later
supported the Pan-Pacific Education and Communication Experiment (PEACE-
SAT) administered by the University of Hawaii. In addition, NOAA-10 was
deactivated in August. Since its launch in 1986, the satellite was fully operational
for almost 5 years, and served secondary functions until its deactivation.
NESDIS continued to operate two polar-orbiting environmental satellites,
NOAA-15 and NOAA-16, to provide a continuous flow of data to support
weather forecasting and monitoring of environmental events around the world. In
the U.S., NOAA’s National Weather Service (NWS) used the data primarily for
long-range weather and climate forecasts. These satellites are the first of 2 in a
series of 5 polar-orbiting satellites with improved imaging and sounding capabili-
ties that will operate over the next 12 years. The new microwave instruments on
NOAA-15 and NOAA-16 have enabled NOAA short-term weather forecasting
and warning programs to measure moisture in the atmosphere for identifying heavy
precipitation conditions. The direct broadcast, on a free and open basis, of
Advanced Very High Resolution Radiometer (AVHRR) instrument data provides
imagery to scientific, commercial, and educational groups throughout the world.
In addition, the search and rescue instruments on these satellites continue to sup-
port a global community that has established ground stations that “listen” for
distress beacons relayed through the NOAA polar-orbiting and Russian Cospas
satellites.
As part of NOAA’s interagency activities, it represented the DoC interests
in several subteams under the National Security Council Space Policy
Coordinating Committee. NOAA also continued its work with the Department of
Defense (DoD) and NASA as part of the Integrated Program Office (IPO) that is
2001 report 3/20/03 3:25 PM Page 49
managing the development of the National Polar-orbiting Operational
Environmental Satellite System (NPOESS) commenced 7 years ago. NPOESS
represents a major step toward the merger of U.S. civilian and military operational
meteorological satellites into a single, integrated, end-to-end satellite system.
NPOESS is designed to replace the current NOAA Polar-orbiting Operational
Environmental Satellites (POES) and the Defense Meteorological Satellite
Program (DMSP) systems.
Under a robust sensor risk-reduction effort that has been focused on early
development of the critical sensor suites and algorithms necessary to support
NPOESS, the IPO has awarded contracts for design and development of the fol-
lowing NPOESS instruments: Ozone Mapping and Profiler Suite (OMPS);
Cross-track Infrared Sounder (CrIS); Global Positioning System Occultation
Sensor (GPSOS); and the Visible/Infrared Imager Radiometer Suite (VIIRS). In
August 2001, preliminary design efforts were completed for the last of five critical
advanced technology imaging/sounding instruments for NPOESS, and an instru-
ment development contract was awarded for the Conical-scanning Microwave
Imager Sounder (CMIS). In 2001, the IPO continued work on competitive
Program Definition and Risk Reduction contracts to define the requirements for
the NPOESS total system architecture, including space, ground processing, and
command, control, and communications components, as well as to develop speci-
fications for sensor/spacecraft integration.
The IPO continued to support its partners in final development of the joint
DoD/IPO WindSat/Coriolis mission that is designed to provide a space-based test
and demonstration of passive microwave polarimetric techniques to derive meas-
urements of ocean surface wind speed and direction. This 3-year mission will
continue the development of improved microwave measurement capabilities from
the Special Sensor Microwave Imager and Sounder (SSMI/S) on DMSP to CMIS
on NPOESS. In addition, the IPO continued to comanage development of the
NPOESS Preparatory Project (NPP) designed to reduce the potential risks
incurred during the transition from POES and DMSP to NPOESS. NPP is also
designed to provide continuity of the calibrated, validated, and geo-located
NASA EOS Terra and Aqua missions systematic global imaging and sounding
observations for NASA Earth Science research. As part of the convergence of the
DoC and DoD meteorological satellite programs (POES and DMSP) into
Ae
ro
na
ut
ic
s
an
d
Sp
ac
e
Re
po
rt
o
f
th
e
Pr
es
id
en
t
50
2001 report 3/20/03 3:25 PM Page 50
Fi
sc
al
Y
ea
r
20
01
A
ct
iv
it
ie
s
51NPOESS, the IPO and NESDIS continued to operate the DMSP satellites
and prepared for the launch of the next replacement satellite (DMSP F-16).
During the course of the year, four DMSP satellites continued to contribute atmos-
pheric, ocean, and space weather measurements to DoD and NOAA operational
forecast centers.
NOAA/NESDIS continued to lead the National Hazard Information
Strategy (NHIS), which is an interagency initiative to reduce disaster losses
through better information. Under this initiative, efforts to develop the Hazard
Mapping System (HMS) succeeded in achieving progress on applications for
smoke and fire detection for State and Federal agencies. The HMS is an interac-
tive processing system that allows analysts in the NESDIS Office of Satellite Data
Processing and Distribution to integrate data from various sources, such as GOES,
polar-orbiting data (AVHRR), detection of fire from the NASA Moderate
Resolution Imaging Spectroradiometer (MODIS), and Defense Meteorological
Satellite Program/Operational Linescan System (DMSP/OLS) nighttime lights
detection technique. This composite data set is used to compile a quality-
controlled display of fire locations for the continental United States.
In FY 2001, the national Search and Rescue Satellite-Aided Tracking
(SARSAT) and international Cospas-Sarsat programs, led by NOAA/NESDIS in
collaboration with the U.S. Coast Guard, U.S. Air Force, and NASA, contributed
to the rescue of 178 lives in the U.S. and more than 1,000 worldwide. The
SARSAT program uses search and rescue payloads on NOAA and Russian satel-
lites to detect emergency beacons used by aviators and mariners in distress. During
the year, South Africa and Nigeria joined the Cospas-Sarsat program, bringing the
total number of member States to 33. Planning also continued for placing search
and rescue payloads on the European Meteosat Second Generation and Indian
Insat-3 geostationary satellites.
In FY 2001, the NESDIS/National Climatic Data Center (NCDC)
archived 2.3 terabytes of POES data and 16.2 terabytes of GOES data.
Approximately 300 customers requested satellite products. A data set of surface
temperatures was recently developed from a combination of in situ, satellite, ship,
and buoy observations. This blended source of information provides a comprehen-
sive analysis of surface temperature anomalies throughout the globe. In support of
NOAA efforts to improve access to GOES retrospective data, NCDC awarded a
2001 report 3/20/03 3:25 PM Page 51
contract to Marada Corporation in June 2001 to conduct a 1-year study of design
options for online access to GOES data.
NCDC supported the International Satellite Cloud Climatology Project
(ISCCP) by serving as the Sector Processing Center (SPC) for both operational
morning and afternoon NOAA polar orbiter satellites and, secondly, as the ISCCP
Central Archive (ICA). In its role as the SPC, NCDC provided ISCCP level B2
data, which consists of a spatially sampled version (approximately 30 km resolu-
tion) of the Global Area Coverage (GAC) data routinely produced by NOAA
from the AVHRR instrument onboard the operational NOAA polar orbiters. In
its role as the ICA, NCDC acted as the official archive of ISCCP data, serviced
customer orders from this archive, and also provided correlative data to some of
the ISCCP participants.
Throughout FY 2001, NCDC responded to data requests from customers
supporting the NOAA mission. The Great Lakes Environmental Research Lab,
which is part of NOAA, ordered approximately 1,000 GOES images to study the
El Niño-induced weather patterns from Central America and South America. The
National Centers for Environmental Prediction (NCEP) acquired GOES-8 data to
help map aerosol distribution from space. Scientists developed new algorithms to
study the effects of aerosols on regional climate patterns and used aerosol proper-
ties retrieved from the GOES-8 Imager to compare against ground-based Sun
photometer measurements.
Space environment monitoring data from the geostationary and
polar-orbiting operational satellites were processed and archived at the
NOAA/NESDIS National Geophysical Data Center (NGDC). Space environ-
ment, atmospheric, and oceanic monitoring data recorded on operational Defense
Meteorological Satellite Program (DMSP) satellites were also processed and
archived. Analyses of the DMSP archives produced the first global database of vis-
ible-to-near-infrared emissions. The emission database was used to produce a map
of changes in emission intensity from 1992 to 2000, which are then related to
analysis of urban sprawl. NOAA personnel developed a new Satellite Archive
Browse and Retrieval system to provide a variety of online, automated services
from imagery browsers to high volume, full resolution data transfers. This archive
and access system was modified to accept moderate resolution imagery collected
on NASA’s Earth Observing Satellite (EOS) as a joint venture with NASA to
address the long-term archive of EOS data.
Ae
ro
na
ut
ic
s
an
d
Sp
ac
e
Re
po
rt
o
f
th
e
Pr
es
id
en
t
52
2001 report 3/20/03 3:25 PM Page 52

In conjunction with the GOES-12 satellite launch and the Solar X-ray
Imager (SXI) that it carries, the first new instrument in over 20 years designed to
improve space weather forecasting and monitoring, NGDC helped to develop a
real-time system that will provide data to commercial space weather vendors, sci-
entists, educators, and the public. NGDC worked in close cooperation with
NOAA’s Space Environment Center to produce the software to process, archive,
and access SXI data within minutes of the recording.
Charged under the 1992 Land Remote Sensing Policy Act to license private
remote-sensing satellite systems, NOAA approved four new licenses for commer-
cial systems in FY 2001, including second-generation electro-optical/multispectral
systems, and high-resolution synthetic aperture radar. NOAA also approved 6
foreign agreements of its licensees, totaling an investment of up to $110 million in
U.S. systems.
Additionally, NOAA and DoC’s International Trade Administration (ITA)
commissioned a remote-sensing policy study from the RAND Corporation.
This study was conducted with the aim of better understanding the role that
U.S. Government policies and regulations play in shaping prospects for the
commercial remote-sensing satellite industry. The study provided recommenda-
tions to U.S. Government and industry to mitigate technical, market, policy, and
regulatory risks.
In the international space arena, NOAA/NESDIS continued to improve
and enhance its ongoing activities in FY 2001. NOAA participation in the United
Nations Committee on Peaceful Uses of Outer Space (COPUOS) played a key
role in facilitating negotiations that established the U.N. COPUOS Action Team
on Disaster Management. State Department Environmental Defense Funding was
awarded to NOAA through its role as the Chair of the Committee on Earth
Observation Satellites (CEOS) Disaster Management Support Group (DMSG).
This funding, together with assistance from the United Nations Office of Outer
Space Affairs (OOSA) and the European Space Agency (ESA), is to be used in
support of disaster workshops to bring together practitioners and space agencies
that have developed space technology solutions for disaster management in devel-
oping countries. NOAA managers also negotiated a renewal of the Radarsat-1
Memorandum of Understanding resulting in signature by the NOAA and NASA
Administrators and the Director-General of the Canadian Space Agency. This
agreement maintains NOAA access to Radarsat-1 data until Radarsat-2 becomes
Fi
sc
al
Y
ea
r
20
01
A
ct
iv
it
ie
s
53
2001 report 3/20/03 3:25 PM Page 53

operational. NOAA’s ongoing space relations with Japan also continued in 2001,
with completion of a new proposal to NASDA for cooperation on their Advanced
Land Observing Satellite (ALOS) mission. NOAA continued to provide, as the
sole DoC representative, overall responsibility for observational issues on the
U.S. delegations to the United Nations Framework Convention on Climate
Change (UNFCCC) and the United Nations Commission on Sustainable
Development (CSD).
NESDIS’s significant multilateral space activities also continued through its
prominent activities in the Integrated Global Observing Strategy (IGOS). NOAA
developed, with an IGOS visibility team, IGOS-related language and concepts for
endorsement at the April 2001 intergovernmental Commission on Sustainable
Development (CSD) at the United Nations Headquarters in New York City. In
particular, they worked to insert language in support of full and open data sharing,
and to find an integrated global observing strategy for documents being prepared
for the World Summit on Sustainable Development (WSSD). NOAA also organ-
ized, with its IGOS Partners, an IGOS exhibit and side-event in connection with
the CSD.
In coordination with the French, Canadian, and European Space Agencies,
the DoS, and other U.S. agencies, NOAA became a member to the International
Charter on Space and Major Disasters. NOAA also worked closely with the DoS
to obtain an Export License for four-line elements and perturbation software to
allow EUMETSAT to calibrate and validate NOAA instruments on their METOP
satellites. In addition, the NOAA/DoS collaboration helped to expedite approval
of a Technology Assistance Agreement between EUMETSAT and ITT. European
cooperation with NOAA was further enhanced through an energetic effort to re-
focus NOAA and U.S. Government polar satellite cooperation with EUMETSAT.
NOAA obtained EUMETSAT funds, in agreement with NASA, for testing
NOAA instruments scheduled to fly in a changed METOP-1 launch environment.
NOAA, with NASA and DoD, its partners in the NPOESS, drafted a new Joint
Polar Transition Agreement for negotiation with EUMETSAT.
The NOAA Assistant Administrator for Satellite and Information Services
participated in a July 26, 2001, inaugural ceremony in San Jose, Costa Rica, that
celebrated the NOAA-facilitated transfer to Costa Rica of a satellite ground sta-
Ae
ro
na
ut
ic
s
an
d
Sp
ac
e
Re
po
rt
o
f
th
e
Pr
es
id
en
t
54
2001 report 3/20/03 3:25 PM Page 54
Fi
sc
al
Y
ea
r
20
01
A
ct
iv
it
ie
s
55tion that brings high-resolution digital imagery from GOES satellites to the
Central American region. The imagery is collected through RAMSDIS units
installed in Costa Rica, Nicaragua, and Guatemala. NOAA has commenced
efforts to establish agreements with Belize, El Salvador, Guatemala, Honduras,
Nicaragua, and Panama for installation of RAMSDIS systems.
In addition, Australia and NOAA signed a historic Science and
Technology Arrangement for collaboration on coral reef research. The Acting
NOAA Administrator signed the Arrangement in January 2001 to establish a
Coral Reef Virtual Laboratory that will help researchers better understand and
monitor coral reef health. Excessive temperatures can cause bleaching of the corals
that are detrimental to island reef structures and the attendant marine ecosystem.
The health of the coral reefs will be monitored by using satellite-observed sea
surface temperatures and will contribute to mitigation activities under the
arrangement.
NOAA/NESDIS worked with NASA, the French space agency, and
EUMETSAT to fashion cooperation for the eventual transitioning of research
satellite altimetry missions of the follow-on Jason series of satellites to operational
status. The four agencies also received recognition for preparing to commit
resources to the identified satellite altimetry requirements in the Oceans Theme
of the IGOS. NOAA/NESDIS also focused efforts of the Assistant Administrator,
in coordination with NASA and NOAA/NWS counterparts, to represent U.S.
interests in the January 2001 World Meteorological Organization (WMO)
Consultative Meeting on High-Level Policy on Satellite Matters. This effort also
included NOAA inputs to a new WMO Technical Document on the role of satel-
lites in WMO programs. NOAA/NESDIS contributed, and prompted
contribution by other foreign space agencies, to a May 2001 University of Miami
international infrared radiometer calibration and inter-comparison exercise in
connection with the CEOS Working Group on Calibration and Validation.
In FY 2001, the NOAA/NESDIS Office of Research and Applications
(ORA) and NASA established the Joint Center for Satellite Data Assimilation
(JCSDA) to accelerate the use of satellite data in weather-prediction models. The
JCSDA is a “virtual center,” involving scientists from NASA and NOAA who
work in tandem to transition research, algorithms, and techniques in satellite data
assimilation. The objective is to maximize the significant investment that has
2001 report 3/20/03 3:25 PM Page 55
been put into current observing systems and prepare for the explosion of data that
will be available from future systems, such as the convergence of the NPOESS
constellation of satellites.
NOAA’s AOC supported hurricane research and surveillance, winter
storms research, coastal mapping, snow surveys (for hydrological forecasting), air
chemistry studies, and global climate research by providing specially designed and
instrumented aircraft for operations. Highly trained pilots, scientists, engineers,
and technicians operate these aircraft. In FY 2001, AOC also made significant
improvements to NOAA’s “hurricane hunter” technology. In conjunction with
flights of the NOAA G-IV hurricane surveillance jet far out over the Pacific
Ocean, a WP-3D Orion flew into winter storms off the West Coast, collecting
meteorological data for computer models to improve forecasts of severe Pacific
storms approaching the United States. An Inmarsat communications system was
installed on the P-3 for this mission that enabled immediate, real-time storm data
and voice transmissions to forecasters. The system was later installed on NOAA’s
other P-3, giving both aircraft the capability to transmit immediately to the
National Hurricane Center during missions flown over the course of the 2001 hur-
ricane season.
NOAA’s NOS continued to use GPS and remote-sensing technology to
meet its mission of mapping the national shoreline, producing airport obstruction
charts, and monitoring and analyzing coastal and landscape changes. NOS/NGS
continued work on advancing centimeter-level positioning accuracy of GPS
through its National Continuously Operating Reference Stations (CORS) pro-
gram. It added 31 new stations to the National CORS network during FY 2001.
At the end of the fiscal year, the network contained 229 sites. NOS continued
upgrading the sampling rate of all Nationwide Differential GPS (NDGPS)/DGPS
sites from 30 seconds to 5 seconds to better serve those involved in Geographical
Information Systems (GIS) development and/or kinematic applications. In
another effort to better serve those in the GPS and GIS communities, NOS hosted
a CORS Industry Forum in March 2001. The Forum presented the current status
of the CORS program and solicited input from existing and prospective partners
to determine the future direction of CORS. A joint effort was undertaken between
NOS and the FAA Tech Center in Atlantic City, NJ, to establish a T1 Internet
connection to download GPS data from approximately 50 sites contained in the
Wide Area Augmentation System/National Satellite Test Bed (WAAS/NSTB)
Ae
ro
na
ut
ic
s
an
d
Sp
ac
e
Re
po
rt
o
f
th
e
Pr
es
id
en
t
56
2001 report 3/20/03 3:25 PM Page 56
Fi
sc
al
Y
ea
r
20
01
A
ct
iv
it
ie
s
57network. Many of these sites are being incorporated into the CORS network. This
software will allow the streaming of FAA data into hourly files. CORS was also uti-
lized in the response and recovery efforts of the World Trade Center disaster. The
New Jersey Institute of Technology and the U.S. Coast Guard increased the data
collection rate at nearby stations to better position the airplanes that were map-
ping the affected area via remote-sensing techniques.
Also in the past year, NOS developed the Online Positioning User Service
(OPUS) as a means to facilitate GPS users’ access to the NSRS. OPUS allows
users to submit their GPS data files to NOS, where the data will be processed to
determine a position using NOS computers and software. Each submitted file is
processed with respect to three CORS sites. While it is not a real-time feedback,
it is very valuable for checking data that is brought in from the field.
NGS continued its effort as a key partner in the NASA Synthetic Vision
System (SVS) program by providing essential data and information to be incorpo-
rated into this system. NASA is working with industry to create Synthetic Vision,
a virtual reality display system for the cockpit. This program could offer pilots a
clear, electronic picture of what is outside their windows, regardless of the weather
or time of day.
NOS continued to provide access to data it currently collects and maintains
within the Aeronautical Survey Program (ASP). It also continued to derive spe-
cialized data to support the SVS. These data include obstruction data, runway
positional information, digital terrain models, and orthorectified imagery. In FY
2001, two test sites were selected, Dallas-Fort Worth, Texas, and Eagle County,
Colorado. This data provides the backbone of the SVS system, which is used to
provide the required positional accuracy and the scene replication data needed for
safe air navigation in low-visibility situations.
NOS has collaborated with the FAA Aviation Systems Standards (AVN),
the University of Florida Geomatics Department, and Optech Inc. to test the fea-
sibility of using an Optech 33 kHz Airborne Laser Terrain Mapper (ALTM) for
FAA programs (AVN-Flight Check/National Aeronautical Charting Office
(NACO)-Flight Edit) and the NOS Aeronautical Survey Program.
NOS continued to participate in the Safe Flight 21 program, which is led
by the FAA. This is a joint Government/industry initiative designed to demon-
strate and validate, in a real-world environment, the capabilities of advanced
surveillance systems and air traffic procedures that will move the national airspace
2001 report 3/20/03 3:25 PM Page 57
58 system forward in the 21st century. Enabling technologies include Automatic
Dependent Surveillance-Broadcast (ADS-B) and Traffic Information Services-
Broadcast (TIS-B). The NOS role is to provide accurate data referenced to the
NSRS. It provides orthorectified imagery and then generates a highly detailed
digital map of the test airports. The data sets include runways, taxiways, vehicle
roads, signs, centerline paint stripes, all movement areas, and other detailed infor-
mation to help air traffic controllers safely move aircraft and ground vehicles
around the airfield.
The NOS Coastal Services Center (CSC) continued to expand its efforts to
make remote-sensing data, information, and technology accessible to the coastal
resource management community in FY 2001. One of CSC’s most significant
efforts was to manage the NOS coral mapping efforts in the Pacific Ocean. This
effort is based primarily on remote-sensing technology, using satellite and airborne
platforms to develop the coral reef map products. This is an ongoing collaborative
activity and includes the participation of many program offices within NOS, as
well as contracts with the private sector for product development.
Another significant activity included the beginning of outsourcing efforts
for remote-sensing products and services. NOS released a contract to private
industry for the development of satellite-based, land cover and “change” data sets
in the coastal areas of the Great Lakes region. These products will meet the guide-
lines and standards of the NOAA Coastal Change Analysis Program (CCAP). In
FY 2001, NOS also developed these products for the main eight islands of Hawaii.
Commercial, high-resolution satellite data were purchased to support various land-
based resource management projects in the Pacific Islands and coastal regions of
the mainland. Other outsourcing activities included the initiation of a contract to
collect elevation data from LIDAR technology for the Willapa Bay region of
Washington.
NOS also continued to support remote-sensing and GIS activities in part-
nership with the coastal management community. These data were used to support
the land cover mapping of the main eight islands of Hawaii, to verify historical
logging activities for an ecological characterization project in Alaska, and to esti-
mate visitor use for two National Marine Sanctuaries located off the coasts of
Georgia and Texas.
Ae
ro
na
ut
ic
s
an
d
Sp
ac
e
Re
po
rt
o
f
th
e
Pr
es
id
en
t
2001 report 3/20/03 3:25 PM Page 58
Fi
sc
al
Y
ea
r
20
01
A
ct
iv
it
ie
s
59NOS outreach and educational activities included the development of a
remote-sensing training course for GIS professionals, Web-based materials that
focus on the coastal applications of remote sensing, and CD-ROM products that
demonstrate how remote-sensing technology is being used in specific State and
local coastal resource management applications. NOS continued to develop its
internal NOAA relationships and to foster its relationships with other civil agen-
cies that have mutual interests in remote-sensing and Earth observation
technologies within the coastal zone, such as the U.S. Geological Survey (USGS),
the Federal Emergency Management Agency (FEMA), EPA, and NASA’s Earth
Science Enterprise.
The NOAA/National Marine Fisheries Service (NMFS) Office of Habitat
Conservation has been interacting with the Naval Oceanographic Office at
Stennis Space Center in Mississippi for several years on a project to acquire high-
resolution imagery of the Sacramento River. The aim is to monitor areas along the
river that are accessible by threatened and endangered species of interest to
NMFS. Previously, the Navy collected very-high-quality imagery along the
Sacramento River, from Shasta Dam downstream to the Delta (i.e., the entire por-
tion of the river accessible to resources of interest to NMFS). That imagery was
processed by the Naval Oceanographic Office and sent to NMFS as 2 sets of a
6-volume series of hard-copy images of the Sacramento River. The last volume was
received during summer 2001. Copies were then sent to the NMFS field office in
Santa Rosa, California, for immediate use in assessments for both the Endangered
Species Act and the Sustainable Fisheries Act. The imagery has allowed NMFS
staff engineers and biologists to examine details of the river that have enhanced
project planning, impact assessment, and evaluation of potential restoration activ-
ities.
During FY 2001, following completion of a NMFS-led restoration effort to
enhance lateral growth of the Atchafalaya River Delta under the Coastal
Wetlands Planning, Protection, and Restoration Act (CWPPRA), the NMFS
Office of Habitat Conservation used National Imagery Systems and other data to
track changes in the delta from 1998. Louisiana has 40 percent of the wetlands in
the continental U.S., yet the State experiences 80 percent of the loss (the
CWPPRA was instituted to combat this loss). The imagery collected under this
project was utilized by the USGS and analyzed by NMFS. This imagery has
2001 report 3/20/03 3:25 PM Page 59
Ae
ro
na
ut
ic
s
an
d
Sp
ac
e
Re
po
rt
o
f
th
e
Pr
es
id
en
t
60 revealed observations of large areas of accretion on the lateral edges of the delta,
which demonstrates the success of the NMFS-led restoration effort.
NOAA’s Special Agents and Fisheries management officials leveraged high-
tech tools to assist them in their work of protecting and managing the Nation’s
marine living resources. One of these tools is a national Vessel Monitoring System
(VMS), which routinely uses satellite-based monitoring systems to monitor com-
pliance with domestic and international fishing regulations, as well as receive
real-time catch data. NOAA’s Fisheries Office for Law Enforcement (OLE) con-
tinued to expand its national VMS program. This program is the vehicle to
provide infrastructure, economies of scale and coordination across NOAA
Fisheries’ regions and offices. It is designed to ensure standards-based consistency
for enacting national policies concerning fishing data confidentiality, systems
security, and legal evidence handling. The current regional VMS systems are
designed to be linked to OLE HQ servers and use standardized hardware, commu-
nications software, and formats. An integral part of the national VMS program is
the ability to afford wide-area network connectivity for all of the major enforce-
ment and VMS monitoring offices.
NOAA’s SEC, the Nation’s official source of space weather alerts and warn-
ings, continued to monitor continually and forecast Earth’s space environment by
providing accurate, reliable, and useful solar-terrestrial information.
SEC conducted research into phenomena affecting the Sun-Earth environ-
ment, including the emission of electromagnetic radiation and particles from the
Sun, the transmission of solar energy to Earth via solar wind, and the interactions
between the solar wind and Earth’s magnetic field, ionosphere, and atmosphere. In
conjunction with the U.S. Air Force, SEC continued to conduct Space Weather
Operations (SWO) to monitor solar and geomagnetic activity 24 hours a day; dis-
seminate information on the solar-terrestrial environment; alert private,
commercial, Government, and military users to possible disruptive or dangerous
changes in the space environment; issue daily forecasts of space environment con-
ditions; and act as the World Warning Agency for the space environment. The
SEC continued to operate a Data Acquisition and Display System to gather cur-
rent space weather data for distribution to Government and private sector users
and for subsequent archiving by NOAA’s NGDC.
2001 report 3/20/03 3:25 PM Page 60
Fi
sc
al
Y
ea
r
20
01
A
ct
iv
it
ie
s
61More than 20 years of joint effort between the U.S. Air Force, NASA, and
NOAA culminated in the development of a real-time image processing system, to
improve space weather alerts and forecast the effects of such disturbances. The
system, installed on one of NOAA’s geostationary satellites (GOES-12), includes
a flexible “movie” player for visualization and assessment of dynamic changes in
the sun’s corona, as provided by the new SXI data. Data from the instrument was
first recorded on September 7, 2001. The images, which revealed solar details such
as coronal holes, active regions, flare locations, and a wealth of other detail,
achieved all expectations. The instrument is being tested and calibrated to opti-
mize products that will come out of the images.
Real-time tracking of NASA’s Imager for Magnetopause-to-Aurora Global
Exploration (IMAGE) commenced from NOAA’s Fairbanks ground station.
IMAGE is the first mission dedicated to “seeing” Earth’s space environment and
watching solar activity drive space weather. Through a partnership between
NASA, NOAA, and the Communications Research Laboratory in Japan, the
IMAGE satellite broadcasts images of space weather in real time, and ground sta-
tions receive the images and transfer them to the SEC.
SEC collaborated with NASA in planning Living with a Star, a guide pro-
viding K–12 educators with materials and resources that are useful for
understanding connections between the Sun and Earth. The two primary goals of
this effort are to disseminate educational resources about the Sun and to facilitate
the involvement of space scientists in education.
DoC also engaged in a variety of non-NOAA aerospace activities. The
Technology Administration (TA) engaged in a number of space-related activities
through the Office of Space Commercialization (OSC) and the National Institute
of Standards and Technology (NIST). OSC continued to serve as the principal
coordinating unit within the DoC on space-related issues, coordinating positions
with and disseminating information to various bureaus with separate space-related
responsibilities and authorities, including NIST, NOAA, the International Trade
Administration (ITA), the National Telecommunications and Information
Administration (NTIA), and the Bureau of Export Administration (BXA).
In June, OSC published the 2001 Trends in Space Commerce report, provid-
ing an overview of the commercial space market and projections for future growth.
The analysis included highlights on competitiveness comparing the U.S. with
2001 report 3/20/03 3:25 PM Page 61
other nations in the fields of space commerce, space transportation, satellite com-
munications, remote sensing and the Global Positioning System. The report
projected a $93.4 billion worldwide market for the space industry in 2001, with
$77.74 billion in revenue expected from satellite communications, the largest and
fastest growing segment of the industry.
OSC assumed an active role in interagency space matters under the Space
Policy Coordinating Committee (PCC) established by the National Security
Council. OSC cochaired the Space PCC Sub-Team on commercial space issues,
overseeing the development of strategies for the use of commercial remote-sensing
satellite systems by the military and for commercial use of the International Space
Station. OSC also participated in Space PCC Sub-Teams focused on space trans-
portation, spectrum, and international issues.
Within the White House-led Interagency Working Group on the Future
Use and Management of the U.S. Space Launch Bases and Ranges, OSC collabo-
rated with the U.S. Air Force and the FAA Office of the Associate Administrator
for Commercial Space Transportation (AST) to assure full consideration of the
needs of commercial users of the two major Federal space launch facilities. As part
of a separate effort, OSC, FAA/AST and IT’s Office of Aerospace worked closely
to coordinate industry positions on outside funding for Federal launch bases
and ranges.
Through OSC and NOAA, DoC continued to promote the interests of
commercial, scientific, and Government users of GPS as a key member of the
Interagency GPS Executive Board. OSC played a critical role in defending GPS
radio spectrum from encroachment by ultra-wideband emitters and other potential
interference sources, working with the NTIA as well as civil and military Federal
agencies. OSC also continued to host the offices and meetings of the IGEB, to
engage in international outreach missions to promote GPS, and to participate in
the GPS modernization program.
OSC continued to represent U.S. industry interests during bilateral negoti-
ations with the European Commission on satellite navigation. OSC also
participated in bilateral consultations with Japan led by the DoS to affirm the two
nations’ mutual commitment to promote and use GPS as an international standard
for satellite navigation and timing.
In the area of satellite remote sensing, OSC, NOAA, and IT’s Office of
Aerospace (OA) continued to represent commercial interests as part of the
Ae
ro
na
ut
ic
s
an
d
Sp
ac
e
Re
po
rt
o
f
th
e
Pr
es
id
en
t
62
2001 report 3/20/03 3:25 PM Page 62

Fi
sc
al
Y
ea
r
20
01
A
ct
iv
it
ie
s
63Remote Sensing Interagency Working Group (RSIWG). Led by the DoS, the
RSIWG is charged with coordinating policy for the export of U.S. remote-sensing
satellite systems and negotiating government-to-government agreements covering
the safeguarding of those systems’ technology.
During FY 2001, NIST performed a broad range of measurements and
standards-related research, technology transfer, and industry support in the areas
of aeronautics and space. NIST continued to provide radiometric calibration sup-
port for NASA’s EOS program to ensure the accuracy of the sensors used in global
remote sensing. NIST also provided the radiometric calibration of NOAA’s
Marine Optical Buoy (MOBY), which furnishes accurate data necessary to cali-
brate and validate satellite ocean color measuring instruments such as the
Sea-Viewing Wide Field-of-View Sensor (SeaWifs) and MODIS. NIST started a
multi-year effort to improve calibration techniques for radiometers used for remote
sensing. These new developments should provide greater measurement accuracy in
satellite applications such as measuring Earth’s temperature, wind speed over the
ocean, sea salinity, and locating resource position.
The NIST Manufacturing Extension Partnership (MEP) helped hundreds
of U.S. aerospace parts and systems manufacturers increase sales and productivity
and reduce costs through adoption of lean manufacturing and other competitive
processes. As one example, RoBrad Tool & Engineering, Inc., an 80-employee
machine shop that supplies precision subassemblies for Boeing and Honeywell,
came to the Arizona extension center to reengineer its setup processes.
Conversion techniques prescribed by the Arizona center reduced RoBrad’s setup
times by 42 percent and saved $300,000 a year in setup costs.
To improve the security of communications between space-based and
ground-based operations, NIST’s Cryptographic Module Validation Program
worked with NASA to develop and use new cryptographic modules and crypto-
graphic algorithm implementations. To reduce interference between aircraft
navigation systems, external radiation, and onboard laptops and cell phones, the
Naval Surface Warfare Center provided funding to NIST to compare alternatives
and to deliver efficient techniques and methodologies for measuring aircraft radi-
ation shielding. With funding from FAA, NIST helped set interference
measurement policy. To reduce potential interference between ultra-wideband
2001 report 3/20/03 3:25 PM Page 63
Ae
ro
na
ut
ic
s
an
d
Sp
ac
e
Re
po
rt
o
f
th
e
Pr
es
id
en
t
64 broadcast signals and GPS systems, NIST and the NTIA worked on characterizing
ultra-wideband emissions for simulated interference studies.
NIST continued to work with the NASA Jet Propulsion Laboratory on the
Condensate Laboratory Aboard the Space Station (CLASS) project, which will
develop microgravity measurement instruments for Bose-Einstein condensates, an
atomic-level phenomenon for which a NIST scientist received the 2001 Nobel
Prize in physics. NIST scientists also prepared a Shuttle experiment involving the
rapid stirring of xenon in microgravity, a process that decreases its viscosity, some-
thing never seen before in such a simple fluid. Results from this experiment should
help predict flows occurring in the manufacture of ordinary plastics.
NIST continued to provide the tools, methodologies, standards, and meas-
urement services needed by aerospace parts manufacturers and assemblers to
maintain their accurate and traceable use of the International System of Units (SI)
of length, mass, and time, as well as their derived units (force, acceleration, sound
pressure, and ultrasonic power). For example, NIST provided calibration services
in the areas of electrical measurements and microwave parameters to numerous
aerospace corporations such as Boeing, General Dynamics, Lockheed Martin
Astronautics, McDonnell Douglas Corporation, Northrop Grumman, and TRW
Space and Electronics.
NIST’s Advanced Technology Program supported efforts of an industry
team at the Ohio Aerospace Institute of Cleveland to develop technologies that
make product design concurrent with manufacturing, thereby reducing design
time, improving quality, and potentially reducing the cost of creating new products
in a range of industries. Demonstration of the technology will focus on a jet
engine, nacelle, and fuel nozzle.
NIST continued its NASA-funded research on microgravity-based fires and
fire suppression. NIST studied flame extinction in microgravity in order to
improve methods for ensuring fire safety during long-duration space missions. To
characterize the size distribution of smoke generated in microgravity, NIST and
NASA researchers measured and compared the output of approved spacecraft
smoke detectors with 1-g results and model predictions. A computer program was
developed to simulate the effects of g-jitter on small combustion experiments
being conducted in NASA drop towers, the Space Shuttle, and the International
Space Station.
2001 report 3/20/03 3:25 PM Page 64
Fi
sc
al
Y
ea
r
20
01
A
ct
iv
it
ie
s
65NIST worked with aerospace manufacturers to develop “predictive process
engineering” models, metrology, and standards, intelligent manufacturing control
systems, and product interoperability protocols and knowledge representation
schemes for Computer-Aided Design (CAD) systems. NIST developed software
for testing the Air Transport Association’s IGExchange, a specification that allows
the aerospace industry to develop Extensible Markup Language (XML)-based
dynamic graphics. In collaboration with NASA, NIST helped deploy on a tele-
scope in Hawaii a unique infrared-imaging instrument similar to NIST systems
aerospace companies have commercialized for space missions.
NIST worked with NASA to develop an optics metrology laboratory and
capability for NASA optics. NIST also developed optical disk image and storage
standards for NASA, which is interested in using optical tape for storing satellite
imagery. With funding from NASA and in collaboration with Stanford University,
NIST deployed a new class of optical detectors with sufficient speed and resolution
to provide entirely new information from space, such as the detailed characteriza-
tion of light being emitted from pulsars.
NIST scientists developed tools to accelerate the introduction of new mate-
rials and processes in the manufacture of aerospace engine components; these
include multi-component alloy thermodynamics, phase diagrams, solidification,
and diffusion. Additionally, NIST cooperated with the NASA Glenn Research
Center to broaden the use of advanced ceramic materials that, due to their brit-
tleness, currently have limited applications. The two agencies developed standard
test methods for quantifying the fracture resistance of brittle, monolithic ceramics
in a manner suitable for use by aerospace designers. NIST also developed object-
oriented finite element software to enable virtual measurements of the thermal
conductivity of ceramic thermal barrier coatings used to extend the operating
temperature and life of jet turbine blades.
NIST continued to support the Primary Atomic Reference Clock in Space
(PARCS), a laser-cooled cesium clock being developed for deployment on and use
with the International Space Station’s onboard scientific and technical applica-
tions. The PARCS project has completed its first two NASA reviews and is
scheduled to fly in early 2005. NIST also continued to provide synchronization
support for NASA’s Deep Space Network, used for space navigation and tracking.
NIST provided a number of key NIST facilities to NASA science missions, includ-
ing NIST’s synchrotron (SURF III), the Solar Radiation and Climate Experiment
2001 report 3/20/03 3:25 PM Page 65
Ae
ro
na
ut
ic
s
an
d
Sp
ac
e
Re
po
rt
o
f
th
e
Pr
es
id
en
t
66 (SORCE), and the TIMED (Thermosphere Ionosphere Mesosphere Energetics
and Dynamics) spacecraft. SURF III was used as a source of soft x rays and vacuum
ultraviolet light to calibrate mirrors, detectors, and spectrometers used in space-
craft that study solar flares and astronomical bodies.
NIST completed the radiometric calibration of the NIST Advanced
Radiometer (NISTAR) and Earth Polychromatic Imaging Camera (EPIC), both
planned for deployment on the NASA Triana satellite. NISTAR will measure the
absolute irradiance of the Earth. EPIC will provide hourly, spatially resolved meas-
urements of cloud properties, and ozone and aerosol levels of the Earth’s
atmosphere.
In FY 2001, ITA’s OA played a central role in the organization and coordi-
nation of the Commission on the Future of the United States Aerospace Industry,
established by Congress to study issues associated with the future of the industry in
the global context, particularly in relation to national security. The Commission
is required to issue a report for the President and Congress in late 2002 recom-
mending actions by Federal agencies to maintain a robust industry in the future.
OA contributed a staff member to colead a team on global issues and assist the
Commission in developing recommendations on issues including export control,
technology transfers, subsidies/offsets, trade agreements and policies, regulations
and standards, and international mergers and teaming.
OA worked closely with other U.S. agencies to renew the Czech
government’s 1-year tariff waiver on imports of U.S. large civil aircraft, helicop-
ters, and certain spare parts through December 31, 2002. The DoS, the office of
the U.S. Trade Representative (USTR), and the U.S. Embassy in Prague joined
efforts in convincing Czech officials to eliminate the tariff differential between
U.S. and EU aircraft by renewing the tariff waiver. Without the waiver, the Czech
Republic levies a 4.8 percent tariff on U.S. aircraft, while no tariff is assessed on
EU aircraft. The Czech government confirmed its intention to join the World
Trade Organization (WTO) Trade in Civil Aircraft Agreement (which, among
other things, binds tariffs on aircraft and parts to zero) as part of any future
multilateral trade negotiations. OA encourages as many countries as possible to
sign the WTO Agreement on Trade in Civil Aircraft as part of their WTO
accession process.
Efforts by OA, USTR, and the DoS to open Russia’s highly protectionist
aerospace market met with some success during FY 2001. In August 2001, the
2001 report 3/20/03 3:25 PM Page 66
Fi
sc
al
Y
ea
r
20
01
A
ct
iv
it
ie
s
67Russian government repealed Resolution #716, which had linked obtaining tariff
waivers for imported aircraft to purchases of Russian-made aircraft.
OA continued to monitor and address European government loans to
Airbus for the development of the A380 super jumbo jet. In January 2001, a U.S.
interagency team, led by USTR and DoC, held consultations with the EU in
Washington. U.S. officials expressed concern about Government loans and the
extent to which they are compatible with the WTO. The EU responded that any
Government loans would be compatible with the 1992 U.S.-EU Large Civil
Aircraft Agreement, which allows for direct Government loans that match up to
33 percent of total aircraft development costs. In April 2001, the EU provided
information about the loans as required in the 1992 agreement. OA personnel
continued analyzing this data, and the U.S. Government requested further infor-
mation from the EU to better understand their compatibility with both the 1992
Agreement and WTO disciplines.
OA organized a number of aerospace-related activities under the U.S.-
China Joint Commission on Commerce and Trade (JCCT) aimed at fostering
greater bilateral trade in this sector. The Chinese participated in training programs
sponsored by the FAA and offered by the American Association of Airport
Executives. Delegations of Chinese from various disciplines in the aviation com-
munity visited the United States and participated in the annual meetings of the
Airports Council International, the National Business Aviation Association, and
the General Aviation Manufacturers Association.
OA continued to play a critical role in the U.S. Government team seeking
resolution of the dispute over the European Union regulation that restricts the reg-
istration and operation in the EU of aircraft modified with noise suppression
technology, including aircraft engine “hushkits” and replacement engines. OA and
other agency representatives participated in bilateral discussions with EU officials
under the mediation of the International Civil Aviation Organization (ICAO)
Council President. The U.S. Government team also vigorously supported the rec-
ommendation for a new aircraft noise standard and related procedures by an ICAO
technical working group and subsequent adoption of the standard by the ICAO
Council. Through extensive technical discussions and negotiations with other
ICAO members, the U.S. Government successfully achieved the key objective of
endorsement by all ICAO members of new aircraft-noise-related policy guidance.
ICAO adoption of this policy guidance is anticipated to significantly contribute to
2001 report 3/20/03 3:25 PM Page 67
Ae
ro
na
ut
ic
s
an
d
Sp
ac
e
Re
po
rt
o
f
th
e
Pr
es
id
en
t
68 resolution of the “hushkit” dispute. The U.S. Government will continue bilateral
negotiations with European officials to seek withdrawal of the hushkit regulation
prior to April 2002.
During discussions with European officials in FY 2001, OA and other
Federal agencies raised concerns over the European Commission’s plans to estab-
lish a European Aviation Safety Agency (EASA) to regulate civil aircraft safety in
the EU and other European states. OA has concerns with provisions that link air-
craft safety to international trade considerations. DoC championed a proposal to
amend the EASA regulation in a way that would remove the linkage between
trade considerations and the oversight of aircraft safety.
OA and TA’s OSC continued to participate in efforts led by USTR to mon-
itor Chinese compliance with the quantitative restrictions and pricing provisions
of the U.S.-China Commercial Space Launch Agreement. Ongoing and new
proliferation-related sanctions on China have limited the ability of foreign satel-
lite manufacturers and operators to select a Chinese launch vehicle, thereby
reducing China’s participation in the commercial market. China had relatively few
new commercial contracts, and the interagency working group discovered no new
violations of the agreement.
In FY 2001, OA continued to assist the U.S. aerospace industry through
trade promotion events. To promote the export of U.S. aerospace products, ITA
sponsored Aerospace Product Literature Centers at five major international exhi-
bitions and air shows in Australia, China, France, Taiwan, and the United
Kingdom. More than 4,000 trade leads were generated through this program.
Working with the American Association of Airport Executives, OA sponsored the
6th Annual Eastern European Airport and Infrastructure Conference and Trade
Show in Budapest, Hungary. The office also cosponsored, with Senator
Rockefeller, Congressman Oberstar, and Federal agencies, a China seminar that
showcased a variety of U.S. products and services.
With support from OA, Secretary Evans visited the Paris Air Show in June
2001. In meetings with representatives of leading U.S. aerospace exporters and
with his counterparts in foreign governments, Secretary Evans called for improve-
ments in the international trade regime to facilitate U.S. export sales. OA
arranged visits to the U.S. Pavilion by more than 20 delegations from outside the
United States. Those visits helped generate sales leads for U.S. exhibitors.
2001 report 3/20/03 3:25 PM Page 68
Fi
sc
al
Y
ea
r
20
01
A
ct
iv
it
ie
s
69OA, in coordination with ITA’s Advocacy Center and overseas offices, pro-
vided advocacy to support U.S. companies in international aerospace
competitions. The competitions include commercial aircraft sales for the Boeing
Company, helicopters, airport construction, commercial space projects, and air
traffic management projects.
Secretary Evans oversaw the official signing ceremony for the sale of 30
Boeing aircraft worth over $1.6 billion to four Chinese airlines. The contract and
signing ceremony, coordinated by OA, highlighted the importance of interna-
tional cooperation in this sector, especially in the wake of the September 11
terrorist attacks and their toll on the U.S. aircraft industry.
As the lead advisory agency for Federal Government telecommunications
issues, the National Telecommunications and Information Administration
(NTIA) undertook a number of policy initiatives regarding satellites and other
space-based communications systems. Specifically, NTIA provided policy guid-
ance on the restructuring of the International Telecommunications Satellite
(INTELSAT) Organization and the International Mobile Satellite (INMARSAT)
Organization. The restructuring has been successfully completed. NTIA continued
to manage the Federal Government’s use of the radio spectrum, including assign-
ments for NASA, DoD, NOAA, and other Government satellite programs.
NTIA worked closely with other U.S. regulatory authorities and commercial satel-
lite users to prepare for U.S. participation at the ITU World Radio Conference
(2003) to protect spectrum allocations for GPS.
2001 report 3/20/03 3:25 PM Page 69

2001 report 3/20/03 3:25 PM Page 70
Fi
sc
al
Y
ea
r
20
01
A
ct
iv
it
ie
s
71
DEPARTMENT OF THEINTERIORDoIThe U.S. Geological Survey (USGS) and NASA continued their partnership to
manage the Landsat-7 satellite, providing important new data to the global science
and operational user communities. USGS assumed complete mission operation
responsibility for Landsat-7 from NASA in October 2000, and USGS continued
to have responsibility for Landsat-7 data collection, archiving, and distribution.
NASA shared its expertise in mission management with USGS staff and con-
ducted research in the technical characteristics and the potential uses of Landsat
data. At the end of FY 2001, nearly 200,000 scenes of Landsat-7 Enhanced
Thematic Mapper Plus (ETM+) data were collected for the U.S. archive at the
USGS Earth Resources Observation Systems (EROS) Data Center. Total Earth
coverage, including record amounts of repetitive coverage, exceeds 6.2 billion
square kilometers. USGS successfully supported the Landsat-7 International
Cooperator Network by downlinking approximately 350 scenes per day to 16 oper-
ational Landsat-7 ground receiving stations. Eight ground stations are now
submitting metadata on a regular basis.
The commercial operator of the Landsat-5 satellite officially relinquished
commercial rights to market Landsat Thematic Mapper (TM) data on July 1, 2001.
The operator had informed USGS earlier that it would no longer support the oper-
ation of Landsats 4 and 5 at no cost to the Government. Because USGS manages
Landsat-7 operations, it assumed responsibility for Landsat-5 operations and con-
tinued to operate Landsat-5 through FY 2001. Landsat-4 was decommissioned in
June 2001 because it was no longer able to provide useful data.
The Land Remote Sensing Policy Act of 1992 requires U.S. Government
Landsat Program Management (NASA and USGS) to “assess options for a suc-
cessor land remote-sensing system to Landsat 7.” NASA and the USGS proceeded
2001 report 3/20/03 3:25 PM Page 71
with a two-step procurement strategy for the Landsat Data Continuity Mission
(LDCM) under which the private sector would provide multispectral digital image
data for global coverage of the Earth’s land mass on a seasonal basis and in a
manner that ensures continuity with the Landsat-7 mission. In FY 2001, NASA
requested industry comment on a draft Request for Proposals (RFP) for a set of
Formulation Phase contracts. In response to the final RFP for this phase, NASA
may award several contracts in FY 2002 to companies that will develop plans for a
mission that is mutually beneficial to the Government and the private sector. The
winning contractor for the Implementation Phase will deliver data as specified in
the LDCM Data Specification for the 5-year period starting in 2006, with an
option to extend the contract for a second 5-year period.
Landsat data were used in many studies of human-induced and natural alter-
ations to the Earth during FY 2001. For example, USGS collected Landsat-7
ETM+ data over Siren, Wisconsin, on June 18, 2001, the day after a tornado
destroyed much of the community; the data clearly showed the geographic extent
of the affected area. State and Federal emergency response agencies used the data
to study the path of the tornado and to assess its effects on the communities
involved by comparing that scene with one collected shortly before the storm.
The Land Cover Trends project is a 4-year collaborative research project
between USGS, the U.S. Environmental Protection Agency, and NASA to use
Landsat and other data to document the rates, driving forces, and consequences of
land use and land cover change over the past 30 years for the conterminous United
States. The project is based on the hypothesis that land cover changes unevenly
over time and space. In order to understand and manage the consequences of the
change, it is necessary to have reliable information on the forces that cause change
and the actual rates of change from time-to-time and from place-to-place. During
FY 2001, project scientists began to determine the rates of change for 84 regions
of the conterminous United States, using a probability sample methodology with
over 800 20-km by 20-km sites and Landsat data covering five dates from 1972 to
2000. Preliminary results showed that land cover has changed little between 1972
and 1992 in some regions such as North Central Appalachia in Pennsylvania and
New York. In other areas, such as the Northern Piedmont stretching from New
Jersey through Virginia, there has been significant conversion of agricultural land
to urban cover.
Ae
ro
na
ut
ic
s
an
d
Sp
ac
e
Re
po
rt
o
f
th
e
Pr
es
id
en
t
72
2001 report 3/20/03 3:25 PM Page 72
Fi
sc
al
Y
ea
r
20
01
A
ct
iv
it
ie
s
73With funding support from NASA, primary team members from the USGS
Astrogeology Program had outstanding success supporting several missions in the
FY 2001 NASA Planetary Science Program, and they hold leadership roles on sev-
eral future missions. USGS is part of the imaging team on the Galileo spacecraft's
continuing survey of Jupiter’s largest moons. Galileo returned image and geophys-
ical data as it closed to within 180 km of Jupiter’s moon, Io, passing through the
sulfurous snowflakes of one of its volcanic plumes. The Mars Global Surveyor col-
lected spectacular images of Mars with the Mars Observer Camera and the
Thermal Emission Spectrometer, especially of the largest global dust storm on
Mars in over 20 years. As Mars 2001 Odyssey reached orbit, USGS team members
collected data to help determine the distribution of minerals on the surface of Mars
and how that relates to its geological landforms.
USGS leads the combination camera-and-spectrometer instrument on the
Deep Space 1 probe that had a successful encounter with comet Borrelly, return-
ing images of the 10-km-long “bowling-pin-shaped” nucleus of that comet from
only 2,200 kilometers away. USGS leads the micro-imager camera team on the
Mars Excursion Rover mission that will be launched in 2003. Astrogeology scien-
tists are also part of the primary camera team for the ultra-high spatial resolution
(25 cm) camera on the Mars 2005 orbiter.
The Office of Surface Mining Reclamation and Enforcement (OSMRE)
used IKONOS 1-meter-resolution pan-sharpened multispectral stereo satellite
imagery covering active western and eastern coal mines for regulatory purposes,
including review of coal mining permits, making topographic measurements at
active coal mines, and ensuring that mine operators comply with regulations.
OSMRE successfully orthorectified this imagery by collecting high-accuracy global
positioning system (GPS) ground control and generating digital elevation model
products from the IKONOS stereo pairs on a photogrammetric workstation.
OSMRE used its Technology Information Processing System to distribute
Landsat orthorectified imagery mosaics (imagery from approximately 1990) of the
conterminous 48 States to over 70 State agencies, tribes, and OSMRE field offices
involved in surface coal mining to promote the use of remote sensing. OSMRE
installed a terabyte imagery server in Denver and began testing software to dis-
tribute the data to agencies and tribes involved in surface coal mine permitting
issues. OSMRE personnel conducted briefings and training sessions during the
2001 report 3/20/03 3:25 PM Page 73
Ae
ro
na
ut
ic
s
an
d
Sp
ac
e
Re
po
rt
o
f
th
e
Pr
es
id
en
t
74 year to expand the use of remotely sensed data within the agency and to stimulate
its full integration with geographic information systems (GIS), GPS, and mobile
computing activities.
OSMRE continued to acquire and successfully use Light Detection and
Ranging (LIDAR) imagery for detailed topographic mapping at abandoned mine
land sites and active coal mines. OSMRE also acquired standard aerial photogra-
phy products from commercial vendors and used airborne GPS and Inertial
Measurement Unit data to lower the overall cost of internal production of
orthophotography. OSMRE used GPS technology in FY 2001 in surface mine
reclamation verification, technical assistance projects, and training. OSMRE mine
inspectors routinely used GPS on large western surface mines for navigation and
field verification of mine features such as channels, surface depressions, and
reclaimed topography. OSMRE used GPS in Midwestern States to map acid mine
drainage discharges and to locate and inventory abandoned mine entries. In the
Eastern States, OSMRE technical staff mapped domestic wells and home sites to
aid in resolving complaints of water loss due to the impact of mining activities on
ground water flow.
Bureau of Land Management (BLM) resource specialists used a wide variety
of remote-sensing technologies in FY 2001 to inventory and monitor public lands
that were under increased pressure for energy and mineral resource extraction, as
well as urban growth. Data from traditional and digital aerial cameras, and multi-
spectral and hyperspectral sensors were supplemented by GPS and GIS to support
management activities associated with wildlife habitat, wilderness, recreation,
rangeland, timber, fire, minerals, and hazardous materials.
In FY 2001, BLM specialists used Landsat TM data to map a variety of land-
scape components, including: vegetation and invasive species for five
Southwestern States—Arizona, Colorado, Nevada, New Mexico, and Utah (in
partnership with USGS); leafy spurge, an invasive plant species in Wyoming;
increased soil detail throughout the Western U.S.; sage grouse habitat as an input
to conservation planning for the 11 BLM-managed Western States; and riparian
wetland areas in South Park, Colorado. Landsat TM data were also used to map
hazardous fuels in the 11 Western States that BLM manages, and to develop
hydrologic and terrain landscape models to support identification of rangeland
health indicators in western Colorado. BLM personnel analyzed NOAA
2001 report 3/20/03 3:25 PM Page 74
Fi
sc
al
Y
ea
r
20
01
A
ct
iv
it
ie
s
75Advanced Very-High-Resolution Radiometer (AVHRR) satellite data for detec-
tion of cheatgrass, an invasive species, in the Great Basin region to support
vegetation restoration efforts following wildland fire.
BLM used digital orthophoto quadrangles to identify off-highway vehicle
routes for land use assessments on BLM-managed lands. Color-infrared and black-
and-white aerial photographs were used to assess riparian conditions in numerous
Western States. BLM personnel mapped historical changes in pinyon-juniper com-
munities in western Utah to support site-specific fuels management. Airborne
Data Acquisition and Registration (ADAR) multispectral camera data were used
to monitor vegetation succession following wildland fire in northern Wyoming.
AURORA hyperspectral data were collected to develop a hazardous waste materi-
als inventory for remediation efforts on BLM-managed lands; for coal bed methane
inventory in Colorado, Montana, and Wyoming; and to inventory an invasive
plant species in Wyoming.
The National Park Service (NPS) used Landsat, SPOT, and IKONOS satel-
lite data, along with conventional aerial photography, LIDAR data, and digital
orthophotography to map and monitor land cover, vegetation, cultural features,
and other specific features in many national parks. Approximately 400 GPS
receivers were used for mapping and navigation to support a variety of NPS
resource management and park maintenance applications.
NPS continued to work with USGS to map vegetation and obtain uniform
baseline data on the composition and distribution of vegetation types for 270 U.S.
national park units. Vegetation mapping was completed in FY 2001 for Badlands
(South Dakota), Theodore Roosevelt (North Dakota), Voyageurs (Minnesota),
Isle Royale (Michigan), and Rock Creek (District of Colombia) National Parks.
The pace of mapping increased substantially in FY 2001, with work beginning in
29 new park units. For comparison, mapping was performed in a total of only 30
parks since the program began in 1994.
Bureau of Reclamation (BOR) and USGS personnel used NASA
Advanced Visible and Infrared Imaging Spectrometer (AVIRIS) hyperspectral
data of a portion of the Owyhee Basin in eastern Oregon to map surface minerals
and identify source areas of mercury within the basin that are contributing to the
high levels of mercury found in Reclamation’s Owyhee Reservoir. These high mer-
cury levels exceed standards set for fish and wildlife populations, and have resulted
2001 report 3/20/03 3:25 PM Page 75
Ae
ro
na
ut
ic
s
an
d
Sp
ac
e
Re
po
rt
o
f
th
e
Pr
es
id
en
t
76 in advisories being placed on the consumption of fish taken from the reservoir.
Preliminary maps of mercury source areas have been produced; when these maps
are finalized, they could be used to institute land-management practices to retard
the influx of mercury into the reservoir.
The California Central Valley Project Improvement Act Biological
Opinion requires that data on wildlife habitat change be used in water-related
negotiations with irrigation districts and with the U.S. Fish and Wildlife Service
(FWS). BOR image analysts used multitemporal Landsat TM data of the Central
Valley to identify such areas of change between 1993 and 2000. Areas that
changed between 1993 and 2000 will be mapped again using 1:120,000-scale aerial
photography acquired in 2001. This two-tiered approach reduced overall costs by
focusing more expensive high-resolution image acquisitions on specific areas iden-
tified using the Landsat data. These data will also be incorporated into the
Statewide change detection project being coordinated by the U.S. Forest Service
and the California Department of Forestry.
BOR continued to use Landsat TM, Indian Remote-Sensing Satellite mul-
tispectral and panchromatic data, and USGS digital orthophoto quarterquads to
map agricultural crops in the Colorado River basin, the Lahontan Basin in
Nevada, and the Central Valley of California. Water managers used irrigation
status and crop-type data with crop water use coefficients and locally varying cli-
mate data to calculate agricultural consumptive water use.
BOR continued mapping flood inundation perimeters and depths below
reclamation dams. Image analysts developed high-accuracy digital elevation
models (DEMs) from multireturn airborne LIDAR data. Hydraulic engineers used
these DEMs in conjunction with one- or two-dimensional hydraulic models to
predict flood water perimeters and depths for specific time intervals that would
result from a theoretical dam breach or spill event. GIS analysts overlaid maps of
maximum wetted area and maximum depth onto geographically referenced popu-
lation and infrastructure data derived from USGS, the Census Bureau,
Department of Transportation, Federal Emergency Management Agency, and
other Federal agencies to determine the human and economic impacts of the mod-
eled flood events.
During FY 2001, the Bureau of Indian Affairs (BIA) used remote sensing
and GPS to support BIA and tribal initiatives to map land use, inventory natural
2001 report 3/20/03 3:25 PM Page 76
Fi
sc
al
Y
ea
r
20
01
A
ct
iv
it
ie
s
77resources, conduct environmental assessments, support Safety of Dams program
initiatives, and map and inventory irrigation systems. Application specialists used
digital orthophotography, National Aerial Photography Program (NAPP) aerial
photography, National Elevation Dataset (NED) data, Digital Raster Graphics
(DRG), and IKONOS satellite imagery as backdrops for modeling inundation
zones associated with the potential catastrophic failure of earthen dams. BIA per-
sonnel also collected GPS data on high-priority dams under BIA jurisdiction. BIA
personnel developed inundation maps for input to Emergency Action Plans for
five dams during the reporting period.
Commercial GPS receivers were used to collect data for 1,539 ditch miles
and 19,518 associated structures in BIA-managed irrigation systems. In addition,
digital aerial photographs with GPS coordinates were collected for all structures.
These data sets were combined to map irrigation system and structure condition
on seven major BIA Irrigation Projects on Indian Reservations in the Western
United States. Aerial photos and satellite data were also key components in the
mapping process in both the Irrigation and Safety of Dams Projects. The BIA also
continued its use of the Precision Lightweight GPS Receivers (PLGRs) to access
the DoD Navstar GPS Precise Positioning Service (PPS), primarily at the field
office level. The PLGRs are being phased out, where appropriate, in favor of com-
mercial systems as the life span of PLGRs is being reached.
The Minerals Management Service (MMS) supported University of
Colorado scientists in research on satellite altimetry using the TOPEX/Poseidon
and European Remote Sensing-2 (ERS-2) satellites. This work has improved esti-
mates of sea surface height and ocean currents, particularly for the large Loop
Current eddies in the Gulf of Mexico. Accurate ocean currents are important for
estimating oil spill trajectories and can affect offshore oil and gas operations.
MMS continued to use GPS data to assist in determining baseline points
that are used to delineate offshore boundaries in the U.S. Virgin Islands. Accurate
boundaries were needed to support Territorial Submerged Lands jurisdictions, as
well as a proposed national monument for protection of coral reefs around the
islands of St. Thomas and St. Croix.
The USGS and BLM used Landsat-7, RADARSAT-2 synthetic aperture
radar (SAR) images to investigate glacier dynamics and change at Bering Glacier,
Alaska. The observations are used to map the retreat of the glacier terminus as it
2001 report 3/20/03 3:25 PM Page 77
Ae
ro
na
ut
ic
s
an
d
Sp
ac
e
Re
po
rt
o
f
th
e
Pr
es
id
en
t
78 undergoes large-scale calving in Vitus Lake. Vitus Lake is now expanding, and a
marine ecosystem is rapidly evolving. The stability of the ice dam that impounds
water in Berg Lake remained under study to assess potential hazards should the
dam fail.
The USGS and the French Space Agency (CNES) have developed multi-
sensor techniques to estimate snow pack thickness and water equivalent from
microwave instruments. The combination of passive microwave observations
obtained by the Special Sensor Microwave Imager (SSM/I) on the Defense
Meteorological Satellite and the dual frequency TOPEX/Poseidon radar altimetry
measurements have yielded more accurate snow depths than previously attained
by SSM/I observations when the technique was applied to the U.S. Northern
Great Plains, with the heavy snow year of 1997 used as a test case.
Cleveland Volcano in the Aleutian Islands, Alaska, sent ash plumes across
the air lanes of the North Pacific three times in February and March 2001.
Scientists at the USGS Alaska Volcano Observatory detected the ash clouds by
using data from meteorological satellites, Landsat 7, and other sources, and quickly
informed Federal and State agencies, including the Federal Aviation
Administration, the National Weather Service, and local Air Force installations,
of the hazard. These ash clouds disrupted international air traffic in the busy North
Pacific corridor during the first 48 hours after each of the explosions. Timely infor-
mation on the position of ash clouds helps minimize both the cost of such
eruptions to the airlines and the danger and inconvenience they pose to the
public. Satellite data was the main monitoring tool for this eruption because
Cleveland Volcano (which has erupted at least 11 times since 1893) was not yet
monitored seismically at the end of the fiscal year.
In FY 2001, USGS scientists used SAR data from the ERS satellites and the
interferometric SAR (InSAR) technique to detect uplift of the ground surface
over a broad area centered 5 kilometers west of South Sister Volcano in the Three
Sisters region of the central Oregon Cascade Range. The initial uplift, which
occurred between 1996 and 2000, covers an area about 15 to 20 km in diameter,
with the maximum amount of uplift being about 10 centimeters. Close aerial
inspections of the area revealed no unusual surface features. Scientists from the
Cascades Volcano Observatory installed a seismometer near the center of the area
to see if there are any earthquakes associated with the deformation. The uplift,
which is most likely caused by intrusion of magma, appeared from InSAR analysis
2001 report 3/20/03 3:25 PM Page 78
Fi
sc
al
Y
ea
r
20
01
A
ct
iv
it
ie
s
79results to be continuing. The USGS continued to monitor the area to assess the
probability of an eruption. This was the first successful use of the InSAR technique
in the Cascades region.
USGS also used the InSAR technique to study land surface deformation
associated with natural recharge in the San Bernardino ground water basin of
Southern California. Several centimeters of uplift were detected during the first
half of 1993 in two areas of the basin based on InSAR analysis of ERS-1 and ERS-
2 images. This uplift correlates with unusually high runoff from the surrounding
mountains and increased ground water levels in nearby wells. The deformation of
the land surface identifies the location of faults that restrict ground water flow,
maps the location of recharge, and suggests the areal distribution of fine-grained
aquifer materials. Preliminary results demonstrate that naturally occurring runoff
and the resultant recharge can be used with interferometric deformation mapping
to help define the structure and important hydrogeologic features of a ground
water basin. This approach may be particularly useful in investigations of remote
areas with limited ground-based hydrogeologic data.
USGS, in collaboration with the University of Washington, tested the fea-
sibility of using helicopter-mounted radar equipment that is to measure river
discharge. River discharge traditionally has been measured by using sounding
weights to determine average river depth and rotating cups to determine river
velocity. For these experiments, standard ground-penetrating radar measured river
cross-sectional areas, and microwave radar developed by the Applied Physics
Laboratory, University of Washington, measured river velocity. Preliminary analy-
sis indicates that discharge can be measured within +/-10 percent of the discharge
value computed from stage readings at streamflow-gaging stations. Discharge
measurements using the radar method were made in an average of about 45 sec-
onds each, compared with several hours using the traditional method. The radar
method may have an important application during large regional floods when dis-
charge measurements are needed at many streamflow-gaging stations in a short
period of time, or for other applications in which the physical properties of a river
need to be defined.
USGS scientists used key predator bird species as part of long-term con-
taminant monitoring systems to assess the health of large river systems, bays, and
estuaries in the United States. In the past, scientists have used bird banding to
2001 report 3/20/03 3:25 PM Page 79
track where one such species, the American osprey, spent the winter and the
routes used to reach wintering sites. Scientists from USGS and the University of
Minnesota used NOAA satellites to track osprey migration routes by using small
radios. Knowledge about the speed of migration and the location of wintering
grounds gained in this way provides a better understanding of contaminant expo-
sure away from the nesting grounds in the United States.
Sandhill cranes migrate through the Platte River valleys of Nebraska, but
much is not known about their habitat use and ultimate destinations. During
FY 2001, researchers marked 51 cranes with satellite-monitored transmitters
attached to plastic leg bands and tracked them continuously from their staging
area along the Platte and North Platte Rivers in Nebraska, to their breeding
grounds. At the end of the fiscal year, results showed that lesser sandhill cranes
staging along the North Platte River breed mostly in Siberia and western Alaska.
Data show that most of the midcontinent population was present in late
March when the FWS conducted their annual population survey, providing man-
agers with key information on reliability of population size estimates derived from
the survey.
USGS biologists completed a pilot study of the year-to-year movements of
snowy owls in the Arctic. They used satellite telemetry to map the annual flight
paths of adult female snowy owls from Barrow, Alaska, through remote areas and
during periods of Arctic darkness. These data would have been impractical or
impossible to obtain with traditional tracking methods.
USGS biologists developed methods to predict brood and duckling survival
across the extensive Prairie Pothole region of the upper Great Plains by analyzing
habitat information in a GIS. They also used satellite radiotelemetry to monitor
mallard and gadwall duckling survival rates in relation to wetland and upland
habitat conditions. They collected imagery from a digital color-infrared camera to
monitor the availability of seasonal wetland habitat and to estimate the percent-
age of the landscape in perennial vegetation cover. USGS biologists used similar
satellite telemetry techniques to determine the survival, dispersal, and long-range
movements of prairie falcons from the Snake River Birds of Prey National
Conservation Area, Idaho.
In FY 2001, the USGS Grand Canyon Monitoring and Research Center
collected digital, high-resolution black-and-white and color-infrared aerial
2001 report 3/20/03 3:25 PM Page 80
Fi
sc
al
Y
ea
r
20
01
A
ct
iv
it
ie
s
81imagery over approximately two thirds of the Colorado River Ecosystem between
Lake Powell and Lake Mead. The USGS has collected aerial imagery annually
since 1990 to monitor change in the natural and cultural resources within the
ecosystem resulting from the operation of the Glen Canyon Dam. This informa-
tion is used by the Glen Canyon Adaptive Management Program to make
informed decisions on the operation of the dam that improve the values for which
the Grand Canyon National Park and the Glen Canyon National Recreation
Area were created.
USGS scientists cooperated with the U.S. Army Corps of Engineers
(USACE) and a private firm to complete initial high-definition airborne mapping
of glacial and bedrock outcrop sites in northern Lake Michigan that are used by
lake trout as spawning habitat. Mapping was done with the USACE/Navy
Scanning Hydrographic Operational Airborne LIDAR Survey (SHOALS) system
that uses a LIDAR sensor to make lake-floor maps in areas too shallow for practi-
cal use of conventional sonar systems, such as reefs and near-shore areas. Fishery
resource management agencies used this information to determine whether
degraded spawning habitat is one of the factors adversely affecting the rehabilita-
tion of trout populations in Lake Michigan.
USGS scientists regularly used GPS in FY 2001 to support scientific
research conducted in the Great Lakes basin. Side-scan sonar surveys conducted
throughout the Great Lakes basin and habitat-mapping projects in the St. Claire-
Detroit River System required GPS technology to locate sample sites and provide
geographic reference for biological data. Larval fish habitat preference studies in
Lake Erie used GPS to guide repetitive sampling procedures and simplify naviga-
tion in open water. GPS was also used for locating field sites while conducting
native clam research in several NPS national parks and lakeshores in Michigan
and wetland restoration projects in cooperation with FWS on national wildlife
refuges in Michigan and Ohio.
USGS scientists used GPS to conduct annual fish stock assessments in all
five Great Lakes in cooperation with the international Great Lakes Fishery
Commission and State, tribal, and Canadian fishery management agencies. These
data are used to make management decisions on fish stocking and harvest quotas
to promote the ecological and economic sustainability of Great Lakes commercial,
sport, and tribal fisheries. USGS scientists also used GPS to guide studies on the
2001 report 3/20/03 3:25 PM Page 81
82 recovery of the burrowing mayfly (Hexagenia) populations in western Lake Erie,
Saginaw Bay (Lake Huron), and Green Bay (Lake Michigan). Hexagenia is an
important food source for many kinds of Great Lakes fishes, and its increasing
numbers in recent years is an indicator of improving Great Lakes water and bottom
sediment quality. In contrast, another important fish food organism is the deep-
water amphipod, Diporeia, and its declining numbers were investigated at sites
located by GPS in Lakes Ontario and Huron.
USGS scientists on the NASA Earth Observing-1 (EO-1) satellite Science
Validation Team worked to determine whether data from the EO-1 satellite could
be used to detect and map leafy spurge, an invasive plant species in Theodore
Roosevelt National Park, North Dakota. Preliminary analysis of multiple data sets
collected during the 2001 growing season with the EO-1 Hyperion hyperspectral
sensor indicated the feasibility of delineating stands of leafy spurge larger than 30
m in diameter in grassland and badland environments of the park.
USGS scientists used high-spatial-resolution IKONOS satellite data and
NASA’s Advanced Spaceborne Thermal Emission and Reflection Radiometer
(ASTER) multispectral satellite data to map small but important and sensitive
bird habitat types such as pockets of forested wetlands on islands in the Great
Lakes. These features were essentially unidentifiable with other commercially
available spaceborne sensors. Protection of Great Lakes island habitats is one of
the highest management priorities of the FWS in the Great Lakes region. Landsat
ETM+ images were used for project planning and wetland research at Seney
National Wildlife Refuge, a very large refuge on the Upper Peninsula of Michigan
where a USGS/FWS wetland restoration project is ongoing.
USGS and a private company began developing new techniques to moni-
tor infestations of water hyacinth, an exotic aquatic weed infestation that is
causing major damage to the ecosystem and economy of the Lake Victoria basin of
East Africa. They used RADARSAT, Landsat, and IKONOS satellite data to pro-
vide timely information to aquatic plant managers in East Africa. USGS scientists
documented a major infestation in Winam Gulf, Kenya, which peaked at 180 km2
of areal extent in November 1998, and subsequently declined to under 1 km2 by
February 2000. USGS and the company are helping East African governments to
implement an operational monitoring system.
Ae
ro
na
ut
ic
s
an
d
Sp
ac
e
Re
po
rt
o
f
th
e
Pr
es
id
en
t
2001 report 3/20/03 3:25 PM Page 82
Fi
sc
al
Y
ea
r
20
01
A
ct
iv
it
ie
s
83Since 1975, the USGS has chaired the Civil Applications Committee,
chartered by the Office of the President, to facilitate the use of classified imagery
for applications that are central to many agency missions, such as environmental
monitoring, resource management, homeland security, natural hazards, and emer-
gency response applications. USGS continued to support this growing demand
through the National Civil Applications Project (NCAP). NCAP staff employed
a network of secure national and regional facilities to help users acquire these data
for science investigations, and to generate custom and derived products. FY 2001
applications of classified data included glacier monitoring and delineation of
glacial karst features; tracking of migration and breeding patterns of animals
in remote locations; determining the surface characteristics of sea ice melt
ponds; gathering river stage information for flood forecasting; and water
quality monitoring.
2001 report 3/20/03 3:25 PM Page 83

Ae
ro
na
ut
ic
s
an
d
Sp
ac
e
Re
po
rt
o
f
th
e
Pr
es
id
en
t
84
2001 report 3/20/03 3:25 PM Page 84
Fi
sc
al
Y
ea
r
20
01
A
ct
iv
it
ie
s
85
FEDERALCOMMUNICATIONSCOMMISSIONFCC
All FCC accomplishments in space during FY 2001 were related to communica-
tions and Earth observation satellites. The FCC formulates rules to facilitate and
regulate the U.S. domestic satellite industry and the licensing of all stations and
satellite launches. Internationally, the FCC continued to coordinate satellite place-
ment with other countries. FCC specific accomplishments are outlined for FY 2001.
The FCC issued construction authorizations and authorized a number of
launches of communications satellites. There were 34 Ka-band Geostationary
Orbit/Fixed Satellite Service (GSO/FSS) satellites authorized for construction. In
the C/Ku bands, the FCC authorized SES Americom for two satellites which were
launched in October and December 2000.
The FCC granted operational licenses to The Boeing Company, Celsat
America, Inc., Constellation Communications Holdings, Inc., Globalstar, L.P.,
Iridium LLC, Mobile Communications Holdings, Inc., ICO Services Ltd., and TMI
Communications and Company, L.P., in the 2 GHz band. An Earth Exploration
Satellite Service (EESS) license was granted to AstroVision, and the DirecTV 5
space station license was granted in November 2000. In addition, 34 Ka-band
GSO/FSS satellites were licensed to 11 companies.
Several satellites authorized by the FCC became operational during FY 2001.
These were VITA, a little LEO licensee; and EarthWatch, an EESS licensee. Also,
XM Radio began providing Satellite Digital Audio Radio Service broadcast in
September 2001.
During FY 2001, the FCC was also active in international satellite coordi-
nation with Argentina, Brazil, Canada, ESA, INTERSPUTNIK, Mexico,
2001 report 3/20/03 3:25 PM Page 85

Ae
ro
na
ut
ic
s
an
d
Sp
ac
e
Re
po
rt
o
f
th
e
Pr
es
id
en
t
86 Netherlands, Papua New Guinea, United Arab Emirates, United Kingdom,
Uruguay, and Venezuela in the C/Ku-band. Other coordination meetings were also
concluded with Japan, Norway, and the Russian Federation.
2001 report 3/20/03 3:25 PM Page 86
Fi
sc
al
Y
ea
r
20
01
A
ct
iv
it
ie
s
87
DEPARTMENT OFAGRICULTUREUSDA
During FY 2001, several USDA agencies regularly used remotely sensed data to
support operational and research activities. These agencies include, but are not
limited to, the Agricultural Research Service (ARS), Foreign Agricultural Service
(FAS), Farm Service Agency (FSA), Forest Service (FS), National Agricultural
Statistics Service (NASS), and Natural Resources Conservation Service (NRCS).
Following are brief summaries from these six agencies describing how remotely
sensed data were used to accomplish departmental goals and objectives during
FY 2001.
The ARS research program used remotely sensed data and related tech-
nologies to develop techniques and methodologies to monitor, assess, and
administer agricultural, rangeland, and natural resources. ARS identified eight
areas for research of the application of remotely sensed information to agricultural
and natural resource problems. These areas encompassed 1) soil properties and
assessment, 2) hydrometeorology, 3) crop management, 4) range management, 5)
land use evaluation, 6) water quality and aquatic ecosystems, 7) sensor develop-
ment and calibration, and 8) development of analytical tools for remotely sensed
data. ARS scientists were involved in a broad remote-sensing research program
that involved more than 30 laboratories. These laboratories cooperated exten-
sively with other Federal and State agencies, in this country and abroad, to extend
the applications of remotely sensed data for agricultural and natural resources man-
agement. This research resulted in the development of new and cost-effective
methods to assess agricultural and natural resources at local, regional, and global
scales. The following examples epitomize the breadth and depth of remote-sensing
research in ARS.
2001 report 3/20/03 3:25 PM Page 87
88 ARS scientists used remote-sensing data from ground, aircraft, and satellite
platforms to develop methods to monitor, assess, and manage the Nation’s waters
on small and large scales. For example, at the Kika de la Garza Subtropical
Agricultural Research Center in Weslaco, Texas, scientists used aerial photogra-
phy and videography to detect water-lettuce infestations in Texas waterways.
Similarly, scientists at the Northwest Watershed Research Center in Boise, Idaho,
used very-large-scale, color-infrared aerial photography of stream segments to
quantify stream shading by riparian vegetation. Stream shading was under consid-
eration by the Environmental Protection Agency as a possible remotely sensed
surrogate for direct stream temperature measurements because it is logistically
impossible to use ground-based techniques to characterize the spatial dynamics of
stream temperature within extensive and remote rangeland stream systems.
Researchers in Louisiana, Maryland, Mississippi, and Texas used remote sensing to
develop methods to monitor water quality. A prototype submersible sensor to
monitor harmful algal species, such as those responsible for red tide and dead
zones, was being tested in the St. John’s River in collaboration with other regional,
State, and Federal agencies.
ARS scientists in Arizona, Georgia, Idaho, Iowa, Maryland, New Mexico,
Mississippi, Oklahoma, and Texas collaborated with personnel from NASA and
other Federal and international agencies to study interactions between the Earth’s
surface and atmosphere, and how these interactions influence climate change and
the management of agricultural and natural resources. For example, researchers
from the ARS Hydrology and Remote Sensing Laboratory and the University of
Virginia, Department of Environmental Sciences, explored the coupling between
the land and the atmospheric boundary layer using a three-dimensional turbulence
large eddy simulation model and remotely sensed land surface images. An analysis
of the results revealed the existence of scale-dependent earth/atmosphere interac-
tions, suggesting that significant changes in regional land use or agricultural
practices could affect local and regional climate. This research was a fundamental
step in addressing the effects of climate change on agricultural resources and will
help in the development of mitigation strategies.
In Arizona, California, Colorado, Iowa, Maryland, Missouri, Nebraska, and
Texas, ARS scientists worked on developing remote sensors and techniques to
monitor crop growth, soil conditions, and plant water and fertilizer requirements.
Ae
ro
na
ut
ic
s
an
d
Sp
ac
e
Re
po
rt
o
f
th
e
Pr
es
id
en
t
2001 report 3/20/03 3:25 PM Page 88
Fi
sc
al
Y
ea
r
20
01
A
ct
iv
it
ie
s
89These sensors and techniques have helped in the development of precision farm-
ing techniques that enable farmers to maximize crop production while minimizing
agricultural effects on the environment. Work also focused on sensor calibration.
ARS scientists from the U.S. Water Conservation Laboratory in Phoenix,
Arizona, and from the Southwest Watershed Research Center in Tucson, Arizona,
teamed with personnel from NASA Stennis Space Center and the National
Imaging and Mapping Agency to perform a multiple-platform calibration in July
2001. Images of the University of Arizona’s Maricopa Agricultural Center were
acquired via sensors aboard IKONOS, Landsat 7, and NASA Earth Observing
System (EOS) satellites, as well as aircraft ranging from a Learjet to a powered
parachute. Ground crews measured plant and soil parameters, surface properties,
and atmospheric conditions in support of this project. ARS scientists used these
data to evaluate each sensor’s suitability for helping growers make better informed
management decisions related to the water and nutrient needs of their crops.
ARS personnel applied remote sensing in recent studies of insect, weed, and
disease infestations and rangeland conditions. One goal of this research was to
develop new remote-sensing tools and techniques to help decisionmakers better
manage pests and weeds affecting agriculture and natural resources. For example,
the ARS Screwworm Research Program found that screwworm population densi-
ties were highest in edges between mature forests and open fields in the tropics.
Researchers developed methods to identify these habitats using Landsat Thematic
Mapper (TM), SPOT, and RADARSAT satellite data. The ability to locate prob-
able screwworm populations using remotely sensed data would increase the
efficiency and effectiveness of USDA’s biological control of screwworm.
The FAS remote-sensing program is administered by the Production
Estimates and Crop Assessment Division (PECAD). PECAD is the focal point
within FAS and USDA for assessing global agricultural production and conditions
that affect world food security. PECAD is the world’s most extensive and longest
running (20 years) operational user of commercial satellite data, using numerous
satellite platforms to evaluate agronomic situations worldwide. This basic market
intelligence effort was mandated in the legislation, establishing the agency in 1954
(Title VI of the Agricultural Act of 1954). PECAD is the only operational unit of
its type in the world.
2001 report 3/20/03 3:25 PM Page 89
Ae
ro
na
ut
ic
s
an
d
Sp
ac
e
Re
po
rt
o
f
th
e
Pr
es
id
en
t
90 PECAD was responsible for global crop condition analysis and estimates of
world grain, oilseed, and cotton production. Satellite remote-sensing data are a
critical components used in making crop production and condition estimates for
key markets and competitors, providing reliable, repeatable, and comparable
observations. In 2001, the division confirmed and enhanced remote-sensing data
by incorporating economic, weather, crop model, and field observation data in a
“convergence of evidence” methodology. These data came from public and
private sources. Remote sensing enabled PECAD to obtain information in regions
where such information is often difficult to obtain. Satellite data were
frequently more timely and reliable, and often more complete, than conventional
sources. Furthermore, satellite data were quite inexpensive compared to the cost
of maintaining staff in overseas offices or continually funding travel for
U.S.-based analysts.
PECAD helped USDA and other agencies “right size” food aid and other
emergency response efforts by providing unbiased assessments of the influence of
weather and other events on food supplies. Two division analysts provided full-
time support to the USDA Farm Service Agency (FSA) by providing crop
condition assessments and early warnings of crop disasters through the FSA/FAS
Center for Remote-Sensing Analysis. FAS also shared data and analyses with
other USDA and U.S. Government agencies to meet national security require-
ments and assess global food security needs. In 2000, USDA designated FAS as the
repository and manager of the USDA Satellite Imagery Archive. FAS purchased,
archived, and shared satellite data with six other USDA agencies, substantially
reducing individual agency costs. All high- and medium-resolution and some low-
resolution satellite data were purchased commercially. Some low-resolution data
was acquired from NASA and NOAA. NOAA and the U.S. Air Force Weather
Agency (AFWA) provided the satellite weather data.
FSA completed a three-state pilot that compared alternative methods for
collecting aerial photography for farm program compliance. During FY 2001, FSA
acquired most of the U.S. agricultural area data using light aircraft equipped with
35-millimeter cameras and color slide film. FSA tested approaches to replace this
methodology with a program that delivered 1 to 2 m geo-referenced digital
imagery. FSA challenged the private sector to collect, rectify, package by county,
and deliver, within 60 days of the flying window, usable products. Data for 51
2001 report 3/20/03 3:25 PM Page 90
Fi
sc
al
Y
ea
r
20
01
A
ct
iv
it
ie
s
91counties in Kansas and Nebraska were collected through this project, and the
result was an amazing achievement for inexpensive, high-quality digital images. As
an added benefit, FSA had the color film, similar to that available through the
National Aerial Photography Program (NAPP), stored at the Aerial Photography
Field Office in Salt Lake City, Utah. The film was capable of being scanned to
create 1-meter Digital Orthophoto Quadrangles.
As a result of the Kansas and Nebraska pilots, FSA began a major paradigm
shift. FSA began redirecting its $500,000 NAPP cost-share money to contract
internally to create digital products that can serve FSA compliance requirements.
These products were anticipated to be a great national asset, used by Federal, State
and local Governments, as well as the public, to obtain low-cost, high-resolution
digital images of domestic agricultural areas. FSA spent about $2 per square mile
to acquire film for the 35- millimeter compliance program. In contrast, this new
digital acquisition method required $12 to $14 per square mile. The FSA FY 2002
and 2003 budgets would not allow this innovation to be fielded.
The FSA also tested a lower cost alternative in Minnesota. Here, compa-
nies flew small aircraft with digital sensors and 35-millimeter film-based cameras.
These products were not geo-referenced as well and, combined with a small foot-
print, were more difficult to use. This new digital acquisition method required $4
to $8 per square mile.
FS continued to manage 191 million acres of public lands in national forests
and grasslands, and provided technical and financial assistance to State and pri-
vate forestry agencies. FS also continued its role as the largest forestry research
organization in the world. Wildfires in 2000 and 2001 were larger, more frequent,
and more numerous than those seen in recent years. The number and severity of
these fires severely taxed Federal and State wildfire management resources. The FS
Remote Sensing Applications Center (RSAC) collaborated with staff at NASA
Goddard Space Flight Center and the University of Maryland to develop the
Moderate-Resolution Imaging Spectroradiometer (MODIS) Land Rapid Response
System, providing a range of time-critical data to the National Interagency Fire
Center (NIFC) and other Federal and State users. Staff at the RSAC used MODIS
data to generate cumulative and daily active fire maps, and disseminated the maps
to users via an Internet Web-based system. The Federal wildfire community used
this near-real-time data to assist in the strategic allocation of assets and in post-fire
2001 report 3/20/03 3:25 PM Page 91
92 rehabilitation efforts. Before the end of the fiscal year, technicians installed an
antenna at the RSAC facility in Salt Lake City, Utah, to receive Direct Broadcast
MODIS data that was expected to become operational in FY 2002.
NASA also supported FS by acquiring high-altitude color photography over
the nearly 1,600,000 acres of the Deschutes National Forest. The imagery included
large format camera 9 x 18-inch color-infrared photography at 1:30,000 scale and
9 x 9-inch color-infrared photography at 1:60,000 scale. FS staff used this photog-
raphy for a wide range of resource management applications, including
recreational planning and forest health management.
The mission of NASS continued to be the provision of timely, accurate,
and useful statistics describing U.S. agriculture. These statistics cover virtually
every facet of domestic agriculture, from the production and supply of food and
fiber to the prices paid and received by farmers and ranchers.
During FY 2001, NASS personnel used remote-sensing data to construct
area frames for statistical sampling, estimate crop area, and create crop-specific
land-cover data layers for geographic information systems (GIS). For area frame
construction, NASS staff combined digital Landsat and SPOT data with U.S.
Geological Survey (USGS) digital line-graph data, enabling users to assign a cat-
egory to each piece of land in a State based on the percentage of cultivated land
and other variables. NASS implemented a new remote-sensing-based area frame
and sample for Tennessee and Wisconsin. The remote-sensing acreage estimation
project analyzed Landsat data from the 2000 crop season in Arkansas, Illinois,
Indiana, Iowa, Mississippi, New Mexico, and North Dakota. These data were used
to produce crop acreage estimates for major crops at State and county levels, and
to develop a crop-specific categorization of a digital mosaic of TM scenes, which
was distributed to users on a CD-ROM. For the 2001 crop season, NASS head-
quarters and several NASS field offices continued partnership agreements with
State organizations, working to decentralize Landsat processing and analysis tasks,
and expanding into the boot heel of Missouri and a pilot area in southeastern
Nebraska. The pilot area in southeastern Nebraska was a joint project with FSA
to examine the accuracy of NASS crop-specific categorizations. Data for 2001
acreage estimation analyses were collected in Arkansas, Illinois, Indiana, Iowa,
Mississippi, Missouri, New Mexico, and North Dakota. NASS, in conjunction
with ARS, began studying data obtained from the MODIS sensor on the NASA
Ae
ro
na
ut
ic
s
an
d
Sp
ac
e
Re
po
rt
o
f
th
e
Pr
es
id
en
t
2001 report 3/20/03 3:25 PM Page 92
Fi
sc
al
Y
ea
r
20
01
A
ct
iv
it
ie
s
93Terra satellite for use as an additional input for setting yield estimates and as a pos-
sible replacement for Advanced Very-High-Resolution Radiometer (AVHRR)
data in generating vegetation condition images.
NRCS is the primary Federal agency working with private landowners to
help them protect their natural resources. Much of the land management business
conducted by NRCS requires the use of good science and practical technology,
such as remote sensing. NRCS has used aerial photography and related remote-
sensing products for over 50 years to conduct agency programs and business.
In FY 2001, aerial photography and orthoimagery (1-meter resolution) were
used extensively nationwide for conducting soil surveys as part of the National
Cooperative Soil Survey program. Soil scientists used digital orthoimagery to map
and digitize soils at their true map positions on the ground. NRCS personnel also
used digital orthoimagery for conservation planning, wetland delineations, water-
shed planning, and to provide technical assistance to landowners and
communities. NRCS acquired and used high-quality (1-foot resolution) aerial
photography to conduct the annual continuous National Resources Inventory
(NRI). In FY 2001, the agency expanded use of GIS to most county field offices.
As a result, the need for digital orthoimagery for use as a mapping and planning
base map also increased.
NRCS obtained all of its aerial photography and digital orthoimagery from
commercial sources. NRCS coordinated with USDA and other Federal agencies in
the purchase of aerial photography and digital orthoimagery. Much of the aerial
photography was obtained through NAPP, a partnership of Federal and State agen-
cies. Digital orthoimagery was coordinated and obtained through the National
Digital Orthophoto Program (NDOP), a partnership of Federal and State agencies
having common imagery requirements. All of the data developed through these
national imagery programs became part of the public domain, permitting agencies
to share these data and imagery internally and externally without licensing or
use restrictions.
The NRI program required high-resolution imagery over confidential sta-
tistical sampling sites. In FY 2001, NRCS purchased high-quality imagery for
approximately 72,500 sites nationwide. The USDA Aerial Photography Field
Office of FSA contracted for the imagery. The FSA office had responsibility for
contracting aerial photography in the USDA.
2001 report 3/20/03 3:25 PM Page 93
Ae
ro
na
ut
ic
s
an
d
Sp
ac
e
Re
po
rt
o
f
th
e
Pr
es
id
en
t
94 Compared to the purchase and use of aerial photography and digital imagery
derived from airborne systems, NRCS purchased and used only a modest amount
of satellite imagery. Most NRCS programs and activities required high-resolution
imagery from airborne systems. Satellite systems were not able to provide high-
resolution imagery to NRCS at a cost comparable to airborne systems.
NRCS was well represented on Federal mapping, remote sensing, GPS, and
geodata committees. Significant time and resources were devoted to supporting
the work of the Federal Geographic Data Committee, NAPP, NDOP, Interagency
GPS Executive Board, and other groups. Coordination efforts within these com-
mittees resulted in partnerships to cost share in the development, acquisition, and
sharing of imagery and geodata.
NRCS has actively used GPS for more than six years as a tool in support of
carrying out conservation programs and technical assistance. Over 1,000 GPS
receivers were in use at county field offices. In FY 2001, NRCS led a GPS mod-
ernization team of USDA county service center agencies to develop business
application requirements, equipment configuration specifications, and to provide
contact support to the department for the awarding of an USDA-wide GPS con-
tract for commercial off-the-shelf GPS receivers.
2001 report 3/20/03 3:25 PM Page 94
Fi
sc
al
Y
ea
r
20
01
A
ct
iv
it
ie
s
95
NATIONALSCIENCE FOUNDATIONNSFNSF continued to serve as the lead Federal agency for the support of ground-based
astronomy and space science, and sponsored a broad base of observational, theo-
retical, and laboratory research aimed at understanding the states of matter and
physical processes in the solar system, our Milky Way galaxy, and the universe.
NSF also supported advanced technologies and instrumentation, and optical and
radio observatories that maintain state-of-the-art instrumentation and observing
capabilities accessible to the community on the basis of scientific merit.
NSF-supported researchers extended their work to measure the very faint
fluctuations in the microwave light emitted by the hot gas in the early universe,
from a time before stars and galaxies formed. These additional data have strength-
ened the conclusion that the universe is nearly spatially flat and added information
about the higher order peaks in the power spectrum of primordial sound waves,
which have been used to estimate cosmological parameters, such as the expansion
rate, the age, and the total mass of the universe, and how much of that mass is
comprised of normal (baryonic) matter. Models of the universe which have a “flat”
geometry are dominated by (up to 90 percent) “dark” matter and fit the standard
nuclear physics models for the generation of the elements hydrogen and helium
during the big bang, and have been shown to be consistent with the observations.
Researchers involved in the Sloan Digital Sky Survey discovered, in the
spectrum of the most distant quasar known, the signature of neutral hydrogen in
the intergalactic medium, indicating that their observations are probing redshifts
before large numbers of quasars and galaxies formed. Recent observations of the
highest redshift quasar yet discovered showed the signature of a high optical depth
of neutral hydrogen. The existence of this neutral hydrogen indicates that in this
2001 report 3/20/03 3:25 PM Page 95
distant epoch, the universe had not yet been flooded with a substantial density of
ionizing photons from stars and quasars.
Recent radio observations of the prototypical starburst galaxy M82 revealed
a complex and dynamic system. NSF-funded researchers used the Owens Valley
Radio Observatory array to map the large-scale structure of molecular gas in M82.
The sensitivity and area coverage of the resulting high-angular-resolution data was
an order of magnitude better than previous interferometric observations. Their
images showed tidal stripping of the molecular gas along the plane of the galaxy
and coincident with streams of neutral hydrogen. The distribution of molecular gas
also coincides with the dramatic dust features seen in optical absorption. As much
as 25 percent of the total molecular mass of M82 is situated at large galactocentric
radii. Researchers with the Five College Radio Astronomy Observatory used the
14-meter telescope and the focal plane array system to identify molecular gas
located as high as 3 kiloparsecs above the plane of the disk of M82. Some of the
carbon monoxide (CO) emission is clearly associated with neutral hydrogen tidal
features that arise from the interaction of M82 with the large, neighboring spiral
galaxy M81. The molecular gas in these tidal features may have been directly
extracted from the molecular gas rich reservoir of M82 or formed in situ within the
tidal streams.
The large, spherical halo component of our own galaxy is believed to harbor
a substantial amount of unseen dark matter. NSF researchers recently observed
microlensing events toward the nearby Magellanic Clouds, indicating that 10 to
50 percent of this dark matter may be in the form of very old white dwarfs, the
remnants of a population of stars as old as the galaxy itself. A team of astronomers
used the Cerro Tololo InterAmerican Observatory 4-meter telescope to carry out
a survey to find faint, cool white dwarfs in the solar neighborhood that would be
members of the halo. The survey revealed a substantial population of white dwarfs,
too faint and cool to have been seen in previous surveys. The newly discovered
population accounts for at least 2 percent of the dark matter, or about an order of
magnitude larger than previously thought, and represents the first direct detection
of galactic halo dark matter. The objects are also found in astrometric survey pho-
tographs with other telescopes, and spectra taken at the Cerro Tololo
InterAmerican Observatory confirmed their white dwarf nature.
2001 report 3/20/03 3:25 PM Page 96
Fi
sc
al
Y
ea
r
20
01
A
ct
iv
it
ie
s
97Research into the birth and the death of stars and their planetary systems
continued to be an active area of investigation and discovery. Radio and infrared
studies revealed protostars in the process of formation and extended structures
around them that indicate preplanetary disks. Young stars at different evolutionary
stages show complex outflows of wind and jets. High-resolution images of CO
emission show shell structures and reveal close associations between the mor-
phologies of CO and molecular hydrogen emission features. The CO kinematics
show evidence of bow-shock interactions in a number of sources and evidence for
wide-angle wind interactions. Scientists running simulations found that neither of
the current popular models for stellar outflow, pure jet wind, or wide-angle wind
adequately explain all morphologies and kinematics.
A major impetus to the observational and theoretical studies of the forma-
tion of stars and their planetary disks has been provided in the last few years by the
discovery of extra-solar planets. NSF has supported much of this work. A recent
discovery, again by the team of Marcy, Butler, Fischer, and Vogt, found a planet
three-quarters the mass of Jupiter in a circular orbit around the solar-like star 47
Ursa Majoris. Although 70 extra-solar planets have been found thus far, this is the
first system with two planets in circular orbits—at distances that make the plane-
tary system similar to our own.
Brown dwarfs are cool, dim objects with masses between that of Jupiter and
the Sun, so small that their cores never become hot enough to burn hydrogen into
helium. Only the slow cooking of the limited amount of deuterium in the stellar
interior is possible. Progress in the discovery and study of brown dwarfs has been
possible through the large coordinated efforts of the 2 Micron All Sky Survey and
Sloan Digital Sky Survey, both of which have been supported partly by NSF.
Individual researchers have been following up these discoveries and investigating
the physical properties of these new objects. Under an award in a joint NSF-
NASA grants program, investigators from New Mexico State University and
Washington University have developed cool cloud models appropriate to the cool,
substellar temperatures found in brown dwarf atmospheres. Their new models
explain the color changes seen in the spectral sequence of brown dwarfs, and their
thermochemical calculations have wide application to the derivation of tempera-
ture and pressure indicators for gas giant planets, as well as brown dwarfs. Their
models also predicted that large grains precipitate out of the brown dwarf atmos-
pheres, just as rain does on Earth.
2001 report 3/20/03 3:25 PM Page 97
Ae
ro
na
ut
ic
s
an
d
Sp
ac
e
Re
po
rt
o
f
th
e
Pr
es
id
en
t
98 The national astronomy centers generate substantial databases and archives
of observational data, often through coordinated surveys, which enable research
beyond the scope of a single researcher. A recent example was the National
Optical Astronomy Observatory’s Deep Wide-Field Survey, an extensive, multi-
year, multicolor survey using the 4-meter telescopes at Kitt Peak and at Cerro
Tololo. The first results, covering an area of 1.15 degrees square, and with it over
300,000 faint galaxies and stars, were released in January 2001. When the survey
is completed in spring 2002, the full area will be 15 times this size and will provide
deep images in both the visible and infrared. With it, astronomers will be able to
study large-scale structures in the universe, the formation and evolution of galax-
ies and quasars, rare stellar populations, and the structure of the Milky Way.
Among the areas of development supported by instrumentation programs at
NSF is optical interferometry, which will enable diffraction-limited imaging using
aperture synthesis methods to create images from telescopes with effective aper-
tures up to 1 kilometer in diameter. Recent results from the Infrared Stellar
Interferometer, under development by Townes at UC Berkeley, show the potential
of such instrumentation—measurements of nearby stars indicate that our previous
understanding of stellar sizes has been confused by the dust and gas surrounding
evolved stars. New measurements with ISI show stellar radii some 10 to 25 percent
larger than previous measurements, changes that have implications for our models
of stellar structure and atmospheres, temperature, and ultimately distance scales.
NSF continued a joint activity with the Air Force Office of Scientific
Research to provide the U.S. astronomical community with access to state-of-the-
art facilities at the Advanced Electro-Optical System (AEOS) telescope, in Maui,
Hawaii. The capability of this 3.76-meter advanced technology telescope for sci-
entific research is illustrated with its recent observations of Jupiter’s satellite
Ganymede. Images obtained with AEOS resolve details only 270 km in size, per-
forming significantly better than the Hubble Space Telescope.
NSF also supported technological development in the field of radio astron-
omy that involves the real-time adaptive cancellation of unwanted radio
interference using adaptive digital filters and special signal-processing algorithms.
Researchers at the National Radio Astronomy Observatory, Brigham Young
University, Ohio State University, and the University of California at Berkeley
have begun a program of recording high-speed data samples of signals that are
2001 report 3/20/03 3:25 PM Page 98

Fi
sc
al
Y
ea
r
20
01
A
ct
iv
it
ie
s
99known to cause interference to radio astronomical observations. With these
samples in hand, tests of canceling algorithms were underway at the end of the
fiscal year and have proven to be very successful for certain kinds of well-
characterized and predictable signals, as in the cancellation of a signal from the
GLONASS satellite.
2001 report 3/20/03 3:25 PM Page 99

Ae
ro
na
ut
ic
s
an
d
Sp
ac
e
Re
po
rt
o
f
th
e
Pr
es
id
en
t
100
2001 report 3/20/03 3:25 PM Page 100
Fi
sc
al
Y
ea
r
20
01
A
ct
iv
it
ie
s
101
DEPARTMENT OFSTATEDoSThe Department of State (DoS) conducted successful negotiations with the
Japanese government to resolve issues related to the 1995 U.S.-Japan Agreement
Concerning Cross-Waiver of Liability for Space Cooperation that had been
impeding successful implementation of the agreement.
During FY 2001, the Department of State led U.S. Government participa-
tion in the United Nations’ Committee on the Peaceful Uses of Outer Space
(COPUOS). Over the past year, the committee undertook significant work in
areas such as addressing the problem of orbital space debris, global navigation
satellite systems, meteorology, astronomy and astrophysics, space transportation,
human space flight, planetary exploration, and environmental monitoring. The
committee also considered legal issues related to international liability and respon-
sibility of launching nations, international financial security interests in space
equipment, and the equitable access to the geostationary orbit.
The Department of State provided funding for a series of four regional
Global Navigation Satellite Systems (GNSS) Workshops and one Plenary Session
to be held during 2001–2002. These workshops are being held under the auspices
of the United Nations and the United States. The first two workshops were held
in Kuala Lumpur, Malaysia, for the Asia Pacific regions, and in Vienna, Austria,
for the Eastern European region. Both workshops were highly successful in bring-
ing together regional experts and decisionmakers to advance awareness and
support for use of GNSS applications for sustained growth, transportation safety,
and environmental management.
In addition to the GNSS workshops, the DoS led GPS international out-
reach efforts for the interagency GPS Executive Board Secretariat. As a result, the
2001 report 3/20/03 3:25 PM Page 101
Ae
ro
na
ut
ic
s
an
d
Sp
ac
e
Re
po
rt
o
f
th
e
Pr
es
id
en
t
102 GPS exhibit and support team carried the U.S. message to such venues as the
International Civil Aviation Organization General Assembly in Montreal and the
Working Party 8D of the International Telecommunication Union in Geneva.
The Department of State also presented a draft framework agreement
between the United States and the European Community on Satellite Navigation
Systems in October 2000. This led to two negotiation sessions with the European
Community based on the draft.
2001 report 3/20/03 3:25 PM Page 102
Fi
sc
al
Y
ea
r
20
01
A
ct
iv
it
ie
s
103
DEPARTMENT OFENERGYDoEDoE’s Office of Nuclear Energy continued to support NASA’s Space Exploration
Program by providing radioisotope power sources and heater units, and developing
new advanced power systems covering the range of power levels required to meet
more stringent power system requirements for future missions. DoE personnel pro-
vided safety analyses to support the NASA Environmental Impact Statement for
the potential use of radioisotope heater units on the Mars 2003 mission. DoE con-
ducted competitive procurements with several potential system contractors for
development of conceptual designs for a Stirling radioisotope power system. A
Stirling engine is one in which work is performed by the expansion of gas at high
temperature to which heat is supplied through a wall. At the end of the fiscal year,
DoE specialists were evaluating these contractor designs and expected to select
one for further development. Additionally, DoE initiated actions to procure a
system contractor to develop a multimission radioisotope thermoelectric generator
(RTG) suitable for use in a variety of environments such as the surface of Mars and
deep space. Finally, following a bench-scale demonstration in 2000, DoE pro-
ceeded to install a full-scale process to recover Plutonium-238 scrap for reuse as an
energy source for radioisotope power systems for future NASA missions.
In FY 2001, DoE’s Office of Science cooperated with NASA in a wide vari-
ety of activities, such as bringing the experimental techniques of fundamental
physics for use in outer space, using the science and technology plasma science to
devise new propulsion systems, joint efforts to understand atmospheric and envi-
ronmental phenomena, and a working partnership in advanced computing
research. These activities were carried out under a Memorandum of
Understanding between NASA and DoE signed by NASA Administrator Goldin
and DoE Secretary Watkins in 1992.
2001 report 3/20/03 3:25 PM Page 103
Through an Implementing Arrangement with NASA signed in 1995, the
Office of Science continued in 2001 to build the Alpha Magnetic Spectrometer
(AMS) for use on the International Space Station. The AMS is an international
experiment designed to use the unique environment of space to search for and
measure, with a much greater sensitivity than heretofore possible, various unusual
types of matter. AMS will study the properties and origin of cosmic particles and
nuclei, including antimatter and dark matter. Discovering the presence of either
material will increase scientists’ understanding of the early universe and could
potentially lead to a clearer understanding of the actual origin of the universe.
Funding in FY 2001 was used for analysis of data acquired during a 10-day Shuttle
flight in 1998, and for planning and fabrication for an upcoming Shuttle flight, for
the eventual deployment on the International Space Station in 2003.
DoE’s Office of Science and NASA’s Office of Space Science worked
together in FY 2001 to build the Large-Area Telescope (LAT), the primary instru-
ment for the Gamma-ray Large-Area Space Telescope (GLAST) project. This
device, using the techniques of experimental particle physics research, detects
gamma rays emitted by the most energetic objects and phenomena in the universe.
Stanford University and the Stanford Linear Accelerator Center (SLAC) are
responsible to the Office of Science and to NASA for overall project direction.
SLAC, a DoE facility at Stanford University, is responsible for the assembly and
integration of the complete instrument, data acquisition system management, as
well as software development for GLAST’s flight system and science analysis. DoE
provided funding in FY 2001 for R&D, design, and fabrication of the telescope, in
conjunction with NASA and international partners. At the end of FY 2001, the
launch was anticipated to take place in 2004.
DoE’s Oak Ridge National Laboratory (ORNL) and NASA’s Johnson Space
Center collaborated in FY 2001 on the development of an advanced rocket
technology that could cut in half the time required to reach Mars. Called the
Variable-Specific Impulse Magnetoplasma Rocket (VASIMR), the technology is a
precursor to fusion rockets and was developed in DoE’s magnetic fusion program.
The VASIMR concept could provide a powerful means of propulsion by utilizing
plasma as the propellant. A key to the technology is the capability to vary the
plasma exhaust to maintain optimal propulsive efficiency.
2001 report 3/20/03 3:25 PM Page 104
Fi
sc
al
Y
ea
r
20
01
A
ct
iv
it
ie
s
105Some of the new fusion technologies being developed for VASIMIR include
magnets that are super-conducting at space temperatures, compact power genera-
tion equipment, and compact and robust radio-frequency systems for plasma
generation and heating. ORNL’s Fusion Energy Division continued to play a key
role in developing and adapting these technologies for use on the VASIMR plasma
thruster. NASA’s Johnson Space Center provided direct support to ORNL to fund
technology development specific to the VASIMR. In addition, DoE's Office of
Science complemented the NASA effort by supporting related research on creat-
ing high-density plasmas by radio-frequency heating.
The Office of Science also worked with NASA to evaluate the responses of
ecosystems to increasing concentrations of atmospheric carbon dioxide and to
make predictions of future climate variation due to such increases. In FY 2001, the
Office of Science made available to NASA its models of carbon dynamics in ter-
restrial ecosystems developed under the Terrestrial Carbon Processes Program.
Scientists began to use these models as a basis for comparison with a variety of
models developed under NASA’s Vegetation Model Analysis Program.
DoE’s Office of Science and NASA also worked together to calculate the
biweekly primary productivity of various representative regions in the United
States. In FY 2001, the AmeriFlux Program of the Office of Science provided real-
time meteorological and solar radiation data for these calculations, and NASA
provided data on leaf-area and photosynthetically active radiation. This joint work
made possible continental-scale estimates of seasonal and geographic patterns of
productivity. The AmeriFlux Program produced unique measurements of net
ecosystem production from about 25 locations across the U.S. These results pro-
vided an independent calibration of NASA’s productivity calculations.
The Atmospheric Radiation Measurement program of the Office of Science
conducted a joint field campaign with NASA that is designed to provide accurate
measurements of water vapor in the upper troposphere. Data on water vapor in the
upper troposphere are one of the key elements required to improve the perform-
ance of large-scale weather and climate-prediction models. The Office of Science
and NASA provided ground and airborne instrumentation for water vapor meas-
urements for the campaign. In addition, NASA provided the new Proteus aircraft,
an airborne platform designed for high-altitude and long-endurance research
flights. This campaign represented the most extensive study of upper-level water
vapor to date—a critical step forward in climate model improvements.
2001 report 3/20/03 3:25 PM Page 105
Ae
ro
na
ut
ic
s
an
d
Sp
ac
e
Re
po
rt
o
f
th
e
Pr
es
id
en
t
106 The Office of Science and NASA also collaborated in a joint effort to meas-
ure water vapor in the lower troposphere. Both agencies provided ground-based
instruments, which enabled researchers to compare two sets of data. This research
has led to new algorithms for the instruments that will be used by each agency as
standards for specific measurements.
The Office of Science’s Low-Dose Radiation Research Program continued
to have an ongoing interaction with the Space Radiation Health Program in
NASA’s Office of Biological and Physical Research. The focus of research in the
DoE Low-Dose Radiation Research Program continued to be on doses of radiation
that are at or below current workplace exposure limits. The primary area of empha-
sis of the NASA Space Radiation Health Program continued to be understanding
the biological effects of space radiation that account for radiation risks.
In FY 2001, NASA and DoE developed a Memorandum of Agreement
(MoA) to better coordinate their common interests that were pending final
approval at the end of the fiscal year. This close collaboration between NASA and
DoE is to enhance progress in understanding and predicting the effects and health
risks resulting from low-dose radiation. In addition to the MoA, DoE and NASA
jointly sponsored a radiation investigators workshop in FY 2001 that included pre-
sentations by representatives of all radiation biology research projects funded by
DoE and NASA. DoE and NASA also issued a joint Request for Applications in
FY 2001 for research that addresses both DoE and NASA needs to understand the
human health effects and risks of exposures to low doses of radiation.
The Office of Science continued to make available to NASA the
Alternating Gradient Synchrotron (AGS), part of the Relativistic Heavy Ion
Collider (RHIC) complex at Brookhaven National Laboratory. The AGS is the
only accelerator in the United States capable of providing heavy ion beams at
energies of interest for space radiobiology. Since the fall of 1995, experiments in
radiobiology have been performed using beams of iron, gold, or silicon ions from
the AGS. NASA funded these experiments as part of its Space Radiation Health
Program. A new NASA-funded facility is under construction at the RHIC com-
plex, the Booster Applications Facility. This new user facility, scheduled for
completion in 2003, will be used to more effectively continue NASA’s radiation
biology studies. The Office of Science and NASA continued working together to
expand the range of technical resources available for experimentation and analy-
sis of experimental results at BNL.
2001 report 3/20/03 3:25 PM Page 106
Fi
sc
al
Y
ea
r
20
01
A
ct
iv
it
ie
s
107In the computing area, the Office of Science and NASA continued their
collaboration on “Grids,” an innovative way to transfer data among geographically
disbursed computer systems at rates of a gigabyte per second and higher.
Disciplines that are benefiting from Grid technology include multidisciplinary
aerospace system design, high-energy physics data analysis, climate analysis and
prediction, and large-scale remote instrument operation. The Office of Science
and NASA also conducted the Global Grid Forum, a technology definition and
standards organization that is providing an invaluable contribution to the field.
Most users of Grids will access Grid services via discipline-specific frame-
works that are built from services that use the World Wide Web. The Office of
Science supplied and continued working on various technologies that made Grid
services available in the Web environment. The Office of Science has developed
a range of basic Grid services for reliable movement of terabyte-sized datasets, data
replication, and location management techniques to minimize data access times,
etc. Two Office of Science laboratories, the Lawrence Berkeley National
Laboratory and the Argonne National Laboratory, set up experimental Grids with
NASA's Ames Research Center in order to identify and resolve the technical and
configuration issues that arise from cross-institutional operation of the authenti-
cation and security infrastructure, and cross-operation of the directory services
that are the central information service for Grids.
2001 report 3/20/03 3:25 PM Page 107

Ae
ro
na
ut
ic
s
an
d
Sp
ac
e
Re
po
rt
o
f
th
e
Pr
es
id
en
t
108
2001 report 3/20/03 3:25 PM Page 108
Fi
sc
al
Y
ea
r
20
01
A
ct
iv
it
ie
s
109
SMITHSONIAN INSTITUTION
The Smithsonian Institution continued to contribute to national aerospace goals
through the activities of the Smithsonian Astrophysical Observatory (SAO),
which is joined with the Harvard College Observatory in Cambridge,
Massachusetts, to form the Harvard-Smithsonian Center for Astrophysics (CfA).
Here, over 300 scientists engage in a broad program of research in astronomy,
astrophysics, and science education. The Smithsonian National Air and Space
Museum (NASM) in Washington, DC, also contributed to national aerospace
goals through its research and education activities.
SAO continued to operate NASA’s Chandra X-ray Observatory, which
completed its second year of observations in FY 2001 with a series of widely
reported results and discoveries. During FY 2001, Chandra observations led to an
enhanced understanding of black holes. Chandra took the deepest x-ray images
ever and found the early universe likely to be teeming with black holes, probed the
theoretical edge of a black hole known as the “event horizon,” observed the x-ray
afterglows of gamma-ray bursts, and captured the first x-ray flare ever seen from the
massive black hole in the center of the Milky Way. Chandra data also shed light
on the distribution of dark matter by yielding the most accurate estimate to date
of the amount of dark matter in galaxy clusters. In the field of supernova research,
Chandra associated a pulsar with a supernova recorded by Chinese astronomers in
386 AD (only the second pulsar to be associated with a historically observed super-
nova), and a team of three high school students using x-ray data from Chandra and
radio data from the National Radio Astronomy Observatory’s Very Large Array
discovered a neutron star within a nearby supernova remnant.
2001 report 3/20/03 3:25 PM Page 109
SAO also continued its role as the leader of another NASA satellite, the
Submillimeter Wave Astronomy Satellite (SWAS), a space telescope used to study
the chemistry and dynamics of the interstellar gas clouds in the Milky Way galaxy.
In FY 2001, SWAS observed massive amounts of water vapor surrounding an aging
giant star about 500 light years from Earth. The SWAS observations provided
the first evidence that extrasolar planetary systems contain water. Scientists
concluded that this water likely comes from a swarm of icy comets surrounding the
star which are gradually being vaporized. This result was the subject of a NASA
Space Science Update news conference held at NASA Headquarters in
Washington, DC.
In FY 2001, using ground-based observations, SAO scientists discovered
high-energy gamma-ray emissions from so-called “extreme” galaxies and created
the first large-scale map of the galactic center using emissions from carbon monox-
ide molecules at submillimeter wavelengths. They also discovered a young star
repeatedly emitting spheres of gas into space. An international team of
astronomers including a member from SAO discovered dusty disks surrounding
young brown dwarfs in the Orion Nebula, indicating that brown dwarfs probably
form in a manner similar to stars. SAO scientists set new limits on the amount of
material in the outer reaches of the solar system by studying the diffused light from
Kuiper Belt Objects too small to be seen directly. Their data set constraints on the-
ories of planet formation in our solar system.
Solar scientists at SAO continued to study the electrically charged atoms
(ions) that the Sun expels into the solar system via coronal mass ejections. New
observations from SAO’s UltraViolet Coronagraph Spectrometer (UVCS) aboard
the Solar and Heliospheric Observatory (SOHO) spacecraft allowed scientists to:
1) probe physical processes in the explosive coronal mass ejections that can have
a strong impact on Earth’s local space environment, and 2) observe, for the first
time, the properties of the sources of the high-speed solar wind as these sources
reform in conjunction with the Sun’s switch in magnetic polarity. These measure-
ments are coordinated with other SOHO instruments and with the extreme
ultraviolet images from the Transition Region and Coronal Explorer satellite.
UVCS ultraviolet spectra of sungrazing comets indicated that the nuclei of those
comets are in the range of 10–20 meters in diameter. These spectra also provided
unique probes of the density and speed of the solar wind.
Ae
ro
na
ut
ic
s
an
d
Sp
ac
e
Re
po
rt
o
f
th
e
Pr
es
id
en
t
110
2001 report 3/20/03 3:25 PM Page 110
The Science Education Department (SED) at CfA continued to host teach-
ers from across the United States at sessions designed to train them in the use of
the department’s many curriculum programs for grades 3–12. SED activities
included the “MicroObservatory Program,” which enables classrooms to control
small telescopes located around the world. Using MicroObservatory, students can
plan observations, take data, and share their results with other schools. SED
worked with a consortium of teachers from across the Nation to develop the “From
the Ground UP!” program—a series of investigations in physical science for
middle and high school students using the MicroObservatory network.
SED’s Science Media Group produced four television workshops and
documentaries, ranging from a 1-hour special on science and sports to an eight-
part workshop exploring the science of force and motion. SED also continued
managing the Annenberg/CPB Channel, a satellite/Web service broadcasting free
educational programming nationwide for schools, colleges, and communities. The
channel’s reach has grown over the past year to 62,000 schools and 38 million
households.
SAO continued to offer its popular Observatory Night lectures and tele-
scope observing to the public on a monthly basis. Lectures aimed at general
audiences drew more than 100 people to most events. A new program of monthly
“Sci-Fi Movie Nights” was introduced, offering attendees the chance to learn
about science in a fun way by comparing what Hollywood got right versus what it
got wrong. A CfA scientist introduced each film by discussing the science shown
and the social context in which the film was made. These movie nights, with the
theme “Everything we learned about science, we learned at the movies,” proved
extremely popular, with attendances of up to 100 people, and were frequented by
science and science-fiction enthusiasts of all ages. SAO also continued to offer
“Children’s Night” programs aimed at younger audiences.
Staff of the Center for Earth & Planetary Studies (CEPS) at the National
Air and Space Museum were selected as science team members for the 2005 Mars
Reconnaissance Orbiter. Dr. John Grant is a co-investigator for the HiRISE High-
Resolution Imager, which will be capable of color and stereo imaging with about
six times higher resolution than any current images of Mars. This imagery will be
crucial for understanding the evolution of Mars and the changing role that water
has played in shaping the surface of the planet. CEPS chairman Dr. Bruce
Fi
sc
al
Y
ea
r
20
01
A
ct
iv
it
ie
s
111
2001 report 3/20/03 3:25 PM Page 111
Campbell is a member of the science team for the Shallow Subsurface Sounding
Radar. This system will use radio waves to penetrate the upper kilometer of the
Martian crust, map subsurface geologic layering, and search for buried ice and
water deposits. Dr. Campbell was also selected as one of 10 principal investigators
to receive NASA funding for a 6-month concept study of the Mars Scout Radar
instrument proposed for the Mars Scout missions. CEPS staff were further involved
in planetary mission planning through co-chairing the Mars Landing Site
Steering Group, participating in the Mars Exploration Payload Analysis Group,
serving on the Messenger Science Team, and working on numerous other NASA
evaluation groups.
CEPS continued its active research program in planetary and terrestrial
geology and geophysics using remote-sensing data from Earth-orbiting satellites
and manned and unmanned space missions. The scope of research activities
included work on Mercury, Venus, the Moon, and Mars, and corresponding field
studies in terrestrial analog regions. CEPS staff studied a variety of geologic
processes such as volcanism, cratering, tectonics, and sand movement.
As a NASA Regional Planetary Imagery Facility, CEPS continued to house
an extensive collection of images of the planets and their satellites. In addition,
CEPS staff participated in the development and presentation of exhibits and
public programs, including teacher workshops, special events, and outreach activ-
ities in the community. Staff continued to be responsible for developing and
maintaining the National Air and Space Museum Web site, including innovative
online exhibit materials, interactive educational programs, research highlights,
and virtual tours of the museum’s galleries.
Ae
ro
na
ut
ic
s
an
d
Sp
ac
e
Re
po
rt
o
f
th
e
Pr
es
id
en
t
112
2001 report 3/20/03 3:25 PM Page 112
Fi
sc
al
Y
ea
r
20
01
A
ct
iv
it
ie
s
113
APPENDICES
2001 report 3/20/03 3:25 PM Page 113

Ae
ro
na
ut
ic
s
an
d
Sp
ac
e
Re
po
rt
o
f
th
e
Pr
es
id
en
t
114APPENDIX A-1
U.S. Government Spacecraft Record(Includes spacecraft from cooperating countries launched by U.S. launch vehicles.)
Calendar Earth Orbita Earth Escapea
Year Success Failure Success Failure
1957 0 1 0 01958 5 8 0 41959 9 9 1 21960 16 12 1 21961 35 12 0 21962 55 12 4 11963 62 11 0 01964 69 8 4 01965 93 7 4 11966 94 12 7 1 b
1967 78 4 10 01968 61 15 3 01969 58 1 8 11970 36 1 3 01971 45 2 8 11972 33 2 8 01973 23 2 3 01974 27 2 1 01975 30 4 4 01976 33 0 1 01977 27 2 2 01978 34 2 7 01979 18 0 0 01980 16 4 0 01981 20 1 0 01982 21 0 0 01983 31 0 0 01984 35 3 0 01985 37 1 0 01986 11 4 0 01987 9 1 0 01988 16 1 0 01989 24 0 2 01990 40 0 1 01991 32 c 0 0 01992 26 c 0 1 01993 28 c 1 1 01994 31 c 1 1 01995 24 c, d 2 1 0 1996 30 1 3 01997 22 e 0 1 01998 23 0 2 01999 35 4 2 02000 31 f 0 0 02001 (through September 30, 2001) 16 0 3 0
TOTAL 1,499 153 97 15
a. The criterion of success or failure used is attainment of Earth orbit or Earth escape rather than judgment of mission success. “Escape” flightsinclude all that were intended to go to at least an altitude equal to lunar distance from Earth.
b. This Earth-escape failure did attain Earth orbit and, therefore, is included in the Earth-orbit success totals.c. This excludes commercial satellites. It counts separately spacecraft launched by the same launch vehicle.d. This counts the five orbital debris radar calibration spheres that were launched from STS-63 as one set of spacecraft.e. This includes the SSTI Lewis spacecraft that began spinning out of control shortly after it achieved Earth orbit.f. Counts OCS, OPAL, FALCONSAT, and ASUSAT microsatellites as one set, and The Picosats 4-8 as another set.
2001 report 3/20/03 3:25 PM Page 114
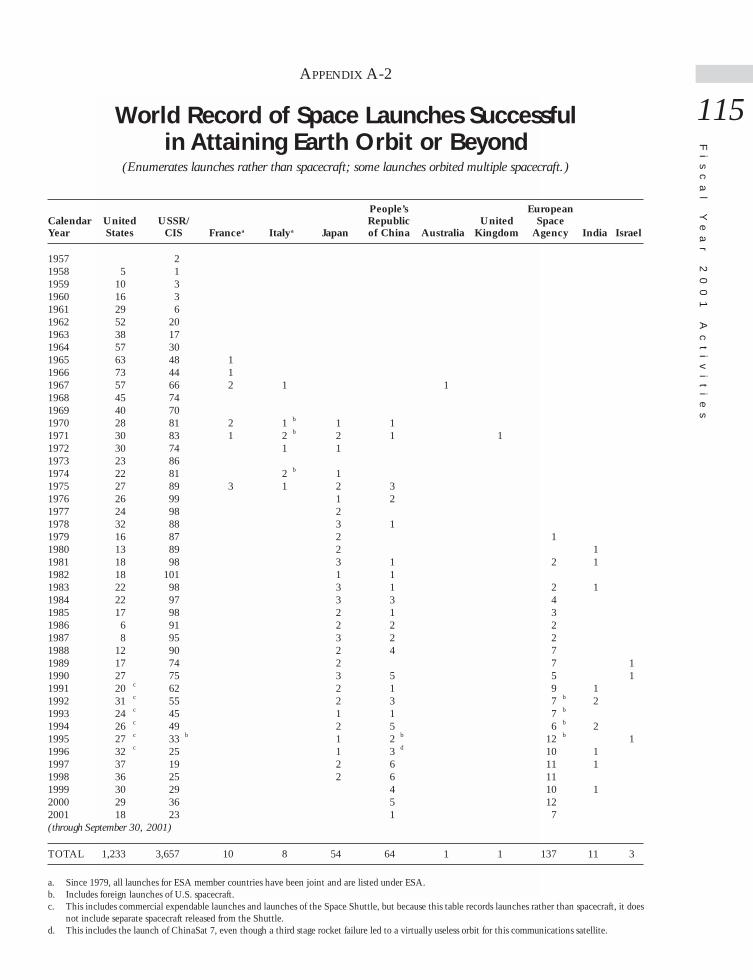
Fi
sc
al
Y
ea
r
20
01
A
ct
iv
it
ie
s
115APPENDIX A-2
World Record of Space Launches Successfulin Attaining Earth Orbit or Beyond
(Enumerates launches rather than spacecraft; some launches orbited multiple spacecraft.)
People’s EuropeanCalendar United USSR/ Republic United SpaceYear States CIS Francea Italya Japan of China Australia Kingdom Agency India Israel
1957 21958 5 11959 10 31960 16 31961 29 61962 52 201963 38 171964 57 301965 63 48 11966 73 44 11967 57 66 2 1 11968 45 741969 40 701970 28 81 2 1 b 1 11971 30 83 1 2 b 2 1 11972 30 74 1 11973 23 861974 22 81 2 b 11975 27 89 3 1 2 31976 26 99 1 21977 24 98 21978 32 88 3 11979 16 87 2 11980 13 89 2 11981 18 98 3 1 2 11982 18 101 1 11983 22 98 3 1 2 11984 22 97 3 3 41985 17 98 2 1 31986 6 91 2 2 21987 8 95 3 2 21988 12 90 2 4 71989 17 74 2 7 11990 27 75 3 5 5 11991 20 c 62 2 1 9 11992 31 c 55 2 3 7 b 21993 24 c 45 1 1 7 b
1994 26 c 49 2 5 6 b 21995 27 c 33 b 1 2 b 12 b 11996 32 c 25 1 3 d 10 11997 37 19 2 6 11 11998 36 25 2 6 111999 30 29 4 10 12000 29 36 5 122001 18 23 1 7(through September 30, 2001)
TOTAL 1,233 3,657 10 8 54 64 1 1 137 11 3
a. Since 1979, all launches for ESA member countries have been joint and are listed under ESA.b. Includes foreign launches of U.S. spacecraft.c. This includes commercial expendable launches and launches of the Space Shuttle, but because this table records launches rather than spacecraft, it does
not include separate spacecraft released from the Shuttle.d. This includes the launch of ChinaSat 7, even though a third stage rocket failure led to a virtually useless orbit for this communications satellite.
2001 report 3/20/03 3:25 PM Page 115
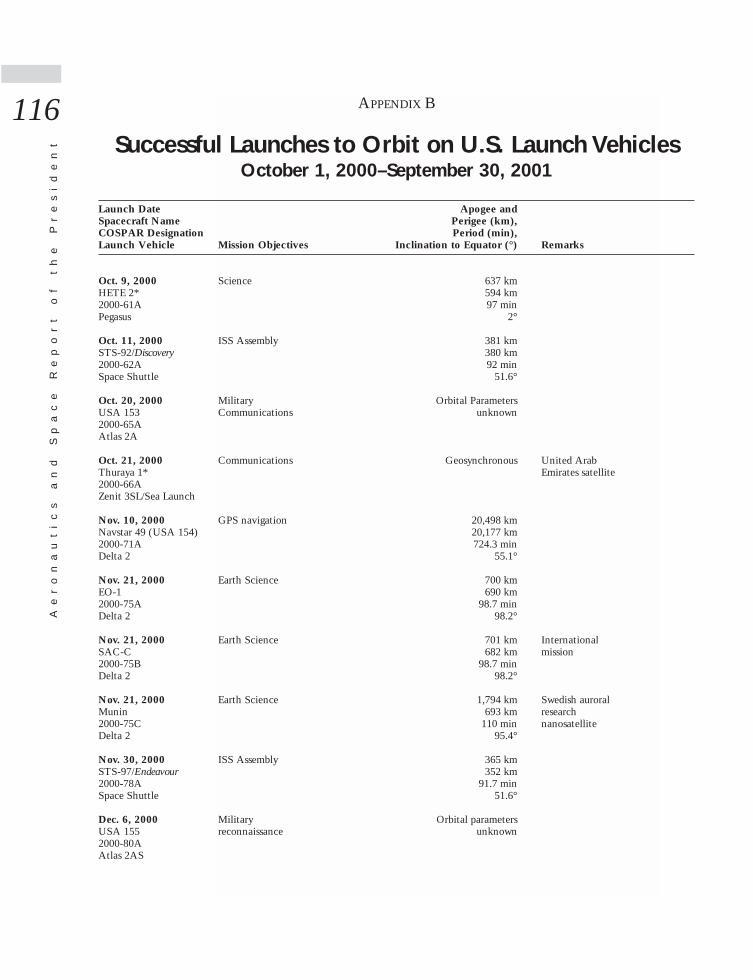
Ae
ro
na
ut
ic
s
an
d
Sp
ac
e
Re
po
rt
o
f
th
e
Pr
es
id
en
t
116 APPENDIX B
Successful Launches to Orbit on U.S. Launch VehiclesOctober 1, 2000–September 30, 2001
Launch Date Apogee andSpacecraft Name Perigee (km),COSPAR Designation Period (min),Launch Vehicle Mission Objectives Inclination to Equator (°) Remarks
Oct. 9, 2000 Science 637 kmHETE 2* 594 km2000-61A 97 minPegasus 2°
Oct. 11, 2000 ISS Assembly 381 kmSTS-92/Discovery 380 km2000-62A 92 minSpace Shuttle 51.6°
Oct. 20, 2000 Military Orbital ParametersUSA 153 Communications unknown2000-65AAtlas 2A
Oct. 21, 2000 Communications Geosynchronous United ArabThuraya 1* Emirates satellite2000-66AZenit 3SL/Sea Launch
Nov. 10, 2000 GPS navigation 20,498 kmNavstar 49 (USA 154) 20,177 km2000-71A 724.3 minDelta 2 55.1°
Nov. 21, 2000 Earth Science 700 kmEO-1 690 km2000-75A 98.7 minDelta 2 98.2°
Nov. 21, 2000 Earth Science 701 km InternationalSAC-C 682 km mission2000-75B 98.7 minDelta 2 98.2°
Nov. 21, 2000 Earth Science 1,794 km Swedish auroralMunin 693 km research2000-75C 110 min nanosatelliteDelta 2 95.4°
Nov. 30, 2000 ISS Assembly 365 kmSTS-97/Endeavour 352 km2000-78A 91.7 minSpace Shuttle 51.6°
Dec. 6, 2000 Military Orbital parametersUSA 155 reconnaissance unknown2000-80AAtlas 2AS
2001 report 3/20/03 3:25 PM Page 116
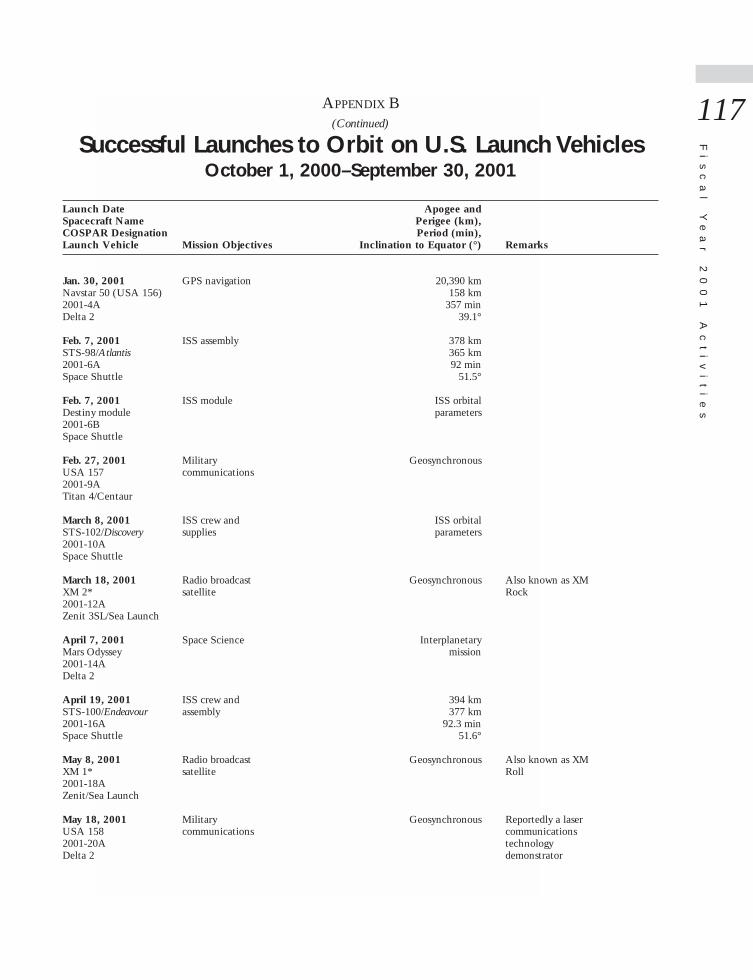
Fi
sc
al
Y
ea
r
20
01
A
ct
iv
it
ie
s
117APPENDIX B(Continued)
Successful Launches to Orbit on U.S. Launch VehiclesOctober 1, 2000–September 30, 2001
Launch Date Apogee andSpacecraft Name Perigee (km),COSPAR Designation Period (min),Launch Vehicle Mission Objectives Inclination to Equator (°) Remarks
Jan. 30, 2001 GPS navigation 20,390 kmNavstar 50 (USA 156) 158 km2001-4A 357 minDelta 2 39.1°
Feb. 7, 2001 ISS assembly 378 kmSTS-98/Atlantis 365 km2001-6A 92 minSpace Shuttle 51.5°
Feb. 7, 2001 ISS module ISS orbitalDestiny module parameters2001-6BSpace Shuttle
Feb. 27, 2001 Military GeosynchronousUSA 157 communications2001-9ATitan 4/Centaur
March 8, 2001 ISS crew and ISS orbitalSTS-102/Discovery supplies parameters2001-10ASpace Shuttle
March 18, 2001 Radio broadcast Geosynchronous Also known as XMXM 2* satellite Rock2001-12AZenit 3SL/Sea Launch
April 7, 2001 Space Science InterplanetaryMars Odyssey mission2001-14ADelta 2
April 19, 2001 ISS crew and 394 kmSTS-100/Endeavour assembly 377 km2001-16A 92.3 minSpace Shuttle 51.6°
May 8, 2001 Radio broadcast Geosynchronous Also known as XMXM 1* satellite Roll2001-18AZenit/Sea Launch
May 18, 2001 Military Geosynchronous Reportedly a laserUSA 158 communications communications2001-20A technologyDelta 2 demonstrator
2001 report 3/20/03 3:25 PM Page 117
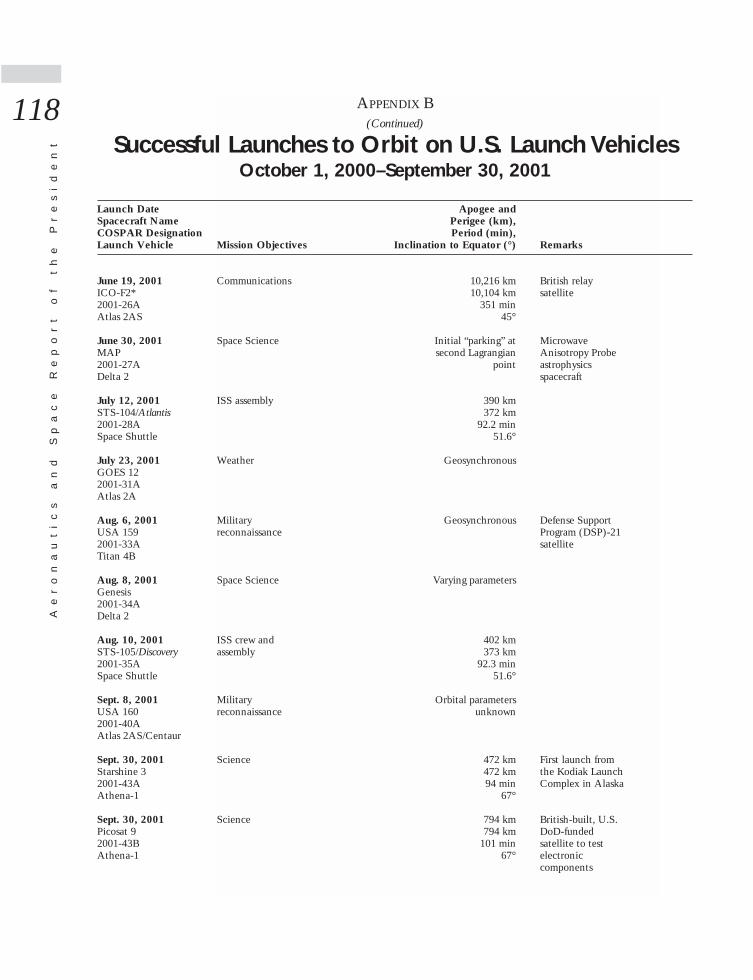
Ae
ro
na
ut
ic
s
an
d
Sp
ac
e
Re
po
rt
o
f
th
e
Pr
es
id
en
t
118 APPENDIX B(Continued)
Successful Launches to Orbit on U.S. Launch VehiclesOctober 1, 2000–September 30, 2001
Launch Date Apogee andSpacecraft Name Perigee (km),COSPAR Designation Period (min),Launch Vehicle Mission Objectives Inclination to Equator (°) Remarks
June 19, 2001 Communications 10,216 km British relayICO-F2* 10,104 km satellite2001-26A 351 minAtlas 2AS 45°
June 30, 2001 Space Science Initial “parking” at MicrowaveMAP second Lagrangian Anisotropy Probe2001-27A point astrophysicsDelta 2 spacecraft
July 12, 2001 ISS assembly 390 kmSTS-104/Atlantis 372 km2001-28A 92.2 minSpace Shuttle 51.6°
July 23, 2001 Weather GeosynchronousGOES 122001-31AAtlas 2A
Aug. 6, 2001 Military Geosynchronous Defense SupportUSA 159 reconnaissance Program (DSP)-212001-33A satelliteTitan 4B
Aug. 8, 2001 Space Science Varying parametersGenesis2001-34ADelta 2
Aug. 10, 2001 ISS crew and 402 kmSTS-105/Discovery assembly 373 km2001-35A 92.3 minSpace Shuttle 51.6°
Sept. 8, 2001 Military Orbital parametersUSA 160 reconnaissance unknown2001-40AAtlas 2AS/Centaur
Sept. 30, 2001 Science 472 km First launch fromStarshine 3 472 km the Kodiak Launch2001-43A 94 min Complex in AlaskaAthena-1 67°
Sept. 30, 2001 Science 794 km British-built, U.S.Picosat 9 794 km DoD-funded2001-43B 101 min satellite to testAthena-1 67° electronic
components
2001 report 3/20/03 3:25 PM Page 118
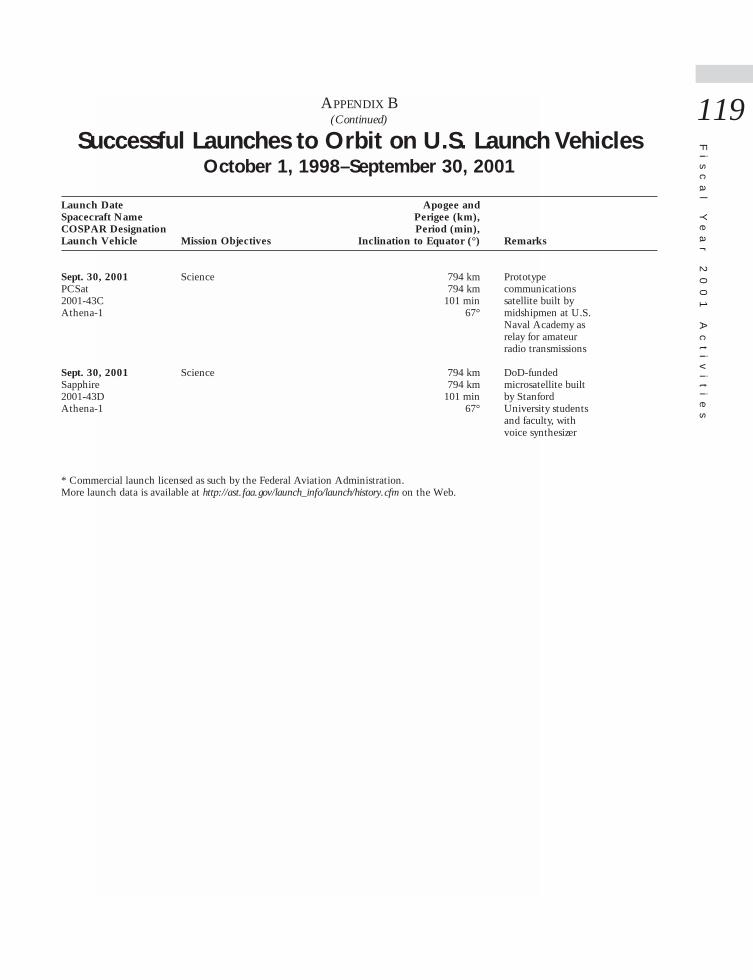
Fi
sc
al
Y
ea
r
20
01
A
ct
iv
it
ie
s
119APPENDIX B(Continued)
Successful Launches to Orbit on U.S. Launch VehiclesOctober 1, 1998–September 30, 2001
Launch Date Apogee andSpacecraft Name Perigee (km),COSPAR Designation Period (min),Launch Vehicle Mission Objectives Inclination to Equator (°) Remarks
Sept. 30, 2001 Science 794 km PrototypePCSat 794 km communications2001-43C 101 min satellite built byAthena-1 67° midshipmen at U.S.
Naval Academy asrelay for amateurradio transmissions
Sept. 30, 2001 Science 794 km DoD-fundedSapphire 794 km microsatellite built2001-43D 101 min by StanfordAthena-1 67° University students
and faculty, withvoice synthesizer
* Commercial launch licensed as such by the Federal Aviation Administration. More launch data is available at http://ast.faa.gov/launch_info/launch/history.cfm on the Web.
2001 report 3/20/03 3:25 PM Page 119
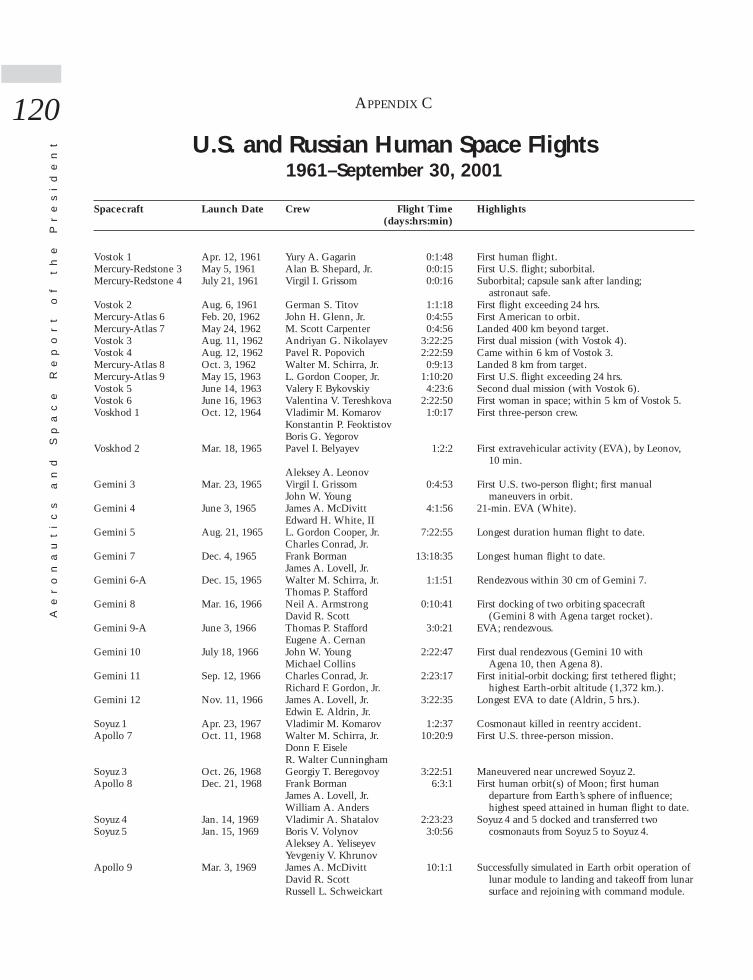
Ae
ro
na
ut
ic
s
an
d
Sp
ac
e
Re
po
rt
o
f
th
e
Pr
es
id
en
t
120 APPENDIX C
U.S. and Russian Human Space Flights1961–September 30, 2001
Spacecraft Launch Date Crew Flight Time Highlights(days:hrs:min)
Vostok 1 Apr. 12, 1961 Yury A. Gagarin 0:1:48 First human flight.Mercury-Redstone 3 May 5, 1961 Alan B. Shepard, Jr. 0:0:15 First U.S. flight; suborbital.Mercury-Redstone 4 July 21, 1961 Virgil I. Grissom 0:0:16 Suborbital; capsule sank after landing;
astronaut safe.Vostok 2 Aug. 6, 1961 German S. Titov 1:1:18 First flight exceeding 24 hrs.Mercury-Atlas 6 Feb. 20, 1962 John H. Glenn, Jr. 0:4:55 First American to orbit.Mercury-Atlas 7 May 24, 1962 M. Scott Carpenter 0:4:56 Landed 400 km beyond target.Vostok 3 Aug. 11, 1962 Andriyan G. Nikolayev 3:22:25 First dual mission (with Vostok 4).Vostok 4 Aug. 12, 1962 Pavel R. Popovich 2:22:59 Came within 6 km of Vostok 3.Mercury-Atlas 8 Oct. 3, 1962 Walter M. Schirra, Jr. 0:9:13 Landed 8 km from target.Mercury-Atlas 9 May 15, 1963 L. Gordon Cooper, Jr. 1:10:20 First U.S. flight exceeding 24 hrs.Vostok 5 June 14, 1963 Valery F. Bykovskiy 4:23:6 Second dual mission (with Vostok 6).Vostok 6 June 16, 1963 Valentina V. Tereshkova 2:22:50 First woman in space; within 5 km of Vostok 5.Voskhod 1 Oct. 12, 1964 Vladimir M. Komarov 1:0:17 First three-person crew.
Konstantin P. FeoktistovBoris G. Yegorov
Voskhod 2 Mar. 18, 1965 Pavel I. Belyayev 1:2:2 First extravehicular activity (EVA), by Leonov, 10 min.
Aleksey A. LeonovGemini 3 Mar. 23, 1965 Virgil I. Grissom 0:4:53 First U.S. two-person flight; first manual
John W. Young maneuvers in orbit.Gemini 4 June 3, 1965 James A. McDivitt 4:1:56 21-min. EVA (White).
Edward H. White, IIGemini 5 Aug. 21, 1965 L. Gordon Cooper, Jr. 7:22:55 Longest duration human flight to date.
Charles Conrad, Jr.Gemini 7 Dec. 4, 1965 Frank Borman 13:18:35 Longest human flight to date.
James A. Lovell, Jr.Gemini 6-A Dec. 15, 1965 Walter M. Schirra, Jr. 1:1:51 Rendezvous within 30 cm of Gemini 7.
Thomas P. StaffordGemini 8 Mar. 16, 1966 Neil A. Armstrong 0:10:41 First docking of two orbiting spacecraft
David R. Scott (Gemini 8 with Agena target rocket).Gemini 9-A June 3, 1966 Thomas P. Stafford 3:0:21 EVA; rendezvous.
Eugene A. CernanGemini 10 July 18, 1966 John W. Young 2:22:47 First dual rendezvous (Gemini 10 with
Michael Collins Agena 10, then Agena 8).Gemini 11 Sep. 12, 1966 Charles Conrad, Jr. 2:23:17 First initial-orbit docking; first tethered flight;
Richard F. Gordon, Jr. highest Earth-orbit altitude (1,372 km.).Gemini 12 Nov. 11, 1966 James A. Lovell, Jr. 3:22:35 Longest EVA to date (Aldrin, 5 hrs.).
Edwin E. Aldrin, Jr.Soyuz 1 Apr. 23, 1967 Vladimir M. Komarov 1:2:37 Cosmonaut killed in reentry accident.Apollo 7 Oct. 11, 1968 Walter M. Schirra, Jr. 10:20:9 First U.S. three-person mission.
Donn F. EiseleR. Walter Cunningham
Soyuz 3 Oct. 26, 1968 Georgiy T. Beregovoy 3:22:51 Maneuvered near uncrewed Soyuz 2.Apollo 8 Dec. 21, 1968 Frank Borman 6:3:1 First human orbit(s) of Moon; first human
James A. Lovell, Jr. departure from Earth’s sphere of influence; William A. Anders highest speed attained in human flight to date.
Soyuz 4 Jan. 14, 1969 Vladimir A. Shatalov 2:23:23 Soyuz 4 and 5 docked and transferred two Soyuz 5 Jan. 15, 1969 Boris V. Volynov 3:0:56 cosmonauts from Soyuz 5 to Soyuz 4.
Aleksey A. YeliseyevYevgeniy V. Khrunov
Apollo 9 Mar. 3, 1969 James A. McDivitt 10:1:1 Successfully simulated in Earth orbit operation of David R. Scott lunar module to landing and takeoff from lunar Russell L. Schweickart surface and rejoining with command module.
2001 report 3/20/03 3:25 PM Page 120

Fi
sc
al
Y
ea
r
20
01
A
ct
iv
it
ie
s
121APPENDIX C(Continued)
U.S. and Russian Human Space Flights1961–September 30, 2001
Spacecraft Launch Date Crew Flight Time Highlights(days:hrs:min)
Apollo 10 May 18, 1969 Thomas P. Stafford 8:0:3 Successfully demonstrated complete system, John W. Young including lunar module to 14,300 m from the Eugene A. Cernan lunar surface.
Apollo 11 July 16, 1969 Neil A. Armstrong 8:3:9 First human landing on lunar surface and safe Michael Collins return to Earth. First return of rock and soil Edwin E. Aldrin, Jr. samples to Earth and human deployment of
experiments on lunar surface.Soyuz 6 Oct. 11, 1969 Georgiy Shonin 4:22:42 Soyuz 6, 7, and 8 operated as a group flight
Valery N. Kubasov without actually docking. Each conducted certain experiments,
Soyuz 7 Oct. 12, 1969 A. V. Filipchenko 4:22:41 including welding and Earth and celestial Viktor N. Gorbatko observation.Vladislav N. Volkov
Soyuz 8 Oct. 13, 1969 Vladimir A. Shatalov 4:22:50Aleksey S. Yeliseyev
Apollo 12 Nov. 14, 1969 Charles Conrad, Jr. 10:4:36 Second human lunar landing explored surface of Richard F. Gordon, Jr. Moon and retrieved parts of Surveyor 3 Alan L. Bean spacecraft, which landed in Ocean of Storms
on Apr. 19, 1967.Apollo 13 Apr. 11, 1970 James A. Lovell, Jr. 5:22:55 Mission aborted; explosion in service module.
Fred W. Haise, Jr. Ship circled Moon, with crew using Lunar John L. Swigert, Jr. Module as “lifeboat” until just before reentry.
Soyuz 9 June 1, 1970 Andriyan G. Nikolayev 17:16:59 Longest human space flight to date.Vitaliy I. Sevastyanov
Apollo 14 Jan. 31, 1971 Alan B. Shepard, Jr. 9:0:2 Third human lunar landing. Mission demon-Stuart A. Roosa strated pinpoint landing capability and Edgar D. Mitchell continued human exploration.
Soyuz 10 Apr. 22, 1971 Vladimir A. Shatalov 1:23:46 Docked with Salyut 1, but crew did not board Aleksey S. Yeliseyev space station launched Apr. 19. Crew Nikolay N. Rukavishnikov recovered Apr. 24, 1971.
Soyuz 11 June 6, 1971 Georgiy T. Dobrovolskiy 23:18:22 Docked with Salyut 1, and Soyuz 11 crew Vladislav N. Volkov occupied space station for 22 days. Crew Viktor I. Patsayev perished in final phase of Soyuz 11 capsule
recovery on June 30, 1971.Apollo 15 July 26, 1971 David R. Scott 12:7:12 Fourth human lunar landing and first Apollo “J”
Alfred M. Worden series mission, which carried Lunar Roving James B. Irwin Vehicle. Worden’s inflight EVA of 38 min.,
12 sec. was performed during return trip.Apollo 16 Apr. 16, 1972 John W. Young 11:1:51 Fifth human lunar landing, with roving vehicle.
Charles M. Duke, Jr.Thomas K. Mattingly II
Apollo 17 Dec. 7, 1972 Eugene A. Cernan 12:13:52 Sixth and final Apollo human lunar landing, Harrison H. Schmitt again with roving vehicle.Ronald E. Evans
Skylab 2 May 25, 1973 Charles Conrad, Jr. 28:0:50 Docked with Skylab 1 (launched uncrewed May Joseph P. Kerwin 14) for 28 days. Repaired damaged station.Paul J. Weitz
Skylab 3 July 28, 1973 Alan L. Bean 59:11:9 Docked with Skylab 1 for more than 59 days.Jack R. LousmaOwen K. Garriott
Soyuz 12 Sep. 27, 1973 Vasiliy G. Lazarev 1:23:16 Checkout of improved Soyuz.Oleg G. Makarov
2001 report 3/20/03 3:25 PM Page 121

Ae
ro
na
ut
ic
s
an
d
Sp
ac
e
Re
po
rt
o
f
th
e
Pr
es
id
en
t
122 APPENDIX C(Continued)
U.S. and Russian Human Space Flights1961–September 30, 2001
Spacecraft Launch Date Crew Flight Time Highlights(days:hrs:min)
Skylab 4 Nov. 16, 1973 Gerald P. Carr 84:1:16 Docked with Skylab 1 in long-duration mission; Edward G. Gibson last of Skylab program.William R. Pogue
Soyuz 13 Dec. 18, 1973 Petr I. Klimuk 7:20:55 Astrophysical, biological, and Earth resources Valentin V. Lebedev experiments.
Soyuz 14 July 3, 1974 Pavel R. Popovich 15:17:30 Docked with Salyut 3 and Soyuz 14 crew Yury P. Artyukhin occupied space station.
Soyuz 15 Aug. 26, 1974 Gennady V. Sarafanov 2:0:12 Rendezvoused but did not dock with Salyut 3.Lev S. Demin
Soyuz 16 Dec. 2, 1974 Anatoly V. Filipchenko 5:22:24 Test of Apollo-Soyuz Test Project (ASTP) Nikolay N. Rukavishnikov configuration.
Soyuz 17 Jan. 10, 1975 Aleksey A. Gubarev 29:13:20 Docked with Salyut 4 and occupied station.Georgiy M. Grechko
Anomaly (Soyuz 18A) Apr. 5, 1975 Vasiliy G. Lazarev 0:0:20 Soyuz stages failed to separate; crew recovered Oleg G. Makarov after abort.
Soyuz 18 May 24, 1975 Petr I. Klimuk 62:23:20 Docked with Salyut 4 and occupied station.Vitaliy I. Sevastyanov
Soyuz 19 July 15, 1975 Aleksey A. Leonov 5:22:31 Target for Apollo in docking and joint Valery N. Kubasov experiments of ASTP mission.
Apollo July 15, 1975 Thomas P. Stafford 9:1:28 Docked with Soyuz 19 in joint (ASTP) Donald K. Slayton experiments of ASTP mission.Vance D. Brand
Soyuz 21 July 6, 1976 Boris V. Volynov 48:1:32 Docked with Salyut 5 and occupied station.Vitaliy M. Zholobov
Soyuz 22 Sep. 15, 1976 Valery F. Bykovskiy 7:21:54 Earth resources study with multispectral camera Vladimir V. Aksenov system.
Soyuz 23 Oct. 14, 1976 Vyacheslav D. Zudov 2:0:6 Failed to dock with Salyut 5.Valery I. Rozhdestvenskiy
Soyuz 24 Feb. 7, 1977 Viktor V. Gorbatko 17:17:23 Docked with Salyut 5 and occupied station.Yury N. Glazkov
Soyuz 25 Oct. 9, 1977 Vladimir V. Kovalenok 2:0:46 Failed to achieve hard dock with Salyut 6 Valery V. Ryumin station.
Soyuz 26 Dec. 10, 1977 Yury V. Romanenko 37:10:6 Docked with Salyut 6. Crew returned in Georgiy M. Grechko Soyuz 27; crew duration 96 days, 10 hrs.
Soyuz 27 Jan. 10, 1978 Vladimir A. Dzhanibekov 64:22:53 Docked with Salyut 6. Crew returned in Oleg G. Makarov Soyuz 26; crew duration 5 days, 22 hrs., 59 min.
Soyuz 28 Mar. 2, 1978 Aleksey A. Gubarev 7:22:17 Docked with Salyut 6. Remek was first Czech Vladimir Remek cosmonaut to orbit.
Soyuz 29 June 15, 1978 Vladimir V. Kovalenok 9:15:23 Docked with Salyut 6. Crew returned in Soyuz 31; Aleksandr S. Ivanchenkov crew duration 139 days, 14 hrs., 48 min.
Soyuz 30 June 27, 1978 Petr I. Klimuk 7:22:4 Docked with Salyut 6. Hermaszewski was first Miroslaw Hermaszewski Polish cosmonaut to orbit.
Soyuz 31 Aug. 26, 1978 Valery F. Bykovskiy 67:20:14 Docked with Salyut 6. Crew returned in Soyuz 29; Sigmund Jaehn crew duration 7 days, 20 hrs., 49 min.
Jaehn was first German Democratic Republic cosmonaut to orbit.
Soyuz 32 Feb. 25, 1979 Vladimir A. Lyakhov 108:4:24 Docked with Salyut 6. Crew returned in Soyuz 34; Valery V. Ryumin crew duration 175 days, 36 min.Nikolay N. Rukavishnikov
Soyuz 33 Apr. 10, 1979 Georgi I. Ivanov 1:23:1 Failed to achieve docking with Salyut 6 station. Ivanov was first Bulgarian cosmonaut to orbit.
Soyuz 34 June 6, 1979 (unmanned at launch) 7:18:17 Docked with Salyut 6, later served as ferry for Soyuz 32 crew while Soyuz 32 returned without a crew.
2001 report 3/20/03 3:25 PM Page 122
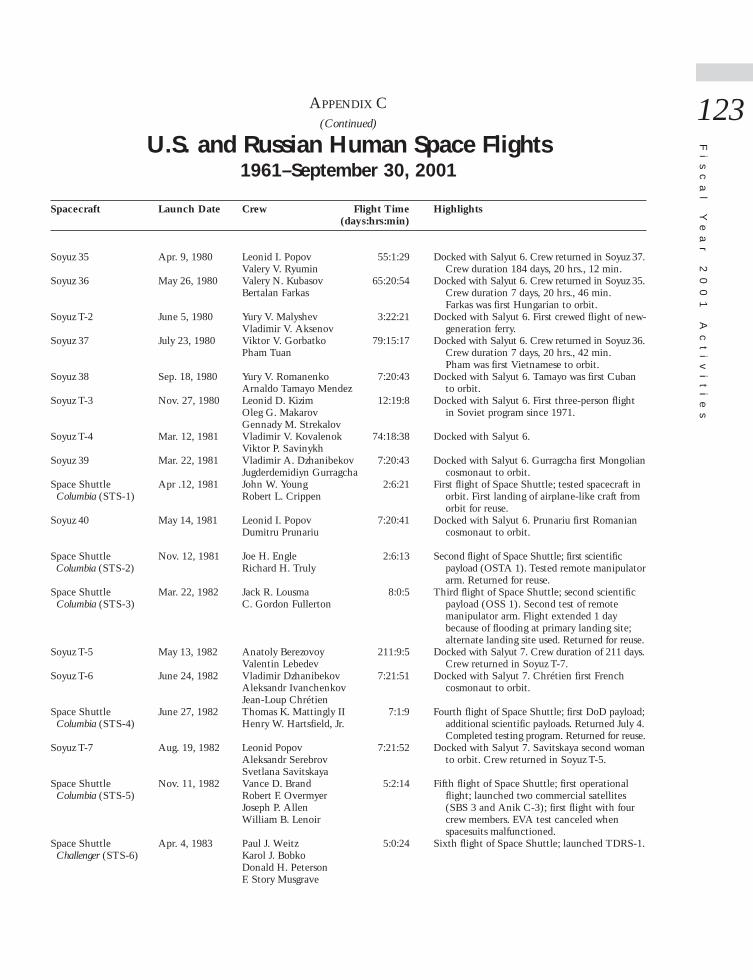
Fi
sc
al
Y
ea
r
20
01
A
ct
iv
it
ie
s
123APPENDIX C(Continued)
U.S. and Russian Human Space Flights1961–September 30, 2001
Spacecraft Launch Date Crew Flight Time Highlights(days:hrs:min)
Soyuz 35 Apr. 9, 1980 Leonid I. Popov 55:1:29 Docked with Salyut 6. Crew returned in Soyuz 37. Valery V. Ryumin Crew duration 184 days, 20 hrs., 12 min.
Soyuz 36 May 26, 1980 Valery N. Kubasov 65:20:54 Docked with Salyut 6. Crew returned in Soyuz 35. Bertalan Farkas Crew duration 7 days, 20 hrs., 46 min.
Farkas was first Hungarian to orbit.Soyuz T-2 June 5, 1980 Yury V. Malyshev 3:22:21 Docked with Salyut 6. First crewed flight of new-
Vladimir V. Aksenov generation ferry.Soyuz 37 July 23, 1980 Viktor V. Gorbatko 79:15:17 Docked with Salyut 6. Crew returned in Soyuz 36.
Pham Tuan Crew duration 7 days, 20 hrs., 42 min. Pham was first Vietnamese to orbit.
Soyuz 38 Sep. 18, 1980 Yury V. Romanenko 7:20:43 Docked with Salyut 6. Tamayo was first Cuban Arnaldo Tamayo Mendez to orbit.
Soyuz T-3 Nov. 27, 1980 Leonid D. Kizim 12:19:8 Docked with Salyut 6. First three-person flight Oleg G. Makarov in Soviet program since 1971.Gennady M. Strekalov
Soyuz T-4 Mar. 12, 1981 Vladimir V. Kovalenok 74:18:38 Docked with Salyut 6.Viktor P. Savinykh
Soyuz 39 Mar. 22, 1981 Vladimir A. Dzhanibekov 7:20:43 Docked with Salyut 6. Gurragcha first Mongolian Jugderdemidiyn Gurragcha cosmonaut to orbit.
Space Shuttle Apr .12, 1981 John W. Young 2:6:21 First flight of Space Shuttle; tested spacecraft in Columbia (STS-1) Robert L. Crippen orbit. First landing of airplane-like craft from
orbit for reuse.Soyuz 40 May 14, 1981 Leonid I. Popov 7:20:41 Docked with Salyut 6. Prunariu first Romanian
Dumitru Prunariu cosmonaut to orbit.
Space Shuttle Nov. 12, 1981 Joe H. Engle 2:6:13 Second flight of Space Shuttle; first scientific Columbia (STS-2) Richard H. Truly payload (OSTA 1). Tested remote manipulator
arm. Returned for reuse.Space Shuttle Mar. 22, 1982 Jack R. Lousma 8:0:5 Third flight of Space Shuttle; second scientific
Columbia (STS-3) C. Gordon Fullerton payload (OSS 1). Second test of remote manipulator arm. Flight extended 1 day because of flooding at primary landing site; alternate landing site used. Returned for reuse.
Soyuz T-5 May 13, 1982 Anatoly Berezovoy 211:9:5 Docked with Salyut 7. Crew duration of 211 days. Valentin Lebedev Crew returned in Soyuz T-7.
Soyuz T-6 June 24, 1982 Vladimir Dzhanibekov 7:21:51 Docked with Salyut 7. Chrétien first French Aleksandr Ivanchenkov cosmonaut to orbit.Jean-Loup Chrétien
Space Shuttle June 27, 1982 Thomas K. Mattingly II 7:1:9 Fourth flight of Space Shuttle; first DoD payload; Columbia (STS-4) Henry W. Hartsfield, Jr. additional scientific payloads. Returned July 4.
Completed testing program. Returned for reuse.Soyuz T-7 Aug. 19, 1982 Leonid Popov 7:21:52 Docked with Salyut 7. Savitskaya second woman
Aleksandr Serebrov to orbit. Crew returned in Soyuz T-5.Svetlana Savitskaya
Space Shuttle Nov. 11, 1982 Vance D. Brand 5:2:14 Fifth flight of Space Shuttle; first operational Columbia (STS-5) Robert F. Overmyer flight; launched two commercial satellites
Joseph P. Allen (SBS 3 and Anik C-3); first flight with four William B. Lenoir crew members. EVA test canceled when
spacesuits malfunctioned.Space Shuttle Apr. 4, 1983 Paul J. Weitz 5:0:24 Sixth flight of Space Shuttle; launched TDRS-1.
Challenger (STS-6) Karol J. BobkoDonald H. PetersonF. Story Musgrave
2001 report 3/20/03 3:25 PM Page 123
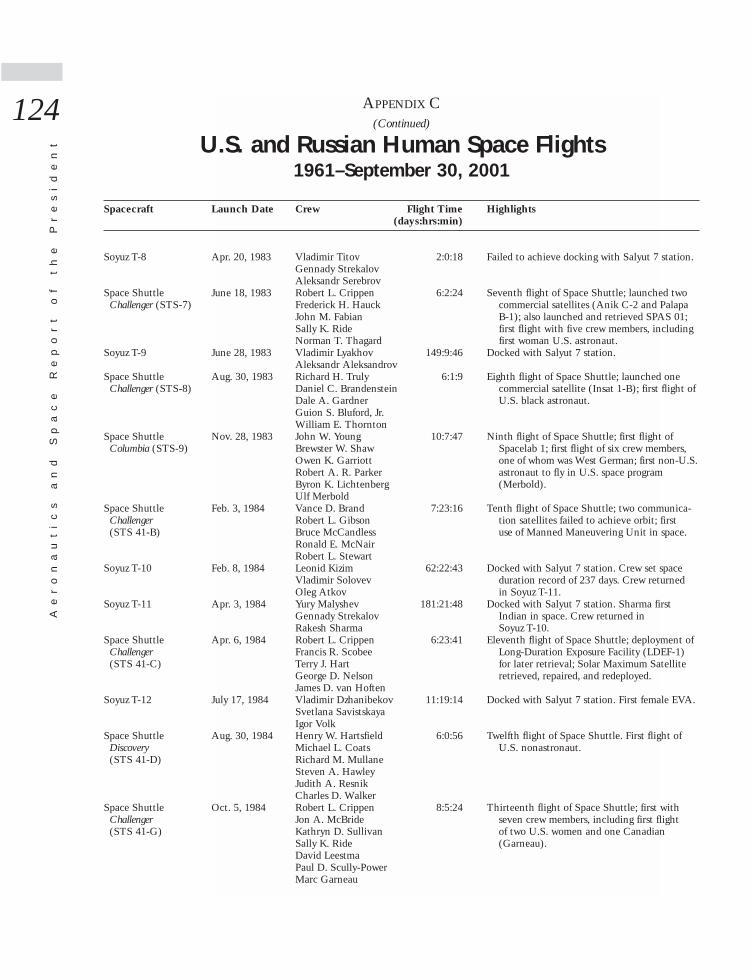
Ae
ro
na
ut
ic
s
an
d
Sp
ac
e
Re
po
rt
o
f
th
e
Pr
es
id
en
t
124 APPENDIX C(Continued)
U.S. and Russian Human Space Flights1961–September 30, 2001
Spacecraft Launch Date Crew Flight Time Highlights(days:hrs:min)
Soyuz T-8 Apr. 20, 1983 Vladimir Titov 2:0:18 Failed to achieve docking with Salyut 7 station.Gennady StrekalovAleksandr Serebrov
Space Shuttle June 18, 1983 Robert L. Crippen 6:2:24 Seventh flight of Space Shuttle; launched two Challenger (STS-7) Frederick H. Hauck commercial satellites (Anik C-2 and Palapa
John M. Fabian B-1); also launched and retrieved SPAS 01; Sally K. Ride first flight with five crew members, including Norman T. Thagard first woman U.S. astronaut.
Soyuz T-9 June 28, 1983 Vladimir Lyakhov 149:9:46 Docked with Salyut 7 station.Aleksandr Aleksandrov
Space Shuttle Aug. 30, 1983 Richard H. Truly 6:1:9 Eighth flight of Space Shuttle; launched one Challenger (STS-8) Daniel C. Brandenstein commercial satellite (Insat 1-B); first flight of
Dale A. Gardner U.S. black astronaut.Guion S. Bluford, Jr.William E. Thornton
Space Shuttle Nov. 28, 1983 John W. Young 10:7:47 Ninth flight of Space Shuttle; first flight of Columbia (STS-9) Brewster W. Shaw Spacelab 1; first flight of six crew members,
Owen K. Garriott one of whom was West German; first non-U.S. Robert A. R. Parker astronaut to fly in U.S. space program Byron K. Lichtenberg (Merbold).Ulf Merbold
Space Shuttle Feb. 3, 1984 Vance D. Brand 7:23:16 Tenth flight of Space Shuttle; two communica-Challenger Robert L. Gibson tion satellites failed to achieve orbit; first (STS 41-B) Bruce McCandless use of Manned Maneuvering Unit in space.
Ronald E. McNairRobert L. Stewart
Soyuz T-10 Feb. 8, 1984 Leonid Kizim 62:22:43 Docked with Salyut 7 station. Crew set space Vladimir Solovev duration record of 237 days. Crew returnedOleg Atkov in Soyuz T-11.
Soyuz T-11 Apr. 3, 1984 Yury Malyshev 181:21:48 Docked with Salyut 7 station. Sharma first Gennady Strekalov Indian in space. Crew returned in Rakesh Sharma Soyuz T-10.
Space Shuttle Apr. 6, 1984 Robert L. Crippen 6:23:41 Eleventh flight of Space Shuttle; deployment of Challenger Francis R. Scobee Long-Duration Exposure Facility (LDEF-1) (STS 41-C) Terry J. Hart for later retrieval; Solar Maximum Satellite
George D. Nelson retrieved, repaired, and redeployed.James D. van Hoften
Soyuz T-12 July 17, 1984 Vladimir Dzhanibekov 11:19:14 Docked with Salyut 7 station. First female EVA.Svetlana SavistskayaIgor Volk
Space Shuttle Aug. 30, 1984 Henry W. Hartsfield 6:0:56 Twelfth flight of Space Shuttle. First flight of Discovery Michael L. Coats U.S. nonastronaut.(STS 41-D) Richard M. Mullane
Steven A. HawleyJudith A. ResnikCharles D. Walker
Space Shuttle Oct. 5, 1984 Robert L. Crippen 8:5:24 Thirteenth flight of Space Shuttle; first with Challenger Jon A. McBride seven crew members, including first flight (STS 41-G) Kathryn D. Sullivan of two U.S. women and one Canadian
Sally K. Ride (Garneau).David LeestmaPaul D. Scully-PowerMarc Garneau
2001 report 3/20/03 3:25 PM Page 124
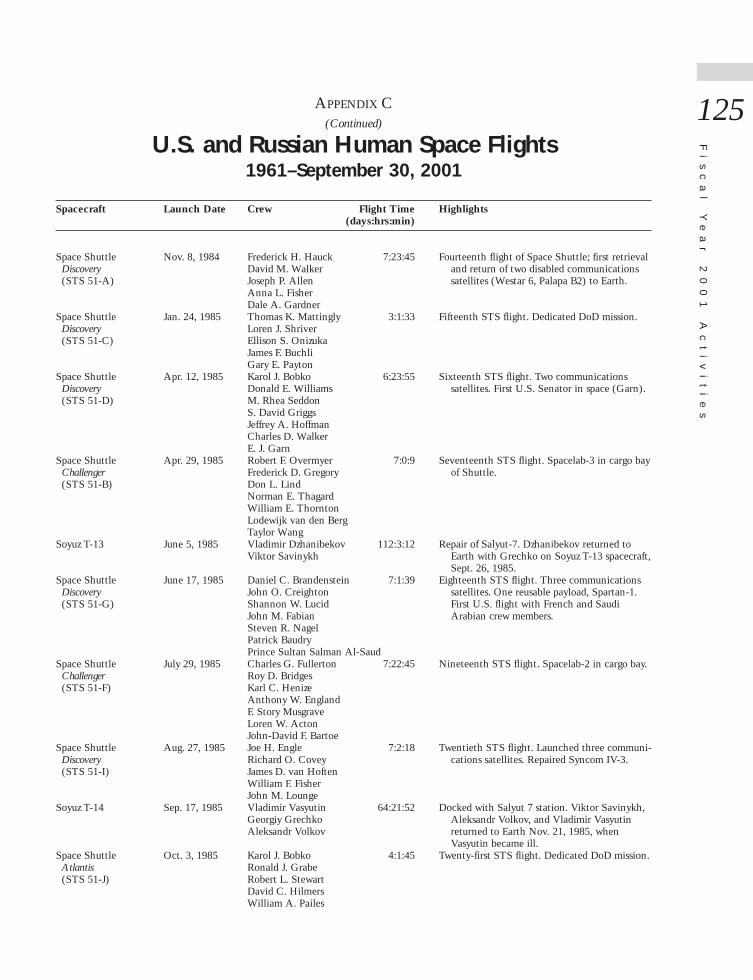
Fi
sc
al
Y
ea
r
20
01
A
ct
iv
it
ie
s
125APPENDIX C(Continued)
U.S. and Russian Human Space Flights1961–September 30, 2001
Spacecraft Launch Date Crew Flight Time Highlights(days:hrs:min)
Space Shuttle Nov. 8, 1984 Frederick H. Hauck 7:23:45 Fourteenth flight of Space Shuttle; first retrieval Discovery David M. Walker and return of two disabled communications (STS 51-A) Joseph P. Allen satellites (Westar 6, Palapa B2) to Earth.
Anna L. FisherDale A. Gardner
Space Shuttle Jan. 24, 1985 Thomas K. Mattingly 3:1:33 Fifteenth STS flight. Dedicated DoD mission.Discovery Loren J. Shriver(STS 51-C) Ellison S. Onizuka
James F. BuchliGary E. Payton
Space Shuttle Apr. 12, 1985 Karol J. Bobko 6:23:55 Sixteenth STS flight. Two communications Discovery Donald E. Williams satellites. First U.S. Senator in space (Garn).(STS 51-D) M. Rhea Seddon
S. David GriggsJeffrey A. HoffmanCharles D. WalkerE. J. Garn
Space Shuttle Apr. 29, 1985 Robert F. Overmyer 7:0:9 Seventeenth STS flight. Spacelab-3 in cargo bay Challenger Frederick D. Gregory of Shuttle. (STS 51-B) Don L. Lind
Norman E. ThagardWilliam E. ThorntonLodewijk van den BergTaylor Wang
Soyuz T-13 June 5, 1985 Vladimir Dzhanibekov 112:3:12 Repair of Salyut-7. Dzhanibekov returned to Viktor Savinykh Earth with Grechko on Soyuz T-13 spacecraft,
Sept. 26, 1985.Space Shuttle June 17, 1985 Daniel C. Brandenstein 7:1:39 Eighteenth STS flight. Three communications
Discovery John O. Creighton satellites. One reusable payload, Spartan-1. (STS 51-G) Shannon W. Lucid First U.S. flight with French and Saudi
John M. Fabian Arabian crew members.Steven R. NagelPatrick BaudryPrince Sultan Salman Al-Saud
Space Shuttle July 29, 1985 Charles G. Fullerton 7:22:45 Nineteenth STS flight. Spacelab-2 in cargo bay.Challenger Roy D. Bridges(STS 51-F) Karl C. Henize
Anthony W. EnglandF. Story MusgraveLoren W. ActonJohn-David F. Bartoe
Space Shuttle Aug. 27, 1985 Joe H. Engle 7:2:18 Twentieth STS flight. Launched three communi-Discovery Richard O. Covey cations satellites. Repaired Syncom IV-3.(STS 51-I) James D. van Hoften
William F. FisherJohn M. Lounge
Soyuz T-14 Sep. 17, 1985 Vladimir Vasyutin 64:21:52 Docked with Salyut 7 station. Viktor Savinykh, Georgiy Grechko Aleksandr Volkov, and Vladimir Vasyutin Aleksandr Volkov returned to Earth Nov. 21, 1985, when
Vasyutin became ill.Space Shuttle Oct. 3, 1985 Karol J. Bobko 4:1:45 Twenty-first STS flight. Dedicated DoD mission.
Atlantis Ronald J. Grabe(STS 51-J) Robert L. Stewart
David C. HilmersWilliam A. Pailes
2001 report 3/20/03 3:25 PM Page 125
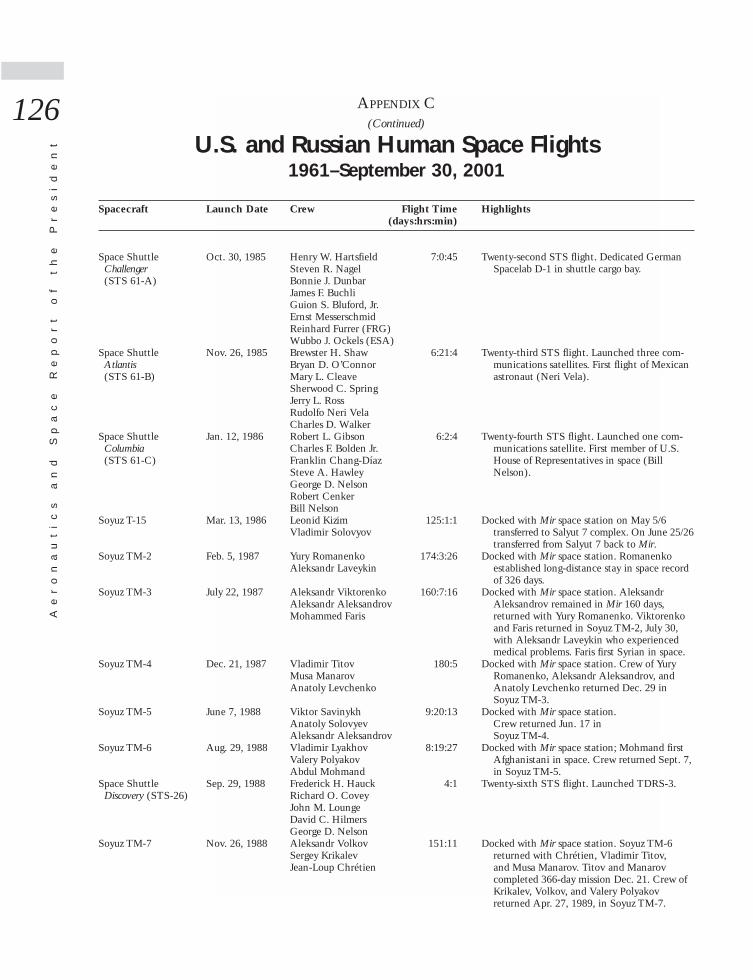
Ae
ro
na
ut
ic
s
an
d
Sp
ac
e
Re
po
rt
o
f
th
e
Pr
es
id
en
t
126 APPENDIX C(Continued)
U.S. and Russian Human Space Flights1961–September 30, 2001
Spacecraft Launch Date Crew Flight Time Highlights(days:hrs:min)
Space Shuttle Oct. 30, 1985 Henry W. Hartsfield 7:0:45 Twenty-second STS flight. Dedicated German Challenger Steven R. Nagel Spacelab D-1 in shuttle cargo bay. (STS 61-A) Bonnie J. Dunbar
James F. BuchliGuion S. Bluford, Jr.Ernst MesserschmidReinhard Furrer (FRG)Wubbo J. Ockels (ESA)
Space Shuttle Nov. 26, 1985 Brewster H. Shaw 6:21:4 Twenty-third STS flight. Launched three com-Atlantis Bryan D. O’Connor munications satellites. First flight of Mexican (STS 61-B) Mary L. Cleave astronaut (Neri Vela).
Sherwood C. SpringJerry L. RossRudolfo Neri VelaCharles D. Walker
Space Shuttle Jan. 12, 1986 Robert L. Gibson 6:2:4 Twenty-fourth STS flight. Launched one com-Columbia Charles F. Bolden Jr. munications satellite. First member of U.S. (STS 61-C) Franklin Chang-Díaz House of Representatives in space (Bill
Steve A. Hawley Nelson).George D. NelsonRobert CenkerBill Nelson
Soyuz T-15 Mar. 13, 1986 Leonid Kizim 125:1:1 Docked with Mir space station on May 5/6Vladimir Solovyov transferred to Salyut 7 complex. On June 25/26
transferred from Salyut 7 back to Mir.Soyuz TM-2 Feb. 5, 1987 Yury Romanenko 174:3:26 Docked with Mir space station. Romanenko
Aleksandr Laveykin established long-distance stay in space record of 326 days.
Soyuz TM-3 July 22, 1987 Aleksandr Viktorenko 160:7:16 Docked with Mir space station. Aleksandr Aleksandr Aleksandrov Aleksandrov remained in Mir 160 days, Mohammed Faris returned with Yury Romanenko. Viktorenko
and Faris returned in Soyuz TM-2, July 30, with Aleksandr Laveykin who experienced medical problems. Faris first Syrian in space.
Soyuz TM-4 Dec. 21, 1987 Vladimir Titov 180:5 Docked with Mir space station. Crew of Yury Musa Manarov Romanenko, Aleksandr Aleksandrov, and Anatoly Levchenko Anatoly Levchenko returned Dec. 29 in
Soyuz TM-3.Soyuz TM-5 June 7, 1988 Viktor Savinykh 9:20:13 Docked with Mir space station.
Anatoly Solovyev Crew returned Jun. 17 in Aleksandr Aleksandrov Soyuz TM-4.
Soyuz TM-6 Aug. 29, 1988 Vladimir Lyakhov 8:19:27 Docked with Mir space station; Mohmand first Valery Polyakov Afghanistani in space. Crew returned Sept. 7,Abdul Mohmand in Soyuz TM-5.
Space Shuttle Sep. 29, 1988 Frederick H. Hauck 4:1 Twenty-sixth STS flight. Launched TDRS-3.Discovery (STS-26) Richard O. Covey
John M. LoungeDavid C. HilmersGeorge D. Nelson
Soyuz TM-7 Nov. 26, 1988 Aleksandr Volkov 151:11 Docked with Mir space station. Soyuz TM-6 Sergey Krikalev returned with Chrétien, Vladimir Titov, Jean-Loup Chrétien and Musa Manarov. Titov and Manarov
completed 366-day mission Dec. 21. Crew ofKrikalev, Volkov, and Valery Polyakov returned Apr. 27, 1989, in Soyuz TM-7.
2001 report 3/20/03 3:25 PM Page 126
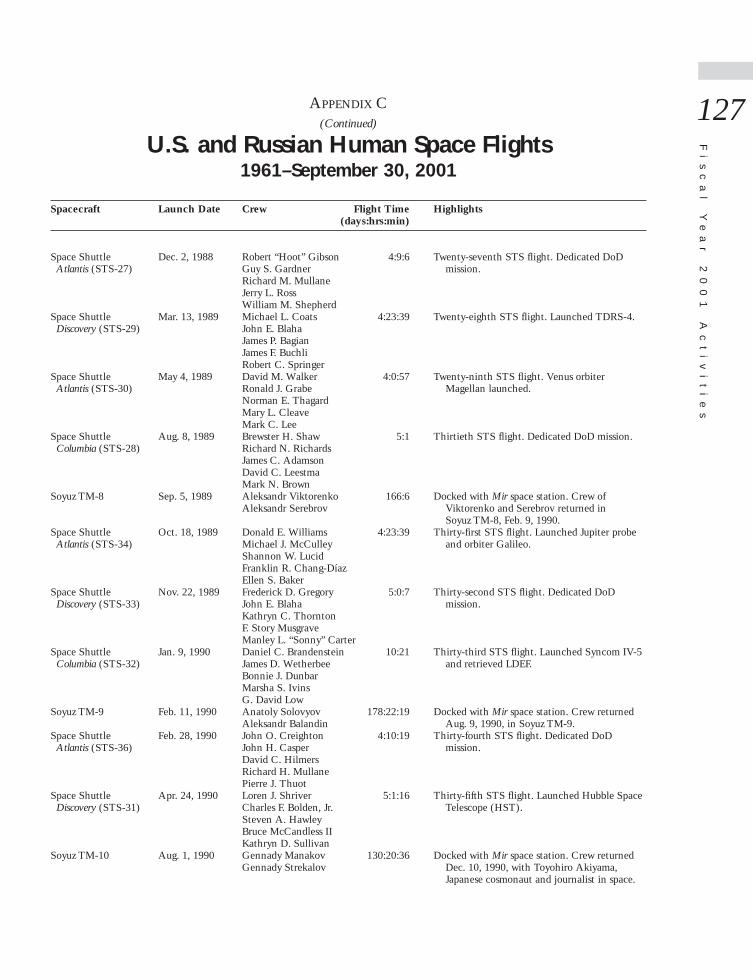
Fi
sc
al
Y
ea
r
20
01
A
ct
iv
it
ie
s
127APPENDIX C(Continued)
U.S. and Russian Human Space Flights1961–September 30, 2001
Spacecraft Launch Date Crew Flight Time Highlights(days:hrs:min)
Space Shuttle Dec. 2, 1988 Robert “Hoot” Gibson 4:9:6 Twenty-seventh STS flight. Dedicated DoD Atlantis (STS-27) Guy S. Gardner mission.
Richard M. MullaneJerry L. RossWilliam M. Shepherd
Space Shuttle Mar. 13, 1989 Michael L. Coats 4:23:39 Twenty-eighth STS flight. Launched TDRS-4. Discovery (STS-29) John E. Blaha
James P. BagianJames F. BuchliRobert C. Springer
Space Shuttle May 4, 1989 David M. Walker 4:0:57 Twenty-ninth STS flight. Venus orbiter Atlantis (STS-30) Ronald J. Grabe Magellan launched.
Norman E. ThagardMary L. CleaveMark C. Lee
Space Shuttle Aug. 8, 1989 Brewster H. Shaw 5:1 Thirtieth STS flight. Dedicated DoD mission.Columbia (STS-28) Richard N. Richards
James C. AdamsonDavid C. LeestmaMark N. Brown
Soyuz TM-8 Sep. 5, 1989 Aleksandr Viktorenko 166:6 Docked with Mir space station. Crew of Aleksandr Serebrov Viktorenko and Serebrov returned in
Soyuz TM-8, Feb. 9, 1990.Space Shuttle Oct. 18, 1989 Donald E. Williams 4:23:39 Thirty-first STS flight. Launched Jupiter probe
Atlantis (STS-34) Michael J. McCulley and orbiter Galileo. Shannon W. LucidFranklin R. Chang-Díaz Ellen S. Baker
Space Shuttle Nov. 22, 1989 Frederick D. Gregory 5:0:7 Thirty-second STS flight. Dedicated DoD Discovery (STS-33) John E. Blaha mission.
Kathryn C. Thornton F. Story Musgrave Manley L. “Sonny” Carter
Space Shuttle Jan. 9, 1990 Daniel C. Brandenstein 10:21 Thirty-third STS flight. Launched Syncom IV-5 Columbia (STS-32) James D. Wetherbee and retrieved LDEF.
Bonnie J. DunbarMarsha S. IvinsG. David Low
Soyuz TM-9 Feb. 11, 1990 Anatoly Solovyov 178:22:19 Docked with Mir space station. Crew returned Aleksandr Balandin Aug. 9, 1990, in Soyuz TM-9.
Space Shuttle Feb. 28, 1990 John O. Creighton 4:10:19 Thirty-fourth STS flight. Dedicated DoD Atlantis (STS-36) John H. Casper mission.
David C. HilmersRichard H. MullanePierre J. Thuot
Space Shuttle Apr. 24, 1990 Loren J. Shriver 5:1:16 Thirty-fifth STS flight. Launched Hubble Space Discovery (STS-31) Charles F. Bolden, Jr. Telescope (HST).
Steven A. HawleyBruce McCandless IIKathryn D. Sullivan
Soyuz TM-10 Aug. 1, 1990 Gennady Manakov 130:20:36 Docked with Mir space station. Crew returned Gennady Strekalov Dec. 10, 1990, with Toyohiro Akiyama,
Japanese cosmonaut and journalist in space.
2001 report 3/20/03 3:25 PM Page 127
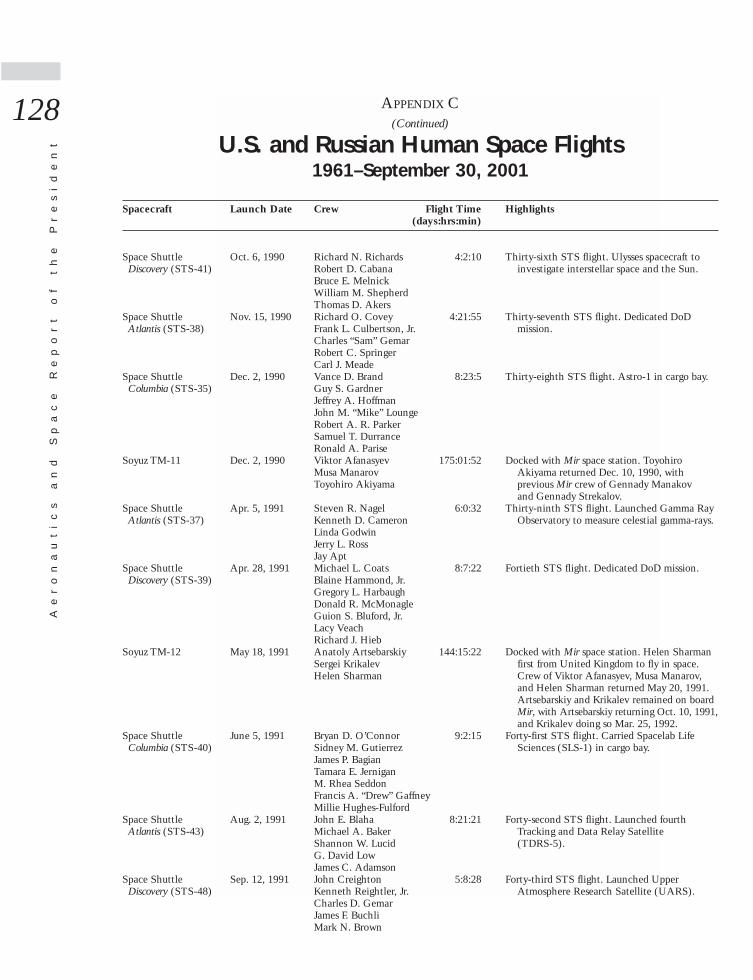
Ae
ro
na
ut
ic
s
an
d
Sp
ac
e
Re
po
rt
o
f
th
e
Pr
es
id
en
t
128 APPENDIX C(Continued)
U.S. and Russian Human Space Flights1961–September 30, 2001
Spacecraft Launch Date Crew Flight Time Highlights(days:hrs:min)
Space Shuttle Oct. 6, 1990 Richard N. Richards 4:2:10 Thirty-sixth STS flight. Ulysses spacecraft to Discovery (STS-41) Robert D. Cabana investigate interstellar space and the Sun.
Bruce E. MelnickWilliam M. ShepherdThomas D. Akers
Space Shuttle Nov. 15, 1990 Richard O. Covey 4:21:55 Thirty-seventh STS flight. Dedicated DoD Atlantis (STS-38) Frank L. Culbertson, Jr. mission.
Charles “Sam” GemarRobert C. SpringerCarl J. Meade
Space Shuttle Dec. 2, 1990 Vance D. Brand 8:23:5 Thirty-eighth STS flight. Astro-1 in cargo bay.Columbia (STS-35) Guy S. Gardner
Jeffrey A. HoffmanJohn M. “Mike” LoungeRobert A. R. ParkerSamuel T. DurranceRonald A. Parise
Soyuz TM-11 Dec. 2, 1990 Viktor Afanasyev 175:01:52 Docked with Mir space station. Toyohiro Musa Manarov Akiyama returned Dec. 10, 1990, with Toyohiro Akiyama previous Mir crew of Gennady Manakov
and Gennady Strekalov.Space Shuttle Apr. 5, 1991 Steven R. Nagel 6:0:32 Thirty-ninth STS flight. Launched Gamma Ray
Atlantis (STS-37) Kenneth D. Cameron Observatory to measure celestial gamma-rays.Linda GodwinJerry L. RossJay Apt
Space Shuttle Apr. 28, 1991 Michael L. Coats 8:7:22 Fortieth STS flight. Dedicated DoD mission.Discovery (STS-39) Blaine Hammond, Jr.
Gregory L. HarbaughDonald R. McMonagleGuion S. Bluford, Jr.Lacy VeachRichard J. Hieb
Soyuz TM-12 May 18, 1991 Anatoly Artsebarskiy 144:15:22 Docked with Mir space station. Helen Sharman Sergei Krikalev first from United Kingdom to fly in space. Helen Sharman Crew of Viktor Afanasyev, Musa Manarov,
and Helen Sharman returned May 20, 1991. Artsebarskiy and Krikalev remained on board Mir, with Artsebarskiy returning Oct. 10, 1991, and Krikalev doing so Mar. 25, 1992.
Space Shuttle June 5, 1991 Bryan D. O’Connor 9:2:15 Forty-first STS flight. Carried Spacelab Life Columbia (STS-40) Sidney M. Gutierrez Sciences (SLS-1) in cargo bay.
James P. BagianTamara E. JerniganM. Rhea SeddonFrancis A. “Drew” GaffneyMillie Hughes-Fulford
Space Shuttle Aug. 2, 1991 John E. Blaha 8:21:21 Forty-second STS flight. Launched fourth Atlantis (STS-43) Michael A. Baker Tracking and Data Relay Satellite
Shannon W. Lucid (TDRS-5).G. David LowJames C. Adamson
Space Shuttle Sep. 12, 1991 John Creighton 5:8:28 Forty-third STS flight. Launched Upper Discovery (STS-48) Kenneth Reightler, Jr. Atmosphere Research Satellite (UARS).
Charles D. GemarJames F. BuchliMark N. Brown
2001 report 3/20/03 3:25 PM Page 128

APPENDIX C(Continued)
U.S. and Russian Human Space Flights1961–September 30, 2001
Spacecraft Launch Date Crew Flight Time Highlights(days:hrs:min)
Soyuz TM-13 Oct. 2, 1991 Aleksandr Volkov 90:16:00 Docked with Mir space station. Crew returned Toktar Aubakirov Oct. 10, 1991, with Anatoly Artsebarskiy(Kazakh Republic) in the TM-12 spacecraft.Franz Viehboeck (Austria)
Space Shuttle Nov. 24, 1991 Frederick D. Gregory 6:22:51 Forty-fourth STS flight. Launched Defense Atlantis (STS-44) Tom Henricks Support Program (DSP) satellite.
Jim VossF. Story MusgraveMario Runco, Jr.Tom Hennen
Space Shuttle Jan. 22, 1992 Ronald J. Grabe 8:1:15 Forty-fifth STS flight. Carried International Discovery (STS-42) Stephen S. Oswald Microgravity Laboratory-1 in cargo bay.
Norman E. ThagardDavid C. HilmersWilliam F. ReaddyRoberta L. BondarUlf Merbold (ESA)
Soyuz TM-14 Mar. 17, 1992 Aleksandr Viktorenko 145:15:11 First manned CIS space mission. Docked with Aleksandr Kaleri Mir space station Mar. 19. The TM-13 Klaus-Dietrich Flade capsule with Flade, Aleksandr Volkov, and (Germany) Sergei Krikalev returned to Earth Mar. 25.
Krikalev had been in space 313 days.Viktorenko and Kaleri remained on the Mir space station.
Space Shuttle Mar. 24, 1992 Charles F. Bolden 8:22:9 Forty-sixth STS flight. Carried Atmospheric Atlantis (STS-45) Brian Duffy Laboratory for Applications and Science
Kathryn D. Sullivan (ATLAS-1).David C. LeestmaMichael FoaleDirk D. FrimoutByron K. Lichtenberg
Space Shuttle May 7, 1992 Daniel C. Brandenstein 8:21:18 Forty-seventh STS flight. Reboosted a crippled Endeavour (STS-49) Kevin P. Chilton INTELSAT VI communications satellite.
Richard J. HiebBruce E. MelnickPierre J. ThuotKathryn C. ThorntonThomas D. Akers
Space Shuttle June 25, 1992 Richard N. Richards 13:19:30 Forty-eighth STS flight. Carried U.S. Columbia (STS-50) Kenneth D. Bowersox Microgravity Laboratory-1.
Bonnie DunbarEllen BakerCarl MeadeLawrence J. DeLucasEugene H. Trinh
Soyuz TM-15 July 27, 1992 Anatoly Solovyov 189:17:43 Docked with Mir space station July 29. Tognini Sergei Avdeyev returned to Earth in TM-14 capsule with Michel Tognini (France) Aleksandr Viktorenko and Aleksandr Kaleri.
Solovyov and Avdeyev spent over six months in the Mir orbital complex and returned to Earth in the descent vehicle of the TM-15 spacecraft on Feb. 1, 1993.
Fi
sc
al
Y
ea
r
20
01
A
ct
iv
it
ie
s
129
2001 report 3/20/03 3:25 PM Page 129
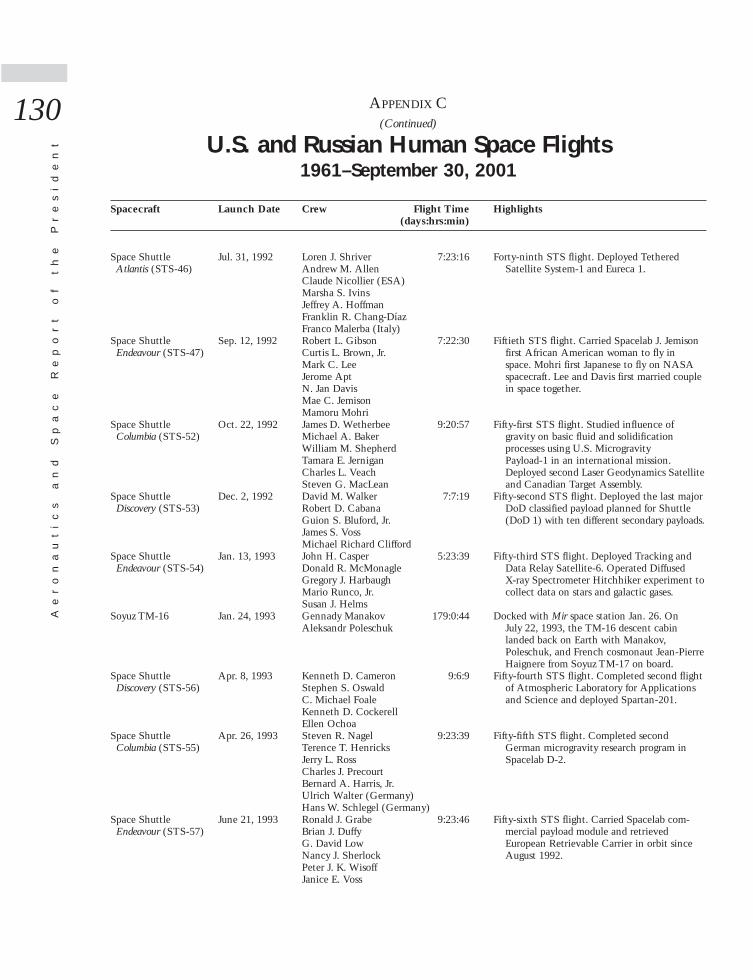
APPENDIX C(Continued)
U.S. and Russian Human Space Flights1961–September 30, 2001
Spacecraft Launch Date Crew Flight Time Highlights(days:hrs:min)
Space Shuttle Jul. 31, 1992 Loren J. Shriver 7:23:16 Forty-ninth STS flight. Deployed Tethered Atlantis (STS-46) Andrew M. Allen Satellite System-1 and Eureca 1.
Claude Nicollier (ESA)Marsha S. IvinsJeffrey A. HoffmanFranklin R. Chang-DíazFranco Malerba (Italy)
Space Shuttle Sep. 12, 1992 Robert L. Gibson 7:22:30 Fiftieth STS flight. Carried Spacelab J. Jemison Endeavour (STS-47) Curtis L. Brown, Jr. first African American woman to fly in
Mark C. Lee space. Mohri first Japanese to fly on NASA Jerome Apt spacecraft. Lee and Davis first married couple N. Jan Davis in space together.Mae C. JemisonMamoru Mohri
Space Shuttle Oct. 22, 1992 James D. Wetherbee 9:20:57 Fifty-first STS flight. Studied influence of Columbia (STS-52) Michael A. Baker gravity on basic fluid and solidification
William M. Shepherd processes using U.S. Microgravity Tamara E. Jernigan Payload-1 in an international mission. Charles L. Veach Deployed second Laser Geodynamics Satellite Steven G. MacLean and Canadian Target Assembly.
Space Shuttle Dec. 2, 1992 David M. Walker 7:7:19 Fifty-second STS flight. Deployed the last major Discovery (STS-53) Robert D. Cabana DoD classified payload planned for Shuttle
Guion S. Bluford, Jr. (DoD 1) with ten different secondary payloads.James S. VossMichael Richard Clifford
Space Shuttle Jan. 13, 1993 John H. Casper 5:23:39 Fifty-third STS flight. Deployed Tracking and Endeavour (STS-54) Donald R. McMonagle Data Relay Satellite-6. Operated Diffused
Gregory J. Harbaugh X-ray Spectrometer Hitchhiker experiment to Mario Runco, Jr. collect data on stars and galactic gases.Susan J. Helms
Soyuz TM-16 Jan. 24, 1993 Gennady Manakov 179:0:44 Docked with Mir space station Jan. 26. On Aleksandr Poleschuk July 22, 1993, the TM-16 descent cabin
landed back on Earth with Manakov, Poleschuk, and French cosmonaut Jean-Pierre Haignere from Soyuz TM-17 on board.
Space Shuttle Apr. 8, 1993 Kenneth D. Cameron 9:6:9 Fifty-fourth STS flight. Completed second flight Discovery (STS-56) Stephen S. Oswald of Atmospheric Laboratory for Applications
C. Michael Foale and Science and deployed Spartan-201.Kenneth D. CockerellEllen Ochoa
Space Shuttle Apr. 26, 1993 Steven R. Nagel 9:23:39 Fifty-fifth STS flight. Completed second Columbia (STS-55) Terence T. Henricks German microgravity research program in
Jerry L. Ross Spacelab D-2.Charles J. PrecourtBernard A. Harris, Jr.Ulrich Walter (Germany)Hans W. Schlegel (Germany)
Space Shuttle June 21, 1993 Ronald J. Grabe 9:23:46 Fifty-sixth STS flight. Carried Spacelab com-Endeavour (STS-57) Brian J. Duffy mercial payload module and retrieved
G. David Low European Retrievable Carrier in orbit sinceNancy J. Sherlock August 1992.Peter J. K. WisoffJanice E. Voss
Ae
ro
na
ut
ic
s
an
d
Sp
ac
e
Re
po
rt
o
f
th
e
Pr
es
id
en
t
130
2001 report 3/20/03 3:25 PM Page 130
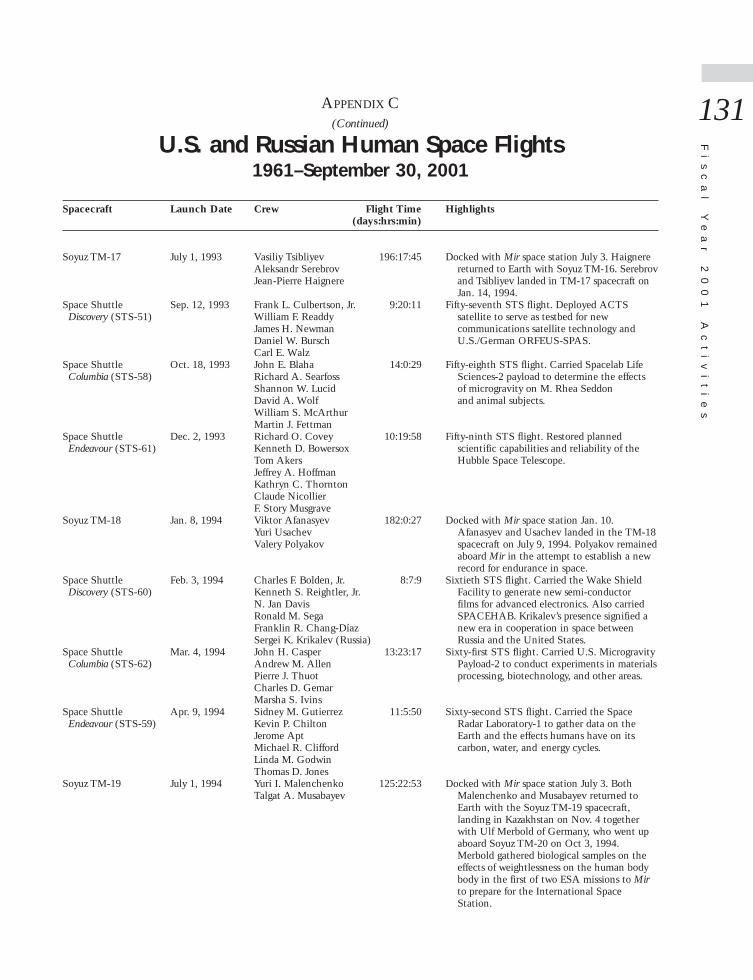
APPENDIX C(Continued)
U.S. and Russian Human Space Flights1961–September 30, 2001
Spacecraft Launch Date Crew Flight Time Highlights(days:hrs:min)
Soyuz TM-17 July 1, 1993 Vasiliy Tsibliyev 196:17:45 Docked with Mir space station July 3. Haignere Aleksandr Serebrov returned to Earth with Soyuz TM-16. SerebrovJean-Pierre Haignere and Tsibliyev landed in TM-17 spacecraft on
Jan. 14, 1994.Space Shuttle Sep. 12, 1993 Frank L. Culbertson, Jr. 9:20:11 Fifty-seventh STS flight. Deployed ACTS
Discovery (STS-51) William F. Readdy satellite to serve as testbed for new James H. Newman communications satellite technology and Daniel W. Bursch U.S./German ORFEUS-SPAS.Carl E. Walz
Space Shuttle Oct. 18, 1993 John E. Blaha 14:0:29 Fifty-eighth STS flight. Carried Spacelab Life Columbia (STS-58) Richard A. Searfoss Sciences-2 payload to determine the effects
Shannon W. Lucid of microgravity on M. Rhea Seddon David A. Wolf and animal subjects.William S. McArthurMartin J. Fettman
Space Shuttle Dec. 2, 1993 Richard O. Covey 10:19:58 Fifty-ninth STS flight. Restored planned Endeavour (STS-61) Kenneth D. Bowersox scientific capabilities and reliability of the
Tom Akers Hubble Space Telescope.Jeffrey A. HoffmanKathryn C. ThorntonClaude NicollierF. Story Musgrave
Soyuz TM-18 Jan. 8, 1994 Viktor Afanasyev 182:0:27 Docked with Mir space station Jan. 10. Yuri Usachev Afanasyev and Usachev landed in the TM-18Valery Polyakov spacecraft on July 9, 1994. Polyakov remained
aboard Mir in the attempt to establish a newrecord for endurance in space.
Space Shuttle Feb. 3, 1994 Charles F. Bolden, Jr. 8:7:9 Sixtieth STS flight. Carried the Wake Shield Discovery (STS-60) Kenneth S. Reightler, Jr. Facility to generate new semi-conductor
N. Jan Davis films for advanced electronics. Also carried Ronald M. Sega SPACEHAB. Krikalev’s presence signified aFranklin R. Chang-Díaz new era in cooperation in space betweenSergei K. Krikalev (Russia) Russia and the United States.
Space Shuttle Mar. 4, 1994 John H. Casper 13:23:17 Sixty-first STS flight. Carried U.S. Microgravity Columbia (STS-62) Andrew M. Allen Payload-2 to conduct experiments in materials
Pierre J. Thuot processing, biotechnology, and other areas.Charles D. GemarMarsha S. Ivins
Space Shuttle Apr. 9, 1994 Sidney M. Gutierrez 11:5:50 Sixty-second STS flight. Carried the Space Endeavour (STS-59) Kevin P. Chilton Radar Laboratory-1 to gather data on the
Jerome Apt Earth and the effects humans have on itsMichael R. Clifford carbon, water, and energy cycles.Linda M. GodwinThomas D. Jones
Soyuz TM-19 July 1, 1994 Yuri I. Malenchenko 125:22:53 Docked with Mir space station July 3. Both Talgat A. Musabayev Malenchenko and Musabayev returned to
Earth with the Soyuz TM-19 spacecraft, landing in Kazakhstan on Nov. 4 together with Ulf Merbold of Germany, who went upaboard Soyuz TM-20 on Oct 3, 1994. Merbold gathered biological samples on the effects of weightlessness on the human bodybody in the first of two ESA missions to Mir to prepare for the International Space Station.
Fi
sc
al
Y
ea
r
20
01
A
ct
iv
it
ie
s
131
2001 report 3/20/03 3:25 PM Page 131
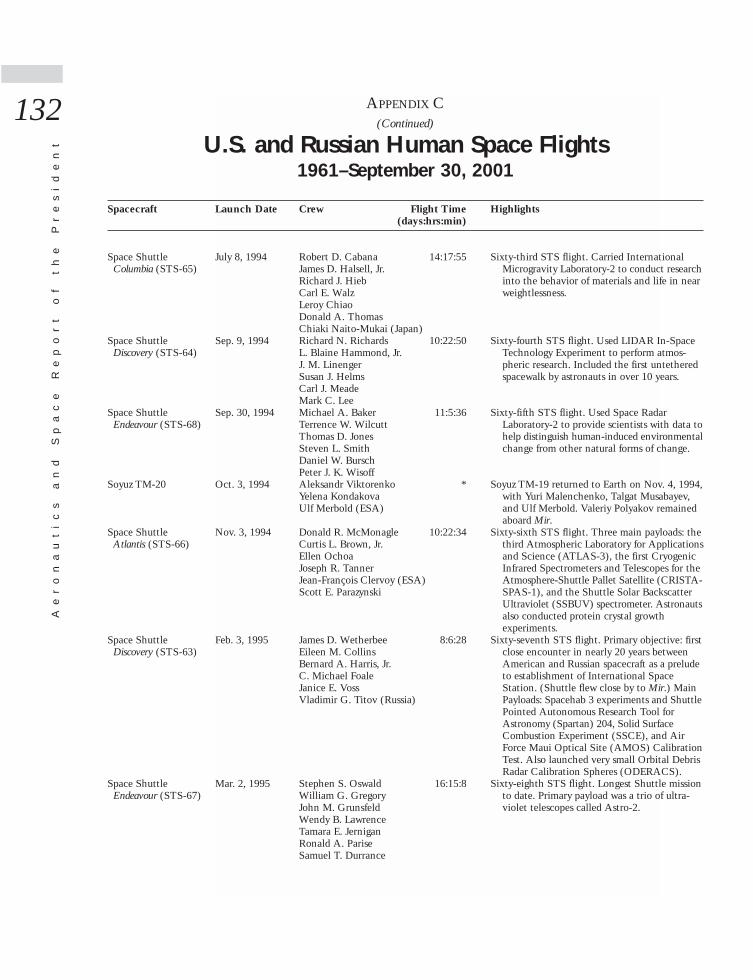
APPENDIX C(Continued)
U.S. and Russian Human Space Flights1961–September 30, 2001
Spacecraft Launch Date Crew Flight Time Highlights(days:hrs:min)
Space Shuttle July 8, 1994 Robert D. Cabana 14:17:55 Sixty-third STS flight. Carried International Columbia (STS-65) James D. Halsell, Jr. Microgravity Laboratory-2 to conduct research
Richard J. Hieb into the behavior of materials and life in near Carl E. Walz weightlessness.Leroy ChiaoDonald A. ThomasChiaki Naito-Mukai (Japan)
Space Shuttle Sep. 9, 1994 Richard N. Richards 10:22:50 Sixty-fourth STS flight. Used LIDAR In-Space Discovery (STS-64) L. Blaine Hammond, Jr. Technology Experiment to perform atmos-
J. M. Linenger pheric research. Included the first untethered Susan J. Helms spacewalk by astronauts in over 10 years.Carl J. MeadeMark C. Lee
Space Shuttle Sep. 30, 1994 Michael A. Baker 11:5:36 Sixty-fifth STS flight. Used Space Radar Endeavour (STS-68) Terrence W. Wilcutt Laboratory-2 to provide scientists with data to
Thomas D. Jones help distinguish human-induced environmentalSteven L. Smith change from other natural forms of change.Daniel W. BurschPeter J. K. Wisoff
Soyuz TM-20 Oct. 3, 1994 Aleksandr Viktorenko * Soyuz TM-19 returned to Earth on Nov. 4, 1994, Yelena Kondakova with Yuri Malenchenko, Talgat Musabayev, Ulf Merbold (ESA) and Ulf Merbold. Valeriy Polyakov remained
aboard Mir.Space Shuttle Nov. 3, 1994 Donald R. McMonagle 10:22:34 Sixty-sixth STS flight. Three main payloads: the
Atlantis (STS-66) Curtis L. Brown, Jr. third Atmospheric Laboratory for Applications Ellen Ochoa and Science (ATLAS-3), the first Cryogenic Joseph R. Tanner Infrared Spectrometers and Telescopes for the Jean-François Clervoy (ESA) Atmosphere-Shuttle Pallet Satellite (CRISTA-Scott E. Parazynski SPAS-1), and the Shuttle Solar Backscatter
Ultraviolet (SSBUV) spectrometer. Astronautsalso conducted protein crystal growthexperiments.
Space Shuttle Feb. 3, 1995 James D. Wetherbee 8:6:28 Sixty-seventh STS flight. Primary objective: first Discovery (STS-63) Eileen M. Collins close encounter in nearly 20 years between
Bernard A. Harris, Jr. American and Russian spacecraft as a prelude C. Michael Foale to establishment of International Space Janice E. Voss Station. (Shuttle flew close by to Mir.) Main Vladimir G. Titov (Russia) Payloads: Spacehab 3 experiments and Shuttle
Pointed Autonomous Research Tool forAstronomy (Spartan) 204, Solid SurfaceCombustion Experiment (SSCE), and Air Force Maui Optical Site (AMOS) Calibration Test. Also launched very small Orbital Debris Radar Calibration Spheres (ODERACS).
Space Shuttle Mar. 2, 1995 Stephen S. Oswald 16:15:8 Sixty-eighth STS flight. Longest Shuttle mission Endeavour (STS-67) William G. Gregory to date. Primary payload was a trio of ultra-
John M. Grunsfeld violet telescopes called Astro-2.Wendy B. LawrenceTamara E. JerniganRonald A. PariseSamuel T. Durrance
Ae
ro
na
ut
ic
s
an
d
Sp
ac
e
Re
po
rt
o
f
th
e
Pr
es
id
en
t
132
2001 report 3/20/03 3:25 PM Page 132

Fi
sc
al
Y
ea
r
20
01
A
ct
iv
it
ie
s
133APPENDIX C(Continued)
U.S. and Russian Human Space Flights1961–September 30, 2001
Spacecraft Launch Date Crew Flight Time Highlights(days:hrs:min)
Soyuz TM-21 Mar. 14, 1995 Vladimir Dezhurov * Thagard was the first American astronaut to fly Gennadi Strekalov on a Russian rocket and to stay on the Mir Norman Thagard (U.S.) space station. Soyuz TM-20 returned to Earth
on Mar. 22, 1995, with Valeriy Polyakov, Alexsandr Viktorenko, and Yelena Kondakova. Polyakov set world record by remaining in space for 438 days.
Space Shuttle June 27, 1995 Robert L. Gibson 9:19:22 Sixty-ninth STS flight and one hundredth U.S. Atlantis (STS-71) Charles J. Precourt human space flight. Docked with Mir space
Ellen S. Baker station. Brought up Mir 19 crew (Anatoly Y.Gregory Harbaugh Solovyev and Nikolai M. Budarin). Returned Bonnie J. Dunbar to Earth with Mir 18 crew (Vladimir N.
Dezhurov, Gennady M. Strekalov, and Norman Thagard). Thagard set an American record by remaining in space for 115 days.
Space Shuttle July 13, 1995 Terence Henricks 8:22:20 Seventieth STS flight. Deployed Tracking and Discovery (STS-70) Kevin R. Kregel Data Relay Satellite (TDRS). Also conducted
Nancy J. Currie various biomedical experiments.Donald A. ThomasMary Ellen Weber
Soyuz TM-22 Sep. 3, 1995 Yuri Gidzenko * Soyuz TM-21 returned to Earth on Sep. 11, 1995, Sergei Avdeev with Mir 19 crew (Anatoliy Solovyev and Thomas Reiter (ESA) Nikolay Budarin).
Space Shuttle Sep. 7, 1995 David M. Walker 10:20:28 Seventy-first STS flight. Deployed Wake Shield Endeavour (STS-69) Kenneth D. Cockrell Facility (WSF-2) and Spartan 201-03.
James S. VossJames H. NewmanMichael L. Gernhardt
Space Shuttle Oct. 20, 1995 Kenneth D. Bowersox 15:21:52 Seventy-second STS flight. Carried out micro-Columbia (STS-73) Kent V. Rominger gravity experiments with the U.S.
Catherine G. Coleman Microgravity Laboratory (USML-2) Michael Lopez-Alegria payload.Kathryn C. ThorntonFred W. LeslieAlbert Sacco, Jr.
Space Shuttle Nov. 12, 1995 Kenneth D. Cameron 8:4:31 Seventy-third STS flight. Docked with Mir Atlantis (STS-74) James D. Halsell, Jr. space station as part of International Space
Chris A. Hadfield (CSA) Station (ISS) Phase I efforts.Jerry L. RossWilliam S. McArthur, Jr.
Space Shuttle Jan. 11, 1996 Brian Duffy 8:22:1 Seventy-fourth STS flight. Deployed OAST Endeavour (STS-72) Brent W. Jett, Jr. Flyer. Retrieved previously launched
Leroy Chiao Japanese Space Flyer Unit satellite. Crew Winston E. Scott performed spacewalks to build experience Koichi Wakata (Japan) for ISS construction.Daniel T. Barry
Soyuz TM-23 Feb. 21, 1996 Yuri Onufrienko * Soyuz TM-22 returned to Earth on Feb. 29, 1996, Yuri Usachyou with Mir 20 crew (Yuri Gidzenko, Sergei
Avdeev, and Thomas Reiter).
2001 report 3/20/03 3:25 PM Page 133
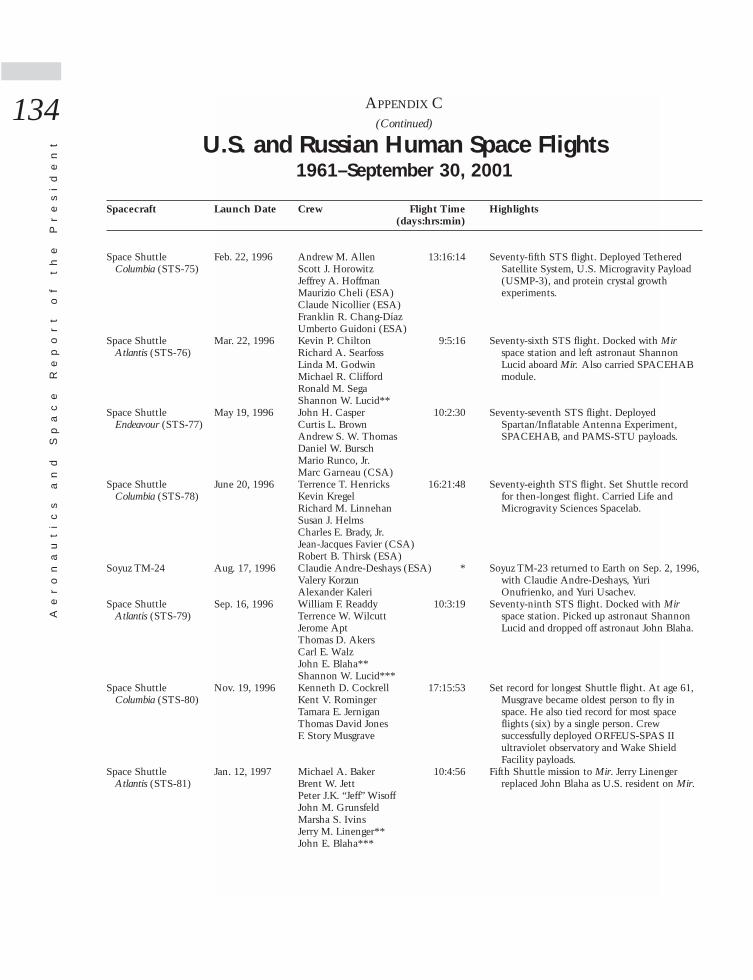
Ae
ro
na
ut
ic
s
an
d
Sp
ac
e
Re
po
rt
o
f
th
e
Pr
es
id
en
t
134 APPENDIX C(Continued)
U.S. and Russian Human Space Flights1961–September 30, 2001
Spacecraft Launch Date Crew Flight Time Highlights(days:hrs:min)
Space Shuttle Feb. 22, 1996 Andrew M. Allen 13:16:14 Seventy-fifth STS flight. Deployed Tethered Columbia (STS-75) Scott J. Horowitz Satellite System, U.S. Microgravity Payload
Jeffrey A. Hoffman (USMP-3), and protein crystal growth Maurizio Cheli (ESA) experiments.Claude Nicollier (ESA)Franklin R. Chang-DíazUmberto Guidoni (ESA)
Space Shuttle Mar. 22, 1996 Kevin P. Chilton 9:5:16 Seventy-sixth STS flight. Docked with Mir Atlantis (STS-76) Richard A. Searfoss space station and left astronaut Shannon
Linda M. Godwin Lucid aboard Mir. Also carried SPACEHAB Michael R. Clifford module.Ronald M. SegaShannon W. Lucid**
Space Shuttle May 19, 1996 John H. Casper 10:2:30 Seventy-seventh STS flight. Deployed Endeavour (STS-77) Curtis L. Brown Spartan/Inflatable Antenna Experiment,
Andrew S. W. Thomas SPACEHAB, and PAMS-STU payloads.Daniel W. BurschMario Runco, Jr.Marc Garneau (CSA)
Space Shuttle June 20, 1996 Terrence T. Henricks 16:21:48 Seventy-eighth STS flight. Set Shuttle recordColumbia (STS-78) Kevin Kregel for then-longest flight. Carried Life and
Richard M. Linnehan Microgravity Sciences Spacelab. Susan J. HelmsCharles E. Brady, Jr.Jean-Jacques Favier (CSA)Robert B. Thirsk (ESA)
Soyuz TM-24 Aug. 17, 1996 Claudie Andre-Deshays (ESA) * Soyuz TM-23 returned to Earth on Sep. 2, 1996,Valery Korzun with Claudie Andre-Deshays, Yuri Alexander Kaleri Onufrienko, and Yuri Usachev.
Space Shuttle Sep. 16, 1996 William F. Readdy 10:3:19 Seventy-ninth STS flight. Docked with Mir Atlantis (STS-79) Terrence W. Wilcutt space station. Picked up astronaut Shannon
Jerome Apt Lucid and dropped off astronaut John Blaha.Thomas D. AkersCarl E. WalzJohn E. Blaha**Shannon W. Lucid***
Space Shuttle Nov. 19, 1996 Kenneth D. Cockrell 17:15:53 Set record for longest Shuttle flight. At age 61, Columbia (STS-80) Kent V. Rominger Musgrave became oldest person to fly in
Tamara E. Jernigan space. He also tied record for most space Thomas David Jones flights (six) by a single person. Crew F. Story Musgrave successfully deployed ORFEUS-SPAS II
ultraviolet observatory and Wake Shield Facility payloads.
Space Shuttle Jan. 12, 1997 Michael A. Baker 10:4:56 Fifth Shuttle mission to Mir. Jerry Linenger Atlantis (STS-81) Brent W. Jett replaced John Blaha as U.S. resident on Mir.
Peter J.K. “Jeff” WisoffJohn M. GrunsfeldMarsha S. IvinsJerry M. Linenger**John E. Blaha***
2001 report 3/20/03 3:25 PM Page 134
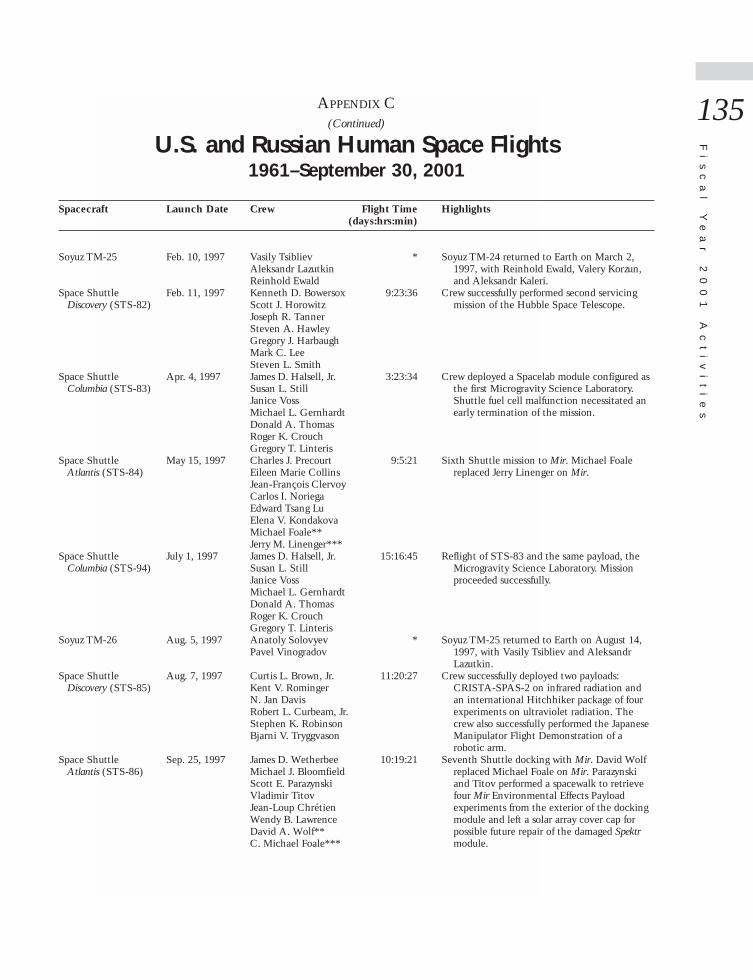
Fi
sc
al
Y
ea
r
20
01
A
ct
iv
it
ie
s
135APPENDIX C(Continued)
U.S. and Russian Human Space Flights1961–September 30, 2001
Spacecraft Launch Date Crew Flight Time Highlights(days:hrs:min)
Soyuz TM-25 Feb. 10, 1997 Vasily Tsibliev * Soyuz TM-24 returned to Earth on March 2, Aleksandr Lazutkin 1997, with Reinhold Ewald, Valery Korzun, Reinhold Ewald and Aleksandr Kaleri.
Space Shuttle Feb. 11, 1997 Kenneth D. Bowersox 9:23:36 Crew successfully performed second servicing Discovery (STS-82) Scott J. Horowitz mission of the Hubble Space Telescope.
Joseph R. TannerSteven A. HawleyGregory J. HarbaughMark C. LeeSteven L. Smith
Space Shuttle Apr. 4, 1997 James D. Halsell, Jr. 3:23:34 Crew deployed a Spacelab module configured as Columbia (STS-83) Susan L. Still the first Microgravity Science Laboratory.
Janice Voss Shuttle fuel cell malfunction necessitated an Michael L. Gernhardt early termination of the mission.Donald A. ThomasRoger K. CrouchGregory T. Linteris
Space Shuttle May 15, 1997 Charles J. Precourt 9:5:21 Sixth Shuttle mission to Mir. Michael Foale Atlantis (STS-84) Eileen Marie Collins replaced Jerry Linenger on Mir.
Jean-François ClervoyCarlos I. NoriegaEdward Tsang LuElena V. Kondakova Michael Foale**Jerry M. Linenger***
Space Shuttle July 1, 1997 James D. Halsell, Jr. 15:16:45 Reflight of STS-83 and the same payload, the Columbia (STS-94) Susan L. Still Microgravity Science Laboratory. Mission
Janice Voss proceeded successfully.Michael L. GernhardtDonald A. ThomasRoger K. CrouchGregory T. Linteris
Soyuz TM-26 Aug. 5, 1997 Anatoly Solovyev * Soyuz TM-25 returned to Earth on August 14, Pavel Vinogradov 1997, with Vasily Tsibliev and Aleksandr
Lazutkin.Space Shuttle Aug. 7, 1997 Curtis L. Brown, Jr. 11:20:27 Crew successfully deployed two payloads:
Discovery (STS-85) Kent V. Rominger CRISTA-SPAS-2 on infrared radiation and N. Jan Davis an international Hitchhiker package of four Robert L. Curbeam, Jr. experiments on ultraviolet radiation. The Stephen K. Robinson crew also successfully performed the Japanese Bjarni V. Tryggvason Manipulator Flight Demonstration of a
robotic arm.Space Shuttle Sep. 25, 1997 James D. Wetherbee 10:19:21 Seventh Shuttle docking with Mir. David Wolf
Atlantis (STS-86) Michael J. Bloomfield replaced Michael Foale on Mir. Parazynski Scott E. Parazynski and Titov performed a spacewalk to retrieve Vladimir Titov four Mir Environmental Effects Payload Jean-Loup Chrétien experiments from the exterior of the docking Wendy B. Lawrence module and left a solar array cover cap for David A. Wolf** possible future repair of the damaged SpektrC. Michael Foale*** module.
2001 report 3/20/03 3:25 PM Page 135
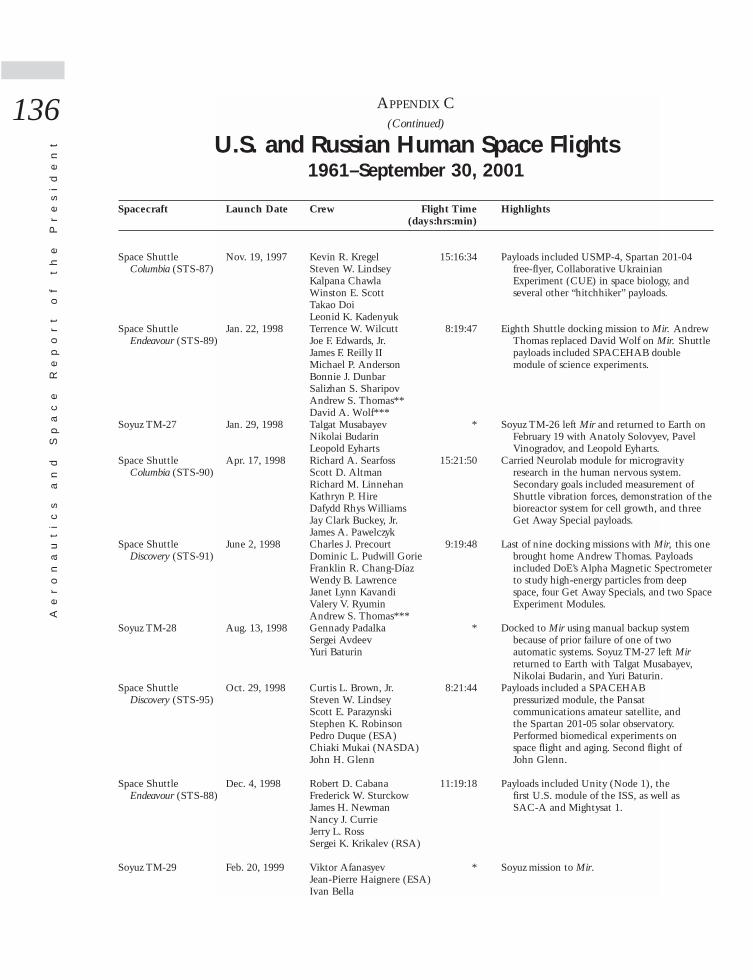
Ae
ro
na
ut
ic
s
an
d
Sp
ac
e
Re
po
rt
o
f
th
e
Pr
es
id
en
t
136 APPENDIX C(Continued)
U.S. and Russian Human Space Flights1961–September 30, 2001
Spacecraft Launch Date Crew Flight Time Highlights(days:hrs:min)
Space Shuttle Nov. 19, 1997 Kevin R. Kregel 15:16:34 Payloads included USMP-4, Spartan 201-04Columbia (STS-87) Steven W. Lindsey free-flyer, Collaborative Ukrainian
Kalpana Chawla Experiment (CUE) in space biology, and Winston E. Scott several other “hitchhiker” payloads.Takao DoiLeonid K. Kadenyuk
Space Shuttle Jan. 22, 1998 Terrence W. Wilcutt 8:19:47 Eighth Shuttle docking mission to Mir. AndrewEndeavour (STS-89) Joe F. Edwards, Jr. Thomas replaced David Wolf on Mir. Shuttle
James F. Reilly II payloads included SPACEHAB double Michael P. Anderson module of science experiments.Bonnie J. DunbarSalizhan S. SharipovAndrew S. Thomas**David A. Wolf***
Soyuz TM-27 Jan. 29, 1998 Talgat Musabayev * Soyuz TM-26 left Mir and returned to Earth onNikolai Budarin February 19 with Anatoly Solovyev, PavelLeopold Eyharts Vinogradov, and Leopold Eyharts.
Space Shuttle Apr. 17, 1998 Richard A. Searfoss 15:21:50 Carried Neurolab module for microgravity Columbia (STS-90) Scott D. Altman research in the human nervous system.
Richard M. Linnehan Secondary goals included measurement ofKathryn P. Hire Shuttle vibration forces, demonstration of theDafydd Rhys Williams bioreactor system for cell growth, and three Jay Clark Buckey, Jr. Get Away Special payloads.James A. Pawelczyk
Space Shuttle June 2, 1998 Charles J. Precourt 9:19:48 Last of nine docking missions with Mir, this oneDiscovery (STS-91) Dominic L. Pudwill Gorie brought home Andrew Thomas. Payloads
Franklin R. Chang-Díaz included DoE’s Alpha Magnetic Spectrometer Wendy B. Lawrence to study high-energy particles from deep Janet Lynn Kavandi space, four Get Away Specials, and two Space Valery V. Ryumin Experiment Modules.Andrew S. Thomas***
Soyuz TM-28 Aug. 13, 1998 Gennady Padalka * Docked to Mir using manual backup systemSergei Avdeev because of prior failure of one of two Yuri Baturin automatic systems. Soyuz TM-27 left Mir
returned to Earth with Talgat Musabayev, Nikolai Budarin, and Yuri Baturin.
Space Shuttle Oct. 29, 1998 Curtis L. Brown, Jr. 8:21:44 Payloads included a SPACEHABDiscovery (STS-95) Steven W. Lindsey pressurized module, the Pansat
Scott E. Parazynski communications amateur satellite, andStephen K. Robinson the Spartan 201-05 solar observatory.Pedro Duque (ESA) Performed biomedical experiments onChiaki Mukai (NASDA) space flight and aging. Second flight ofJohn H. Glenn John Glenn.
Space Shuttle Dec. 4, 1998 Robert D. Cabana 11:19:18 Payloads included Unity (Node 1), theEndeavour (STS-88) Frederick W. Sturckow first U.S. module of the ISS, as well as
James H. Newman SAC-A and Mightysat 1.Nancy J. CurrieJerry L. RossSergei K. Krikalev (RSA)
Soyuz TM-29 Feb. 20, 1999 Viktor Afanasyev * Soyuz mission to Mir.Jean-Pierre Haignere (ESA)Ivan Bella
2001 report 3/20/03 3:25 PM Page 136
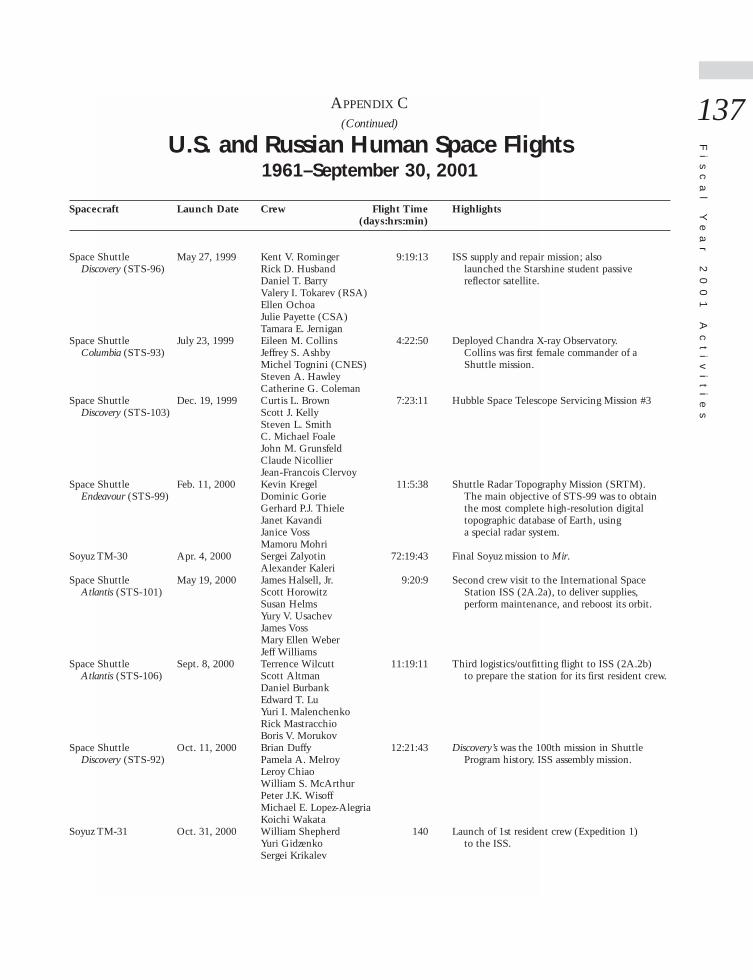
Fi
sc
al
Y
ea
r
20
01
A
ct
iv
it
ie
s
137APPENDIX C(Continued)
U.S. and Russian Human Space Flights1961–September 30, 2001
Spacecraft Launch Date Crew Flight Time Highlights(days:hrs:min)
Space Shuttle May 27, 1999 Kent V. Rominger 9:19:13 ISS supply and repair mission; alsoDiscovery (STS-96) Rick D. Husband launched the Starshine student passive
Daniel T. Barry reflector satellite.Valery I. Tokarev (RSA)Ellen OchoaJulie Payette (CSA)Tamara E. Jernigan
Space Shuttle July 23, 1999 Eileen M. Collins 4:22:50 Deployed Chandra X-ray Observatory.Columbia (STS-93) Jeffrey S. Ashby Collins was first female commander of a
Michel Tognini (CNES) Shuttle mission.Steven A. HawleyCatherine G. Coleman
Space Shuttle Dec. 19, 1999 Curtis L. Brown 7:23:11 Hubble Space Telescope Servicing Mission #3Discovery (STS-103) Scott J. Kelly
Steven L. SmithC. Michael FoaleJohn M. GrunsfeldClaude NicollierJean-Francois Clervoy
Space Shuttle Feb. 11, 2000 Kevin Kregel 11:5:38 Shuttle Radar Topography Mission (SRTM).Endeavour (STS-99) Dominic Gorie The main objective of STS-99 was to obtain
Gerhard P.J. Thiele the most complete high-resolution digitalJanet Kavandi topographic database of Earth, usingJanice Voss a special radar system.Mamoru Mohri
Soyuz TM-30 Apr. 4, 2000 Sergei Zalyotin 72:19:43 Final Soyuz mission to Mir.Alexander Kaleri
Space Shuttle May 19, 2000 James Halsell, Jr. 9:20:9 Second crew visit to the International SpaceAtlantis (STS-101) Scott Horowitz Station ISS (2A.2a), to deliver supplies,
Susan Helms perform maintenance, and reboost its orbit.Yury V. UsachevJames VossMary Ellen WeberJeff Williams
Space Shuttle Sept. 8, 2000 Terrence Wilcutt 11:19:11 Third logistics/outfitting flight to ISS (2A.2b)Atlantis (STS-106) Scott Altman to prepare the station for its first resident crew.
Daniel BurbankEdward T. LuYuri I. MalenchenkoRick MastracchioBoris V. Morukov
Space Shuttle Oct. 11, 2000 Brian Duffy 12:21:43 Discovery’s was the 100th mission in ShuttleDiscovery (STS-92) Pamela A. Melroy Program history. ISS assembly mission.
Leroy ChiaoWilliam S. McArthurPeter J.K. WisoffMichael E. Lopez-AlegriaKoichi Wakata
Soyuz TM-31 Oct. 31, 2000 William Shepherd 140 Launch of 1st resident crew (Expedition 1)Yuri Gidzenko to the ISS.Sergei Krikalev
2001 report 3/20/03 3:25 PM Page 137
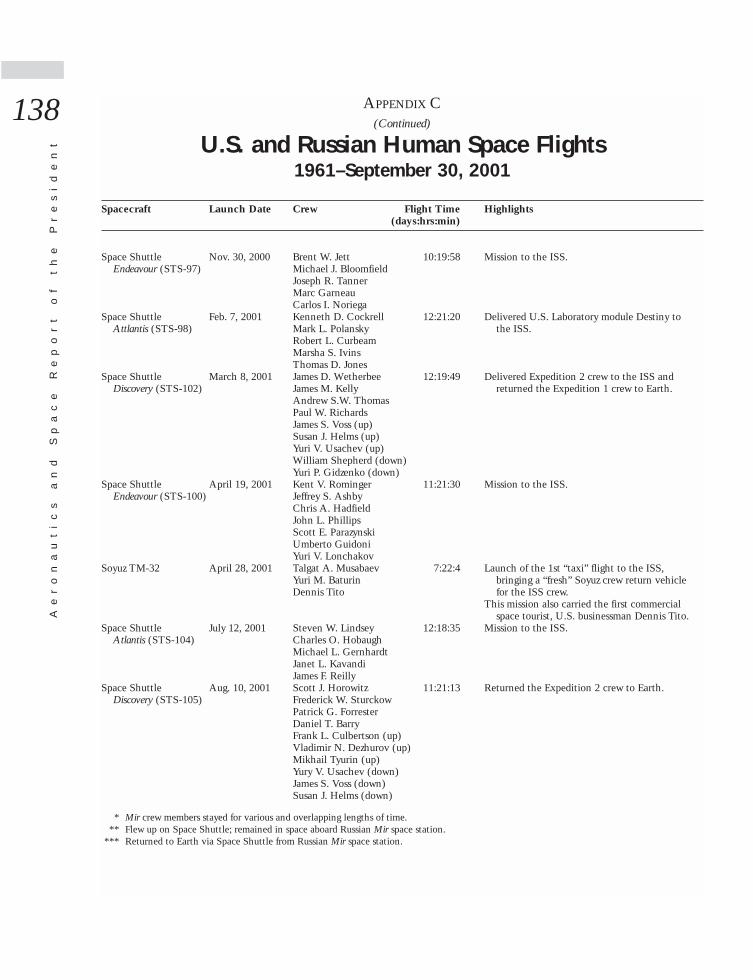
Ae
ro
na
ut
ic
s
an
d
Sp
ac
e
Re
po
rt
o
f
th
e
Pr
es
id
en
t
138 APPENDIX C(Continued)
U.S. and Russian Human Space Flights1961–September 30, 2001
Spacecraft Launch Date Crew Flight Time Highlights(days:hrs:min)
Space Shuttle Nov. 30, 2000 Brent W. Jett 10:19:58 Mission to the ISS.Endeavour (STS-97) Michael J. Bloomfield
Joseph R. TannerMarc GarneauCarlos I. Noriega
Space Shuttle Feb. 7, 2001 Kenneth D. Cockrell 12:21:20 Delivered U.S. Laboratory module Destiny toAttlantis (STS-98) Mark L. Polansky the ISS.
Robert L. CurbeamMarsha S. IvinsThomas D. Jones
Space Shuttle March 8, 2001 James D. Wetherbee 12:19:49 Delivered Expedition 2 crew to the ISS andDiscovery (STS-102) James M. Kelly returned the Expedition 1 crew to Earth.
Andrew S.W. ThomasPaul W. RichardsJames S. Voss (up)Susan J. Helms (up)Yuri V. Usachev (up)William Shepherd (down)Yuri P. Gidzenko (down)
Space Shuttle April 19, 2001 Kent V. Rominger 11:21:30 Mission to the ISS.Endeavour (STS-100) Jeffrey S. Ashby
Chris A. HadfieldJohn L. PhillipsScott E. ParazynskiUmberto GuidoniYuri V. Lonchakov
Soyuz TM-32 April 28, 2001 Talgat A. Musabaev 7:22:4 Launch of the 1st “taxi” flight to the ISS,Yuri M. Baturin bringing a “fresh” Soyuz crew return vehicleDennis Tito for the ISS crew.
This mission also carried the first commercialspace tourist, U.S. businessman Dennis Tito.
Space Shuttle July 12, 2001 Steven W. Lindsey 12:18:35 Mission to the ISS.Atlantis (STS-104) Charles O. Hobaugh
Michael L. GernhardtJanet L. KavandiJames F. Reilly
Space Shuttle Aug. 10, 2001 Scott J. Horowitz 11:21:13 Returned the Expedition 2 crew to Earth.Discovery (STS-105) Frederick W. Sturckow
Patrick G. ForresterDaniel T. BarryFrank L. Culbertson (up)Vladimir N. Dezhurov (up)Mikhail Tyurin (up)Yury V. Usachev (down)James S. Voss (down)Susan J. Helms (down)
* Mir crew members stayed for various and overlapping lengths of time.** Flew up on Space Shuttle; remained in space aboard Russian Mir space station.
*** Returned to Earth via Space Shuttle from Russian Mir space station.
2001 report 3/20/03 3:25 PM Page 138

Fi
sc
al
Y
ea
r
20
01
A
ct
iv
it
ie
s
139APPENDIX D(Continued)
U.S. Space Launch Vehicles
Max. Payload (kg)d
Max. Dia Geosynch. Sun-Stages: Thrust x Height 185-km Transfer Synch. First
Vehicle Engine/Motor Propellanta (kilonewtons)b, c (m) Orbit Orbit Orbite Launchf
Pegasus 6.71x15.5h 380 — 210 1990280e
1. Orion 50S Solid 484.9 1.28x8.882. Orion 50 Solid 118.2 1.28x2.663. Orion 38 Solid 31.9 0.97x1.34
Pegasus XL 6.71x16.93 460 — 335 1994g
1. Orion 50S-XL Solid 743.3 1.28x10.29 350e
2. Orion 50-XL Solid 201.5 1.28x3.583. Orion 38 Solid 31.9 0.97x1.34
Taurus 2.34x28.3 1,400 255 1,020 19940. Castor 120 Solid 1,687.7 2.34x11.86 1,080e
1. Orion 50S Solid 580.5 1.28x8.882. Orion 50 Solid 138.6 1.28x2.663. Orion 38 Solid 31.9 0.97x1.34
Delta II 2.44x29.70 5,089 1,842i 3,175 1990,(7920, 7925) 3,890e Delta-7925
1. RS-270/A LOX/RP-1 1,043.0 (SL) 3.05x38.1 [1960, Delta]Hercules GEM (9) Solid 487.6 (SL) 1.01x12.95
2. AJ10-118K N204/A-50 42.4 2.44x5.973. Star 48Bj Solid 66.4 1.25x2.04
Atlas E 3.05x28.1 820e — 910k 1968, Atlas F1,860e, k [1958,
1. Atlas: MA-3 LOX/RP-1 1,739.5 (SL) 3.05x21.3 Atlas LV-3A]
Atlas I 4.2x43.9 — 2,255 — 1990, I [1966,Atlas Centaur]
1. Atlas: MA-5 LOX/RP-1 1,952.0 (SL) 3.05x22.16 2. Centaur I: LOX/LH2 73.4/ 3.05x9.14
RL10A-3-3A (2) engine
Atlas II 4.2x47.5 6,580 2,810 4,300 1991, II [1966,5,510e Atlas Centaur]
1. Atlas: MA-5A LOX/RP-1 2,110.0 (SL) 3.05x24.92. Centaur II: LOX/LH2 73.4/engine 3.05x10.05
RL10A-3-3A (2)
Atlas IIA 4.2x47.5 6,828 3,062 4,750 1992, Atlas6,170e IIA [1966,
1. Atlas: MA-5A LOX/RP-1 2,110.0 (SL) 3.05x24.9 Atlas Centaur]2. Centaur II: LOX/LH2 92.53/engine 3.05x10.05
RL10A-4 (2)
Atlas IIAS 4.2x47.5 8,640 3,606 5,800 1993, IIAS7,300e [1966,
1. Atlas: MA-5A LOX/RP-1 2,110.0 (SL) 3.05x24.9 Atlas Centaur]Castor IVA (4)j Solid 433.6 (SL) 1.01x11.16
2. Centaur II: LOX/LH2 92.53/engine 3.05x10.05RL10A-4 (2)
Athena
1. Athena Solid 1450 2.36x19.8 520 245 1995
2001 report 3/20/03 3:25 PM Page 139
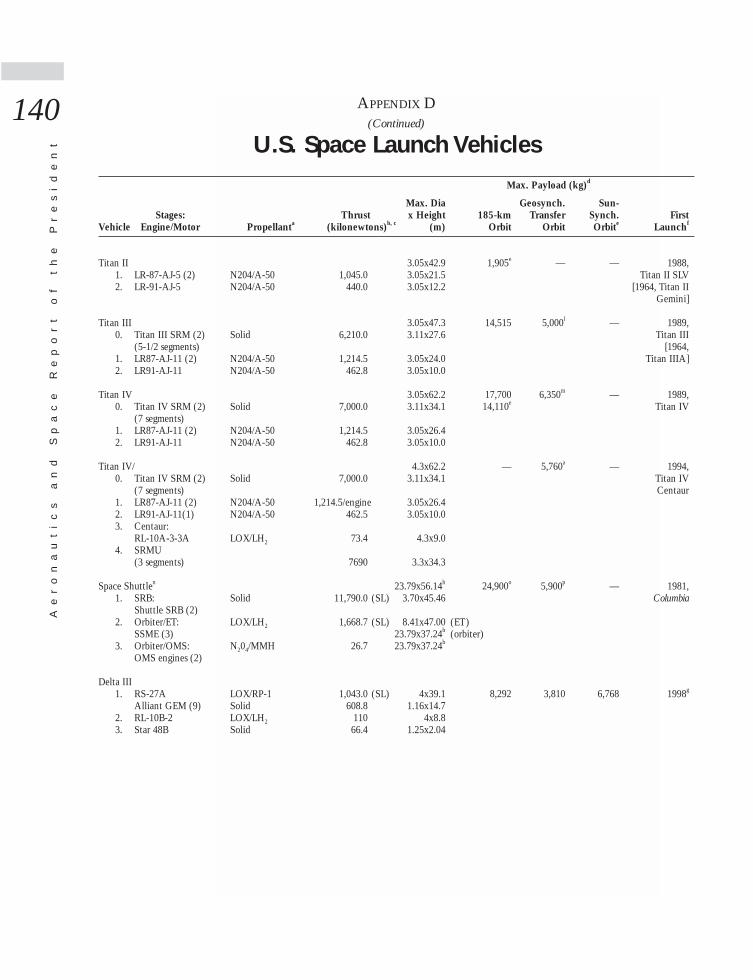
Ae
ro
na
ut
ic
s
an
d
Sp
ac
e
Re
po
rt
o
f
th
e
Pr
es
id
en
t
140 APPENDIX D(Continued)
U.S. Space Launch Vehicles
Max. Payload (kg)d
Max. Dia Geosynch. Sun-Stages: Thrust x Height 185-km Transfer Synch. First
Vehicle Engine/Motor Propellanta (kilonewtons)b, c (m) Orbit Orbit Orbite Launchf
Titan II 3.05x42.9 1,905e — — 1988,1. LR-87-AJ-5 (2) N204/A-50 1,045.0 3.05x21.5 Titan II SLV2. LR-91-AJ-5 N204/A-50 440.0 3.05x12.2 [1964, Titan II
Gemini]
Titan III 3.05x47.3 14,515 5,000l — 1989, 0. Titan III SRM (2) Solid 6,210.0 3.11x27.6 Titan III
(5-1/2 segments) [1964,1. LR87-AJ-11 (2) N204/A-50 1,214.5 3.05x24.0 Titan IIIA]2. LR91-AJ-11 N204/A-50 462.8 3.05x10.0
Titan IV 3.05x62.2 17,700 6,350m — 1989,0. Titan IV SRM (2) Solid 7,000.0 3.11x34.1 14,110e Titan IV
(7 segments)1. LR87-AJ-11 (2) N204/A-50 1,214.5 3.05x26.42. LR91-AJ-11 N204/A-50 462.8 3.05x10.0
Titan IV/ 4.3x62.2 — 5,760a — 1994, 0. Titan IV SRM (2) Solid 7,000.0 3.11x34.1 Titan IV
(7 segments) Centaur1. LR87-AJ-11 (2) N204/A-50 1,214.5/engine 3.05x26.42. LR91-AJ-11(1) N204/A-50 462.5 3.05x10.03. Centaur:
RL-10A-3-3A LOX/LH2 73.4 4.3x9.04. SRMU
(3 segments) 7690 3.3x34.3
Space Shuttlen 23.79x56.14h 24,900o 5,900p — 1981,1. SRB: Solid 11,790.0 (SL) 3.70x45.46 Columbia
Shuttle SRB (2)2. Orbiter/ET: LOX/LH2 1,668.7 (SL) 8.41x47.00 (ET)
SSME (3) 23.79x37.24h (orbiter)3. Orbiter/OMS: N204/MMH 26.7 23.79x37.24h
OMS engines (2)
Delta III1. RS-27A LOX/RP-1 1,043.0 (SL) 4x39.1 8,292 3,810 6,768 1998g
Alliant GEM (9) Solid 608.8 1.16x14.72. RL-10B-2 LOX/LH2 110 4x8.83. Star 48B Solid 66.4 1.25x2.04
2001 report 3/20/03 3:25 PM Page 140
Fi
sc
al
Y
ea
r
20
01
A
ct
iv
it
ie
s
141APPENDIX D(Continued)
U.S. Space Launch Vehicles
NOTES:
a. Propellant abbreviations used are as follows: i. Applies to Delta II-7925 version only.A-50 = Aerozine 50 (50% Monomethyl Hydrazine,
50% Unsymmetrical Dimethyl Hydrazine) j. Two Castor IVA motors ignited at liftoff. Two Castor IVARP-1 = Rocket Propellant 1 (kerosene) motors ignited at approximately 57 seconds into flight. Solid = Solid Propellant (any type)LH2 = Liquid Hydrogen k. With TE-M-364-4 upper stage.LOX = Liquid OxygenMMH = Monomethyl Hydrazine l. With Transfer Orbit Stage.N204 = Nitrogen Tetroxide
m. With appropriate upper stageb. Thrust at vacuum except where indicated at sea level (SL).
n. Space Shuttle Solid Rocket Boosters fire in parallel with thec. Thrust per engine. Multiply by number of engines for Space Shuttle Main Engines (SSME), which are mounted on
thrust per stage. the aft end of the Shuttle Orbiter Vehicle and burn fuel, andoxidizer from the External Tank. The boosters stage first, with
d. Inclination of 28.5˚ except where indicated. SSME’s continuing to fire. The External Tank stages next, justbefore the orbiter attains orbit. The Orbiter Maneuvering
e. Polar launch from Vandenberg AFB, CA. Subsystem is then used to maneuver or change the orbit of theOrbiter Vehicle.
f. First successful orbital launch [ditto of initial version].o. 204-km circular orbit.
g. First launch was a failurep. With Inertial Upper Stage or Transfer Orbit Stage.
h. Diameter dimension represents vehicle wing span.
NOTE: Data should not be used for detailed NASA mission planning without concurrence of the Director of Space Transportation System Support Programs.
2001 report 3/20/03 3:25 PM Page 141
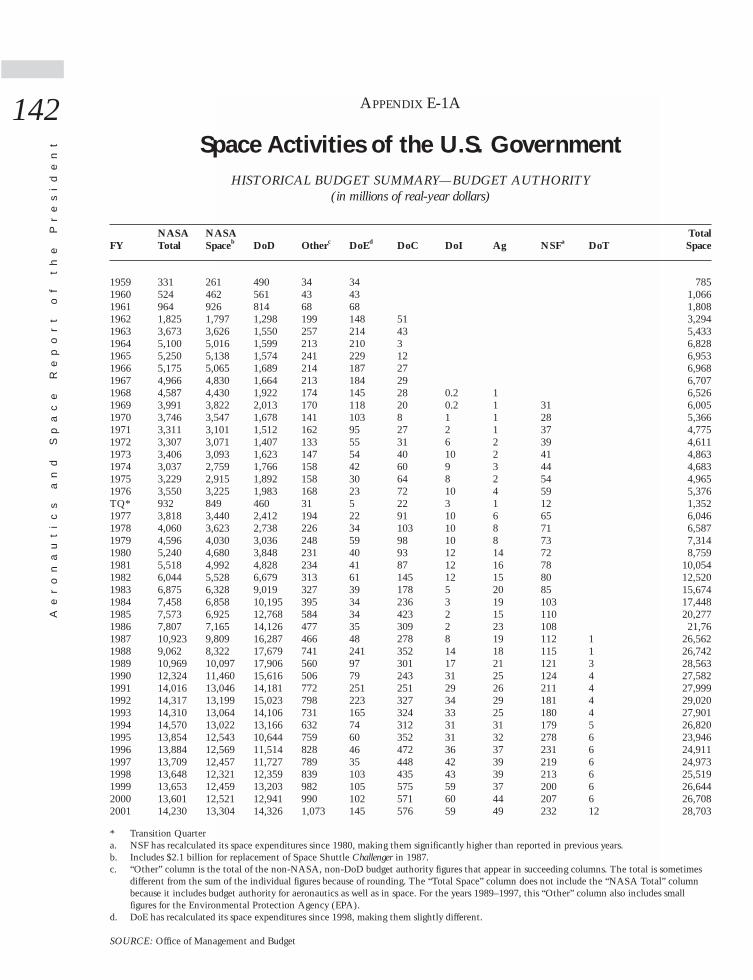
Ae
ro
na
ut
ic
s
an
d
Sp
ac
e
Re
po
rt
o
f
th
e
Pr
es
id
en
t
142 APPENDIX E-1A(Continued)
Space Activities of the U.S. GovernmentHISTORICAL BUDGET SUMMARY—BUDGET AUTHORITY
(in millions of real-year dollars)
NASA NASA TotalFY Total Spaceb DoD Otherc DoEd DoC DoI Ag NSFa DoT Space
1959 331 261 490 34 34 7851960 524 462 561 43 43 1,0661961 964 926 814 68 68 1,8081962 1,825 1,797 1,298 199 148 51 3,2941963 3,673 3,626 1,550 257 214 43 5,4331964 5,100 5,016 1,599 213 210 3 6,8281965 5,250 5,138 1,574 241 229 12 6,9531966 5,175 5,065 1,689 214 187 27 6,9681967 4,966 4,830 1,664 213 184 29 6,7071968 4,587 4,430 1,922 174 145 28 0.2 1 6,5261969 3,991 3,822 2,013 170 118 20 0.2 1 31 6,0051970 3,746 3,547 1,678 141 103 8 1 1 28 5,3661971 3,311 3,101 1,512 162 95 27 2 1 37 4,7751972 3,307 3,071 1,407 133 55 31 6 2 39 4,6111973 3,406 3,093 1,623 147 54 40 10 2 41 4,8631974 3,037 2,759 1,766 158 42 60 9 3 44 4,6831975 3,229 2,915 1,892 158 30 64 8 2 54 4,9651976 3,550 3,225 1,983 168 23 72 10 4 59 5,376TQ* 932 849 460 31 5 22 3 1 12 1,3521977 3,818 3,440 2,412 194 22 91 10 6 65 6,0461978 4,060 3,623 2,738 226 34 103 10 8 71 6,5871979 4,596 4,030 3,036 248 59 98 10 8 73 7,3141980 5,240 4,680 3,848 231 40 93 12 14 72 8,7591981 5,518 4,992 4,828 234 41 87 12 16 78 10,0541982 6,044 5,528 6,679 313 61 145 12 15 80 12,5201983 6,875 6,328 9,019 327 39 178 5 20 85 15,6741984 7,458 6,858 10,195 395 34 236 3 19 103 17,4481985 7,573 6,925 12,768 584 34 423 2 15 110 20,2771986 7,807 7,165 14,126 477 35 309 2 23 108 21,761987 10,923 9,809 16,287 466 48 278 8 19 112 1 26,5621988 9,062 8,322 17,679 741 241 352 14 18 115 1 26,7421989 10,969 10,097 17,906 560 97 301 17 21 121 3 28,5631990 12,324 11,460 15,616 506 79 243 31 25 124 4 27,5821991 14,016 13,046 14,181 772 251 251 29 26 211 4 27,9991992 14,317 13,199 15,023 798 223 327 34 29 181 4 29,0201993 14,310 13,064 14,106 731 165 324 33 25 180 4 27,9011994 14,570 13,022 13,166 632 74 312 31 31 179 5 26,8201995 13,854 12,543 10,644 759 60 352 31 32 278 6 23,9461996 13,884 12,569 11,514 828 46 472 36 37 231 6 24,9111997 13,709 12,457 11,727 789 35 448 42 39 219 6 24,9731998 13,648 12,321 12,359 839 103 435 43 39 213 6 25,5191999 13,653 12,459 13,203 982 105 575 59 37 200 6 26,6442000 13,601 12,521 12,941 990 102 571 60 44 207 6 26,7082001 14,230 13,304 14,326 1,073 145 576 59 49 232 12 28,703
* Transition Quartera. NSF has recalculated its space expenditures since 1980, making them significantly higher than reported in previous years.b. Includes $2.1 billion for replacement of Space Shuttle Challenger in 1987.c. “Other” column is the total of the non-NASA, non-DoD budget authority figures that appear in succeeding columns. The total is sometimes
different from the sum of the individual figures because of rounding. The “Total Space” column does not include the “NASA Total” columnbecause it includes budget authority for aeronautics as well as in space. For the years 1989–1997, this “Other” column also includes smallfigures for the Environmental Protection Agency (EPA).
d. DoE has recalculated its space expenditures since 1998, making them slightly different.
SOURCE: Office of Management and Budget
2001 report 3/20/03 3:25 PM Page 142
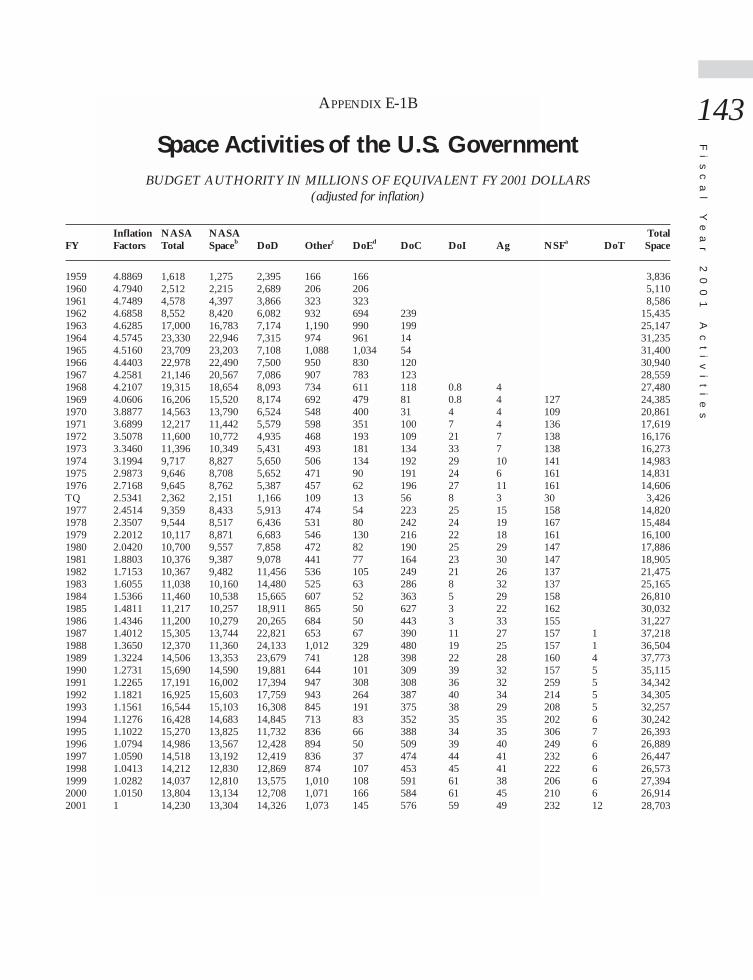
Fi
sc
al
Y
ea
r
20
01
A
ct
iv
it
ie
s
143APPENDIX E-1B(Continued)
Space Activities of the U.S. GovernmentBUDGET AUTHORITY IN MILLIONS OF EQUIVALENT FY 2001 DOLLARS
(adjusted for inflation)
Inflation NASA NASA TotalFY Factors Total Spaceb DoD Otherc DoEd DoC DoI Ag NSFa DoT Space
1959 4.8869 1,618 1,275 2,395 166 166 3,8361960 4.7940 2,512 2,215 2,689 206 206 5,1101961 4.7489 4,578 4,397 3,866 323 323 8,5861962 4.6858 8,552 8,420 6,082 932 694 239 15,4351963 4.6285 17,000 16,783 7,174 1,190 990 199 25,1471964 4.5745 23,330 22,946 7,315 974 961 14 31,2351965 4.5160 23,709 23,203 7,108 1,088 1,034 54 31,4001966 4.4403 22,978 22,490 7,500 950 830 120 30,9401967 4.2581 21,146 20,567 7,086 907 783 123 28,5591968 4.2107 19,315 18,654 8,093 734 611 118 0.8 4 27,4801969 4.0606 16,206 15,520 8,174 692 479 81 0.8 4 127 24,3851970 3.8877 14,563 13,790 6,524 548 400 31 4 4 109 20,8611971 3.6899 12,217 11,442 5,579 598 351 100 7 4 136 17,6191972 3.5078 11,600 10,772 4,935 468 193 109 21 7 138 16,1761973 3.3460 11,396 10,349 5,431 493 181 134 33 7 138 16,2731974 3.1994 9,717 8,827 5,650 506 134 192 29 10 141 14,9831975 2.9873 9,646 8,708 5,652 471 90 191 24 6 161 14,8311976 2.7168 9,645 8,762 5,387 457 62 196 27 11 161 14,606TQ 2.5341 2,362 2,151 1,166 109 13 56 8 3 30 3,4261977 2.4514 9,359 8,433 5,913 474 54 223 25 15 158 14,8201978 2.3507 9,544 8,517 6,436 531 80 242 24 19 167 15,4841979 2.2012 10,117 8,871 6,683 546 130 216 22 18 161 16,1001980 2.0420 10,700 9,557 7,858 472 82 190 25 29 147 17,8861981 1.8803 10,376 9,387 9,078 441 77 164 23 30 147 18,9051982 1.7153 10,367 9,482 11,456 536 105 249 21 26 137 21,4751983 1.6055 11,038 10,160 14,480 525 63 286 8 32 137 25,1651984 1.5366 11,460 10,538 15,665 607 52 363 5 29 158 26,8101985 1.4811 11,217 10,257 18,911 865 50 627 3 22 162 30,0321986 1.4346 11,200 10,279 20,265 684 50 443 3 33 155 31,2271987 1.4012 15,305 13,744 22,821 653 67 390 11 27 157 1 37,2181988 1.3650 12,370 11,360 24,133 1,012 329 480 19 25 157 1 36,5041989 1.3224 14,506 13,353 23,679 741 128 398 22 28 160 4 37,7731990 1.2731 15,690 14,590 19,881 644 101 309 39 32 157 5 35,1151991 1.2265 17,191 16,002 17,394 947 308 308 36 32 259 5 34,3421992 1.1821 16,925 15,603 17,759 943 264 387 40 34 214 5 34,3051993 1.1561 16,544 15,103 16,308 845 191 375 38 29 208 5 32,2571994 1.1276 16,428 14,683 14,845 713 83 352 35 35 202 6 30,2421995 1.1022 15,270 13,825 11,732 836 66 388 34 35 306 7 26,3931996 1.0794 14,986 13,567 12,428 894 50 509 39 40 249 6 26,8891997 1.0590 14,518 13,192 12,419 836 37 474 44 41 232 6 26,4471998 1.0413 14,212 12,830 12,869 874 107 453 45 41 222 6 26,5731999 1.0282 14,037 12,810 13,575 1,010 108 591 61 38 206 6 27,3942000 1.0150 13,804 13,134 12,708 1,071 166 584 61 45 210 6 26,9142001 1 14,230 13,304 14,326 1,073 145 576 59 49 232 12 28,703
2001 report 3/20/03 3:25 PM Page 143
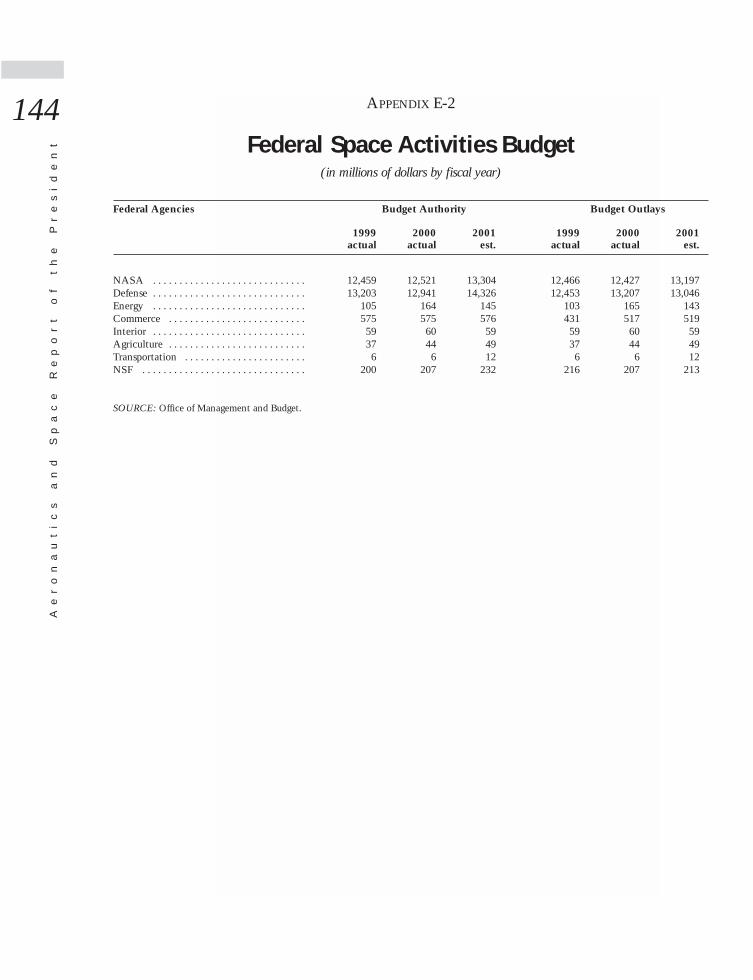
Ae
ro
na
ut
ic
s
an
d
Sp
ac
e
Re
po
rt
o
f
th
e
Pr
es
id
en
t
144 APPENDIX E-2(Continued)
Federal Space Activities Budget(in millions of dollars by fiscal year)
Federal Agencies Budget Authority Budget Outlays
1999 2000 2001 1999 2000 2001actual actual est. actual actual est.
NASA . . . . . . . . . . . . . . . . . . . . . . . . . . . . . 12,459 12,521 13,304 12,466 12,427 13,197Defense . . . . . . . . . . . . . . . . . . . . . . . . . . . . . 13,203 12,941 14,326 12,453 13,207 13,046Energy . . . . . . . . . . . . . . . . . . . . . . . . . . . . . 105 164 145 103 165 143Commerce . . . . . . . . . . . . . . . . . . . . . . . . . . 575 575 576 431 517 519Interior . . . . . . . . . . . . . . . . . . . . . . . . . . . . . 59 60 59 59 60 59Agriculture . . . . . . . . . . . . . . . . . . . . . . . . . . 37 44 49 37 44 49Transportation . . . . . . . . . . . . . . . . . . . . . . . 6 6 12 6 6 12NSF . . . . . . . . . . . . . . . . . . . . . . . . . . . . . . . 200 207 232 216 207 213
SOURCE: Office of Management and Budget.
2001 report 3/20/03 3:25 PM Page 144
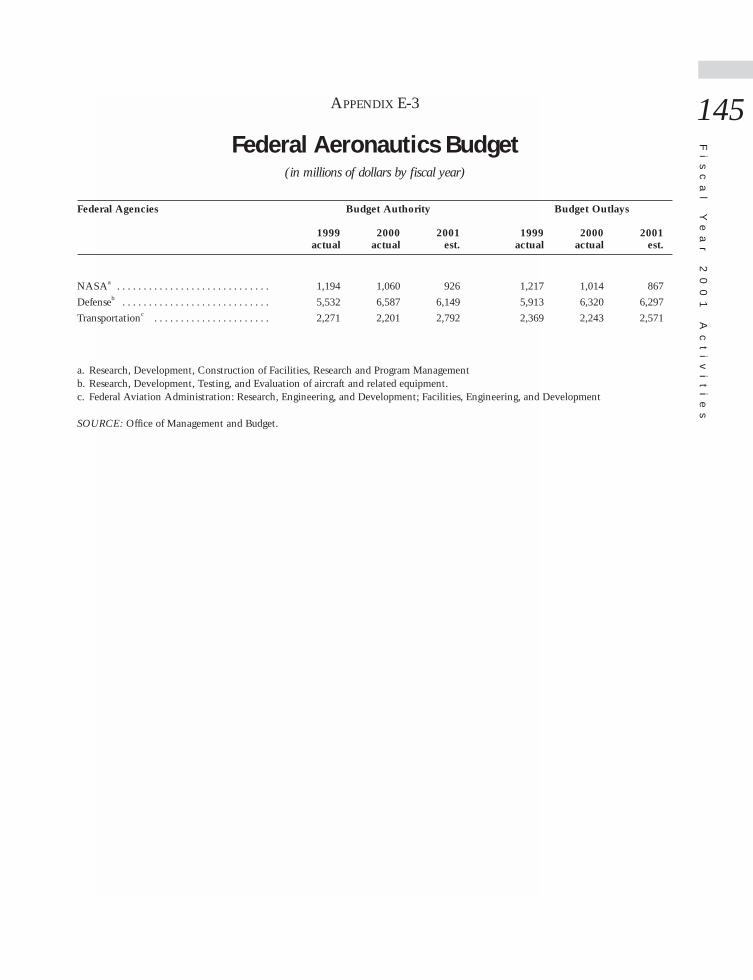
Fi
sc
al
Y
ea
r
20
01
A
ct
iv
it
ie
s
145APPENDIX E-3(Continued)
Federal Aeronautics Budget(in millions of dollars by fiscal year)
Federal Agencies Budget Authority Budget Outlays
1999 2000 2001 1999 2000 2001actual actual est. actual actual est.
NASAa . . . . . . . . . . . . . . . . . . . . . . . . . . . . . 1,194 1,060 926 1,217 1,014 867
Defenseb . . . . . . . . . . . . . . . . . . . . . . . . . . . . 5,532 6,587 6,149 5,913 6,320 6,297
Transportationc . . . . . . . . . . . . . . . . . . . . . . 2,271 2,201 2,792 2,369 2,243 2,571
a. Research, Development, Construction of Facilities, Research and Program Managementb. Research, Development, Testing, and Evaluation of aircraft and related equipment.c. Federal Aviation Administration: Research, Engineering, and Development; Facilities, Engineering, and Development
SOURCE: Office of Management and Budget.
2001 report 3/20/03 3:25 PM Page 145

2001 report 3/20/03 3:25 PM Page 146
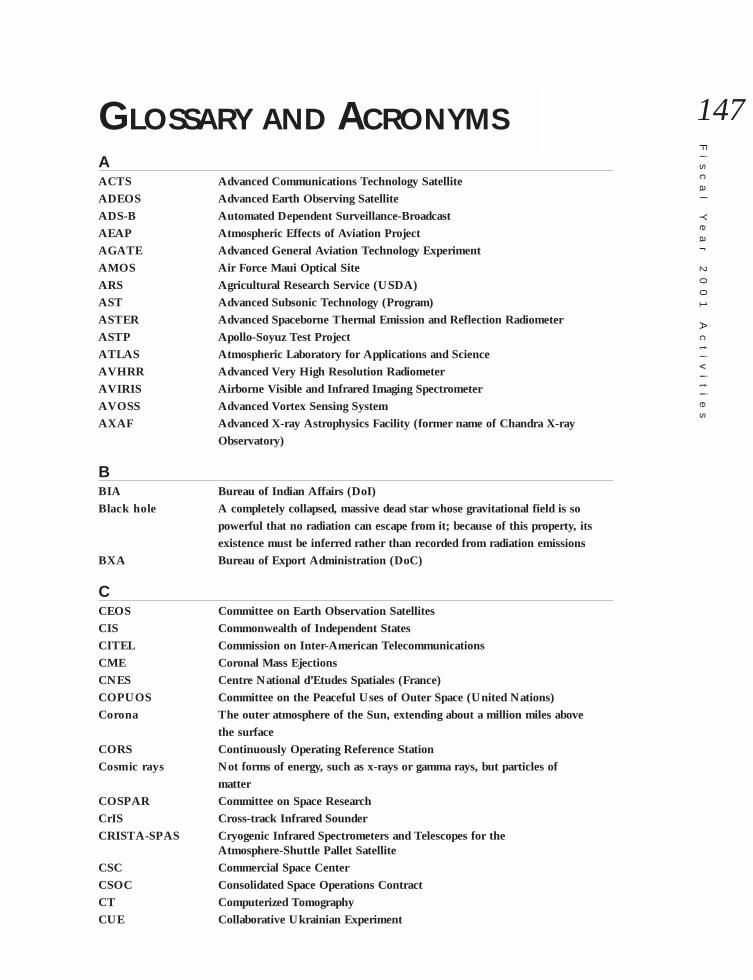
Fi
sc
al
Y
ea
r
20
01
A
ct
iv
it
ie
s
147
AACTS Advanced Communications Technology SatelliteADEOS Advanced Earth Observing SatelliteADS-B Automated Dependent Surveillance-BroadcastAEAP Atmospheric Effects of Aviation ProjectAGATE Advanced General Aviation Technology ExperimentAMOS Air Force Maui Optical SiteARS Agricultural Research Service (USDA)AST Advanced Subsonic Technology (Program)ASTER Advanced Spaceborne Thermal Emission and Reflection RadiometerASTP Apollo-Soyuz Test ProjectATLAS Atmospheric Laboratory for Applications and ScienceAVHRR Advanced Very High Resolution RadiometerAVIRIS Airborne Visible and Infrared Imaging SpectrometerAVOSS Advanced Vortex Sensing SystemAXAF Advanced X-ray Astrophysics Facility (former name of Chandra X-ray
Observatory)
BBIA Bureau of Indian Affairs (DoI)Black hole A completely collapsed, massive dead star whose gravitational field is so
powerful that no radiation can escape from it; because of this property, its existence must be inferred rather than recorded from radiation emissions
BXA Bureau of Export Administration (DoC)
CCEOS Committee on Earth Observation SatellitesCIS Commonwealth of Independent StatesCITEL Commission on Inter-American TelecommunicationsCME Coronal Mass EjectionsCNES Centre National d’Etudes Spatiales (France)COPUOS Committee on the Peaceful Uses of Outer Space (United Nations)Corona The outer atmosphere of the Sun, extending about a million miles above
the surfaceCORS Continuously Operating Reference StationCosmic rays Not forms of energy, such as x-rays or gamma rays, but particles of
matterCOSPAR Committee on Space ResearchCrIS Cross-track Infrared SounderCRISTA-SPAS Cryogenic Infrared Spectrometers and Telescopes for the
Atmosphere-Shuttle Pallet SatelliteCSC Commercial Space CenterCSOC Consolidated Space Operations ContractCT Computerized TomographyCUE Collaborative Ukrainian Experiment
GLOSSARY AND ACRONYMS
2001 report 3/20/03 3:25 PM Page 147
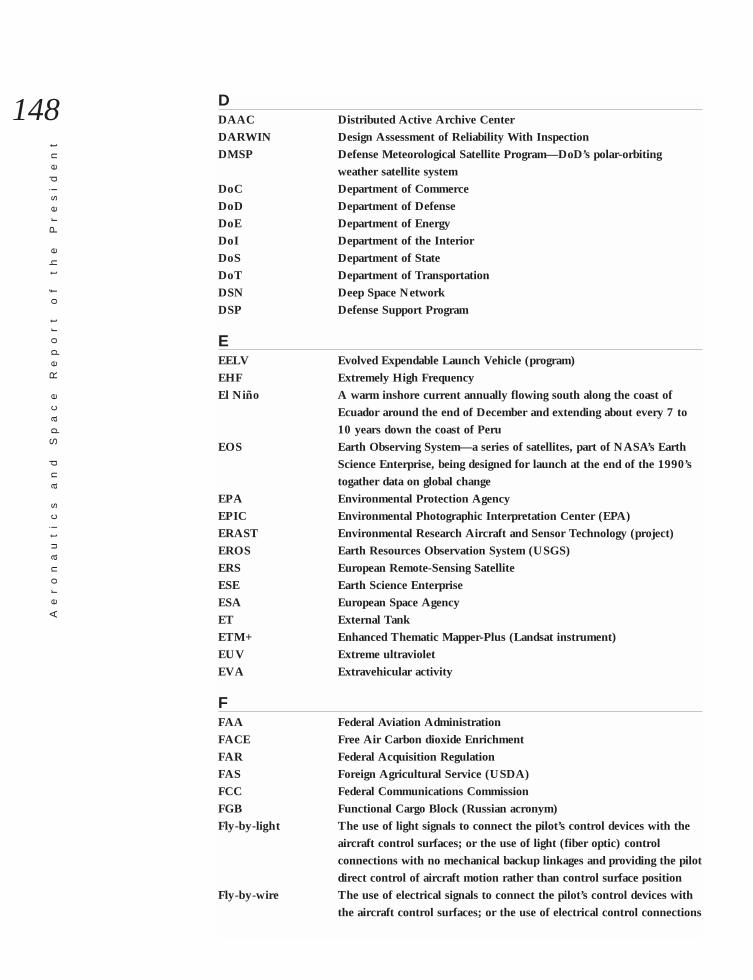
Ae
ro
na
ut
ic
s
an
d
Sp
ac
e
Re
po
rt
o
f
th
e
Pr
es
id
en
t
148 DDAAC Distributed Active Archive CenterDARWIN Design Assessment of Reliability With InspectionDMSP Defense Meteorological Satellite Program—DoD’s polar-orbiting
weather satellite systemDoC Department of CommerceDoD Department of DefenseDoE Department of EnergyDoI Department of the InteriorDoS Department of StateDoT Department of TransportationDSN Deep Space NetworkDSP Defense Support Program
EEELV Evolved Expendable Launch Vehicle (program)EHF Extremely High FrequencyEl Niño A warm inshore current annually flowing south along the coast of
Ecuador around the end of December and extending about every 7 to 10 years down the coast of Peru
EOS Earth Observing System—a series of satellites, part of NASA’s Earth Science Enterprise, being designed for launch at the end of the 1990’s togather data on global change
EPA Environmental Protection Agency EPIC Environmental Photographic Interpretation Center (EPA)ERAST Environmental Research Aircraft and Sensor Technology (project)EROS Earth Resources Observation System (USGS)ERS European Remote-Sensing SatelliteESE Earth Science EnterpriseESA European Space AgencyET External TankETM+ Enhanced Thematic Mapper-Plus (Landsat instrument)EUV Extreme ultravioletEVA Extravehicular activity
FFAA Federal Aviation AdministrationFACE Free Air Carbon dioxide EnrichmentFAR Federal Acquisition RegulationFAS Foreign Agricultural Service (USDA)FCC Federal Communications CommissionFGB Functional Cargo Block (Russian acronym)Fly-by-light The use of light signals to connect the pilot’s control devices with the
aircraft control surfaces; or the use of light (fiber optic) control connections with no mechanical backup linkages and providing the pilotdirect control of aircraft motion rather than control surface position
Fly-by-wire The use of electrical signals to connect the pilot’s control devices with the aircraft control surfaces; or the use of electrical control connections
2001 report 3/20/03 3:25 PM Page 148
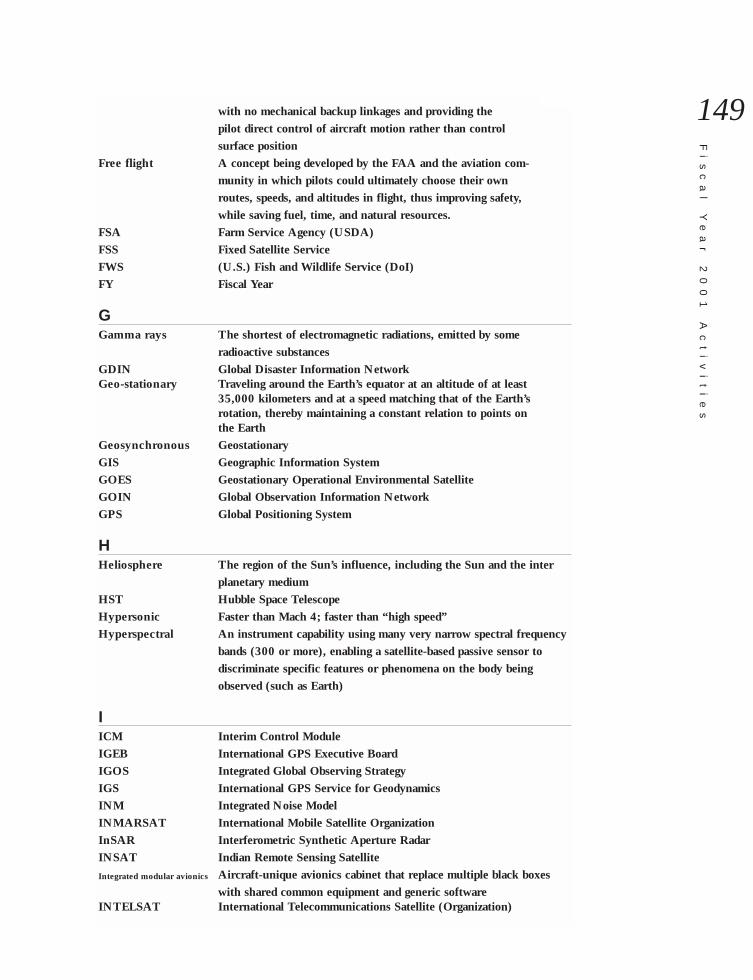
Fi
sc
al
Y
ea
r
20
01
A
ct
iv
it
ie
s
149with no mechanical backup linkages and providing the pilot direct control of aircraft motion rather than control surface position
Free flight A concept being developed by the FAA and the aviation com-munity in which pilots could ultimately choose their own routes, speeds, and altitudes in flight, thus improving safety, while saving fuel, time, and natural resources.
FSA Farm Service Agency (USDA)FSS Fixed Satellite ServiceFWS (U.S.) Fish and Wildlife Service (DoI)FY Fiscal Year
GGamma rays The shortest of electromagnetic radiations, emitted by some
radioactive substancesGDIN Global Disaster Information NetworkGeo-stationary Traveling around the Earth’s equator at an altitude of at least
35,000 kilometers and at a speed matching that of the Earth’s rotation, thereby maintaining a constant relation to points on the Earth
Geosynchronous GeostationaryGIS Geographic Information SystemGOES Geostationary Operational Environmental SatelliteGOIN Global Observation Information NetworkGPS Global Positioning System
HHeliosphere The region of the Sun’s influence, including the Sun and the inter
planetary mediumHST Hubble Space TelescopeHypersonic Faster than Mach 4; faster than “high speed”Hyperspectral An instrument capability using many very narrow spectral frequency
bands (300 or more), enabling a satellite-based passive sensor to discriminate specific features or phenomena on the body being observed (such as Earth)
IICM Interim Control ModuleIGEB International GPS Executive BoardIGOS Integrated Global Observing StrategyIGS International GPS Service for GeodynamicsINM Integrated Noise ModelINMARSAT International Mobile Satellite OrganizationInSAR Interferometric Synthetic Aperture RadarINSAT Indian Remote Sensing Satellite
Integrated modular avionics Aircraft-unique avionics cabinet that replace multiple black boxes with shared common equipment and generic software
INTELSAT International Telecommunications Satellite (Organization)
2001 report 3/20/03 3:25 PM Page 149
Ae
ro
na
ut
ic
s
an
d
Sp
ac
e
Re
po
rt
o
f
th
e
Pr
es
id
en
t
150 Interferometry The production and measurement of interference from two or more coherent wave trains emitted from the same source
Internet An international computer network that began about 1970 as the NSF Net; very slowly it became a collection of more than 40,000 independently managed computer networks worldwide that have adopted common protocols to permit the exchange of electronic information
Ionosphere That region of Earth’s atmosphere so named because of the presence of ionized atoms in layers that reflect radio waves and short-wave transmissions
IPO Integrated Program OfficeISO International Organization for StandardizationISS International Space StationITA International Trade Administration (DoC)ITU International Telecommunications Union
JJEM Japanese Experimental ModuleJPL Jet Propulsion Laboratory (NASA)
KK-band Radio frequencies in the 20-gigahertz rangeKa-band Radio frequencies in the 30-gigahertz rangeKSC Kennedy Space CenterKu-band Radio frequencies in the 11–12-gigahertz range
LLandsat Land [remote sensing] Satellite—a series of satellites designed to
collect information about Earth’s natural resourcesLaser Light amplified by simulated emission of radiation—a device that
produces an intense beam of light that may be strong enough to vaporize the hardest and most heat-resistant materials, first constructed in 1960
LDEF Long-Duration Exposure FacilityLEO Low-Earth Orbit—100 to 350 nautical miles above EarthLH2 Liquid HydrogenLIDAR Light Intersection Direction and RangingLOX Liquid OxygenLVIS Laser Vegetation Imaging Sensor
MMach A relative number named after Austrian physicist Ernst Mach
(1838–1916) and indicating speed with respect to that of sound ina given medium; in dry air at 32 degrees Fahrenheit and at sea level, for example, Mach 1=approximately 741 miles per hour (1,192 kilometers per hour)
Magnetosphere The region of Earth’s atmosphere in which ionized gas plays animportant role in the atmospheric dynamics and where, consequently, the geomagnetic field also exerts an important influence;other magnetic planets, such as Jupiter, have magnetospheres that are similar in many respects to Earth’s
2001 report 3/20/03 3:25 PM Page 150
Fi
sc
al
Y
ea
r
20
01
A
ct
iv
it
ie
s
151MCC-H Mission Control Center–HoustonMCC-M Mission Control Center–MoscowMCO Mars Climate OrbiterMHz MegahertzMilSatCom Military Satellite CommunicationsMISR Multiangle Imaging SpectroradiometerMMH Monomethyl HydrazineMMS Minerals Management Service (DoI)MODIS Moderate Resolution Imaging SpectrometerMPL Mars Polar LanderMPLM Multi-Purpose Logistics Module
NNAPP National Aerial Photography ProgramNAS National Airspace System (FAA)NASA National Aeronautics and Space AdministrationNASDA National Space Development Agency (of Japan)NASM National Air and Space MuseumNASS National Agricultural Statistics Service (USDA)NATO North Atlantic Treaty OrganizationNAWQA National Water Quality AssessmentNCAP National Civil Applications Program (USGS)NDGPS Nationwide Differential GPSNDOP National Digital Orthoquad ProgramNESDIS National Environmental Satellite, Data and Information Service
(NOAA)Neutron Any of a class of extremely dense, compact stars thought to be com-star posed primarily of neutrons; see pulsarNEXRAD Next Generation Weather RadarNGS National Geodetic SurveyNGSO Nongeostationary satelliteNIST National Institute of Standards and Technology (DoC)NOAA National Oceanic and Atmospheric Administration (DoC); also the
designation of that administration’s Sun-synchronous satellites in polar orbit
Nominal Functioning as designedNOx Oxides of nitrogenNPOESS National Polar-orbiting Operational Environmental Satellite SystemNPP NPOESS Preparatory ProjectNPS National Park Service (DoI)NRA NASA Research AnnouncementNRCS National Resources Conservation Service (USDA)NRO National Reconnaissance Office (DoD)NSC National Security CouncilNSF National Science FoundationNTIA National Telecommunications and Information Administration
(DoC)—the Federal Government’s radio spectrum manager, which coordinates the use of LEO satellite networks, such as those for Landsat, Navstar GPS, the Space Shuttle, and the Television and Infrared Operational Satellite (TIROS), with other countries of the world
2001 report 3/20/03 3:25 PM Page 151
Ae
ro
na
ut
ic
s
an
d
Sp
ac
e
Re
po
rt
o
f
th
e
Pr
es
id
en
t
152 NWRC Northwest Watershed Research Center (ARS)
OODERACS Orbital Debris Radar Calibration SpheresOLMSA Office of Life and Microgravity Sciences and Applications (NASA)OMPS Ozone Mapping and Profiler SuiteOrder of An amount equal to 10 times a given value; thus if somemagnitude quantity was 10 times as great as another quantity, it would
be an order of magnitude greater; if 100 times as great, it would be larger by two orders of magnitude
ORFEUS- Orbiting and Retrievable Far and Extreme Ultraviolet Spectrograph-SPAS Shuttle Pallet SatelliteOSMRE Office of Surface Mining Reclamation and Enforcement (DoI)OSS Office of Space Science (NASA)OSTP Office of Science and Technology Policy
PPAMS-STU Passive Aerodynamically Stabilized Magnetically Damped Satellite-
Satellite Test UnitPARCS Primary Atomic Reference Clock in SpacePathfinder A program that focuses on the processing, reprocessing, maintaining,
archiving, and distributing existing Earth science data sets to make them more useful to researchers; NASA, NOAA, and USGS are involved in specific Pathfinder efforts
PCB Polychlorinated biphenylPEACESAT Pan-Pacific Education and Communications Experiment by SatellitePECAD Production Estimates and Crop Assessment Division (FAS)Photo- The science or art of obtaining reliable measurements by means of grammetry photographyPMA Pressurized Mating AdapterPOES Polar-orbiting Operational Environmental Satellite (program)PPS Precise Positioning ServicePRA Probabilistic Risk AssessmentPulsar A pulsating radio star, which is thought to be a rapidly spinning
neutron star; the latter is formed when the core of a violently exploding star, called a supernova, collapses inward and becomes compressed together; pulsars emit extremely regular pulses of radio waves
QQuasar A class of rare cosmic objects of extreme luminosity and strong radio
emission; many investigators attribute their high-energy generation to gas spiraling at high velocity into a massive black hole
QuikSCAT Quick Scatterometer
RRADARSAT Canadian Radar SatelliteRamjet A jet engine with no mechanical compressor, consisting of specially
shaped tubes or ducts open at both ends, along with the air necessary
2001 report 3/20/03 3:25 PM Page 152
Fi
sc
al
Y
ea
r
20
01
A
ct
iv
it
ie
s
153for combustion being shoved into the duct and compressed by the forward motion of the engine
RFID Radio Frequency IdentificationRLV Reusable Launch VehicleRPA Remotely Piloted AircraftRSA Russian Space AgencyRSML Remote Sensing and Modeling Laboratory (ARS)
SSAMRSS Shafter Airborne Multispectral Remote Sensing SystemSAO Smithsonian Astrophysical ObservatorySAR Synthetic Aperture RadarSBIRS Space Based Infrared SystemSBS Satellite Business SystemsScramjet Supersonic-combustion ramjetSeaWiFS Sea-viewing Wide Field-of-view SensorSLS Spacelab Life SciencesSMA Safety and Mission AssuranceSNOE Student Nitric Oxide ExperimentSOFIA Stratospheric Observatory for Infrared AstronomySOHO Solar and Heliospheric ObservatorySolar wind A stream of particles accelerated by the heat of the solar corona (outer
region of the Sun) to velocities great enough to permit them to escape from the Sun’s gravitational field
SPACEHAB Commercial module for housing Shuttle experimentsSPARTAN Shuttle Pointed Autonomous Research Tool for AstronomySPOT Satellite Pour l’Observation de la Terre (French satellite for the
observation of Earth)SRB Solid Rocket BoosterSRM Solid Rocket MotorSRMU Solid Rocket Motor UpgradeSSBUV Shuttle Solar Backscatter UltravioletSSCC Space Station Control CenterSSCE Solid Surface Combustion ExperimentSSME Space Shuttle Main EngineSSM/I Special Sensor Microwave ImagerSSRMS Space Station Remote Manipulator SystemSSTF Space Station Training FacilitySSTI Small Satellite Technology InitiativeSTART Strategic Arms Reduction TreatySTS Space Transportation SystemSWAS Submillimeter Wave Astronomy Satellite
TTA Technology Administration (DoC)TATP Triacetone triperoxide (terrorist explosive) TDRS Tracking and Data Relay SatelliteTERRIERS Tomographic Experiment using Radiative Recombinative Ionospheric
2001 report 3/20/03 3:25 PM Page 153
Ae
ro
na
ut
ic
s
an
d
Sp
ac
e
Re
po
rt
o
f
th
e
Pr
es
id
en
t
154 EUV and Radio SourcesTOMS Total Ozone Mapping SpectrometerTOPEX Ocean Topography ExperimentTRACE Transition Region and Coronal ExplorerTRACON Terminal Radar Approach Control (system)TRMM Tropical Rainfall Measuring Mission
UUARS Upper Atmosphere Research SatelliteUHF Ultrahigh Frequency—any frequency between 300 and 3,000 megacy-
cles per secondUNISPACE United Nations Conference on the Exploration and Peaceful Uses of
Outer SpaceURET User Request Evaluation ToolU.S. United StatesUSAID U.S. Agency for International DevelopmentUSDA U.S. Department of AgricultureUSGS U.S. Geological Survey (DoI)USML U.S. Microgravity LaboratoryUSMP U.S. Microgravity PayloadUSWCL U.S. Water Conservation Laboratory (ARS)
VVCL Vegetation Canopy LidarVHF Very High Frequency—any radio frequency between 30 and 300
megacycles per secondVLBA Very Large Baseline ArrayVLSA Very Large Scale Aerial
WWAAS Wide Area Augmentation SystemWind shear Variation of wind speed and wind direction with respect to a horizontal
or vertical plane; powerful but invisible downdrafts called microbursts focus intense amounts of vertical energy in a narrow funnel that can force an aircraft to the ground nose first if the aircraft is caught underneath
WIRE Wide-field Infrared ExplorerWRC World Radiocommunication ConferenceWSDDM Weather Support to Deicing Decision MakingWSF Wake Shield Facility
X-Y-ZX rays Radiations of very short wavelengths, beyond the ultraviolet in the
spectrumXRSIM X-ray simulation software
2001 report 3/20/03 3:25 PM Page 154

Fi
sc
al
Y
ea
r
20
01
A
ct
iv
it
ie
s
155
2001 report 3/20/03 3:25 PM Page 155

Aeronauticsand
Space Reportof the
President
Fiscal Year2000
Activities
Aeronautics and Space Report of the President • Fiscal Year 2000 Activities
NP-2003-3-259-HQ
NationalAeronautics andSpace Administration
cover.308 3/20/03 3:26 PM Page 1