aersp 305w aerospace technology...
TRANSCRIPT

AERSP 305W Aerospace Technology Laboratory
Laboratory Section 17
Laboratory Experiment Number 3 2D Airfoil Testing of S805 Airfoil
February 10, 2011 Performed in Room 8 Hammond Building
Brett Davis
Lab Partner’s Names: Titos Gosalvez Kevin Harrigan James Trexler
Zachary Watson
Lab TA: Brian Wallace
Course Instructor: Richard Auhl

Brett Davis Lab 3 Page 2 of 14
Abstract
The objective of this experiment was to determine the 2D lift and drag coefficients of an S805
airfoil. Pressure taps in the airfoil were used to measure the local pressures on the airfoil’s
surface. These were used to calculate the lift coefficients. A hot-wire anemometer was used
to take a velocity survey of the airfoil’s wake in order to calculate the drag coefficients. The
coefficients were calculated from -18o to 18o at every two degrees. The angle of attach at
which stall and that at which the flow reattaches were also determined. The data from this
experiment coincided with the data presented in the NREL report on the S805 airfoil. This
experiment successfully determined the 2D lift and drag coefficients for the S805 airfoil and
was consistent with the NREL report.

Brett Davis Lab 3 Page 3 of 14
Introduction
The objective of this experiment was to determine the 2D lift and drag coefficients of an S805
airfoil. The data obtained in this experiment was compared to prior experiments performed
by the National Renewable Energy Laboratory (NREL). With pressure readings from the
pressure taps in the airfoil, the local pressure coefficients were determined using Equations
(1a, 1b) for the upper and lower surface of the airfoil.
The normal force coefficient was calculated using the equations below.
(2)
(3)
Equation (3) was obtained by assuming a thin airfoil. From the normal force coefficient, the
2D lift coefficient was obtained with Equation (4) by assuming a small angle of attack.
(4)
To determine the 2D drag coefficient, Equation (5) was evaluated using Simpson’s Rule,
Equation (6), and the velocities measured by a hot-wire anemometer
.
(5)
(6)
During Lab 1, the wind tunnel’s venturi was calibrated using Equation (7). This was used to
hold the wind tunnel at a constant Reynolds number.
(7)
Brett Davis Lab 3 Page 4 of 14
Experimental Procedure
To determine the 2D lift and drag coefficients for the S805 airfoil a series of experiments were
run in the 2x3 foot wind at a Reynolds number of 1,000,000 and at angles of attach ranging
from negative 18o to positive 18o. Time constraints only allowed each lab group to run tests
at two angles of attack. The data collected was shared between all lab groups. This report
concerns the experiments performed at 1o and -18o angle of attack. The details of the
procedures are outlined below.
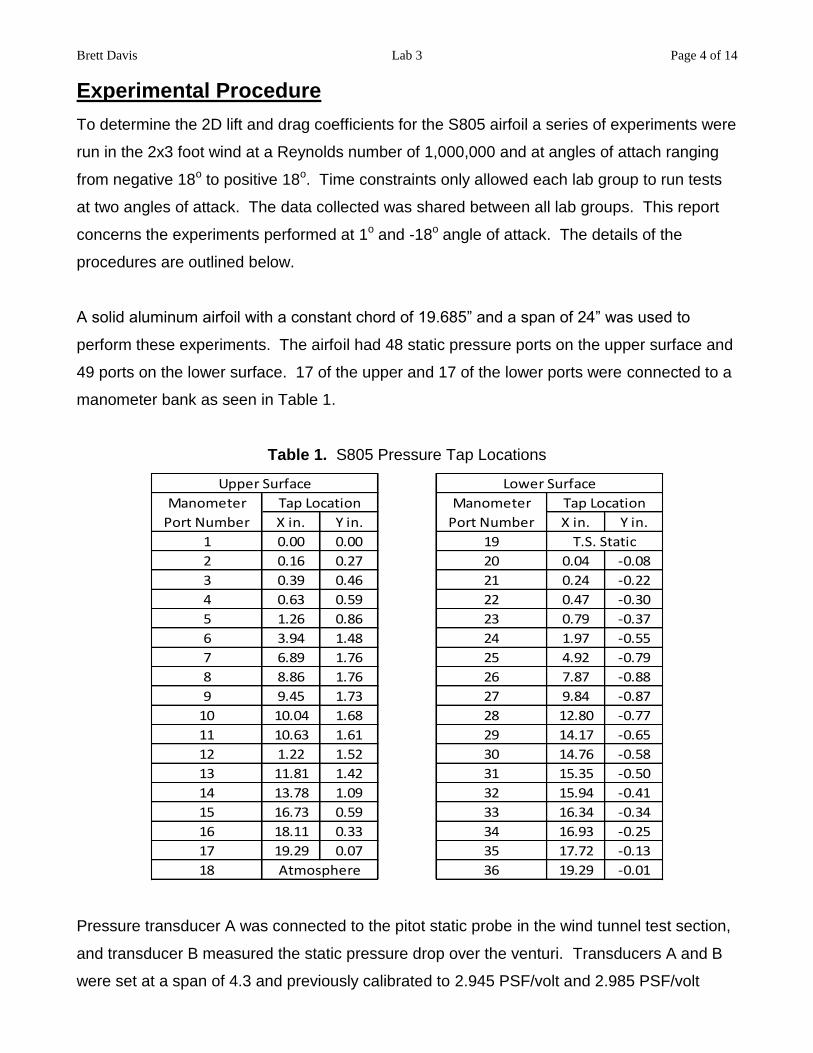
A solid aluminum airfoil with a constant chord of 19.685” and a span of 24” was used to
perform these experiments. The airfoil had 48 static pressure ports on the upper surface and
49 ports on the lower surface. 17 of the upper and 17 of the lower ports were connected to a
manometer bank as seen in Table 1.
Table 1. S805 Pressure Tap Locations
X in. Y in. X in. Y in.
1 0.00 0.00 19
2 0.16 0.27 20 0.04 -0.08
3 0.39 0.46 21 0.24 -0.22
4 0.63 0.59 22 0.47 -0.30
5 1.26 0.86 23 0.79 -0.37
6 3.94 1.48 24 1.97 -0.55
7 6.89 1.76 25 4.92 -0.79
8 8.86 1.76 26 7.87 -0.88
9 9.45 1.73 27 9.84 -0.87
10 10.04 1.68 28 12.80 -0.77
11 10.63 1.61 29 14.17 -0.65
12 1.22 1.52 30 14.76 -0.58
13 11.81 1.42 31 15.35 -0.50
14 13.78 1.09 32 15.94 -0.41
15 16.73 0.59 33 16.34 -0.34
16 18.11 0.33 34 16.93 -0.25
17 19.29 0.07 35 17.72 -0.13
18 36 19.29 -0.01Atmosphere
Manometer
Port Number
Manometer
Port Number
Tap Location
Upper Surface Lower Surface
Tap Location
T.S. Static
Pressure transducer A was connected to the pitot static probe in the wind tunnel test section,
and transducer B measured the static pressure drop over the venturi. Transducers A and B
were set at a span of 4.3 and previously calibrated to 2.945 PSF/volt and 2.985 PSF/volt

Brett Davis Lab 3 Page 5 of 14
respectively. Downstream from the airfoil a hot-wire anemometer was mounted on a sting
and motorized traverse system to measure the wake velocities as seen in Figure 1.
Figure 1. Experimental set up, location of hot-wire probe and airfoil
The hot-wire anemometer was previously calibrated to yield Equation (8).
(8)
To run the wind tunnel at a constant Reynolds number of 1 million, the venturi pressure drop
was held constant at 3.47 volts on transducer B. This pressure was determined from the
venturi calibration performed in Lab 1. The calibration constants in Lab 1 were determined
for the front, middle and rear of the test section as seen in the Appendix A. This experiment
was performed between the rear and middle locations, so these values were averaged to get
K = 0.899.
The airfoil was set at -17.95o (as close to -18o as possible) angle of attack and LabVIEW was
used to traverse the hot-wire probe vertically across the test section to measure the velocities
in the airfoil’s wake at every 0.125” over the 24” wind tunnel height. The probe made 2000
measurements at each location with a sample rate of 2 kHz. With the manometer bank tilted
at 19.8o the height of the fluid in each bank was recorded. When the hot-wire wake survey
was completed, the airfoil was rotated to 0.96o (approximately 1o). The hot-wire survey was
run again, and the fluid levels in each bank were recorded while the manometer bank was
tilted at 19.7o.
Hot-wire probe
S805 Airfoil
Traverse
direction
Brett Davis Lab 3 Page 6 of 14
General observations about the stall point of the airfoil were made with the wind tunnel
running at 50%. The airfoil was rotated from -18o to stall while observing the manometer
bank. After the airfoil stalled at 20o, the airfoil was rotated back through lower angles of
attack until the flow reattached at 17.6o.
Results and Discussion
The data collected during this experiment and during the experiments performed by other lab
groups was combined to determine the 2D coefficients of lift and drag for the S805 airfoil.
The results of these experiments were compared to the data in the NREL Design and
Experimental Results for the S805 Airfoil report to assess the findings of this experiment.
During the lab, the room temperature, pressure and air density were recorded in Table 2.
Table 2. Room conditions during experiments
During Experiment Temperature (F) Pressure (in Hg) Density (slug/ft^3)
α = 1 deg 66.4 29.42 0.002305
α = -18 deg 67.1 29.42 0.002302
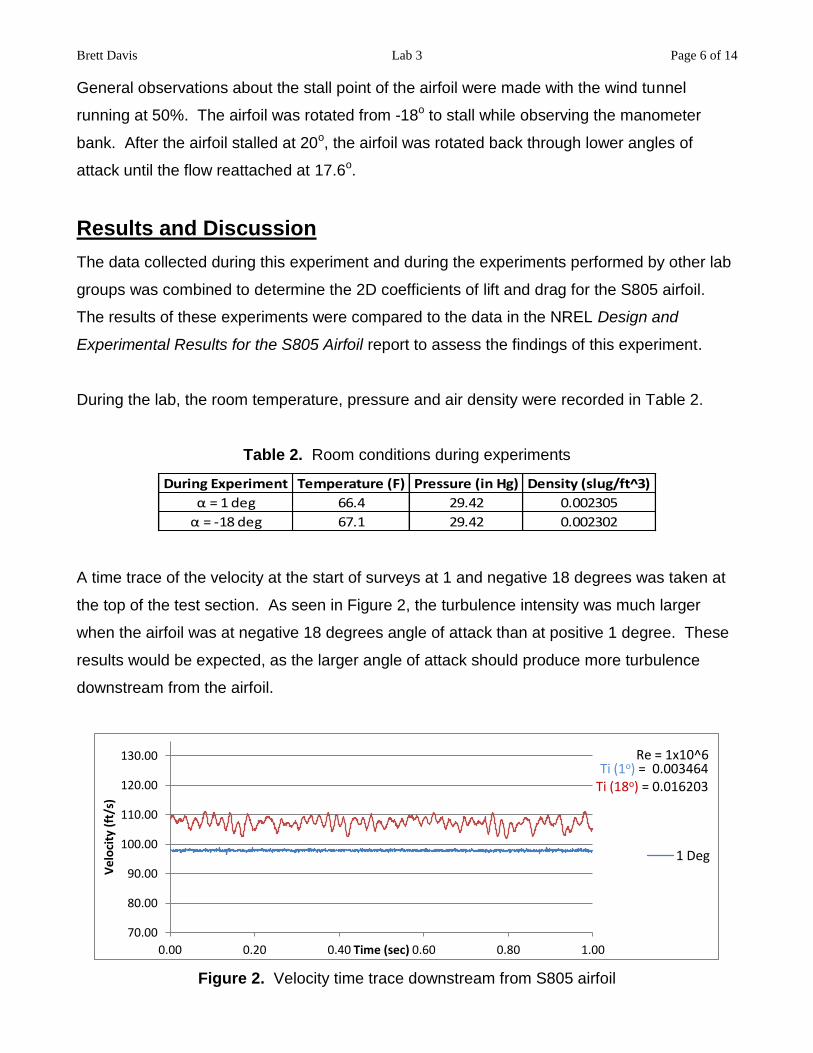
A time trace of the velocity at the start of surveys at 1 and negative 18 degrees was taken at
the top of the test section. As seen in Figure 2, the turbulence intensity was much larger
when the airfoil was at negative 18 degrees angle of attack than at positive 1 degree. These
results would be expected, as the larger angle of attack should produce more turbulence
downstream from the airfoil.
Figure 2. Velocity time trace downstream from S805 airfoil
70.00
80.00
90.00
100.00
110.00
120.00
130.00
0.00 0.20 0.40 0.60 0.80 1.00
Ve
loci
ty (
ft/s
)
Time (sec)
1 Deg
Re = 1x10^6 Ti (1o) = 0.003464
Ti (18o) = 0.016203

Brett Davis Lab 3 Page 7 of 14
From the hot-wire anemometer’s measurements, the average velocity at each position was
calculated. These velocities were plotted as a function of vertical position to form the wake
profile at 1o in Figure 3 and at -18o in Figure 4. These profiles show that the -18o angle of
attach created a much larger velocity deficit than the 1o orientation. This large wake results in
a larger coefficient of drag, 0.2412, than the smaller wake at 1o, which had a cd of 0.0083.
These differences are consistent with what is expected.
Figure 3. Wake velocity profile at 1o angle of attack
Figure 4. Wake velocity profile at -18o angle of attack
0
5
10
15
20
88 90 92 94 96 98 100
Ve
rtic
al P
osi
tio
n (
inch
es)
Velocity (ft/s)
Re = 1x10^6 α = 0.96o
cd = 0.0083
0
5
10
15
20
0 20 40 60 80 100 120
Ve
rtic
al P
osi
tio
n (
inch
es)
Velocity (ft/s)
Re = 1x10^6 α = -17.95o
cd = 0.2412

Brett Davis Lab 3 Page 8 of 14
Using the pressure readings taken from the manometer bank, the pressure distribution over
the airfoil was plotted. In Figure 5, it can be seen that at α = 1o the upper surface of the airfoil
experienced negative pressures and the lower surface had positive pressure, indicating
positive lift resulting in a cl of 0.3344. The data from this experiment closely follows the data
from the NREL report as can be seen from Figure 5. There was a favorable pressure
gradient to about 50% of the chord on the upper surface and 65% on the lower surface,
followed by adverse pressure gradients, which is close to the design specifications in the
NREL report.
Figure 5. Pressure distribution over S805 airfoil at 1o angle of attack
The pressure distribution over the airfoil at -18o can be seen in Figure 6. From this graph, it
can be seen that the airfoil generated negative lift, as the upper surface experienced positive
pressures, and the lower surface had negative pressures. There was not a large pressure
gradient on the lower surface in this orientation, while the upper surface had a large adverse
pressure gradient up to 0.5% of the chord followed by a mostly favorable pressure gradient.
At this angle, the cl was -0.6714. This data did not follow the NREL data as closely, although
-0.8
-0.6
-0.4
-0.2
0
0.2
0.4
0.6
0.8
1
0.000 0.200 0.400 0.600 0.800 1.000
Cp
x/c
Experimental Upper Surface
Experimental Lower Surface
NREL upper
NREL lower
Re = 1x10^6 cl = 0.3344
αExperiment = 0.96o
αNREL = 1o
LE TE

Brett Davis Lab 3 Page 9 of 14
the general trend was consistent. The angles of attack did not exactly match the NREL data
in this case which could have contributed to the differences in the data.
Figure 6. Pressure distribution over S805 airfoil at -18o angle of attack
The compiled data from each lab group was used to generate a plot of the coefficient of lift as
a function of the angle of attack in Figure 7. The linear portion of the cl versus α curve was a
near perfect match to the NREL results. In the non-linear regions of the curve, the
coefficients of lift from this experiment were slightly greater than those from the NREL report
for positive angles of attack. At -16o and -14o the coefficients of lift are slightly less than
expected possibly due to measurement errors. Overall, the cl versus α curve is consistent
with expectations and the NREL findings.
-1.500
-1.000
-0.500
0.000
0.500
1.000
1.500
0.000 0.200 0.400 0.600 0.800 1.000
Cp
x/c
Experimental Upper Surface
Experimental Lower Surface
NREL lower
NREL upper
Re = 1x10^6 cl = -0.6714
αExperiment = -17.95o
αNREL = -18.1o
TE LE

Brett Davis Lab 3 Page 10 of 14
Figure 7. Coefficient of lift vs. angle of attack of S805 airfoil
The compiled data was also used to create a plot of the coefficient of lift versus the coefficient
of drag in Figure 8. The plot shows the expected relationship between cl and cd, and the
NREL data appears to be consistent with the findings of this experiment. However, the NREL
data was over a much smaller range of drag coefficients. Figure 9 shows the data over the
range of cd presented in the NREL report. At small values of cd this experiment’s data is
relatively close to the NREL data. The differences between the two sets of data are likely
due to the difficulty in determining these very small drag coefficients. In this experiment, the
cd was evaluated by integrating the wake profile using Simpson’s Rule. The bounds of
integration for each angle of attack had to be manually selected because the velocity varied
slightly over the height of the wind tunnel. The approximations in this approach could be
responsible for the differences seen in Figure 9.
-1
-0.5
0
0.5
1
1.5
-20.00 -15.00 -10.00 -5.00 0.00 5.00 10.00 15.00 20.00
Cl
Angle of Attack (deg)
Experimental
NREL
Re = 1x10^6

Brett Davis Lab 3 Page 11 of 14
Figure 8. Coefficient of lift vs. coefficient of drag of S805 airfoil
Figure 9. cl vs. cd*1000 of S805 airfoil at small cd values
-1
-0.5
0
0.5
1
1.5
0 0.05 0.1 0.15 0.2 0.25
cl
cd
Experimental
NREL
Re = 1x10^6
-0.4
-0.2
0
0.2
0.4
0.6
0.8
1
1.2
0 5 10 15 20
cl
cd *1000
Experimental
NREL
Re = 1x10^6

Brett Davis Lab 3 Page 12 of 14
With the tunnel running at 50%, the airfoil stalled at approximately 20o, however, the
protractor maxed out at 20o so this measurement could be slightly off. Figure 10 shows the
manometer bank when the airfoil was at 6o to 20o angle of attack.
Figure 10. Manometer bank showing airfoil pressures from 6o until stall
The flow reattached when the airfoil was rotated back to 17.6o. The flow separated at a
higher angle of attack than it reattached at because the flow needs more energy to reattach.
Once the flow is attached, its momentum resists separation until the adverse pressure
gradient over comes it. Once separated, the flow needs to gain enough energy to initially
reattach which is why the two angles were different.
6.0o 11.2
o 13.5
o 18.9
o ~20
o
(stall)

Brett Davis Lab 3 Page 13 of 14
Conclusions
The 2D lift and drag coefficients for the S805 airfoil found from this experiment were
consistent with those presented in the NREL report. The coefficient of lift as a function of the
angle of attack yielded the same relationship as that in the NREL report with only a slight
error at large angles of attack. The lift and drag coefficients’ relationship was also consistent
with the NREL data. Some errors occurred at small coefficients of drag likely due to the
difficulty in computing such small amounts of drag. These differences were insignificant
when considered over the full range of data taken. General observations indicated that the
angle of stall is greater than the angle required to reattach the flow, which is consistent with
what was expected. Overall, the experiment successfully determined the 2D lift and drag
coefficients for the S805 airfoil.

Brett Davis Lab 3 Page 14 of 14
The Appendix
Appendix A. 2x3 ft. wind tunnel venturi calibration
∆P = 0.9976q - 0.0937
∆P = 0.8976q + 0.1094
∆P = 0.8766q + 0.0078
∆P = 0.9897q
0
5
10
15
20
25
30
0 5 10 15 20 25 30
Co
ntr
acti
on
Pre
ssu
re D
rop
(P
SF)
Test Section Dynamic Pressure (PSF)
Front
Middle
Rear
Theoretical