af mfcpbr 021 pressp-w.pdf_085906 app 10 17 16
TRANSCRIPT

A Review of U.S. Presidential Elections
Elections Come and Go. Results Last a Lifetime.

Set Your Sights on the Long Term Investor doubts may seem especially prevalent during presidential election years when campaigns spotlight the country’s challenges. Yet even with election year rhetoric amplifying the negative, it’s important to focus on your vision for the future. To help you stay the course, consider the following:
• Successful long-term investors stay the course and rely on time rather than timing.
• Investment success has depended more on the strength and resilience of the American economy than on which candidate or party holds office.
• The experience and time-tested process of your investment manager can be an important contributor to your long-term investment success.
“ The only limit to
our realization of
tomorrow will be our
doubts of today.”
— Franklin D. Roosevelt
Investments are not FDIC-insured, nor are they deposits of or guaranteed by a bank or any other entity, so they may lose value.
RepublicanDemocrat
1936 1940 1944 1948 1952 1956 1960 1964 1968 1972
Franklin D. Roosevelt
vs. Alf Landon
Franklin D. Roosevelt
vs. Wendell Willkie
Franklin D. Roosevelt
vs. Thomas Dewey
Harry Truman vs.
Thomas Dewey
Dwight Eisenhower
vs. Adlai Stevenson
Dwight Eisenhower
vs. Adlai Stevenson
John F. Kennedy vs.
Richard Nixon
Lyndon Johnson vs.
Barry Goldwater
Richard Nixon vs.
Hubert Humphrey
Richard Nixon vs.
George McGovern
U.S. remains in grip of
Depression
Nazi rise troubles Europe
Isolationism vs. engagement
hotly debated
Germany menaces Europe;
France falls
FDR’s health in question
Potential Post-War impact of
New Deal debated
Civil rights tension boils over at convention
Berlin blockade accelerates Cold War
U.S. detonates first hydrogen
bomb
Attempts at Korean War
truce fail
Mideast trouble as Egypt seizes
Suez Canal
Soviets invade Hungary
Cuba nationalizes U.S. assets
American U-2 spy plane shot down in Soviet
airspace
Civil Rights Act passes after
lengthy filibuster
Gulf of Tonkin signals Vietnam
involvement
Vietnam protests and civil rights
issues roil conventions
RFK and Martin Luther King Jr. assassinated
Watergate scandal surfaces
Vietnam War drags on

There have always been tumultuous events
The current economic and political challenges may seem unprecedented, but a look back shows
that controversy and uncertainty have surrounded every race.
CLOSED
Labor market struggles
Market declines and recessions
CLOSED
Businesses going bankrupt
CLOSED
Weather-related calamities
CLOSED
Overseas conflict and war
CLOSED
Civil unrest and protest
1976 1980 1984 1988 1992 1996 2000 2004 2008 2012
Jimmy Carter vs.
Gerald Ford
Ronald Reagan vs.
Jimmy Carter
Ronald Reagan vs.
Walter Mondale
George H.W. Bush
vs. Michael Dukakis
Bill Clinton vs.
George H.W. Bush
Bill Clinton vs.
Bob Dole
George W. Bush vs.
Al Gore
George W. Bush vs.
John Kerry
Barack Obama vs.
John McCain
Barack Obama vs.
Mitt Romney
New York City threatens
bankruptcy
Economy mired in recession
Iran hostage crisis drags on
Olympic boycott underscores
Cold War divide
Budget deficits rising rapidly
Stock market slides over 30%
in less than four months
Savings and loan crisis
reaches apex
Iran-Contra indictments
Los Angeles riots highlight racial
tension
Pending NAFTA ratification
creates anxiety
19 American servicemen
killed in Saudi Arabia bombing
UN arms inspec-tors repeatedly thwarted in Iraq
Tech bubble bursts; stock
markets plummet
Attack on USS Cole heightens
terrorism concerns
Oil prices soar
Ongoing wars in Iraq and
Afghanistan
Subprime mortgage crisis
Lehman Brothers collapse; world
markets fall
High-stakes negotiations lead to a deal to avert the “fiscal cliff”
Superstorm Sandy kills 268 people, and causes $68
billion in damage

Value added by reinvestmentof dividends
Rec
ord
-set
ting
m
arke
t dec
line
Dep
ress
ion
Civ
il w
ar in
Sp
ain
Rec
essi
on
Eco
nom
y st
ill s
trug
glin
g
War
clo
uds
gat
her
War
in E
uro
pe
Fran
ce fa
lls
Pear
l Har
bo
r
War
tim
e p
rice
co
ntro
ls
Ind
ustr
y m
ob
ilize
s
Co
nsum
er g
oo
ds
sho
rtag
es
Post
-war
rec
essi
on
pre
dic
ted
Do
w to
ps
20
0 —
mar
ket “
too
hig
h”
Co
ld W
ar b
egin
s
Ber
lin b
lock
ade
Sovi
ets
det
ona
te A
-bo
mb
Ko
rean
War
Exc
ess
pro
fits
tax
U.S
. sei
zes
stee
l mill
s
Sovi
ets
det
ona
te H
-bo
mb
Do
w to
ps
30
0 —
mar
ket “
too
hig
h”
Eis
enho
wer
illn
ess
Suez
Cri
sis
Sovi
ets
laun
ch S
put
nik
Rec
essi
on
Cas
tro
sei
zes
po
wer
in C
uba
Sovi
ets
do
wn
U-2
pla
ne
Ber
lin W
all i
s er
ecte
d
Cub
an M
issi
le C
risi
s
Ken
ned
y as
sass
inat
ion
Gul
f o
f To
nkin
Civ
il ri
ght
s m
arch
es
New
ark
rio
ts
Vie
tnam
War
esc
alat
es
No
rth
Ko
rea
cap
ture
s U
SS P
ueb
lo
Mo
ney
tig
hten
s;m
arke
t fal
ls
Wag
e-p
rice
free
ze
Wat
erg
ate
Oil
emb
arg
o
Nix
on
resi
gns
U.S
. wit
hdra
ws
fro
m V
ietn
am
New
Yo
rk C
ity
thre
aten
s b
ankr
uptc
y
Ene
rgy
cris
is
Mas
sacr
es in
Cam
bo
dia
Thre
e M
ile Is
land
nucl
ear
acci
den
t
U.S
. inv
ades
Cam
bo
dia
Ab
scam
sca
ndal
rock
s C
ong
ress
Wo
rst r
eces
sio
nin
40
yea
rs
Sovi
ets
sho
ot d
ow
n K
ore
an a
irlin
er
Iran
-Ira
q w
ar
esca
late
s
U.S
. bec
om
es a
d
ebto
r na
tio
n
U.S
. bo
mb
s Li
bya
Ban
k fa
ilure
s p
eak
Iraq
inva
des
Kuw
ait
Rec
essi
on
in U
.S.;
Sovi
et U
nio
n d
isso
lves
Los
Ang
eles
rio
ts
Mid
wes
tern
U.S
. flo
od
s
Fed
rai
ses
inte
rest
rat
essi
x ti
mes
Pro
ble
ms
wit
h ju
nk b
ond
s
Tech
nolo
gy
sto
cks
stum
ble
Cha
os
in A
sian
mar
kets
Glo
bal
eco
nom
ic tu
rmo
il
Fear
s o
f Y2
K
com
put
er p
rob
lem
s
Rea
gan
and
the
po
pe
are
sho
t
Inte
rnet
bub
ble
bur
sts
Terr
ori
st a
ttac
ks in
U.S
.
Co
rpo
rate
acc
oun
ting
sc
and
als
U.S
. inv
ades
Iraq
Hur
rica
nes
dev
asta
teso
uthe
rn U
.S.
Do
w J
one
s to
ps
12
00
0 fo
r fir
st ti
me
Sub
pri
me
cred
it c
risi
s
U.S
. rec
essi
on
U.S
. une
mp
loym
ent t
op
s 1
0%
Gul
f o
f M
exic
o o
il sp
ill
Eur
op
ean
sove
reig
n d
ebt c
risi
s
U.S
. fac
es “
fisca
l clif
f”
U.S
. dra
wn
into
Syr
ian
confl
ict
Gre
ek d
ebt c
risi
s;
Chi
na g
row
th s
low
s
Year
five
of
fed
eral
go
vern
men
t’sq
uant
itat
ive
easi
ng p
olic
y
Oil
pri
ces
soar
Do
w to
ps
40
00
, the
n 5
00
0 —
mar
ket “
too
hig
h”
Averageannual totalreturn for 82 years:
+12.0%
Original investment$10,000
ICA with dividends excluded$9,787,1003
Average annualreturn: 8.8%
ICA with dividendsreinvested$107,719,5522
Average annualreturn: 12.0%
Stock market with dividends excluded$2,023,703Average annualreturn: 6.7%
Consumer Price Index (Inflation)$179,186Average annualreturn: 3.6%
Stock market with dividends reinvested$44,324,528Average annualreturn: 10.8%
Total return
Year ended Dec. 31
Capital value ($ in 000)
Dividends excluded:Value at year-end:
Total value ($ in 000)
Dividends reinvested:Value at year-end:
–38.5 –2.4 –7.4 –2.4 –11.9 –13.2 –10.7 –16.8 –17.9 –2.6+83.1 +45.8 +27.6 +0.8 +16.8 +32.8 +23.3 +36.8 +0.9 +0.4 +9.4 +19.8 +17.8 +12.2 +0.4 +56.1 +25.4 +10.8 +44.8 +14.2 +4.5 +23.1 +22.9 +16.3 +26.9 +1.0 +28.9 +17.0 +2.6 +17.0 +15.9 +35.4 +29.6 +14.7 +19.2 +21.2 +0.9 +33.8 +20.2 +6.7 +33.4 +21.7 +5.4 +13.3 +29.4 +0.7 +26.5 +27.2+7.0 +11.6 +0.2 +30.6 +19.3 +29.8 +16.6+22.9 +3.8 –4.6 +5.9+18.2% –34.7 +10.9 –1.8 +15.6 +32.4 +12.1 –1.4–14.5 +26.3 +9.8 +6.9 +15.9
357.8
14,092.3
320.4
13,171.9
406.3
10,409.0
370.8
10,338.6
318.7
7,989.3
203.8
6,685.7
174.9
5,491.9
160.4
4,117.2
147.2
3,859.7
146.1
3,212.0
115.9
2,401.1
91.3
2,380.2
70.0
1,963.3
56.0
1,647.5
49.8
1,436.4
46.4
1,474.4
52.2
840.3
49.8
1,137.7
29.9
1,231.1
28.6
1,062.7
27.3
908.0
33.4
1,024.1
25.3
884.8
22.6
990.6
18.4
846.9
15.5
657.1
12.1
650.7
10.7
512.6
9.6
440.9
9.1
358.8
8.4
413.6
8.1
336.0
7.0
321.4
6.5
281.5
6.2
194.4
5.6
220.6
5.1
199.2
4.1
158.9
3.9
101.7
3.5
101.3
3.4
90.3
3.2
76.6
2.7
63.9
2.7
58.4
2.4
58.2
1.8
57.7
1.2
59.1
1.2
43.2
1.1
35.0
1.2
26.4
1.3
22.6
.9
24.4
.5
25.0
.2
24.8
1.0
19.4
$.4
31.6
—
21.6
—
$11.8
267.5
7,049.2
374.4
15,729.4
407.2
15,753.9
450.1
20,578.7
480.1
24,560.6
510.3
31,881.2
651.8
45,682.2
584.1
39,193.5
743.4
47,435.2
804.1
45,258.6
1,319.3
70,456.8
1,466.7
45,983.8
1,264.7
58,481.1
1,272.4
64,830.6
1,345.5
63,692.5
1,707.1
73,628.5
1,548.6
97,503.5
1,939.3
109,291.9
833.3
38,709.1
864.3
48,891.6
887.4
53,674.5
1,196.3
57,361.4
1,364.6
66,504.4
53.0
2,052.2
48.7
1,969.9
64.1
1,598.8
60.7
1,652.8
54.4
1,327.4
37.3
1,200.5
33.2
1,017.9
31.7
792.0
30.3
774.5
31.6
670.6
26.4
530.9
21.7
552.2
17.3
475.7
14.4
414.4
13.3
374.3
12.8
398.1
15.9
245.5
14.3
317.7
9.7
394.7
9.6
349.7
9.4
307.4
10.6
317.9
9.0
309.6
8.3
356.6
6.9
312.5
5.9
248.0
4.7
251.6
4.3
202.3
3.9
177.8
3.8
148.2
3.6
175.4
3.6
145.6
3.2
142.9
3.0
128.0
3.0
90.9
2.7
106.3
2.6
98.5
2.1
80.8
2.1
53.4
2.0
55.3
2.0
51.2
1.9
45.2
1.7
39.4
1.8
37.7
1.7
39.3
1.3
40.7
.9
42.9
.9
32.1
.9
26.9
1.0
20.9
1.1
18.8
.8
21.5
.5
22.9
.2
23.2
1.0
18.3
$.4
31.0
—
21.6
—
$11.8
47.5
1,220.9
54.0
2,234.2
57.3
2,180.6
61.7
2,779.7
64.3
3,247.9
67.0
4,142.7
82.8
5,748.5
93.0
5,875.5
99.0
5,507.5
75.4
5,008.2
144.0
7,601.9
156.9
4,835.7
131.5
5,986.9
129.2
6,496.8
133.8
6,249.9
166.1
7,055.0
147.4
9,179.2
181.3
10,102.3
100.7
4,616.9
102.2
5,713.5
103.0
6,163.0
136.3
6,446.5
152.1
7,313.2
2007 2008 2009 2010 2011 2012 2013 2014
1,849.1
107,719.6
169.8
9,787.1
20151935 1936 1937 1938 1939 1940 1941 1942 19431934 1944 1945 1946 1947 1948 1949 1950 1951 1952 1953 1954 1955 1956 1957 1958 1959 1960 1961 1962 1963 1964 1965 1966 1967 1968 1969 1970 1971 1972 1973 1974 1975 1976 1977 1978 1979 1980 1981 1982 1983 1984 1985 1986 1987 1988 1989 1990 1991 1992 1993 1994 1995 1996 1997 1999 20001998 200620052004200320022001
8,000
10,000
20,000
40,000
60,000
80,000
100,000
200,000
400,000
600,000
800,000
1,000,000
2,000,000
4,000,000
6,000,000
30,000,000
40,000,000
50,000,000
70,000,000
100,000,000
$200,000,000
10,000,000
20,000,000
8,000,000
Average annual return:
9.9%
19361
Franklin Roosevelt
Average annual return:
9.2%
19401
Franklin Roosevelt
Average annual return:
10.6%
19441
Franklin Roosevelt
Average annual return:
12.1%
19481
HarryTruman
$10,000 investment 10 years later
Dividends reinvested during period
Average annual return:
15.8%
$43,238
19521
DwightEisenhower
Average annual return:
11.9%
$30,768
19561
DwightEisenhower
Average annual return:
10.0%
$25,951
19601
John F.Kennedy
Average annual return:
8.2%
$21,901
19641
LyndonJohnson
Average annual return:
4.8%
$15,994
19681
RichardNixon
Average annual return:
7.9%
$21,301
19721
RichardNixon
Average annual return:
16.4%
$45,486
19761
JimmyCarter
Average annual return:
17.4%
$49,623
19801
RonaldReagan
Average annual return:
14.4%
$38,400
19841
RonaldReagan
Average annual return:
15.6%
$42,624
19881
George H.W.Bush
Average annual return:
12.5%
$32,378
19921
BillClinton
Average annual return:
10.1%
$26,270
19961
BillClinton
Average annual return:
1.9%
$12,066
20001
George W.Bush
$6,128
$6,540$7,002
$6,176
$31,461$27,432
$24,145
$25,740
$3,918
$4,786$4,103
$3,947
$4,068$5,276
$8,763
$9,584 $7,214 $5,343 $3,837 $3,460 $2,217
Average annual return:
6.5%
$18,796
20041
George W.Bush
$2,578
Results reflect payment of the maximum 5.75% sales charge for Class A shares on a hypothetical $10,000 investment. Thus the net amount invested was $9,425. The maximum initial sales charge was 8.5% prior to July 1, 1988. As outlined in the prospectus, the sales charge is reduced for larger investments. There is no sales charge on dividends or capital gain distributions that are reinvested in additional shares. The results shown are before taxes on fund distributions and sale of fund shares. Past results are not predictive of results in future periods. Results for other share classes may differ.
The Investment Company of America® 20 elections and countingAs you can see in the mountain chart below, a hypothetical $10,000 investment in The Investment Company of America has grown steadily and significantly over the fund’s 82-year history.
Additionally, a hypothetical $10,000 investment in ICA made at the beginning of an election year was always larger 10 years down the road.

Value added by reinvestmentof dividends
Rec
ord
-set
ting
m
arke
t dec
line
Dep
ress
ion
Civ
il w
ar in
Sp
ain
Rec
essi
on
Eco
nom
y st
ill s
trug
glin
g
War
clo
uds
gat
her
War
in E
uro
pe
Fran
ce fa
lls
Pear
l Har
bo
r
War
tim
e p
rice
co
ntro
ls
Ind
ustr
y m
ob
ilize
s
Co
nsum
er g
oo
ds
sho
rtag
es
Post
-war
rec
essi
on
pre
dic
ted
Do
w to
ps
20
0 —
mar
ket “
too
hig
h”
Co
ld W
ar b
egin
s
Ber
lin b
lock
ade
Sovi
ets
det
ona
te A
-bo
mb
Ko
rean
War
Exc
ess
pro
fits
tax
U.S
. sei
zes
stee
l mill
s
Sovi
ets
det
ona
te H
-bo
mb
Do
w to
ps
30
0 —
mar
ket “
too
hig
h”
Eis
enho
wer
illn
ess
Suez
Cri
sis
Sovi
ets
laun
ch S
put
nik
Rec
essi
on
Cas
tro
sei
zes
po
wer
in C
uba
Sovi
ets
do
wn
U-2
pla
ne
Ber
lin W
all i
s er
ecte
d
Cub
an M
issi
le C
risi
s
Ken
ned
y as
sass
inat
ion
Gul
f o
f To
nkin
Civ
il ri
ght
s m
arch
es
New
ark
rio
ts
Vie
tnam
War
esc
alat
es
No
rth
Ko
rea
cap
ture
s U
SS P
ueb
lo
Mo
ney
tig
hten
s;m
arke
t fal
ls
Wag
e-p
rice
free
ze
Wat
erg
ate
Oil
emb
arg
o
Nix
on
resi
gns
U.S
. wit
hdra
ws
fro
m V
ietn
am
New
Yo
rk C
ity
thre
aten
s b
ankr
uptc
y
Ene
rgy
cris
is
Mas
sacr
es in
Cam
bo
dia
Thre
e M
ile Is
land
nucl
ear
acci
den
t
U.S
. inv
ades
Cam
bo
dia
Ab
scam
sca
ndal
rock
s C
ong
ress
Wo
rst r
eces
sio
nin
40
yea
rs
Sovi
ets
sho
ot d
ow
n K
ore
an a
irlin
er
Iran
-Ira
q w
ar
esca
late
s
U.S
. bec
om
es a
d
ebto
r na
tio
n
U.S
. bo
mb
s Li
bya
Ban
k fa
ilure
s p
eak
Iraq
inva
des
Kuw
ait
Rec
essi
on
in U
.S.;
Sovi
et U
nio
n d
isso
lves
Los
Ang
eles
rio
ts
Mid
wes
tern
U.S
. flo
od
s
Fed
rai
ses
inte
rest
rat
essi
x ti
mes
Pro
ble
ms
wit
h ju
nk b
ond
s
Tech
nolo
gy
sto
cks
stum
ble
Cha
os
in A
sian
mar
kets
Glo
bal
eco
nom
ic tu
rmo
il
Fear
s o
f Y2
K
com
put
er p
rob
lem
s
Rea
gan
and
the
po
pe
are
sho
t
Inte
rnet
bub
ble
bur
sts
Terr
ori
st a
ttac
ks in
U.S
.
Co
rpo
rate
acc
oun
ting
sc
and
als
U.S
. inv
ades
Iraq
Hur
rica
nes
dev
asta
teso
uthe
rn U
.S.
Do
w J
one
s to
ps
12
00
0 fo
r fir
st ti
me
Sub
pri
me
cred
it c
risi
s
U.S
. rec
essi
on
U.S
. une
mp
loym
ent t
op
s 1
0%
Gul
f o
f M
exic
o o
il sp
ill
Eur
op
ean
sove
reig
n d
ebt c
risi
s
U.S
. fac
es “
fisca
l clif
f”
U.S
. dra
wn
into
Syr
ian
confl
ict
Gre
ek d
ebt c
risi
s;
Chi
na g
row
th s
low
s
Year
five
of
fed
eral
go
vern
men
t’sq
uant
itat
ive
easi
ng p
olic
y
Oil
pri
ces
soar
Do
w to
ps
40
00
, the
n 5
00
0 —
mar
ket “
too
hig
h”
Averageannual totalreturn for 82 years:
+12.0%
Original investment$10,000
ICA with dividends excluded$9,787,1003
Average annualreturn: 8.8%
ICA with dividendsreinvested$107,719,5522
Average annualreturn: 12.0%
Stock market with dividends excluded$2,023,703Average annualreturn: 6.7%
Consumer Price Index (Inflation)$179,186Average annualreturn: 3.6%
Stock market with dividends reinvested$44,324,528Average annualreturn: 10.8%
Total return
Year ended Dec. 31
Capital value ($ in 000)
Dividends excluded:Value at year-end:
Total value ($ in 000)
Dividends reinvested:Value at year-end:
–38.5 –2.4 –7.4 –2.4 –11.9 –13.2 –10.7 –16.8 –17.9 –2.6+83.1 +45.8 +27.6 +0.8 +16.8 +32.8 +23.3 +36.8 +0.9 +0.4 +9.4 +19.8 +17.8 +12.2 +0.4 +56.1 +25.4 +10.8 +44.8 +14.2 +4.5 +23.1 +22.9 +16.3 +26.9 +1.0 +28.9 +17.0 +2.6 +17.0 +15.9 +35.4 +29.6 +14.7 +19.2 +21.2 +0.9 +33.8 +20.2 +6.7 +33.4 +21.7 +5.4 +13.3 +29.4 +0.7 +26.5 +27.2+7.0 +11.6 +0.2 +30.6 +19.3 +29.8 +16.6+22.9 +3.8 –4.6 +5.9+18.2% –34.7 +10.9 –1.8 +15.6 +32.4 +12.1 –1.4–14.5 +26.3 +9.8 +6.9 +15.9
357.8
14,092.3
320.4
13,171.9
406.3
10,409.0
370.8
10,338.6
318.7
7,989.3
203.8
6,685.7
174.9
5,491.9
160.4
4,117.2
147.2
3,859.7
146.1
3,212.0
115.9
2,401.1
91.3
2,380.2
70.0
1,963.3
56.0
1,647.5
49.8
1,436.4
46.4
1,474.4
52.2
840.3
49.8
1,137.7
29.9
1,231.1
28.6
1,062.7
27.3
908.0
33.4
1,024.1
25.3
884.8
22.6
990.6
18.4
846.9
15.5
657.1
12.1
650.7
10.7
512.6
9.6
440.9
9.1
358.8
8.4
413.6
8.1
336.0
7.0
321.4
6.5
281.5
6.2
194.4
5.6
220.6
5.1
199.2
4.1
158.9
3.9
101.7
3.5
101.3
3.4
90.3
3.2
76.6
2.7
63.9
2.7
58.4
2.4
58.2
1.8
57.7
1.2
59.1
1.2
43.2
1.1
35.0
1.2
26.4
1.3
22.6
.9
24.4
.5
25.0
.2
24.8
1.0
19.4
$.4
31.6
—
21.6
—
$11.8
267.5
7,049.2
374.4
15,729.4
407.2
15,753.9
450.1
20,578.7
480.1
24,560.6
510.3
31,881.2
651.8
45,682.2
584.1
39,193.5
743.4
47,435.2
804.1
45,258.6
1,319.3
70,456.8
1,466.7
45,983.8
1,264.7
58,481.1
1,272.4
64,830.6
1,345.5
63,692.5
1,707.1
73,628.5
1,548.6
97,503.5
1,939.3
109,291.9
833.3
38,709.1
864.3
48,891.6
887.4
53,674.5
1,196.3
57,361.4
1,364.6
66,504.4
53.0
2,052.2
48.7
1,969.9
64.1
1,598.8
60.7
1,652.8
54.4
1,327.4
37.3
1,200.5
33.2
1,017.9
31.7
792.0
30.3
774.5
31.6
670.6
26.4
530.9
21.7
552.2
17.3
475.7
14.4
414.4
13.3
374.3
12.8
398.1
15.9
245.5
14.3
317.7
9.7
394.7
9.6
349.7
9.4
307.4
10.6
317.9
9.0
309.6
8.3
356.6
6.9
312.5
5.9
248.0
4.7
251.6
4.3
202.3
3.9
177.8
3.8
148.2
3.6
175.4
3.6
145.6
3.2
142.9
3.0
128.0
3.0
90.9
2.7
106.3
2.6
98.5
2.1
80.8
2.1
53.4
2.0
55.3
2.0
51.2
1.9
45.2
1.7
39.4
1.8
37.7
1.7
39.3
1.3
40.7
.9
42.9
.9
32.1
.9
26.9
1.0
20.9
1.1
18.8
.8
21.5
.5
22.9
.2
23.2
1.0
18.3
$.4
31.0
—
21.6
—
$11.8
47.5
1,220.9
54.0
2,234.2
57.3
2,180.6
61.7
2,779.7
64.3
3,247.9
67.0
4,142.7
82.8
5,748.5
93.0
5,875.5
99.0
5,507.5
75.4
5,008.2
144.0
7,601.9
156.9
4,835.7
131.5
5,986.9
129.2
6,496.8
133.8
6,249.9
166.1
7,055.0
147.4
9,179.2
181.3
10,102.3
100.7
4,616.9
102.2
5,713.5
103.0
6,163.0
136.3
6,446.5
152.1
7,313.2
2007 2008 2009 2010 2011 2012 2013 2014
1,849.1
107,719.6
169.8
9,787.1
20151935 1936 1937 1938 1939 1940 1941 1942 19431934 1944 1945 1946 1947 1948 1949 1950 1951 1952 1953 1954 1955 1956 1957 1958 1959 1960 1961 1962 1963 1964 1965 1966 1967 1968 1969 1970 1971 1972 1973 1974 1975 1976 1977 1978 1979 1980 1981 1982 1983 1984 1985 1986 1987 1988 1989 1990 1991 1992 1993 1994 1995 1996 1997 1999 20001998 200620052004200320022001
8,000
10,000
20,000
40,000
60,000
80,000
100,000
200,000
400,000
600,000
800,000
1,000,000
2,000,000
4,000,000
6,000,000
30,000,000
40,000,000
50,000,000
70,000,000
100,000,000
$200,000,000
10,000,000
20,000,000
8,000,000
Average annual return:
9.9%
19361
Franklin Roosevelt
Average annual return:
9.2%
19401
Franklin Roosevelt
Average annual return:
10.6%
19441
Franklin Roosevelt
Average annual return:
12.1%
19481
HarryTruman
$10,000 investment 10 years later
Dividends reinvested during period
Average annual return:
15.8%
$43,238
19521
DwightEisenhower
Average annual return:
11.9%
$30,768
19561
DwightEisenhower
Average annual return:
10.0%
$25,951
19601
John F.Kennedy
Average annual return:
8.2%
$21,901
19641
LyndonJohnson
Average annual return:
4.8%
$15,994
19681
RichardNixon
Average annual return:
7.9%
$21,301
19721
RichardNixon
Average annual return:
16.4%
$45,486
19761
JimmyCarter
Average annual return:
17.4%
$49,623
19801
RonaldReagan
Average annual return:
14.4%
$38,400
19841
RonaldReagan
Average annual return:
15.6%
$42,624
19881
George H.W.Bush
Average annual return:
12.5%
$32,378
19921
BillClinton
Average annual return:
10.1%
$26,270
19961
BillClinton
Average annual return:
1.9%
$12,066
20001
George W.Bush
$6,128
$6,540$7,002
$6,176
$31,461$27,432
$24,145
$25,740
$3,918
$4,786$4,103
$3,947
$4,068$5,276
$8,763
$9,584 $7,214 $5,343 $3,837 $3,460 $2,217
Average annual return:
6.5%
$18,796
20041
George W.Bush
$2,578
Expense ratio was 0.59% as of the fund’s prospectus available at the time of publication.
Here are ICA’s average annual total returns on a $1,000 investment with all distributions reinvested for periods ended December 31, 2015: 1 year 5 years 10 yearsClass A shares –7.10% 9.38% 5.88%

Value added by reinvestmentof dividends
Rec
ord
-set
ting
m
arke
t dec
line
Dep
ress
ion
Civ
il w
ar in
Sp
ain
Rec
essi
on
Eco
nom
y st
ill s
trug
glin
g
War
clo
uds
gat
her
War
in E
uro
pe
Fran
ce fa
lls
Pear
l Har
bo
r
War
tim
e p
rice
co
ntro
ls
Ind
ustr
y m
ob
ilize
s
Co
nsum
er g
oo
ds
sho
rtag
es
Post
-war
rec
essi
on
pre
dic
ted
Do
w to
ps
20
0 —
mar
ket “
too
hig
h”
Co
ld W
ar b
egin
s
Ber
lin b
lock
ade
Sovi
ets
det
ona
te A
-bo
mb
Ko
rean
War
Exc
ess
pro
fits
tax
U.S
. sei
zes
stee
l mill
s
Sovi
ets
det
ona
te H
-bo
mb
Do
w to
ps
30
0 —
mar
ket “
too
hig
h”
Eis
enho
wer
illn
ess
Suez
Cri
sis
Sovi
ets
laun
ch S
put
nik
Rec
essi
on
Cas
tro
sei
zes
po
wer
in C
uba
Sovi
ets
do
wn
U-2
pla
ne
Ber
lin W
all i
s er
ecte
d
Cub
an M
issi
le C
risi
s
Ken
ned
y as
sass
inat
ion
Gul
f o
f To
nkin
Civ
il ri
ght
s m
arch
es
New
ark
rio
ts
Vie
tnam
War
esc
alat
es
No
rth
Ko
rea
cap
ture
s U
SS P
ueb
lo
Mo
ney
tig
hten
s;m
arke
t fal
ls
Wag
e-p
rice
free
ze
Wat
erg
ate
Oil
emb
arg
o
Nix
on
resi
gns
U.S
. wit
hdra
ws
fro
m V
ietn
am
New
Yo
rk C
ity
thre
aten
s b
ankr
uptc
y
Ene
rgy
cris
is
Mas
sacr
es in
Cam
bo
dia
Thre
e M
ile Is
land
nucl
ear
acci
den
t
U.S
. inv
ades
Cam
bo
dia
Ab
scam
sca
ndal
rock
s C
ong
ress
Wo
rst r
eces
sio
nin
40
yea
rs
Sovi
ets
sho
ot d
ow
n K
ore
an a
irlin
er
Iran
-Ira
q w
ar
esca
late
s
U.S
. bec
om
es a
d
ebto
r na
tio
n
U.S
. bo
mb
s Li
bya
Ban
k fa
ilure
s p
eak
Iraq
inva
des
Kuw
ait
Rec
essi
on
in U
.S.;
Sovi
et U
nio
n d
isso
lves
Los
Ang
eles
rio
ts
Mid
wes
tern
U.S
. flo
od
s
Fed
rai
ses
inte
rest
rat
essi
x ti
mes
Pro
ble
ms
wit
h ju
nk b
ond
s
Tech
nolo
gy
sto
cks
stum
ble
Cha
os
in A
sian
mar
kets
Glo
bal
eco
nom
ic tu
rmo
il
Fear
s o
f Y2
K
com
put
er p
rob
lem
s
Rea
gan
and
the
po
pe
are
sho
t
Inte
rnet
bub
ble
bur
sts
Terr
ori
st a
ttac
ks in
U.S
.
Co
rpo
rate
acc
oun
ting
sc
and
als
U.S
. inv
ades
Iraq
Hur
rica
nes
dev
asta
teso
uthe
rn U
.S.
Do
w J
one
s to
ps
12
00
0 fo
r fir
st ti
me
Sub
pri
me
cred
it c
risi
s
U.S
. rec
essi
on
U.S
. une
mp
loym
ent t
op
s 1
0%
Gul
f o
f M
exic
o o
il sp
ill
Eur
op
ean
sove
reig
n d
ebt c
risi
s
U.S
. fac
es “
fisca
l clif
f”
U.S
. dra
wn
into
Syr
ian
confl
ict
Gre
ek d
ebt c
risi
s;
Chi
na g
row
th s
low
s
Year
five
of
fed
eral
go
vern
men
t’sq
uant
itat
ive
easi
ng p
olic
y
Oil
pri
ces
soar
Do
w to
ps
40
00
, the
n 5
00
0 —
mar
ket “
too
hig
h”
Averageannual totalreturn for 82 years:
+12.0%
Original investment$10,000
ICA with dividends excluded$9,787,1003
Average annualreturn: 8.8%
ICA with dividendsreinvested$107,719,5522
Average annualreturn: 12.0%
Stock market with dividends excluded$2,023,703Average annualreturn: 6.7%
Consumer Price Index (Inflation)$179,186Average annualreturn: 3.6%
Stock market with dividends reinvested$44,324,528Average annualreturn: 10.8%
Total return
Year ended Dec. 31
Capital value ($ in 000)
Dividends excluded:Value at year-end:
Total value ($ in 000)
Dividends reinvested:Value at year-end:
–38.5 –2.4 –7.4 –2.4 –11.9 –13.2 –10.7 –16.8 –17.9 –2.6+83.1 +45.8 +27.6 +0.8 +16.8 +32.8 +23.3 +36.8 +0.9 +0.4 +9.4 +19.8 +17.8 +12.2 +0.4 +56.1 +25.4 +10.8 +44.8 +14.2 +4.5 +23.1 +22.9 +16.3 +26.9 +1.0 +28.9 +17.0 +2.6 +17.0 +15.9 +35.4 +29.6 +14.7 +19.2 +21.2 +0.9 +33.8 +20.2 +6.7 +33.4 +21.7 +5.4 +13.3 +29.4 +0.7 +26.5 +27.2+7.0 +11.6 +0.2 +30.6 +19.3 +29.8 +16.6+22.9 +3.8 –4.6 +5.9+18.2% –34.7 +10.9 –1.8 +15.6 +32.4 +12.1 –1.4–14.5 +26.3 +9.8 +6.9 +15.9
357.8
14,092.3
320.4
13,171.9
406.3
10,409.0
370.8
10,338.6
318.7
7,989.3
203.8
6,685.7
174.9
5,491.9
160.4
4,117.2
147.2
3,859.7
146.1
3,212.0
115.9
2,401.1
91.3
2,380.2
70.0
1,963.3
56.0
1,647.5
49.8
1,436.4
46.4
1,474.4
52.2
840.3
49.8
1,137.7
29.9
1,231.1
28.6
1,062.7
27.3
908.0
33.4
1,024.1
25.3
884.8
22.6
990.6
18.4
846.9
15.5
657.1
12.1
650.7
10.7
512.6
9.6
440.9
9.1
358.8
8.4
413.6
8.1
336.0
7.0
321.4
6.5
281.5
6.2
194.4
5.6
220.6
5.1
199.2
4.1
158.9
3.9
101.7
3.5
101.3
3.4
90.3
3.2
76.6
2.7
63.9
2.7
58.4
2.4
58.2
1.8
57.7
1.2
59.1
1.2
43.2
1.1
35.0
1.2
26.4
1.3
22.6
.9
24.4
.5
25.0
.2
24.8
1.0
19.4
$.4
31.6
—
21.6
—
$11.8
267.5
7,049.2
374.4
15,729.4
407.2
15,753.9
450.1
20,578.7
480.1
24,560.6
510.3
31,881.2
651.8
45,682.2
584.1
39,193.5
743.4
47,435.2
804.1
45,258.6
1,319.3
70,456.8
1,466.7
45,983.8
1,264.7
58,481.1
1,272.4
64,830.6
1,345.5
63,692.5
1,707.1
73,628.5
1,548.6
97,503.5
1,939.3
109,291.9
833.3
38,709.1
864.3
48,891.6
887.4
53,674.5
1,196.3
57,361.4
1,364.6
66,504.4
53.0
2,052.2
48.7
1,969.9
64.1
1,598.8
60.7
1,652.8
54.4
1,327.4
37.3
1,200.5
33.2
1,017.9
31.7
792.0
30.3
774.5
31.6
670.6
26.4
530.9
21.7
552.2
17.3
475.7
14.4
414.4
13.3
374.3
12.8
398.1
15.9
245.5
14.3
317.7
9.7
394.7
9.6
349.7
9.4
307.4
10.6
317.9
9.0
309.6
8.3
356.6
6.9
312.5
5.9
248.0
4.7
251.6
4.3
202.3
3.9
177.8
3.8
148.2
3.6
175.4
3.6
145.6
3.2
142.9
3.0
128.0
3.0
90.9
2.7
106.3
2.6
98.5
2.1
80.8
2.1
53.4
2.0
55.3
2.0
51.2
1.9
45.2
1.7
39.4
1.8
37.7
1.7
39.3
1.3
40.7
.9
42.9
.9
32.1
.9
26.9
1.0
20.9
1.1
18.8
.8
21.5
.5
22.9
.2
23.2
1.0
18.3
$.4
31.0
—
21.6
—
$11.8
47.5
1,220.9
54.0
2,234.2
57.3
2,180.6
61.7
2,779.7
64.3
3,247.9
67.0
4,142.7
82.8
5,748.5
93.0
5,875.5
99.0
5,507.5
75.4
5,008.2
144.0
7,601.9
156.9
4,835.7
131.5
5,986.9
129.2
6,496.8
133.8
6,249.9
166.1
7,055.0
147.4
9,179.2
181.3
10,102.3
100.7
4,616.9
102.2
5,713.5
103.0
6,163.0
136.3
6,446.5
152.1
7,313.2
2007 2008 2009 2010 2011 2012 2013 2014
1,849.1
107,719.6
169.8
9,787.1
20151935 1936 1937 1938 1939 1940 1941 1942 19431934 1944 1945 1946 1947 1948 1949 1950 1951 1952 1953 1954 1955 1956 1957 1958 1959 1960 1961 1962 1963 1964 1965 1966 1967 1968 1969 1970 1971 1972 1973 1974 1975 1976 1977 1978 1979 1980 1981 1982 1983 1984 1985 1986 1987 1988 1989 1990 1991 1992 1993 1994 1995 1996 1997 1999 20001998 200620052004200320022001
8,000
10,000
20,000
40,000
60,000
80,000
100,000
200,000
400,000
600,000
800,000
1,000,000
2,000,000
4,000,000
6,000,000
30,000,000
40,000,000
50,000,000
70,000,000
100,000,000
$200,000,000
10,000,000
20,000,000
8,000,000
Average annual return:
9.9%
19361
Franklin Roosevelt
Average annual return:
9.2%
19401
Franklin Roosevelt
Average annual return:
10.6%
19441
Franklin Roosevelt
Average annual return:
12.1%
19481
HarryTruman
$10,000 investment 10 years later
Dividends reinvested during period
Average annual return:
15.8%
$43,238
19521
DwightEisenhower
Average annual return:
11.9%
$30,768
19561
DwightEisenhower
Average annual return:
10.0%
$25,951
19601
John F.Kennedy
Average annual return:
8.2%
$21,901
19641
LyndonJohnson
Average annual return:
4.8%
$15,994
19681
RichardNixon
Average annual return:
7.9%
$21,301
19721
RichardNixon
Average annual return:
16.4%
$45,486
19761
JimmyCarter
Average annual return:
17.4%
$49,623
19801
RonaldReagan
Average annual return:
14.4%
$38,400
19841
RonaldReagan
Average annual return:
15.6%
$42,624
19881
George H.W.Bush
Average annual return:
12.5%
$32,378
19921
BillClinton
Average annual return:
10.1%
$26,270
19961
BillClinton
Average annual return:
1.9%
$12,066
20001
George W.Bush
$6,128
$6,540$7,002
$6,176
$31,461$27,432
$24,145
$25,740
$3,918
$4,786$4,103
$3,947
$4,068$5,276
$8,763
$9,584 $7,214 $5,343 $3,837 $3,460 $2,217
Average annual return:
6.5%
$18,796
20041
George W.Bush
$2,578
Figures shown are past results for Class A shares and are not predictive of results in future periods. Current and future results may be lower or higher than those shown. Share prices and returns will vary, so investors may lose money. Investing for short periods makes losses more likely. Investments are not FDIC-insured, nor are they deposits of or guaranteed by a bank or any other entity. Results shown are at the 5.75% maximum sales charge for Class A shares with all distributions reinvested. For current information and month-end results, visit americanfunds.com.
The stock market is represented by Standard & Poor’s 500 Composite Index, a widely used measure of stocks issued by relatively large U.S. companies. The S&P 500 is unmanaged and, therefore, has no expenses.
1 Investment results shown are for 10-year periods beginning on January 1 of the year shown.

Value added by reinvestmentof dividends
Rec
ord
-set
ting
m
arke
t dec
line
Dep
ress
ion
Civ
il w
ar in
Sp
ain
Rec
essi
on
Eco
nom
y st
ill s
trug
glin
g
War
clo
uds
gat
her
War
in E
uro
pe
Fran
ce fa
lls
Pear
l Har
bo
r
War
tim
e p
rice
co
ntro
ls
Ind
ustr
y m
ob
ilize
s
Co
nsum
er g
oo
ds
sho
rtag
es
Post
-war
rec
essi
on
pre
dic
ted
Do
w to
ps
20
0 —
mar
ket “
too
hig
h”
Co
ld W
ar b
egin
s
Ber
lin b
lock
ade
Sovi
ets
det
ona
te A
-bo
mb
Ko
rean
War
Exc
ess
pro
fits
tax
U.S
. sei
zes
stee
l mill
s
Sovi
ets
det
ona
te H
-bo
mb
Do
w to
ps
30
0 —
mar
ket “
too
hig
h”
Eis
enho
wer
illn
ess
Suez
Cri
sis
Sovi
ets
laun
ch S
put
nik
Rec
essi
on
Cas
tro
sei
zes
po
wer
in C
uba
Sovi
ets
do
wn
U-2
pla
ne
Ber
lin W
all i
s er
ecte
d
Cub
an M
issi
le C
risi
s
Ken
ned
y as
sass
inat
ion
Gul
f o
f To
nkin
Civ
il ri
ght
s m
arch
es
New
ark
rio
ts
Vie
tnam
War
esc
alat
es
No
rth
Ko
rea
cap
ture
s U
SS P
ueb
lo
Mo
ney
tig
hten
s;m
arke
t fal
ls
Wag
e-p
rice
free
ze
Wat
erg
ate
Oil
emb
arg
o
Nix
on
resi
gns
U.S
. wit
hdra
ws
fro
m V
ietn
am
New
Yo
rk C
ity
thre
aten
s b
ankr
uptc
y
Ene
rgy
cris
is
Mas
sacr
es in
Cam
bo
dia
Thre
e M
ile Is
land
nucl
ear
acci
den
t
U.S
. inv
ades
Cam
bo
dia
Ab
scam
sca
ndal
rock
s C
ong
ress
Wo
rst r
eces
sio
nin
40
yea
rs
Sovi
ets
sho
ot d
ow
n K
ore
an a
irlin
er
Iran
-Ira
q w
ar
esca
late
s
U.S
. bec
om
es a
d
ebto
r na
tio
n
U.S
. bo
mb
s Li
bya
Ban
k fa
ilure
s p
eak
Iraq
inva
des
Kuw
ait
Rec
essi
on
in U
.S.;
Sovi
et U
nio
n d
isso
lves
Los
Ang
eles
rio
ts
Mid
wes
tern
U.S
. flo
od
s
Fed
rai
ses
inte
rest
rat
essi
x ti
mes
Pro
ble
ms
wit
h ju
nk b
ond
s
Tech
nolo
gy
sto
cks
stum
ble
Cha
os
in A
sian
mar
kets
Glo
bal
eco
nom
ic tu
rmo
il
Fear
s o
f Y2
K
com
put
er p
rob
lem
s
Rea
gan
and
the
po
pe
are
sho
t
Inte
rnet
bub
ble
bur
sts
Terr
ori
st a
ttac
ks in
U.S
.
Co
rpo
rate
acc
oun
ting
sc
and
als
U.S
. inv
ades
Iraq
Hur
rica
nes
dev
asta
teso
uthe
rn U
.S.
Do
w J
one
s to
ps
12
00
0 fo
r fir
st ti
me
Sub
pri
me
cred
it c
risi
s
U.S
. rec
essi
on
U.S
. une
mp
loym
ent t
op
s 1
0%
Gul
f o
f M
exic
o o
il sp
ill
Eur
op
ean
sove
reig
n d
ebt c
risi
s
U.S
. fac
es “
fisca
l clif
f”
U.S
. dra
wn
into
Syr
ian
confl
ict
Gre
ek d
ebt c
risi
s;
Chi
na g
row
th s
low
s
Year
five
of
fed
eral
go
vern
men
t’sq
uant
itat
ive
easi
ng p
olic
y
Oil
pri
ces
soar
Do
w to
ps
40
00
, the
n 5
00
0 —
mar
ket “
too
hig
h”
Averageannual totalreturn for 82 years:
+12.0%
Original investment$10,000
ICA with dividends excluded$9,787,1003
Average annualreturn: 8.8%
ICA with dividendsreinvested$107,719,5522
Average annualreturn: 12.0%
Stock market with dividends excluded$2,023,703Average annualreturn: 6.7%
Consumer Price Index (Inflation)$179,186Average annualreturn: 3.6%
Stock market with dividends reinvested$44,324,528Average annualreturn: 10.8%
Total return
Year ended Dec. 31
Capital value ($ in 000)
Dividends excluded:Value at year-end:
Total value ($ in 000)
Dividends reinvested:Value at year-end:
–38.5 –2.4 –7.4 –2.4 –11.9 –13.2 –10.7 –16.8 –17.9 –2.6+83.1 +45.8 +27.6 +0.8 +16.8 +32.8 +23.3 +36.8 +0.9 +0.4 +9.4 +19.8 +17.8 +12.2 +0.4 +56.1 +25.4 +10.8 +44.8 +14.2 +4.5 +23.1 +22.9 +16.3 +26.9 +1.0 +28.9 +17.0 +2.6 +17.0 +15.9 +35.4 +29.6 +14.7 +19.2 +21.2 +0.9 +33.8 +20.2 +6.7 +33.4 +21.7 +5.4 +13.3 +29.4 +0.7 +26.5 +27.2+7.0 +11.6 +0.2 +30.6 +19.3 +29.8 +16.6+22.9 +3.8 –4.6 +5.9+18.2% –34.7 +10.9 –1.8 +15.6 +32.4 +12.1 –1.4–14.5 +26.3 +9.8 +6.9 +15.9
357.8
14,092.3
320.4
13,171.9
406.3
10,409.0
370.8
10,338.6
318.7
7,989.3
203.8
6,685.7
174.9
5,491.9
160.4
4,117.2
147.2
3,859.7
146.1
3,212.0
115.9
2,401.1
91.3
2,380.2
70.0
1,963.3
56.0
1,647.5
49.8
1,436.4
46.4
1,474.4
52.2
840.3
49.8
1,137.7
29.9
1,231.1
28.6
1,062.7
27.3
908.0
33.4
1,024.1
25.3
884.8
22.6
990.6
18.4
846.9
15.5
657.1
12.1
650.7
10.7
512.6
9.6
440.9
9.1
358.8
8.4
413.6
8.1
336.0
7.0
321.4
6.5
281.5
6.2
194.4
5.6
220.6
5.1
199.2
4.1
158.9
3.9
101.7
3.5
101.3
3.4
90.3
3.2
76.6
2.7
63.9
2.7
58.4
2.4
58.2
1.8
57.7
1.2
59.1
1.2
43.2
1.1
35.0
1.2
26.4
1.3
22.6
.9
24.4
.5
25.0
.2
24.8
1.0
19.4
$.4
31.6
—
21.6
—
$11.8
267.5
7,049.2
374.4
15,729.4
407.2
15,753.9
450.1
20,578.7
480.1
24,560.6
510.3
31,881.2
651.8
45,682.2
584.1
39,193.5
743.4
47,435.2
804.1
45,258.6
1,319.3
70,456.8
1,466.7
45,983.8
1,264.7
58,481.1
1,272.4
64,830.6
1,345.5
63,692.5
1,707.1
73,628.5
1,548.6
97,503.5
1,939.3
109,291.9
833.3
38,709.1
864.3
48,891.6
887.4
53,674.5
1,196.3
57,361.4
1,364.6
66,504.4
53.0
2,052.2
48.7
1,969.9
64.1
1,598.8
60.7
1,652.8
54.4
1,327.4
37.3
1,200.5
33.2
1,017.9
31.7
792.0
30.3
774.5
31.6
670.6
26.4
530.9
21.7
552.2
17.3
475.7
14.4
414.4
13.3
374.3
12.8
398.1
15.9
245.5
14.3
317.7
9.7
394.7
9.6
349.7
9.4
307.4
10.6
317.9
9.0
309.6
8.3
356.6
6.9
312.5
5.9
248.0
4.7
251.6
4.3
202.3
3.9
177.8
3.8
148.2
3.6
175.4
3.6
145.6
3.2
142.9
3.0
128.0
3.0
90.9
2.7
106.3
2.6
98.5
2.1
80.8
2.1
53.4
2.0
55.3
2.0
51.2
1.9
45.2
1.7
39.4
1.8
37.7
1.7
39.3
1.3
40.7
.9
42.9
.9
32.1
.9
26.9
1.0
20.9
1.1
18.8
.8
21.5
.5
22.9
.2
23.2
1.0
18.3
$.4
31.0
—
21.6
—
$11.8
47.5
1,220.9
54.0
2,234.2
57.3
2,180.6
61.7
2,779.7
64.3
3,247.9
67.0
4,142.7
82.8
5,748.5
93.0
5,875.5
99.0
5,507.5
75.4
5,008.2
144.0
7,601.9
156.9
4,835.7
131.5
5,986.9
129.2
6,496.8
133.8
6,249.9
166.1
7,055.0
147.4
9,179.2
181.3
10,102.3
100.7
4,616.9
102.2
5,713.5
103.0
6,163.0
136.3
6,446.5
152.1
7,313.2
2007 2008 2009 2010 2011 2012 2013 2014
1,849.1
107,719.6
169.8
9,787.1
20151935 1936 1937 1938 1939 1940 1941 1942 19431934 1944 1945 1946 1947 1948 1949 1950 1951 1952 1953 1954 1955 1956 1957 1958 1959 1960 1961 1962 1963 1964 1965 1966 1967 1968 1969 1970 1971 1972 1973 1974 1975 1976 1977 1978 1979 1980 1981 1982 1983 1984 1985 1986 1987 1988 1989 1990 1991 1992 1993 1994 1995 1996 1997 1999 20001998 200620052004200320022001
8,000
10,000
20,000
40,000
60,000
80,000
100,000
200,000
400,000
600,000
800,000
1,000,000
2,000,000
4,000,000
6,000,000
30,000,000
40,000,000
50,000,000
70,000,000
100,000,000
$200,000,000
10,000,000
20,000,000
8,000,000
Average annual return:
9.9%
19361
Franklin Roosevelt
Average annual return:
9.2%
19401
Franklin Roosevelt
Average annual return:
10.6%
19441
Franklin Roosevelt
Average annual return:
12.1%
19481
HarryTruman
$10,000 investment 10 years later
Dividends reinvested during period
Average annual return:
15.8%
$43,238
19521
DwightEisenhower
Average annual return:
11.9%
$30,768
19561
DwightEisenhower
Average annual return:
10.0%
$25,951
19601
John F.Kennedy
Average annual return:
8.2%
$21,901
19641
LyndonJohnson
Average annual return:
4.8%
$15,994
19681
RichardNixon
Average annual return:
7.9%
$21,301
19721
RichardNixon
Average annual return:
16.4%
$45,486
19761
JimmyCarter
Average annual return:
17.4%
$49,623
19801
RonaldReagan
Average annual return:
14.4%
$38,400
19841
RonaldReagan
Average annual return:
15.6%
$42,624
19881
George H.W.Bush
Average annual return:
12.5%
$32,378
19921
BillClinton
Average annual return:
10.1%
$26,270
19961
BillClinton
Average annual return:
1.9%
$12,066
20001
George W.Bush
$6,128
$6,540$7,002
$6,176
$31,461$27,432
$24,145
$25,740
$3,918
$4,786$4,103
$3,947
$4,068$5,276
$8,763
$9,584 $7,214 $5,343 $3,837 $3,460 $2,217
Average annual return:
6.5%
$18,796
20041
George W.Bush
$2,578
2 Includes dividends of $27,595,819, and capital gain distributions of $55,802,079, reinvested in the years 1936-2015.
3 Includes reinvested capital gains of $6,525,803, but does not reflect income dividends of $3,369,476 taken in cash.

Printed on recycled paperLit. No. MFCPBR-021-0316P Litho in USA CGD/CG/10204-S52707 © 2016 American Funds Distributors, Inc.
Red, Blue and You
Beliefs about which political party is best for the markets might discourage you from investing. But as you can see from the chart below, whether the GOP or the Democrats claim the presidency historically has not been the deciding factor in how a $10,000 investment made at the beginning of an election year looked 10 years down the road.
Investors should carefully consider investment objectives, risks, charges and expenses. This and other important information is contained in the fund prospectus and summary prospectus, which can be obtained from a financial professional and should be read carefully before investing. If used after March 31, 2016, this brochure must be accompanied by a current American Funds quarterly statistical update.
Standard & Poor’s 500 Composite Index is a market capitalization-weighted index based on the results of 500 widely held common stocks. The market index is unmanaged and, therefore, has no expenses. Investors cannot invest directly in an index.
When applicable, investment results reflect fee waivers and/or expense reimbursements, without which results would have been lower. Please see americanfunds.com for more information.
Source for ICA and S&P 500 10-year returns: Thomson InvestmentView
Each 10-year period begins on January 1 of the first year shown and ends on December 31 of the final year shown. For example, the first period listed (1936–1945) covers 1/1/36 through 12/31/45.
All results for ICA shown on this page reflect payment of the maximum 5.75% sales charge for Class A shares on a hypothetical $10,000 investment. Thus, the net amount invested in each period was $9,425. The S&P 500 is unmanaged and, therefore, has no expenses. There have been periods when the fund has lagged the index.
Growth of a Hypothetical $10,000 Investment Made at the Beginning of an Election Year
’96–’05 ’00–’09’92–’01’88–’97’84–’93’80–’89’76–’85’72–’81’68–’77’64–’73’60–’69’56–’65’52–’61’48–’57’44–’53’40–’49’36–’45
$25,
740
$22,
418
$24,
145
$23,
992
$27,
432
$38,
016
$31,
461
$45,
702
$43,
238
$45,
741
$30,
768
$28,
561
$25,
951
$21,
228
$21,
901
$17,
908
$15,
994
$14,
240 $2
1,30
1$1
8,76
1
$45,
486
$38,
193
$49,
623
$50,
324
$38,
400
$40,
141
$42,
624
$52,
448
$32,
378
$33,
727
$26,
270
$23,
830
$12,
066
$9,0
90’04–’13
$18,
796
$20,
421
ICA total ending value 10 years after the start of a Republican presidency
ICA total ending value 10 years after the start of a Democratic presidency
S&P 500 total ending value

Please see important information about risks, fee waivers and expense reimbursements, beginning on page 18.
Quarterly Statistical Update
June 30, 2016
This update must be used (until superseded)with any American Funds and CollegeAmerica®
sales materials that include investment resultsfor periods ended before the date shown. As apractical matter, financial advisors shouldconsider including this update with allAmerican Funds and CollegeAmerica salesliterature. This material may be photocopied.Investment results updated monthly, and dailyshare price information, are available atamericanfunds.com.
Exchange privileges generally allowshareholders to transfer some or all of theirholdings among American Funds in the sameshare class without a sales charge.CollegeAmerica allows exchanges twice percalendar year and when the beneficiary ischanged. Class A, C and F-1 shares generallymay be exchanged into the corresponding 529share class without a sales charge, but suchexchanges from UGMA or UTMA custodialaccounts may create significant legal and taxconsequences. Exchange privileges aresubject to change or termination.
American Funds Class A shares are subject to a5.75% maximum up-front sales charge forequity funds, Retirement Income PortfolioSeries funds and most Portfolio Series funds,3.75% for most bond and tax-exempt bondfunds and American Funds Tax-AdvantagedIncome Portfolio, and 2.50% for shorter termbond funds, American Funds PreservationPortfolio and American Funds Tax-ExemptPreservation Portfolio. There is no sales chargefor the Class A money market fund. Shareclasses without an up-front sales charge arealso available. Class C shares have a 1%contingent deferred sales charge on shares
American Funds
sold within the first year of purchase andconvert to Class F-1 shares after 10 years. ClassF-1 and F-2 shares have an annual asset-basedfee charged by the sponsoring firm. Newinvestments in Class B shares are no longerallowed. For more information and investmentresults, please see americanfunds.com.
Class C shares are limited to a maximumpurchase of $500,000, and are not available tocertain employer-sponsored retirement plans.Class F-1 and F-2 shares are available onlythrough certain fee-based programs offeredby registered investment advisors. Yourfinancial advisor can help you decide whichshare class is best for you.
Class F-2 shares were introduced on August 1, 2008. Fund results prior to the date of first sale are hypothetical, based on Class A share returns without a sales charge and adjusted for typical additional expenses as described on page 18. Individual fund expenses are shown on pages 8 and 9.
CollegeAmerica, a 529 college savings plansponsored by Virginia529SM, is availablenationwide and allows federal-tax-freeearnings and withdrawals for a beneficiary’squalified higher education expenses.(Qualified withdrawals from 529 plans areexempt from federal income tax. Qualifiedwithdrawals may also be exempt from stateincome tax. Check with a tax advisor. Ifwithdrawals are used for purposes other thanhigher education, the earnings will be subjectto a 10% federal tax penalty in addition tofederal and, if applicable, state income tax.)Interests in CollegeAmerica are sold throughunaffiliated intermediaries. Depending on yourstate of residence, there may be an in-stateplan that provides tax and other benefits not
American Funds in CollegeAmerica
available through CollegeAmerica. Beforeinvesting in any state’s 529 plan, you shouldconsult your tax advisor.
CollegeAmerica features four share classes.Class 529-A, 529-C and 529-F-1 shares arestructured similarly to American Funds Class A,C and F-1 shares, respectively. Unlessotherwise indicated, 529 share class details(including sales charges and share conversion)are generally the same as the correspondingAmerican Funds share class. Class 529-Eshares are structured similarly to Class 529-F-1shares but are available only through eligibleemployer-sponsored plans. Unless otherwiseindicated, Class 529-E share details aregenerally the same as Class 529-F-1 shares.New investments in Class 529-B shares are nolonger allowed. More information andinvestment results for Class 529-B and 529-Eshares can be found on americanfunds.com.
Class 529-C shares do not convert to Class 529-F-1 shares after 10 years. Class 529-F-1 sharesare available only through certain fee-basedprograms offered by broker-dealer firms andregistered investment advisors.
CollegeAmerica investors can contribute up to$14,000 a year per beneficiary ($28,000 formarried couples) without gift-taxconsequences. With a special gift-tax election,five years’ worth of investments can beaccelerated, so investors can contribute up to$70,000 at one time ($140,000 for marriedcouples). Each beneficiary is limited to$350,000 in combined account values(including investments and earnings) of all 529plans administered by Virginia529.
Investments are not FDIC-insured, nor are they deposits of or guaranteed by a bank or any other entity, so they may lose value.Investors should carefully consider investment objectives, risks, charges and expenses. This and other important information is contained in thefund prospectuses, summary prospectuses and CollegeAmerica Program Description, which can be obtained from a financial professional andshould be read carefully before investing. CollegeAmerica is distributed by American Funds Distributors, Inc. and sold through unaffiliatedintermediaries.The return of principal for bond funds and for funds with significant underlying bond holdings is not guaranteed. Fund shares are subject to thesame interest rate, inflation and credit risks associated with the underlying bond holdings. The value of fixed-income securities may be affected bychanging interest rates and changes in credit ratings of the securities. Lower rated bonds are subject to greater fluctuations in value and risk of lossof income and principal than higher rated bonds. Investments in mortgage-related securities involve additional risks, such as prepayment risk, asmore fully described in the prospectus. While not directly correlated to changes in interest rates, the values of inflation linked bonds generallyfluctuate in response to changes in real interest rates and may experience greater losses than other debt securities with similar durations.

Please see important information about risks, fee waivers and expense reimbursements, beginning on page 18.
Figures shown are past results and are not predictive of results in future periods. Current and future results may be lower or higher than thoseshown. Share prices and returns will vary, so investors may lose money. Investing for short periods makes losses more likely.Returns shown at net asset value (NAV) have all distributions reinvested. If a sales charge had been deducted, the results would have been lower.Returns shown at maximum offering price (MOP) for Class A shares reflect deduction of the maximum sales charge of 5.75% for equity funds,Target Date funds, Retirement Income funds and most Portfolio Series funds, 3.75% for most fixed income funds and American Funds Tax-Advantaged Income Portfolio and 2.50% for American Funds Inflation Linked Bond Fund, Intermediate Bond Fund of America, Limited Term Tax-Exempt Bond Fund of America, Short-Term Bond Fund of America, American Funds Short-Term Tax-Exempt Bond Fund, American FundsPreservation Portfolio and American Funds Tax-Exempt Preservation Portfolio.For money market funds, the annualized 7-day SEC yield more accurately reflects the fund's current earnings than does the fund's return.For current expense ratios and month-end results, visit americanfunds.com.You could lose money by investing in the American Funds U.S. Government Money Market Fund. Although the fund seeks to preserve the value ofyour investment at $1.00 per share, it cannot guarantee it will do so. An investment in the fund is not insured or guaranteed by the Federal DepositInsurance Corporation or any other government agency. The fund's sponsor has no legal obligation to provide financial support to the fund, andyou should not expect that the sponsor will provide financial support to the fund at any time.
Average Annual Total Returns (%)Annualized30-day SEC
Yield atMOP (%)*
Inception Date
Max SalesCharge
(%)
ExpenseRatio (%)
(Net/Gross)
Without Sales Charge (NAV) With Maximum Sales Charge (MOP)
Returns as of 6/30/16 1 Year 5 Year 10 YearFund
Lifetime 1 Year 5 Year 10 YearFund
Lifetime
GrowthAMCAP Fund® 5/1/67 -1.35 11.54 7.72 11.35 -7.01 10.22 7.09 11.22 5.75 0.43 0.67EuroPacific Growth Fund® 4/16/84 -9.89 2.14 3.62 10.51 -15.07 0.94 3.01 10.31 5.75 1.03 0.83The Growth Fund of America® 12/1/73 0.80 11.12 6.92 13.36 -5.00 9.81 6.29 13.20 5.75 0.53 0.65The New Economy Fund® 12/1/83 -8.93 10.25 7.74 10.79 -14.16 8.95 7.10 10.59 5.75 0.33 0.78New Perspective Fund® 3/13/73 -1.88 7.70 6.68 12.04 -7.54 6.43 6.05 11.89 5.75 0.88 0.75New World Fund® 6/17/99 -6.42 0.54 5.08 7.26 -11.80 -0.64 4.46 6.88 5.75 0.75 1.04SMALLCAP World Fund® 4/30/90 -8.57 6.53 6.18 9.24 -13.83 5.27 5.55 9.00 5.75 0.00 1.07Growth and IncomeAmerican Funds Developing World Growthand Income FundSM
2/3/14 -8.39 — — -2.29 -13.67 — — -4.66 5.75 1.92 1.32
American Mutual Fund® 2/21/50 6.57 10.91 7.33 11.60 0.45 9.61 6.70 11.50 5.75 2.00 0.58Capital World Growth and Income Fund® 3/26/93 -3.39 6.19 5.35 10.28 -8.95 4.93 4.73 10.00 5.75 2.10 0.77Fundamental Investors® 8/1/78 4.35 10.76 7.28 12.29 -1.64 9.45 6.64 12.12 5.75 1.45 0.60International Growth and Income FundSM 10/1/08 -10.62 1.56 — 5.79 -15.76 0.37 — 4.98 5.75 2.36 0.91The Investment Company of America® 1/1/34 4.73 11.37 6.64 12.09 -1.30 10.06 6.02 12.01 5.75 1.75 0.58Washington Mutual Investors FundSM 7/31/52 6.22 11.44 6.94 11.78 0.12 10.13 6.31 11.68 5.75 1.82 0.58Equity IncomeCapital Income Builder® 7/30/87 3.89 6.77 5.45 9.35 -2.09 5.52 4.82 9.13 5.75 3.06 0.59The Income Fund of America® 12/1/73 5.42 8.44 6.31 11.07 -0.63 7.16 5.69 10.91 5.75 2.90 0.55BalancedAmerican Balanced Fund® 7/26/75 6.29 9.77 7.10 10.69 0.17 8.47 6.47 10.53 5.75 1.55 0.58American Funds Global Balanced FundSM 2/1/11 2.46 5.86 — 6.12 -3.42 4.61 — 4.96 5.75 1.88 0.85BondAmerican Funds Inflation Linked Bond Fund® 12/14/12 3.49 — — 0.12 0.85 — — -0.61 2.50 4.64 0.80American Funds Mortgage Fund® 11/1/10 4.12 2.88 — 2.65 0.18 2.09 — 1.96 3.75 1.90 0.70American Funds Strategic Bond FundSM 3/18/16 — — — 3.25 — — — -0.63 3.75 4.04 1.08/1.16American High-Income Trust® 2/19/88 -1.31 3.72 5.50 7.81 -4.97 2.94 5.10 7.67 3.75 6.36 0.67The Bond Fund of America® 5/28/74 5.41 3.63 3.77 7.81 1.49 2.84 3.37 7.71 3.75 1.78 0.60Capital World Bond Fund® 8/4/87 6.28 1.68 4.33 6.38 2.29 0.91 3.93 6.24 3.75 1.61 0.93Intermediate Bond Fund of America® 2/19/88 2.79 1.75 2.88 4.87 0.19 1.23 2.62 4.78 2.50 1.28 0.61Short-Term Bond Fund of America® 10/2/06 1.10 0.62 — 1.69 -1.46 0.11 — 1.42 2.50 1.10 0.60U.S. Government Securities Fund® 10/17/85 4.67 2.88 4.29 5.87 0.72 2.09 3.89 5.74 3.75 1.43 0.65Tax-Exempt BondAmerican Funds Short-Term Tax-Exempt Bond Fund® 8/7/09 1.51 1.15 — 1.44 -1.02 0.64 — 1.06 2.50 0.67 0.58American Funds Tax-Exempt Fund of New York® 11/1/10 7.76 5.37 — 4.90 3.75 4.56 — 4.20 3.75 1.41 0.67/0.72American High-Income Municipal Bond Fund® 9/26/94 9.97 8.03 5.16 5.83 5.84 7.21 4.76 5.64 3.75 2.33 0.68Limited Term Tax-Exempt Bond Fund of America® 10/6/93 3.33 2.89 3.58 4.13 0.73 2.37 3.31 4.01 2.50 0.66 0.57The Tax-Exempt Bond Fund of America® 10/3/79 7.36 5.75 4.79 6.69 3.36 4.94 4.38 6.58 3.75 1.40 0.54The Tax-Exempt Fund of California® 10/28/86 7.52 6.47 5.06 5.78 3.51 5.66 4.66 5.65 3.75 1.28 0.62Money MarketAmerican Funds U.S. Government MoneyMarket FundSM
5/1/09 0.00 0.00 — 0.00 0.00 0.00 — 0.00 — 0.00/-0.16 0.08/0.38
Class A Shares1,2,4
2
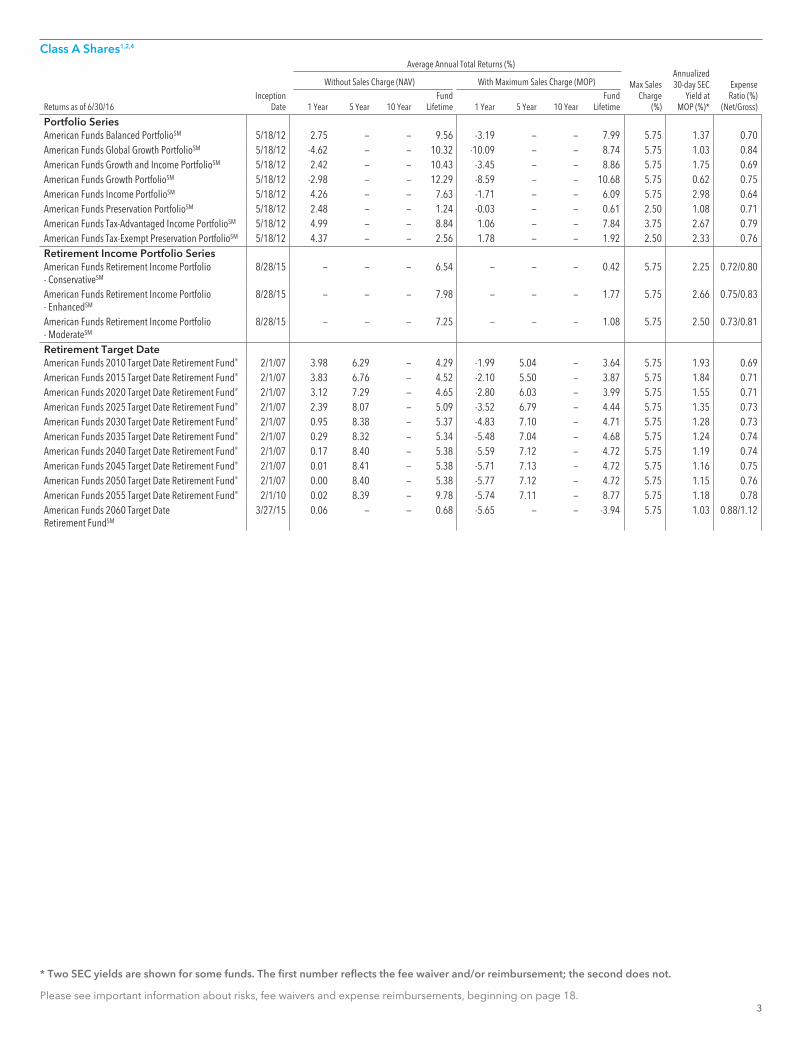
Please see important information about risks, fee waivers and expense reimbursements, beginning on page 18.
Average Annual Total Returns (%)Annualized30-day SEC
Yield atMOP (%)*
Inception Date
Max SalesCharge
(%)
ExpenseRatio (%)
(Net/Gross)
Without Sales Charge (NAV) With Maximum Sales Charge (MOP)
Returns as of 6/30/16 1 Year 5 Year 10 YearFund
Lifetime 1 Year 5 Year 10 YearFund
Lifetime
Class A Shares1,2,4
0.84American Funds Growth and Income PortfolioSM
10.32 -10.09— — — 5.75 1.03— 8.745/18/12 1.75 0.69— 10.432.42 — -3.45 8.86 5.75— —
-4.625/18/12 2.75American Funds Balanced PortfolioSM
Portfolio Series
—
—American Funds Global Growth PortfolioSM 5/18/12
-3.19 —— 9.56 — 1.37 0.707.99 5.75
American Funds Growth PortfolioSM
2.50 1.08— 0.61 0.715/18/12 2.48American Funds Preservation PortfolioSM — -0.03 —— 1.247.84 3.75— — 2.67 0.79American Funds Tax-Advantaged Income PortfolioSM 5/18/12 4.99 8.84 1.06— —
0.755.75 0.62— —5/18/12 -2.98 12.29 — 10.68-8.59 —2.98 0.646.09 5.754.26 —American Funds Income PortfolioSM 5/18/12 — — —7.63 -1.71
0.68 -5.65—
American Funds 2035 Target Date Retirement Fund® 2/1/07 — 5.340.29 8.325.75 1.28— 4.71 0.73
-5.48American Funds 2040 Target Date Retirement Fund® 8.40 —2/1/07 0.17
4.68 5.757.04 — 1.24 0.747.10
2/1/07 2.39American Funds 2025 Target Date Retirement Fund® 8.07 -3.52 6.79— 5.090.715.75 1.55
—American Funds 2030 Target Date Retirement Fund® 2/1/07 0.95 5.37 -4.838.38 —
1.35 0.734.44 5.75
5.38
American Funds 2055 Target Date Retirement Fund® 2/1/10-5.77 7.12— 5.38 — 1.15 0.764.72 5.75
0.02 0.78American Funds 2060 Target DateRetirement FundSM
9.78 -5.748.39 — 7.11 5.75 1.18— 8.778.40
0.01 8.41American Funds 2045 Target Date Retirement Fund® 2/1/07— 4.72-5.59 7.12 5.75 1.19 0.74
—2/1/07 0.00American Funds 2050 Target Date Retirement Fund®
7.13 —5.38 -5.71 4.72 0.755.75 1.16
3.99
8/28/15 —American Funds Retirement Income Portfolio- EnhancedSM
— —6.54 — 0.42 0.72/0.805.75 2.25
—
American Funds Retirement Income Portfolio- ModerateSM
8/28/15
— —— 7.98 — 2.66 0.75/0.831.77 5.75
—
— —2.56 1.78 1.92 0.762.50 2.33American Funds Tax-Exempt Preservation PortfolioSM — —5/18/12 4.37
— —American Funds Retirement Income Portfolio- ConservativeSM
8/28/15
0.06
Retirement Income Portfolio Series
—
6.76 —2/1/07 3.83 4.52 — 3.87-2.10 5.500.69
American Funds 2015 Target Date Retirement Fund® 5.753.12 7.29American Funds 2020 Target Date Retirement Fund® 2/1/07 — 6.03 —4.65 -2.80
1.84 0.711.93
0.73/0.81
3/27/15
7.25 —— — — 5.75 2.50— 1.08
Retirement Target Date— 4.293.98 6.29 -1.99 3.64 5.755.04 —American Funds 2010 Target Date Retirement Fund® 2/1/07
5.75 0.88/1.121.03— -3.94—
* Two SEC yields are shown for some funds. The first number reflects the fee waiver and/or reimbursement; the second does not.
3

Please see important information about risks, fee waivers and expense reimbursements, beginning on page 18.
Figures shown are past results and are not predictive of results in future periods. Current and future results may be lower or higher than thoseshown. Share prices and returns will vary, so investors may lose money. Investing for short periods makes losses more likely.Returns shown at net asset value (NAV) have all distributions reinvested. If a sales charge had been deducted, the results would have been lower.Class C shares reflect the deduction of a contingent deferred sales charge (1%) on shares sold within the first year of purchase.For money market funds, the annualized 7-day SEC yield more accurately reflects the fund's current earnings than does the fund's return.For current expense ratios and month-end results, visit americanfunds.com.You could lose money by investing in the American Funds U.S. Government Money Market Fund. Although the fund seeks to preserve the value ofyour investment at $1.00 per share, it cannot guarantee it will do so. An investment in the fund is not insured or guaranteed by the Federal DepositInsurance Corporation or any other government agency. The fund's sponsor has no legal obligation to provide financial support to the fund, andyou should not expect that the sponsor will provide financial support to the fund at any time.
Average Annual Total Returns (%) Annualized30-day
SEC Yieldat NAV (%)*
Inception Date
ExpenseRatio (%)
(Net/Gross)
Without CDSC With CDSC
Returns as of 6/30/16 1 Year 5 Year 10 Year Fund Lifetime 1 Year
GrowthAMCAP Fund® 5/1/67 -2.13 10.65 6.87 11.12 -3.04 -0.34 1.48EuroPacific Growth Fund® 4/16/84 -10.59 1.35 2.81 10.20 -11.47 0.32 1.62The Growth Fund of America® 12/1/73 0.00 10.24 6.08 13.11 -0.92 -0.20 1.45The New Economy Fund® 12/1/83 -9.64 9.37 6.89 10.48 -10.50 -0.46 1.59New Perspective Fund® 3/13/73 -2.68 6.85 5.82 11.79 -3.61 0.16 1.55New World Fund® 6/17/99 -7.16 -0.26 4.25 6.74 -8.09 0.04 1.84SMALLCAP World Fund® 4/30/90 -9.31 5.68 5.35 8.90 -10.15 -0.78 1.87Growth and IncomeAmerican Funds Developing World Growthand Income FundSM
2/3/14 -9.12 — — -2.99 -10.01 1.28 2.07
American Mutual Fund® 2/21/50 5.71 10.02 6.46 11.40 4.71 1.34 1.38Capital World Growth and Income Fund® 3/26/93 -4.18 5.34 4.51 9.87 -5.11 1.46 1.57Fundamental Investors® 8/1/78 3.54 9.87 6.42 12.02 2.55 0.75 1.40International Growth and Income FundSM 10/1/08 -11.35 0.75 — 4.95 -12.22 1.68 1.69The Investment Company of America® 1/1/34 3.88 10.47 5.78 11.91 2.92 1.09 1.39Washington Mutual Investors FundSM 7/31/52 5.33 10.55 6.09 11.59 4.34 1.17 1.38Equity IncomeCapital Income Builder® 7/30/87 3.06 5.93 4.60 8.99 2.06 2.47 1.38The Income Fund of America® 12/1/73 4.64 7.58 5.46 10.80 3.64 2.29 1.35BalancedAmerican Balanced Fund® 7/26/75 5.46 8.90 6.26 10.44 4.46 0.85 1.38American Funds Global Balanced FundSM 2/1/11 1.65 5.01 — 5.28 0.66 1.19 1.65BondAmerican Funds Inflation Linked Bond Fund® 12/14/12 2.80 — — -0.85 1.80 3.70 1.55American Funds Mortgage Fund® 11/1/10 3.31 2.04 — 1.84 2.31 1.16 1.50American Funds Strategic Bond FundSM 3/18/16 — — — 3.00 — 2.73 1.86/1.94American High-Income Trust® 2/19/88 -2.09 2.90 4.66 7.45 -3.01 5.81 1.47The Bond Fund of America® 5/28/74 4.58 2.82 2.95 7.56 3.58 1.07 1.40Capital World Bond Fund® 8/4/87 5.41 0.88 3.50 6.06 4.41 0.90 1.73Intermediate Bond Fund of America® 2/19/88 1.99 0.96 2.08 4.54 0.99 0.53 1.39Short-Term Bond Fund of America® 10/2/06 0.25 -0.22 — 0.86 -0.75 0.28 1.44U.S. Government Securities Fund® 10/17/85 3.90 2.07 3.48 5.58 2.90 0.72 1.42Tax-Exempt BondAmerican Funds Tax-Exempt Fund of New York® 11/1/10 6.92 4.47 — 4.02 5.92 0.55 1.50/1.56American High-Income Municipal Bond Fund® 9/26/94 9.14 7.20 4.35 5.39 8.14 1.56 1.44Limited Term Tax-Exempt Bond Fund of America® 10/6/93 2.55 2.12 2.81 3.72 1.55 -0.11 1.33The Tax-Exempt Bond Fund of America® 10/3/79 6.52 4.92 3.96 6.38 5.52 0.75 1.33The Tax-Exempt Fund of California® 10/28/86 6.68 5.64 4.23 5.41 5.68 0.48 1.40Money MarketAmerican Funds U.S. Government MoneyMarket FundSM
5/1/09 0.00 0.00 — 0.00 -1.00 0.00/-0.16 0.08/0.42
Class C Shares1,3,4
4

Please see important information about risks, fee waivers and expense reimbursements, beginning on page 18.
Average Annual Total Returns (%) Annualized30-day
SEC Yieldat NAV (%)*
Inception Date
ExpenseRatio (%)
(Net/Gross)
Without CDSC With CDSC
Returns as of 6/30/16 1 Year 5 Year 10 Year Fund Lifetime 1 Year
Class C Shares1,3,4
American Funds Growth and Income PortfolioSM
——-5.45 9.45 1.610.28-6.361.48—1.535/18/12 — 1.060.559.57
2.045/18/12American Funds Balanced PortfolioSM
American Funds 2060 Target DateRetirement FundSM
Portfolio Series
5/18/12American Funds Global Growth PortfolioSM
8.73—— 1.04 1.490.69
American Funds Growth PortfolioSM
1.430.350.855/18/12American Funds Preservation PortfolioSM 1.85 0.52——1.903.338.08 1.49American Funds Tax-Advantaged Income PortfolioSM 5/18/12 ——4.33
1.54—-3.695/18/12 — -0.15-4.6211.411.412.363.515/18/12American Funds Income PortfolioSM — 2.516.82—
—-0.743/27/15
2/1/07American Funds 2035 Target Date Retirement Fund®
4.53—7.53 -0.71 1.490.56
American Funds 2040 Target Date Retirement Fund®
—7.48-0.44 4.50 1.510.51-1.39
American Funds 2025 Target Date Retirement Fund® 7.211.602/1/070.811.293.81 1.46
0.242/1/07American Funds 2030 Target Date Retirement Fund®
0.634.25— 0.64 1.48
2/1/07
1.530.40-0.772/1/07American Funds 2050 Target Date Retirement Fund® 7.53 -1.724.53—1.560.39-1.722/1/10American Funds 2055 Target Date Retirement Fund® -0.76 8.92—7.55
American Funds 2045 Target Date Retirement Fund®
—7.53-0.68 4.53 1.510.47-1.631.527.52-0.772/1/07 — 0.41-1.724.52
8/28/15American Funds Retirement Income Portfolio- EnhancedSM
5.91—— — 1.42/1.501.44
American Funds Retirement Income Portfolio- ModerateSM
——— 7.39 1.45/1.531.83—
1.622.551.83 1.46American Funds Tax-Exempt Preservation PortfolioSM 5/18/12 ——3.55
—8/28/15American Funds Retirement Income Portfolio- ConservativeSM
Retirement Income Portfolio Series
8/28/15
2/1/07American Funds 2015 Target Date Retirement Fund® 3.02 3.69—5.921.451.26
American Funds 2020 Target Date Retirement Fund® 2/1/07 —6.442.281.451.172.04
——— 6.61 1.43/1.511.67—
3.152/1/07American Funds 2010 Target Date Retirement Fund® 5.46 2.163.47—Retirement Target Date
0.34 1.57/1.81-0.04 -1.73—
* Two SEC yields are shown for some funds. The first number reflects the fee waiver and/or reimbursement; the second does not.
5

Please see important information about risks, fee waivers and expense reimbursements, beginning on page 18.
Figures shown are past results at net asset value and are not predictive of results in future periods. Current and future results may be lower orhigher than those shown. Share prices and returns will vary, so investors may lose money. Investing for short periods makes losses more likely.For money market funds, the annualized 7-day SEC yield more accurately reflects the fund's current earnings than does the fund's return.For current expense ratios and month-end results, visit americanfunds.com.You could lose money by investing in the American Funds U.S. Government Money Market Fund. Although the fund seeks to preserve the value ofyour investment at $1.00 per share, it cannot guarantee it will do so. An investment in the fund is not insured or guaranteed by the Federal DepositInsurance Corporation or any other government agency. The fund's sponsor has no legal obligation to provide financial support to the fund, andyou should not expect that the sponsor will provide financial support to the fund at any time.
Annualized30-day
SEC Yieldat NAV (%)*
ExpenseRatio (%)
(Net/Gross)Inception Date
Average Annual Total Returns (%)
Returns as of 6/30/16 1 Year 5 Year 10 Year Fund Lifetime
GrowthAMCAP Fund® 5/1/67 -1.43 11.50 7.71 11.30 0.40 0.73EuroPacific Growth Fund® 4/16/84 -9.90 2.12 3.60 10.46 1.10 0.86The Growth Fund of America® 12/1/73 0.75 11.09 6.92 13.32 0.54 0.70The New Economy Fund® 12/1/83 -8.96 10.22 7.73 10.74 0.29 0.83New Perspective Fund® 3/13/73 -1.98 7.66 6.64 11.98 0.85 0.81New World Fund® 6/17/99 -6.37 0.57 5.10 7.23 0.90 1.02SMALLCAP World Fund® 4/30/90 -8.58 6.54 6.20 9.21 -0.01 1.07Growth and IncomeAmerican Funds Developing World Growthand Income FundSM
2/3/14 -8.33 — — -2.23 2.16 1.26
American Mutual Fund® 2/21/50 6.46 10.84 7.28 11.53 2.01 0.66Capital World Growth and Income Fund® 3/26/93 -3.45 6.15 5.33 10.23 2.20 0.81Fundamental Investors® 8/1/78 4.29 10.70 7.24 12.24 1.54 0.67International Growth and Income FundSM 10/1/08 -10.68 1.52 — 5.75 2.50 0.95The Investment Company of America® 1/1/34 4.60 11.28 6.59 12.02 1.77 0.67Washington Mutual Investors FundSM 7/31/52 6.10 11.38 6.90 11.71 1.84 0.66Equity IncomeCapital Income Builder® 7/30/87 3.80 6.72 5.40 9.28 3.16 0.65The Income Fund of America® 12/1/73 5.33 8.34 6.25 11.00 2.95 0.64BalancedAmerican Balanced Fund® 7/26/75 6.22 9.73 7.09 10.64 1.54 0.65American Funds Global Balanced FundSM 2/1/11 2.40 5.82 — 6.09 1.90 0.91BondAmerican Funds Inflation Linked Bond Fund® 12/14/12 3.47 — — -0.14 4.55 0.82American Funds Mortgage Fund® 11/1/10 4.12 2.85 — 2.62 1.98 0.71American Funds Strategic Bond FundSM 3/18/16 — — — 3.15 3.38 1.09/1.17American High-Income Trust® 2/19/88 -1.34 3.68 5.46 7.74 6.60 0.70The Bond Fund of America® 5/28/74 5.38 3.61 3.75 7.76 1.86 0.63Capital World Bond Fund® 8/4/87 6.20 1.68 4.33 6.34 1.85 0.91Intermediate Bond Fund of America® 2/19/88 2.74 1.70 2.85 4.83 1.26 0.66Short-Term Bond Fund of America® 10/2/06 0.99 0.50 — 1.60 0.95 0.73U.S. Government Securities Fund® 10/17/85 4.67 2.88 4.30 5.84 1.44 0.62Tax-Exempt BondAmerican Funds Short-Term Tax-Exempt Bond Fund® 8/7/09 1.29 0.92 — 1.23 0.39 0.80American Funds Tax-Exempt Fund of New York® 11/1/10 7.83 5.29 — 4.82 1.71 0.74/0.80American High-Income Municipal Bond Fund® 9/26/94 9.89 7.93 5.07 5.74 2.20 0.75Limited Term Tax-Exempt Bond Fund of America® 10/6/93 3.24 2.81 3.53 4.05 0.51 0.67The Tax-Exempt Bond Fund of America® 10/3/79 7.19 5.61 4.67 6.60 1.80 0.67The Tax-Exempt Fund of California® 10/28/86 7.39 6.34 4.96 5.69 1.10 0.74Money MarketAmerican Funds U.S. Government MoneyMarket FundSM
5/1/09 0.00 0.00 — 0.00 0.00/-0.68 0.08/0.70
Class F-1 Shares1,3,4
6

Please see important information about risks, fee waivers and expense reimbursements, beginning on page 18.
Annualized30-day
SEC Yieldat NAV (%)*
ExpenseRatio (%)
(Net/Gross)Inception Date
Average Annual Total Returns (%)
Returns as of 6/30/16 1 Year 5 Year 10 Year Fund Lifetime
Class F-1 Shares1,3,4
10.28—— 0.891.00-4.705/18/12American Funds Global Growth PortfolioSM
——2.38 0.751.7710.395/18/12American Funds Growth and Income PortfolioSM
Portfolio Series9.53—— 0.761.402.735/18/12American Funds Balanced PortfolioSM
—2.485/18/12 1.081.26—American Funds Preservation PortfolioSM
5.025/18/12American Funds Tax-Advantaged Income PortfolioSM 8.88——0.700.68
——-3.07 0.820.5512.235/18/12American Funds Growth PortfolioSM
—4.315/18/12 3.077.62—American Funds Income PortfolioSM
American Funds 2060 Target DateRetirement FundSM
3/27/15
2.61
0.771.340.992/1/07American Funds 2030 Target Date Retirement Fund® 5.32—8.350.771.225.292/1/07American Funds 2035 Target Date Retirement Fund® —8.290.32
0.737.263.132/1/07 1.524.60—0.761.352.302/1/07American Funds 2025 Target Date Retirement Fund® 5.04—8.02
1.135.33— 0.79American Funds 2050 Target Date Retirement Fund® 8.35-0.062/1/079.75—8.37 0.821.10-0.042/1/10American Funds 2055 Target Date Retirement Fund®
0.781.265.332/1/07American Funds 2040 Target Date Retirement Fund® —8.350.071.135.32— 0.80American Funds 2045 Target Date Retirement Fund® 8.34-0.072/1/07
0.73/0.812.106.558/28/15American Funds Retirement Income Portfolio- ConservativeSM
———
2.447.99— 0.76/0.84American Funds Retirement Income Portfolio- EnhancedSM
——8/28/15
4.305/18/12American Funds Tax-Exempt Preservation PortfolioSM 2.59——0.76
Retirement Income Portfolio Series0.732.37
2/1/07American Funds 2015 Target Date Retirement Fund®
4.26—6.27 0.711.97
American Funds 2020 Target Date Retirement Fund®
—6.703.81 0.721.894.463.99
2.307.26— 0.74/0.82American Funds Retirement Income Portfolio- ModerateSM
——8/28/15
2/1/07American Funds 2010 Target Date Retirement Fund®
Retirement Target Date
0.83 0.85/1.091.76— —0.14
* Two SEC yields are shown for some funds. The first number reflects the fee waiver and/or reimbursement; the second does not.
7

Please see important information about risks, fee waivers and expense reimbursements, beginning on page 18.
Figures shown are past results at net asset value and are not predictive of results in future periods. Current and future results may be lower orhigher than those shown. Share prices and returns will vary, so investors may lose money. Investing for short periods makes losses more likely.For money market funds, the annualized 7-day SEC yield more accurately reflects the fund's current earnings than does the fund's return.For current expense ratios and month-end results, visit americanfunds.com.You could lose money by investing in the American Funds U.S. Government Money Market Fund. Although the fund seeks to preserve the value ofyour investment at $1.00 per share, it cannot guarantee it will do so. An investment in the fund is not insured or guaranteed by the Federal DepositInsurance Corporation or any other government agency. The fund's sponsor has no legal obligation to provide financial support to the fund, andyou should not expect that the sponsor will provide financial support to the fund at any time.
Annualized30-day
SEC Yieldat NAV (%)*
ExpenseRatio (%)
(Net/Gross)Inception Date
Average Annual Total Returns (%)
Returns as of 6/30/16 1 Year 5 Year 10 Year Fund Lifetime
GrowthAMCAP Fund® 5/1/67 -1.16 11.78 7.97 11.58 0.65 0.47EuroPacific Growth Fund® 4/16/84 -9.67 2.40 3.87 10.74 1.29 0.60The Growth Fund of America® 12/1/73 1.03 11.39 7.18 13.61 0.79 0.43The New Economy Fund® 12/1/83 -8.72 10.53 8.01 11.04 0.58 0.57New Perspective Fund® 3/13/73 -1.68 7.96 6.92 12.26 1.13 0.55New World Fund® 6/17/99 -6.12 0.84 5.37 7.53 1.13 0.76SMALLCAP World Fund® 4/30/90 -8.32 6.83 6.48 9.51 0.28 0.82Growth and IncomeAmerican Funds Developing World Growthand Income FundSM
2/3/14 -8.17 — — -1.99 2.35 1.00
American Mutual Fund® 2/21/50 6.77 11.11 7.53 11.77 2.26 0.41Capital World Growth and Income Fund® 3/26/93 -3.19 6.45 5.60 10.51 2.42 0.54Fundamental Investors® 8/1/78 4.56 10.99 7.51 12.51 1.70 0.41International Growth and Income FundSM 10/1/08 -10.43 1.78 — 6.02 2.71 0.69The Investment Company of America® 1/1/34 4.92 11.60 6.86 12.27 1.99 0.41Washington Mutual Investors FundSM 7/31/52 6.39 11.66 7.16 11.98 2.09 0.41Equity IncomeCapital Income Builder® 7/30/87 4.10 6.99 5.65 9.54 3.44 0.40The Income Fund of America® 12/1/73 5.65 8.62 6.50 11.25 3.22 0.38BalancedAmerican Balanced Fund® 7/26/75 6.51 10.00 7.33 10.92 1.82 0.39American Funds Global Balanced FundSM 2/1/11 2.66 6.08 — 6.35 2.18 0.65BondAmerican Funds Inflation Linked Bond Fund® 12/14/12 3.81 — — 0.13 4.68 0.55American Funds Mortgage Fund® 11/1/10 4.50 3.13 — 2.90 2.23 0.42American Funds Strategic Bond FundSM 3/18/16 — — — 3.27 3.57 0.79/0.87American High-Income Trust® 2/19/88 -1.07 3.95 5.72 8.04 6.84 0.45The Bond Fund of America® 5/28/74 5.67 3.89 4.01 8.05 2.08 0.37Capital World Bond Fund® 8/4/87 6.62 1.97 4.61 6.67 1.80 0.65Intermediate Bond Fund of America® 2/19/88 3.03 1.99 3.14 5.13 1.49 0.39Short-Term Bond Fund of America® 10/2/06 1.25 0.78 — 1.87 1.19 0.45U.S. Government Securities Fund® 10/17/85 4.94 3.13 4.55 6.17 1.71 0.38Tax-Exempt BondAmerican Funds Short-Term Tax-Exempt Bond Fund® 8/7/09 1.54 1.19 — 1.49 0.64 0.55American Funds Tax-Exempt Fund of New York® 11/1/10 7.91 5.46 — 5.00 1.42 0.56/0.61American High-Income Municipal Bond Fund® 9/26/94 10.17 8.21 5.34 6.02 2.49 0.49Limited Term Tax-Exempt Bond Fund of America® 10/6/93 3.50 3.07 3.77 4.32 0.77 0.41The Tax-Exempt Bond Fund of America® 10/3/79 7.50 5.89 4.94 6.83 1.47/1.46 0.41The Tax-Exempt Fund of California® 10/28/86 7.66 6.61 5.21 5.92 1.35 0.49Money MarketAmerican Funds U.S. Government MoneyMarket FundSM
5/1/09 0.00 0.00 — 0.00 0.00/-0.37 0.08/0.44
Class F-2 Shares1,3,4
8

Please see important information about risks, fee waivers and expense reimbursements, beginning on page 18.
Annualized30-day
SEC Yieldat NAV (%)*
ExpenseRatio (%)
(Net/Gross)Inception Date
Average Annual Total Returns (%)
Returns as of 6/30/16 1 Year 5 Year 10 Year Fund Lifetime
Class F-2 Shares1,3,4
10.55—— 0.631.27-4.495/18/12American Funds Global Growth PortfolioSM
——2.62 0.502.0410.685/18/12American Funds Growth and Income PortfolioSM
Portfolio Series9.81—— 0.511.673.055/18/12American Funds Balanced PortfolioSM
—2.745/18/12 1.321.50—American Funds Preservation PortfolioSM
5.365/18/12American Funds Tax-Advantaged Income PortfolioSM 9.16——0.450.44
——-2.80 0.560.8312.525/18/12American Funds Growth PortfolioSM
—4.585/18/12 3.377.89—American Funds Income PortfolioSM
American Funds 2060 Target DateRetirement FundSM
3/27/15
2.89
0.511.551.282/1/07American Funds 2030 Target Date Retirement Fund® 5.59—8.620.521.525.562/1/07American Funds 2035 Target Date Retirement Fund® —8.560.58
0.477.533.422/1/07 1.824.87—0.491.642.642/1/07American Funds 2025 Target Date Retirement Fund® 5.30—8.30
1.385.59— 0.53American Funds 2050 Target Date Retirement Fund® 8.620.272/1/0710.01—8.62 0.581.350.212/1/10American Funds 2055 Target Date Retirement Fund®
0.521.455.592/1/07American Funds 2040 Target Date Retirement Fund® —8.620.351.405.58— 0.55American Funds 2045 Target Date Retirement Fund® 8.610.232/1/07
0.48/0.562.316.798/28/15American Funds Retirement Income Portfolio- ConservativeSM
———
2.788.22— 0.51/0.59American Funds Retirement Income Portfolio- EnhancedSM
——8/28/15
4.675/18/12American Funds Tax-Exempt Preservation PortfolioSM 2.85——0.51
Retirement Income Portfolio Series0.482.61
2/1/07American Funds 2015 Target Date Retirement Fund®
4.52—6.53 0.462.32
American Funds 2020 Target Date Retirement Fund®
—6.994.14 0.462.174.744.18
2.537.47— 0.49/0.57American Funds Retirement Income Portfolio- ModerateSM
——8/28/15
2/1/07American Funds 2010 Target Date Retirement Fund®
Retirement Target Date
0.95 0.61/0.851.44— —0.30
* Two SEC yields are shown for some funds. The first number reflects the fee waiver and/or reimbursement; the second does not.
9

Please see important information about risks, fee waivers and expense reimbursements, beginning on page 18.
Figures shown are past results and are not predictive of results in future periods. Current and future results may be lower or higher than thoseshown. Share prices and returns will vary, so investors may lose money. Investing for short periods makes losses more likely.Returns shown at net asset value (NAV) have all distributions reinvested. If a sales charge had been deducted, the results would have been lower.Returns shown at maximum offering price (MOP) for Class 529-A shares reflect deduction of the maximum sales charge of 5.75% for equity funds and most Portfolio Series funds, 4.25% for most College Target Date funds, 3.75% for most fixed income funds and 2.50% for American Funds Inflation Linked Bond Fund, Intermediate Bond Fund of America, Short-Term Bond Fund of America, American Funds Preservation Portfolio and College Enrollment Fund.For money market funds, the annualized 7-day SEC yield more accurately reflects the fund's current earnings than does the fund's return.For current expense ratios and month-end results, visit americanfunds.com.You could lose money by investing in the American Funds U.S. Government Money Market Fund. Although the fund seeks to preserve the value ofyour investment at $1.00 per share, it cannot guarantee it will do so. An investment in the fund is not insured or guaranteed by the Federal DepositInsurance Corporation or any other government agency. The fund's sponsor has no legal obligation to provide financial support to the fund, andyou should not expect that the sponsor will provide financial support to the fund at any time.
Average Annual Total Returns (%)Annualized30-day SEC
Yield atMOP (%)*
Inception Date
Max SalesCharge
(%)
ExpenseRatio (%)
(Net/Gross)
Without Sales Charge (NAV) With Maximum Sales Charge (MOP)
Returns as of 6/30/16 1 Year 5 Year 10 YearFund
Lifetime 1 Year 5 Year 10 YearFund
Lifetime
GrowthAMCAP Fund® 5/1/67 -1.44 11.43 7.65 11.25 -7.10 10.12 7.01 11.11 5.75 0.33 0.77EuroPacific Growth Fund® 4/16/84 -9.94 2.09 3.57 10.42 -15.10 0.89 2.96 10.22 5.75 0.95 0.90The Growth Fund of America® 12/1/73 0.70 11.02 6.86 13.26 -5.10 9.72 6.22 13.10 5.75 0.44 0.73The New Economy Fund® 12/1/83 -9.00 10.17 7.68 10.70 -14.22 8.87 7.05 10.50 5.75 0.24 0.86New Perspective Fund® 3/13/73 -1.99 7.61 6.59 11.94 -7.62 6.34 5.96 11.78 5.75 0.78 0.84New World Fund® 6/17/99 -6.48 0.48 5.03 7.20 -11.85 -0.70 4.41 6.83 5.75 0.69 1.11SMALLCAP World Fund® 4/30/90 -8.65 6.45 6.13 9.17 -13.90 5.20 5.50 8.92 5.75 -0.09 1.15Growth and IncomeAmerican Funds Developing World Growthand Income FundSM
2/3/14 -8.35 — — -2.27 -13.64 — — -4.65 5.75 1.90 1.38
American Mutual Fund® 2/21/50 6.46 10.80 7.24 11.49 0.32 9.50 6.60 11.39 5.75 1.90 0.68Capital World Growth and Income Fund® 3/26/93 -3.49 6.10 5.28 10.19 -9.04 4.84 4.66 9.91 5.75 2.01 0.86Fundamental Investors® 8/1/78 4.27 10.65 7.20 12.19 -1.73 9.35 6.57 12.01 5.75 1.35 0.70International Growth and Income FundSM 10/1/08 -10.71 1.49 — 5.72 -15.84 0.29 — 4.91 5.75 2.27 0.97The Investment Company of America® 1/1/34 4.59 11.25 6.54 11.97 -1.42 9.94 5.92 11.89 5.75 1.65 0.69Washington Mutual Investors FundSM 7/31/52 6.10 11.34 6.85 11.67 0.00 10.03 6.22 11.56 5.75 1.73 0.68Equity IncomeCapital Income Builder® 7/30/87 3.79 6.68 5.36 9.24 -2.18 5.42 4.74 9.02 5.75 2.97 0.68The Income Fund of America® 12/1/73 5.32 8.33 6.22 10.95 -0.73 7.05 5.59 10.80 5.75 2.80 0.65BalancedAmerican Balanced Fund® 7/26/75 6.20 9.67 7.03 10.59 0.08 8.38 6.39 10.43 5.75 1.44 0.68American Funds Global Balanced FundSM 2/1/11 2.42 5.79 — 6.05 -3.47 4.54 — 4.89 5.75 1.77 0.93BondAmerican Funds Inflation Linked Bond Fund® 12/14/12 3.65 — — -0.16 1.06 — — -0.87 2.50 4.36 0.93American Funds Mortgage Fund® 11/1/10 4.15 2.79 — 2.57 0.21 2.00 — 1.88 3.75 1.77 0.79American Funds Strategic Bond FundSM 3/18/16 — — — 3.13 — — — -0.74 3.75 3.16 1.23/1.31American High-Income Trust® 2/19/88 -1.40 3.63 5.42 7.71 -5.06 2.85 5.02 7.56 3.75 6.26 0.76The Bond Fund of America® 5/28/74 5.31 3.54 3.69 7.71 1.39 2.75 3.29 7.61 3.75 1.67 0.70Capital World Bond Fund® 8/4/87 6.21 1.60 4.26 6.30 2.24 0.83 3.86 6.16 3.75 1.51 1.02Intermediate Bond Fund of America® 2/19/88 2.69 1.66 2.80 4.78 0.10 1.14 2.54 4.68 2.50 1.16 0.70Short-Term Bond Fund of America® 10/2/06 1.04 0.56 — 1.62 -1.48 0.05 — 1.35 2.50 1.01 0.66U.S. Government Securities Fund® 10/17/85 4.58 2.79 4.22 5.78 0.64 2.01 3.82 5.65 3.75 1.35 0.72Money MarketAmerican Funds U.S. Government MoneyMarket FundSM
5/1/09 0.00 0.00 — 0.00 0.00 0.00 — 0.00 — 0.00/-0.25 0.08/0.50
CollegeAmerica Class 529-A Shares1,2,3,4
10

Please see important information about risks, fee waivers and expense reimbursements, beginning on page 18.
Average Annual Total Returns (%)Annualized30-day SEC
Yield atMOP (%)*
Inception Date
Max SalesCharge
(%)
ExpenseRatio (%)
(Net/Gross)
Without Sales Charge (NAV) With Maximum Sales Charge (MOP)
Returns as of 6/30/16 1 Year 5 Year 10 YearFund
Lifetime 1 Year 5 Year 10 YearFund
Lifetime
CollegeAmerica Class 529-A Shares1,2,3,4
1.03
7.92—— 5.75 0.801.312.685/18/12American Funds Balanced PortfolioSM — -3.269.48——-4.755/18/12 — —-10.2210.26American Funds Global Growth PortfolioSM
Portfolio Series
— -0.17
——-0.61 5.57 0.761.624.259/14/12American Funds College 2024 Fund® 3.78 6.77——2.519/14/12American Funds College 2027 Fund® — -1.817.60—
American Funds College 2021 Fund® 9/14/12 ——4.260.741.190.71—-0.145.74 — 1.554.254.55
——-0.93 -0.58 ——-5.103/27/15American Funds College 2033 FundSM
2.449/14/12American Funds College Enrollment Fund®
1.404.25-3.92 0.85/0.88American Funds College 2030 Fund®
6.38—— 4.25 0.781.484.257.04— 1.37 0.79—1.149/14/12 — —-3.188.26
12.23—— -8.53 10.63——-2.985/18/12American Funds Growth PortfolioSM
American Funds Income PortfolioSM —4.155/18/120.820.525.75
5/18/12American Funds Growth and Income PortfolioSM
5.758.69— 0.95 0.901.655.758.78 0.78——2.34 10.35 ——-3.53
College Target Date
—
0.77
-1.044.56— — 4.253.38—American Funds College 2018 Fund® —3.369/14/12
0.752.88-1.817.55— — 5.756.01——0.011.20 — 1.052.500.57American Funds Preservation PortfolioSM 5/18/12 ——2.52
2.50 0.780.94—— 0.34
* Two SEC yields are shown for some funds. The first number reflects the fee waiver and/or reimbursement; the second does not.
11

Please see important information about risks, fee waivers and expense reimbursements, beginning on page 18.
Figures shown are past results and are not predictive of results in future periods. Current and future results may be lower or higher than thoseshown. Share prices and returns will vary, so investors may lose money. Investing for short periods makes losses more likely.Returns shown at net asset value (NAV) have all distributions reinvested. If a sales charge had been deducted, the results would have been lower.Class 529-C shares reflect the deduction of a contingent deferred sales charge (1%) on shares sold within the first year of purchase.For money market funds, the annualized 7-day SEC yield more accurately reflects the fund's current earnings than does the fund's return.For current expense ratios and month-end results, visit americanfunds.com.You could lose money by investing in the American Funds U.S. Government Money Market Fund. Although the fund seeks to preserve the value ofyour investment at $1.00 per share, it cannot guarantee it will do so. An investment in the fund is not insured or guaranteed by the Federal DepositInsurance Corporation or any other government agency. The fund's sponsor has no legal obligation to provide financial support to the fund, andyou should not expect that the sponsor will provide financial support to the fund at any time.
Average Annual Total Returns (%) Annualized30-day
SEC Yieldat NAV (%)*
Inception Date
ExpenseRatio (%)
(Net/Gross)
Without CDSC With CDSC
Returns as of 6/30/16 1 Year 5 Year 10 Year Fund Lifetime 1 Year
GrowthAMCAP Fund® 5/1/67 -2.20 10.57 6.79 10.35 -3.10 -0.36 1.55EuroPacific Growth Fund® 4/16/84 -10.66 1.28 2.74 9.53 -11.53 0.30 1.68The Growth Fund of America® 12/1/73 -0.07 10.16 6.01 12.35 -0.99 -0.23 1.51The New Economy Fund® 12/1/83 -9.74 9.29 6.80 9.80 -10.59 -0.48 1.66New Perspective Fund® 3/13/73 -2.77 6.77 5.76 11.04 -3.69 0.14 1.62New World Fund® 6/17/99 -7.23 -0.32 4.18 6.32 -8.15 0.03 1.90SMALLCAP World Fund® 4/30/90 -9.34 5.61 5.28 8.28 -10.19 -0.79 1.93Growth and IncomeAmerican Funds Developing World Growthand Income FundSM
2/3/14 -9.15 — — -3.03 -10.05 1.21 2.14
American Mutual Fund® 2/21/50 5.63 9.94 6.39 10.61 4.63 1.31 1.46Capital World Growth and Income Fund® 3/26/93 -4.23 5.27 4.44 9.31 -5.16 1.42 1.64Fundamental Investors® 8/1/78 3.45 9.79 6.34 11.30 2.46 0.72 1.48International Growth and Income FundSM 10/1/08 -11.44 0.67 — 4.87 -12.31 1.65 1.77The Investment Company of America® 1/1/34 3.79 10.39 5.71 11.09 2.83 1.07 1.46Washington Mutual Investors FundSM 7/31/52 5.29 10.48 6.02 10.79 4.29 1.14 1.45Equity IncomeCapital Income Builder® 7/30/87 2.98 5.85 4.53 8.37 1.98 2.43 1.46The Income Fund of America® 12/1/73 4.52 7.50 5.39 10.08 3.52 2.25 1.42BalancedAmerican Balanced Fund® 7/26/75 5.39 8.83 6.19 9.72 4.39 0.81 1.45American Funds Global Balanced FundSM 2/1/11 1.58 4.93 — 5.20 0.59 1.13 1.73BondAmerican Funds Inflation Linked Bond Fund® 12/14/12 2.63 — — -0.94 1.63 3.62 1.64American Funds Mortgage Fund® 11/1/10 3.24 1.97 — 1.77 2.24 1.09 1.57American Funds Strategic Bond FundSM 3/18/16 — — — 3.02 — 2.67 1.93/2.01American High-Income Trust® 2/19/88 -2.15 2.83 4.59 6.84 -3.08 5.82 1.53The Bond Fund of America® 5/28/74 4.51 2.75 2.89 6.85 3.51 1.06 1.46Capital World Bond Fund® 8/4/87 5.38 0.81 3.43 5.45 4.38 0.88 1.79Intermediate Bond Fund of America® 2/19/88 1.93 0.89 2.01 3.95 0.93 0.55 1.46Short-Term Bond Fund of America® 10/2/06 0.14 -0.30 — 0.78 -0.86 0.26 1.52U.S. Government Securities Fund® 10/17/85 3.79 2.01 3.41 4.93 2.79 0.74 1.47Money MarketAmerican Funds U.S. Government MoneyMarket FundSM
5/1/09 0.00 0.00 — 0.00 -1.00 0.00/-0.25 0.08/0.50
CollegeAmerica Class 529-C Shares1,3,4
12

Please see important information about risks, fee waivers and expense reimbursements, beginning on page 18.
Average Annual Total Returns (%) Annualized30-day
SEC Yieldat NAV (%)*
Inception Date
ExpenseRatio (%)
(Net/Gross)
Without CDSC With CDSC
Returns as of 6/30/16 1 Year 5 Year 10 Year Fund Lifetime 1 Year
CollegeAmerica Class 529-C Shares1,3,4
1.67
1.915/18/12 — 8.62—American Funds Balanced PortfolioSM 0.925/18/12American Funds Global Growth PortfolioSM
1.580.60
9/14/12
Portfolio Series
—
-5.52
2.949/14/12 — 5.95—American Funds College 2024 Fund® 1.969/14/12American Funds College 2027 Fund®
1.550.93
1.623.77 0.50 1.51American Funds College 2021 Fund® 0.862.45 1.503.459/14/12 — 4.92—
1.67
American Funds College 2033 FundSM 3/27/15 —-1.73 — -2.71-1.30 0.73 1.64/1.67
1.58—— 6.75 0.780.697.39— -0.69 1.610.67American Funds College 2030 Fund® 9/14/12 —0.28
American Funds Growth PortfolioSM 5/18/12 —-3.84 — -4.7711.30 -0.24 1.64
1.70—— 9.36 0.19-6.439.49— 0.59 1.570.97American Funds Growth and Income PortfolioSM 5/18/12 —1.57
American Funds Income PortfolioSM
College Target Date
American Funds College Enrollment Fund®
1.520.29
9/14/12American Funds College 2018 Fund® 2.61 ——
2.322.39 1.503.395/18/12 — 6.73——1.64 — 0.640.425/18/12American Funds Preservation PortfolioSM
0.19 1.530.27— 0.67
* Two SEC yields are shown for some funds. The first number reflects the fee waiver and/or reimbursement; the second does not.
13

Please see important information about risks, fee waivers and expense reimbursements, beginning on page 18.
Figures shown are past results at net asset value and are not predictive of results in future periods. Current and future results may be lower orhigher than those shown. Share prices and returns will vary, so investors may lose money. Investing for short periods makes losses more likely.For money market funds, the annualized 7-day SEC yield more accurately reflects the fund's current earnings than does the fund's return.For current expense ratios and month-end results, visit americanfunds.com.You could lose money by investing in the American Funds U.S. Government Money Market Fund. Although the fund seeks to preserve the value ofyour investment at $1.00 per share, it cannot guarantee it will do so. An investment in the fund is not insured or guaranteed by the Federal DepositInsurance Corporation or any other government agency. The fund's sponsor has no legal obligation to provide financial support to the fund, andyou should not expect that the sponsor will provide financial support to the fund at any time.
Annualized30-day
SEC Yieldat NAV (%)*
ExpenseRatio (%)
(Net/Gross)Inception Date
Average Annual Total Returns (%)
Returns as of 6/30/16 1 Year 5 Year 10 Year Fund Lifetime
GrowthAMCAP Fund® 5/1/67 -1.28 11.67 7.86 11.26 0.57 0.56EuroPacific Growth Fund® 4/16/84 -9.77 2.30 3.78 10.46 1.23 0.69The Growth Fund of America® 12/1/73 0.91 11.26 7.08 13.28 0.69 0.51The New Economy Fund® 12/1/83 -8.81 10.38 7.89 10.73 0.45 0.66New Perspective Fund® 3/13/73 -1.79 7.84 6.82 11.96 1.05 0.63New World Fund® 6/17/99 -6.29 0.68 5.23 7.31 0.93 0.90SMALLCAP World Fund® 4/30/90 -8.46 6.68 6.34 9.22 0.12 0.93Growth and IncomeAmerican Funds Developing World Growthand Income FundSM
2/3/14 -8.22 — — -2.10 2.16 1.12
American Mutual Fund® 2/21/50 6.71 11.04 7.46 11.48 2.23 0.46Capital World Growth and Income Fund® 3/26/93 -3.28 6.33 5.50 10.27 2.35 0.64Fundamental Investors® 8/1/78 4.49 10.89 7.42 12.22 1.65 0.48International Growth and Income FundSM 10/1/08 -10.55 1.69 — 5.93 2.61 0.77The Investment Company of America® 1/1/34 4.83 11.50 6.78 11.96 1.97 0.47Washington Mutual Investors FundSM 7/31/52 6.33 11.59 7.09 11.67 2.05 0.46Equity IncomeCapital Income Builder® 7/30/87 4.01 6.91 5.59 9.30 3.37 0.46The Income Fund of America® 12/1/73 5.56 8.57 6.45 10.98 3.19 0.42BalancedAmerican Balanced Fund® 7/26/75 6.45 9.91 7.26 10.61 1.75 0.46American Funds Global Balanced FundSM 2/1/11 2.59 5.99 — 6.26 2.10 0.72BondAmerican Funds Inflation Linked Bond Fund® 12/14/12 3.64 — — 0.04 4.59 0.64American Funds Mortgage Fund® 11/1/10 4.24 2.99 — 2.76 2.09 0.57American Funds Strategic Bond FundSM 3/18/16 — — — 3.16 3.65 0.94/1.02American High-Income Trust® 2/19/88 -1.18 3.85 5.64 7.77 6.72 0.54The Bond Fund of America® 5/28/74 5.55 3.77 3.92 7.73 1.96 0.47Capital World Bond Fund® 8/4/87 6.43 1.82 4.48 6.34 1.79 0.79Intermediate Bond Fund of America® 2/19/88 2.93 1.89 3.03 4.84 1.42 0.47Short-Term Bond Fund of America® 10/2/06 1.18 0.70 — 1.79 1.16 0.53U.S. Government Securities Fund® 10/17/85 4.82 3.02 4.44 5.83 1.61 0.49Money MarketAmerican Funds U.S. Government MoneyMarket FundSM
5/1/09 0.00 0.00 — 0.00 0.00/-0.25 0.08/0.50
CollegeAmerica Class 529-F-1 Shares1,3,4
14

Please see important information about risks, fee waivers and expense reimbursements, beginning on page 18.
Annualized30-day
SEC Yieldat NAV (%)*
ExpenseRatio (%)
(Net/Gross)Inception Date
Average Annual Total Returns (%)
Returns as of 6/30/16 1 Year 5 Year 10 Year Fund Lifetime
CollegeAmerica Class 529-F-1 Shares1,3,4
American Funds College Enrollment Fund®
2.895/18/12 ——American Funds Balanced PortfolioSM
American Funds Global Growth PortfolioSM
1.589.71 0.58Portfolio Series
9/14/12
5/18/12
9/14/12American Funds College 2024 Fund® —3.97 7.00— 0.551.90
0.51—— 1.474.805.97— 0.501.83—American Funds College 2021 Fund® 4.569/14/12
American Funds College 2027 Fund®
3/27/15American Funds College 2033 FundSM
0.611.650.64/0.671.71—-0.64 -0.27—
0.581.767.822.769/14/12 ———1.27 8.45—9/14/12American Funds College 2030 Fund®
American Funds Growth PortfolioSM -2.855/18/120.570.63—— 0.7412.42
0.701.17—-4.50 10.46——— 1.9410.582.545/18/12American Funds Growth and Income PortfolioSM
1.251.43 0.52
American Funds College 2018 Fund® 3.589/14/12College Target Date
3.267.80 0.50—5/18/12American Funds Income PortfolioSM —4.502.765/18/12 ——American Funds Preservation PortfolioSM
1.28 0.531.16—2.71 —
* Two SEC yields are shown for some funds. The first number reflects the fee waiver and/or reimbursement; the second does not.
15

Please see important information about risks, fee waivers and expense reimbursements, beginning on page 18.
Rankings shown are based on total returns for Class A shares at net asset value. Rankings do not reflect the effects of sales charges.
Lipper Category 1 Year 5 Year 10 Year
GrowthAMCAP Fund® Growth 1258 of 2921 295 of 2193 295 of 1401EuroPacific Growth Fund® International 719 of 1484 318 of 1064 94 of 627The Growth Fund of America® Large-Cap Growth 186 of 679 170 of 548 254 of 395The New Economy Fund® Growth 2661 of 2921 806 of 2193 288 of 1401New Perspective Fund® Global 302 of 962 74 of 592 16 of 317New World Fund® Emerging Markets 149 of 821 28 of 408 26 of 167SMALLCAP World Fund® Global Small-/Mid-Cap 72 of 126 28 of 85 10 of 57Growth and IncomeAmerican Funds Developing World Growthand Income FundSM
Emerging Markets 250 of 821 — —
American Mutual Fund® Growth & Income 51 of 2447 200 of 1551 101 of 830Capital World Growth and Income Fund® Global 433 of 962 216 of 592 78 of 317Fundamental Investors® Growth & Income 173 of 2447 229 of 1551 109 of 830International Growth and Income FundSM International 866 of 1484 452 of 1064 —The Investment Company of America® Growth & Income 142 of 2447 138 of 1551 207 of 830Washington Mutual Investors FundSM Growth & Income 65 of 2447 128 of 1551 152 of 830Equity IncomeCapital Income Builder® Global Equity Income Funds 40 of 163 13 of 84 3 of 37The Income Fund of America® Income (Mixed Equity) 30 of 590 8 of 461 10 of 279BalancedAmerican Balanced Fund® Balanced 9 of 635 5 of 535 17 of 393American Funds Global Balanced FundSM Flexible Portfolio 195 of 1248 286 of 773 —BondAmerican Funds Inflation Linked Bond Fund® Inflation Protected Bond 79 of 245 — —American Funds Mortgage Fund® Intermediate U.S. Government 37 of 65 17 of 61 —American Funds Strategic Bond FundSM Multi-Sector Income — — —American High-Income Trust® High Yield 482 of 667 361 of 441 217 of 295The Bond Fund of America® Core Bond 179 of 503 194 of 399 246 of 293Capital World Bond Fund® Global Income 54 of 210 82 of 141 44 of 78Intermediate Bond Fund of America® Short-Intermediate Investment-Grade
Debt66 of 188 79 of 112 69 of 87
Short-Term Bond Fund of America® Short U.S. Government 27 of 82 35 of 74 —U.S. Government Securities Fund® General U.S. Government 37 of 101 28 of 93 27 of 74Tax-Exempt BondAmerican Funds Short-Term Tax-Exempt Bond Fund® Short Municipal Debt 36 of 108 40 of 84 —American Funds Tax-Exempt Fund of New York® New York Municipal Debt 62 of 97 35 of 85 —American High-Income Municipal Bond Fund® High-Yield Municipal Debt 78 of 155 28 of 111 16 of 67Limited Term Tax-Exempt Bond Fund of America® Short-Intermediate Municipal Debt 27 of 65 13 of 54 5 of 39The Tax-Exempt Bond Fund of America® General & Insured Municipal Debt 152 of 266 93 of 211 58 of 158The Tax-Exempt Fund of California® California Municipal Debt 101 of 126 55 of 108 37 of 86
American Funds Lipper Rankings as of 6/30/16
16

Please see important information about risks, fee waivers and expense reimbursements, beginning on page 18.
Rankings shown are based on Class A share results at net asset value. Morningstar rankings do not reflect the effects of sales charges, account feesor taxes.
1 Year 5 Year 10 Year
Rankings as of 6/30/16 Morningstar CategoryInception Date Rank
Funds inCategory
PeerGroup
Percentile RankFunds inCategory
PeerGroup
Percentile RankFunds inCategory
PeerGroup
Percentile
GrowthAMCAP Fund® Large Growth 5/1/67 661 1627 41 236 1289 19 344 931 37EuroPacific Growth Fund® Foreign Large Growth 4/16/84 237 355 67 151 275 55 59 189 31The Growth Fund of America® Large Growth 12/1/73 343 1627 21 333 1289 26 545 931 58The New Economy Fund® Large Growth 12/1/83 1522 1627 93 609 1289 47 336 931 36New Perspective Fund® World Stock 3/13/73 317 1131 28 87 731 12 18 409 5New World Fund® Diversified Emerging Mkts 6/17/99 156 856 18 20 416 5 24 186 13SMALLCAP World Fund® World Stock 4/30/90 876 1131 77 211 731 29 42 409 10Growth and IncomeAmerican Funds Developing World Growthand Income FundSM
Diversified Emerging Mkts 2/3/14 273 856 32 — — — — — —
American Mutual Fund® Large Value 2/21/50 156 1368 12 177 1030 17 87 756 12Capital World Growth and Income Fund® World Stock 3/26/93 443 1131 39 250 731 34 106 409 26Fundamental Investors® Large Blend 8/1/78 189 1523 13 515 1206 43 198 895 22International Growth and Income FundSM Foreign Large Blend 10/1/08 468 823 57 234 631 37 — — —The Investment Company of America® Large Blend 1/1/34 162 1523 11 311 1206 26 417 895 47Washington Mutual Investors FundSM Large Value 7/31/52 173 1368 13 109 1030 11 138 756 18Equity IncomeCapital Income Builder® World Allocation 7/30/87 23 552 4 11 362 3 37 176 21The Income Fund of America® Allocation--70% to 85%
Equity12/1/73 23 451 5 25 310 8 10 234 4
BalancedAmerican Balanced Fund® Allocation--50% to 70%
Equity7/26/75 26 895 3 13 704 2 30 479 7
American Funds Global Balanced FundSM World Allocation 2/1/11 55 552 10 43 362 12 — — —BondAmerican Funds Inflation Linked Bond Fund® Inflation-Protected Bond 12/14/12 84 249 34 — — — — — —American Funds Mortgage Fund® Intermediate Government 11/1/10 118 309 38 80 285 28 — — —American Funds Strategic Bond FundSM Multisector Bond 3/18/16 — — — — — — — — —American High-Income Trust® High Yield Bond 2/19/88 551 775 71 437 529 82 273 371 73The Bond Fund of America® Intermediate-Term Bond 5/28/74 297 1061 28 439 836 52 519 603 86Capital World Bond Fund® World Bond 8/4/87 131 364 36 118 253 47 79 152 52Intermediate Bond Fund of America® Short-Term Bond 2/19/88 51 571 9 154 405 38 147 284 52Short-Term Bond Fund of America® Short-Term Bond 10/2/06 403 571 70 362 405 89 — — —U.S. Government Securities Fund® Intermediate Government 10/17/85 58 309 19 78 285 27 109 218 50Tax-Exempt BondAmerican Funds Short-Term Tax-Exempt Bond Fund® Muni National Short 8/7/09 128 214 60 120 175 68 — — —American Funds Tax-Exempt Fund of New York® Muni New York Long 11/1/10 57 91 62 34 79 42 — — —American High-Income Municipal Bond Fund® High Yield Muni 9/26/94 101 200 50 40 146 27 22 95 23Limited Term Tax-Exempt Bond Fund of America® Muni National Short 10/6/93 40 214 19 12 175 7 8 115 7The Tax-Exempt Bond Fund of America® Muni National Interm 10/3/79 80 333 24 36 266 14 22 177 12The Tax-Exempt Fund of California® Muni California
Intermediate10/28/86 17 78 21 11 72 14 3 57 4
American Funds Morningstar Rankings5
17

State-specific tax-exempt funds are more susceptible to factors adversely affecting issuers of their states' tax-exempt securities than more widelydiversified municipal bond funds. Income from municipal bonds may be subject to state or local income taxes and/or the federal alternativeminimum tax (except for The Tax-Exempt Bond Fund of America). Certain other income, as well as capital gain distributions, may be taxable.Investment allocations for funds of funds may not achieve fund objectives. There are expenses associated with the underlying funds in addition tofund-of-funds expenses. The funds' risks are directly related to the risks of the underlying funds, as described herein. Each target date fund iscomposed of a mix of American Funds and is subject to the risks and returns of the underlying funds. Underlying funds may be added or removedduring the year. Although the target date funds are managed for investors on a projected retirement date time frame, the fund's allocation strategydoes not guarantee that investors' retirement goals will be met. The target date is the year in which an investor is assumed to retire and begin takingwithdrawals. American Funds investment professionals actively manage the target date fund's portfolio, moving it from a more growth-orientedstrategy to a more income-oriented focus as the fund gets closer to its target date. Investment professionals continue to manage each fund for 30years after it reaches its target date. The target allocations are as of January 1, 2016 and are subject to the Portfolio Oversight Committee'sdiscretion. The funds’ investment adviser anticipates that the funds will invest their assets within a range that deviates no more than 10% above orbelow these allocations. Investment professionals gradually adjust the portfolio over time so that it becomes more preservation-oriented. The funds'allocation strategy does not guarantee that investors' education savings goals will be met. The target date is the year in which the beneficiary isexpected to begin taking withdrawals. Investors and their advisors should periodically evaluate their investment to determine whether it continues tomeet their needs. The Retirement Income Portfolio Series investment allocations may not achieve fund objectives and adequate income throughretirement is not guaranteed. There are expenses associated with the underlying funds in addition to fund-of-funds expenses. The funds’ risks aredirectly related to the risks of the underlying funds. Payments consisting of return of capital will result in a decrease in an investor’s fund sharebalance. Higher rates of withdrawal and withdrawals during declining markets may result in a more rapid decrease in an investor’s fund sharebalance. Persistent returns of capital could ultimately result in a zero account balance.Investing outside the United States involves risks, such as currency fluctuations, periods of illiquidity and price volatility, as more fully described in the prospectus. These risks may be heightened in connection with investments in developing countries. Diversification does not eliminate the risks of investing; losses are possible in diversified portfolios. Small-company stocks entail additional risks, and they can fluctuate in price more than larger company stocks.
The use of derivatives involves a variety of risks, which may be different from, or greater than, the risks associated with investing in traditional cashsecurities, such as stocks and bonds. American Funds Strategic Bond Fund may engage in frequent and active trading of its portfolio securities,which may involve correspondingly greater transaction costs, adversely affecting the fund's results.Fund shares of U.S. Government Securities Fund are not guaranteed by the U.S. government.Although American Funds U.S. Government Money Market Fund has 12b-1 plans for some share classes, the fund is currently suspending certain 12 b-1 payments in this low interest rate environment. Should payments commence, the fund’s investment results will be lower and expenses will be higher. American Funds U.S. Government Money Market Fund Class A is the only share class in the American Funds offering check-writing privileges. It is also the only share class that can be exchanged into certain other share classes of other American Funds.
Investment results assume all distributions are reinvested and reflect applicable fees and expenses. Lifetime returns for less than one year are notannualized, but calculated as cumulative total returns.For the following funds, the investment adviser is currently reimbursing a portion of the funds' fees or expenses, without which the results wouldhave been lower and net expense ratios higher. - American Funds U.S. Government Money Market Fund is currently reimbursing a portion of the fund's fees and expenses. Please see the FinancialHighlights table in the fund's most recent prospectus for details. - American Funds Tax-Exempt Fund of New York is currently reimbursing a portion of its expenses through at least September 30, 2016. - American Funds Strategic Bond Fund is currently reimbursing a portion of other expenses through at least March 1, 2017. - American Funds Retirement Income Portfolio Series funds are currently reimbursing a portion of other expenses for each share class through atleast January 1, 2017. - American Funds 2060 Target Date Retirement Fund is currently reimbursing a portion of other expenses for each share class through at leastJanuary 1, 2017. - American Funds College 2033 Fund is currently reimbursing a portion of other expenses through at least January 1, 2017. Per the terms for each specific fund and subject to fund board approval, the investment adviser may elect to extend, modify or terminate the waiverand/or reimbursement. Please see each fund's most recent prospectus for details. When applicable, investment results reflect fee waivers and/orexpense reimbursements, without which results would have been lower. For more information on fee waivers and expense reimbursements, visitamericanfunds.com.1 The Tax-Exempt Money Fund of America (inception date: October 24, 1989) converted to American Funds Short-Term Tax-Exempt Bond Fund on
August 7, 2009. Investment results shown do not include the fund's results for the period it operated as The Tax-Exempt Money Fund of America.Results that reflect the operation of the fund as a money market fund prior to its conversion can be found in American Funds Short-Term Tax-Exempt Bond Fund's prospectus.
2 For Intermediate Bond Fund of America and Limited Term Tax-Exempt Bond Fund of America, the maximum initial sales charge was 3.75% from 1/10/2000 to 10/31/2006. For bond funds, the maximum initial sales charge was 4.75% prior to 1/10/2000.
3 Class C and F-1 shares were first offered on March 15, 2001; Class F-2 shares were first offered on August 1, 2008; Class 529-A and 529-C shareswere first offered on February 15, 2002; Class 529 F-1 shares were first offered on September 9, 2002. Class C, F-1, F-2, 529-A, 529-C and 529-F-1share results prior to the date of first sale are hypothetical based on Class A share results without a sales charge, with Class C, F-1, 529-A, 529-Cand 529-F-1 results adjusted for estimated additional annual expenses and Class F-2 results adjusted for typical estimated expenses. Results forcertain funds with an inception date after March 15, 2001 for Class C and F-1; after August 1, 2008 for Class F-2; after February 15, 2002 for Class529-A and 529-C; and after September 9, 2002 for 529-F-1 also include hypothetical returns because those funds' Class C, F-1, F2, 529-A, 529-Cand 529-F-1 shares sold after the funds' date of first offering. Class C shares convert to Class F-1 shares after 10 years. Please seeamericanfunds.com for more information on specific expense adjustments and the actual dates of first sale.
4 Expense ratios are as of the most recent prospectus available at the time of publication. Expense ratios are estimated for Inflation Linked BondFund (529 share classes), Strategic Bond Fund, American Funds 2060 Target Date Retirement Fund, American Funds Retirement Income Portfolio— Conservative, American Funds Retirement Income Portfolio — Moderate and American Funds Retirement Income Portfolio — Enhanced. Expenseratios for funds of funds include the weighted average expenses of the underlying funds.
5 Rankings are based on the funds' average annual total returns (Class A shares at net asset value) within the applicable Morningstar categories. TheMorningstar rankings do not reflect the effects of sales charges, account fees or taxes. Past results are not predictive of results in future periods.When applicable, investment results reflect fee waivers and/or expense reimbursements, without which results would have been lower. Please seeamericanfunds.com for more information.
18

This page intentionally left blank.
19

This page intentionally left blank.
20 Lit.N
o.M
FGEQ
S-00
5-07
16P
Lith
o in
USA
MO
D/R
RD
/629
6 ©
201
6 A
mer
ican
Fun
ds
Dis
trib
uto
rs, I
nc.
R P
rint
ed o
n re
cycl
ed p
aper