affordable energy-efficient new housing solutions
TRANSCRIPT

PNNL-21275
Prepared for the U.S. Department of Energy under Contract DE-AC05-76RL01830
Affordable Energy-Efficient New Housing Solutions Program Manager: M Baechler Authors: Pacific Northwest National Laboratory: S. Chandra, SH Widder, R Bartlett Florida Solar Energy Center: J McIlvaine, D Chasar, D Beal, K Sutherland, K Abbott Florida HERO: K Fonorow Washington State University: K Eklund, M Lubliner, E Salzberg Northwest Energy Works: B Peeks, T Hewes Gas Technology Institute: D Kosar May 2012


PNNL-21275
Affordable Energy-Efficient New Housing Solutions
Program Manager: M Baechler1
S Chandra1 J McIlvaine2
SH Widder1 D Chasar
2
R Bartlett1 D Beal
2
K Sutherland2
K Abbott2
K Fonorow3
K Eklund4
M Lubliner4
E Salzberg4
B Peeks4
T Hewes5
D Kosar5
May 2012
Prepared for
the U.S. Department of Energy
under Contract DE-AC05-76RL01830
Pacific Northwest National Laboratory
Richland, Washington 99352
1 Pacific Northwest National Laboratory, Richland, WA
2 FSEC, a research institute of the University of Central Florida, Cocoa, FL
3 Florida Home Energy and Resources Organization (Florida HERO), Newberry, FL
4 Northwest Energy Works, Corvallis, OR
5 Gas Technology Institute, Des Plaines, IL


iii
Summary
Since 2010, the U.S. Department of Energy’s Building America Program has sponsored research at
PNNL to investigate cost-effective, energy-saving home-building technologies and to demonstrate how
high-performance homes can deliver lower utility bills, increased comfort, and improved indoor air
quality, while maintaining accessibility for low-income homeowners. PNNL and its contractors have
been investigating 1) cost-effective whole-house solutions for Habitat for Humanity International (HFHI)
and specific HFH affiliates in hot-humid and marine climates; 2) cost-effective energy-efficiency
improvements for heating, ventilation, and air-conditioning (HVAC) systems in new, stick-built and
manufactured homes; and 3) energy-efficient domestic hot-water systems in military housing in the
marine climate.
Whole-House Solutions for Habitat for Humanity
To date, our research shows that energy-efficient homes can be built cost-effectively using volunteer
labor in the hot-humid and marine climates using relatively simple measures. Simple design and
construction changes included improved air sealing measures; increased thermal performance of the
building envelope; more efficient lighting, HVAC, and hot water heating equipment; and more efficient
ventilation. These measures reduced installation costs, and delivered savings in the form of reduced
utility bills to the homeowner.
For example, in one case simple changes made to the HFH affiliate’s previous typical house design
resulted in reported costs of $1,640 for the 1,100-ft2 home, for an annual mortgage increase (30 years at
7%) of $82/year. Projected annual energy savings amounted to $291, based on $0.13 per kWh electricity
costs. The net positive yearly cash flow to the homeowner was $209. The HERS rating decreased from
83 (about as efficient as the 2009 International Energy Conservation Code) to 66 as a result of the
recommended efficiency improvements.
In another case, the energy-efficiency measures already being included as part of the affiliate’s
standard building practice, were shown to be cost-effective and resulted in positive monthly cash flow
when financed at a zero percent interest rate, 30-year loan (available to all HFH partner families).
Modeling results for evaluated, future measures indicate positive monthly cash flow and up to 36%
savings in energy consumption in comparison to the affiliate’s standard package.
HVAC Systems Research
Research evaluating the use of cost-effective, energy-efficient HVAC systems to achieve affordable
high-performance homes shows that ductless heat pumps are 2.3 to 2.6 times as energy-efficient as
electric resistance wall heaters. They can provide adequate heating and cooling with minimal use of
supplemental heating in secondary zones and should also be considered as an important load-reducing
measure.
The research also shows the effectiveness of the single return and transoms duct design method at
achieving adequate temperature and relative humidity distribution to maintain comfort in high-
performance homes, while reducing the costs of installing ducts in conditioned space. Transom duct

iv
design can also be achieved for reduced cost, compared to the fully-ducted return method of installing
ducts in conditioned space, with no negative homeowner responses related to comfort or aesthetic aspects.
Installing all duct work in conditioned space can also be an important energy-saving measure,
because it limits air leakage and heat transfer through the ducts. This research explored a cost-effective
strategy for installing ducts in conditioned space using over-the-door transoms instead of a fully ducted
return design to save $1.14/ft2, while achieving comparable air distribution and humidity control. The
transom duct design also appears to significantly reduce duct leakage and is expected to result in a more
energy-efficient duct design due to reduced duct runs.
Domestic Hot Water Systems
Energy consumed by domestic hot-water use—the next greatest contributor to whole-house energy
consumption after HVAC systems—can be reduced by using tankless on-demand hot-water heaters,
depending on the volume of daily water use. Researchers evaluating two new housing developments at
Joint Base Lewis McChord found the tankless hot-water heaters contributed to a 22% savings in baseload
natural gas consumption.

v
Acknowledgments
The authors acknowledge the guidance and support of David Lee, Terry Logee, Eric Werling, Sam
Rashkin, and Chris Early of the U.S. Department of Energy Building Technologies Program in
sponsoring this work and providing helpful feedback.
The team is most appreciative of the builders and Habitat for Humanity affiliates who are choosing to
implement high-performance home construction practices and were willing to work with Building
America researchers to document and improve their techniques. This work would not be possible without
these motivated individuals and organizations who are passionate about pursuing energy efficiency in the
new home market.
The team appreciates the encouragement and guidance from Michael Baechler, Senior Program
Manager for this project at PNNL.
Finally, this report is compiled in honor and memory of Subrato Chandra. This research would not
have been possible without his vision, motivation, guidance, and individual effort. Subrato devoted most
of his professional life to the pursuit of energy-efficient residential housing and this report summarizes
some of his final work.

vii
Acronyms and Abbreviations
ºF degrees Fahrenheit
ACCA Air Conditioning Contractors of America
ACH air changes per hour
AHAM Association of Home Appliance Manufacturers
ANSI American National Standards Institute
BOP Builder Option Package
BR return of the room with the highest heat gains/losses
BTP Building Technologies Program
CFM cubic feet per minute
CSA Canadian Standards Association
DD desiccant dehumidifier
DHP Ductless heat pump
DOE U.S. Department of Energy
DX direct expansion
DX&DD direct expansion and desiccant dehumidifier
EF Energy Factor
FDR Fully ducted return
Florida HERO Home Energy and Resources Organization
FSEC Florida Solar Energy Center
ft foot(feet)
ft2 square foot(feet)
gpd gallon(s) per day
GTI Gas Technology Institute
HERS Home Energy Rating System
HFH Habitat for Humanity
HFHI Habitat for Humanity International
HOBO temperature and relative humidity data logger
HRV heat recovery ventilator
HSPF Heating Seasonal Performance Factor
HVAC heating, ventilating, and air-conditioning
IECC International Energy Conservation Code
in. inch(es)
JBLM Joint Base Lewis McChord
kWh kilowatt-hour
L liters
MBR master bedroom return

viii
Main RA main return air
NEW Northwest Energy Works, Inc.
Pa pascals
PNNL Pacific Northwest National Laboratory
SEER Seasonal Energy Efficiency Ratio
SHGC Solar Heat Gain Coefficient
SRT Single return with transom
U*A heat loss coefficient
WSU Washington State University Energy Program
XPS extruded polystyrene
yr year(s)

ix
Contents
Summary ........................................................................................................................................... iii
Acknowledgments ............................................................................................................................... v
Acronyms and Abbreviations ...........................................................................................................vii
1.0 Introduction ............................................................................................................................. 1.1
1.1 Purpose and Scope .......................................................................................................... 1.1
1.2 Report Contents and Organization .................................................................................. 1.2
2.0 Cost-Effective Whole-House Solutions for Habitat for Humanity Affiliates .......................... 2.1
2.1 Lake-Sumter Counties ..................................................................................................... 2.2
2.1.1 Lessons Learned ................................................................................................... 2.3
2.1.2 Results .................................................................................................................. 2.3
2.2 Hillsborough County, Florida (FSEC) ............................................................................ 2.3
2.2.1 Lessons Learned ................................................................................................... 2.4
2.2.2 Results .................................................................................................................. 2.4
2.3 Palm Beach County (FSEC) ............................................................................................ 2.5
2.3.1 Lessons Learned ................................................................................................... 2.5
2.3.2 Results .................................................................................................................. 2.6
2.4 Seattle/South King County .............................................................................................. 2.6
2.4.1 Existing Measures Evaluated ............................................................................... 2.6
2.4.2 Analysis Results ................................................................................................... 2.9
2.4.3 Lessons Learned ................................................................................................. 2.11
2.4.4 Results ................................................................................................................ 2.12
2.5 Conclusions ................................................................................................................... 2.12
3.0 Energy-Efficient and Cost-Effective HVAC Systems for High-Performance Homes ............ 3.1
3.1 Field Monitoring of Ductless Heat Pump Performance versus Electric Resistance in
High-Performance Manufactured Housing ..................................................................... 3.1
3.2 Cost-Effective Ducts in Conditioned Space .................................................................... 3.6
3.3 High-Performance Supplemental Dehumidification Systems ....................................... 3.13
3.4 Conclusions ................................................................................................................... 3.16
4.0 Energy-Efficient Domestic Hot-Water Systems ...................................................................... 4.1
5.0 References ............................................................................................................................... 5.1

x
Figures
Figure 2.1. Photo of Rigid Foam Board Installed on the Exterior of the Wall Assembly .............. 2.9
Figure 3.1. ... Home Individual Heating Performance and Portland Site Heating Performance Factor.
Individual home performance is calculated as the total internal heating loads over the
average daily temperature difference between indoors and outdoors. The Heating
Performance Factor is a ratio of the two homes’ individual performance. ............................ 3.4
Figure 3.2. Portland Site Hourly Zone Temperatures and Outdoor Temperatures ......................... 3.4
Figure 3.3. Cloverdale Site Hourly Zone Temperatures and Outdoor Temperatures ..................... 3.5
Figure 3.4. Portland Site Space and Water Heating Time of Day Consumption Profile ................ 3.6
Figure 3.5. Cloverdale Site Space and Water Heating Time of Day Consumption Profile ............ 3.6
Figure 3.6. ........ Temperature and Relative Humidity Distributions for a Home with a Single Return
Transom for the Months of March to September 2011 ....................................................... 3.11
Figure 3.7. ............ Temperature and Relative Humidity Distributions for a Home with Fully Ducted
Returns for the Months of March to September 2011 .......................................................... 3.11
Figure 3.8. Average Monthly Temperature (lines) and Relative Humidity (dots) in Fully Ducted
Return (blue) and Single Return Transom (red) Homes for the Months of March 2011 to
September 2011 .................................................................................................................... 3.12
Figure 3.9. Integrated Vapor Compression and Condenser Waste Heat Regenerated Desiccant
Dehumidifier (Source: Munters 2011) ................................................................................ 3.13
Figure 3.10. DX&DD System Temperature and Relative Humidity Test Points (Source: Kosar
2012) .................................................................................................................................... 3.14
Figure 3.11. ........... Efficiency of Moisture Removal of Munters DryCool Dehumidifier in DX&DD
Mode as a Function of Air Inlet Temperature (process air refers to the incoming air to be
dehumidified and regeneration air refers to the air heated by the condenser used to
regenerate the desiccant; Kosar 2012) ................................................................................. 3.15
Tables
Table 2.1. Features of the Lake-Sumter Habitat for Humanity House ........................................... 2.2
Table 2.2. Lake-Sumter Habitat for Humanity Comparison of Energy-Efficiency Measures ........ 2.2
Table 2.3. Features of the Hillsborough Habitat for Humanity House ........................................... 2.3
Table 2.4. Hillsborough Habitat for Humanity Comparison of Energy-Efficiency Measures ........ 2.4
Table 2.5. Features of the Palm Beach Habitat for Humanity House ............................................. 2.5
Table 2.6. Palm Beach Habitat for Humanity Comparison of Energy Efficiency Measures .......... 2.5
Table 2.7. Seattle/South King County Habitat for Humanity Current Typical Design Features .... 2.7
Table 2.8. Comparison of Actual to Modeled Estimate, kWh/yr .................................................. 2.10
Table 2.9. Percent Deviation of Modeled Energy Use from Actual Utility Bills ......................... 2.10
Table 2.10. Estimated Annual Energy Use, Monthly Energy Use and Savings by Package ........ 2.11
Table 3.1. Home Thermal Characteristics ...................................................................................... 3.2

xi
Table 3.2. Mean Temperature and Energy Consumption Parameters over Monitoring Period
(November 2010 through May 2011)..................................................................................... 3.3
Table 3.3. Summary of House Characteristics ................................................................................ 3.9
Table 3.4. Manufacturer and Curve Fit Model Dehumidification Capacity Comparison ............. 3.15
Table 4.1. Hot-Water Utility Billing Analysis in Discovery Village and Miller Hill ..................... 4.2

1.1
1.0 Introduction
The residential sector accounts for 21% of the annual energy used in the United States (EIA 2011)
and the average homeowner spends $1,767.00 on his or her annual utility bill (DOE 2010). Homebuyers
are increasingly concerned about rising energy costs and the impact of fossil fuels as a major source of
greenhouse gases (DOE 2010). High-performance homes can deliver lower utility bills, as well as
increased comfort and improved indoor air quality. However, these improvements may result in an
increased capital cost when constructing high-performance homes. To make high-quality, energy-
efficient homes accessible to everyone, including members of low-income communities who will benefit
most from the decreased utility bills associated with efficient housing, high-performance housing must
also be affordable. Since 2010, the U.S. Department of Energy’s Building America has sponsored
research at Pacific Northwest National Laboratory (PNNL) to investigate cost-effective, energy-saving
home-building technologies and to demonstrate how high-performance homes can deliver lower utility
bills, increased comfort, and improved indoor air quality, while maintaining or enhancing affordability for
low-income homeowners.
1.1 Purpose and Scope
To investigate and demonstrate cost-effective high-performance housing, PNNL researchers
partnered with Washington State University Energy Program (WSU) in the Pacific Northwest and the
Florida Solar Energy Center (FSEC) in the Southeast to provide technical assistance to Habitat for
Humanity (HFH) affiliates that are building high-performance prototypes in Washington and Florida.
WSU partnered with the Seattle/South King County HFH affiliate in Washington State to evaluate the
cost-effectiveness of existing new construction practices and potential future practices. FSEC worked
with HFH affiliates located in Florida striving to reach Builders Challenge, a certification program
established by DOE’s Building America Program for high-performance new home builders, or
participating in HFH’s nationwide Partners in Sustainable Building program to complete 11 new homes
with Home Energy Rating System (HERS) ratings of less than 70. Through this work, PNNL and its
research partners are helping to make high-performance housing achieve lower utility bills for low-
income families across the nation.
In addition to energy savings, high-performance homes are healthy and comfortable through tight
building envelopes and efficient, well-designed HVAC systems. PNNL worked with Northwest Energy
Works (NEW), Florida Home Energy and Resources Organization (Florida HERO), and the Gas
Technologies Institute (GTI), to evaluate cost-effective energy-efficiency improvements for HVAC
systems in new, stick-built and manufactured homes. This included research examining the installation of
high-performance ductless heat pumps to dramatically reduce heating and cooling energy consumption in
manufactured homes, investigating new cost-effective methods for installing ducts in conditioned space in
new housing construction, and evaluating new direct expansion and desiccant-based dehumidification
technology.
The research program also explored energy-efficient domestic hot-water heaters at Joint Base Lewis
McChord. Specifically, WSU evaluated natural gas usage at two new housing developments, one that has
tankless water heaters installed, to verify the actual energy savings achieved by these systems compared
to gas tanked water heaters.

1.2
1.2 Report Contents and Organization
This report summarizes findings of research on cost-effective high-performance whole-house
solutions and HVAC/domestic hot-water systems conducted with American Reinvestment and Recovery
Act funding in 2010 and 2011. The ensuing sections present a summary of the research conducted with
HFH affiliates and by the PNNL team on high-performance HVAC and domestic hot-water systems,
including research methods, lessons learned, and next steps. More detailed descriptions of each
individual research project are found in individual publications reporting on the specific accomplishments
of the research (McIlvaine et al. 2012; Salzberg et al. 2012; Hewes and Peeks 2012; Kosar 2012; and
Lubliner 2012).
This report is designed to provide a summary of research results to U.S. Department of Energy (DOE)
Building Technologies Program staff, program managers, and other interested parties. The report focuses
primarily on the efforts of the PNNL team in the marine and hot-humid climates. Conclusions are
described within the sections for each study. Summary conclusions are provided for each chapter.
2.1
2.0 Cost-Effective Whole-House Solutions for Habitat for Humanity Affiliates
Habitat for Humanity International was founded in 1976 with a goal to build decent, affordable
houses and eliminate poverty housing. Since then, it has built more than 500,000 houses worldwide,
sheltering over 2.5 million people. HFHI operates at the community level through more than 1,500
affiliates in the United States and over 550 internationally. Each affiliate is an independently run,
nonprofit organization that coordinates all aspects of home building in its community, from fund raising
to mortgage servicing.
Through volunteer labor, as well as monetary and material donations, HFH builds and rehabilitates
houses with homeowner partner families. The homes are not given to the partner families; they must
provide hundreds of hours of “sweat equity” to build their own homes and to help build other homes as
well. Homes are sold to the families at no profit with affordable loans, and a down payment and monthly
mortgage payments are required.
Homeowners are responsible for their own utility bills which can prove difficult to cover if too high.
The overall research goal was to determine what measures could be undertaken with volunteer labor that
were cost-effective and could save on utility bills.
In the hot-humid climate, the FSEC provided technical assistance to HFH of Lake-Sumter Counties in
rural North-Central Florida, HFH of Hillsborough County in Tampa, Florida, and HFH of Palm Beach
County, located in West Palm Beach, Florida. FSEC recruited partners interested in building to the
standards established by the DOE Building America Program under its Builders Challenge. After
recruitment, FSEC 1) provided introductory training on key concepts and performance targets (duct
leakage, detailing, etc.), 2) conducted detailed energy analysis of two or three of the partner’s own
projects, 3) conducted a thorough audit of current building techniques and generated a HERS rating, and
4) proposed a package that met the Builders Challenge criteria and provided a projected HERS rating for
a home based on the proposed new package. Technical assistance was provided as the selected package
of improvements was implemented. After a midpoint inspection, training and contractor assistance were
provided as needed. Final testing and energy ratings were then conducted. FSEC worked with 3 partners
on 11 houses. FSEC calculated costs using material costs provided by the partners. All houses were all-
electric, and electric costs were assumed to be $0.13/kilowatt-hour. Mortgage costs were based on a 30-
year, 7% mortgage.
In the marine climate of Seattle, Washington, WSU worked with HFH of Seattle/South King County
to evaluate the cost-effectiveness of measures currently used by the affiliate on 23 homes in two
developments over a 3-year time period. HFH of Seattle/South King County used this analysis to
evaluate the cost-effectiveness of three possible future measures. To determine the cost-effectiveness of
the current measures, energy usage data were obtained and evaluated for seven all-electric homes. The
energy-efficiency measures already implemented were analyzed using modeling software, including
BEopt and REM/Rate, and then indexed to the actual usage data available from the seven-home sample.
For each of the four county affiliates (three in Florida and one in Washington), the following sections
briefly describe the design features of the HFH homes, compare the energy-efficiency components of
2.2
each, list lessons learned and research results, and note where to find more detailed information about the
related research.
2.1 Lake-Sumter Counties
HFH of Lake-Sumter counties was founded in 1989 and serves two counties, Lake and Sumter, in
rural north-central Florida. It has built over 180 affordable homes ranging in size from a 900-ft2 two
bedroom, one bath home to a four bedroom, two bath, 1,300-ft2 home. The project time period covered
the fall/winter of 2010 to the spring of 2011. During that period, six high-performance houses were built
by the affiliate. Two of the homes did not include a thermal bypass inspection, a requirement for
participating in this project, but the other four qualified to participate.
Of the four homes that qualified, two met Builders Challenge criteria and two met the enhanced
ENERGY STAR 2.5 criteria, incorporating all Builders Challenge Quality Criteria (BCQC), excluding
the documentation requirements of BCQC #1 and 2 – energy features and moisture protection included in
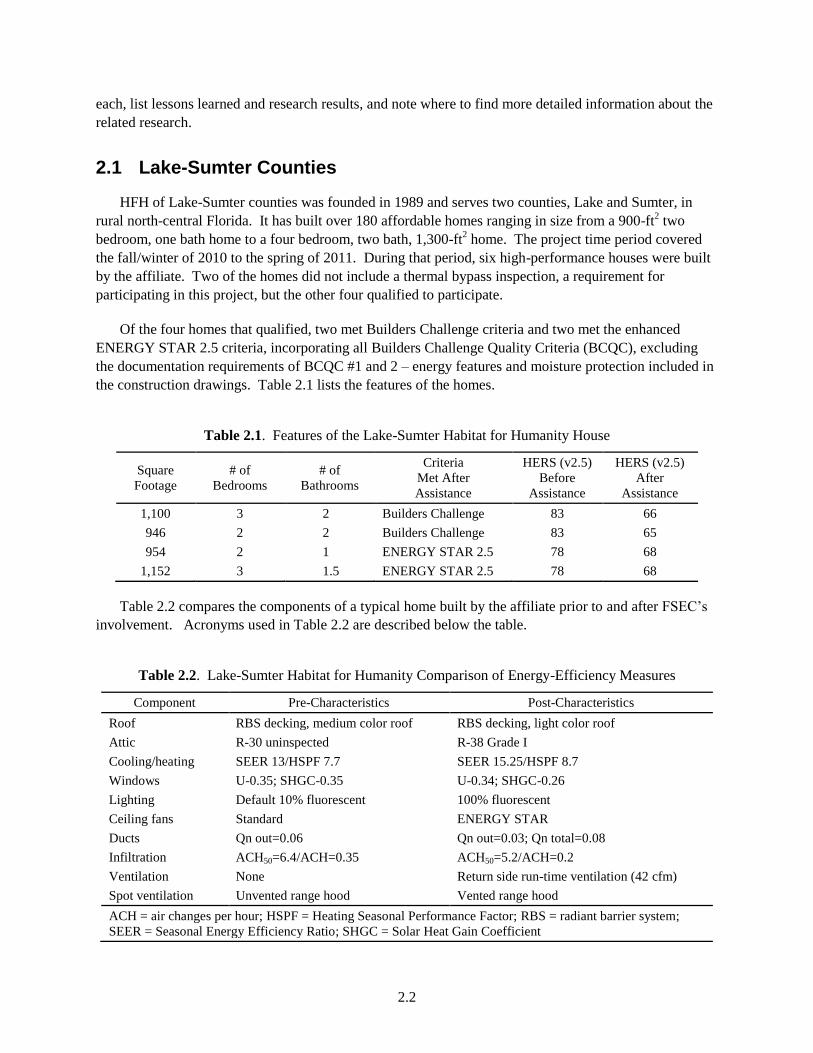
the construction drawings. Table 2.1 lists the features of the homes.
Table 2.1. Features of the Lake-Sumter Habitat for Humanity House
Square
Footage
# of
Bedrooms
# of
Bathrooms
Criteria
Met After
Assistance
HERS (v2.5)
Before
Assistance
HERS (v2.5)
After
Assistance
1,100 3 2 Builders Challenge 83 66
946 2 2 Builders Challenge 83 65
954 2 1 ENERGY STAR 2.5 78 68
1,152 3 1.5 ENERGY STAR 2.5 78 68
Table 2.2 compares the components of a typical home built by the affiliate prior to and after FSEC’s
involvement. Acronyms used in Table 2.2 are described below the table.
Table 2.2. Lake-Sumter Habitat for Humanity Comparison of Energy-Efficiency Measures
Component Pre-Characteristics Post-Characteristics
Roof RBS decking, medium color roof RBS decking, light color roof
Attic R-30 uninspected R-38 Grade I
Cooling/heating SEER 13/HSPF 7.7 SEER 15.25/HSPF 8.7
Windows U-0.35; SHGC-0.35 U-0.34; SHGC-0.26
Lighting Default 10% fluorescent 100% fluorescent
Ceiling fans Standard ENERGY STAR
Ducts Qn out=0.06 Qn out=0.03; Qn total=0.08
Infiltration ACH50=6.4/ACH=0.35 ACH50=5.2/ACH=0.2
Ventilation None Return side run-time ventilation (42 cfm)
Spot ventilation Unvented range hood Vented range hood
ACH = air changes per hour; HSPF = Heating Seasonal Performance Factor; RBS = radiant barrier system;
SEER = Seasonal Energy Efficiency Ratio; SHGC = Solar Heat Gain Coefficient

2.3
2.1.1 Lessons Learned
Lessons learned that may drive future efforts of the HFH affiliate are as follows:
The required HERS Index of 70 is achievable and cost effective in this location using a few, relatively
simple, off-the-shelf components and building materials.
Efficient hot-water heating was not included as a measure by this affiliate (but discussed), because of
the lack of natural gas infrastructure and the unavailability of new, “hybrid” heat pump water heaters.
Hybrid heat pump water heaters have a conventional electric storage heater combined with a heat
pump that extracts heat from the air to help heat the water.
Future new construction projects will include the use of hybrid heat pump water heaters when
projects cannot take advantage of a recent utility program providing substantial funding for nonprofit
builders to install solar hot-water heating.
2.1.2 Results
The simple changes made to the partners’ previous typical house design resulted in reported costs of
$1,640 for the 1,100-ft2 home, for an annual mortgage increase (30 years at 7%) of $82/year, and a
projected annual energy savings of $291. The net positive yearly cash flow to the homeowner was $209.
The HERS Index ratings decreased from 83 to 66 as a result of the recommended efficiency
improvements.
More detailed information about this research protocol and significant findings is presented by
McIlvaine et al.(2012).
2.2 Hillsborough County, Florida (FSEC)
HFH of Hillsborough County was established in 1987 and has built over 135 new homes and
retrofitted many others. All four project houses were 1,164 ft2 with three bedrooms and two bathrooms.
Table 2.3 lists the features of the homes.
Table 2.3. Features of the Hillsborough Habitat for Humanity House
Square
Footage
# of
Bedrooms
# of
Bathrooms
Criteria
Met* After
Assistance
HERS (v2.5)
Before
Assistance
HERS (v2.5)
After
Assistance
1,164 3 2 ENERGY STAR 2.0
(Due to permit date;
house would have
qualified for 2.5)
87 67
1,164 3 2 ENERGY STAR 2.5 87 68
1,164 3 2 ENERGY STAR 2.5 87 64
1,164 3 2 ENERGY STAR 2.5 87 64
*Problems were encountered with Builders Challenge QC criteria, specifically items 1 and 2, requiring
documentation on plans. Otherwise, all BCQC criteria were met.

2.4
Table 2.4 compares the components of a typical home built by the affiliate prior to FSEC’s
involvement and after. Acronyms used in Table 2.4 are defined immediately below the table.
Table 2.4. Hillsborough Habitat for Humanity Comparison of Energy-Efficiency Measures
Component Pre-Characteristics Post-Characteristics
Roof Medium color roof Light color or white roof
Attic R-19 R-38
Walls R-13 Grade 3 R-15 Grade I and R-3 sheathing
HVAC SEER 13 AC with electric resistance heating SEER 14 heat pump
Windows U-0.5; SHGC-0.7 U-0.32; SHGC-0.28
Lighting Over 90% fluorescent Over 90% fluorescent
Ducts Qn out=0.05 Qn out=0.03; Qn total=0.07
Infiltration ACH50=8.2/ACH=0.36 ACH50=5.6/ACH=0.25
Ventilation No fresh air Run-time fresh air
Spot ventilation Recirculating kitchen range hood Range hood vent outdoors
Appliances ENERGY STAR refrigerator
ACH = air changes per hour; SEER = Seasonal Energy Efficiency Ratio; SHGC = Solar Heat Gain
Coefficient
2.2.1 Lessons Learned
Lessons learned that may drive future efforts of the HFH affiliate are as follows:
The required HERS Index of 70 is achievable in this location using a few, relatively simple, off-the-
shelf components and building materials.
Merely specifying ENERGY STAR components is not sufficient; specifications must be clear in
order to comply with design requirements. For example, the affiliate specified ENERGY STAR
windows, and received windows that did not meet the solar heat gain coefficient (SHGC)
requirements for ENERGY STAR’s Southern climate. The delivered windows had a SHGC of 0.28,
qualifying for ENERGY STAR in North-Central and South-Central, but not the Southern climate
requirement of SHGC <=0.27. The windows did have an ENERGY STAR label.
Further confusion arose when the HVAC contractor supplied SEER 13 heat pumps and told the
affiliate that they preformed as well as the specified SEER 14. The solution to this problem was
replacing the contractor.
2.2.2 Results
These improvements resulted in an estimated energy savings of $346/year, and a resulting HERS
rating of 64 (SEER 14 heat pump) or 67 (SEER 13 heat pump). The construction manager estimated that
the improvement costs totaled $2,500, including $1,000 for the 100% tile floor and the cost of the donated
R-3 sheathing and ENERGY STAR refrigerator. Positive cash flow to the homeowner is estimated to be
$220/year. When gas is available, the affiliate now uses instantaneous gas water heaters.
2.5
More detailed information about this research protocol and significant findings is presented by
McIlvaine et al. (2012).
2.3 Palm Beach County (FSEC)
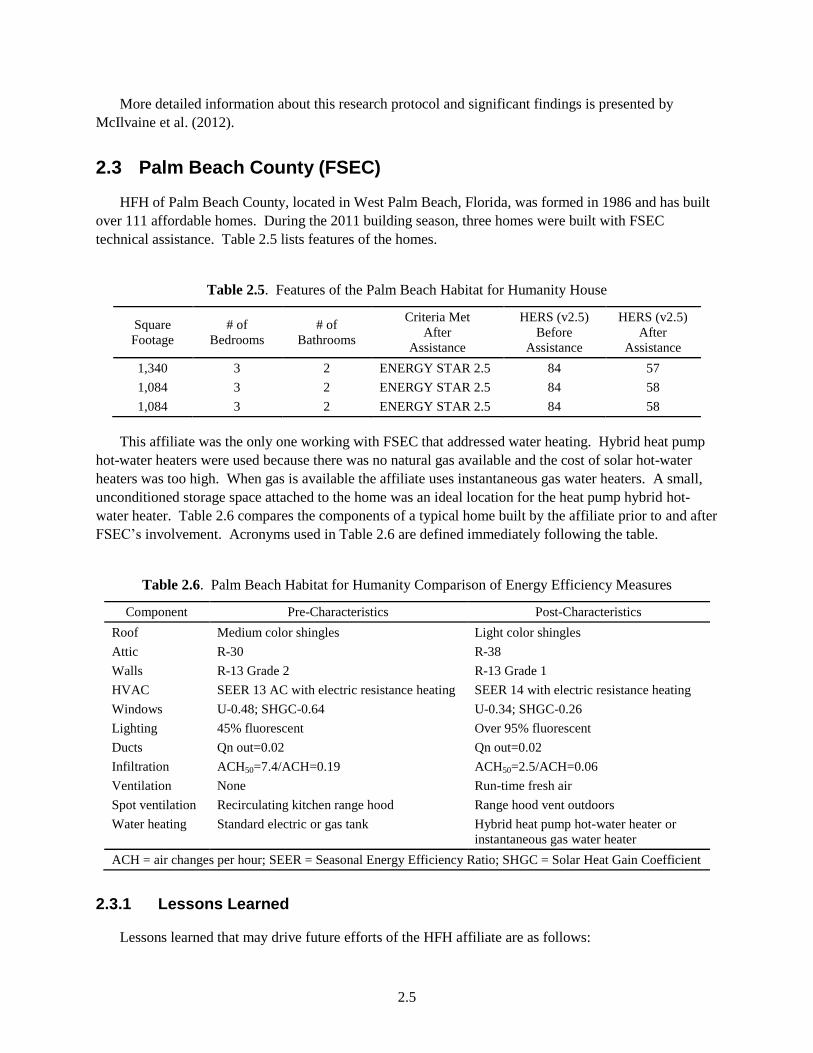
HFH of Palm Beach County, located in West Palm Beach, Florida, was formed in 1986 and has built
over 111 affordable homes. During the 2011 building season, three homes were built with FSEC
technical assistance. Table 2.5 lists features of the homes.
Table 2.5. Features of the Palm Beach Habitat for Humanity House
Square
Footage
# of
Bedrooms
# of
Bathrooms
Criteria Met
After
Assistance
HERS (v2.5)
Before
Assistance
HERS (v2.5)
After
Assistance
1,340 3 2 ENERGY STAR 2.5 84 57
1,084 3 2 ENERGY STAR 2.5 84 58
1,084 3 2 ENERGY STAR 2.5 84 58
This affiliate was the only one working with FSEC that addressed water heating. Hybrid heat pump
hot-water heaters were used because there was no natural gas available and the cost of solar hot-water
heaters was too high. When gas is available the affiliate uses instantaneous gas water heaters. A small,
unconditioned storage space attached to the home was an ideal location for the heat pump hybrid hot-
water heater. Table 2.6 compares the components of a typical home built by the affiliate prior to and after
FSEC’s involvement. Acronyms used in Table 2.6 are defined immediately following the table.
Table 2.6. Palm Beach Habitat for Humanity Comparison of Energy Efficiency Measures
Component Pre-Characteristics Post-Characteristics
Roof Medium color shingles Light color shingles
Attic R-30 R-38
Walls R-13 Grade 2 R-13 Grade 1
HVAC SEER 13 AC with electric resistance heating SEER 14 with electric resistance heating
Windows U-0.48; SHGC-0.64 U-0.34; SHGC-0.26
Lighting 45% fluorescent Over 95% fluorescent
Ducts Qn out=0.02 Qn out=0.02
Infiltration ACH50=7.4/ACH=0.19 ACH50=2.5/ACH=0.06
Ventilation None Run-time fresh air
Spot ventilation Recirculating kitchen range hood Range hood vent outdoors
Water heating Standard electric or gas tank Hybrid heat pump hot-water heater or
instantaneous gas water heater
ACH = air changes per hour; SEER = Seasonal Energy Efficiency Ratio; SHGC = Solar Heat Gain Coefficient
2.3.1 Lessons Learned
Lessons learned that may drive future efforts of the HFH affiliate are as follows:

2.6
The required HERS rating of 57 is achievable and highly cost effective in this location using a few,
relatively simple, off-the-shelf components and building materials. These simple improvements
included a hybrid hot water heat pump.
Air sealing around window and door frames and air sealing the top plate to the wallboard with a foam
gasket (ENERGY STAR 2.5 requirements) significantly improved the overall airtightness of the
home.
The south Florida climate does not justify significant heating and cooling system improvements due
to the minor heating loads, and the added cost of installing beyond code minimum equipment
typically cannot be justified.
Understanding specifications results in better choices. The affiliate was buying “Low-E” windows,
but the SHGC was 0.64. When the impact of this specification was explained to the affiliate they
immediately adopted better windows with a much lower SHGC (0.26) with a minimal cost increase.
2.3.2 Results
The improvements resulted in an estimated energy savings of $434/year with electric costs of
$0.13/kWh, and a resulting HERS rating of 57. The construction director estimated that the improvement
costs totaled $1,500. Positive cash flow to the homeowner is estimated to be $313/year.
More detailed information about this research protocol and significant findings is presented by
McIlvaine et al. (2012).
2.4 Seattle/South King County
HFH of Seattle/South King County covers all cities within King County to the west of Lake
Washington (including Seattle) and all areas within King County to the south of and including the City of
Renton, Washington. The HFH of Seattle was founded in 1986 and merged with the South King County
affiliate in 2003. The combined affiliate has built or repaired over 208 homes.
WSU’s project aimed to confirm the cost-effectiveness of measures already implemented in the
marine climate by the HFH of Seattle.
2.4.1 Existing Measures Evaluated
The HFH affiliate has been working in recent years to meet the requirements of a local program,
Northwest ENERGY STAR. This program offers two prescriptive Builder Option Packages (BOPs).
The main difference between the two BOPs is the heating system; BOP1 applies to forced-air gas
furnaces, while BOP2 is for 100% zonal electric resistance heating. Each BOP has prescriptive
requirements for insulation, air leakage, ventilation, water heating, lighting, and appliances. BOP2
requires lower U-factor windows, increased wall insulation, a much tighter building envelope, and a heat
recovery ventilator (HRV) to ensure proper ventilation. However, there are no specifications or protocols
in BOP2 to ensure proper commissioning of the HRV.

2.7
The maximum allowable air leakage for BOP2 is 2.5 ACH 50, which can be very difficult to achieve,
especially for multifamily buildings. The affiliate committed to building to BOP2. It should be noted
that the affiliate had already been working to achieve air leakage rates lower than the targets in the 2012
International Energy Conservation Code (IECC). Therefore, the issues faced by the affiliate may be of
particular interest prior to national implementation of the 2012 IECC. Table 2.7 lists the features of the
affiliate’s current typical design. The acronyms used in Table 2.7 are defined below the table.
The measures that were evaluated focused on reducing air leakage, improving ventilation, and
improving the thermal performance of the building envelope. Field inspection and testing were used to
evaluate the measures.
Table 2.7. Seattle/South King County Habitat for Humanity Current Typical Design Features
Component Characteristic
Attic insulation R-38
Single rafter vault R-38
Walls R-21, 16” o.c.
Heating Electric baseboard
Windows U-0.30, 12% glazing
Framed floor R-30
Slab R-10 full, R-10 thermal break
Infiltration ACH50=3.1
Lighting 100% fluorescent
Water heating Electric EF=.92
Appliances (all electric) ENERGY STAR dishwasher and clothes washer
ACH = air changes per hour; EF = Energy Factor
2.4.1.1 Air Sealing
The affiliate provided training in air sealing techniques and used various strategies, including sealing
penetrations with caulk and/or spray foam and using specialty air leakage products such as air-tight
electrical boxes and installing drywall gaskets to seal the drywall to framing members. Five of the homes
were sealed by professionals and the rest were sealed by trained volunteers. The homes sealed by
professionals had an average leakage of ACH50=2.87, and those sealed by volunteers averaged
ACH50=3.63.
Twenty-three units from multiple developments completed over a 3-year time period were tested and
analyzed. The tests were conducted without simultaneously depressurizing the adjacent units. As a
result, the blower door test results reflect air leakage outside of conditioned space in addition to air
leakage to adjacent units. The results would likely have been different if multiple blower doors were used
to equalize the pressures between neighboring units, and this is indicated as a possible issue for future
Building America research in multifamily housing.
2.8
2.4.1.2 Ventilation
The affiliate provides whole-house ventilation using two different strategies. In one development, an
exhaust fan in the laundry room was set on a timer to run intermittently. In the other development, HRVs
were installed. Spot ventilation was provided in the bathrooms using exhaust fans in both developments,
and range hoods in the kitchens were also provided.
The affiliate found the HRVs relatively easy to install, but there were issues with duct run placement.
Best practices for installation were challenging in a compact, multifamily unit. Ducts were mostly in
conditioned space except for some in attics that were covered by blown-in insulation. If the ducts had
been kept entirely within the conditioned space, associated duct leakage from the HRV would not affect
the blower door test results, and the HRV, in general, would typically be more efficient.
2.4.1.3 Building Envelope
Three building envelope measures were studied: slab insulation, rigid foam board exterior wall
insulation (Figure 2.1), and windows. Most of the homes have R-10 extruded polystyrene (XPS) installed
under the full slab and have an R-10 thermal break between the slab and the foundation stem wall. The
energy code only requires unheated slabs to have slab edge insulation, but because the XPS foam is
donated, the affiliate can fully insulate the slab cost-effectively. Based on cost information from Dow,
the estimated cost to purchase and fully insulate a slab to R-10 versus just insulating the slab edge is an
increase of approximately $750 for material.
The affiliate uses R-5 XPS foam on exterior walls as standard practice, including on rehabilitation
projects when the siding is replaced. Because the foam is donated, the affiliate would like to use more
than 1 in. insulation, such as 2 in. of XPS or 1.5 in. of polyisocyanurate. However, HardiePlank® is
standard practice, and to maintain the warranty, the attaching nail can’t cantilever any longer than 1 in.
from solid wood, so battens would have to be used with more than 1 in. of XPS.
Both the efficiency and the durability of the windows are important to the affiliate, so energy-efficient
windows are used and are carefully flashed. Some developments have windows with an area-weighted
U-factor of 0.35. Later developments used windows improved to U-0.30 and U-0.22.

2.9
Figure 2.1. Photo of Rigid Foam Board Installed on the Exterior of the Wall Assembly
2.4.2 Analysis Results
At least 1 year of energy usage data were collected from four identical duplexes, although data
ultimately were available for only seven of the eight units due to waiver issues. Each three-story duplex
has a four-bedroom unit and a five-bedroom unit. Each unit has 1-1/2 bathrooms. The units were built in
two phases, with the second phase incorporating improved air sealing and insulation levels. Despite that,
there did not appear to be any decrease in energy use in the phase 2 units.
HFH of Seattle/South King County was particularly interested in whether energy rates for low-
income households offered to some of the homeowners discourages them from implementing energy
conservation practices. After analyzing the data, it didn’t appear that homes with the lower income rates
had greater energy usage.
REM/Rate v. 12.91 was used for the initial analysis. The results allowed the following comparisons:
HERS ratings among units, estimated annual kilowatt-hour usage to actual kilowatt-hour usage and
estimated annual energy costs to actual annual energy costs. HERS ratings were available for 23 homes,
3 in phase 1, 12 in phase 2, and 8 from a separate development. There does seem to be a correlation
between the phases in the first development and the HERS ratings. Ratings for units in the second phase
2.10
with the improved air sealing and insulation levels were lower than the ratings for the phase 1 units.
Details are available in Salzberg et al. (2012).
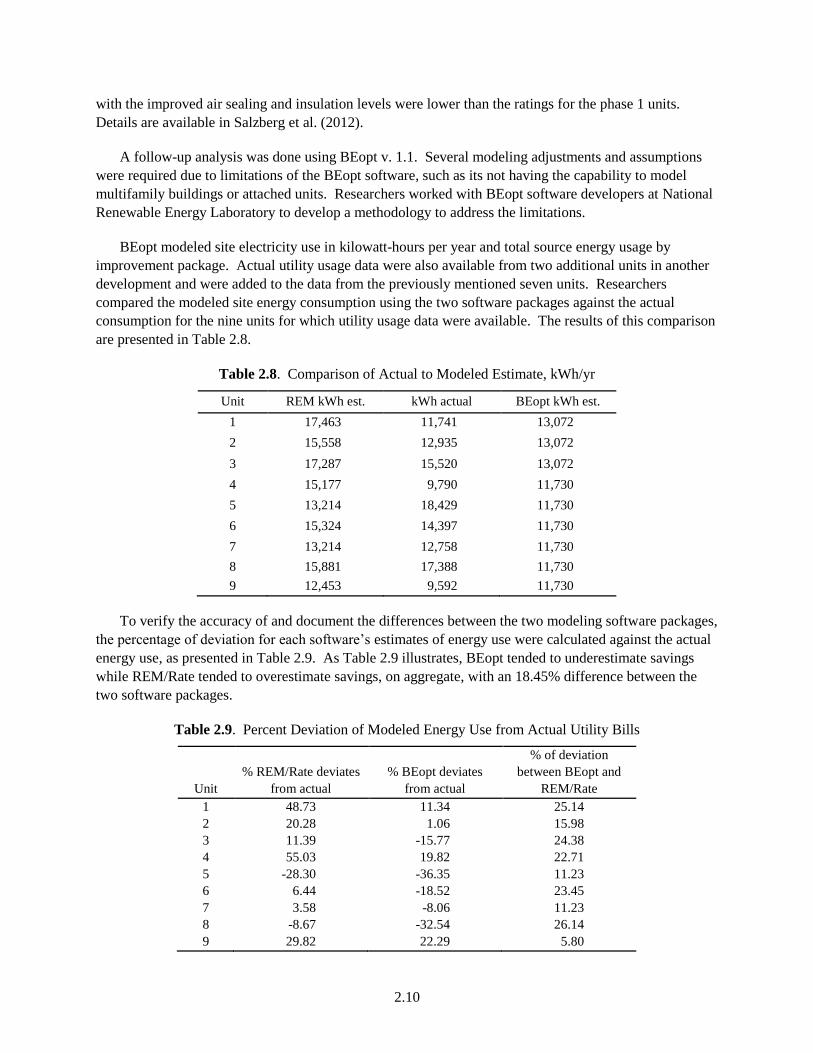
A follow-up analysis was done using BEopt v. 1.1. Several modeling adjustments and assumptions
were required due to limitations of the BEopt software, such as its not having the capability to model
multifamily buildings or attached units. Researchers worked with BEopt software developers at National
Renewable Energy Laboratory to develop a methodology to address the limitations.
BEopt modeled site electricity use in kilowatt-hours per year and total source energy usage by
improvement package. Actual utility usage data were also available from two additional units in another
development and were added to the data from the previously mentioned seven units. Researchers
compared the modeled site energy consumption using the two software packages against the actual
consumption for the nine units for which utility usage data were available. The results of this comparison
are presented in Table 2.8.
Table 2.8. Comparison of Actual to Modeled Estimate, kWh/yr
Unit REM kWh est. kWh actual BEopt kWh est.
1 17,463 11,741 13,072
2 15,558 12,935 13,072
3 17,287 15,520 13,072
4 15,177 9,790 11,730
5 13,214 18,429 11,730
6 15,324 14,397 11,730
7 13,214 12,758 11,730
8 15,881 17,388 11,730
9 12,453 9,592 11,730
To verify the accuracy of and document the differences between the two modeling software packages,
the percentage of deviation for each software’s estimates of energy use were calculated against the actual
energy use, as presented in Table 2.9. As Table 2.9 illustrates, BEopt tended to underestimate savings
while REM/Rate tended to overestimate savings, on aggregate, with an 18.45% difference between the
two software packages.
Table 2.9. Percent Deviation of Modeled Energy Use from Actual Utility Bills
Unit
% REM/Rate deviates
from actual
% BEopt deviates
from actual
% of deviation
between BEopt and
REM/Rate
1 48.73 11.34 25.14
2 20.28 1.06 15.98
3 11.39 -15.77 24.38
4 55.03 19.82 22.71
5 -28.30 -36.35 11.23
6 6.44 -18.52 23.45
7 3.58 -8.06 11.23
8 -8.67 -32.54 26.14
9 29.82 22.29 5.80
2.11
Mean 15.37 -6.3 18.45
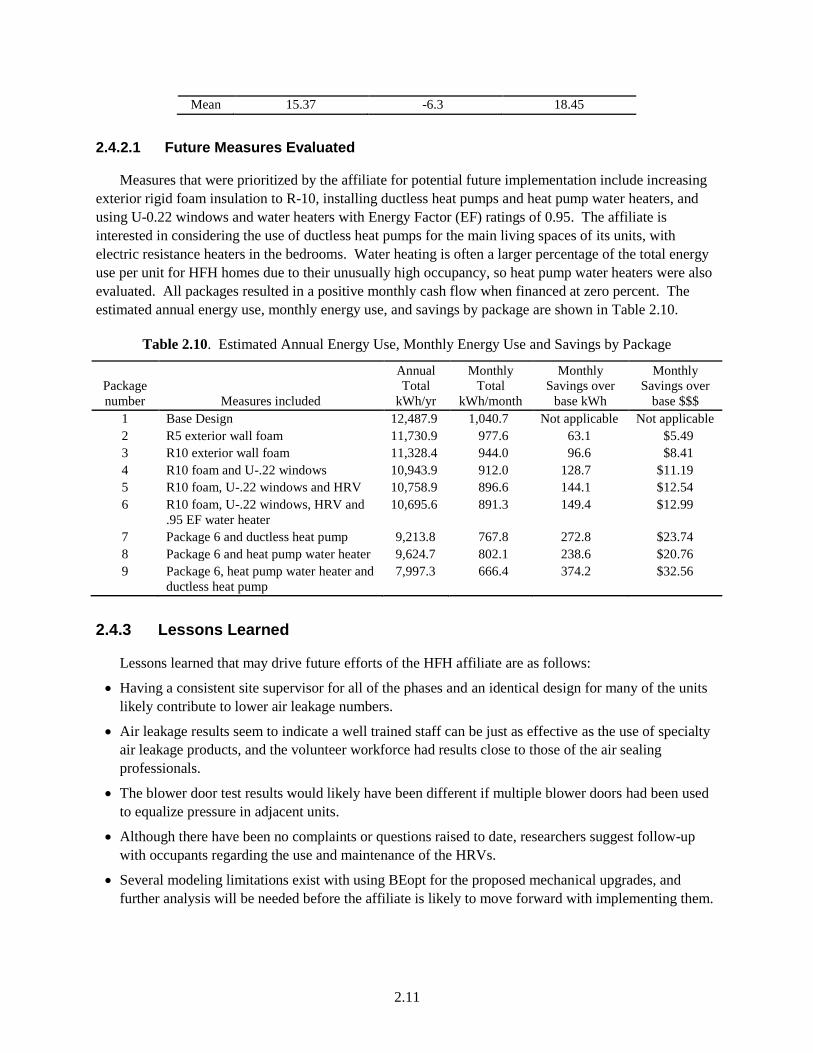
2.4.2.1 Future Measures Evaluated
Measures that were prioritized by the affiliate for potential future implementation include increasing
exterior rigid foam insulation to R-10, installing ductless heat pumps and heat pump water heaters, and
using U-0.22 windows and water heaters with Energy Factor (EF) ratings of 0.95. The affiliate is
interested in considering the use of ductless heat pumps for the main living spaces of its units, with
electric resistance heaters in the bedrooms. Water heating is often a larger percentage of the total energy
use per unit for HFH homes due to their unusually high occupancy, so heat pump water heaters were also
evaluated. All packages resulted in a positive monthly cash flow when financed at zero percent. The
estimated annual energy use, monthly energy use, and savings by package are shown in Table 2.10.
Table 2.10. Estimated Annual Energy Use, Monthly Energy Use and Savings by Package
Package
number Measures included
Annual
Total
kWh/yr
Monthly
Total
kWh/month
Monthly
Savings over
base kWh
Monthly
Savings over
base $$$
1 Base Design 12,487.9 1,040.7 Not applicable Not applicable
2 R5 exterior wall foam 11,730.9 977.6 63.1 $5.49
3 R10 exterior wall foam 11,328.4 944.0 96.6 $8.41
4 R10 foam and U-.22 windows 10,943.9 912.0 128.7 $11.19
5 R10 foam, U-.22 windows and HRV 10,758.9 896.6 144.1 $12.54
6 R10 foam, U-.22 windows, HRV and
.95 EF water heater
10,695.6 891.3 149.4 $12.99
7 Package 6 and ductless heat pump 9,213.8 767.8 272.8 $23.74
8 Package 6 and heat pump water heater 9,624.7 802.1 238.6 $20.76
9 Package 6, heat pump water heater and
ductless heat pump
7,997.3 666.4 374.2 $32.56
2.4.3 Lessons Learned
Lessons learned that may drive future efforts of the HFH affiliate are as follows:
Having a consistent site supervisor for all of the phases and an identical design for many of the units
likely contribute to lower air leakage numbers.
Air leakage results seem to indicate a well trained staff can be just as effective as the use of specialty
air leakage products, and the volunteer workforce had results close to those of the air sealing
professionals.
The blower door test results would likely have been different if multiple blower doors had been used
to equalize pressure in adjacent units.
Although there have been no complaints or questions raised to date, researchers suggest follow-up
with occupants regarding the use and maintenance of the HRVs.
Several modeling limitations exist with using BEopt for the proposed mechanical upgrades, and
further analysis will be needed before the affiliate is likely to move forward with implementing them.

2.12
2.4.4 Results
The energy-efficiency measures included as part of the affiliate’s standard building practice are cost-
effective and resulted in positive monthly cash flow when financed at a zero percent interest rate, 30-year
loan (available to all HFH partner families). The modeling results for the evaluated, future measures
indicate a resulting positive monthly cash flow and up to 36% savings in energy consumption over the
affiliate’s standard package. However, the modeling software has some limited capabilities related to the
mechanical upgrades, and further analysis is recommended.
More detailed information on this research protocol and significant findings is presented by Salzberg
et al. (2012).
2.5 Conclusions
Research by both FSEC and WSU has shown that energy-efficient homes can be built cost-effectively
using volunteer labor in the hot-humid and marine climates using a few, relatively simple measures. The
Florida climate responds better to increases in roof reflectance and attic insulation over wall insulation
and due to small cooling and heating loads, dramatic increases in conditioning equipment efficiency are
not warranted for small, well-built houses.
These results imply that if energy-efficient homes can be built under these circumstances, they should
also be achievable in many for-profit situations as well. Most importantly, this research proved that high-
performance homes can cost-effectively bring energy savings and lower utility bills to low-income
families.
During the course of the research, several issues were identified and listed under “lessons learned.”
The main, overall issue involved with these projects was the difficulty in obtaining precise cost data due
to the fact many of the materials were discounted or donated and a mostly volunteer workforce was used.
With many of these costs estimated, the evaluation of cost-effectiveness is an approximation. In addition,
two particular areas to address in the future are modeling enhancements for BEopt and a clear protocol for
testing attached dwelling units.

3.1
3.0 Energy-Efficient and Cost-Effective HVAC Systems for High-Performance Homes
In addition to having lower utility bills, high-performance homes have the potential to provide better
temperature and relative humidity control than leaky, poorly built homes, because they allow greater
control over the source and amount of air introduced from outside. In a high-performance home, most
outside air introduced to maintain acceptable indoor air quality enters through designed pathways (i.e.,
outdoor air intakes) and is conditioned prior to being introduced into the interior space. In contrast, in
many existing homes, the building envelope is leaky enough that designed mechanical ventilation is not
necessary because sufficient air is supplied through infiltration to meet existing ventilation standards
(Sherman and Matson 1997). However, ventilation via infiltration can be problematic when trying to
ensure adequate ventilation because the flow paths are diffuse and often unknown. Air infiltration is
especially problematic for hot-humid climates where dehumidification is required, as moist air can
transport water vapor into and through building materials. When moisture intrusion overwhelms the
ability of materials to dry, mold, mildew, and rot can occur. Thus, the mantra of “build tight, ventilate
right” has come to describe new construction ventilation practices, which provide much better
temperature and humidity control in tight homes.
In 2011, PNNL worked with NEW, Florida HERO, and the GTI to evaluate cost- effective energy-
efficiency improvements for HVAC systems in new, stick-built and manufactured homes. One study, led
by NEW, examined the installation of high-performance ductless heat pumps to dramatically reduce
heating and cooling energy consumption in manufactured homes, while delivering acceptable comfort to
the homeowners. Another study, conducted in collaboration with Florida HERO, investigated new cost-
effective methods for installing ducts in conditioned space in new housing construction, as well as the
comfort impacts and occupant satisfaction of ducted versus transom duct designs. GTI evaluated new
supplemental dehumidification technology, which has the potential to decrease energy consumption over
existing dehumidification systems while improving temperature and humidity control.
These types of research advances, which work towards the cost-effective implementation of high-
performance HVAC technologies, promote the continued implementation of these systems in new
housing and the continued growth of the high-performance housing market.
3.1 Field Monitoring of Ductless Heat Pump Performance versus Electric Resistance in High-Performance Manufactured Housing
One significant research area related to cost-effective high-performance housing is in the
manufactured housing arena. Manufactured housing can achieve economies of scale that stick-built
housing cannot, because manufactured homes do not have the same degree of customization. They can
also achieve remarkable levels of airtightness due to the uniformity and optimization of construction
practices on the line. Consequently, manufactured home manufacturers are achieving high energy
efficiency in their homes, particularly in the Pacific Northwest where many homes are achieving
ENERGY STAR or Northwest Energy Efficient Manufactured-Home Program certification. Northwest
manufactured home manufacturers are constantly looking for new energy-saving technologies or
manufacturing processes that can improve the quality of their homes. However, manufactured home
manufacturers are also very cost sensitive. Manufactured home buyers are typically looking for an
3.2
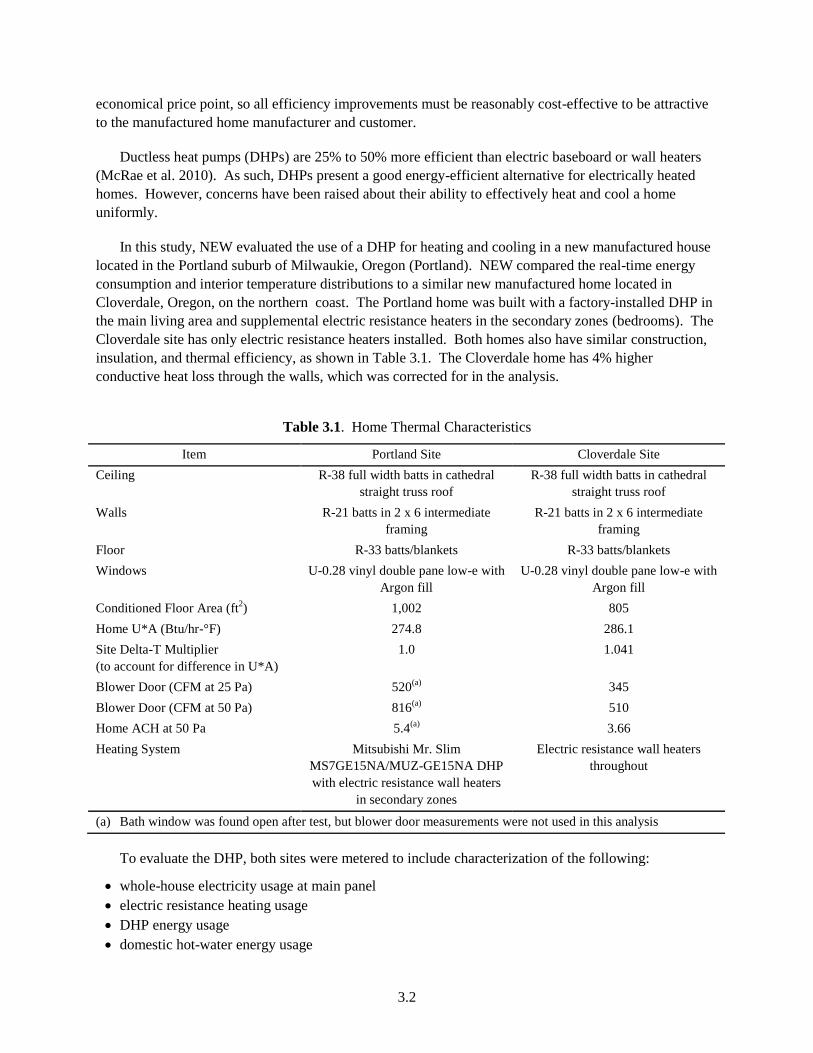
economical price point, so all efficiency improvements must be reasonably cost-effective to be attractive
to the manufactured home manufacturer and customer.
Ductless heat pumps (DHPs) are 25% to 50% more efficient than electric baseboard or wall heaters
(McRae et al. 2010). As such, DHPs present a good energy-efficient alternative for electrically heated
homes. However, concerns have been raised about their ability to effectively heat and cool a home
uniformly.
In this study, NEW evaluated the use of a DHP for heating and cooling in a new manufactured house
located in the Portland suburb of Milwaukie, Oregon (Portland). NEW compared the real-time energy
consumption and interior temperature distributions to a similar new manufactured home located in
Cloverdale, Oregon, on the northern coast. The Portland home was built with a factory-installed DHP in
the main living area and supplemental electric resistance heaters in the secondary zones (bedrooms). The
Cloverdale site has only electric resistance heaters installed. Both homes also have similar construction,
insulation, and thermal efficiency, as shown in Table 3.1. The Cloverdale home has 4% higher
conductive heat loss through the walls, which was corrected for in the analysis.
Table 3.1. Home Thermal Characteristics
Item Portland Site Cloverdale Site
Ceiling R-38 full width batts in cathedral
straight truss roof
R-38 full width batts in cathedral
straight truss roof
Walls R-21 batts in 2 x 6 intermediate
framing
R-21 batts in 2 x 6 intermediate
framing
Floor R-33 batts/blankets R-33 batts/blankets
Windows U-0.28 vinyl double pane low-e with
Argon fill
U-0.28 vinyl double pane low-e with
Argon fill
Conditioned Floor Area (ft2) 1,002 805
Home U*A (Btu/hr-°F) 274.8 286.1
Site Delta-T Multiplier
(to account for difference in U*A)
1.0 1.041
Blower Door (CFM at 25 Pa) 520(a)
345
Blower Door (CFM at 50 Pa) 816(a)
510
Home ACH at 50 Pa 5.4(a)
3.66
Heating System Mitsubishi Mr. Slim
MS7GE15NA/MUZ-GE15NA DHP
with electric resistance wall heaters
in secondary zones
Electric resistance wall heaters
throughout
(a) Bath window was found open after test, but blower door measurements were not used in this analysis
To evaluate the DHP, both sites were metered to include characterization of the following:
whole-house electricity usage at main panel
electric resistance heating usage
DHP energy usage
domestic hot-water energy usage

3.3
interior main zone temperature and relative humidity
secondary zone (bedroom) temperatures and relative humidity
outside temperature and heat pump vapor line temp (to confirm heating or cooling operation).
Metering was accomplished with the help of Ecotope, Inc., with metering equipment supplied by the
Bonneville Power Administration.
Table 3.2 presents the mean outdoor air temperature, mean difference between indoor and outdoor
temperatures, and the total heating energy use (excluding miscellaneous internal loads) over the
monitoring period.
Table 3.2. Mean Temperature and Energy Consumption Parameters over Monitoring Period (November
2010 through May 2011)
Item Portland Site Cloverdale
Mean Outdoor Air Temperature (°F) 42.5 44.9
Mean Delta-T (°F) 20.4 23.4
Heating Energy Use over Monitoring Period (kWh) 1,784 7,104
Electric Resistance Usage (kWh) 250 4,000
Heating Performance Factor 2.3 – 2.6 1
Because only two homes are included in this study, it is important to account for differences in
occupancy and internal loads between the two homes, which may affect the comparison of heating energy
consumption. To do this, researchers created a factor called the “Heating Performance Factor,” which
accounts for all sensible heat loads introduced into the home both from the heating systems and from any
other internal loads. The Heating Performance Factor is a comparison of the heating performance of one
home to another “baseline” home, much like a coefficient of performance value. The heating
performance for these homes, accounting for internal gains, is calculated as a ratio of total heating energy
consumption over the average difference between indoor and outdoor temperatures over the same time
period. The overall calculation for Heating Performance Factor is shown in Equation 1 below.
(Eq. 1)
Using this analysis, the Portland site achieved a whole-house Heating Performance Factor that was
about 2.3 to 2.6 times as efficient as the Cloverdale house when outdoor air temperatures ranged from the
mid-20s °F to the mid-40s °F, respectively.
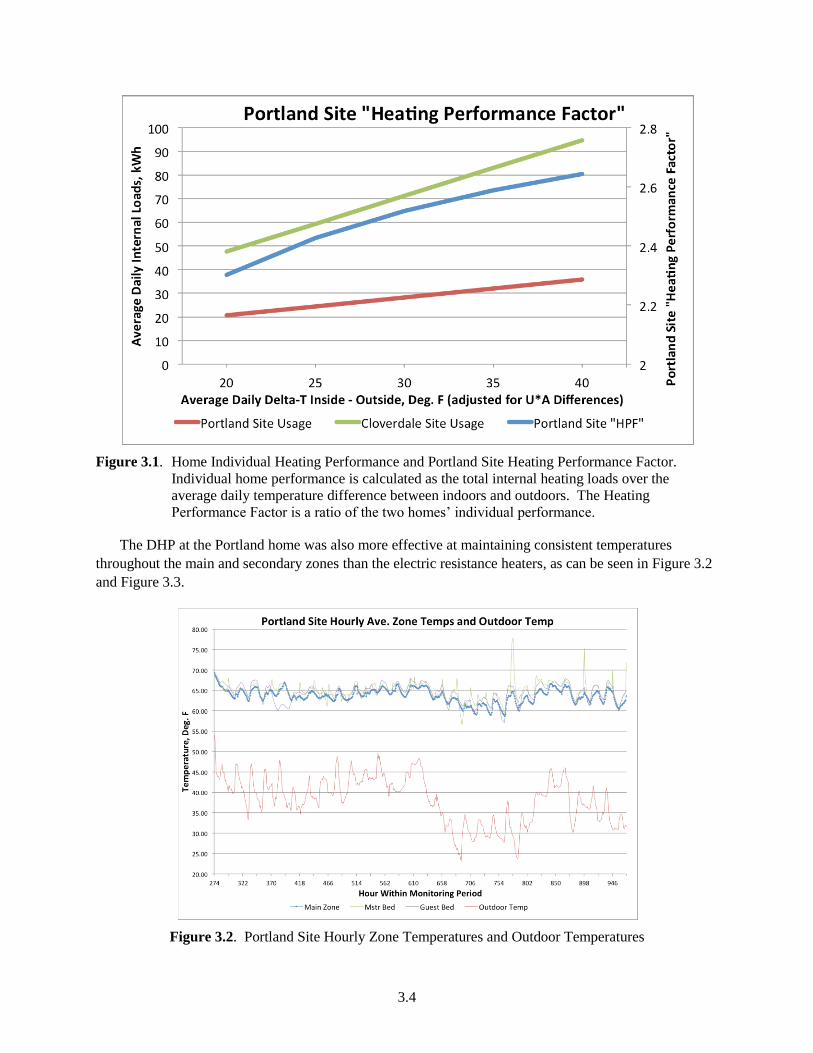
Figure 3.1 depicts the heating performance of the Portland site and the Cloverdale site individually, as
well as the Heating Performance Factor for the Portland site (which is a ratio of Portland heating
performance over Cloverdale heating performance). The DHP reduced the use of electric resistance heat
by almost 94%, with 4,000 kWh required in the Cloverdale site and only 250 kWh used in the Portland
site over the monitoring period. As a result, heating energy consumption in the Portland home was about
one-quarter of that in the Cloverdale home, over the monitoring period, as summarized in Table 3.2
3.4
Figure 3.1. Home Individual Heating Performance and Portland Site Heating Performance Factor.
Individual home performance is calculated as the total internal heating loads over the
average daily temperature difference between indoors and outdoors. The Heating
Performance Factor is a ratio of the two homes’ individual performance.
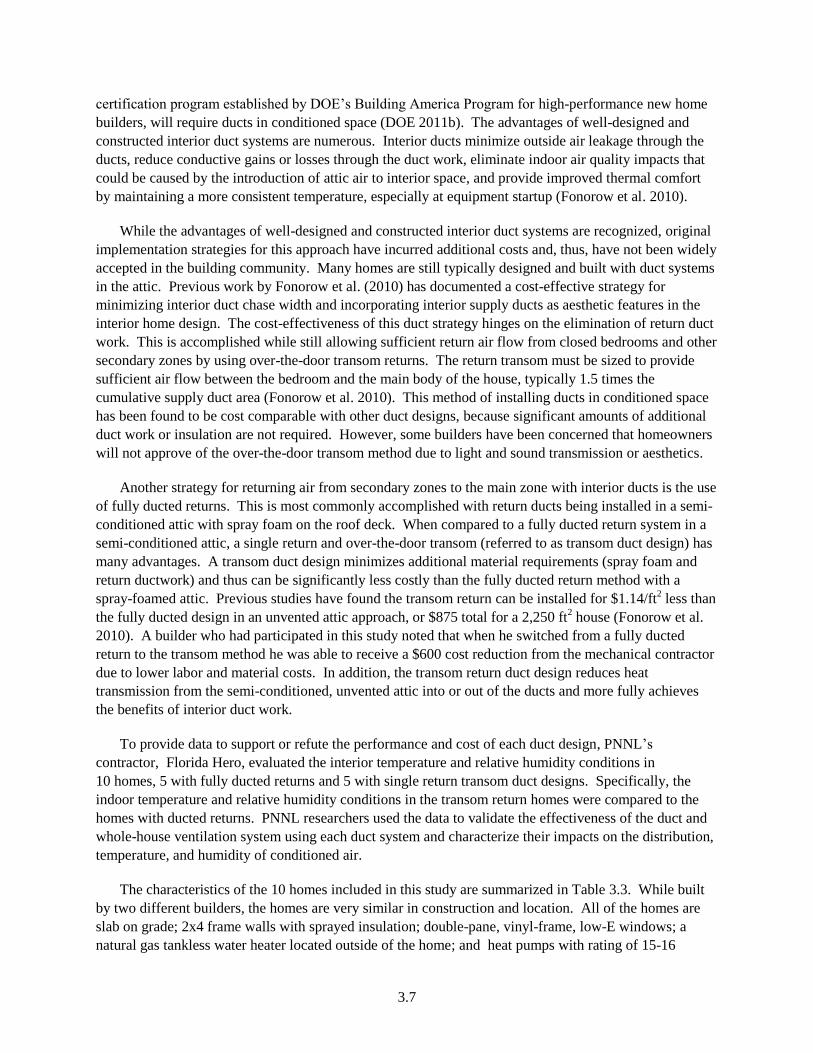
The DHP at the Portland home was also more effective at maintaining consistent temperatures
throughout the main and secondary zones than the electric resistance heaters, as can be seen in Figure 3.2
and Figure 3.3.
Figure 3.2. Portland Site Hourly Zone Temperatures and Outdoor Temperatures

3.5
Figure 3.3. Cloverdale Site Hourly Zone Temperatures and Outdoor Temperatures
The DHP for the Portland home was sized based on Air Conditioning Contractors of America Manual
J sizing requirements at 13,600 Btu/hr (ACCA 2005). The estimated total design load for the Portland
site is 14,600 Btu/hr, meaning the heat pump should be able to provide adequate conditioning to the main
and secondary zones of the house under most conditions. However, because the manufacturer of the
Portland home was concerned about the ability of the DHP to condition the secondary zones,
supplemental electric wall heaters were installed in all the secondary zones. As noted above, the Portland
site consumed only 250 kWh of electric resistance supplemental heat in the secondary zones over the
entire monitoring period, which represents approximately 2% of the energy load of the Portland home.1
Clearly, the DHP was able to maintain acceptable indoor temperatures over most of the study period.
The installation of a DHP was also evaluated as a demand management strategy. In this analysis, the
energy consumption of the homes was compared on an hourly basis to arrive at an “average” consumption
profile based on the heating source (electric resistance or DHP) and the magnitude of energy demand. As
can be seen in Figure 3.4 and Figure 3.5 below, the maximum consumption at the Portland site is of a
similar magnitude as the minimum use-hour at the Cloverdale site, despite strong similarities in home
construction and occupancy schedule. While the study’s small sample size makes it difficult to draw
conclusions from these results, the profiles for these two homes reinforce the impact of energy efficiency
as a demand management strategy.
In this comparison of heating system energy efficiency, the DHPs proved to be significantly more
efficient than resistance wall heaters and were able to consistently heat the interior space with minimal
use of supplemental wall heaters. Due to this dramatic decrease in heating energy consumption, DHPs
afforded a significant reduction in peak power consumption, as well as overall energy use. This research
has shown DHPs are an efficient and effective replacement for existing resistance wall heaters in
manufactured housing.
1 Calculated based on the DHP rated Heating Seasonal Performance Factor of 10 Bth/h/W (Mitsubishi 2007).

3.6
Figure 3.4. Portland Site Space and Water Heating Time of Day Consumption Profile
Figure 3.5. Cloverdale Site Space and Water Heating Time of Day Consumption Profile
More specific information about homeowner recruitment, metering strategy, data analysis, discussion,
and results is presented by Hewes and Peeks (2012).
3.2 Cost-Effective Ducts in Conditioned Space
A key efficiency criterion for high-performing homes and HVAC systems is tight, energy-efficient
duct work and duct design. The efficiency and comfort improvements associated with bringing ducts into
interior space have been widely recognized in the building science community, consistently showing
heating and cooling system energy savings of 10 to 20 percent (Lubliner et al. 2008, Hales and Baylon
2008; Fonorow et al. 2010). For example, the new draft Builders Challenge Program Requirements, a
3.7
certification program established by DOE’s Building America Program for high-performance new home
builders, will require ducts in conditioned space (DOE 2011b). The advantages of well-designed and
constructed interior duct systems are numerous. Interior ducts minimize outside air leakage through the
ducts, reduce conductive gains or losses through the duct work, eliminate indoor air quality impacts that
could be caused by the introduction of attic air to interior space, and provide improved thermal comfort
by maintaining a more consistent temperature, especially at equipment startup (Fonorow et al. 2010).
While the advantages of well-designed and constructed interior duct systems are recognized, original
implementation strategies for this approach have incurred additional costs and, thus, have not been widely
accepted in the building community. Many homes are still typically designed and built with duct systems
in the attic. Previous work by Fonorow et al. (2010) has documented a cost-effective strategy for
minimizing interior duct chase width and incorporating interior supply ducts as aesthetic features in the
interior home design. The cost-effectiveness of this duct strategy hinges on the elimination of return duct
work. This is accomplished while still allowing sufficient return air flow from closed bedrooms and other
secondary zones by using over-the-door transom returns. The return transom must be sized to provide
sufficient air flow between the bedroom and the main body of the house, typically 1.5 times the
cumulative supply duct area (Fonorow et al. 2010). This method of installing ducts in conditioned space
has been found to be cost comparable with other duct designs, because significant amounts of additional
duct work or insulation are not required. However, some builders have been concerned that homeowners
will not approve of the over-the-door transom method due to light and sound transmission or aesthetics.
Another strategy for returning air from secondary zones to the main zone with interior ducts is the use
of fully ducted returns. This is most commonly accomplished with return ducts being installed in a semi-
conditioned attic with spray foam on the roof deck. When compared to a fully ducted return system in a
semi-conditioned attic, a single return and over-the-door transom (referred to as transom duct design) has
many advantages. A transom duct design minimizes additional material requirements (spray foam and
return ductwork) and thus can be significantly less costly than the fully ducted return method with a
spray-foamed attic. Previous studies have found the transom return can be installed for $1.14/ft2 less than
the fully ducted design in an unvented attic approach, or $875 total for a 2,250 ft2 house (Fonorow et al.
2010). A builder who had participated in this study noted that when he switched from a fully ducted
return to the transom method he was able to receive a $600 cost reduction from the mechanical contractor
due to lower labor and material costs. In addition, the transom return duct design reduces heat
transmission from the semi-conditioned, unvented attic into or out of the ducts and more fully achieves
the benefits of interior duct work.
To provide data to support or refute the performance and cost of each duct design, PNNL’s
contractor, Florida Hero, evaluated the interior temperature and relative humidity conditions in
10 homes, 5 with fully ducted returns and 5 with single return transom duct designs. Specifically, the
indoor temperature and relative humidity conditions in the transom return homes were compared to the
homes with ducted returns. PNNL researchers used the data to validate the effectiveness of the duct and
whole-house ventilation system using each duct system and characterize their impacts on the distribution,
temperature, and humidity of conditioned air.
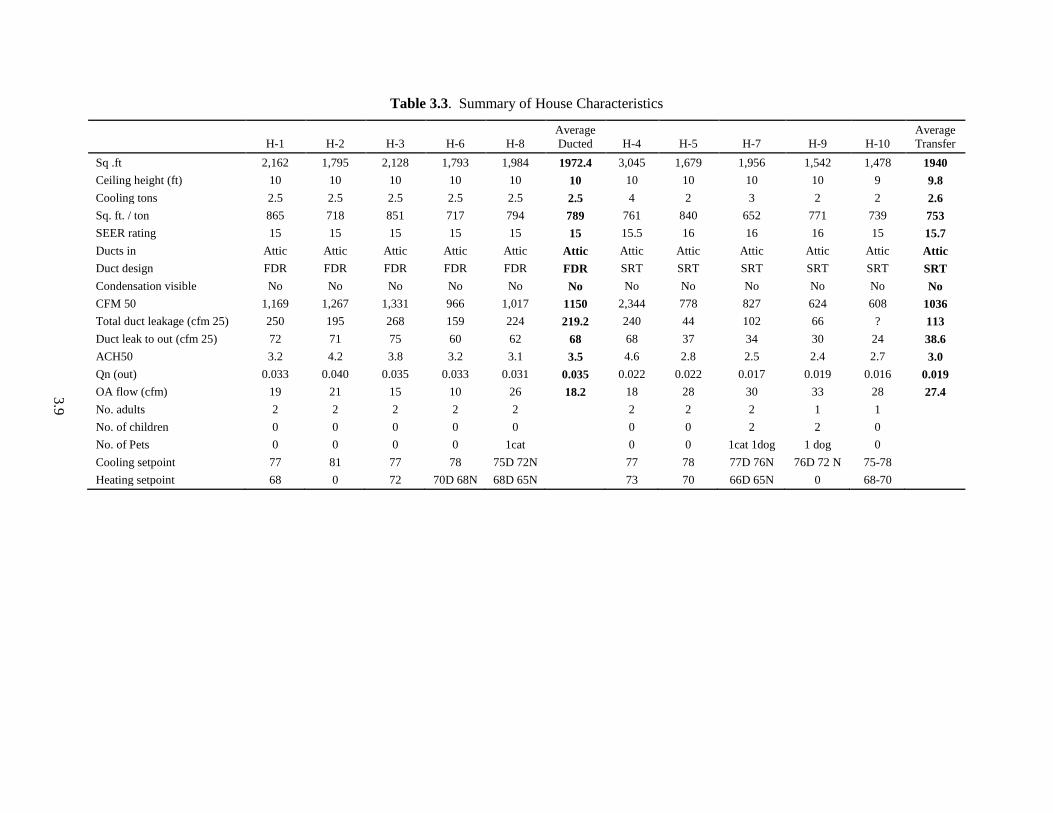
The characteristics of the 10 homes included in this study are summarized in Table 3.3. While built
by two different builders, the homes are very similar in construction and location. All of the homes are
slab on grade; 2x4 frame walls with sprayed insulation; double-pane, vinyl-frame, low-E windows; a
natural gas tankless water heater located outside of the home; and heat pumps with rating of 15-16
3.8
Seasonal Energy Efficiency Ratio (SEER) with air handlers located within the conditioned space. All
homes also have a run-time ventilation outside air system that brings in enough air to maintain the home
under positive pressure with respect to outside when the air handler is running. There is a manual damper
located directly at the point where the outside air flex duct terminates into the main return air plenum.
This damper is always left in the open position. The resulting outside air intake is not consistent with
American Society of Heating, Refrigerating and Air Conditioning Engineers 62.2 standards.
As can be seen in Table 3.3, a wide range of building footprints is included in this study, from
1,478 ft2 to 3,054 ft
2 for single return transom homes, which exhibits the applicability and effectiveness of
this duct strategy over a range of home sizes. Despite this difference in building square footage, the
homes have similar occupancy. The 10 homes have similar amounts of cooling capacity installed, in
terms of square foot per ton and the characteristics of the cooling equipment are also similar. One
primary benefit of the elimination of return duct work can be observed in the building and duct tightness
data. Although fully ducted return duct designs are, in principle, completely in conditioned space, the
implementation of the spray foam on the underside of the attic roof deck and the airtightness of the attic
can affect the success of this measure. It is difficult in practice to achieve a completely airtight boundary
at the roof deck, and thus additional building envelope leakage can be observed. In these 10 homes, the
homes with ducted returns were, on average, 11% leakier than the single return transom homes and their
relative leakage was 16% greater, with an average ACH50 value of 3.5 cfm50/ft2 compared to 3.0
cfm50/ft2 for the transom homes.
Because much of the duct work is eliminated in the single return transom duct design, this method
also drastically reduces overall duct leakage due to reduced duct surface area. On average, the homes
with the transom duct design had 94% less total duct leakage and 76% less duct leakage to the outside, as
shown in Table 3.3. These data illustrate the potential of the transom duct design to reduce installation
costs for ducts in conditioned space, while achieving greater energy savings from doing so, compared to
the ducted return in unvented attic method.
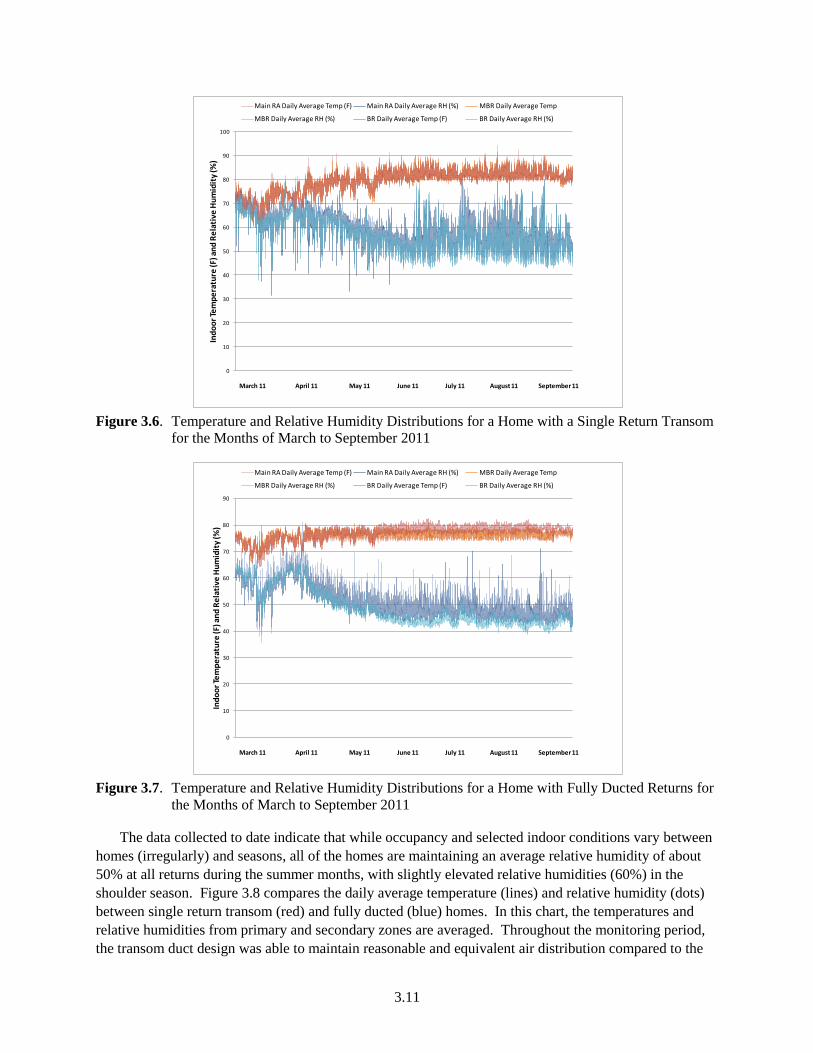
To collect temperature and relative humidity information in this study, temperature and relative
humidity data loggers (HOBOs) were placed on the face of the return air grilles. One was placed on the
main return air (Main RA), one on the master bedroom return (MBR), and one on the return of the room
with the highest heat gains/losses (BR). The occupants were informed not to make any changes to their
normal routine. A monthly site visit was made to each home to download the collected data from the
HOBOs and to visually monitor the homes for any signs of moisture-related issues. Data analysis
evaluated the temperature and moisture distributions achieved by each interior duct strategy, and
documented homeowner satisfaction with each approach. Figure 3.6 shows the representative
temperature and relative humidity distribution for a home with a single return transom at the three
monitoring locations, Main RA, MBR, and BR. Figure 3.7 shows the same for a house with fully ducted
returns. Both systems exhibit similar performance, with comparable temperature and relative humidity
profiles between the main and secondary zones of the home and maintenance of interior humidity
between 40 and 70%. The overlap observed between temperature and relative humidity distributions
indicates good air transfer and mixing between primary and secondary zones.
3.9
Table 3.3. Summary of House Characteristics
H-1 H-2 H-3 H-6 H-8
Average
Ducted H-4 H-5 H-7 H-9 H-10
Average
Transfer
Sq .ft 2,162 1,795 2,128 1,793 1,984 1972.4 3,045 1,679 1,956 1,542 1,478 1940
Ceiling height (ft) 10 10 10 10 10 10 10 10 10 10 9 9.8
Cooling tons 2.5 2.5 2.5 2.5 2.5 2.5 4 2 3 2 2 2.6
Sq. ft. / ton 865 718 851 717 794 789 761 840 652 771 739 753
SEER rating 15 15 15 15 15 15 15.5 16 16 16 15 15.7
Ducts in Attic Attic Attic Attic Attic Attic Attic Attic Attic Attic Attic Attic
Duct design FDR FDR FDR FDR FDR FDR SRT SRT SRT SRT SRT SRT
Condensation visible No No No No No No No No No No No No
CFM 50 1,169 1,267 1,331 966 1,017 1150 2,344 778 827 624 608 1036
Total duct leakage (cfm 25) 250 195 268 159 224 219.2 240 44 102 66 ? 113
Duct leak to out (cfm 25) 72 71 75 60 62 68 68 37 34 30 24 38.6
ACH50 3.2 4.2 3.8 3.2 3.1 3.5 4.6 2.8 2.5 2.4 2.7 3.0
Qn (out) 0.033 0.040 0.035 0.033 0.031 0.035 0.022 0.022 0.017 0.019 0.016 0.019
OA flow (cfm) 19 21 15 10 26 18.2 18 28 30 33 28 27.4
No. adults 2 2 2 2 2 2 2 2 1 1
No. of children 0 0 0 0 0 0 0 2 2 0
No. of Pets 0 0 0 0 1cat 0 0 1cat 1dog 1 dog 0
Cooling setpoint 77 81 77 78 75D 72N 77 78 77D 76N 76D 72 N 75-78
Heating setpoint 68 0 72 70D 68N 68D 65N 73 70 66D 65N 0 68-70

3.11
Figure 3.6. Temperature and Relative Humidity Distributions for a Home with a Single Return Transom
for the Months of March to September 2011
Figure 3.7. Temperature and Relative Humidity Distributions for a Home with Fully Ducted Returns for
the Months of March to September 2011
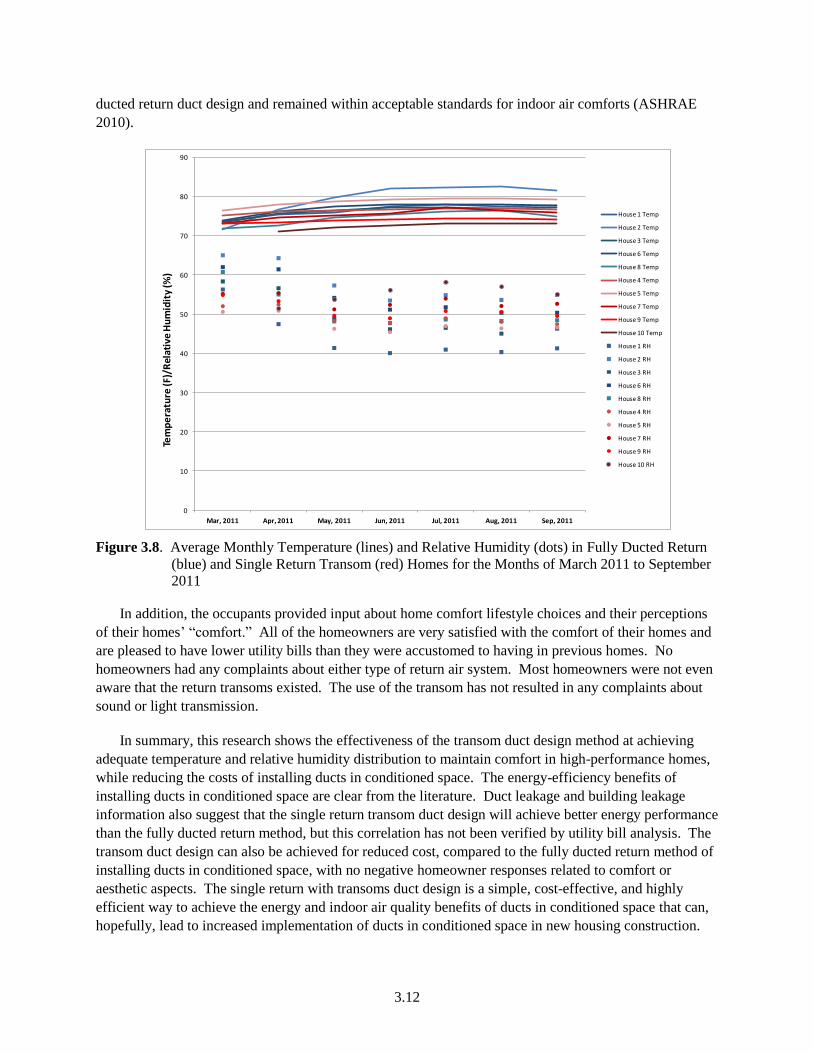
The data collected to date indicate that while occupancy and selected indoor conditions vary between
homes (irregularly) and seasons, all of the homes are maintaining an average relative humidity of about
50% at all returns during the summer months, with slightly elevated relative humidities (60%) in the
shoulder season. Figure 3.8 compares the daily average temperature (lines) and relative humidity (dots)
between single return transom (red) and fully ducted (blue) homes. In this chart, the temperatures and
relative humidities from primary and secondary zones are averaged. Throughout the monitoring period,
the transom duct design was able to maintain reasonable and equivalent air distribution compared to the
0
10
20
30
40
50
60
70
80
90
100
Ind
oo
r Te
mp
era
ture
(F) a
nd
Re
lati
ve H
um
idit
y (%
)
Main RA Daily Average Temp (F) Main RA Daily Average RH (%) MBR Daily Average Temp
MBR Daily Average RH (%) BR Daily Average Temp (F) BR Daily Average RH (%)
March 11 April 11 May 11 June 11 July 11 August 11 September 11
0
10
20
30
40
50
60
70
80
90
Ind
oo
r Te
mp
era
ture
(F) a
nd
Re
lati
ve H
um
idit
y (%
)
Main RA Daily Average Temp (F) Main RA Daily Average RH (%) MBR Daily Average Temp
MBR Daily Average RH (%) BR Daily Average Temp (F) BR Daily Average RH (%)
March 11 April 11 May 11 June 11 July 11 August 11 September 11
3.12
ducted return duct design and remained within acceptable standards for indoor air comforts (ASHRAE
2010).
Figure 3.8. Average Monthly Temperature (lines) and Relative Humidity (dots) in Fully Ducted Return
(blue) and Single Return Transom (red) Homes for the Months of March 2011 to September
2011
In addition, the occupants provided input about home comfort lifestyle choices and their perceptions
of their homes’ “comfort.” All of the homeowners are very satisfied with the comfort of their homes and
are pleased to have lower utility bills than they were accustomed to having in previous homes. No
homeowners had any complaints about either type of return air system. Most homeowners were not even
aware that the return transoms existed. The use of the transom has not resulted in any complaints about
sound or light transmission.
In summary, this research shows the effectiveness of the transom duct design method at achieving
adequate temperature and relative humidity distribution to maintain comfort in high-performance homes,
while reducing the costs of installing ducts in conditioned space. The energy-efficiency benefits of
installing ducts in conditioned space are clear from the literature. Duct leakage and building leakage
information also suggest that the single return transom duct design will achieve better energy performance
than the fully ducted return method, but this correlation has not been verified by utility bill analysis. The
transom duct design can also be achieved for reduced cost, compared to the fully ducted return method of
installing ducts in conditioned space, with no negative homeowner responses related to comfort or
aesthetic aspects. The single return with transoms duct design is a simple, cost-effective, and highly
efficient way to achieve the energy and indoor air quality benefits of ducts in conditioned space that can,
hopefully, lead to increased implementation of ducts in conditioned space in new housing construction.
0
10
20
30
40
50
60
70
80
90
Mar, 2011 Apr, 2011 May, 2011 Jun, 2011 Jul, 2011 Aug, 2011 Sep, 2011
Tem
pe
ratu
re (F
)/R
elat
ive
Hu
mid
ity
(%)
House 1 Temp
House 2 Temp
House 3 Temp
House 6 Temp
House 8 Temp
House 4 Temp
House 5 Temp
House 7 Temp
House 9 Temp
House 10 Temp
House 1 RH
House 2 RH
House 3 RH
House 6 RH
House 8 RH
House 4 RH
House 5 RH
House 7 RH
House 9 RH
House 10 RH
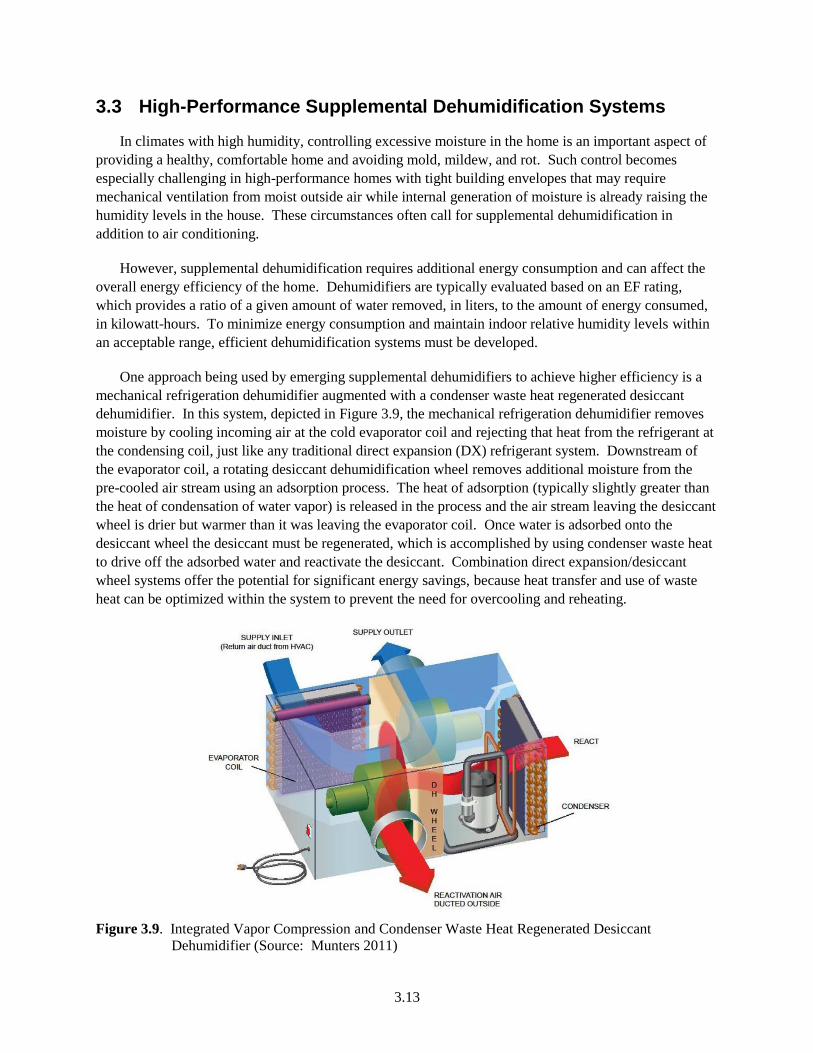
3.13
3.3 High-Performance Supplemental Dehumidification Systems
In climates with high humidity, controlling excessive moisture in the home is an important aspect of
providing a healthy, comfortable home and avoiding mold, mildew, and rot. Such control becomes
especially challenging in high-performance homes with tight building envelopes that may require
mechanical ventilation from moist outside air while internal generation of moisture is already raising the
humidity levels in the house. These circumstances often call for supplemental dehumidification in
addition to air conditioning.
However, supplemental dehumidification requires additional energy consumption and can affect the
overall energy efficiency of the home. Dehumidifiers are typically evaluated based on an EF rating,
which provides a ratio of a given amount of water removed, in liters, to the amount of energy consumed,
in kilowatt-hours. To minimize energy consumption and maintain indoor relative humidity levels within
an acceptable range, efficient dehumidification systems must be developed.
One approach being used by emerging supplemental dehumidifiers to achieve higher efficiency is a
mechanical refrigeration dehumidifier augmented with a condenser waste heat regenerated desiccant
dehumidifier. In this system, depicted in Figure 3.9, the mechanical refrigeration dehumidifier removes
moisture by cooling incoming air at the cold evaporator coil and rejecting that heat from the refrigerant at
the condensing coil, just like any traditional direct expansion (DX) refrigerant system. Downstream of
the evaporator coil, a rotating desiccant dehumidification wheel removes additional moisture from the
pre-cooled air stream using an adsorption process. The heat of adsorption (typically slightly greater than
the heat of condensation of water vapor) is released in the process and the air stream leaving the desiccant
wheel is drier but warmer than it was leaving the evaporator coil. Once water is adsorbed onto the
desiccant wheel the desiccant must be regenerated, which is accomplished by using condenser waste heat
to drive off the adsorbed water and reactivate the desiccant. Combination direct expansion/desiccant
wheel systems offer the potential for significant energy savings, because heat transfer and use of waste
heat can be optimized within the system to prevent the need for overcooling and reheating.
Figure 3.9. Integrated Vapor Compression and Condenser Waste Heat Regenerated Desiccant
Dehumidifier (Source: Munters 2011)
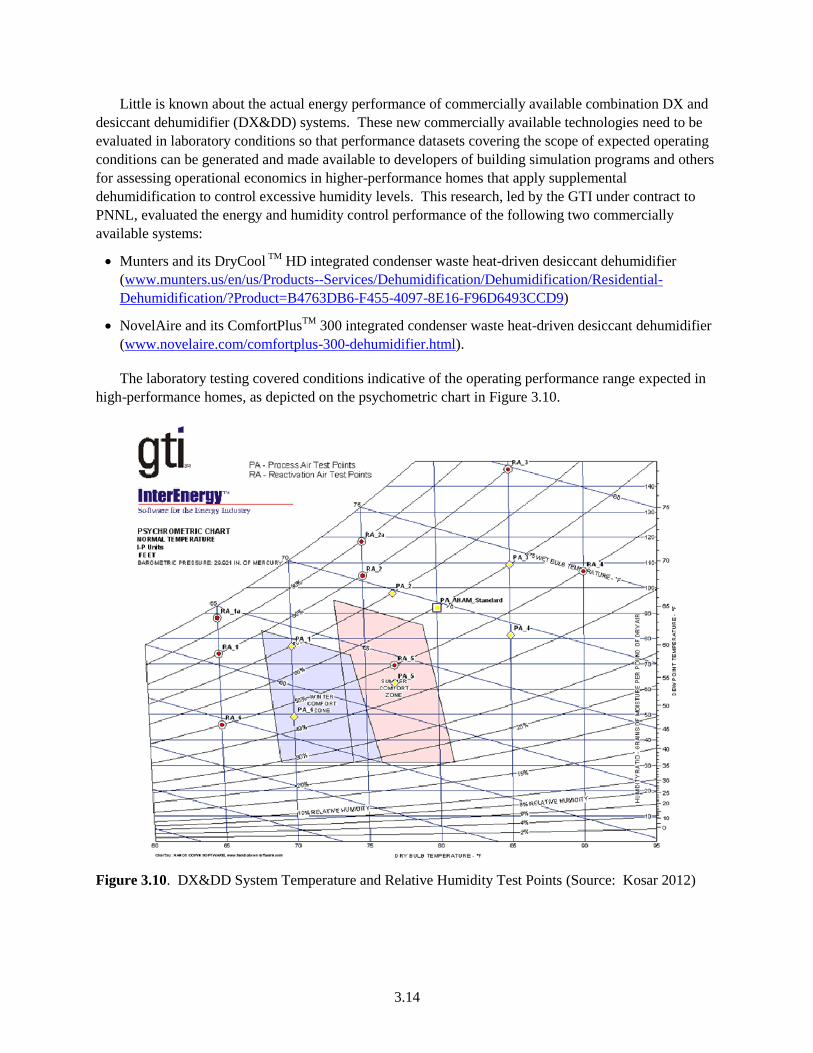
3.14
Little is known about the actual energy performance of commercially available combination DX and
desiccant dehumidifier (DX&DD) systems. These new commercially available technologies need to be
evaluated in laboratory conditions so that performance datasets covering the scope of expected operating
conditions can be generated and made available to developers of building simulation programs and others
for assessing operational economics in higher-performance homes that apply supplemental
dehumidification to control excessive humidity levels. This research, led by the GTI under contract to
PNNL, evaluated the energy and humidity control performance of the following two commercially
available systems:
Munters and its DryCool TM
HD integrated condenser waste heat-driven desiccant dehumidifier
(www.munters.us/en/us/Products--Services/Dehumidification/Dehumidification/Residential-
Dehumidification/?Product=B4763DB6-F455-4097-8E16-F96D6493CCD9)
NovelAire and its ComfortPlusTM
300 integrated condenser waste heat-driven desiccant dehumidifier
(www.novelaire.com/comfortplus-300-dehumidifier.html).
The laboratory testing covered conditions indicative of the operating performance range expected in
high-performance homes, as depicted on the psychometric chart in Figure 3.10.
Figure 3.10. DX&DD System Temperature and Relative Humidity Test Points (Source: Kosar 2012)

3.15
The tested moisture removal efficiency of the Munters DryCoolTM
HD system as a function of air inlet
temperature and relative humidity is shown in Figure 3.11.
Figure 3.11. Efficiency of Moisture Removal of Munters DryCool Dehumidifier in DX&DD Mode as a
Function of Air Inlet Temperature (process air refers to the incoming air to be dehumidified
and regeneration air refers to the air heated by the condenser used to regenerate the
desiccant; Kosar 2012)
Like the Munters DryCoolTM
HD unit, the NovelAire ComfortPlusTM
300 achieved laboratory
performance comparable to its nominal rating. However, several issues were encountered with the
NovelAire system, so only limited testing was accomplished in the laboratory. The most limiting issue
was the presence of a regeneration fan controller that automatically varied its speed to maintain a preset
condenser (regeneration) temperature. As a result, maintenance of steady-state conditions was not
possible at most of the proposed test points. The test plan for this unit was revised to reflect these
limitations.
Unfortunately, the literature on these two desiccant humidifiers does not present energy-efficiency
parameters, so we are not able to compare test results to literature values. Sufficient data were presented
in the literature to allow for a comparison of dehumidification capacity, which is presented in Table 3.4.
Table 3.4. Manufacturer and Curve Fit Model Dehumidification Capacity Comparison
Dehumidification Capacity
(latent cooling in pints/day) Munters DryCool TM
HD NovelAire ComfortPlus TM
300
Approximate operating parameters for
regeneration air inlet process air inlet
90 °F db/60%RH
80 °F db/60%RH
85 °F db/60%RH
78 °F db/67%RH
Manufacturer literature/software 120 pints/day 200 pints/day
Curve fit model 104 pints/day 204 pints/day
% difference -13% +2%
db= dry bulb; RH = relative humidity
3.16
One reason more information about energy performance is not readily available for these units is that
this integrated dehumidifier product type, with a secondary (regeneration) airstream, does not meet the
dehumidifier equipment definition in ANSI/AHAM DH-1-2008 (AHAM 2008) and CAN/CSA C749-
2007 (CSA 2007), and hence does not qualify for EF labeling in liters per kilowatt-hour as do the other
self-contained (packaged), electrically operated, mechanically refrigerated dehumidifiers covered by
those standards. A Moisture Removal Efficiency term with the same units as EF was used to present
research results for the integrated dehumidifiers with a secondary (regeneration) airstream tested for this
project.
The laboratory datasets from this evaluation were to generate performance algorithms that can be
used to model DX&DD systems in EnergyPlus simulation software. The modeling methodology, dictated
by the EnergyPlus component-based modeling structure and developed jointly by GTI and National
Renewable Energy Laboratory, required modeling the DX&DD type dehumidifier with separate
performance algorithms for the two major components (desiccant wheel, DD, and cooling coil, DX). To
generate these two algorithms, the performance of only the DD system, with the DX refrigerant loop
inoperative, was characterized in addition to the combined DX&DD performance. The desiccant-only
performance was then subtracted from the combined DX&DD system performance to arrive at the
separate DX system performance. This research successfully generated representative parameters for a
DX&DD algorithm in EnergyPlus based on the test data. However, the statistical quality of the derived
DX system parameters was questionable (R2<0.85). Kosar (2012) recommends that the EnergyPlus
development team implement a “black box” model in EnergyPlus to execute simulations of DX&DD
products, directly using the higher quality DX&DD performance modeling algorithm developed from the
laboratory dataset.
More detailed discussion about system testing, test data, and algorithm development is presented by
Kosar (2012).
3.4 Conclusions
Because heating and cooling accounts for 40% of annual energy usage, cost-effective energy-efficient
HVAC systems are crucial to achieving comfortable and energy-efficient new homes (DOE 2009).
HVAC systems should improve the comfort and indoor air quality of the home by reducing temperature
fluctuations, controlling humidity, and decreasing uncontrolled infiltration of air into the home.
Research related to the use of DHPs in manufactured housing in the Pacific Northwest found that
DHPs are 2.3 to 2.6 times as energy efficient as electric resistance wall heaters and can provide adequate
heating and cooling with minimal use of supplemental heating in secondary zones. Because of this
improvement in energy efficiency, the use of DHPs should also be considered as an important load-
reducing measure.
Installing all duct work in conditioned space can also be an important energy-saving measure,
because it limits air leakage and heat transfer through the ducts. This research explored a cost-effective
strategy for installing ducts in conditioned space using over-the-door transoms instead of a fully ducted
return to save $1.14/ft2, while achieving comparable air distribution and humidity control. The single
return with transom duct design also appears to significantly reduce duct leakage and is expected to result
in a more energy-efficient duct design due to reduced duct runs.

3.17
Moisture management is also an extremely important consideration in high-performance tight homes.
Effectively controlling indoor humidity in hot humid climates, with minimal additional energy
consumption, is an active area of research. Research conducted by GTI under contract to PNNL explored
combined direct expansion mechanical refrigeration and desiccant dehumidifiers, which have the
potential to achieve energy savings over traditional dehumidification systems because they minimize the
amount of overcooling that occurs to dry air and can use a waste heat stream from the refrigerant
condenser to regenerate the desiccant. Researchers found a moisture-removal efficiency of 2.0 to 4.5
L/kWh over a range of operating conditions. However, little is published in the literature about the
performance of these innovative systems, in large part due to the lack of applicable standards to rate such
equipment. Thus, it is difficult to compare this performance to other published values. Instead,
researchers developed performance algorithms that can be used to model DX&DD systems in EnergyPlus
simulation software. These EnergyPlus models can then be used to understand the potential of these
systems to decrease whole-house energy consumption in high-performance new homes.


4.1
4.0 Energy-Efficient Domestic Hot-Water Systems
After heating and cooling energy consumption, domestic hot-water use is the next greatest contributor
to whole-house energy consumption, about 14 to 25% (DOE 2011b). Thus, efficient domestic hot-water
heaters can be a key part of achieving an energy-efficient home. One technology that can save a
significant amount of energy is a tankless or on-demand hot-water heater. This technology eliminates
standby losses associated with tank water heaters because they only heat water when water is called for.
The energy savings potential of tankless hot-water heaters depends on the volume of water use per day.
For homes which have very small hot-water loads, tankless hot-water heaters can provide significant
savings because the tank standby load is fixed and represents a large portion of that home’s hot-water
load. The DOE (2011b) estimates savings of 24 to 34% for homes that use 41 gpd. For homes with
larger hot-water loads, the standby tank losses are not as large a percentage of the homes’ total hot-water
load and the energy-efficiency improvement is reduced. For example, savings will only be 8 to 14% for
homes that use 86 gpd (DOE 2011b).
To evaluate the actual energy savings achieved in the field, PNNL contracted with WSU to evaluate
the hot water heater performance in two new housing developments at Joint Base Lewis McChord
(JBLM) as part of a larger study. WSU compared the hot water heater energy usage from the two
developments, one with tankless hot water heaters and one with traditional tank water heaters, to verify
the energy savings associated with tankless hot water heaters in practice.
Since 2005, WSU has been working with Equity Residential, the developer on the JBLM near
Tacoma, Washington. This partnership has led to the construction of more than
450 duplex and triplex modular units at Discovery Village and 34 at Miller Hills
160 modular row homes at Town Center phase 1
32 single-family site-built homes at Westcott Hills and 62 homes at Cascade Village.
In addition, WSU is providing technical assistance to the following current projects underway and in the
design stage:
60 modular multifamily homes at Town Center phase 2 over mixed-use space
826 homes similar to Westcott and Cascade as part of the new “Grow the Army” (GTA) phase 1
(280 single family and duplex homes).
The newest housing units at JBLM were built in 2008 at Miller Hill (part of Discovery Village).
These 34 units have high-efficiency tankless natural gas hot-water heaters (EF=0.82). To identify the
natural gas savings associated with these tankless hot-water heaters, researchers compared the natural gas
use of Miller Hill units with similar units in Discovery Village. The Discovery Village units have power-
vented natural-gas storage water heaters (EF=0.62).
Researchers compared the 34 Miller Hill units to two different groups of Discovery Village units—
units with similar plans that have four bedrooms (136), and a set of units flagged by JBLM as being the
most similar to Miller Hill (86). Number of occupants is one of the key determinants of hot-water use.
By comparing similar units with the same number of bedrooms, researchers are more likely to be
comparing units with similar numbers of occupants and hot-water usage patterns.

4.2
Researchers used two methods to estimate the energy savings from the tankless hot-water heaters. In
one method they used a regression model to compare the natural gas baseload in four-bedroom Discovery
Village units with Miller Hill units. This analysis found the tankless hot-water heaters contributed to a
22% savings in baseload natural gas consumption, or 51 therms. The 95 percent confidence interval is 20
to 82 therms, which is relatively large due to the small sample size.
The second analysis method used actual utility bills to compare natural gas use for summer months
when researchers would expect minimal to no space heating. Because many Miller Hills units were not
occupied until mid-way through 2009, researchers considered natural gas use for four summer month
periods. Table 4.1 shows the results of this comparison.
Table 4.1. Hot-Water Utility Billing Analysis in Discovery Village and Miller Hill
Units
Aug/Sep
2009
(therms) Units
Jun/Jul
2010
(therms) Units
Jul/Aug
2010
(therms) Units
Aug/Sep
2010
(therms) Units
DV-4Bdrm 136 21.2 96 22.8 120 21.2 103 23.7 119
DV-Flagged 86 21.7 57 23.3 71 21.4 64 24.3 76
Miller Hill 34 17.6 25 18.1 29 17.4 22 19.7 30
Savings-4Bdrm 4.1 5.2 4.0 4.6
Savings-Flagged 3.7 4.8 3.8 4.1
This analysis also found natural gas use for Miller Hill to be lower than each of the Discovery Village
comparison groups, and the difference is statistically significant for all four months at a 95% confidence
level. The average savings values for the units (4 bedrooms) suggest the tankless water heaters are saving
about 4.5 therms per month or about 20% of summer natural gas consumption.
The savings estimates for the two methods are similar at approximately 50 therms per year, which is
slightly less than the 24% predicted based on the EF values alone. Caution should be used in interpreting
these results, because the number of Miller Hill units with tankless water heaters is small. While
researchers are confident the tankless water heaters are saving energy, further research is warranted to
confirm similarities with the Discovery Village units and larger sample sizes would provide more robust
savings estimates.

5.1
5.0 References
ACCA (Air Conditioning Contractors of America). 2005. Manual J: Residential Load Calculation,
Eighth Edition. Arlington, Virginia. Available at www.acca.org
AHAM (Association of Home Appliance Manufacturers). 2008. ANSI/AHAM DH-1-2008.
Dehumidifiers. Washington, D.C. Available at http://www.aham.org/ht/d/ProductDetails/sku/4042-120-
210/from/714/pid/.
ASHRAE (American Society of Heating, Refrigerating and Air Conditioning Engineers). 2010. Thermal
Environmental Conditions for Human Occupancy (ANSI approved).Standard 55-2010, Atlanta, Georgia.
Available at www.ashrae.org.
CSA (Canadian Standards Association). 2007. CAN/CSA C749-2007 Performance of Dehumidifiers.
Mississauga, Ontario, Canada. Available at http://shop.csa.ca/en/canada/energy-efficiency/cancsa-c749-
07/invt/27000742007/.
DOE (U.S. Department of Energy). 2010. “Builders Challenge: Homebuyers.” U.S. Department of
Energy Builders Challenge Website. Available
athttp://www1.eere.energy.gov/buildings/challenge/homebuyers.html. Last updated: 05/06/2010. Visited
03/21/2012.
DOE (U.S. Department of Energy). 2011a. “Draft Builders Challenge National Program Requirements.”
DOE Office of Energy Efficiency and Renewable Energy, Building Technologies Program, Washington,
D.C. Available at http://www1.eere.energy.gov/buildings/challenge/.
DOE (U.S. Department of Energy). 2011b. “Energy Savers: Water Heating.” U.S. Department of
Energy; Energy Savers Website. Available at
http://www.energysavers.gov/your_home/water_heating/index.cfm/mytopic=12760. Last updated:
02/09/2011. Visited 03/21/2012.
DOE (U.S. Department of Energy). 2009. “Table 2.1.6, 2010 Residential Energy End-Use Splits, by
Fuel Type.” In U.S. Department of Energy Building Energy Data Book. Washington, D.C. Available at
http://buildingsdatabook.eren.doe.gov/TableView.aspx?table=2.1.6.
EIA (U.S. Energy Information Administration). 2011. “Annual Energy Review: Total Energy Flow.”
Washington, D.C. Available at: http://205.254.135.7/totalenergy/data/annual/diagram1.cfm.
Fonorow K, D Jenkins, S Thomas-Rees, and S Chandra. 2010. ACEEE Summer Study on Energy
Efficiency in Buildings, August 15-20, 2010. FSEC-PF-451-10, Florida Solar Energy Center. Pacific
Grove, California.
Hales D and D Baylon. 2010. “Moving Ducts into Conditioned Space: Getting to Code in the Pacific
Northwest.” ASHRAE Transactions, 116, Part 1.
Hewes T and B Peeks. 2012. Field Monitoring of Two New Manufactured Homes in the Pacific
Northwest. Northwest Energy Works, Inc., Corvallis, Oregon.

5.2
International Code Council. 2011. 2012 International Energy Conservation Code. Washington, D.C.
Kosar D. 2012. Evaluation of Selected Supplemental Dehumidification Equipment. Gas Technologies
Institute, Des Plaines, Illinois.
Lubliner M, R Kerr, A Gordon, and C Murray. 2008. “Moving Ducts Inside: Big Builders, Scientists
Find Common Ground.” In Proceedings From The 2008 ACEEE Summer Study on Energy Efficiency in
Buildings. ACEEE, Washington, D.C. www.aceee.org.
Lubliner M, L Mattheis, L Howard, R Kunkle, K Eklund, and M Blasnik. 2012. Baseline Energy
Performance and Opportunities to Improve Energy Efficiency in Family Military Housing. WSUEEP12-
005, Washington State University Energy Program, Olympia, Washington.
McIlvaine J, D Chasar, D Beal, K Sutherland, D Parker, and K Abbott. 2012. Partnership for High
Performance Housing Final Report. FSEC-CR-1911-12, Florida Solar Energy Center, Cocoa, Florida.
McRae, M, N Harris, and A Armstrong. 2010. Northwest Ductless Heat Pump Pilot Project. Market
Evaluation Report #2, Northwest Energy Efficiency Alliance, Portland, Oregon.
Munters. 2011. DryCoolTM
HD Hesiccant Dehumidifier. Available at
http://webdh.munters.com/webdh/BrochureUploads/Product%20Guide-%20DryCool%20HD.pdf.
Salzberg E, K Morgan, and M Lubliner. 2012. Technical Solutions for High Performance Habitat
Homes in Washington State. WSUEEP12-011, Washington State University Energy Program, Olympia,
Washington.
Sherman MH and NE Matson. 1997. “Residential ventilation and energy characteristics.” LBNL-39036.
ASHRAE Transactions (1):717–730. Available at: http://epb.lbl.gov/publications/lbl-39036.pdf.

