afghanistan economic update - world bank · pdf fileafghanistan economic update ... this...
TRANSCRIPT

October2012
PovertyReduction,andEconomicManagement,SouthAsiaRegion
TheWorldBank
AfghanistanEconomicUpdate
Picture: Aynak mine in Logar province, Afghanistan
Pub
lic D
iscl
osur
e A
utho
rized
Pub
lic D
iscl
osur
e A
utho
rized
Pub
lic D
iscl
osur
e A
utho
rized
Pub
lic D
iscl
osur
e A
utho
rized
Pub
lic D
iscl
osur
e A
utho
rized
Pub
lic D
iscl
osur
e A
utho
rized
Pub
lic D
iscl
osur
e A
utho
rized
Pub
lic D
iscl
osur
e A
utho
rized
1
Afghanistan Economic Update October 2012
Summary1
Afghanistan is in a state of transition which involves the handover of security responsibilities from
international forces to the Afghan government. This process is characterized by more political and
security uncertainty. However, at present, Afghanistan’s economy is growing strongly as a result of an
exceptionally good harvest this year. Real GDP growth will most likely close the calendar year at around
10 percent, a significant increase from last year’s 7.3 percent. The services and construction sectors
continue to grow strongly, driven mostly by continued high military spending and external aid. The good
harvest has also brought Afghanistan to near food self‐sufficiency and slowed inflation to 4.6 percent in
July 2012 (y‐o‐y).
Revenue collection and budget execution has been higher than at the same time last year, but have
missed quarterly fiscal targets. Changes to the budget calendar and prolonged parliamentary discussions
have shortened the time frame for the execution of this year’s budget and will make it challenging for
the government to meet fiscal targets.
The banking sector is still recovering from the Kabul Bank crisis. The authorities made little progress in
recovering the assets owned by the previous shareholders and related parties of Kabul Bank and
subsequently shifted their asset recovery strategy. The privatization of New Kabul Bank (NKB) is moving
forward but there is a risk of insufficient interest from the investor community to buy NKB. Sector‐wide
audits have revealed considerable weaknesses at all levels of banking governance and operations, which
also affect the micro finance sector.
Progress in the mining sector is clouded by uncertainty about a new mineral law. While investor interest
in the sector is encouraging, gaps in the legal and regulatory framework of the sector do not provide
sufficient confidence to investors to start operations or make firm commitments. A new law is in
preparation but has also been heavily debated.
The medium‐term outlook for Afghanistan remains optimistic. At the Tokyo conference in July, donors
pledged sufficient funds to fill the financing gap, and this should allow the government to sustain
development gains and continue making progress towards achievement of the UN’s Millennium
Development Goals. Nevertheless, the transition process and the upcoming presidential elections will
further increase uncertainty in the medium term and will likely take a toll on investor confidence.
1 This update was prepared by Claudia Nassif with inputs from Guillemette Sidonie Jaffrin, Luke Simon Jordan, Camilo Gomez Osorio, and Mohammed Edreess Sahak.

2
Recent Economic Developments
GDP and its Components
Afghanistan’s economic growth prospects for 2012 give cause for optimism. Although real GDP growth
slowed, to 7.3 percent in 2011 (from 8.4 percent the year before), due mainly to unfavorable weather
and a poor harvest, the agriculture sector rebounded strongly in 2012 and is expected to boost
economic growth to over 10 percent.
Agriculture is an important but volatile component of economic growth. Due to the importance of the
sector in the economy (between 20‐30 percent of GDP depending on harvest), changes in agriculture
output have a large influence on GDP growth (Figure 1). Wheat accounts for three‐fourths of aggregated
agriculture output and is the most important licit crop in Afghanistan. However, more than 70 percent of
the wheat production is rain‐fed and, hence, highly weather dependent. The good weather conditions at
the turn of the year, for instance, resulted in a growth of 27 percent over last year’s harvest. This
brought the sector
close to the record harvest
levels of 2009, (which came
close to self‐sufficiency in
cereals) and improved
economic growth prospects in
2012 (Table1 and Box 1). This
demonstrates that further
investment in irrigation
systems, among other
interventions, has the
potential to significantly
stabilize Afghanistan’s growth
path and reduce food insecurity.
Services increased further in 2011. Services, which account for about half of GDP, grew by over 12
percent in 2011. Telecommunication, transport, and public services were the most dynamic subsectors.
The Ministry of Communications and Technology reported a 21 percent increase in ICT service
subscriptions over the past year. The demand for transportation and distribution was fuelled by
continuously high donor aid inflows and security‐related trade. The strong performing
telecommunication sector continued to expand with release of the first two 3G licenses. The
government‐owned, corporatized Afghan Telecom drastically reduced its wholesale prices for Internet
bandwidth in 2012 from US$900 to US$300 which led to further decline in end‐consumer prices for
Internet service and nearly doubled Internet usage. However, with end‐consumer prices between
US$200 and US$500 for high‐speed Internet packages, such services remain unaffordable for the
majority of the population, even those who have access to electricity and information technology.
Table 1: Cereal Balance 2008‐2012
Source: Ministry of Agriculture, Irrigation and Livestock

3
Mining saw progress in the development of oil and gas resources. Up to now, the mining sector has
contributed little to domestic production (less than 1 percent, Figure 1) and growth, but current
developments are promising with the planned large‐scale investment in Aynak (copper) and Hajigak
(ore). Earlier this year, the Amu Darya oil basin began production at its first well, and appears on track
to produce 150,000 barrels of crude oil in 2012.
This is modest production, but represents a
significant milestone in the development of the
sector. The basin is expected to ramp up quickly
over the following two years to 15,000‐30,000
barrels per day. At those levels the oil
production could add some US$150 million‐
US$200 million per year to fiscal revenues. The
developers are also actively exploring
investment in a mid‐scale refinery, at a cost of
US$300 million‐US$500 million which, if
realized, would give Afghanistan a domestic
supply of petroleum products for the first time.
At the same time, expressions of interest were
received for the Afghan‐Tajik basin, estimated
to hold around 700 million barrels of oil. Lastly,
the operational rehabilitation of the
Sheberghan gas fields may be nearing reality, with rehabilitation work on the pipeline to Mazar‐i‐Sharif
set to be rehabilitated in the first half of 2013. On the other hand, the development of the gas sector
will require urgent attention to the pricing and allocation of gas among domestic users (such as power
generation and CNG).
Opium production is expected to increase in 2012. According to the 2012 survey carried out by United
Nations Office on Drugs and Crime (UNODC), total farm‐gate income reached US$1.4 billion in 2011,
equivalent to 9 percent of GDP. The export earnings from opium production are estimated at US$2.4
billion (15 percent of GDP). Two main factors contributed to the trend: In 2010, plant disease nearly
halved crop production, leading to crop scarcity. The resulting high price speculation motivated farmers
to increase opium cultivation. This was compounded by a domestic decline in wheat prices, which
resulted in a larger relative profit margin and a higher incentive for opium production. Gross income
from opium was 11 times higher than for wheat in 2011, thus making opium a much more attractive
crop to harvest. Consequently, land used for opium cultivation increased by 7 percent and opium
production increased by 61 percent. This trend might continue over the next year: the decrease in
wheat prices will improve the terms of trade for opium and might provide an incentive for higher opium
production. Also, households affected by the transition process might increase opium production as a
coping strategy for losses in wage labor (see Economic Outlook further below).
On the demand side, private consumption accounted for more than half of GDP growth (4.2
percentage points of GDP growth in 2011/122). Consumption growth is tied closely to the security
2 The government reports data using the Persian solar year as a reference point which covers the period from March 21 to March 20. Some agencies have started referring to the Gregorian calendar in their data reporting. To simplify
Figure 1: Share of Sectors in GDP
Source: Central Statistics Office, National Accounts 2011
4
economy, which generates demand for goods and services, equipment and operations and maintenance
of the national army, as well as to donor spending. On‐budget donors financing for security related
purposes and civilian development projects surpassed the levels of previous years. Private investment
accounts for only a small proportion of demand (around 4 percent of GDP growth) and contributes little
to GDP growth (0.2 percentage points in 2011/12). It is, however, expected to rise over the years with
the development of the mining industry. This should also affect the contribution of exports to growth,
which is currently marginal at about 0.3 percentage points.
External Sector
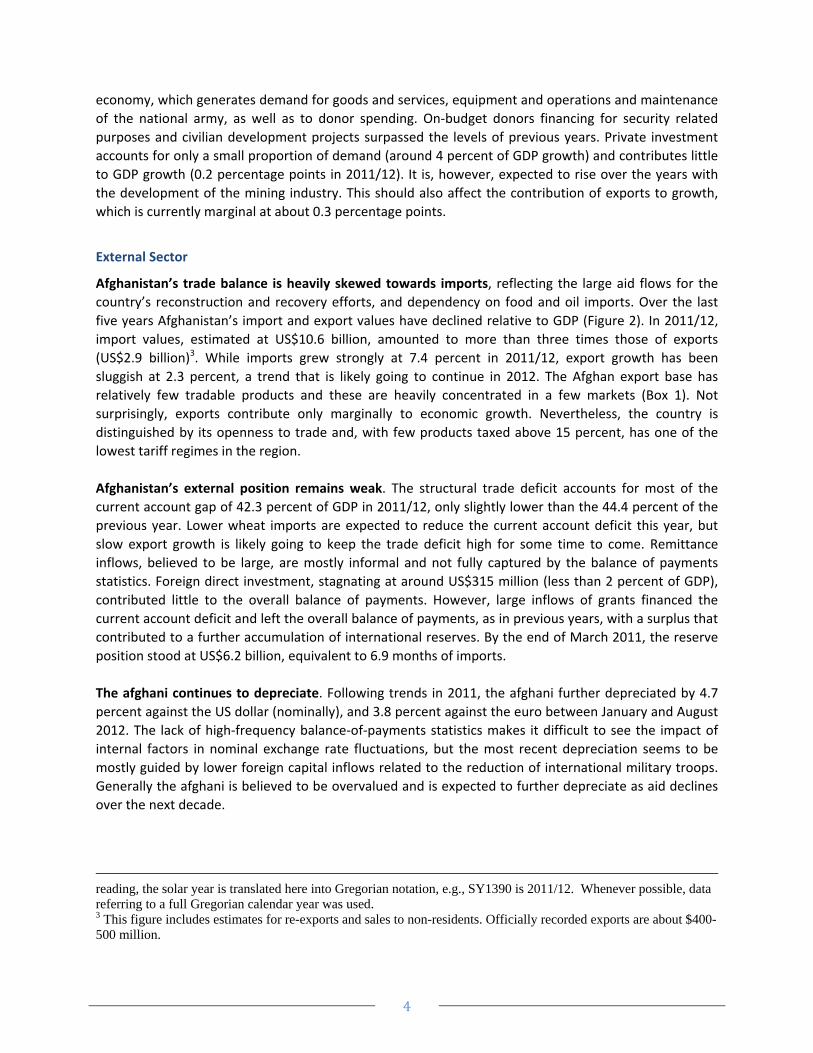
Afghanistan’s trade balance is heavily skewed towards imports, reflecting the large aid flows for the
country’s reconstruction and recovery efforts, and dependency on food and oil imports. Over the last
five years Afghanistan’s import and export values have declined relative to GDP (Figure 2). In 2011/12,
import values, estimated at US$10.6 billion, amounted to more than three times those of exports
(US$2.9 billion)3. While imports grew strongly at 7.4 percent in 2011/12, export growth has been
sluggish at 2.3 percent, a trend that is likely going to continue in 2012. The Afghan export base has
relatively few tradable products and these are heavily concentrated in a few markets (Box 1). Not
surprisingly, exports contribute only marginally to economic growth. Nevertheless, the country is
distinguished by its openness to trade and, with few products taxed above 15 percent, has one of the
lowest tariff regimes in the region.
Afghanistan’s external position remains weak. The structural trade deficit accounts for most of the
current account gap of 42.3 percent of GDP in 2011/12, only slightly lower than the 44.4 percent of the
previous year. Lower wheat imports are expected to reduce the current account deficit this year, but
slow export growth is likely going to keep the trade deficit high for some time to come. Remittance
inflows, believed to be large, are mostly informal and not fully captured by the balance of payments
statistics. Foreign direct investment, stagnating at around US$315 million (less than 2 percent of GDP),
contributed little to the overall balance of payments. However, large inflows of grants financed the
current account deficit and left the overall balance of payments, as in previous years, with a surplus that
contributed to a further accumulation of international reserves. By the end of March 2011, the reserve
position stood at US$6.2 billion, equivalent to 6.9 months of imports.
The afghani continues to depreciate. Following trends in 2011, the afghani further depreciated by 4.7
percent against the US dollar (nominally), and 3.8 percent against the euro between January and August
2012. The lack of high‐frequency balance‐of‐payments statistics makes it difficult to see the impact of
internal factors in nominal exchange rate fluctuations, but the most recent depreciation seems to be
mostly guided by lower foreign capital inflows related to the reduction of international military troops.
Generally the afghani is believed to be overvalued and is expected to further depreciate as aid declines
over the next decade.
reading, the solar year is translated here into Gregorian notation, e.g., SY1390 is 2011/12. Whenever possible, data referring to a full Gregorian calendar year was used. 3 This figure includes estimates for re-exports and sales to non-residents. Officially recorded exports are about $400-500 million.

5
Box 1: Trade in Afghanistan
A recent Trade Diagnostic Study (World Bank, 2012) concluded that Afghanistan could benefit far more from its
international trade opportunities than it does at present. The country is underperforming in exports, with an
unusually narrow export base concentrated in just a few markets. Exports contributed 16 percent of GDP in
2011, whereas a country of Afghanistan’s income level should expect to be exporting closer to 30 percent of
GDP (Figure 2).
Carpets and fruits account for close to three‐quarters of total exports. The composition of exports has changed
over the last five years, with dry fruits and seeds becoming the largest official Afghan export, now amounting to
around 51 percent of total exports, surpassing carpets, which dropped to 38 percent of exports from its earlier
60 percent share (Figure 3). Export of fresh fruits accounted for only 6 percent of export trade. The remaining 10
percent of exports consists of leather, spices, and medicinal plants.
Afghanistan’s largest export market is Pakistan (48 percent of all exports), followed by India (19 percent) and
Iran (10 percent). Afghanistan’s traditional exports lost ground in the EU, and the trade performance of existing
exports to new markets did not compensate for this decline. Afghan exports have risen with the introduction of
new products, such as oil seed and lac, gums, and raisins to Asia and the Middle East/North Africa.
There are several challenges to export development and competitiveness of Afghanistan’s exports. Firstly, the
cost of trade is unduly high. Security risk, bad infrastructure and high levels of corruption are the main cost
drivers for domestic traders, while constrained access to markets and increasing costs of transportation and
transactions are limitations in both directions. Secondly, the bulk of Afghan exports are primary products which
have little added value. Finally, there is a low primary material base and limited domestic production facilities
for manufacturing processes – factors that constrain development of a manufacturing sector.
Figure 2: Export Ratios Relative to Country Incomes Figure 3: Composition of Exports, FY2012 (%)
Source: World Bank (2012): Afghanistan Trade Diagnostics Study
AFG BGD
BTN
IND
IRN
KAZ
KGZ
LKA
NPL PAK
TJK
TKM
UZB
020
4060
8010
0E
xpo
rt to
GD
P (
%)
200
6-0
8
6 7 8 9 10 11Log of GDP per capita (PPP 2006-08)
Dried fruits, 31.0
Carpets, 13.0
Medical plants, 12.0
Fresh fruits, 2.0
Seeds, 1.1
Skin and wool, 7.3
other, 33.6
6
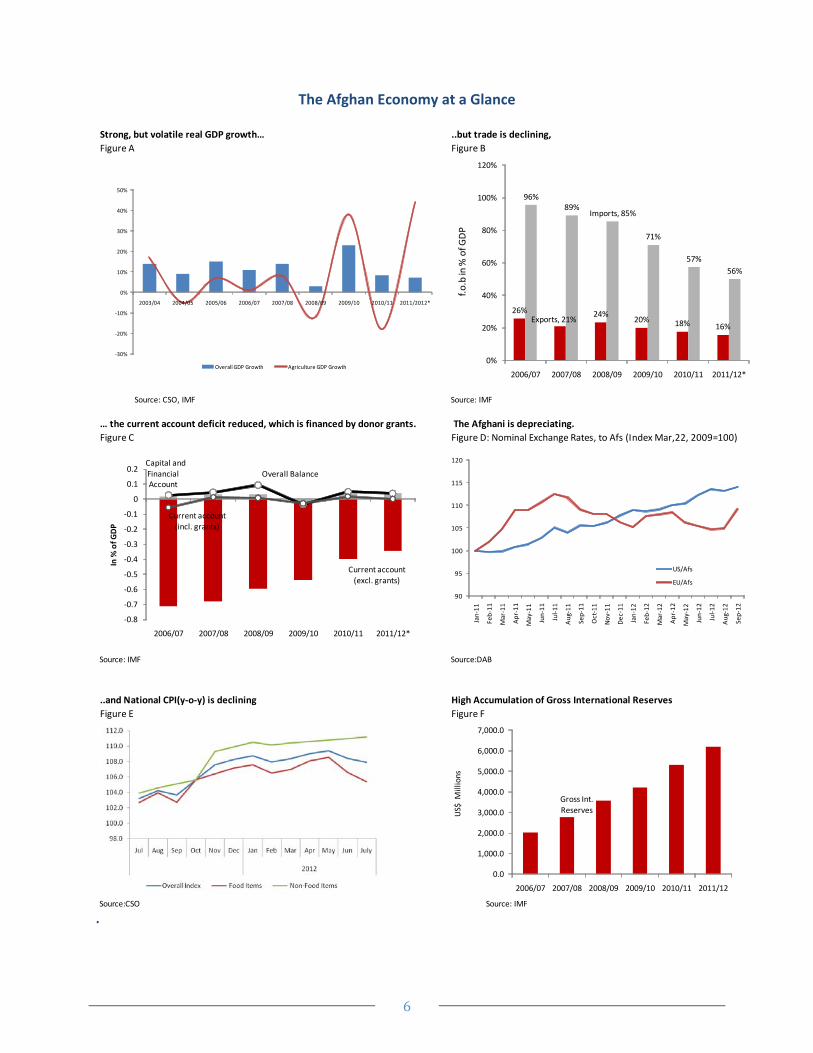
The Afghan Economy at a Glance
.
Strong, but volatile real GDP growth… ..but trade is declining,
Figure A Figure B
Source: CSO, IMF Source: IMF
… the current account deficit reduced, which is financed by donor grants. The Afghani is depreciating.
Figure C Figure D: Nominal Exchange Rates, to Afs (Index Mar,22, 2009=100)
Source: IMF Source:DAB
..and National CPI(y‐o‐y) is declining High Accumulation of Gross International Reserves
Figure E Figure F
Source:CSO Source: IMF
Capital and Financial Account
Current account (excl. grants)
Overall Balance
Current account (incl. grants)
‐0.8
‐0.7
‐0.6
‐0.5
‐0.4
‐0.3
‐0.2
‐0.1
0
0.1
0.2
2006/07 2007/08 2008/09 2009/10 2010/11 2011/12*
In % of G
DP
26%Exports, 21%
24%20% 18% 16%
96%89%
Imports, 85%
71%
57%
56%
0%
20%
40%
60%
80%
100%
120%
2006/07 2007/08 2008/09 2009/10 2010/11 2011/12*
f.o.b in % of G
DP
Gross Int.
Reserves
0.0
1,000.0
2,000.0
3,000.0
4,000.0
5,000.0
6,000.0
7,000.0
2006/07 2007/08 2008/09 2009/10 2010/11 2011/12
US$ M
illions
‐30%
‐20%
‐10%
0%
10%
20%
30%
40%
50%
2003/04 2004/05 2005/06 2006/07 2007/08 2008/09 2009/10 2010/11 2011/2012*
Overall GDP Growth Agriculture GDP Growth
90
95
100
105
110
115
120
Jan‐11
Feb‐11
Mar‐11
Apr‐11
May‐11
Jun‐11
Jul‐11
Aug‐11
Sep‐11
Oct‐11
Nov‐11
Dec‐11
Jan‐12
Feb‐12
Mar‐12
Apr‐12
May‐12
Jun‐12
Jul‐12
Aug‐12
Sep‐12
US/Afs
EU/Afs
7
July 2011‐
July2012
Dec 2011 ‐
July 2012
March 2012 ‐
July 2012
Overall CPI 4.6 ‐0.3 ‐0.5
Non‐Food 7.0 1.2 7.0
Food and Beverages 2.6 ‐1.7 2.6
Fats and Oil 3.0 3.1 2.9
Bread and Cereal ‐0.1 ‐2.5 ‐0.1
Vegetables ‐3.0 ‐11.0 ‐3.0
Fresh and Dried Fruits 13.2 0.4 13.2
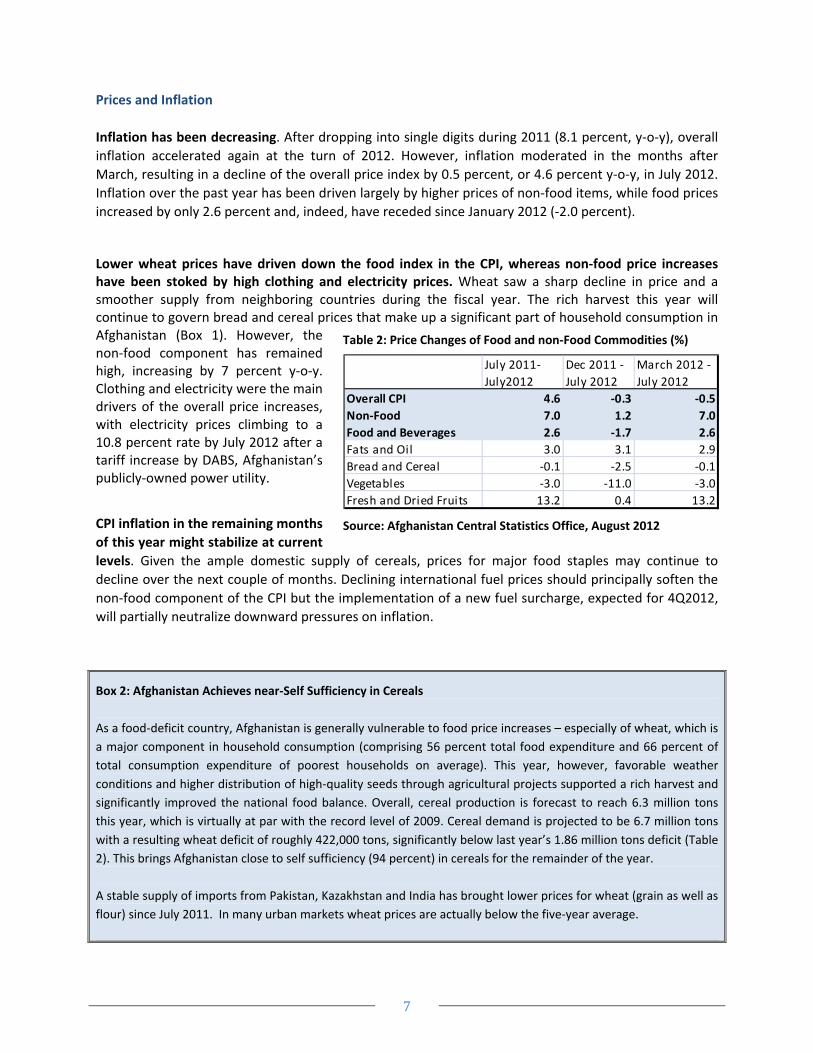
Prices and Inflation
Inflation has been decreasing. After dropping into single digits during 2011 (8.1 percent, y‐o‐y), overall
inflation accelerated again at the turn of 2012. However, inflation moderated in the months after
March, resulting in a decline of the overall price index by 0.5 percent, or 4.6 percent y‐o‐y, in July 2012.
Inflation over the past year has been driven largely by higher prices of non‐food items, while food prices
increased by only 2.6 percent and, indeed, have receded since January 2012 (‐2.0 percent).
Lower wheat prices have driven down the food index in the CPI, whereas non‐food price increases have been stoked by high clothing and electricity prices. Wheat saw a sharp decline in price and a smoother supply from neighboring countries during the fiscal year. The rich harvest this year will continue to govern bread and cereal prices that make up a significant part of household consumption in Afghanistan (Box 1). However, the non‐food component has remained high, increasing by 7 percent y‐o‐y. Clothing and electricity were the main drivers of the overall price increases, with electricity prices climbing to a 10.8 percent rate by July 2012 after a tariff increase by DABS, Afghanistan’s publicly‐owned power utility.
CPI inflation in the remaining months
of this year might stabilize at current
levels. Given the ample domestic supply of cereals, prices for major food staples may continue to
decline over the next couple of months. Declining international fuel prices should principally soften the
non‐food component of the CPI but the implementation of a new fuel surcharge, expected for 4Q2012,
will partially neutralize downward pressures on inflation.
Box 2: Afghanistan Achieves near‐Self Sufficiency in Cereals
As a food‐deficit country, Afghanistan is generally vulnerable to food price increases – especially of wheat, which is
a major component in household consumption (comprising 56 percent total food expenditure and 66 percent of
total consumption expenditure of poorest households on average). This year, however, favorable weather
conditions and higher distribution of high‐quality seeds through agricultural projects supported a rich harvest and
significantly improved the national food balance. Overall, cereal production is forecast to reach 6.3 million tons
this year, which is virtually at par with the record level of 2009. Cereal demand is projected to be 6.7 million tons
with a resulting wheat deficit of roughly 422,000 tons, significantly below last year’s 1.86 million tons deficit (Table
2). This brings Afghanistan close to self sufficiency (94 percent) in cereals for the remainder of the year.
A stable supply of imports from Pakistan, Kazakhstan and India has brought lower prices for wheat (grain as well as
flour) since July 2011. In many urban markets wheat prices are actually below the five‐year average.
Table 2: Price Changes of Food and non‐Food Commodities (%)
Source: Afghanistan Central Statistics Office, August 2012
8
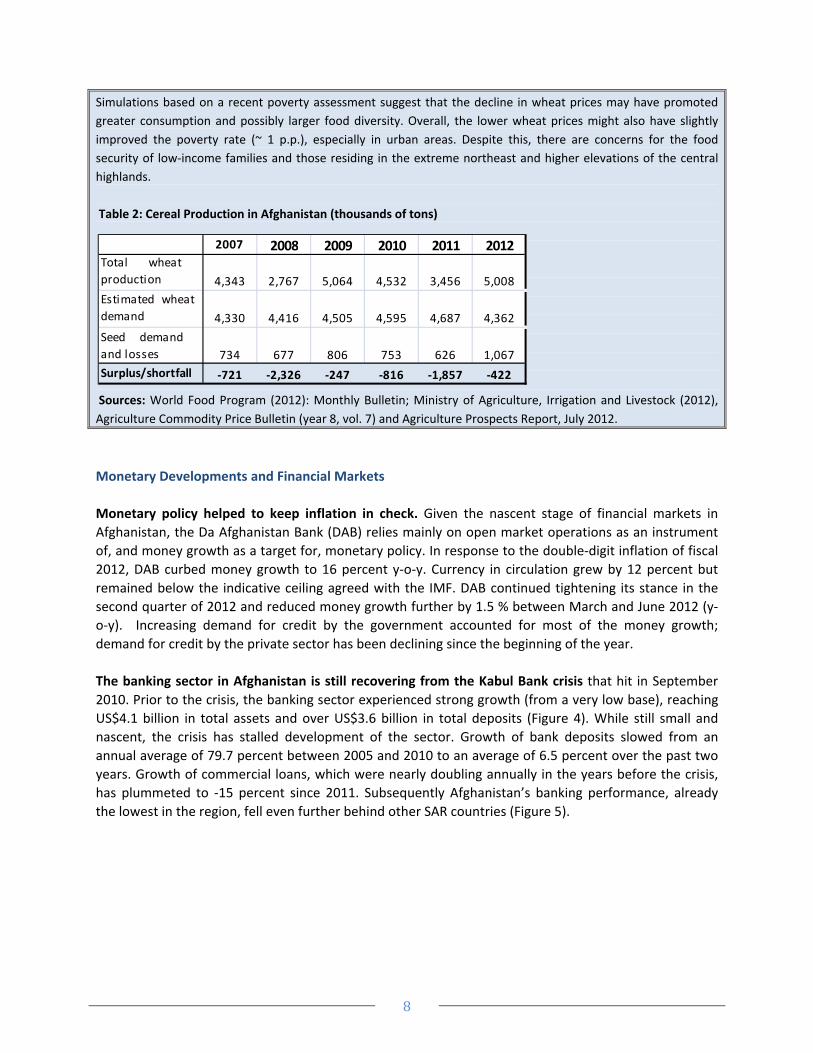
Simulations based on a recent poverty assessment suggest that the decline in wheat prices may have promoted
greater consumption and possibly larger food diversity. Overall, the lower wheat prices might also have slightly
improved the poverty rate (~ 1 p.p.), especially in urban areas. Despite this, there are concerns for the food
security of low‐income families and those residing in the extreme northeast and higher elevations of the central
highlands.
Table 2: Cereal Production in Afghanistan (thousands of tons)
Sources: World Food Program (2012): Monthly Bulletin; Ministry of Agriculture, Irrigation and Livestock (2012),
Agriculture Commodity Price Bulletin (year 8, vol. 7) and Agriculture Prospects Report, July 2012.
Monetary Developments and Financial Markets
Monetary policy helped to keep inflation in check. Given the nascent stage of financial markets in
Afghanistan, the Da Afghanistan Bank (DAB) relies mainly on open market operations as an instrument
of, and money growth as a target for, monetary policy. In response to the double‐digit inflation of fiscal
2012, DAB curbed money growth to 16 percent y‐o‐y. Currency in circulation grew by 12 percent but
remained below the indicative ceiling agreed with the IMF. DAB continued tightening its stance in the
second quarter of 2012 and reduced money growth further by 1.5 % between March and June 2012 (y‐
o‐y). Increasing demand for credit by the government accounted for most of the money growth;
demand for credit by the private sector has been declining since the beginning of the year.
The banking sector in Afghanistan is still recovering from the Kabul Bank crisis that hit in September
2010. Prior to the crisis, the banking sector experienced strong growth (from a very low base), reaching
US$4.1 billion in total assets and over US$3.6 billion in total deposits (Figure 4). While still small and
nascent, the crisis has stalled development of the sector. Growth of bank deposits slowed from an
annual average of 79.7 percent between 2005 and 2010 to an average of 6.5 percent over the past two
years. Growth of commercial loans, which were nearly doubling annually in the years before the crisis,
has plummeted to ‐15 percent since 2011. Subsequently Afghanistan’s banking performance, already
the lowest in the region, fell even further behind other SAR countries (Figure 5).
2007 2008 2009 2010 2011 2012Total wheat
production 4,343 2,767 5,064 4,532 3,456 5,008
Estimated wheat
demand 4,330 4,416 4,505 4,595 4,687 4,362
Seed demand
and losses 734 677 806 753 626 1,067
Surplus/shortfall ‐721 ‐2,326 ‐247 ‐816 ‐1,857 ‐422

9
‐1,000
0
1,000
2,000
3,000
4,000
5,000
6,000
2005 2006 2007 2008 2009 2010 2011 2012
Assets Liabilities Capital
0
10
20
30
40
50
60
70
2006 2007 2008 2009 2010 2011
Afghanistan Nepal Pakistan India
0
50
100
150
200
250
300
350
400
2002 2003 2004 2005 2006 2007 2008 2009 2010
Thousands
Gross Loan Portfolio (right) Number of active borrowers (left)
Figure 4: Assets and Liabilities in Banking (US$m) Figure 5: Domestic Credit to Private Sector (% of GDP)
Source: DAB Source: World Bank
Sector‐wide audits revealed considerable weaknesses at all levels of banking governance and
operations. Following the Kabul Bank crisis, all major banks were subjected to forensic or special audits.
The results indicate systemic fragility and vulnerability in all areas of banking governance and
operations, including skills, internal controls, accounting, credit analysis, and compliance with
regulations (in particular with regard to related parties lending and single obligor limit). While sobering,
some of these symptoms can be attributed to the early development stage of the sector, and the
generally volatile business environment in Afghanistan which recently prompted one of the few
international banks, Standard Chartered, to cease operations.
Trends in the microfinance sector are of
particular concern. The microfinance sector has
been going through a deep consolidation phase
since 2008, resulting in slower growth of the loan
portfolio, a decline in the number of active
borrowers, and the exit of several institutions
from the sector (Figure 6). Just when it seemed
the sector had recovered, it emerged that two
microfinance institutions (one of them large) face
severe difficulties and possible bankruptcy. Their
demise would lead to a further reduction in size
of the dwindling microfinance sector, with fewer
borrowers and lower outstanding loans. The
sector remains dominated by First Microfinance
Bank (FMFB), a commercial bank with a healthy
standing, targeting small and medium enterprises. FMFB claims 54,000 borrowers (16 percent of them
women), and a loan portfolio of US$23.6 million.
Figure 6: Microfinance in Afghanistan
Source: MIX market website and Micro Banking Bulletin
10
Public Finances
The operating budget deficit of 6.1 percent slightly exceeded targets in fiscal 2012 (the 1390 budget).
Domestic revenue collection (11.3 percent of GDP) increased by 24 percent but was lower than
expected but marginally exceeded the revenue targets agreed with the IMF. Meanwhile, operating
expenditure (17.2 percent) increased by 26 percent because of higher security spending and a higher
wage bill. Consequently the fiscal sustainability ratio, defined as domestic revenue over operating
expenditures, declined from 73 percent in SY1389, to 67 percent in fiscal 2012. As in previous years, the
deficit is financed by donor grants which also cover about 85 percent of the development budget.
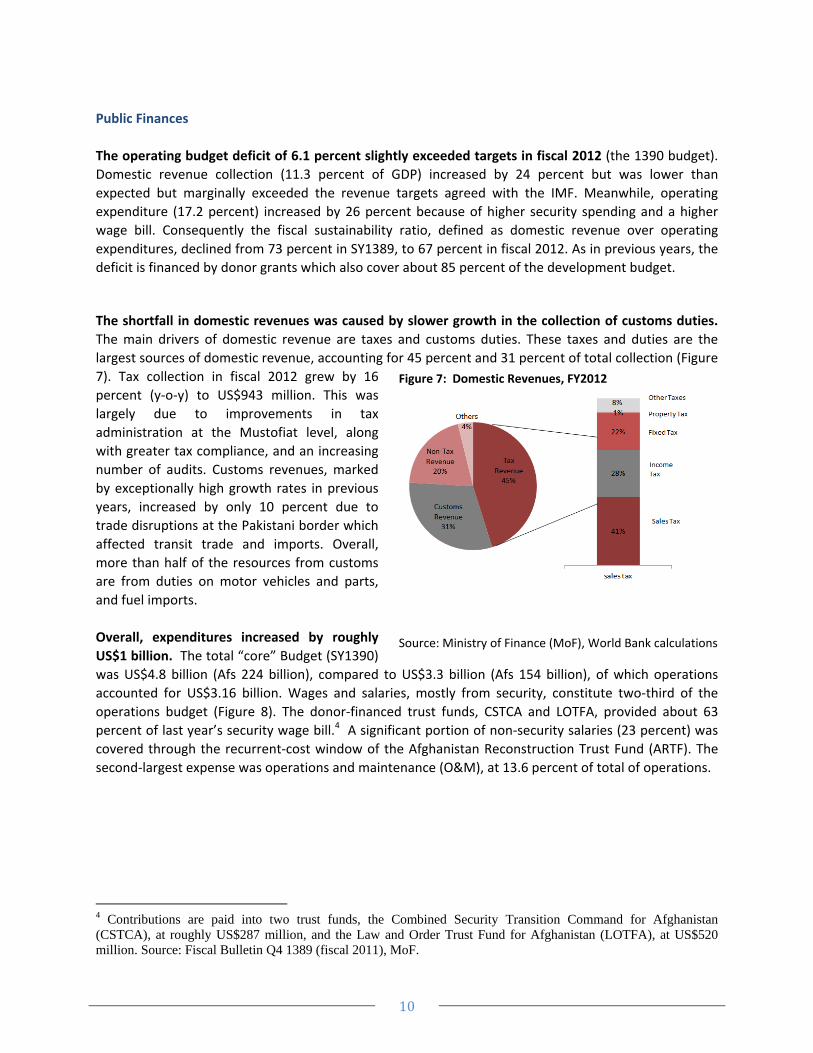
The shortfall in domestic revenues was caused by slower growth in the collection of customs duties.
The main drivers of domestic revenue are taxes and customs duties. These taxes and duties are the
largest sources of domestic revenue, accounting for 45 percent and 31 percent of total collection (Figure
7). Tax collection in fiscal 2012 grew by 16
percent (y‐o‐y) to US$943 million. This was
largely due to improvements in tax
administration at the Mustofiat level, along
with greater tax compliance, and an increasing
number of audits. Customs revenues, marked
by exceptionally high growth rates in previous
years, increased by only 10 percent due to
trade disruptions at the Pakistani border which
affected transit trade and imports. Overall,
more than half of the resources from customs
are from duties on motor vehicles and parts,
and fuel imports.
Overall, expenditures increased by roughly
US$1 billion. The total “core” Budget (SY1390)
was US$4.8 billion (Afs 224 billion), compared to US$3.3 billion (Afs 154 billion), of which operations
accounted for US$3.16 billion. Wages and salaries, mostly from security, constitute two‐third of the
operations budget (Figure 8). The donor‐financed trust funds, CSTCA and LOTFA, provided about 63
percent of last year’s security wage bill.4 A significant portion of non‐security salaries (23 percent) was
covered through the recurrent‐cost window of the Afghanistan Reconstruction Trust Fund (ARTF). The
second‐largest expense was operations and maintenance (O&M), at 13.6 percent of total of operations.
4 Contributions are paid into two trust funds, the Combined Security Transition Command for Afghanistan (CSTCA), at roughly US$287 million, and the Law and Order Trust Fund for Afghanistan (LOTFA), at US$520 million. Source: Fiscal Bulletin Q4 1389 (fiscal 2011), MoF.
Figure 7: Domestic Revenues, FY2012
Source: Ministry of Finance (MoF), World Bank calculations

11
Security Wages
Civil Service Wages
O&M
Others
Development
0%
5%
10%
15%
20%
25%
30%
2005/06 2006/07 2007/08 2008/09 2009/10 2010/11 2011/12
% of GDP
Figure 8: Core Budgets, FY2006 ‐FY2012 Figure 9: Core Budget FY2012
Sources: MoF, World Bank calculations
Development spending increased by 22 percent (to 6 percent of GDP) in fiscal 2012 because of
improved capacity and more realistic budget formulation. Budget execution increased from 39 percent
in fiscal 2011 (1389 Budget) to 51 percent in fiscal 2012. The increase in spending, though, is
attributable mainly to the ministries of Commerce (+216 percent), Defense (+72 percent) and Finance
(+106 percent). Ministries in social sectors managed only moderate spending increases – the Ministry of
Education, for instance, gained just 9.3 percent – or actually experienced declines. The ministries of
Agriculture and Health, for instance, reduced their on‐budget spending by 12.2 percent and 32.2
percent. However, social sectors benefit from large amounts of donor spending outside of the core
budget; given the lack of systemic data for off‐budget aid flows, it is difficult to analyze trends in total
development spending in social sectors.
The 1391 Budget sets ambitious targets for a shorter budget cycle. In an effort to reduce delays in
project implementation and address misalignments caused by differing budget cycles, the Afghan
authorities aligned the budget calendar with the Gregorian calendar year which is used by major
development partners. Consequently the 1391 Budget covers only nine months (end‐March to end‐
December). However, the parliament approved the 1391 budget on April 21, with a delay of six weeks,
further shortening the actual implementation period. Budget allocation increased to roughly US$4.9
billion, which is US$700 million more than last year, out of which the development budget accounts for
US$2.2 billion. Domestic revenues will finance 57 percent of the recurrent budget and 17 percent of the
development budget. This sets an ambitious target of revenue collection of US$1.8 billion, which is 20
percent more than last year and reflects the expected increase in revenues from mining.
12
0 5,000 10,000 15,000 20,000 25,000
Ministry of Rural Rehabilitation and Development
Ministry of Public Works
Ministry of Energy and Water
Ministry of Education
Ministry of Public Health
Ministry of Agriculture
Ministry of Urban Development
Ministry of Transport and Aviation
Ministry of Mines and Industries
1391 Approved Budget
1391 YTD Expenditure
3%
8%
33%
12%
4%
6%
3%
15%
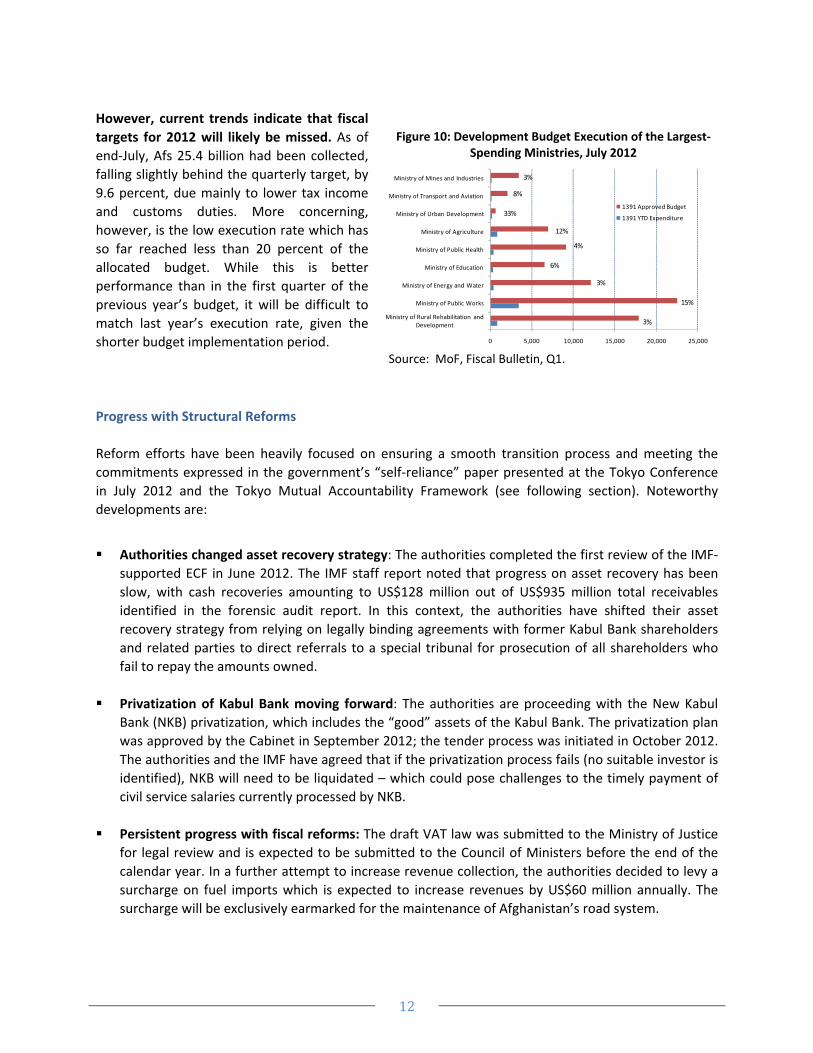
However, current trends indicate that fiscal
targets for 2012 will likely be missed. As of
end‐July, Afs 25.4 billion had been collected,
falling slightly behind the quarterly target, by
9.6 percent, due mainly to lower tax income
and customs duties. More concerning,
however, is the low execution rate which has
so far reached less than 20 percent of the
allocated budget. While this is better
performance than in the first quarter of the
previous year’s budget, it will be difficult to
match last year’s execution rate, given the
shorter budget implementation period.
Progress with Structural Reforms
Reform efforts have been heavily focused on ensuring a smooth transition process and meeting the
commitments expressed in the government’s “self‐reliance” paper presented at the Tokyo Conference
in July 2012 and the Tokyo Mutual Accountability Framework (see following section). Noteworthy
developments are:
Authorities changed asset recovery strategy: The authorities completed the first review of the IMF‐
supported ECF in June 2012. The IMF staff report noted that progress on asset recovery has been
slow, with cash recoveries amounting to US$128 million out of US$935 million total receivables
identified in the forensic audit report. In this context, the authorities have shifted their asset
recovery strategy from relying on legally binding agreements with former Kabul Bank shareholders
and related parties to direct referrals to a special tribunal for prosecution of all shareholders who
fail to repay the amounts owned.
Privatization of Kabul Bank moving forward: The authorities are proceeding with the New Kabul
Bank (NKB) privatization, which includes the “good” assets of the Kabul Bank. The privatization plan
was approved by the Cabinet in September 2012; the tender process was initiated in October 2012.
The authorities and the IMF have agreed that if the privatization process fails (no suitable investor is
identified), NKB will need to be liquidated – which could pose challenges to the timely payment of
civil service salaries currently processed by NKB.
Persistent progress with fiscal reforms: The draft VAT law was submitted to the Ministry of Justice
for legal review and is expected to be submitted to the Council of Ministers before the end of the
calendar year. In a further attempt to increase revenue collection, the authorities decided to levy a
surcharge on fuel imports which is expected to increase revenues by US$60 million annually. The
surcharge will be exclusively earmarked for the maintenance of Afghanistan’s road system.
Figure 10: Development Budget Execution of the Largest‐Spending Ministries, July 2012
Source: MoF, Fiscal Bulletin, Q1.
13
ARTF Incentive Program (IP) signed: Authorities and ARTF donors signed a memorandum of
understanding for a new ARTF incentive program in July 2012. The three‐year financing envelope
provides US$375 million, in addition to the US$450 million baseline financing of the recurrent cost
window. The overall objective of the ARTF IP is to support the authorities with a reform program
that aims to improve fiscal sustainability by increasing domestic revenue mobilization and
strengthening expenditure management. The program rewards the achievement of targets in four
reform areas: public financial management, governance and civil service, investment climate, and
sub‐national finance.
Progress in mining development clouded by uncertainty over new mineral law: The authorities
made progress with setting up a “resource corridor” National Priority Program which will provide a
means to leverage these sectors for broader growth and development. Negotiations on the principal
terms for the Hajigak tender were concluded in August 2012 and expressions of interest were
received for the five copper, gold and lithium tenders launched earlier this year. However, the
current legislative and regulatory environment is unfavorable for investment and contracts are
unlikely to be signed unless a new mineral law, with respective regulations, provides sufficient
certainty and protection for private investors. A proposal for a new mineral law, including provisions
enabling the contract and tenders to proceed, was rejected in July 2012 by the Council of Ministers
and is currently being revised. At the same time, progress in developing the Aynak mine continues
to lag behind schedule, and the developer has recently withdrawn most of its foreign staff due to
deterioration in security. Meanwhile, commodity markets have suffered sharp declines in the last six
months, with iron ore prices dropping 40 percent and copper by 10 percent. Unless addressed
rapidly, these developments cumulatively could result in worsening near‐ and medium‐term
prospects for the sector.
President issues “anti‐corruption decree”: The President issued an anti‐corruption decree on July
26 that responded partly to the Tokyo Mutual Accountability Framework (TMAF) which was one of
the principal outcomes of the Tokyo Conference. Since the decree was issued, its implementation
has been closely tracked by the Office of Administrative Affairs; the office has instituted weekly
meetings of deputy ministers to track progress in implementation across government. The decree
covers similar terrain as the TMAF but is broader and more extensive with tighter timelines for
ministries and agencies. It includes, for instance, finalization of an implementation plan for civil
service reform and preparation of a similar plan for all state‐owned enterprises. Over the next few
months, ministries will be expected to meet the deadlines contained in the document.
14
Economic Outlook: Afghanistan in Transition
The outlook for 2012 and 2013 is favorable. Due to the good harvesting season and favorable weather
conditions, 2012 will be a year of above‐average agricultural output, likely pushing economic growth to
over 10 percent. The following year, donor funding and development projects will continue to drive the
demand for construction, transportation and distribution services. In 2013, mining will begin to
contribute more noticeably to growth with the start of oil production in Amu Darya. Assuming that
agricultural output reverts to its historic average, economic growth might fall back to around 7 percent.
In the next 2‐3 years, however, political and security uncertainties of the transition period are likely to
take a toll on business confidence. This could result in trade interruptions and a possible postponement
of already‐low levels of private investment. The upcoming Presidential elections in 2014 might further
compound the security situation and potentially slow down planned reforms.
In the medium term, economic growth is expected to wind down as aid declines during the transition
and transformation phase. The withdrawal of international troops is associated with a decline in
security, and possibly, civilian aid. Projections suggest that even with favorable assumptions, real GDP
growth may fall from the average of 9 percent per year experienced over the past decade to 4‐6 percent
for 2011‐2018. Given Afghanistan’s annual population growth of 2.8 percent, this would mean only
limited improvement in average per‐capita income, continuing high rates of underemployment and little
progress in reducing poverty. Only growth at the upper level of the range of plausible scenarios would
enable Afghanistan to meaningfully reduce poverty and achieve higher per‐capita incomes. For example,
with real GDP growth of 6 percent per year, average per‐capita income – currently one of the world’s
lowest, at US$528 dollars – would take 22 years, or about a generation, to double.
Economic growth would be even lower under less favorable scenarios. The World Bank’s growth
projections up to 2014 and beyond, to 2022, are based on a set of assumptions (scenarios) related
mainly to security, sources of growth, aid levels, and changes in investment climate. If the assumptions
in the less favorable scenarios materialize – if, for example, agricultural performance is poor, major
mining investments (Aynak for copper and Hajigak for iron ore) do not materialize, and if aid declines
precipitously in the period – then growth could drop to 3‐4 percent. Deteriorating security and
governance would lead to further economic decline. The underdeveloped financial sector and low rates
of financial intermediation leave little scope for helping Afghan businesses adjust to slowing growth.
Conversely, the decline could be partly mitigated by reducing aid in a gradual, planned manner, and by
increasing the amount of aid that is actually spent within Afghanistan, and channeling as much as
possible through the Afghan Budget.
The impact of transition might be uneven across provinces. Aid has not been evenly spread across the
country. Because of the choices made by donors, and the predominant role of stabilization and military
spending, the conflict‐affected provinces have had significantly higher per‐capita aid than the more
peaceful (and often poorer) provinces. As a result, the slowdown in aid is likely to be felt more acutely in
the conflict‐affected areas and in urban centers, most likely through a loss of wage‐labor opportunities
as military bases and provincial reconstruction teams (PRTs) close. At present, with seven out of 30 PRTs
closed, the available analysis and data do not suggest any significant impact, or, it might be too small to
influence (available) economic aggregates. Nevertheless, there are considerable political economy risks
that deserve continuous attention.
15
Transition may have a substantial balance of payment effect. Projections of exchange‐rate behavior
show a depreciation of the exchange rate. By 2025 the afghani is projected to have lost nearly 20
percent of its 2010 value. This may be surprising given the expected capital inflows associated with the
mining expansion. However, the decline in aid outflows will outweigh the expected capital inflows from
mining, particularly in the years soon after 2014, since mining activities are expected to begin only in
2016/2017.5 Only in the case of major expansion of both the mining and agricultural sector does the
model predict a net appreciation.
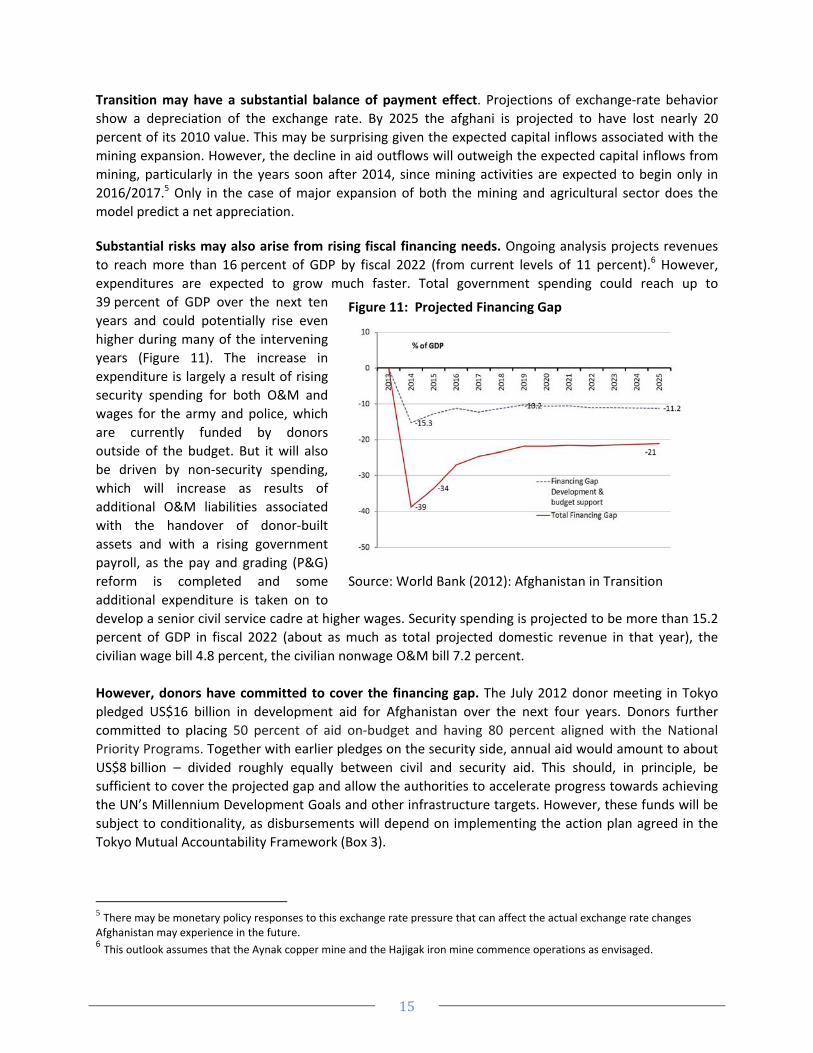
Substantial risks may also arise from rising fiscal financing needs. Ongoing analysis projects revenues
to reach more than 16 percent of GDP by fiscal 2022 (from current levels of 11 percent).6 However,
expenditures are expected to grow much faster. Total government spending could reach up to
39 percent of GDP over the next ten
years and could potentially rise even
higher during many of the intervening
years (Figure 11). The increase in
expenditure is largely a result of rising
security spending for both O&M and
wages for the army and police, which
are currently funded by donors
outside of the budget. But it will also
be driven by non‐security spending,
which will increase as results of
additional O&M liabilities associated
with the handover of donor‐built
assets and with a rising government
payroll, as the pay and grading (P&G)
reform is completed and some
additional expenditure is taken on to
develop a senior civil service cadre at higher wages. Security spending is projected to be more than 15.2
percent of GDP in fiscal 2022 (about as much as total projected domestic revenue in that year), the
civilian wage bill 4.8 percent, the civilian nonwage O&M bill 7.2 percent.
However, donors have committed to cover the financing gap. The July 2012 donor meeting in Tokyo
pledged US$16 billion in development aid for Afghanistan over the next four years. Donors further
committed to placing 50 percent of aid on‐budget and having 80 percent aligned with the National
Priority Programs. Together with earlier pledges on the security side, annual aid would amount to about
US$8 billion – divided roughly equally between civil and security aid. This should, in principle, be
sufficient to cover the projected gap and allow the authorities to accelerate progress towards achieving
the UN’s Millennium Development Goals and other infrastructure targets. However, these funds will be
subject to conditionality, as disbursements will depend on implementing the action plan agreed in the
Tokyo Mutual Accountability Framework (Box 3).
5 There may be monetary policy responses to this exchange rate pressure that can affect the actual exchange rate changes Afghanistan may experience in the future. 6 This outlook assumes that the Aynak copper mine and the Hajigak iron mine commence operations as envisaged.
Figure 11: Projected Financing Gap
Source: World Bank (2012): Afghanistan in Transition

16
Box 3: The Tokyo Mutual Accountability Framework
The TMAF covers five critical areas of engagement, in each of which both the government and international
community have set out goals and indicators of progress. The five areas are:
a) Representational Democracy and Equitable Elections, including presidential and parliamentary elections
in 2014 and 2015.
b) Governance, Rule of Law and Human Rights, covering the enforcement of laws and action plans for the
protection of women and children as improved corruption control.
c) Integrity of Public Finance and Commercial Banking, including timely implementation of the IMF
supported program, the PFM action plan as well as the Anti‐Money Laundering and Combating Terrorism
Financing action plan.
d) Government Revenues, Budget Execution and Sub‐National Governance, including enactment of a legal
framework to implement the sub‐national Governance policy, and development of a sub‐national
budgeting process.
e) Inclusive and Sustained Growth and Development, comprising strengthening of the investment climate,
WTO accession and greater regional integration.

17
World Bank Assistance to Afghanistan Overview
1. World Bank assistance comprises a portfolio of International Development Association (IDA)
grants and credits as well as the projects it supervises on behalf of the ARTF. Since 2002, IDA has
committed a total of US$2.3 billion in grants (80 percent) and credits (20 percent) in Afghanistan. Thirty‐
six development and emergency‐reconstruction projects and four budget‐support operations have been
committed to date. In addition, the ARTF has committed US$2.5 billion for the government’s recurrent
costs and US$2.15 billion for government investments programs. At end‐December 2011 the active IDA
portfolio was worth US$920 million and the active ARTF investment portfolio was worth US$982 million.
New Financing in fiscal 2010 and fiscal 2011
2. In fiscal 2010, IDA approved six new grants worth US$197 million. These included US$7.5 million
for the Pension Reform Project, US$30 million for the Afghanistan Rural Enterprise Development
Program (AREDP), US$50 million for the Customs Reform and Trade Facilitation project, and US$40
million for the third phase of the National Solidarity Program (NSP III). In addition, the crisis response
window of IDA was utilized to provide an extra US$69 million to critical human development
investments in Afghanistan, including the Strengthening Higher Education Project (SHEP) and the
Strengthening Healthcare for the Rural Poor Project (SHARP). In addition, the ARTF approved US$290
million in recurrent‐cost financing (of which US$63.8 million was based on meeting the benchmarks of
the ARTF Incentive Program 1389) and US$196 million for investments, including NSP III, the National
Emergency Rural Access Project (NRAP), SHARP, and the Horticulture and Livestock Project.
3. During fiscal 2011, five projects were approved by the World Bank board, totaling US$261.8
million, ensuring that the full IDA 15 allocation was utilized by the government. The new projects include
the US$40 million additional financing for the National Emergency Rural Access Project (NERAP), the
Sustainable Development of Natural Resources additional financing (US$52m), the ICT Sector
Development Project (US$50m), the Afghanistan New Market Development Program (US$22m), and the
Irrigation Restoration and Development project (US$97.8m). Under the ARTF, new investment financing
of US$554 million was committed in fiscal 2011, of which the substantial part was for co‐financing of the
core IDA‐financed national programs such as NSP, EQUIP and NRAP, as well as new investments in
agriculture and infrastructure.
4. During fiscal 2012, one new project, financed by IDA, was approved by the World Bank: Financial
Sector Rapid Response Project (US$19 million). In the ARTF, a total of US$402 million was committed to
new and ongoing investment programs. These projects include the National Solidarity Program III
(US$100 million), The Horticulture and Livestock Project (US$15 million) and the Capacity Building for
Results Facility (US$100 million).
18
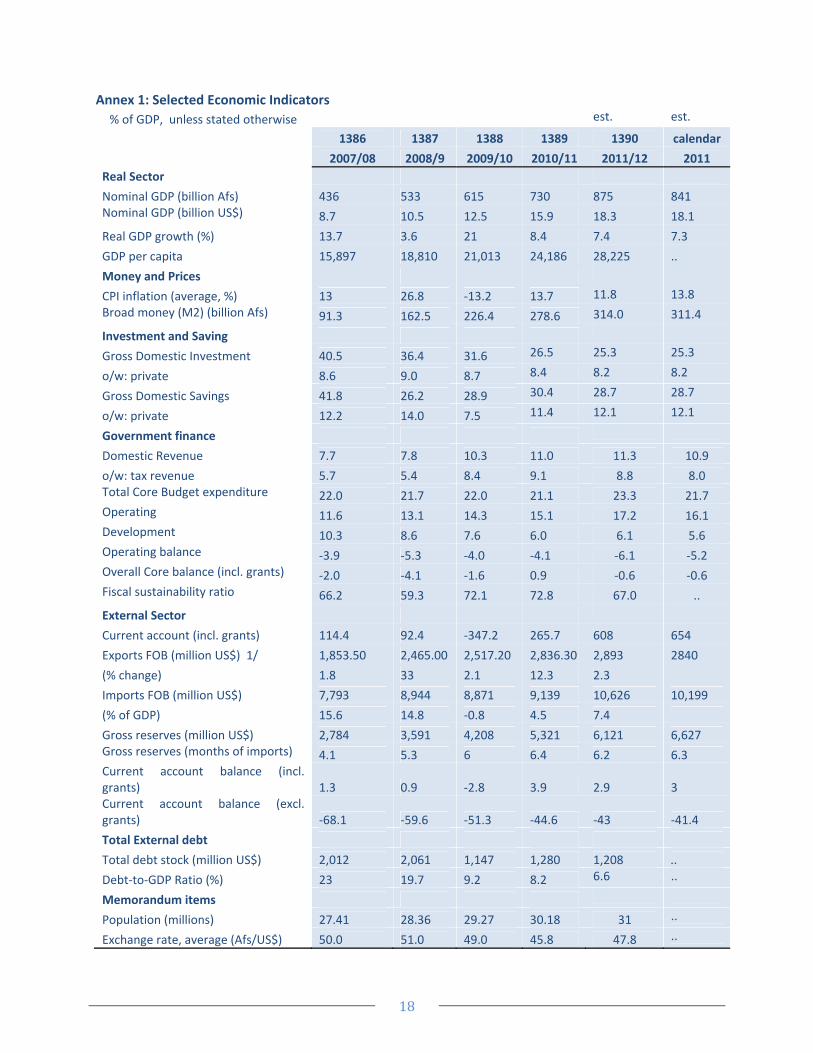
Annex 1: Selected Economic Indicators
% of GDP, unless stated otherwise est. est.
1386 1387 1388 1389 1390 calendar
2007/08 2008/9 2009/10 2010/11 2011/12 2011
Real Sector
Nominal GDP (billion Afs) 436 533 615 730 875 841 Nominal GDP (billion US$) 8.7 10.5 12.5 15.9 18.3 18.1
Real GDP growth (%) 13.7 3.6 21 8.4 7.4 7.3
GDP per capita 15,897 18,810 21,013 24,186 28,225 ..
Money and Prices
CPI inflation (average, %) 13 26.8 ‐13.2 13.7 11.8 13.8
Broad money (M2) (billion Afs) 91.3 162.5 226.4 278.6 314.0 311.4
Investment and Saving
Gross Domestic Investment 40.5 36.4 31.6 26.5 25.3 25.3
o/w: private 8.6 9.0 8.7 8.4 8.2 8.2
Gross Domestic Savings 41.8 26.2 28.9 30.4 28.7 28.7
o/w: private 12.2 14.0 7.5 11.4 12.1 12.1
Government finance
Domestic Revenue 7.7 7.8 10.3 11.0 11.3 10.9
o/w: tax revenue 5.7 5.4 8.4 9.1 8.8 8.0 Total Core Budget expenditure 22.0 21.7 22.0 21.1 23.3 21.7 Operating 11.6 13.1 14.3 15.1 17.2 16.1 Development 10.3 8.6 7.6 6.0 6.1 5.6 Operating balance ‐3.9 ‐5.3 ‐4.0 ‐4.1 ‐6.1 ‐5.2 Overall Core balance (incl. grants) ‐2.0 ‐4.1 ‐1.6 0.9 ‐0.6 ‐0.6 Fiscal sustainability ratio 66.2 59.3 72.1 72.8 67.0 ..
External Sector
Current account (incl. grants) 114.4 92.4 ‐347.2 265.7 608 654
Exports FOB (million US$) 1/ 1,853.50 2,465.00 2,517.20 2,836.30 2,893 2840
(% change) 1.8 33 2.1 12.3 2.3
Imports FOB (million US$) 7,793 8,944 8,871 9,139 10,626 10,199
(% of GDP) 15.6 14.8 ‐0.8 4.5 7.4
Gross reserves (million US$) 2,784 3,591 4,208 5,321 6,121 6,627 Gross reserves (months of imports) 4.1 5.3 6 6.4 6.2 6.3 Current account balance (incl. grants) 1.3 0.9 ‐2.8 3.9 2.9 3 Current account balance (excl. grants) ‐68.1 ‐59.6 ‐51.3 ‐44.6 ‐43 ‐41.4
Total External debt
Total debt stock (million US$) 2,012 2,061 1,147 1,280 1,208 ..
Debt‐to‐GDP Ratio (%) 23 19.7 9.2 8.2 6.6 ..
Memorandum items
Population (millions) 27.41 28.36 29.27 30.18 31 ..
Exchange rate, average (Afs/US$) 50.0 51.0 49.0 45.8 47.8 ..

19