africa in a situation of global crisis · · 2016-02-18it is now recognised as the worst economic...
TRANSCRIPT

1
AGENDA ITEM 4
2nd ITUC- Africa Congress
Birchwood Hotel, Johannesburg (South Africa), November 25-27, 2011
RENEWING THE AFRICAN TRADE UNION MOVEMENT TOWARDS AFRICAN EMANCIPATION
Africa in a Situation of Global Crisis
1. For a greater part of the period under review the world has been in the throes of a global financial
and economic crisis of unprecedented proportions with severe consequences for employment and
working families. It is now recognised as the worst economic crash of capitalism since the Great
Depression of 1929. It will be recalled that the impact of the Great Depression continued for years
and eventually ended up in the Second World War. The war-ravaged economies of the West then
paradoxically provided the opportunity for new investment and expanded reproduction of the
fifties and early sixties. Just as the Great Depression of the late ‘20s and early ‘30’s, this ‘Great
Financial Crisis’ is neither accidental nor temporary, but is a reflection of the inherent
contradictions of the capitalist economic system, which generates periodic structural crises.
2. The ‘financial crisis’ had been heralded by a series of financial crashes of growing magnitude over
the last two decades, including: the US stock market crash of 1987; the savings and loans crisis of
the late 1980s and early 1990s; the Japanese financial crisis and stagnation of the 1990s; the Asian
financial crisis of 1997 to 1998 and the crash of 2000. Quite clearly the effects and ramifications of
the current financial crisis have not played out yet. They are likely to continue for many more
years. Despite the nervous but optimistic predictions of economists in the West at the least sign of
improvements in economic indicators, subsequent events only demonstrate that, far from the
repercussions of this crisis ending soon, they are likely to be long-term. By 2005, total US debt,
including that of households, business, financial and government sectors, was over 57 trillion
dollars and still soaring, and 81% of this debt, i.e. 46 trillion dollars was created since 1990, a period
driven purely by debt instead of productive activity. Currently, the US government debt of 14.34
trillion dollars constitutes 96% of its GDP of 15.003 trillion dollars (July, 2011 estimates). The
bulging debt crisis of the US government and the recent melodrama over whether it might default
on its debt servicing obligations and the continuing threat to the very existence of the euro by the
economic and financial crises in Greece, Portugal, Spain and Italy all point to the extremely
worrying fact that this crisis is far from over.

2
3. To begin to speak sensibly about the possible repercussions of this crisis and its outcome, we must
first have some understanding of its essential character. Why is this not a passing crisis? Why is it
extending in new forms and in new ways? What are the driving forces of this crisis?
4. While we do not intend to attempt anything like a comprehensive analysis of the crisis and its
causes, in our view, the crisis is related to the increasing challenge of finding profitable outlets in
these economies for productive investment of the huge and growing profits generated by the
system with the emergence of ‘maturity’ in capitalist economies of Western Europe, North America
and Japan; linked to the phenomena of growing global inequality, poverty and the drop in effective
demand; financialization of economies (or domination by the financial sector over the real
economy; overproduction etc). These problems have led to a tendency to long-term stagnation in
growth in these developed capitalist economies. The very low growth rate figures of the so-called
mature economies as compared to the high growth rates of the emerging economies attest to this.
5. As productive investment in the centres of capitalism is no longer an effective means of staving off
the economic slump, increasingly financial speculation has become the means of staving off, though
not overcoming this tendency of stagnation .The recent examples of the role of the Federal Bank in
the US in bailing out the banks and the role of the European Central banks in the Greek and Spanish
crisis graphically illustrate this increasing financialization of these economies and the role of the
central banks, and governments in bailing out the financial sector. Thus, while on the surface the
crisis assumes the form of a financial crisis, because of the overdependence of real economic
production on financial markets, this crisis is [in truth] an economic crisis, a crisis of
“overproduction of capital”. Rather than resolving this structural crisis, the decision to bail out the
financial sector, and to impose austerity measures on the people, actually deepens it. This toxic
combination of structural economic problems, combined with inappropriate interventions, means
that, failing a radical shift in direction, the world economy is in for a long and deep stagnation.
6. This, in turn has major negative implications for Africa, which is the most vulnerable region in the
Global South. At the same time, the impacts of the crisis, and the changing global realities within
which it has unfolded, have given rise to a complex combination of possibilities and challenges,
which could see Africa move onto a new development path, if handled correctly. We now turn to
the realignment of international forces, which is creating a new terrain for engagement:
The international situation post the Global Economic Crisis
7. We are living in a period of rapid change, where developments which usually take decades, are
happening in the space of months. Therefore the situation which is described below is by its very
nature dynamic and fluid, and needs to be continuously evaluated.

3
8. As indicated above, it is now understood that the global financial crisis which erupted in 2008, was
a systemic crisis, which quickly developed into an all-round economic crisis, with its centre of
gravity in the advanced capitalist countries of the North, and with devastating impacts for the
countries of the South. There is much debate about the roots of the crisis, but most agree that its
impact, together with large shifts in the international economy and polity, mean that the world
post the global economic recession, will be a very different place than pre-2008. Its ramifications
are still being felt, not only economically, but in terms of massive social and political upheavals, in
places as far apart as North Africa, China, Europe, the US, and Latin America.
9. The first phase of the crisis seemed to have suggested that we were entering into a post neo-liberal
era, which would see huge Keynesian type demand stimulus interventions (particularly through
government spending), and extensive state involvement in both ownership, through
nationalisation, as well as much tighter regulation of capital, particularly in the financial sector; as
well as interventions in the financial markets on an unprecedented scale. Key countries in the
North, together with the G20, seemed to recognise the need for a new approach. But this phase,
with the exception of a massive social and economic stimulus from China, was short lived, as
resources were diverted into bailing out the banks (not the victims of excess by the banks), rather
than social investment as the basis for a sustainable recovery.
10. Therefore, the failure of governments and international institutions to take on the critically
weakened financial sector, whose abuses gave rise to the financial meltdown, in the first phase of
the crisis; allowed the financial sector, and financial markets, to reassert their dominance in the
second phase of the crisis, and re-establish the hegemony of their economic agenda.
11. The second phase, which is still currently unfolding, has seen the reassertion of neo-liberal policy
interventions, to secure the financial sector, in the face of massive debts run up by governments in
the first phase, in large part as a result of bailing out the financial sector. This resurgence of neo-
liberalism is ironically concentrated in the North, with the traditional structural adjustment
packages of slashing the state, fiscal cutback, tight monetary policy, deregulation etc, being visited
most intensively on the nations of Europe and the United States, leading in turn to unprecedented
resistance in those countries.
12. Meanwhile the centre of economic gravity appears to be shifting towards some key countries in the
South, particularly China, even as the dominant centres of the world economy continue to be North
America, Western Europe and Japan; and the developed world is becoming increasingly dependent
on sections of the developing world to stabilise its economy. This shift is in turn being felt at the
level of global governance, with the growing assertion by countries of the South, of the need for a
new global economic and political architecture. Therefore it will be extremely difficult to return to
the old status quo.

4
13. Just as the US economy is trapped in stagnation, China’s economy is rapidly rising, recording high
rates of growth, and over the last couple of years, has become the second largest economy after
the US, surpassing Japan. China is the largest foreign buyer of US bonds and dollars. The US
depends heavily on China to lend it money, and China benefits from the US’s consumption of its
manufactured goods. China therefore has a stake in maintaining the value of the US dollar, and a
stable US economy. This has become an increasingly risky proposition, since the financial crisis.
China is therefore acting to reduce its reliance on the US economy. In 2008 China bought almost
half of total foreign purchases of US Treasuries. By 2009 it held some $1.5 trillion of US$-
denominated assets (equivalent to about one third of China’s GDP), thanks to its giant export
surpluses over many years. But Beijing is moving in the opposite direction as it tries to escape the
‘dollar trap’. First, it has more or less stopped buying US Treasuries. Second, it is selling dollars and
buying non-dollar assets, including minerals, farmland, energy and corporate stocks in European
and Asian companies ; big loans to oil companies which will be repaid in oil; more loans to the
ASEAN states; massively increased exports to Asia etc. Thirdly, China hopes to persuade other
countries, particularly states in Latin America, Africa and Asia to cooperate with a move away from
the Dollar Standard, as the international currency. They are proposing a ‘super-sovereign reserve
currency’ comprised of a basket of several major currencies1.
14. The shift in the global balance of economic power is also reflected in the balance of trade figures.
According to the WTO World Trade Report, 2010, trade surplus and deficits by region in 2009 were
as follows:
Surplus: Middle East +$198 billion; Asia +$169 billion; Former Soviet Union +$120 billion; South
and Central America +$17 billion
Deficit: North America -$515billion; Europe -$148 billion; Africa -$21 billion
15. The crisis of the US economy and the rise of China signify the waning political, economic and
military hegemony of the US in the world, and the real challenge that China poses to this
hegemony. This declining power, both makes the US and other developed capitalist states more
aggressive; but the emergence of a multipolar world order, opens up space, both at the political
and economic level, particularly for countries in the Global South.
16. Economic orthodoxy has been shattered, even amongst the proponents of capitalism. The existing
financial architecture, and international economic governance, is being fundamentally challenged.
Beyond this, the sustainability of the current economic growth model is being questioned, in
relation to:
The environmental limits of uncontrolled, destructive growth
1 See Robert Wade Cambridge Journal of Economics 33, 2009 From global imbalances to global reorganisations

5
The viability of a one-sided export led growth model, which depends on growing demand from
the developed world, now in crisis, and
The impact of growing inequality and poverty in creating systemic crises
17. What is now being determined is the terms on which this international economic crisis will be
resolved, and whether it lays the basis for a movement of peoples, in the South and North, which is
able to drive a new type of economic arrangement, and international architecture, aimed at
resolving the crisis in favour of the mass of ordinary people; or whether unaccountable
governments and financial institutions, will continue to succeed in imposing arrangements which
are primarily aimed at protecting the mighty financial sector, the large corporations, and the
billionaires. While social devastation from the crisis has been widespread, in both North and South,
countries of the South, particularly in key regions such as Asia and Latin America, are better poised
to bounce back, than countries in the developed world. Africa, however, has not yet broken its
position of economic marginalisation, although it is beginning to assert itself in some international
arenas.
18. These new global realities, illustrated by the massive economic social and political shifts which are
taking place, suggest that forces for progress and transformation, have potentially greater leverage
to advance their agenda, than has been the case for many decades.
19. At the same time, the deep crisis facing powerful elites and states, which command huge resources,
and a massive repressive and military machine, raises serious concerns about the possibilities for a
range of reactionary phenomena - neo-fascism; a resurgent imperialism; militarism; religious
fundamentalism; and a concerted project to stamp out worker and human rights. Nor will the
growing economic power of the South automatically be used for progressive ends.
20. The world is therefore confronted with the prospect of a scenario of unprecedented progress and
hope vs. deepening human misery and conflict. There is considerable evidence to suggest the
possible emergence of either – or both- of these competing scenarios, including:
The development of progressive, left governments and peoples movements in Latin America,
the democratic revolutions in North Africa and the Middle East, and the resurgence of popular
resistance in the countries of the North;
The rising economic role of countries of the South, their growing organisation into regional and
international blocs, and the assertion by the South of a new global agenda, with all their
contradictions;
The growth of the green agenda as an integral part of the emerging international movement for
economic and social transformation.

6
At the same time we are witnessing
The increasingly aggressive posture being taken in developed capitalist countries, including
against their own people;
The adoption of economic austerity measures which threaten to plunge the world into an
economic depression;
The rise of right wing governments and ultra-right parties in the North; and
The intensification of dangerous military adventures being undertaken in the pursuit of
economic and geopolitical interests. This has serious ramifications for Africa.
21. The realignment of forces which is emerging in the post crisis landscape therefore sets the stage for
a massive international contestation over the shape of the international economic and political
architecture. While the rising power of the South, and popular movements are, in certain respects,
a cause for optimism, this contains significant contradictions. Further, even if major Northern states
are relatively speaking on the wane, their power, in particular that of the USA (which still remains
the major economic and military force in the world), and their ability to block progress, should not
be underestimated.
22. Nevertheless, the shifting balance of economic power to the South, as well as the resurgence of
progressive and democratic forces in key regions, particularly Latin America and North Africa, is
cause for optimism; as is the emergence of significant worker and popular movements in Europe
and the USA, challenging their governments’ economic policies and international interventions.
23. Careful attention needs to be given by organised African workers to the implications of the rise of
major economic powers in the South, particularly the role of China, which is now the world’s
second largest economy. Greater co-ordination of countries of the South is beginning to take place
in various fora, including BRICS. This economic shift is combined with progressive regional initiatives
being taken in Latin America, which has begun to ‘delink’ the continent from the economic
hegemony of the advanced capitalist countries. Progressive forces in Africa need to consider how to
engage with these emerging realities.
24. Politically, left and popular democratic forces are in the ascendancy in some regions of the South
(although in others, such as India, the left is reportedly losing some ground). For example, 8 of the
10 major Latin American countries (with the left in Peru being the latest to win elections) now have
left or centre left governments.
25. While there are significant differences between the economic policies of some of these South
American states, they are nevertheless more or less united on the need to build the continent’s
independence from US domination, and are putting in place various regional institutions to
strengthen their ability to do this. Countries such as Venezuela and Bolivia are also developing

7
radical left projects, which distinguish them from the middle of the road social democracies which
had hitherto constituted the ‘left’ in most democracies. They, together with other progressive
states, constitute an alternative pole, around which progressive forces can cluster internationally.
26. Even here, we must note the importance of political and civil liberties, the promotion of a culture of
democratic tolerance and debate in public life and the complex of legal and institutional procedures
which have been honed over the years in the North to check political power and arbitrariness in
governance and to provide remedies by which citizens can protect themselves against absolute
power and the writ of the state. For while these legal and administrative procedures have their
origins in a large measure in the capitalist order of the North and are determined by the
characteristics of that order, it may not be prudent to dismiss them as merely formal legal
abstractions of that order that hold no significance for the society of the future. For liberal
democratic principles and institution such as the rule of law, civil liberties, protection of the
legitimate private space of individuals against state intrusion and the restrictions on the state’s
freedom to act anyhow are important concerns that any popular democratic social order must
address.
27. The uprisings in North Africa and Middle East, known as the ‘Arab spring’, constitute a major
development, on Europe’s doorstep, with potentially profound geo-political implications, including
around oil, the Israel-Palestine question, and the role of the US and its allies in the region. It
challenges the stranglehold of US backed dictators, and has broader ramifications for democracy in
Africa. Given that this wave of revolts is still unfolding, and that a counter-offensive has been
launched by the dictators and their backers, it is too early to predict the trajectory they will take.
While having spontaneous elements, and often being led by the youth, many of these revolts e.g. in
Egypt and Tunisia, have also had strong participation by organised workers, and emerging left
formations. What we can predict, is that the region will never be the same, and that these uprisings
pose a real challenge to the current geo-political status quo.
28. Despite the North African uprisings, however, Africa remains fragmented as a regional bloc, and
politically stunted on the whole, in terms of the development of progressive formations. It will be
important to see if the African working class can build on the developments in North Africa. The
main organised progressive force on the continent is the African trade union movement, which
needs to work with emerging social movements, to develop a strategic agenda for Africa. But until
now the African trade union movement itself has been too fragmented, and still needs to develop a
coherent alternative vision and voice.
29. The developments in North Africa and Latin America constitute a qualitative political shift. This
shift, combined with the economic shift in the balance of power to the South, (emerging with the
economic crisis, and the rise of China), constitutes a major opportunity for progressive forces in the
South. However, within the South there will obviously be contestation, including between countries
themselves e.g. within BRICS, and by anti-worker forces, aiming to determine the character of the

8
new agenda. Therefore trade unions, progressive mass organisations, and left parties need to
develop a coherent joint strategy to consolidate and take forward a progressive South-South
platform.
30. The political situation in the developed North is fluid and unpredictable. Massive spending cuts in
Europe and the USA have been accompanied by reduction of real wages, attacks on pensions and
other forms of social protection, and attacks on the rights of workers and unions. This is not
confined to the ‘bankrupt countries’ of Portugal, Greece, Ireland, and now Spain, but is a reality
facing the working class in most of Europe and the USA. This has given rise to political resistance in
the developed world on a scale not seen for many years, including general strikes, and street
occupations, particularly in countries facing IMF-style structural adjustment packages (such as
Greece and Spain), but also in unexpected areas, such as the rebellion in Wisconsin, USA, against
the attacks on trade union rights. The people in these countries are openly relating to events in the
‘Arab Spring’, and beginning to question the legitimacy of their economic and political systems.
31. These events have deepened the crisis of centre-left social democratic parties, who
on the one hand are responsible for selling these measures to their people in the ‘bankrupt states’
of Greece, Ireland, Portugal and Spain, and by so doing are committing political suicide (the
Portuguese and Irish governments have already fallen); and on the other, have been booted out of
power in most other European countries. Even before the latest crisis in Europe, centre right parties
had taken power in the ‘historic heartland of European social democracy’ (Germany, Britain,
France, Italy, Sweden, the Netherlands).
32. The social democrats have adopted the same neo-liberal economic policies as the centre-right, and
have discredited themselves in the process. Increasingly, progressive forces, and trade unions are
beginning to distance themselves from social democratic parties, and left parties (such as Die Linkse
in Germany) are becoming stronger, in some countries. However, the politics of Europe is
increasingly fragmented, and the working class is not only being drawn to the left, but to the
centre-right and ultra-right, as neo-fascists capitalise on peoples material insecurities, fears, and
prejudices (as happened in fascist Europe in the 1930’s).
33. Consequently, while there are some signs of hope, there is also the danger of an increasingly
reactionary economic and military agenda by the developed country governments, as their ruling
classes become progressively more desperate, economically and politically. It is strategically vital,
therefore, to ensure co-ordination between progressive and democratic forces in the North and
South, to isolate these dangers, and bolster a more progressive agenda in the North.
34. The idea of the resolution of this struggle for world hegemony being settled, as in the past, by
another world war is simply unthinkable for the survival of humanity. What is certain, however, is
that the resolution of this crisis and the new world system that is like ly to emerge from it will be
radically different and will have far reaching consequences for humanity. How are Africa and our

9
trade unions, as well as the entire international trade union movement, and progressive forces to
engage this reality, and act to shift the current trajectory? This is a critical question that we need to
start grappling with now.
35. The international trade union movement has a key role to play, as it is the only well organised
movement which has a presence in all these regions, and broadly shares an agenda, at least on
some of the major economic and social issues. More work needs to be done on developing a joint
platform to address some of the current policy differences between labour movements of the
North and South, particularly around trade questions. Arguably, in the post-economic crisis era, the
material and political basis for such a shared platform has improved, as the labour movement in
developed capitalist countries becomes more politicised, and the austerity policies in the North
undermine the project of dividing a ‘labour aristocracy’ in the North, from workers in the South.
The impact of the crisis on working people
36. The result of the ‘Great Financial Crisis’ so far is that millions of jobs have been lost in both
industrialized and developing nations and tens of thousands have lost their homes and savings in
the West. At the same time, the world faces grave dangers of climate change with critical
challenges for sustainable development. As the world grapples with coordinating effective
responses to the crises, they continue to impact heavily on working people around the globe.
37. The General Secretary of the ITUC has summarised some of the global effects of the economic
crisis2:
world unemployment stands today at 210 million - the highest recorded level of unemployment
in history;
64 million more people have been pushed into extreme poverty;
according to the ILO, there are 34 million more people unemployed as a result of the crisis;
23 million more people would be without a job today, were it not for the stimulus packages
adopted to confront the crisis – programmes which apparently now stand to be phased out
rapidly over the time ahead, as governments (particularly in Europe) fall over one another in
their rush to exit from the crisis;
and this “decent work deficit” can only worsen in the coming years, as there are also a record
number of young people entering the labour force all the time – 45 million new job seekers
each year… many increasingly desperate for opportunity as we have seen in Tunisia, Egypt,
2 Sharan Burrow, Ituc General Secretary Address to DGB 2
nd congress on capitalism, Berlin 7 October 2010; and
Address by Sharan Burrow to the Brookings Institution Conference on Employment, 13 April 2011

10
Yemen and neighbouring countries but also Spain, Ireland, the US, Africa, Latin America, Asia;
youth unemployment is a global fear for our young people..
(even the estimates of unemployment of 210 million people) is a significant underestimation of
its true depth since many millions of people seeking work, particularly women, are not
registered and the informal economy is growing with the struggle to soak up these unregistered
individuals who have given up hope of secure, formal livelihoods
Africa’s Political Economy
38. Our analysis above of the international environment post the global economic crisis reveals that it
contains multiple opportunities and challenges for the South in general, and Africa in particular.
However, the fact that Africa is not as well positioned to respond to these challenges, as other
regions of the South, is not an accident of history, but comes on the back of the deep structural
challenges which Africa has inherited: its dependency on a particular – colonial - growth path, and
the role of past policies in entrenching these realities. If we are to take advantage of the space
which has opened up, we need to properly understand the roots of Africa’s ongoing crisis, and what
needs to be done to change Africa’s trajectory. It is therefore obvious that based on this analysis,
the people of Africa will need to develop a radically new approach, if we are to take our destiny in
our own hands. It has been said that the definition of insanity is repeatedly doing the same thing,
and hoping to get different results!
39. What does this mean for Africa? In the first place, it means that the expectations of our
governments and economic orthodoxy that the problems of economic development will and can be
solved by substantial support from western economies is not only contradicted by our historical
experience, but is unrealistic given the current predicament that these countries find themselves.
Secondly, we need to study creatively the experience of the newly emerging economies, to see
what critical lessons, we can derive from them. Thirdly, Africa needs to produce a new leadership of
strategic vision, with a commitment to the interests of our people to lead us in the coming
challenging years. The trade union movement has an important role in promoting the birth of this
new leadership. We allude to this with full acknowledgement of the current limitations of the
African trade union movement. A fresh strategic vision needs, however to be based on a historical
analysis of Africa’s political economy, to identify the required building blocks for a new growth and
development path.
40. Dominant features of the African political economy include:
The deliberate entrenching by the former colonial powers, multinationals and predatory
African ruling elite, of colonial economic patterns of extraction of Africa’s minerals, raw
materials, and agricultural products, (based on abundant supplies of cheap labour); and
reliance of Africa on importation of intermediate and finished goods from other regions,
leading to economic stagnation, underemployment and chronic economic dependence;

11
Related to this, is the failure to develop a diversified industrial base, and therefore the
relatively small size, with a couple of exceptions, of a developed industrial proletariat;
The perseverance of pre-capitalist relations of production, and semi-feudal social relations,
combined with the destruction of traditional forms of production, and the emergence of a
large landless or semi-landless peasantry, with a tenuous hold on the countryside;
The reliance by the majority of Africa’s working people, together with semi-subsistence
agriculture, on informal employment, self-employment, and atypical forms of work, most of
them underemployed, and struggling to survive;
Combined with the resultant narrow fiscal base, the lack of a developed physical, social, and
human development infrastructure, which in turn acts as a fetter on economic development.
Physical infrastructure, including roads, port and other transport nodes, remain focused on
servicing colonial hubs, rather than internal development or trade in the region;
In the absence of the expanded reproduction of society’s economic base, the middle class, and
emerging capitalists, rely disproportionately on accumulation via the state apparatus, leading
to the emergence of predator, or semi-predator states at worst, or comprador bureaucratic
elites at best, with all the worst consequences in terms of corruption, nepotism, abuse of
human rights etc. Where genuine fighters for African peoples have emerged, many have been
destabilised, frustrated, and if necessary assassinated, and replaced with compliant leaders
and despots to serve corrupt foreign interests, and their African comprador allies.
41. Having made a similar analysis of Africa’s political economy, well known radical scholar John Saul,
then points out that these realities do not mean that Africa is unattractive to foreign investment:
“…from a corporate viewpoint, in which the aim is not to develop countries but to exploit profitable opportunities, the prospects can still appear bright enough. Above all in the oil, natural gas, and minerals industries there is optimism, even excitement. Africa’s resources are still substantially untapped, many existing discoveries are yet to be developed and many new ones still to be made. The “investment climate” has been made easier, thanks… to a decade and a half of aid “conditionality,” and the returns can be spectacular; the rates of return on U.S. direct investments in Africa are, for example, the highest of any region in the world (25.3 per cent in 1997)…
“An economic profile of Africa drawn from this perspective would pay relatively little attention to countries or states, except as regards the physical security of fixed investments and the availability of communications and transport facilities. Instead it would highlight a group of large transnational corporations, especially mining companies, and a pattern of mineral deposits, coded according to their estimated size and value and the costs of exploiting them… and a few associated African stock exchanges worth gambling on.
“This map would also include numerous agricultural opportunities, such as the plantation or outgrower production of tea, coffee, cocoa, cotton, sugar, and the like; some low-tech manufacturing for local markets, such as beer and soft drinks, plastics, and cement; and a very limited amount of export manufacturing (e.g., of textiles) by subsidiaries of foreign firms... A larger-scale version of this

12
map, for smaller capitalists, would, of course, show many more modest-scale opportunities… from construction to transportation, import-export businesses, hotels, and so on. And on no actual map, but existing in reality, are the illegal business opportunities, from diamond smuggling to gun-running and drug trafficking, that corruption and the collapse of state authority increasingly open up. In short, a profile of “crude, neo-imperialist” capitalism, exploiting people and resources, but often not needing—and usually incapable of building—the wider social, economic, and political structures required for the development of capitalist production relations and sustained, broad-based capital accumulation… is Africa a victim of exploitation or of marginalization? The short answer must be that
it is both.”3
42. Does the much talked-about ‘boom’ in Africa change these patterns (an over 5% average growth rate
in the 5 years to 2008, and a recovery again to 4.9% in 2010, after growth declined in 2009)? This
rosy picture trumpeted by international financial institutions, as representing the emergence of the
‘African Lions’, masks the deep structural problems which African economies continue to face.
African economies have in fact been harder hit by the economic crisis, than other economies in the
South, with eg South Africa having shed 1 million jobs, and the overall plight of African workers has
not significantly improved. For example, wage austerity has hit African workers worse than any
other region: the ILO surveyed 108 countries in 2009, during the height of the financial crisis, and
57 increased their minimum wages. In Africa however, 26 of the 32 countries surveyed froze
minimum wages over this period, even though African minimum wages are pegged at a very low
level. As mentioned above, even the commodities boom hasn’t shifted Africa into trade surplus- in
2009 Africa registered a $21 billion trade deficit.
43. Nevertheless we are not dismissing the significance of Africa’s recent growth story- there are
features which need to be carefully assessed: Although Africa’s growth picture may not reflect a
change in Africa’s development path, it may be an opportunity to drive a change in its trajectory.
Africa’s recent growth, is based on the commodities boom, which despite the economic crisis,
reflects mainly on surging demand from India and China. The challenge is to invest the dividends
from this resource boom, and channel them into a strategy to finance broad based economic
development, as has been done in numerous resource rich countries over the decades. At a
regional level, we are being offered a model on how to do this by Latin America, something we
discuss below. If, however, Africa’s leaders don’t act differently, to the way they have acted in the
past, this commodities boom will turn into a ‘resource curse’ which will further deepen the features
outlined above. If the dividends are not invested, the boom will simply deepen Africa’s vulnerability
to commodity price fluctuations; make other exports uncompetitive as the currencies appreciate;
and constitute a major squandering of irreplaceable assets. Further, failure to assert real ownership
of Africa’s resources will in all likelihood continue the pattern of super-profits from mining
3 John Saul and Colin Leys “Sub Saharan Africa in global capitalism” Monthly review, July/August 1999

13
companies which don’t benefit the people, and massive looting by corrupt leaders.4 The African
trade union movement needs to put forward a coherent set of proposals on how the opportunities
can be realised; and these dangers avoided.
Mining and drilling
44. Africa's most valuable exports are minerals and petroleum. A few countries possess and export the
vast majority of these resources. The southern nations have large reserves of gold, diamonds, and
copper and many other strategic minerals: According to Wikipedia, the continent is believed to hold
90% of the world’s cobalt, 90% of its platinum, 50% of its gold, 98% of its chromium, 70% of its
tantalite, 64% of its manganese and one-third of its uranium. The Democratic Republic of the Congo
(DRC) has 70% of the world’s coltan, and most mobile phones in the world are made with elements
refined from this mineral. The DRC also has more than 30% of the world’s diamond reserves5. Our
oil reserves are concentrated in Nigeria, Angola, and Libya, as well as a number of other African
countries6.
While mining and drilling produce most of Africa's revenues each year, these industries only employ
about two million people, a tiny fraction of the continent's 370 million odd labour force. Profits
normally go either to large corporations or to the governments. Both have been known to squander
this money on luxuries for the elite or on mega-projects that return little value. At the heart of the
problem of the mining industry in Africa is that it is an enclave industry established during the
period of colonial subjugation of the people of our continent and continued largely as a raw
material producing industry established to meet, not African needs and aspirations, but external
demands and interests. It has hardly any relationship with the rest of African economies. It
produces little or no multiplier effects on the internal economy. At the same time, it exploits and
drains out of the continent’s exhaustible, non-renewable resources at great cost to the
environment and the lives of affected communities.
45. One commentator argues that the investments and ‘aid’ are a ‘gigantic credit system’ that creates a
mountain of debt which Africa has been paying in the form of transfer of real values – coffee,
4 The World Bank estimates that as much as $200 billion of the $600 billion earned in oil revenue by the Nigerian
government since 1956, may have been stolen by successive governments. See Class Struggle and Resistance in Africa, Leo Zelig p3. 5 http://en.wikipedia.org/wiki/Africa#Economy
6 African countries producing oil are (those in the top 50 oil producing nations, have their rankings in brackets) : Ethiopia; Algeria (15)(OPEC Member); Angola (16) (OPEC Member); Cameroon; Chad (50); Côte d'Ivoire; Democratic Republic of the Congo; Republic of the Congo (38); Egypt (28); Equatorial Guinea (34); Gabon; Ghana (40); Libya (17) (OPEC Member); Mauritania; Nigeria (14)(OPEC Member); South Africa (42); Sudan (33); Tunisia

14
cocoa, cotton, cobalt, platinum, gold, chromium, manganese, uranium and titanium, etc. In a recent
paper by the director general of UNIDO, and South Africa's minister of trade and industry the
authors say that Africa has 80–200 billion barrels of hydrocarbon reserves, but most of these are
exploited by global corporations.7
46. A critic of this syndrome uses the World Bank’s own book, Where is the Wealth of Nations? to argue
that a full cost accounting reveals the extent of the loss which Africa has experienced through this
primitive extraction of its resources. The book states that “Genuine saving provides a much broader
indicator of sustainability by valuing changes in natural resources, environmental quality, and
human capital, in addition to the traditional measure of changes in produced assets. Negative
genuine saving rates imply that total wealth is in decline.” Based on this measure, once they factor
in society and the environment, Africa’s most populous country, Nigeria, fell from a GDP in 2000 of
$297 per person to negative $210 in genuine savings, mainly because the value of oil extracted was
subtracted from its net wealth. Even the most industrialized African country, South Africa, suffers
from resource curse on this measure: instead of a per person GDP of $2837 in 2000, the more
reasonable way to measure wealth results in genuine savings declining to negative $2 per person
that year.8
47. In addition to this price which Africa has paid in foregone development, for this process of resource
extraction, a number of African countries have become the site of proxy wars fought by, or on
behalf of corporate interests, attempting to secure control of precious minerals. Some
commentators, for example, claim that state and corporate violence in the Eastern DRC has
resulted in ‘resource-extraction-related mass murder’ adding up to maybe 5 million people.9
The scramble for Africa’s resources- the role of the US Military
The unpredictability of the US military complex’s approach to China has recently been outlined, in
relation to Africa, and the scramble for strategic minerals, in a disturbing article published on May
28, 2011:
Tirivangani Masawi writing for a website called Global Research, argues that Southern Africa has
become the “battle ground for a new scramble for resources, with the United States seeking to
muscle out Chinese influence so as to secure strategic minerals - mainly for its military. More
frightening is the possibility of the US military itself becoming involved in securing these strategic
minerals within the next 20 years.” He bases his analysis on a study by a Dr Stephen Burgess, a
7 Challenges of the green economy for sustainable Africa Yash Tandon, Pambazuka 4 July 2011
8 Is Africa Still Being Looted? Patrick Bond, Pambazuka, August 17, 2010
9 Bond, Ibid

15
professor at the US Air War College. Burgess argues that Washington may have to enlist the
services of the Department of Defence, the National Security Agency and the Africa Command
(AFRICOM) to secure Southern Africa's resources. He says the US should move quickly to secure
Southern Africa's uranium, manganese, platinum, chrome, cobalt and rare earth minerals for
America's industrial needs and for its military as well as maintenance of weapons systems.
Burgess notes: “Of particular concern is possible future conflict between the United States, which needs
strategic minerals for national defence and other purposes, and China, which needs an increasing
amount of resources to fuel its accelerating industrialization.”10
We note the increased desperation of imperialism as expressed by its growing belligerence, hence the intensified military viciousness and the arming of global politics in general. In this regard, we reject the presence of NATO, AFRICOM, the increased foreign military bases on the continent and the increasing military budgets while poverty is deepening on the continent. All this is happening in the name of fighting terrorism, yet its actually about defending despots/elites from working class anger and struggles, and about gaining control of the continents resources.
48. The question is whether Africa can overturn this brutal history of exploitation of its resources and its
people, to harness its mineral resources for developmental purposes; and what it will take to
achieve this objective. Some commentators argue that the industry is too inherently corrupt,
destructive of people, harmful to the environment etc, to be harnessed for development. But Africa
does not have the luxury of abandoning these resources, since they constitute the continents main
economic leverage to construct a broad based industrial development agenda.
49. An expert on the mining industry has argued that certain steps can be taken to overcome the
resource curse11 (which apart from the social ills referred to above, creates the economic syndrome
of high and wasteful consumption; low levels of investment in other sectors; overvalued currencies;
and extreme vulnerability to price fluctuations). He argues that natural resources can be used to
catalyse industrialisation, by deploying policy tools to enhance linkages to the local economy and
promote diversification. These are all aimed at leveraging these resources for value addition:
Levying ‘resource rents’ on mined resources, and channelling these into economic and social
investment;
Developing infrastructure for other economic activity, using these rents
Beneficiation or downstream value addition: taking advantage of aces to resources to establish
resource processing industries which then provide inputs for manufacturing
10
Tirivangani Masawi, Pentagon Plan to muscle out China http://www.globalresearch.ca/index.php?context=va&aid=25014 11
Strategies for resource based development Paul Jourdan, New Agenda fourth quarter, 2008

16
Upstream value addition: use of the resource sector market to develop the supply/ inputs sector
(capital goods, consumables, services)
Technology/product development- resource exploitation technologies generally need to be
adapted for local conditions, and require deliberate investment in R&D and human resources, with
wider ramifications for non-resource markets.
50. He considers why African states have been unable to take advantage of their resource endowments
to make these linkages, and concludes that with the necessary leadership, political will, and
deployment of the required resources, these obstacles can be overcome. But this requires taking on
vested interests, both in industry and in the state. He identifies certain capacities which need to be
unlocked, both at the level of the state, as well as the economy to ensure that this strategy
succeeds. Important among these, are the development of financial institutions and regulation
dedicated to financing industrial development; the effective use of licensing of mineral rights to
require implementation of this industrialisation strategy; the development of the required
infrastructure, particularly transport and energy; and the building of inter-state, regional co-
operation, including through development corridors. Trade strategies should also consciously
advance the beneficiation drive. For example, in the Comprehensive Strategic Partnership signed by
South Africa with China in 2010, China committed to work with SA to beneficiate mineral products
at source and to purchase more value added products. These and other ideas need to be developed
into a coherent continental strategy, with the necessary resources, and political will, to make a
meaningful impact. African trade union federations, and unions particularly in the mining and
manufacturing sectors, should play a key role in pushing for this approach.
Mining and the environment12
A Tanzanian gold mine leaks polluted water into a major river. A mining town in Zambia is listed as
amongst the most polluted places in the world. And a water pollution problem in South Africa that
is caused by mining threatens national water resources.
Like copper and silver, gold is found in rock containing sulphide minerals that when crushed and
exposed to air and water forms sulphuric acid. The acidic water dissolves other toxic metals such as
mercury, lead and cadmium found in surrounding ore. If not safely contained, acid mine drainage
(AMD) - a process that continues as long as sulphides from mine waste, open pits, and tailings
interact with air and water - leaches toxins into the ecosystem, stripping life from everything in its
wake.
Another dangerous chemical specific to gold mining is cyanide, used to extract gold from ore, releasing
lethal metals such as mercury in the process, while breaking down into toxic compounds…
12
This is a summary of an article by Khadija Sharife, Pollution: Africa’s real resource curse? Pambazuka 8 June 2011

17
Kabwe, Zambia’s second largest city, had the dubious honour of being ranked as Africa’s most polluted
city and the world’s fourth most polluted site thanks to the unregulated lead (800,000t) and zinc
(1,800,000t) mining and smelter activities that took place from 1906 until 1994.
In South Africa, according to NGO Earthlife Africa, ‘A total of 43,500 tons of gold has been removed from
the Witwatersrand area’, while between the 1950s and the first democratic election, ‘a total of
73,000 tons of uranium was mined.’ The result? A gaping mine tailings dams, comprised of waste
material measuring 400 square kilometres in addition to six billion tonnes of pyrite (iron sulphide),
‘one of the substances, which, when exposed to air and water, produces acid mine water’. The
‘cradle of mankind’ has already been impacted by 40 million litres of acid mine drainage (AMD).
While South Africa’s agricultural sector uses ten times the water utilised by mining houses (the
former is estimated to use 7,920 million m3 per annum), the costs of mitigating the AMD,
externalised by mining corporations, is projected at R360-billion in specialised water treatment
plants over the next 15 years…
A research report, shoots down government’s conservative estimates that future water shortages will
be in the range of two to 13 per cent. According to the reports author, water demand will exceed
availability by 33 per cent in 2025. Government did not take into account the reduced availability of
water from pollution, in addition to global warming…
Not only will mines evade the legal minimum requirement of the ‘polluter pays principle’ but also profit
from it. ‘What’s more, that profit is all but guaranteed, because it will be underwritten by the state
in the form of a mooted Public Private Partnership (PPP)’. The deal allows for mining houses to
access a R3.5-billion deal with no tendering process, as well as select ‘treatment’ described as the
‘least cost option’ via a process shrouded in secrecy…
Agriculture, food production, and land-leasing
51. Detailed analysis is required on the state of agriculture in Africa, and policy options on the way
forward. This is a complex question, and needs far more consideration than is possible here.
However, it is important to draw attention to a growing phenomenon in Africa, namely the large
scale leasing of land and the introduction of technologies both of which are displacing peasant
producers. According to one commentator many African governments are selling off or leasing
agricultural lands to foreign investors from Europe, the US, India, China, the Gulf States and further
afield. There is a rush for ‘all of Africa’s resources’, including land, not just its forests, oil, gold and
diamonds.13 As a result, ‘hundreds of thousands’ of African rural people are being displaced and
dispossessed to make space for domestic and foreign land grabbers, to ‘grow food for the poor’ –
13
Challenges of the green economy for sustainable Africa Yash Tandon, Pambazuka 4 July 2011

18
using agro-chemicals or the magical biofuel ‘green gas’. This kind of exploitation is being
encouraged by mainstream African economists and power elites. Under the guise of providing
Africa with ‘climate-sensitive’ food crops and flowers, an organisation called AGRA (Alliance for a
Green Revolution in Africa) is pushing agro-chemical crops using multi-genome patents. In the
event small peasant farmers ‘from Mali to Mozambique’ are resisting the takeover of their lands
and meagre means of sustenance.
52. This view is endorsed by another commentator working in the field14. He observes that land-leasing
is a recent phenomenon that is sweeping the continent, called by some a land grab or a form of
agrarian colonialism. Wealthy nations, to secure food for their own populations, seek deals to lease
land abroad to grow food strictly for their people, excluding people of the host country. Qatar,
Saudi Arabia, and the United Arab Emirates have made such propositions to countries such as
Ethiopia, Kenya, Madagascar, and Sudan. Private investors and food companies are also planning to
enter into such deals, as well as some designed to acquire biofuels rather than food for the paying
nation. Land-leasing also raises ecological concerns: vast plantations grow crops using large-scale
intensive monoculture methods involving large quantities of fertilizers and pesticides.
53. He argues that seeking the solution to food shortages by boosting yield with modern agribusiness
technologies, including genetically modified (GM) crops and animals, is based on a fallacious
premise that the inequitable distribution of food and unsustainable agricultural practices that limit
Africa’s food security are overwhelmingly technological in nature, when in fact the causes are
social. The answer to poverty and hunger lies inter alia in creating more just and peaceful societies,
banning some forms of international commodity speculation, eliminating corporate control of food,
rectifying inadequate distribution systems, and improving conditions for sustainable agriculture,
not in ‘high-tech fixes’.
54. Factory farming creates a host of issues, including:
Land degradation. Escalating soil erosion, compaction, and salinization, declining fertility,
agrichemical pollution, soil demineralization, and desertification threaten economic and physical
survival.
Droughts. Recurrent droughts increase soil degradation, and soil degradation magnifies the impacts
of droughts on cultivated land and rangeland in many parts of Africa.
Food sovereignty concerns. Corporate control of the food supply denies farmers and other citizens
the independence they need for long-term wellbeing.
14
Land-Leasing and Intensive Food Production Anteneh Roba, July 05, 2011

19
Loss of biodiversity. Use of GM crops can further deplete ecological and agricultural diversity
through pollen contamination.
Social strife. High prices of high-tech, including GM seeds and "livestock" factory farming, drives
some small- and medium-scale family farmers from their land. Leaving farmers landless drives them
to overpopulated urban areas, subjecting them to poverty, hunger, and infectious diseases. Some
turn to crime or commit suicide. On a large scale, such widespread socioeconomic disruption leads
to political unrest with many destructive consequences. Factory-farmed GM animals are less
resistant to diseases, some of which can spread to humans. GM animals are often poorly adapted
to local ecosystems.
55. He argues that, even ignoring hidden costs of factory farming, industrial agriculture is inherently less
efficient at producing food than smaller sustainable farms. While large-scale, single-crop (also
called mono crop or monoculture) industrial farms produce a large output per worker, diverse-crop
sustainable farms produce more food per acre of farmed land. Sustainable farms require more
workers and create more jobs, while also feeding more people from less land than industrial farms.
56. The labour movement, together with rural and farmers organisations, need to look at these issues in
more detail, and come up with a proposed strategy for agriculture. At the same time, as with
mining, an agro processing strategy is required, to ensure that Africa’s produce is not shipped out in
its raw form, but that value is added. How does a strategy which incorporates small producers, also
link to a broader agricultural and agro processing thrust? Consideration is needed of the types of
support which the state needs to give for such a strategy to succeed, the role of co-ops etc,
including a thorough examination of lessons from existing experiences in Africa, and other parts of
the world. The challenge of increasing productivity of labour among small scale agricultural
producers is key to addressing the question of food security and easily accessible and cheap food.
The informal economy
57. The informal sector has not only persisted but actually grown in many developing countries,
particularly in Africa where it dominates the economy both in terms of output and employment. In
Africa, the majority of the labour force is in the informal economy, with the exception of more
industrialised economies such as South Africa and Egypt. It is estimated that as many as nine in ten
rural and urban workers have informal jobs. Most are women and young people who have no other
choice than the informal economy for their survival and livelihood.
58. According to the statistics of the International Labour Organisation 60 to 90% of the active
population in Africa is employed in informal economy. In sub-Saharan Africa, 84% of women non-
agricultural workers are informally employed compared with 63% of male non-agricultural workers
.

20
59. Most informal workers, both self-employed and wage earners, are deprived of secure work, workers’
benefits, social protection and representation. As a result of these and other factors, there is a
significant, but not complete, correlation between working informally and being poor. Poverty
trends mirror this pattern. In countries where informality is retreating, the numbers of working
poor are also declining. Conversely, in countries where informality is on the rise, the numbers of
working poor are increasing or remain the same.
60. It needs emphasis that the nature of agricultural production in Africa and its difficulties, the fact that
it continues to employ the vast majority of our people with very low productivity of labour result
from the logic and structure of the colonial economy and the failure of post-colonial leadership of
Africa to transform this oppressive colonial system. In the same way, the massive informalisation of
the political economy of Africa and the mass poverty it engenders derive from precisely the
structural inability of this political economy and those classes who superintend it to overcome their
severe limitations through a political agenda of visionary, democratic and transformational
leadership.
Size of the Informal Economy
Region Non Agricultural Employment - % Informal
North Africa 48%
Sub Saharan Africa 72%
Latin America 51%
Asia 65%
(Source: International Labour Organisation, 2002)
61. The ILO points out that if South Africa is excluded from the sub Saharan figures, the share of informal
employment in non-agricultural employment rises to 78% in sub-Saharan Africa. These figures
suggest that there are substantial regional variations within the continent but that even where the
informal economy is relatively small – in North Africa – nearly 1 in every 2 people working outside
of agriculture, works in the informal economy.
62. Figure 1 below draws from figures released by the International Labour Organisation in June 2011
reflecting the latest available estimates for the size of the informal economy for a range of African
countries. These do suggest again that there is variation but the average for these countries is 57%
of the non-agricultural employment is in the informal economy.

21
Figure 1: Informal Economy – Percentage of Non Agricultural Employment
(Source: Draw from International Labour Organisation 2011)
63. Women are disproportionally employed in the informal economy a relationship that is confirmed by
Sethuraman’s extensive review of global evidence (1998). There is a well established correlation
between income in the hands of women and poverty alleviation (Chant 2010).
64. Although individual incomes are often low, cumulatively these activities contribute significantly to
gross domestic product (GDP). The International Labour Organisation (2002:24) compiled
contribution to GDP in 16 Sub-Saharan countries of informal enterprises. The figures varied from
58% in Ghana to 24% in Zambia. On average the informal sector contributed 41% to GDP. These
figures suggest that the informal economy is playing not only a significant employment generation
and poverty alleviation role but is critical to local economies.
65. There is also evidence that the informal economy has been growing. In 2001 Chen (2001:268)
estimated that 93 per cent of new jobs on the African continent were in the informal economy.
Much of the data currently available however predates the global economic crisis. Small scale
studies show that the crisis forced new entrants into this segment of the labour market but also
generated job losses within the informal economy. These studies also find that existing operators
in the informal economy are facing greater pressures.
0%
10%
20%
30%
40%
50%
60%
70%
80%
90%
33% 35%
44% 51% 52%
60%
69% 70% 74%
82%

22
66. The 2010 UNCTAD TRADE AND DEVELOPMENT REPORT draws a clear connection between the role
of the informal sector in Africa, and the inability of African economies to develop broad-based
industrialisation:
In Africa, employment generation, and particularly the creation of high-productivity and well-paid
jobs, has been even more difficult. More than 20 years of orthodox macroeconomic policies and policy
reforms have had limited success in creating the conditions necessary for rapid and sustainable
growth, particularly in sub-Saharan Africa. Many countries in this sub region experienced a fall in per
capita GDP and manufacturing activities during the 1980s and 1990s. By the end of the 1990s, the
production structure of the sub region was reminiscent of the colonial period, consisting
overwhelmingly of agriculture and mining. The extent of the impact on employment was not fully
reflected in official figures on open unemployment but it was evident in the 20 per cent drop in labour
productivity.
The commodity boom, debt relief and the ending of a number of civil conflicts have contributed to a
recovery in income growth since 2003, which has continued in recent years despite the global crisis.
However, so far there is no evidence of any significant change in the pattern of employment. Official
employment rates have remained high in sub-Saharan Africa, which confirms that the unsolved
problem there is not a shortage of employment in absolute terms, but the lack of productive and
decent employment. Agricultural employment, which is largely informal, has diminished somewhat
with progressive urbanization, but it still represents more than 60 per cent of total employment.
Concomitantly there has been a rise in employment – again mainly informal – in urban services and
small-scale commerce. Formal wage jobs account for only 13 per cent of employment in this
subregion (excluding South Africa), and 60 per cent of the employed are “working poor”, meaning
that households are unable to meet their basic needs with the level of income earned ...
In North Africa, GDP growth slowed down, labour productivity stagnated and the sectoral
composition of employment remained broadly unchanged between 1980 and 2000. Employment
growth was not fast enough to absorb the rapidly expanding labour force. As a result, unemployment
surged to two-digit figures in the 1990s. The stronger rise in official unemployment figures in North
Africa is probably due to the fact that wage earners account for more than half of those employed – a
much higher share than in sub-Saharan Africa. Since 2000, the acceleration of GDP growth has helped
reduce unemployment in a context of rising labour productivity. But at close to 10 per cent,
unemployment is high compared to other developing regions, and remains a serious problem,
especially for young people and women.
The challenge of industrial diversification
In 1965, the manufacturing sectors of East Asia and Latin America were of similar relative size,
accounting for some 25 per cent of GDP. By 1980, the share of manufacturing had risen to
almost 35 per cent of GDP in East Asia and stayed above 30 per cent into the 1990s. In Latin
America, manufacturing remained stagnant at slightly above 25 per cent throughout the 1980s.

23
The share of manufacturing in GDP in East Asia is now some 30 per cent, but manufacturing
experienced a sharp decline in Latin America, falling to a low of some 18 per cent of GDP in 2000-
2005. In sub-Saharan Africa…the share of manufacturing in GDP has never exceeded 12 per
cent.15
Industrialised countries accounted for 74.3 per cent of world manufacturing Value Added (MVA)
in 2000, but dropped to 69.4 per cent in 2005. Developing countries, for their part, increased
their share by almost five percentage points. Countries with economies in transition accounted
for a very small percentage of world MVA—only 1.7 per cent in 2005. Reflecting its high rate of
output growth, East Asia and the Pacific increased its share of global MVA from 13.3 per cent in
2000 to 17.5 per cent in 2005. Latin America and the Caribbean lost ground marginally, from a
6.6 per cent share of global MVA in 2000 to 6.4 per cent in 2005. The share of sub-Saharan
Africa remained unchanged at 0.7 per cent (of which SA accounted for 0.4%).16
67. These figures starkly illustrate the scale of the challenge facing Africa in its bid to industrialise, as
well as the important role South Africa needs to play as the industrial locomotive of the region
(accounting for over 50% of sub Saharan Africa’s industrial output). However, South Africa itself
has recognised that its industrial development remains narrowly based, and too dependent on the
mining and financial sectors. It has therefore adopted a strategy which is aimed at broad-based
industrialisation, not only in South Africa, but also in the region.
68. South Africa’s Industrial Policy Action plan (Ipap 2) needs to be carefully examined, and assessed on
the extent to which it advances these objectives, both in South Africa, and the continent more
broadly. Drawing on this, and other experiences in the region, the African labour movement needs
to elaborate an industrial development strategy for the continent. This needs to be done urgently,
to feed into unfolding proposals for an African economic community-see below. It is only in the
context of such a strategy that we will be able to give our campaign for decent work real meaning.
69. Drawing on ideas which have begun to emerge such a strategy needs to include, amongst others
An approach to financing broad based industrialisation;
A continental ‘division of labour’, which builds on existing strengths of countries and sub
regions, and develops new capacities;
An approach to African beneficiation of all raw materials, minerals, and agricultural products;
An approach to African procurement of African goods by all governments and African
enterprises;
15 Industrial Development Report 2009, UN Industrial Development organisation (UNIDO)
16 UNIDO, p 104

24
The building of a capital and intermediate goods sector, linked to the development of
infrastructure, transport, and IT;
A focus on building synergies between formal economy enterprises, and the informal sector e.g.
through the retail sector, and the building of the solidarity economy;
The development and resourcing of a continental R&D, and HRD strategy which is targeted at
the identified focus areas;
The development of an African, developmental macro-economic strategy, which enables and
promotes the industrial strategy;
The development of an African trade strategy, both in terms of South- South, intra African, and
other trade, which is primarily focused on reinforcing the new industrial strategy.
Infrastructure: overcoming colonial geography
70. Africans experience all manner of challenges relating to geography and climate, which have
impeded economic development, communication, and movement. But the greatest challenge we
face in this regard is perpetuation of the colonial infrastructure legacy, which constructed networks
essentially aimed to move products from Africa to the colonial metropoles, and not to encourage
movement within the region. This is why existing infrastructure is largely directed to the movement
of goods to the ports, and why it is so difficult to move within the continent. Therefore we face a
huge challenge to overcome this legacy, by building a new continental infrastructure. A strong case
could be made that former colonial powers should be required to pay reparations, to contribute to
the construction of this infrastructure, given the massive price the people of Africa paid in terms of
their dispossession, and denial of the most basic development. However, we cannot wait for the
former colonisers to concede to this demand.
71. The building of this new infrastructure, as outlined above, is a critical element of any strategy for
development and industrialisation. The labour movement needs to engage with the proposed
projects being put on the table by AU and the various economic communities, and determine
whether the identified priorities, funding models etc, are appropriate. As indicated above, we also
need to ensure that the building of the infrastructure has the maximum developmental impact, the
necessary labour intensity, procurement of African goods etc. We should consider requesting that
resources are made available by governments to enable the labour movement to employ the
necessary expertise, to ensure that we are able to engage meaningfully with the technical detail.

25
Climate change negotiations and technical expertise
72. A prominent commentator and activist has observed17 that it is important that African countries are
self-reliant on matters related to policy issues, especially when it comes to negotiations in the
global system, rather than ‘outsourcing’ policy advice to ‘experts’ from Western NGOs on the
grounds that African countries do not have the experts or the money to finance them.
73. This is a relevant and important point in relation to climate change negotiations. As we move to
COP-17 and Rio+20, it is important that the African Union Commission builds its own network of
experts to advise African countries on technical and political issues that are likely to emerge in the
months ahead.
74. ‘Policy making’ is not something that African governments should ‘outsource’ to anybody from
outside Africa. It is best for Africa to develop its own expertise than depend on outside help, not
only on negotiations on climate change but all matters of vital policy concern to Africa.
75. The labour movement too needs to ensure that it develops focused proposals on climate change
issues that will affect African workers. In particular, we need to give fuller content to the notion of a
‘just transition, ensure that workers aren’t prejudiced by agreements, and proactively put forward
proposals on the green economy which will take forward our decent work and development
agenda.
A New Model for Regional Economic Integration
76. The shifting tendency of economic power towards the South has also created the possibility for a
more assertive regional economic strategy by progressive states in the South, which de-links them
from economic domination by advanced capitalist states, and large multinationals. This potentially
lays the basis for greater control over natural resources, their beneficiation, and their prices,
thereby undermining a key cornerstone of colonial and neo-colonial domination. The region, more
than any other, which has begun to show the potential power of this model, is Latin America which
has introduced an approach to delink their economies from US domination.
77. The creation of new regional economic alternatives and architecture needs to be distinguished
from the traditional conception of “regional integration”, which has been used, certainly in the
period of neo-liberalism to impose a ‘one size fits all’ approach on countries in various regions. Thus
regional integration has been a vehicle to force countries to adopt IMF-compliant macroeconomic
targets eg on monetary policy and inflation targeting, budget deficits, tax policy, tariff liberalisation
etc. Therefore the main thrust of ‘integration’ has not been a developmental strategy for particular
regions, but integration into the hegemonic neo-liberal parameters laid down by the dominant
17
Challenges of the green economy for sustainable Africa Yash Tandon, Pambazuka 4 July 2011

26
powers. The Free Trade Agreements (FTA’s) which the US imposed in central America, and tried,
but failed to impose on Latin America, is a classic case in point. Some of our own sub-regional
agreements, and the proposed approach in Nepad, began to stray down this road. Even the
Maastricht agreement setting the rules for European economic community, tried to compel states
to adopt these parameters.
78. Recently in Latin America, a different approach to regional economic integration has emerged with
at least two critical elements- creation of a new regional financial architecture, aimed at severing
dependence on the dollar, and use of natural resources as leverage, and for mutual benefit,
particularly oil and gas.
79. The question is whether Africa will be able to use its access to strategic minerals to achieve similar
ends, and whether the people of Africa are able to put in place progressive governments, which like
Latin America, have the political will to harness the resources for the benefit of our people, rather
than other interests, as is currently the case. Such an approach would constitute the basis for new
type of African integration.
80. It is an open question whether the proposed African Free Trade Area, which was recently launched,
will be able to be moved in this direction (an FTA is a trading zone whose member countries have
signed a free trade agreement, which eliminates most tariffs, import quotas and preferences on
goods and services traded between them18). Leaders of 26 African countries, meeting in
Johannesburg on 11 June 2011, agreed to formally launch negotiations to establish a grand free
trade area pulling together three regional economic communities, namely the Common Market for
East and Southern Africa, the East African Community and the Southern African Development
Community. The countries involved have a combined GDP of US$860-billion and a combined
population of 590-million. The first phase of setting up the 26-country free trade area is expected to
come into effect in three years. Member countries had agreed to carry out negotiations in two
phases, with the first to be concluded within 36 months. Next step aims to include the West African
countries in free trade negotiations. In South Africa, the proposed agreements will be tabled at
NEDLAC for discussion.19 The focus is on trade integration, infrastructure development, and
industrial development.
81. According to Rob Davies, South African trade and industry minister, “in our view a large scale
African FTA will be a stimulus- if it is complemented by these co-operation programmes to develop
18
South African Trade and Industry Minister Rob Davies indicated in an interview that “it doesn’t mean that we must remove duties on absolutely every product… but we will do so for a sizeable block of products, and the bigger economies will have to do more than we expect the less-developed to do” (New Agenda 2
nd Quarter 2011)
19 http://www.southafrica.info/news/international/fta-150611.htm

27
regional, rather than national, internal markets. It could play a similar development role as internal
market development did in India, Brazil and China”20
82. Part of the strategic thrust of the Latin American model, is to place emphasis on the more
autonomous development of the region, to make it less dependent on the economies, and
fluctuating demands of the North. While this shift in emphasis to regional trade and economic
activity will be dismissed by some critics as inward looking, protectionist etc., it is actually a
mechanism to increase trade, but to place greater emphasis on trade within the region. In Africa eg
we currently have an extremely low level of regional trade- a mere 10% of African trade is between
fellow countries on the continent. Changing this not only creates greater self-sufficiency and
economic integrity for regions, but is also environmentally progressive, reducing the carbon
intensity of economies, given the dramatic reduction in the transportation of traded goods.
83. The economic crisis has called into question the export-led strategies of developing countries, as
they can no longer expect that industrialized countries will absorb the additional supply. This may
“require a reorientation of development strategies towards more investment in local
development”21. Some activists have argued that we need to consciously develop a strategy of ‘de-
globalisation’, to address the problems of dependence, and to foster more autonomous
development. While this may not appear compatible for example with a broader South-South
economic strategy, which goes way beyond local and regional development, it does raise some
important ideas for consideration. At the same time, an African strategy to deepen South- South
trade needs to be taken seriously. For example, between 2006 and 2010, SADC exports to BRICS
countries increased fourfold. According to UNIDO:
The rapid growth of developing country exports of manufactures was driven primarily by the very
rapid growth of trade between developing countries: South- South trade. While global
manufactured trade continues to be concentrated within the developed world, South-South trade
has increased its share in world trade by four percentage points in only five years—it currently
accounts for 14.5 per cent of global trade. Trade in manufactures within the developing world
grew at 16 per cent per annum between 2000 and 2005, double the pace of manufactured trade
between high-income countries. Trade between developed and developing countries grew at
about half the rate of South-South trade.22
84. The two key elements of the Latin American strategy are
to use their natural resources, particularly gas and oil, to bolster economic self-sufficiency, and
to restructure their regional trade and financial architecture.
20
New agenda, second quarter 2011 21 Don’t waste the crisis, Executive summary, ILO 2011
22 Industrial Development Report 2009, UN Industrial Development organisation (UNIDO)

28
New types of regional economic development
85. The development of new forms of regional economic cooperation in Latin America, contains the
seeds of a radical economic alternative. In combination with the shifting economic power to the
South, this raises the possibility of new forms of economic organisation and alignment, not only in
Latin America, but other regions. Of course, we cannot ignore the fact that the reality of a left-
oriented political hegemony in Latin America, doesn’t yet apply in other regions. Nevertheless, the
labour movement could play an important role in Africa, in encouraging progressive states to
develop a new approach to regional economic development. It is therefore crucial that, together
with our civil society allies in the region, we develop coherent proposals in this regard, drawing
from the concrete alternatives being developed in Latin America.
86. We also need to develop stronger regional bargaining strategies, as well as trade union, and trade
union-government forums, for Africa, and align these to a development strategy. What possibilities
are there to influence the recently launched African Free Trade Area discussed above? Critically, we
need to seek agreement on a more domestically/ regionally focused growth path, a broad based
industrialisation strategy for the region, strategies for food security etc. Increased trade within the
region, as well as greater self-sufficiency in the production of food, amongst others, also creates
potential synergies with a green growth agenda.
Africa and China
“China‘s rapid growth has transformed its relationship with Africa. Industrialization has boosted China‘s
import demand for oil and minerals (e.g. iron ore, bauxite, nickel, copper), which Africa can satisfy.
China is now Africa‘s third largest trading partner; bilateral trade with Africa reached $114 billion in
2008, up from $65.9 billion in 2007. .. While China is an important investor in African infrastructure ($11
billion in 2008, compared to $13.7 billion by the G-8 countries-ICA, 2009), Chinese investments are
generally determined by bilateral engagements with individual African countries, and often lack a
regional perspective.
The economic relations between China and Africa have often been referred to as being based on
infrastructure for commodities deals, where Chinese investment in African infrastructure is financed by
Africa‘s exports of commodities and raw materials. ..China is taking some steps to support African
manufactured exports: China is in the process of expanding the zero-tariff treatment to 95% of the
products for African LDCs...
Although Chinese investments are often highly effective in terms of cost and implementation, their
development impact remain frequently limited. It could be enhanced by encouraging increased reliance

29
on local suppliers, that is, employing more African labour and subcontracting project components to
African companies. African governments have increased local content requirements governing foreign
investments. For example, Nigeria recently tightened requirements governing local firms‘ participation
in oil contracts and Angola has in the past required the use of local construction materials
While China‘s investment in mining and infrastructure is dominated by public companies, small- and medium-
sized enterprises from China‘s private sector are also making significant investments. Many textile
producers are already shifting from China to Africa, and there is considerable potential to relocate the
whole range of consumer durables, automobile and other transport manufactures, and electronics.
Survey research undertaken for this study points to the main drivers of investment in Africa by China‘s
SMEs…
The survey data reveal that Chinese managers have a strong work ethic and entrepreneurial spirit, and are
willing to engage in markets where profit margins are low (at least initially) and supply chains are weak.
They take a long-term perspective on the value of markets, and hope to reap strategic advantage by
entering at an early stage (in terms of profitability and size)…
The top five motives for investing identified by Chinese SMME’s were: (1) Access to local African market; (2)
Intense competition in domestic Chinese markets; (3) Transfer abroad of excessive domestic production
capability; (4) Entry into new foreign markets via exports from host; and (5) Taking advantage of African
regional or international trade agreements
Source: post-crisis prospects for China Africa relations African development Bank Group April 2011.
China and Africa post crisis
China is an important economic partner for Africa, as evidenced by the increase in trade, investment flows,
and various forms of economic co-operation between the two sides in the past couple of decades.
Whereas EU member countries were traditionally the major investors in Africa, along with the USA and
to a lesser extent Japan, China has grown to become a major investor in African resource sectors and
has facilitated the development of African infrastructure. Such infrastructure – roads, ports and power
stations - can be used to support national and regional economic diversification and to boost supply
chains. China‟s financial commitments to African infrastructure are also impressive: within four years, it
had more than quadrupled from less than US$1 billion per year in 2001-2003 to US$4.5 billion in 2007.
At their peak, commitments reached US$7 billion in 2006.
The upsurge in Chinese funding for African infrastructure offers great opportunities for boosting Africa’s
growth. However, there have not been convincing plans thus far by African governments to ensure the
economic relationship with China benefits a wide range of sectors at the national and regional levels.
Moreover, there needs to be greater capacity in the public sector to build on the investments made by
Chinese companies, such as maintaining roads built by the Chinese or using Chinese finance (mostly
concessional loans) to catalyse other resources and activities for development.

30
Angola has been one of the four biggest recipients of Chinese financing for infrastructure projects, and
indeed China and Angola’s partnership in this regard has come to be known as the “Angola model” and
is prevalent across Africa. Under the Angola model, the recipient country receives a loan from the China
EximBank; the government then awards a contract for infrastructure projects to a Chinese firm, while
also giving rights for extraction of its natural resource to a Chinese company as repayment for the loan.
The terms of the loan are usually concessional in nature, with on average low interest rates (ranging
from 1-6%), long repayment periods (from 5 to 25 years) and a generous grace period (from 2 to 10
years). In 2004, China extended a US$ 2 billion credit line to Angola for the development of its
infrastructure, which had been destroyed during the civil war. As repayment for the loan, Angola agreed
to supply China with 10.000 barrels of crude oil a day. The infrastructure projects in Angola include
electricity generation and transmission; rehabilitation of power lines; rehabilitation of Luanda railway;
construction of ring roads; telecomm expansion; water; and some public works projects. Also, in 2006
Angola and China created a joint venture, Sonangol Sinopec International, through their petroleum
companies China Petroleum and Chemical Corporation (SINOPEC) and Angola National Oil Corporation
(Sonangol). The new venture aims to explore crude oil prospects in three Angolan oil fields. Angola
supplies 51% of China’s oil imports from Sub-Saharan Africa.
Despite the gains it has made through its relations with China, Angola appears to be failing to optimise spin-
off benefits for its economy, especially for increased diversification. The dangers of this wasted
opportunity were illustrated in the recent global economic crisis when a drop in oil revenues had a
major negative impact on the Angolan economy, with GDP growth predictions for 2009 falling from
11.8% to 3%.
Source: Economic diversification in Africa OECD 2010
87. While we welcome the economic policies of some of the countries in Latin America directed at
uplifting the conditions of life of the people and also pay critical attention to the experience of
China’s economic success, African trade unions must at the same time be concerned that the
political liberties that our people have wrestled or are in the process of wrestling from tyrannical
regimes are not sacrificed on the altar of the ‘need for economic development’. This is especially
the case given Africa’s long and bloody history of political repression and widespread violations of
human rights.
88. The challenge therefore will be how to combine progressive economic policies in the interest of the
people with a polity that is sensitive to and respects the civil and political rights of the people,
thereby bridging the age-old separation between the economic and the formal juridical political
rights characteristic of liberalism. In other words, progressive forces must aim to win the battle for
democracy in all its multiplicity and our trade unions ought to be in the forefront of this battle.

31
Africa’s Social Profile
Population distribution – age and sex
89. The population of Africa has grown exponentially over the past century, and consequently shows a
large youth bulge, further reinforced by a low life expectancy of below 50 years in most African
countries.
According to United Nations estimates, the total number of people in Africa grew from 221 million
in 1950 to 1 billion in 2009 (as of November 2009). The population is growing at the rate of about
24 million per year, and could reach two billion by 2050 according to estimates. About 60%is less
than 25 years old.
90. The population sex ratio is about 100%. That means Africa’s population is made up of nearly the
same head count number of women as men.
Table 1: Characteristics of Africa’s population by sex and age
Indicators 2005 2010 2015 2020
Population (thousands) 911 120 1 022 234 1 145 316 1 278 199
Male population (thousands) 455 068 511 055 572 974 639 896
Female population (thousands) 456 052 511 179 572 342 638 303
Population sex ratio (males per 100 females) 99.8 100.0 100.1 100.2
Percentage aged 0-4 (%) 15.6 15.2 14.7 14.1
Percentage aged 5-14 (%) 25.5 25.1 24.7 24.3
Percentage aged 15-24 (%) 20.4 20.1 19.6 19.4
Percentage aged 0-24 (%) 61.5 60.4 59 57.8
Percentage aged 60 or over (%) 5.3 5.5 5.8 6.1
Percentage aged 65 or over (%) 3.4 3.5 3.7 3.9
Percentage aged 80 or over (%) 0.4 0.4 0.5 0.5
Percentage of women aged 15-49 (%) 48.0 48.5 48.9 49.5
Median age (years) 19.1 19.7 20.3 21.0
Population density (population per sq. km) 30 34 38 42
Source: Population Division of the Department of Economic and Social Affairs of the United Nations Secretariat, World Population Prospects: The 2010
Revision (On- line Database) NB: Percentage aged 0-24 (%) is an addition of Percentage aged 0-4 (%), Percentage aged 5-14 (%) and Percentage aged 15-24 (%).
91. According to the Economic Report on Africa (UNECA 2010), Africa’s population increased by 2.3 per
cent between 2008 and 2009, reaching about 1 billion people. 70% of the population is aged 30 or

32
younger, making Africa one of the youngest continents in the world. The rapid population increase,
together with increased rural-urban migration, creates many problems, including inadequate
provision of sanitation and social services, housing and employment. But that is only one side of
the question posed by rapid population growth in Africa.
92. The other side is what opportunities and potential strengths this social phenomenon provides
Africa. Posed in these terms, the rapid population growth on the continent and the fact that we
possess the youngest population in the world can then become the greatest asset of Africa
provided a number of other conditions are addressed and effectively satisfied. We are talking here
of what Africa could achieve with its young population if it were educated with the necessary
productive, scientific and technological capacities, skills and a consciousness of its mission as
makers of their own history.
Levels and nature of employment
93. Agriculture is the main activity for African people, especially in Sub-Saharan Africa where about
59.9% (FAO, 2010) of the population were employed in 2009. Among the 59.9% of African workers
employed by the agricultural sector, about three-fifths of them are subsistence farmers with many
living in rural areas - 41.2% in Southern African (74.5% in Swaziland and 38.3% in South Africa) and
55.4% in Western Africa (83.3% in Niger, 79.6% in Burkina Faso and 38.5% in Liberia). Subsistence
farms provide a source of food and a relatively small income for the family, but generally fail to
produce enough to make re-investment possible. Larger farms tend to grow cash crops such as
coffee, cotton, cocoa, and rubber. These farms, normally operated by large corporations, cover tens
of square kilometres and employ large numbers of labourers. This is followed by Services which
occupied almost 30% of the population in 2009 and the industry sector that involved about 10.6%
of the people at the same time.
Table 2: Sub regional employment characteristics by age and sex
Employment by sector and sex (%) Agriculture Industry Services
2007 2008 2009 2007 2008 2009 2007 2008 2009
Both Sexes
North Africa 28.4 28.0 27.8 21.8 22.2 22.5 49.8 49.7 49.7
Sub-Saharan Africa 59.4 58.9 59.0 10.4 10.6 10.6 30.2 30.5 30.4
Males
North Africa 27.1 26.8 26.7 24.3 24.8 25.1 48.6 48.4 48.2
Sub-Saharan Africa 59.3 58.8 59.0 12.6 12.8 12.8 28.1 28.4 28.3

33
Females
NorthAfrica 32.1 31.6 31.1 14.7 14.8 14.7 53.2 53.6 54.2
Sub-Saharan Africa 59.5 59.0 59.0 7.6 7.8 7.9 32.9 33.2 33.2
Source: Global Employment Trends, 2011, The challenge of a jobs recovery, ILO, Geneva.
94. Africa Employment ratio[?] to the population (15 years and more) is about 60.36%. According to
gender this rate is 72.72% for males and 48.35% for females. At the same time this rate among
youth (15-24 years) is respectively 50.80% for males and 38.73% for females.
95. These statistics show that Africa’s young people especially females have limited opportunities when
it comes to maximizing their social welfare, and have often become victims of social and economic
regression from previous decades.
96. According to Africa Development Indicators, 2010, women represent almost 41% of the total labour
force in Africa and men represent about 59% as indicated in the table below.
Table 3: Gender distribution of the African Labour Force from 2004-07
2004 2005 2006 2007
Labor force (15+ years), total 345190422 354884181 364361158 374653403
Labor force (15+ years), male (% of total labor force) 59.40 59.25 59.08 59.06
Labor force (15+ years), female (% of total labor force) 40.60 40.75 40.92 40.94
Source: Africa Development Indicators, 2010, World Bank
Levels of unemployment
97. The massive unemployment problem in Africa derives from the fact that our political economy is
not internally driven by the needs, aspirations and interests of our people but by external interests,
rooted in national class formations, the satisfaction of which requires a continuing dehumanization
of our people, based on the path of primitive accumulation, which is rooted in cheap labour and
extraction of resources. Not surprisingly therefore, unemployment remains a crucial problem for
African youth. For example in Sub-Saharan Africa the official figures are that about 12.3% of youth
are without job in 2010 when the general unemployment rate of the region is 8%. At the same
time, adults’ unemployment rate is 6.4%. This drastically understates the case, when
underemployment, and disguised or undocumented unemployment is taken into account.
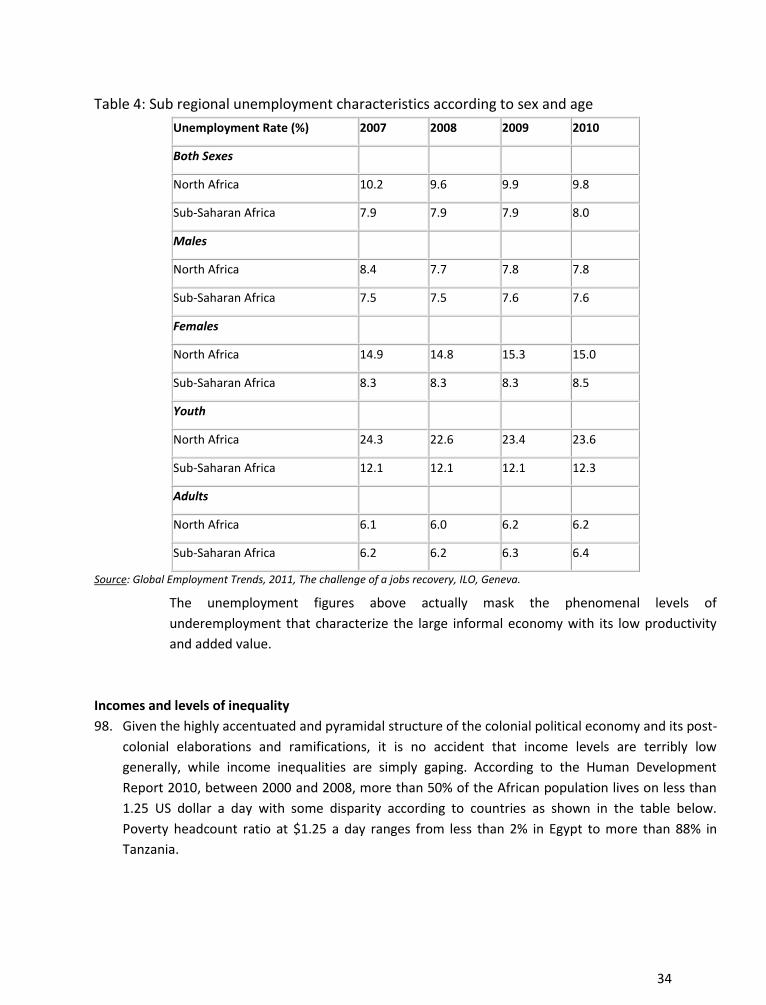
34
Table 4: Sub regional unemployment characteristics according to sex and age
Unemployment Rate (%) 2007 2008 2009 2010
Both Sexes
North Africa 10.2 9.6 9.9 9.8
Sub-Saharan Africa 7.9 7.9 7.9 8.0
Males
North Africa 8.4 7.7 7.8 7.8
Sub-Saharan Africa 7.5 7.5 7.6 7.6
Females
North Africa 14.9 14.8 15.3 15.0
Sub-Saharan Africa 8.3 8.3 8.3 8.5
Youth
North Africa 24.3 22.6 23.4 23.6
Sub-Saharan Africa 12.1 12.1 12.1 12.3
Adults
North Africa 6.1 6.0 6.2 6.2
Sub-Saharan Africa 6.2 6.2 6.3 6.4
Source: Global Employment Trends, 2011, The challenge of a jobs recovery, ILO, Geneva.
The unemployment figures above actually mask the phenomenal levels of
underemployment that characterize the large informal economy with its low productivity
and added value.
Incomes and levels of inequality
98. Given the highly accentuated and pyramidal structure of the colonial political economy and its post-
colonial elaborations and ramifications, it is no accident that income levels are terribly low
generally, while income inequalities are simply gaping. According to the Human Development
Report 2010, between 2000 and 2008, more than 50% of the African population lives on less than
1.25 US dollar a day with some disparity according to countries as shown in the table below.
Poverty headcount ratio at $1.25 a day ranges from less than 2% in Egypt to more than 88% in
Tanzania.

35
Table 5: Poverty headcount ratio at $1.25 a day (PPP) (% of population) between 2000 and 2008
N° Country PPP $ 1.25 N° Country PPP $ 1.25 N° Country PPP $ 1.25
1 Egypt < 2 19 Benin 47.3 37 Mozambique 74.7
2 Morocco 2.5 20 Guinea-Bissau 48.8 38 Rwanda 76.6
3 Tunisia 2.6 21 Mali 51.4 39 Burundi 81.3
4 Djibouti 18.4 22 Uganda 51.5 40 Liberia 83.7
5 Kenya 19.7 23 Sierra Leone 53.4 41 Tanzania 88.5
6 Cape Verde 20.6 24 Congo 54.1 42 Algeria ---
7 Mauritania 21.2 25 Angola 54.3 43 Botswana ---
8 Cote d'Ivoire 23.3 26 Burkina Faso 56.5 44 Equatorial
Guinea ---
9 South Africa 26.2 27 Congo, Dem.
Rep. 59.2 45 Libya ---
10
Sao Tome
and
Principe
28.4 28 Chad 61.9 46 Mauritius ---
11 Ghana 30.0 29
Central
African
Republic
62.4 47 Namibia ---
12 Cameroon 32.8 30 Swaziland 62.9 48 Sudan ---
13 Senegal 33.5 31 Zambia 64.3 49 Zimbabwe ---
14 Gambia 34.3 32 Nigeria 64.4 50 Gabon ---
15 Togo 38.7 33 Niger 65.9 51 Eritrea ---
16 Ethiopia 39.0 34 Madagascar 67.8 52 Seychelles ---
17 Lesotho 43.4 35 Guinea 70.1 53 Somalia ---
18 Comoros 46.1 36 Malawi 73.9
Source: Human Development Report 2010, UNDP.

36
99 . Income inequality in Africa therefore has remained stubbornly high, after more than two
decades of economic and financial reforms. What these disparities reveal, on critical
examination, are suffocating and oppressively exploitative strictures of the post-colonial
political economy in Africa. It is these strictures that account for the mass poverty and food
insecurity on the continent. This has quite clearly been exacerbated by a venal, corrupt and
visionless leadership, which cares little for the crisis of the very existence of our people. As a
measure of the income inequality in a society, the Gini coefficient with, a value of 0 expresses total
equality and a value of 1 maximal inequality. According to international standards, values of Gini
index can help assess the extent of inequality. Thus when the value is
- less than 0.21, the inequality is low,
- between 0.21and 0.29 the inequality is moderate,
- between 0.30 and0.40, the inequality is high and,
- above0.40, the inequality is extreme.
100. Figures from the Human Development Report, 2010, on the basis of the Gini Index for the
period 2000-2010, show that in general the level of income inequality in African countries has
been very high and persistent over the period. The Gini-Index ranges from 29.8[%] in Ethiopia
to74.3 in Namibia. 15 countries out of 53 are classified as high inequality countries while the
others are in the category of extreme inequality.
Table 6:Figures on Gini-coefficient for African countries for the period 2000-2010 (%)
N° Country
Gini-
I
n
d
e
x
N° Country
Gini-
Ind
ex
N° Country
Gini-
Ind
ex
1 Ethiopia 29.8 19 Sierra Leone 42.5 37 Sao Tome and
Principe 50.6
2 Burundi 33.3 20 Uganda 42.6 38 Swaziland 50.7
3 Togo 34.4 21 Ghana 42.8 39 Zambia 50.7
4 Tanzania 34.6 22 Nigeria 42.9 40 Lesotho 52.5
5 Algeria 35.3 23 Guinea 43.3 41 Liberia 52.6

37
6 Guinea-
Bissau 35.5 24
Central African
Republic 43.6 42 South Africa 57.8
7 Egypt 36.7 25 Niger 43.9 43 Angola 58.6
8 Benin 38.6 26 Congo, Dem.
Rep. 44.4 44 Botswana 61.0
9 Malawi 39.0 27 Cameroon 44.6 45 Comoros 64.3
10 Mali 39.0 28 Rwanda 46.7 46 Namibia 74.3
11 Mauritania 39.0 29 Mozambique 47.1 47 Equatorial
Guinea ---
12 Senegal 39.2 30 Madagascar 47.2 48 Libya ---
13 Burkina Faso 39.6 31 Congo 47.3 49 Mauritius ---
14 Chad 39.8 32 Gambia 47.3 50 Sudan ---
15 Djibouti 39.9 33 Kenya 47.7 51 Eritrea ---
16 Tunisia 40.8 34 Cote d'Ivoire 48.4 52 Seychelles ---
17 Morocco 40.9 35 Zimbabwe 50.1 53 Somalia ---
18 Gabon 41.5 36 Cape Verde 50.4
Source: Human Development Report 2010, UNDP.
101. Poverty is also correlated with access to finance. In general, access to finance is lower in poorer
countries than in relatively developed countries. For most African countries, the number of
deposits accounts per 1,000 adults range between 50 and 300. Some particularities remain. For
example, in Botswana, there are an average of 481.4 deposit accounts per 1,000 adults,
compared with 33.8 for Madagascar and only 6.1 for the Democratic Republic of Congo. The
figures for South Africa and Mauritius are respectively 788.1 and 2,109.9 deposit accounts per
1,000 adults.
Wages
102. According to the ILO Global Wage Report 2010 / 11
Wage earners account for about 86 per cent of the employed population in advanced economies,
but this proportion falls to about 35 per cent in Asia and to less than 30 per cent in Africa. Whereas
in advanced countries the fractions of men and women in wage employment are roughly equal, the

38
proportion of women employees in South Asia and sub-Saharan Africa is substantially less than that
of men. Altogether, we found wage data for 115 out of the 177 countries and territories in our
database, or 65 per cent of the total. However, since we have data for all the major economies, the
wage data cover 94 per cent of the world’s wage earners and approximately 98.5 per cent of the
global wage bill…However, the database covers only 29 per cent of all African countries23, although
they account for 57 per cent of the region’s total wage employment and approximately 76 per cent
of its wage bill. This highlights the fact that, although a great deal of data is available, significant
gaps remain in terms of wage statistics in many developing countries. While the most advanced
countries carry out regular establishment surveys and specific surveys on the structure of earnings,
other countries collect wage data through labour force surveys that are implemented at irregular
and unpredictable intervals. A number of low-income countries, particularly in Africa, do not collect
any wage data at all.
Cumulative wage growth, by region since 1999 (1999 = 100)
Capital flight
103. It is difficult to make precise estimates of the scale of capital flight. However, Ndikumana and Boyce
(2008) show that for a sample of 40 countries in sub-Saharan Africa during the period 1970–2004,
the real stock of flight capital, calculated in 2004 dollars and including imputed interest, stood at
23
Wage data were collected by the ILO for: Algeria, Angola, Benin, Botswana, Burkina Faso, Burundi, Cameroon, Cape Verde, Central African Republic, Chad, Comoros, Congo, Democratic Republic of the Congo, Côte d’Ivoire, Egypt, Equatorial Guinea, Eritrea, Ethiopia, Gabon, Gambia, Ghana, Guinea, Guinea-Bissau, Kenya, Lesotho, Liberia, Libyan Arab Jamahiriya, Madagascar, Malawi, Mali, Mauritania, Mauritius, Morocco, Mozambique, Namibia, Niger, Nigeria, Reunion, Rwanda, Senegal, Sierra Leone, Somalia, South Africa, Sudan, Swaziland, United Republic of Tanzania, Togo, Tunisia, Uganda, Zambia, Zimbabwe

39
$607 billion in 2004. That was $398 billion more than those countries’ combined external debt. In
other words, sub-Saharan Africa is a net creditor to the rest of the world. (Source: UNCTAD LDC Report
2009).
104. Another commentator states that according to Global Financial Integrity, between 1970 and 2008,
Africa lost $850bn to $1.8tn in ‘illicit financial outflows’, most importantly forgone tax paid by
corporations. Such a loss of capital led to the need for countries to borrow, in turn leading to a debt
crisis during which capital poured out of the continent. Today, the debt of sub-Saharan Africa still
stands at nearly $200-billion.24 Aid now accounts for $47-billion, though debt repayments still cost
$18-billion every year.
Direct Impact of the Financial Crisis on Africa
105. The global recession has affected most African countries through a variety of means, including a
decline in global trade, a drop in investment, falling remittances from overseas workers, and
possible cuts in foreign aid. These means are largely connected to Africa’s “real” economy, rather
than its financial sector. The repercussions of crisis are already affecting all economic activities,
production, export of cash crops, main sources of foreign currencies for African countries,
employment, the funding of the economy, household’ incomes, the budget situation and workers
and people’s living conditions.
106. Productive investments in energy, manufacturing, water, sanitation and agriculture have all been
affected.
The impact of the crisis in Africa may be summed up as:
- Loss of employment and income
- Increase in poverty
- Reduced migration and lower remittances
- Loss of value in African capital markets
- Loss of value of African money
107. It needs pointing out, however, that it is in the midst of this financial crisis in the West that we are
witnessing some of the most radical transformations of societies in China, India and Brazil. The
question that needs urgent answers is why is it that those countries are rapidly developing in the
midst of this financial crisis in the West, and yet in Africa, we can only bemoan and suffer the
consequences of this crisis. In our view, it is because, even though these economies are linked to
the world market and to the forces of globalization, they are driven first and foremost by internally
generated and relatively autonomous political and economic forces, with clearly envisioned
24 Nick Dearden Pambazuka 30 July 2011

40
strategic economic and political plans, crafted to answer the needs of their societies. In Africa, on
the other hand, the opposite is the case.
108. Regarding incomes, poverty and Jobs - it emerges from the analysis of the economic and social
impacts of the crisis that it has negatively affected the distribution of incomes in countries as well
as the incidence of poverty. The sectors most affected by the crisis are the agricultural, mining,
tourism, textile and manufacturing sectors. Company closures and postponement or cancellation of
projects are frequent in African countries. There are many job losses in all sectors, which have
direct negative effects on workers’ living standards.
109. Concerning gender inequality - Bearing the brunt of this crisis of the post-colonial political
economy of Africa and its worsening by the current financial crisis of the North, are African women.
Historically, women have suffered multiple disadvantages in terms of ownership of landed
property, access to credit and labour markets, and oppressive male hierarchical, patriarchal and
cultural structures of domination and subordination. In most cases, they have not had the same
opportunities as men in the world of work, if at all. And where they work, their labour, even if
critical for sustaining their families, is not recognised as independent social labour but as an
extension of the woman’s status as servant of his husband. Therefore in most regions, the gender
impact of the economic crisis in terms of unemployment rates is expected to be more detrimental
for females than for males. There is some evidence that women will be worse affected particularly
due to the effects of gender inequality and discrimination and the overwhelmingly large numbers of
women in the agricultural sector.
110. Regarding remittances by migrant - Their reduction has negative implications for poverty reduction
and safety nets. According to recent estimates, 77% of migrant remittances amounting to USD 20
billion come from the USA and Western Europe. Recent surveys have indicated that the official
remittances by African migrants fell from almost USD 1,100 million in 2008 to USD 800 million in
2009, i. e. a fall of USD 300 million (about 27%).
111. Concerning External exchanges, the financial crisis is also having a negative effect on trade for
African countries. In particular, there has been a significant decline in the prices of key commodities
exported by African countries since the second half of 2008. In South Africa, for example, exports
dropped in 2008, following the fall in the prices of precious metals, one of the country’s main
sources of wealth. In Burkina Faso, the balance of payments was negatively affected by the fall in
agricultural output and the fall in cotton fibre exports. In Botswana, the production of diamond fell
by 50% due to a 30% fall in its price in the international market. In Zambia, the 65.8% fall in the
price of coal led to a considerable fall in the reserves.

41
112. Regarding capital markets - Despite the low level of financial integration of African economies, the
financial markets have been strongly hit in the African countries where these markets exist. In
general, contagion and interdependence have greatly affected most financial markets around the
continent. From the end of July 2008 to the end of March 2009, in some African countries, the fall
in the value of the assets in the stock markets ranged from 24.8% to 62.5% including Morocco
(24.8%), South Africa (25%), Ivory Coast (38.3%), Mauritius (39%), Kenya (44.5%), Egypt (55%), and
Nigeria (62.5%). So, for some African markets such as Ivory Coast, Mauritius, Kenya, Egypt or
Nigeria, the effect has been more significant than the effect noticed in the markets of some
developed countries such as USA (31.71%), France (35.3%) and Japan (35.5%). Thus, African
investors as a whole, especially Egyptian or Nigerian investors lost on average over a period of six
months more than half of the asset they invested at the end of July 2008. This depreciation of
wealth is more considerable than the losses incurred by the American, French or Japanese
investors. The so-called capital markets in Africa are in truth for the most part poor imitations of
authentic capital markets in the west and elsewhere. For, while those markets are internally
integrated into home political economies and markets as well as worldwide, capital markets in
Africa constitute poor imitations because of the essentially dysfunctional nature of African political
economies.
113. Concerning Money markets – In most African countries, the crisis has been followed by a
depreciation of exchange rates, especially against the US dollar or euro. From the end of July 2008
to the end of March 2009, the currencies of the following countries depreciated: Morocco (10. 9%),
Tanzania (11. 8%), countries in the CFA zone (12. 6%), Tunisia (14. 2%), Botswana (16. 2%), Algeria
(16. 3%), Kenya (17. 2%),Ghana (18. 1%), Namibia (20. 6%), Nigeria (21. 2%), Uganda (22. 1%),
Zambia (36.2), DRC (38. 7%), Sierra Leone, South Africa (21. 8%), Seychelles (50.9%). However,
during the same period, the euro depreciated by 10% only, while the yen appreciated by 10%. In
general, the depreciation of most of these currencies was said to be due to the impact of the
financial crisis on the prices of raw materials and foreign exchange reserves.
114. Africa Economic growth is down - While it is true to say that prior to the crisis, economic growth
rates in Africa were among the highest in the world, this says nothing about the nature and
character of growth. According to the International Monetary Fund (IMF) and African Development
Bank (ADB) forecasts, the continent’s growth rate fell from 5.4% in 2008 to 3.3% in 2009.
Provisional projections from ADB indicate a 3.7% loss in growth for petrol exporting countries in
2009 and 1% loss in growth for petrol importing countries. For the first time since 2000, the petrol
importing countries’ growth rates should be higher (3.4%) than those of petrol exporting countries
(2.9%). A few examples: South Africa, Angola, Kenya, DRC, 1.8%, 6.3%, 2.1% and 1.7% of growth
rates expected in 2009 compared to 5.1%, 21%, 6.3% and 6.5% growth rates recorded respectively
by these countries in 2007. These figures are naturally disturbing. What is to be noted however is
that the relatively high growth rates Africa recorded in the mid-2000s were growth rates that were
42
neither sustainable nor rooted in a process of transformation of the debilitating post-colonial
political economies of African states. Rather, these growth rates were temporary and simply acted
to stabilise the post-colonial economies while reproducing the very strictures and relations of these
economies that guarantee that Africa and her people remain the poorest, most vulnerable and
underdeveloped continent in the world. It is therefore not surprising that the first external shocks
were enough to wipe out the apparent gains made in the early to mid-2000s. This once again raises
the need for a strategic vision of transformation of Africa’s political economies and societies and
their integration.
Social development indices – education and health,
Education
115. Human capital is a major factor in determining the opportunities available to individuals in society
and is closely linked to the productive capacity of households and their economic and social well-
being. An indication of the gravity of the situation is illustrated by the following figures on literacy
on the continent. Adult literacy rate is said to be about 63% for the whole Africa with 29% for
Burkina Faso and Niger, 66% for Ghana and 89% for South Africa. Education is the most important
factor in the social and economic development of a country. Education in Africa, however, is
extremely elitist and has little relevance to the development challenges facing the continent. While
science and technology and their mastery and appropriation to our needs are critical for Africa’s
development, the school system in Africa tends to relegate them to secondary roles and where they
are the subject of education they are taught in a particularly bookish and formal manner. Little
attention is paid to the world of work and industry and the challenges arising from them as a guide
to technical education. Technical education itself, if any, is given second place as against the liberal
arts, which were the main focus of colonial education. Thus, that dialectic of difference and
complementarity between the liberal arts and science and technology that propels social and
economic development have been crucially absent in the system of education in Africa. Further,
the colonial school system as the main vehicle of education was instituted with English, French or
Portuguese as the principal medium of instruction, with the result that European languages have
become the media by which African have become modernized and through which they engage with
peoples of other cultures. In the result, our schools, polytechnics and universities continue to churn
out products who are considerably alienated from their cultural heritage and who, in large
measure, lack the creativity and productive skills needed in the world of work and society at large.
116. Thus, quite apart from the political and economic strictures that the post-colonial political economy
places on our efforts at development, this retrogressive school system is a key aspect of the morass
of African societies and indeed ensures the reproduction of the very structures of
underdevelopment that education properly envisioned can and must overcome for the forward
march of our people.
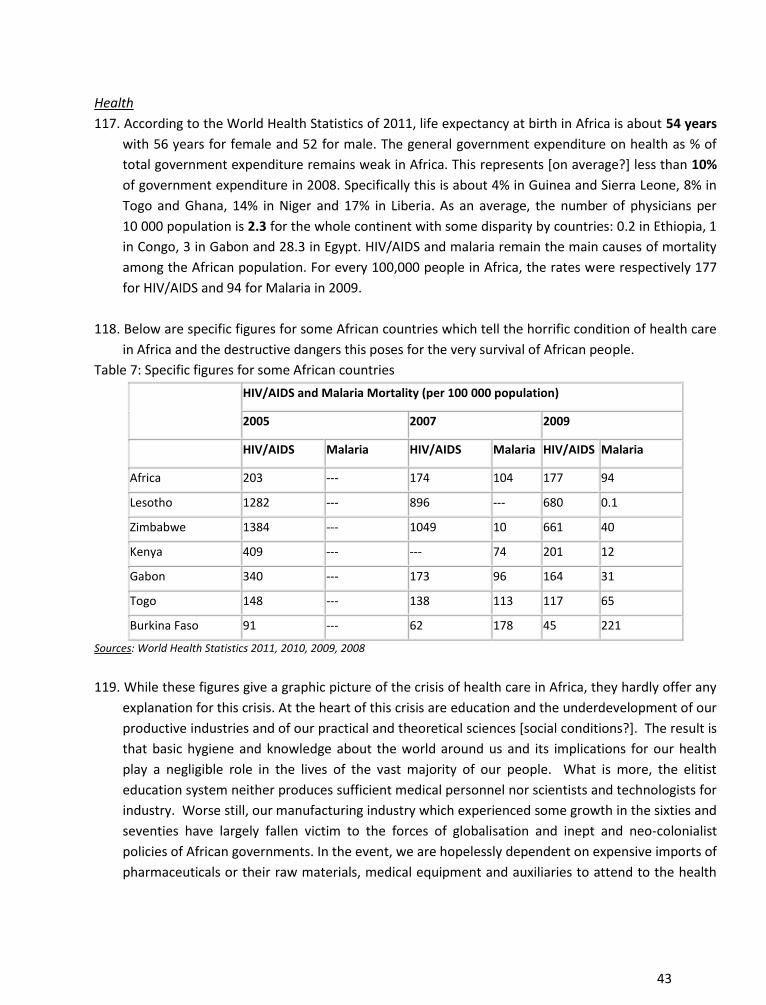
43
Health
117. According to the World Health Statistics of 2011, life expectancy at birth in Africa is about 54 years
with 56 years for female and 52 for male. The general government expenditure on health as % of
total government expenditure remains weak in Africa. This represents [on average?] less than 10%
of government expenditure in 2008. Specifically this is about 4% in Guinea and Sierra Leone, 8% in
Togo and Ghana, 14% in Niger and 17% in Liberia. As an average, the number of physicians per
10 000 population is 2.3 for the whole continent with some disparity by countries: 0.2 in Ethiopia, 1
in Congo, 3 in Gabon and 28.3 in Egypt. HIV/AIDS and malaria remain the main causes of mortality
among the African population. For every 100,000 people in Africa, the rates were respectively 177
for HIV/AIDS and 94 for Malaria in 2009.
118. Below are specific figures for some African countries which tell the horrific condition of health care
in Africa and the destructive dangers this poses for the very survival of African people.
Table 7: Specific figures for some African countries
HIV/AIDS and Malaria Mortality (per 100 000 population)
2005 2007 2009
HIV/AIDS Malaria HIV/AIDS Malaria HIV/AIDS Malaria
Africa 203 --- 174 104 177 94
Lesotho 1282 --- 896 --- 680 0.1
Zimbabwe 1384 --- 1049 10 661 40
Kenya 409 --- --- 74 201 12
Gabon 340 --- 173 96 164 31
Togo 148 --- 138 113 117 65
Burkina Faso 91 --- 62 178 45 221
Sources: World Health Statistics 2011, 2010, 2009, 2008
119. While these figures give a graphic picture of the crisis of health care in Africa, they hardly offer any
explanation for this crisis. At the heart of this crisis are education and the underdevelopment of our
productive industries and of our practical and theoretical sciences [social conditions?]. The result is
that basic hygiene and knowledge about the world around us and its implications for our health
play a negligible role in the lives of the vast majority of our people. What is more, the elitist
education system neither produces sufficient medical personnel nor scientists and technologists for
industry. Worse still, our manufacturing industry which experienced some growth in the sixties and
seventies have largely fallen victim to the forces of globalisation and inept and neo-colonialist
policies of African governments. In the event, we are hopelessly dependent on expensive imports of
pharmaceuticals or their raw materials, medical equipment and auxiliaries to attend to the health

44
needs of an ever-increasing population, the majority of whom are trapped in the throes of poverty,
ignorance and disease.
120. Yet, so long as our governments and weak middle classes continue to pursue the policies of
economic orthodoxy prescribed by the Bretton Woods institutions and within the constricting
frame of globalisation, the historical logic of the future is bound to be a descent into even more
horrifying calamities, as demonstrated by today’s dehumanizing pictures of dying Africans in the
horn of Africa and the helplessness of the African Union (AU) and African governments in the face
of this human tragedy.
Politics and Governance
121. Overall, the first four decades of post independence Africa became marked by tyrannical and
authoritarian regimes that employed repression to contain their contradictions, with the result that
the majority of African states were characterized by political instability, one-party states, military
adventurism, ethnic conflicts, border disputes or conflicts that together with unchanged economic
structures contributed to the deteriorating social conditions for the majority of the peoples. In
southern Africa, the intransigence of settler regimes in Zimbabwe and Namibia and the
entrenchment of Apartheid in South Africa contributed to a delay in the achievement of
independence and provoked a protracted struggle for liberation including the application of armed
struggle. Brutal Portuguese colonialism had also spurred armed struggle in Mozambique, Angola
and Guinea Bissau. Noteworthy, are also the brutal tactics used against African liberation in the
past five decades by the assassination and destruction (often with the involvement of external
forces) of some of the strongest and most credible political leaders and intellectuals including
Patrice Lumumba, Amilcar Cabral, Eduardo Mondlane, Steve Biko, Samora Machel, Chris Hani, Dele
Giwa, Norbert Zongo, Ken Sarowiwa, and others.
122. Having passed through a chequered political-economic existence since independence, there still
exist many obstacles with the political, economic, social and legal governance which are presented
in the form of: absence of democracy, lack of free and fair elections, lack of transparency in the
management of the public services, dys-functioning public institutions, corruption, embezzlement
of funds, impunity. According to the Economic Commission for Africa’s report on Africa
Governance, the political governance of the continent remains weak. Even though in the last two
decades democratization has made great strides in Africa it continues to retain huge deficits. The
multi-party system flourishes, but with poor institutionalisation; opposition parties are still muzzled
in many African countries with unequal access to electoral resources; elections are more regular
now (54 elections in 2005-2007), but badly flawed in some countries; in many countries electoral
commissions lack the requisite autonomy and resources; social inclusiveness remains a daunting
challenge with the limited participation of women, youth, peasant majorities and minorities;

45
respect for constitutionalism remains a major challenge in Africa as constitutions are amended and
tenure of regimes elongated against popular wishes.
123. Concerning economic governance and public financial management, some improvements are
noted. But these improvements have not delivered any radical changes for the simple reason that
they were achieved within the political-economic paradigm that will not permit changes with far-
reaching consequences for transformation and development of our societies. On the other hand,
corruption continues to undermine socio-economic growth and development. Public and
governmental institutions have generally become infected with the canker of corruption.
Demands of an awakened Africa
124. Few can dispute the need for an awakened Africa, an Africa that can hold its own in the community
of nations and co-exist with the rest of the world in dignity, equality and genuine interdependence.
There are clearly a range of conditions to fulfil in order to achieve change and to consolidate the
foundations towards genuine progress for the African peoples. Elements of a change platform
include instituting democratic rights, norms and values, and getting governance right for the African
people through the consolidation of democratic institutions and processes for decision making that
are inclusive, deliberative and authoritative. These are to be reinforced by the reconstruction of
public, private and non-state institutions that are responsible, rational, efficient, innovative, and
customer-service oriented. These institutions should be consolidated within the framework of
achieving African integration and creating the African nation.
125. At the foundation of all this, as we have noted, is the central question of leadership, in particular,
political leadership. Instead of the rulers who see their historical mission as simply managing the
post-colonial economy and relying on not only the aid of donors but also their ideas about
development, what Africa needs is a radically new leadership that is uncompromisingly committed
to the welfare and interests of our people and is guided in all its policies and actions by the
interests of African people, especially its working people. Such leadership, must, like elsewhere,
harness the African state structures in the service of transforming the political economies of African
countries and pushing towards integration. This is the road to African emancipation.
126. The African Union must be reengineered. African states have largely performed in international
relations as individual sovereign states often with grave questions over their ability to be actually
sovereign. Originally through the Organisation of African Unity (OAU) and more recently through
the African Union (AU) as well as sub-regional economic groupings, they have sought to act as a
collective in international relations and have demonstrated potential strength in trade, economic
relations and security. The AU and other structures have, however, been short and limited on
implementation of their own agreements and decisions. The AU and sub-regional structures have
failed woefully to implement their own decisions and protocols on popular participation, on

46
democracy and elections, on customs unions, free movement of goods, services and people. The
AU and sub-regional groupings have also been limited in acting directly to safeguard the interests of
the people. It is rare to hear about the AU or any of its structures mobilizing support to address any
challenge facing a particular African country, whether in terms of famine, drought or any natural
disaster. Further, when it comes to rights violations, it is common to find the AU and its sub
regional groupings supporting African regimes which infringe their own people’s rights and
brutalize them. An AU and sub regional structures that take the lead in identifying and addressing
the needs of the African people and not necessarily governments, are essential for bringing the AU
closer to the people.
African Trade unions and international engagement
127. For those who recognise the trade union movement and the mass democratic movement as the
last frontier of resistance for the African people, the African trade union movement remains an
important terrain of contestation and struggle. The trade union movement needs to be harnessed
to grow the power of the working class and enhance the value of mass democratic action. This
requires deepening democracy in the union movement also as a basis of struggle for a new order
and for the movement to link up with the entire mass democratic movement in carrying forward
the struggle for emancipation.
128. Organised labour is probably the main non-state movement internationally which has the degree of
organisation, experience, capacity and cohesion to drive a global alternative to neo-liberalism,
together with its allies in civil society. We are talking here of genuine, democratically controlled,
and independent worker organisations. Nevertheless the labour movement is not homogenous.
There are issues on which the labour movement differs, particularly between North and South (but
there are also progressive and conservative unions in both regions). However there are more issues
on which it agrees. Further the assault on labour in the North is likely to radicalise the labour
movement, and close these gaps further. If the international labour movement is able to agree on a
programme, it will constitute a formidable force, together with its allies and progressive
governments.
129. At the level of engagements in the global South, labour needs to decide which formations and
institutions to prioritise, and the nature of its engagement. If and when we decide to engage with
the G20, BRICS, the multilateral financial institutions, WTO, COP17 etc, it needs to be on the basis
of a coherent, mutually agreed platform and agenda for engagement, rather than a presence
attached to national governments, which tends to fragment into different interests. This implies the
need for a clear set of proposals and demands for each of these fora and institutions, which can be
placed collectively by a progressive caucus of the international labour movement, initially from the
South, and hopefully ultimately from a truly global perspective.
47
The state of the African trade union movement
Regional
130. The most significant feature of African regional trade union organizing is the existence of two
regional organizations, namely, African Regional Organization of the International Trade Union
Confederation (ITUC Africa) and the Organization of African Trade Union Unity (OATUU).
ITUC-Africa
131. ITUC Africa is the product of the unification of the African Regional Organization of the
International Confederation of Free Trade Unions (ICFTU-AFRO) and the Democratic Organization of
African Workers’ Trade Unions (DOAWTU), both of which were regional organizations of the
International Confederation of Free Trade Unions (ICFTU) and World Confederation of Labour
(WCL) respectively, in the era past. ITUC-Africa was founded by 86 national trade union centres
with a total paid-up membership of 8,891,928 drawn from the affiliates of the erstwhile ICFTU-
AFRO and DOAWTU and three independent national trade union centres within the African region,
which were already affiliated to ITUC. The total potential membership derived from the African
affiliates of the ITUC as a whole number 97 affiliates in 50 African countries with membership of
12,315,624.
132. In the post-war period and several decades after, divisions based on ideology and politics were an
essential feature of the international trade union movement. The divisions also played out in the
regions of Africa, South America and Asia. From the 1950s through the 1960s and 1970s the main
protagonists were the International Confederation of Free Trade Unions ICFTU and World
Federation of Trade Unions (WFTU), with the WCL also assuming some prominence in the 1980s
and 1990s and impacting on regional organization. The end of the Cold War at the end of the 1980s
and the collapse of the Soviet-led socialist bloc as well as the resurgence of capitalism and the
further globalization of the international economic system resulted also in the renewal of the
international trade union movement, with less adherence to divisions along ideological lines as the
basis for the formation of different blocs, with more focus on shared interests and values by
workers, and understanding of the changing international political economy as basis for common
international action and solidarity.
133. At the beginning of the new millennium and with the onslaught of modern globalization it became
obvious that world capitalism through its private institutions, multinational companies, and public
multilateral institutions like the World Bank, International Monetary Fund and World Trade
Organization had finally brought all countries (not necessarily peoples) under its ambit. The rise and
consolidation of neo-liberalism since the 1980s sharpened the contradictions between capital and
labour in the industrialized countries and also worsened the crises of the non-industrialized

48
countries on the periphery of world capitalism. Overall, the trends in the global political economy
contributed to dissolve some of the differences among the working classes of the world, leading to
greater cooperation within the international trade union movement. This trend culminated in the
unification of ICFTU and WCL into ITUC, bringing together 176 million workers from 312 affiliates in
155 countries and territories, throughout the globe. The WFTU remained a minority with its
affiliates concentrated in parts of the Middle East, Africa and South America, claiming a
membership of about 80 million. Unification of ICFTU and WCL extended to the regions, with AFRO
and DOAWTU coming together to form ITUC-Africa. With the defining values of independence,
democracy and representativeness those who fall short within its ranks aim to move towards the
ideal or are encouraged to do so. These values raise the challenge of how to begin to engage with
the WFTU to explore the possibilities of moving towards a single united international trade union
movement.
134. ICFTU-AFRO was originally formed in 1957. It went through various struggles and challenges of
existence and operation as an independent and democratic organ of African workers organization
and struggle directly linked with the international trade union movement. The affiliates of ICFTU-
AFRO fell from 20 in 1960 to 8 in 1977. It was re-launched again in 1992 with a secretariat
established in Nairobi, Kenya. By 2007 when it merged with DOAWTU it had 61 affiliates in 41
African countries with 7,570,576 dues paying members. The other organization which merged with
ICFTU-AFRO to become ITUC-Africa, the Democratic Organisation of Workers Trade Unions
(DOAWTU) was also formed in 1993 as a regional organization of the World Confederation of
Labour (WCL) and brought into the merger 35 affiliates from 25 African countries numbering
1,262,623 dues paying members. All members of the ITUC in Africa qualify to become members of
the regional organisation but they have to apply and be subject to procedure. As an integral part of
the international organization ITUC- Africa is subject to its statute and overall policies. There is,
however, clear space within the international for regional policy development, advocacy and action.
The utilization of this space is largely related to capacity on the part of the regional trade union
movement.
135. ITUC Africa’s stated mission is to strengthen the trade unions in Africa and provide a common voice
for all African workers to realize a healthy and safe working environment and a decent life for all by
fighting all forms of exploitation and discrimination. The organisation developed a strategic plan
around four main pillars, namely, defending and promoting human and trade union rights,
strengthening organizing, promoting equality and social protection, promoting economic and social
policy intervention. ITUC-Africa implements a range of activities and projects around the above
themes that express the organization’s commitment to address the challenges facing African
workers. These include raising awareness about human and trade union rights and developing
networks of solidarity around issues thereof; supporting organising campaigns as well as promoting
women and youth participation in unions; strengthening capacity for economic and social policy

49
intervention; promoting social protection and social economy; promoting equality; promoting
education and advocacy on occupational safety and health, environment, climate change and HIV
and AIDS.
136. ITUC-Africa leads African representation within international trade union delegation to the
multilateral agencies, G20, and also to UN High level consultations and meetings including to the
UNFCCC. ITUC-Africa also represents African workers within the workers’ group of the ILO as well as
at the AU Labour and Social Affairs Commission.
OATUU
137. The Organisation of African Trade Union Unity (OATUU) was established in 1973 under the auspices
of the Organisation of African Unity (OAU) to provide an independent voice for African workers.
Prior to this, in the early 1960s, the African trade union movement had gone through several
motions of defining its identity. Initially torn between two groups whose differences mirrored the
differences between newly independent African states, they were grouped into the ‘radicals’ and
‘conservatives’. The ‘radicals’ canvassed non- affiliation of African trade unions to international
trade union organisation as a variant of the policy of ‘non alignment’ by a number of African states
and went on to form the All Africa Trade Union Federation (AATUF). The ‘conservatives’ on the
other hand considered that African trade unions should freely associate with international trade
union organisations of their choice and went on to form the African Trade Union Confederation
(ATUC). The cold war differences in the international trade union movement in the 1960s and 1970s
through to the 80s that were reflected in the African region undermined the unity of the emergent
African trade union movement. OATUU was founded to provide a framework for unity for all
African workers regardless of ideology or political inclination and affiliation. OATUU had its heyday
in the 1970s and 80s when the cold war raged fiercely. This was when OATUU maintained a
provision in its statute that barred its member organizations from joining other international trade
union organization.
138. OATUU has 62 national affiliated organizations in fifty three African countries and claims a
membership of 20 million. Sponsored by the OAU, OATUU gained early recognition in the structures
and has signified the presence of African workers in the AU Labour and Social Affairs Commission
(AULSAC) and other forums of the African Union including more recently, ECOSOC. OATUU has also
enjoyed recognition at the ILO since the early 1990s as representative of African workers. It
maintains a range of relations with the World Federation of Trade Unions (WFTU), Confederation of
Arab Trade Unions (ICATU),the All China Federation of Trade Unions (ACFTU), as well as LO-TCO of
Sweden and LO-NORWAY and implements projects on education and conflict prevention and
resolution, OSH and HIV and AIDS, as well as a range of activities on a number of trade union issues
including social dialogue, decent work and employment, social protection and the global financial
and economic crises.

50
Dynamics of the African trade union movement
139. At the end of the cold war in the beginning of the 1990s the international trade union movement
itself underwent regeneration and renewal which made it more open and accessible to African
trade unions. In the meantime, during the 1980s and 90s most African trade unions went through
their own metamorphosis from single national trade union centres linked to one-party states or
controlled by governments to independent unions struggling to become democratic and capable
representatives of working families. In the process, pluralism was introduced and union splinters
occurred, in some cases leading to fragmentation of unions that was not necessarily driven by
workers’ interests.
140. From the beginning of the 1990s the majority of African trade union national centres which were
already affiliates of OATUU also joined or renewed their membership of a re-launched ICFTU –
AFRO. Then in 1993, the WCL managed to launch its own regional organization, DOAWTU in Africa.
As part of the renewal of the international trade union movement in the first decade of the new
century and millennium, ICFTU-AFRO and DOAWTU merged in 2007 to become the present day
ITUC-Africa.
141. As a regional organization, ITUC-Africa, like its counterparts in the Americas and Asia-Pacific, relies
on the regional allocation from the international as core funding for the operation of its secretariat.
Limited subscriptions from members (about 10% of its total income) and grants/donations are the
other sources of funding for the activities of ITUC-Africa. OATUU relies for its core funding on
subventions from some African governments, limited subscription from affiliates, generous back up
from a limited number of affiliates as well as grants from solidarity support organisations and
others. Both organisations share support from the ILO, JILAF, LO-TCO and LO-Norway for projects,
while ITUC-Africa implements a range of projects with support from FNV, SASK, TUC (UK), FES, LO-
FTF, CLC, CCOO, USO, CSC, ELA, CFDT, CISL, CGIL, CGT, FTQ, ACILS UNEP and Sustainlabour, with
OATUU implementing other projects with the support of the ACFTU.
142. Both regional organisations are to different degrees financially weak in reflection of the financial
weakness of the majority of their affiliates deriving from their relatively low levels of union
membership/density and the growth of a dependency mentality and syndrome among many. This
limits the possibilities for independent planning and execution by both organisations. For one thing,
projects that are predominantly funded from external sources do not offer great hopes for
sustainability.
143. Both organisations are engaged in relatively weak and disparate representation in AU structures
and in canvassing the interests of African workers where it matters most. Their work is

51
uncoordinated and the African regional trade union level is marked by the absence of a strong
centre to champion campaigns and advocate strongly for African workers.
144. There is a great overlap in affiliates between the two organizations. They share 50 affiliates from 45
countries. In addition, ITUC-Africa has 38 other affiliates who are not members of OATUU while
OATUU has 12 affiliates who are not members of ITUC-Africa. These facts about membership raise
the question about why two instead of a single organisation.
National trade union organizations
145. Africa features a wide range of national trade union organizations marked by differences in size,
strength, ideological and political orientation, internal democratic structures and practices,
independence, representativeness and effectiveness or not as champions of the rights and interests
of workers. A limited number of national unions are strong, internally democratic, fully engaged
with supporting their affiliates in sector and workplace struggles and also engaged with politics and
policy issues through a variety of means at national and international levels. The unions that fall
into this category have varying degrees of financial independence. While they rely on membership
subscriptions for their core funding, the tendency to depend considerably on external sources of
funding to implement a wide range of projects covering education and training, research and policy
development, HIV and AIDS, is heavy. There are also those unions who would fall into this category
but whose financial independence is compromised by their political and socio-economic crises
circumstances that make it impossible for them to rely on internal subscriptions for their core
funding and who thereby depend heavily on international solidarity for their very existence.
146. There are also a host of national centres that are well established and derive their strength from
being attached to or patronized by ruling parties and governments. The independence and
democracy credentials of such unions are questionable. Also in question is how such unions truly
represent the aspirations of the workers they claim to represent.
147. Then there also exists a number of national trade unions which are newly independent and strive to
be democratic but who have limited means. Many such unions are also heavily dependent on
external funding for virtually all or a significant part of their activities. To add to these unions are
also many others who are very small, one among many trade union centres covering a relatively
small labour force in individual countries, and who are able to survive as organizations only because
of their external links or links with governments.
148. The overall picture is that of few independent, democratic, strong and viable national trade unions
and a plethora of weak, dependent, unrepresentative and struggling national union centres. Even
the strong trade unions are marked, though to varying extent and degrees, by deficit in the
representation and participation of women and youth in their internal lives. Further, overall

52
coverage of workers by collective bargaining and national social protection as well as their
representation within structures of social dialogue, given the relatively low density of trade union
organization in Africa, is low, weak and ineffective. And by far the overall majority of African
workers are unprotected. Not all the unionized workers adding up to less than 6% or so of the
labour force in Africa are covered by collective bargaining.
149. A related point, is the importance of the movement, addressing the culture , language, and
concerns of the youth, in a way they can relate to. An old leadership, who do not understand these
dynamics, will increasingly be seen to be out of touch with the youth.
150. Therefore, a key issue, is that all the policies and programmes of the movement, just as they give
priority to addressing the needs of workers, women and rural people, need to ensure a special
focus on youth, not just in rhetoric, but in concrete terms which impact on the lives of young
people. Young people need to have hope that if they work hard, they can get a decent education,
training, decent work, housing etc. The alternative is hopelessness, alienation, and revolt. This will
breed the conditions for a politics of desperation, outside of the control of the organised working
class, which makes unemployed youth available for all manner of demagogic and dangerous
agendas.
Trade unions and politics
151. The reality is that no serious union Federation in the world is able to completely withdraw itself
from politics. The main debate is about whether the Federation should be aligned or ‘non-aligned’
to a political party. The position of non-alignment tends to be linked to a lobbying posture, where
the unions engages as an interest group. This broadly describes the approach which FEDUSA has
taken in South Africa, or the Ghana Trade Union Congress, which entrenches non-alignment in its
constitution.
152. The experience of trade union initiatives in Africa to launch political parties has been a mixed one:
In Nigeria the Nigeria Labour Congress has unsuccessfully tried to build a Nigerian Labour Party,
which has failed to make an impact on the political scene. The Zimbabwean experience is well
known to us, with the ZCTU playing a key role in successfully building a mass opposition party, the
MDC which is now in government, and has the majority in Parliament. The questions which arise
are more around the policies and programme of the MDC, and why the labour movement has not
stamped a working class imprint in this regard?
153. This question is more dramatically raised by the experience of Zambia, where the unions played an
important role in the formation of the Movement for Multiparty Democracy in 1990. As with MDC,
the leader of the MMD, Frederick Chiluba (may his soul rest in peace) was drawn from the Labour
movement, but, having won the Presidential elections, he proved to be both corrupt, and no friend

53
of the working class. In both the Zimbabwe and Zambian cases, it seems that the labour
movements, having successfully formed powerful political parties, stepped back, and allowed these
parties to take their own direction. This is a lose-lose scenario for workers, who plough resources
and political energy into a project, only to find that the vehicle they have created is unable to move
them forward.
154. The independent labour movement (Egyptian Federation of Independent Trade Unions) which has
emerged to replace the state-controlled unions in Egypt has taken the initiative to launch a left pro-
worker party to contest the elections later this year. The party, called the Democratic Workers
Party was launched on May Day this year. They advocate the re-nationalization of industry, more
genuine worker democracy, and “a complete halt to the neoliberal program”. The WDP proposes
the re-nationalization of the over 200 public companies privatised by the previous regime, but calls
on workers of these factories to appoint their own managers. The WDP stands for abolishing
privatization and monopoly policies, and redirecting development plans to benefit "underserved
social classes". The party is also coordinating with other forces to establish a higher minimum wage
for Egyptian workers, the establishment of trade unions independent of the state, and to improve
working conditions in all workplaces. They are also calling for combating administrative corruption
and re-evaluating Egypt’s economic ties to Israel25.
155. On 10 May 2011, the WDP agreed to enter into a "socialist front" with four other Egyptian leftist
groups called the Coalition of Socialist Forces. The new grouping includes the Revolutionary
Socialists, the Egyptian Communist Party, The Socialist Party of Egypt and the Popular Democratic
Alliance Party.
156. It is important that over time, the African trade union movement develops a perspective on this
question to guide it in its overarching political interventions.
Demands of Renewal and Emancipation
157. Africa is in need of emancipation. The democratic and progressive forces must intensify the
struggle against foreign domination, and domestic oppression and exploitation. Africans must
rediscover and reclaim their heritage, refashion institutions that are responsive to the needs of the
people and are effective. Africans need to develop the organisational forms that are necessary as
vehicles for advancing the interests of the people in an increasingly interdependent world.
158. The trade union movement, as a primary organisation of working people whose potential
membership constitutes the majority of the labour force, and in this case also the majority being
youth, is strategically placed to exercise enormous impact on the fortunes of Africa. The movement
must come into its own, however, to fulfil its mission to champion consistently the cause of working
25
Source: en.wikipedia.org/wiki/Workers_Democratic_Party

54
people. It has played important roles in championing the cause for better conditions of
employment for workers, and in political struggles like the anti-colonial movement, anti-apartheid
movement, and recent struggles for democratization in Africa dating from the early 1990s. The
trade union movement has also been involved in a continuing struggle to safeguard the rights to
freedom of association and to collective bargaining; to institute social dialogue in order to influence
economic and social policies; and also to extend the benefits of social protection to more workers.
159. Given the overall picture of few strong national centres as against many weak national
organisations, the trade union movement stands badly in need of renewal and reorganisation. In
view of the particularly low density and coverage of organised labour in Africa renewal of the
movement demands broad organising to cover rural workers and workers in the informal economy.
Beyond organising to achieve broad coverage and representativeness, trade union organisation
must also be characterized by internal democracy and be governed by a democratic ethos and
consciousness of its autonomy if it is to win the confidence and active participation of workers. To
carry forward as a leading force in the democratic movement the trade unions must act in ways
that ensure the optimal organisation, mobilisation, and protection of their members in the world of
work. In addition, to be fully effective, unions must develop policies that link them up with
autonomous civil society and help to establish broad democratic coalitions to promote social causes
and the fight for more accountable leadership in Africa. Again, given the often multi-ethnic and
national character of trade unions they can feature strongly in the fight against ethnocentrism and
xenophobia in the political and social life of African countries.
160. To enable it to live up to its responsibility to protect and promote the interests of workers as well
as act as a great champion of change and African emancipation, the trade unions must redeploy a
set of tools that alone can assure their effective action. These include uniting, organising,
campaigning and representing, all of which have to be developed at both regional and national
levels. Remaining the same is not an option if the trade union movement intends to become
relevant to the current needs of working people
Uniting
161. At regional level the question must be posed: is it tenable to have two regional organisations which
are more or less pursuing the same objectives; two organisations, the majority of whose
membership belong to both – 50 affiliates belong to both ITUC-Africa and OATUU, while 38
affiliates of ITUC-Africa do not belong to OATUU and 12 affiliates of OATUU do not belong to ITUC-
Africa. We can hazard a guess that the 38 ITUC-Africa affiliates who are not at the same time
affiliates of OATUU will support/not oppose a fusion of the two organisations. Will the 12 OATUU
affiliates who are not members of the ITUC support a fusion of our two organisations? If they would
not, can the majority who are interested in fusion go ahead and negotiate a platform or framework
for accommodation and relationship of a united African trade union organisation with those

55
organisations? Thus, while not allowing the interests of the minority to hinder us from aspiring to
greater heights in African regional trade union organisation, we can, nonetheless make plans to
cater for the interests of those few. At all costs, we must address the question as to whether the
interests of relatively few national trade union organisations should prevent the overwhelming
majority of Africa’s organised working people from uniting in one regional organisation. Uniting
organisationally at African regional level has positives all round. It provides African workers with a
common voice at regional and international levels and strengthens their representation. It allows
coordinated action and responses to the needs of workers as well as a more efficient and rational
use of limited resources.
162. At national level too, unity of the movement needs to be pursued, especially among those where
there is obvious fragmentation and a number of them from the same country also share common
membership of regional and international organisation. Discounting problems of ego, such common
affiliates must be able to cooperate for a start through unity in action with an eye to seeking
organisational unity eventually. With the current state of play of overall weak unions and
inadequate and weak representation of workers, trade union unity needs to be redeployed as one
of the sure means to achieving strength, independence, effectiveness and better representation of
workers. It is an objective we can pursue and achieve results provided we are fully committed.
163. We must actively promote closer working relationships between our members in Francophone and
Anglophone Africa; and ensure that we strengthen ties between unions in sub-Saharan Africa and
genuinely independent unions in North Africa, post the Arab spring.
Organising
164. At regional level, the demands of organising can be identified variously, including:
Effectively operationalizing organs like the General Council, Women’s Committee, Youth
committee and Executive Bureau;
Improving communication between the regional secretariat and affiliates;
Facilitating the exchange of information and experiences between affiliates and among them;
Building networks of solidarity and action among affiliates around a range of issues;
Supporting sub-regional trade union organisation and coordinating work with them;
Supporting organising efforts at national level.
165. In respect of organising, however, the main theatre of operation is the national level, where every
effort needs to be undertaken to bring more workers into the fold of the union, including rural
workers and those from the informal economy. Beyond recruiting more members into the union as
part of the organising effort, African trade unions also need to promote more membership
involvement in the life and decision making of the union, particularly that of women and young
workers, as well as greater accountability of leadership to union membership. Critical to the project

56
of organising is keen recognition that organisation is achieved not as a formal bureaucratic process,
but a dynamic process of struggle around concrete and burning issues of the times that impact on
the quality of life of working people. Again, promoting a democratic ethos and developing a mass
democratic consciousness is essential trade union contribution to the development of the mass
democratic movement as a whole. But this also can be achieved only through unity and struggle.
Campaigning
166. At regional level, campaigning requires more support for national struggles through activating
networks; identifying issues for regional action and providing strategic leadership on them; and
coordinating common action on agreed issues.
167. At national level, the demands for renewed campaigning call for more awareness raising and
mobilization of workers around specific issues as well as formulation and implementation of trade
union actions in a programmatic manner.
Representation
168. Representation has some important demands at regional level where it should also be looking at
the international. A number of institutions and forums have to be targeted. At the African Union
level representation has to be strengthened at the Labour and Social Affairs Commission and the
Economic, Social and Cultural Council (ECOSOCC) as well as other Councils that feed into decision
making by the Summit of African Heads of State. Other avenues for representation that have to be
secured include the African Commission on Human and People’s Rights (ACHPR) and the UN
Economic Commission for Africa (UNECA)
169. Representation at AU level must also be extended to include support for trade union
representation at the sub- regional Economic communities that operate alongside the AU.
Besides the regional and sub-regional institutions, African regional representation also has to take
on board the representation of African workers within the international trade union movement as it
canvasses and seeks workers’ interests at the ILO, UN, World Bank, IMF, WTO and lately the G20,
and also struggles for re-ordering the international political economy and changing globalization to
make it people driven and centred.
170. Finally, representation at national level would require the strengthening of bipartite and tripartite
institutions as a framework for consultation with unions and the achievement of their influence in
shaping important economic and social policies. It also means strengthening trade union oversight
over institutions of social security and getting unions to canvass for the vertical and horizontal
extension of social protection to all.

57
Conclusion
171. To recap: the current world financial and economic crisis has deep structural roots going to the heart of the
capitalist system of production and reproduction in the ‘matured’ capitalist economies. It constitutes a
concrete expression of the periodic historical structural crisis of capitalism. This crisis is underpinned by a
number of essential characteristics: (i) the growing difficulty of finding avenues for productive investment
in the ‘matured’ market economies; (ii) the increasing power and dominance of the financial sector and its
speculator activities as a means of staving off temporarily the dangers of stagnation, while not averting
them; (iii)the phenomenon of growing global inequality, reduction in the incomes of large sections of the
population, including sections of the middle class, in these economies, and mass poverty in the South, all
leading to a slump in effective demand; and (iv) ineffective policy measures at addressing these challenges
and contradictions. In the result, the most likely prognosis is that the world economy is in for a long and
deep stagnation, with far reaching consequences for the world, especially Africa and its working people.
172. While it is not possible to predict how and when this crisis would be resolved, what is certain is that the
resolution of this crisis and the new world system that is likely to emerge from it will be radically different
and will have far reaching consequences for humanity. How are Africa and our trade unions to prepare
themselves for this? This is a critical question that confronts African trade unions and the people of Africa.
173. Africa needs to produce a new and courageous leadership, informed by a strategic vision of transformation
and development and with a commitment to the interests of our people to lead us in the coming
challenging years. The trade union movement has an important role in promoting the birth of this new
leadership. We allude to this with full acknowledgement of the current challenges facing the African trade
union movement which we have alluded to already. The African trade union movement itself must unify
its ranks organisationally and programmatically, deepen internal democracy within its ranks, at the
national, sub-regional and regional levels and be imbued by an active and conscious culture of struggle in
the interests of its membership and working people as a whole. This way we shall prove equal to the
historical tasks of the epoch-making era the world and Africa are entering.
Forward to the unity of the African trade union movement!
Long Live the African trade union movement!!
Long live Africa!!!!

58
References African Development Bank (2009) Africa and the Global Economic Crisis: Strategies for Preserving the Foundations of Long-term Growth, Paper prepared for: The 2009 Annual Meetings of the African Development Bank, May 13-14 2009, Dakar, Senegal. African Development Bank (2009), FCMG Weekly Update, 16th – 20th March 2009. African Development Bank (2009), Statistics Department and Oanda Foreign Exchange Rates Online Database March 2009. African Development Bank (2011), Post-crisis prospects for China Africa relations April 2011. Bond, Patrick (2010), Is Africa Still Being Looted? Pambazuka, August 17, 2010. Burrow, Sharan, 2010. Address to DGB 2nd Congress on Capitalism, Berlin 7 October 2010. Burrow, Sharan (2011), Address to the Brookings Institution Conference on Employment, 13 April 2011. Davies (2011), Rob Interview New Agenda 2nd Quarter 2011. Dearden (2011), Nick Free trade is not what Africa needs Pambazuka 30 July 2011.
Department of Economic and Social Affairs of the United Nations Secretariat (2010), World Population Prospects: The 2010 Revision (On- line Database). ETUC and ITUC David Coates(Ed) (2011), Exiting from the Crisis, http://www.exiting. FAO, 2011. The State of Food and Agriculture 2010-11, Women in Agriculture Closing the gender gap for development. Foster, John Belany and Magdoff, Fred (2009), The Great Financial Crisis, Monthly Review Press, New York. ILO (2002), Women and men in the informal economy, Geneva. ILO (2009), The Financial and economic crisis: a decent Work response? ILO, 2010. Global Wage Report 2010/11, Wage policies in times of crisis, ILO, Geneva.
59
ILO, Global Wage Report, Africa Brief 2010/11. ILO (2011) Global Employment Trends, 2011, The challenge of a job’s recovery, ILO, Geneva. ILO (2011), Statistical update on employment in the informal economy, ILO, Department of Statistics, June 2011. IMF (2009), World Economic and Financial Surveys, Regional Economic Outlook, Sub-Saharan Africa, April 2009. Institute of Development Studies (2009), Voices from the South, The Impact of the Financial Crisis on Developing Countries. Jourdan, Paul, (2008), Strategies for resource based development, New Agenda Fourth Quarter, 2008. Masawi, Tirivangani, (2011), Pentagon Plan to muscle out China, May 2011 www.globalresearch.ca. OECD (2010), Economic diversification in Africa 2010. OECD (2011), Economic Outlook, 2011. UNDP (2010), Human Development Report 2010, The Real Wealth of Nations: Pathways to Human Development. Pons-Vignon, Nicolas (Ed) (2011), Don’t waste the crisis, ILO 2011 ilo.org. Ransom, David, (2011), New Internationalist March 2011. Roba, Anteneh, 2011. Land-Leasing and Intensive Food Production, July 05, 2011. Saul, John and Leys, Colin, (1999), “Sub Saharan Africa in global capitalism” Monthly review, July/August 1999. Sharife, Khadija,( 2011), Pollution: Africa’s real resource curse? Pambazuka 8 June 2011

60
Skinner, Caroline, (2011), Planning Education Toolkit on the Informal Economy, July 2011
www.africanplanningschools.org.za.
South Africa. Info African free trade area 'boost for BRICS' southafrica.info 15 June 2011.
Stiglitz, Joseph, (2009), The global crisis, social protection and jobs, International Labour Review Vol 148, 2009. Tandon, Yash, (2011), Challenges of the green economy for sustainable Africa Pambazuka 4 July 2011. UNCTAD (2009), Role of the state in LDC’s (Least Developed Countries). UNECA (2009), African Governance Report II, Oxford University Press. UNECA (2010), Economic Report on Africa 2010, Promoting high-level sustainable growth to reduce unemployment in Africa. UN Industrial Development organisation (2009), Industrial Development Report, 2009. Wade, Robert, (2009), From global imbalances to global reorganisations Cambridge Journal of Economics 33, 2009. World Bank (2010), African Development Indicators 2010, Silent and lethal, How quiet corruption undermines Africa’s development efforts. World Bank (2009), World Development Report, 2009. World Bank (2010), World Development Report, 2010. World Health Organisation (2008), World Health Statistics, 2008. World Health Organisation (2009), World Health Statistics, 2009. World Health Organisation (2010), World Health Statistics, 2010. World Health Organisation (2011), World Health Statistics, 2011. Wikipedia @ The United States Public Debt Wikipedia article on Africa http://en.wikipedia.org/wiki/Africa#Economy. Wikipedia article on Egyptian workers party http://en.wikipedia.org.

61
Wikipedia list of oil producing countries http://en.wikipedia.org. Zeilig ,Leo (2009), Class Struggle and Resistance in Africa.
Statistical Appendices to Second ITUC-Africa Congress theme document:
Extracts from United Nations agencies reports
Note: the statistics below are extracted from various UN agency reports. In some instances the full tables are not reproduced, and extracts are used which focus specifically on Africa. The full versions can be accessed in the various reports as listed. The Table and Chart numbers listed below reflect the original numbers in the cited reports. Relevant extracts from the UNDP 2010 Human Development report will be circulated separately.
I UNIDO Industrial Development Report, 2009
1. Table 1 Indicators of Industrial Performance p64
2. Table 2 Manufacturing value added by region p67
3. Table 3 Exports p67
4. Table 4 Components of competitive industrial performance p71
II OECD Economic Outlook 2011
5. Table 1.4 World trade and current account balances p73
III. ILO Global Wage Report, Africa Brief 2010/11
6. Figure 1 GDP growth in the world, advance economies, and Africa p74
7. Table 1 Labour productivity per region p75
8. Figure 2 Trends in labour productivity, Gdp and employment p76
9. Table 2 Sources of income data in Africa p77

62
10. Figure 4 The share of wage earners in African countries p78
11. Tables 3 and 4 Wage and salaried workers p79
12. Table 5 Wage growth by region since 1999 p80
13. Figure 5 Growth in wages in Africa p80
14. Table 6 Trade union density p81
15. Table 7 Collective bargaining coverage p81
16. Figure 9 Union membership by pay level p82
17. Figure 10 Minimum wage per month p83
IV ILO Global wage report 2010/11
18. Table SA1 Growth of real average wages (Africa) p84
19. Table SA 2 Minimum wages (Africa) p85
V ILO and decent jobs, 2009
20. Figure 4 Social expenditure as a percentage of GDP p89
21. Figure 8 Fiscal package as a percentage of GDP in 2009 p87
VI Unctad Role of the state in LDC’s (Least Developed Countries), 2009
22. Table 5 Financing governance in LDC’s p88
23. Chart 11 Trends in tax components in African LDC’s p89
24. Table 8 LDC’s with high real interest rates p89
25. Chart 18 LDC food import bill p90
26. Table 9 Current account/ trade balance of LDC’s p90

63
27. Chart 15 Food and oil price trends p91
28. Table 10 Capital flight in sub Saharan Africa p92
29. Box Chart 4 Undernourished LDC population p93
30. Table 17 Trends in industrial sector composition p94
31. Table 18-21 Industrial policy tools p95
VII World Bank Development Report, 2009
32. Figure 5.1 -2 Capital flows p96
33. Box 5.1 Labour mobility in sub Saharan Africa p97
34. Table 9.1 Regional agreements and labour mobility p98
35. Box 9.2 Diversifying production through regional cooperation p99
36. Table 9.2 Unreliable infrastructure p99
37. Map G4.1 Africa’s colonial borders p100
38. Table G4.1 Distant and divided regions p101
39. Classification of economies by region and income p102
40. Table 1 Key indicators of development p104
41. Table 2 Millenium Development goals p105
42. Table 3 Economic Activity p107
43. Table 4 Trade, aid and finance p110
44. Table 5 Indicators for other economies p111

64 In constant 2000 dollars
Unido Industrial Development Report,2009 Table 1 Six indicators of industrial performance, by country, 2000 and 2005
Manufacturing value added per capita (dollars)a
Manufactured exports per capita
(dollars)
Share of manufacturing
value added in GDP (percentage)
Share of manufactured exports in total
exports (percentage)
Share of medium high technology
production in manufacturing
value added (percentage)
Share of medium high technology
export in manufactured
exports (percentage)
Country or
territory 2000 2005 2000 2005 2000 2005 2000 2005 2000 2005 2000 2005
Albania 120.4 140.5 79 193 10.2 9.4 92.0 91.2 9.3 8.0 6.5 10.4
Algeria 127.7 132.5 196 239 7.0 6.3 27.1 17.1 15.6 15.6 2.2 1.8
Argentina 1,264.4 1,372.6 376 577 16.5 17.2 52.7 55.7 30.2 25.9 35.3 32.1
Australia 2,410.4 2,422.0 1,59 2,522 11.6 10.4 47.8 48.5 28.5 23.1 36.0 30.9
Austria 4,362.9 4,786.4 6,894 13,052 18.2 18.6 86.7 91.3 36.6 37.4 57.5 57.5
Bahamas 655.6 694.9 1,449 877 4.0 4.3 78.7 71.3 27.3 27.3 55.8 50.2
Bangladesh 50.2 63.1 39 56 14.7 15.7 92.3 94.0 21.3 21.3 3.3 3.4
Barbados 500.5 469.8 975 1,217 5.3 4.6 95.1 90.8 23.6 23.6 33.1 27.1
Belgium 3,876.1 3,897.6 15,972 28,362 17.1 16.2 88.6 89.0 44.8 48.5 52.9 55.7
Benin 31.8 32.9 4 10 8.8 8.5 14.0 30.4 9.8 9.6 14.8 13.8
Bolivia 133.7 141.9 106 106 13.2 13.3 60.5 34.8 7.9 6.9 24.1 7.2
Bosnia and
Herzegovina 117.7 144.1 206 489 9.3 9.4 78.6 80.0 30.5 30.5 29.6 26.6
Botswana 146.8 146.0 1,515 2,082 4.1 3.2 96.2 97.0 21.6 21.6 4.1 5.8
Brazil 700.4 748.7 245 463 20.0 20.4 77.4 72.8 36.6 33.5 47.8 47.9
Bulgaria 245.0 382.2 458 1,177 15.7 18.5 76.6 77.6 36.1 28.5 26.7 28.4
Cambodia 44.5 75.8 107 198 16.0 19.9 98.5 97.5 0.3 0.3 1.0 0.9
Cameroon 62.2 74.8 18 39 9.3 10.3 14.8 25.9 9.7 12.2 6.1 5.1
Canada 4,207.8 4,109.9 6,883 7,944 18.1 16.2 76.4 71.2 41.9 41.2 60.8 57.0
Central African Republic
21.9 23.8 16 22 8.5 10.3 78.3 77.5 11.4 11.4 3.4 1.9
Chile 870.5 977.9 595 1,241 17.6 17.0 50.3 52.4 16.4 22.7 13.2 11.7
China 307.2 495.9 182 556 32.1 34.1 92.1 95.1 43.1 46.9 45.3 57.5
Colombia 289.8 323.4 134 241 14.6 14.9 42.6 51.0 28.2 25.6 36.8 34.6
Costa Rica 935.9 958.6 1,024 1,251 23.1 21.3 73.3 75.7 22.1 22.5 66.3 59.8
Côte d'Ivoire 142.7 116.2 105 219 21.7 19.0 48.6 54.8 15.0 15.0 10.0 36.2
Cyprus 1,037.7 1,032.9 1,238 1,814 8.9 7.9 87.6 88.9 13.8 13.6 30.4 60.7
Czech Republic 1,342.7 1,732.2 2,69 7,18 24.3 26.1 95.1 94.0 27.3 31.3 56.5 62.8
Denmark 4,182.3 3,828.5 7,009 11,779 13.9 12.0 76.0 77.4 34.6 31.2 52.1 54.9
Ecuador 174.8 205.3 91 151 13.6 13.4 23.3 20.2 8.3 11.0 15.8 18.5
Egypt 265.1 278.9 52 83 18.0 17.4 74.5 57.6 39.5 33.7 19.3 11.7
El Salvador 488.1 506.1 145 202 23.1 23.2 68.0 83.7 23.1 23.1 26.4 23.6
Eritrea 17.7 19.4 3 1 10.4 11.4 60.3 39.0 7.7 10.9 8.5 20.6
Estonia 594.0 1,083.6 2,534 4,922 14.8 17.8 90.6 85.9 17.7 16.8 46.8 47.2
Ethiopia 6.4 6.5 1 1 5.4 4.8 18.3 15.7 8.3 6.6 0.5 0.5
Fiji 259.2 274.1 463 716 12.8 12.6 80.0 86.5 7.7 7.7 1.9 5.2
Finland 5,302.8 5,938.8 8,422 11,841 22.8 23.0 95.9 95.2 43.7 47.9 54.8 57.0
France 3,211.9 3,337.3 4,563 6,495 14.3 14.2 91.0 91.0 51.1 53.0 65.3 64.7
Gabon 163.2 176.9 368 613 4.2 4.5 18.0 16.7 5.4 5.4 2.8 7.9
Georgia 100.4 140.0 57 166 17.3 16.2 82.7 85.5 20.4 15.0 30.9 38.6
Germany 4,769.9 5,179.0 5,914 10,9 20.7 21.7 88.5 92.0 61.0 61.1 72.2 71.9

65
Manufacturing value added per capita (dollars)a
Manufactured exports per capita
(dollars)
Share of manufacturing
value added in GDP (percentage)
Share of manufactured exports in total
exports (percentage)
Share of medium high technology
production in manufacturing
value added (percentage)
Share of medium high technology
export in manufactured
exports (percentage)
Country or
territory 2000 2005 2000 2005 2000 2005 2000 2005 2000 2005 2000 2005
Ghana 22.9 23.6 56 164 9.0 8.1 66.5 65.1 14.6 12.5 2.8 10.4
Greece 1,115.1 1,281.1 756 1,221 10.6 9.9 75.3 77.8 27.6 27.6 27.7 36.1
Guatemala 222.4 211.8 118 305 13.2 12.6 48.7 71.5 35.1 35.1 29.3 19.4
Honduras 156.9 172.8 73 90 17.0 17.7 43.5 50.4 10.4 10.4 16.4 20.1
Hong Kong Special
Administrative
Region of China
1,275.5 921.3 29,613 41,264 5.1 3.2 97.4 98.1 36.8 27.7 52.8 64.2
Hungary 974.9 1,251.4 2,516 5,6 20.8 21.2 91.5 90.7 41.8 45.6 73.0 75.5
Iceland 3,414.5 3,959.8 2,507 3,94 11.2 11.2 37.1 37.8 8.5 8.5 25.8 42.5
India 64.7 83.0 37 82 14.3 14.1 83.5 87.3 43.3 39.3 19.8 22.6
Indonesia 216.4 259.1 210 251 27.7 28.1 69.7 64.5 31.6 29.8 34.1 33.1
Iran (Islamic Republic of)
199.2 300.2 42 102 13.1 16.0 9.4 11.6 34.7 43.6 18.1 26.3
Ireland 7,495.5 6,589.5 18,389 24,416 29.8 21.3 91.7 92.3 57.4 62.1 57.7 57.2
Israel 2,982.4 2,637.7 4,821 5,21 15.6 13.9 96.5 84.3 48.0 47.8 50.1 38.6
Italy 3,571.9 3,379.0 4,019 5,949 18.7 17.1 95.2 93.5 40.6 40.6 52.9 53.6
Jamaica 394.9 378.8 462 544 12.7 11.7 91.5 95.4 18.0 18.0 6.4 4.3
Japan 8,129.6 8,474.1 3,598 4,387 22.2 21.7 95.2 94.2 54.2 56.9 85.2 82.0
Jordan 226.1 342.4 215 625 13.5 17.2 79.9 79.1 25.4 21.3 49.8 37.4
Kenya 42.9 46.6 20 42 10.3 10.1 38.2 52.4 21.4 19.4 14.8 11.0
Kuwait 1,160.7 1,532.9 3,739 2,869 6.9 7.8 42.2 40.4 8.3 10.0 11.6 14.1
Latvia 405.8 613.0 736 2,027 12.3 12.0 93.4 87.9 13.7 14.8 15.3 23.1
Lebanon 577.3 657.8 162 398 11.9 12.2 85.7 90.4 10.8 10.8 24.0 29.8
Lesotho 73.4 85.9 185 186 15.2 15.6 98.2 93.8 17.7 20.3 8.1 6.1
Luxembourg 4,677.2 4,495.5 15,616 24,654 10.1 8.8 91.6 88.6 9.2 3.8 42.6 38.7
Macao Special Administrative
Region of China
1,128.3 772.5 5,686 6,068 8.6 3.5 99.0 98.7 5.9 6.8 8.8 8.5
Madagascar 26.9 27.3 35 29 11.1 11.6 68.7 64.3 6.1 2.8 2.9 8.6
Malawi 17.8 17.0 7 10 11.6 10.8 20.3 26.1 23.3 23.3 18.9 18.2
Malaysia 1,280.3 1,430.3 3,815 4,753 32.6 32.2 89.3 85.5 54.9 49.8 76.4 72.1
Malta 2,006.1 1,449.1 6,203 5,769 20.2 14.9 99.2 96.0 40.2 41.6 75.4 71.7
Mauritius 774.1 770.9 1,234 1,523 20.5 17.5 98.3 94.5 7.5 5.9 4.9 21.0
Mexico 1,083.5 1,000.6 1,471 1,707 18.4 16.7 86.7 82.2 44.6 45.2 75.8 74.6
Mongolia 17.7 20.9 124 346 4.7 4.5 63.8 83.0 4.0 2.5 1.8 1.9
Morocco 201.2 219.0 198 294 17.6 16.9 76.0 79.1 24.8 25.5 23.1 27.6
Mozambique 25.3 47.8 7 69 12.0 16.2 35.2 76.4 12.0 12.0 10.4 4.6
Namibia 180.4 224.1 525 776 10.0 10.8 75.0 63.0 7.4 7.4 6.0 19.3
Nepal 20.6 18.4 21 22 8.8 7.6 72.8 87.4 10.1 15.4 12.0 9.1
Netherlands 3,365.8 3,300.7 9,625 16,666 13.8 13.3 85.1 85.0 29.6 24.1 60.5 59.0
New Zealand 2,181.4 2,313.3 1,784 2,765 15.7 14.5 51.8 52.2 26.2 26.2 27.5 29.6
Nicaragua 117.0 130.4 35 60 15.1 16.3 27.1 35.6 15.0 15.0 10.8 15.4
Niger 11.4 11.3 19 20 6.8 6.7 69.5 78.6 19.5 24.8 24.3 10.4
Nigeria 14.4 19.1 0 4 3.6 4.1 0.2 2.5 35.9 35.9 60.7 74.9
Norway 3,601.1 3,953.0 3,59 5,767 9.7 9.8 26.9 25.7 34.7 37.0 46.9 44.9
Oman 413.4 580.4 755 659 5.4 7.3 17.0 8.3 11.9 6.7 56.3 38.7
Pakistan 70.8 98.2 58 92 13.8 17.1 87.0 88.9 29.7 29.7 11.0 8.7
.
In constant 2000 dollars

66
Manufacturing value added per capita (dollars)a
Manufactured exports per capita
(dollars)
Share of manufacturing
value added in GDP (percentage)
Share of manufactured exports in total
exports (percentage)
Share of medium high technology
production in manufacturing
value added (percentage)
Share of medium high technology
export in manufactured
exports (percentage)
Country or
territory 2000 2005 2000 2005 2000 2005 2000 2005 2000 2005 2000 2005
Panama 372.7 315.9 100 67 9.5 7.2 38.3 22.4 8.9 11.1 12.2 11.0
Paraguay 199.8 185.4 54 77 15.5 14.2 33.4 26.8 13.6 11.2 5.9 13.3
Peru 296.3 346.0 145 411 14.4 14.8 54.7 67.2 17.9 17.9 5.3 3.9
Philippines 221.4 249.3 486 476 22.2 22.0 96.6 95.7 34.2 40.1 81.1 81.4
Poland 729.4 977.8 726 2,028 16.5 19.0 88.3 86.6 27.5 25.9 47.2 53.8
Portugal 1,675.4 1,660.0 2,284 3,143 14.9 14.4 95.9 87.0 25.6 23.1 43.1 43.5
Qatar 2,253.8 3,364.4 2,432 3,191 7.4 7.9 16.7 10.1 21.6 18.2 37.1 63.0
Republic of Korea 2,855.3 3,826.6 3,582 5,766 26.1 28.9 97.8 97.9 53.7 60.3 69.6 75.1
Republic of Moldova
42.8 63.2 83 221 14.2 14.9 72.9 78.4 8.1 9.0 12.9 10.3
Romania 361.4 471.6 429 1,217 21.9 21.5 92.8 95.0 23.6 29.5 26.2 33.4
Russian
Federation 349.6 470.4 271 646 19.6 19.0 38.5 38.3 31.5 21.3 33.9 27.3
Rwanda 26.5 27.3 3 2 11.3 10.0 39.9 40.6 6.7 6.7 4.8 19.6
Saint Lucia 197.1 199.0 132 284 4.3 3.9 47.4 73.0 11.6 11.6 29.9 27.9
Saudi Arabia 822.3 942.9 731 1,821 9.7 10.5 19.5 23.3 54.0 54.0 21.7 27.5
Senegal 60.5 69.0 36 88 13.0 13.2 54.0 69.7 28.2 34.3 20.9 31.3
Singapore 5,945.4 6,707.7 33,314 50,028 25.8 26.1 97.1 94.6 71.4 77.6 77.8 72.1
Slovakia 782.7 1,105.5 2,102 5,651 20.9 23.3 95.3 95.1 33.3 37.9 50.7 55.0
Slovenia 2,233.8 2,744.7 4,147 9,089 23.0 23.8 94.5 94.3 40.0 46.4 53.7 57.4
South Africa 521.1 575.9 419 703 17.3 16.3 61.0 70.2 28.3 24.2 39.8 46.8
Spain 2,399.4 2,488.1 2,467 3,879 16.8 15.1 87.6 87.3 34.7 32.3 60.4 60.3
Sri Lanka 132.2 144.1 196 236 15.1 14.2 78.5 75.0 13.8 11.8 9.3 7.8
Sudan 30.5 25.6 38 107 7.7 5.4 76.1 88.7 8.5 8.5 7.3 0.1
Swaziland 331.3 346.4 804 1,299 24.9 24.3 94.3 93.6 0.2 0.2 13.5 16.3
Sweden 5,269.6 6,461.8 9,041 13,132 19.3 21.3 92.2 91.0 50.0 44.1 64.0 60.6
Switzerland 6,483.3 6,873.7 10,697 17,094 18.9 19.0 94.3 97.1 53.9 55.2 66.2 65.0
Syrian Arab
Republic 146.7 152.5 44 87 18.0 19.3 16.0 25.8 9.7 9.7 6.4 16.4
Taiwan Province
of China 3,425.9 4,144.1 6,494 8,053 23.8 25.2 97.5 96.8 49.4 49.4 71.3 70.2
Thailand 676.7 882.2 957 1,498 33.6 36.1 85.5 87.4 34.7 37.8 59.5 61.6
The former
Yugoslav
Republic of
Macedonia
306.8 316.7 558 893 17.3 17.1 84.7 89.0 17.2 15.3 16.0 20.1
Trinidad and
Tobago 446.5 619.7 2,56 4,642 7.1 6.9 77.0 63.0 28.8 22.8 15.8 20.6
Tunisia 372.8 414.7 522 889 18.2 17.2 85.4 85.0 19.7 23.6 24.8 31.5
Turkey 395.3 464.9 361 925 13.5 13.8 88.6 90.8 30.6 27.9 31.9 40.6
Uganda 22.4 25.8 5 10 8.9 9.2 29.4 36.6 9.9 10.9 12.1 21.4
United Kingdom
of Great Britain
and Northern
Ireland
3,921.4 3,706.7 3,978 5,464 16.0 13.6 84.0 85.6 48.1 56.1 67.9 65.4
United Republic
of Tanzania 17.9 23.7 7 22 6.9 7.2 37.0 54.5 12.4 12.4 3.9 3.4
United States 5,414.0 5,528.1 2,48 2,707 15.8 15.0 89.7 88.7 57.0 55.7 74.5 72.1
Uruguay 1,044.4 1,110.3 392 500 16.9 17.8 56.3 48.6 14.1 15.7 25.2 16.7
Venezuela
(Bolivarian
Republic of)
894.1 871.4 471 201 18.5 17.7 37.0 9.6 16.9 16.9 12.2 53.8
Viet Nam 74.1 120.3 87 211 18.6 22.5 46.8 54.0 20.6 21.9 21.5 21.4
Zambia 31.6 38.1 31 47 10.2 10.3 36.7 30.5 22.4 22.4 5.6 7.3
Zimbabwe 79.3 41.1 61 72 13.6 9.6 39.8 67.5 35.8 35.8 30.0 19.4
In constant 2000 dollars

67
Table 2 Manufacturing value addeda, by region, 2000-2005 (Billions of dollars)
Region or country 2000 2001 2002 2003 2004 2005
World 5,774.3 5,674.7 5,765.9 5,979.6 6,296.1 6,536.6
Industrialized economies 4,289.8 4,158.5 4,171.1 4,257.1 4,433.1 4,535.2
Countries with economies in transition 80.1 85.8 88.1 101.7 104.4 108.9
Developing economies 1,404.4 1,430.4 1,506.7 1,620.7 1,758.6 1,892.5
Sub-Saharan Africa 39.7 40.9 42.0 41.9 43.8 45.8
excluding South Africa 16.7 17.2 17.7 18.0 18.8 19.7
South Asia
excluding India 20.1 21.4 22.3 23.7 26.2 28.8
Middle East and North Africa 110.5 112.6 119.8 127.1 137.4 145.9
excluding Turkey 83.5 87.8 92.9 98.0 105.3 111.9
Latin America and the Caribbean 378.4 371.9 367.7 374.9 402.8 415.2
excluding Mexico 271.2 268.8 265.3 273.8 297.7 308.7
East Asia and the Pacific 770.4 798.7 866.5 958.9 1,046.6 1,146.7
excluding China 385.5 380.9 406.7 430.8 471.8 502.3
Least developed countries 16.7 17.6 18.6 19.8 21.1 22.7
Source: UNIDO database .a MVA is in constant 2000 dollars.
Table 3 Total exports, primary exports and manufactured exports, by technology category and
region,2000-2005 (Billions of dollars)
Total trade
Region or country 2000 2001 2002 2003 2004 2005
World 5,985.0 5,752.2 6,034.5 7,051.0 8,531.4 9,669.7
Industrialized economies 4,020.7 3,900.7 4,054.7 4,667.0 5,531.0 6,022.0
Countries with economies in transition 161.4 158.7 172.2 218.7 299.8 379.8
Developing economies 1,799.0 1,685.4 1,799.9 2,159.0 2,693.7 3,262.8
Sub-Saharan Africa 85.7 74.8 71.4 89.4 82.5 94.3
excluding South Africa 55.5 46.8 48.4 57.7 42.3 47.3
South Asia 60.7 63.5 72.5 86.9 106.7 125.6
excluding India 15.4 19.2 20.0 23.9 26.9 22.2
Middle East and North Africa 254.6 237.7 252.2 318.7 407.5 548.3
excluding Turkey 227.1 206.4 216.5 271.5 344.4 474.9
Latin America and the Caribbean 345.6 335.2 333.4 365.5 454.7 552.5
excluding Mexico 179.4 176.8 172.8 200.6 266.7 338.3
East Asia and the Pacific 1,017.6 942.1 1,037.9 1,263.4 1,599.9 1,897.5
excluding China 768.4 676.0 712.3 825.2 1,006.5 1,135.5
Least developed countries 16.4 20.1 20.6 24.8 29.8 21.1

68
Primary exports
Region or country 2000 2001 2002 2003 2004 2005
World 1,001.5 946.1 961.4 1,173.4 1,416.6 1,734.2
Industrialized economies 511.6 493.2 489.8 591.0 708.2 780.4
Countries with economies in transition 77.3 76.1 80.2 102.2 138.2 184.2
Developing economies 411.7 372.8 387.1 476.1 569.0 768.4
Sub-Saharan Africa 51.6 39.0 35.8 46.1 31.2 32.8
excluding South Africa 39.9 31.3 30.8 37.2 19.0 18.8
South Asia 9.3 9.9 10.9 11.7 13.4 16.6
excluding India 1.8 2.5 2.6 2.9 3.1 3.4
Middle East and North Africa 170.0 150.9 159.4 205.8 256.4 373.5
excluding Turkey 166.9 147.4 156.0 201.4 251.1 366.7
Latin America and the Caribbean 98.5 91.5 96.9 113.7 152.5 194.9
excluding Mexico 76.3 73.1 77.5 89.7 122.7 156.7
East Asia and the Pacific 81.1 80.3 83.0 97.5 113.8 143.7
excluding China 61.4 60.4 61.5 71.0 80.9 106.4
Least developed countries 4.8 7.8 8.3 9.4 11.2 10.9
Total manufactured exports (billions of dollars)
Region or country 2000 2001 2002 2003 2004 2005
World 4,917.9 4,740.3 5,005.0 5,791.5 7,017.2 7,829.7
Industrialized economies 3,456.8 3,355.5 3,512.1 4,012.7 4,751.0 5,160.0
Countries with economies in transition 82.8 81.4 90.7 114.9 159.6 193.2
Developing economies 1,375.4 1,300.0 1,398.9 1,662.0 2,101.2 2,472.6
Sub-Saharan Africa 32.3 33.7 33.8 40.6 48.9 58.4
excluding South Africa 13.9 13.6 15.8 18.1 21.4 25.9
South Asia 51.3 53.5 61.5 74.6 92.8 108.4
excluding India 13.6 16.8 17.4 20.9 23.8 18.8
Middle East and North Africa 84.4 86.6 92.4 112.0 149.9 174.1
excluding Turkey 60.1 58.8 60.1 69.2 92.3 107.7
Latin America and the Caribbean 243.7 240.4 232.9 247.0 296.8 350.3
excluding Mexico 100.1 100.8 92.2 106.7 139.2 175.7
East Asia and the Pacific 930.2 855.0 947.1 1,154.1 1,472.1 1,743.8
excluding China 701.8 610.1 644.4 743.9 913.4 1,021.2
Least developed countries 10.5 11.0 10.5 13.7 16.5 9.1

69
Resource-based exports
Region or country 2000 2001 2002 2003 2004 2005
World 875.1 843.9 893.0 1,055.1 1,311.9 1,546.8
Industrialized economies 587.9 568.3 606.8 709.0 855.2 964.7
Countries with economies in transition 32.4 30.7 34.7 44.2 61.9 88.3
Developing economies 252.9 242.7 249.5 300.4 391.8 492.3
Sub-Saharan Africa 17.5 20.3 17.2 20.6 24.1 31.9
excluding South Africa 9.6 9.7 10.0 12.3 14.7 19.8
South Asia 13.0 13.5 17.0 20.5 29.2 39.7
excluding India 0.4 0.8 1.0 1.3 1.7 2.3
Middle East and North Africa 42.7 39.9 40.2 46.5 66.4 79.8
excluding Turkey 39.4 36.0 36.0 40.7 58.9 69.5
Latin America and the Caribbean 57.5 56.4 51.4 60.2 76.5 98.1
excluding Mexico 48.7 48.3 42.5 50.5 64.8 83.4
East Asia and the Pacific 109.8 101.2 110.3 137.7 178.0 223.7
excluding China 88.9 78.5 83.7 103.9 133.6 162.6
Least developed countries 2.8 3.6 3.0 4.4 5.2 7.6
Low-technology exports
Region or country 2000 2001 2002 2003 2004 2005
World 881.0 870
.6 919
.5 1,066.
0 1,27
1.3 1,39
5.2
Industrialized economies 516.0 513.6
535.3
618.7
729.3
786.3 Countries with economies in transition 21.7 21.8 24.0 30.9 41.5 44.9
Developing economies 342.7 334.4
359.3
416.1
499.3
562.6 Sub-Saharan Africa 6.2 5.5 5.9 7.1 8.6 7.6
excluding South Africa 3.1 2.7 3.0 3.2 3.7 2.7
South Asia 29.7 30.9 33.8 40.1 46.6 46.8
excluding India 12.1 14.7 15.1 18.0 20.5 15.0
Middle East and North Africa 24.0 26.0 29.5 35.2 43.2 45.6
excluding Turkey 10.8 11.6 12.9 14.4 16.8 16.7
Latin America and the Caribbean 41.9 41.1 41.2 42.1 49.5 56.4
excluding Mexico 16.3 16.6 16.0 18.1 22.7 27.7
East Asia and the Pacific 235.7 226.0 243.9 286.1 345.7 402.5
excluding China 132.1 119.8 119.0 131.0 150.0 157.8
Least developed countries 7.2 7.0 7.0 8.5 10.4 1.0

70
Medium-technology exports
(billions of dollars)
Region or country 2000 2001 2002 2003 2004 2005
World 1,920.4 1,878.8 1,996.7 2,333.9 2,827.0 3,118.0
Industrialized economies 1,529.4 1,494.0 1,577.5 1,831.2 2,166.7 2,330.4
Countries with economies in transition 22.5 23.6 24.8 31.0 46.5 52.4
Developing economies 368.1 360.8 394.0 471.6 613.0 734.3
Sub-Saharan Africa 7.4 6.9 9.7 11.7 14.1 16.2
excluding South Africa 1.1 1.1 2.5 2.2 2.1 2.5
South Asia 6.3 6.4 7.6 10.2 12.7 16.6
excluding India 1.0 1.0 1.0 1.4 1.3 1.2
Middle East and North Africa 15.3 18.4 20.6 27.3 37.0 45.4
excluding Turkey 8.7 10.1 9.9 12.3 14.9 19.7
Latin America and the Caribbean 100.0 98.6 99.8 104.7 125.6 147.0
excluding Mexico 25.0 26.4 25.0 29.7 41.8 51.9
East Asia and the Pacific 233.0 224.9 251.3 311.9 415.7 501.9
excluding China 177.5 164.6 177.3 209.8 270.7 313.3
Least developed countries 0.5 0.4 0.4 0.6 0.7 0.5
High-technology exports Region or country 2000 2001 2002 2003 2004 2005
World 1,241.5 1,147.1 1,195.9 1,336.5 1,606.8 1,769.7
Industrialized economies 4,020.7 3,900.7 4,054.7 4,667.0 5,531.0 6,022.0
Countries with economies in transition 6.2 5.2 7.2 8.7 9.6 7.5
Developing economies 411.6 362.1 396.1 473.8 597.1 683.4
Sub-Saharan Africa 1.1 1.0 1.0 1.2 2.1 2.7
excluding South Africa 0.1 0.1 0.2 0.3 0.9 1.0
South Asia 2.2 2.7 3.2 3.8 4.3 5.3
excluding India 0.1 0.2 0.3 0.3 0.4 0.3
Middle East and North Africa 2.4 2.3 2.2 3.0 3.3 3.2
excluding Turkey 1.2 1.1 1.4 1.8 1.7 1.9
Latin America and the Caribbean 44.4 44.3 40.6 40.0 45.2 48.8
excluding Mexico 10.1 9.5 8.6 8.3 9.8 12.7
East Asia and the Pacific 351.8 302.9 341.6 418.4 532.6 615.7
excluding China 303.4 247.2 264.3 299.2 359.1 387.6
Least developed countries 0.1 0.0 0.1 0.1 0.1 0.1
Source: UNIDO database. .a MVA is in constant 2000 dollars.

71
Table 4 Components of the competitive industrial performance (CIP) index, by
region, 2000-2005
Manufacturing value added (MVA) per capitaa
Region or country 2000 2001 2002 2003 2004 2005
World 967.5 939.0 942.5 965.8 1,004.9 1,031.3
Industrialized economies 4,616.8 4,453.7 4,446.2 4,517.4 4,683.4 4,771.0
Countries with economies in transition
252.8 271.6 279.6 323.5 333.0 348.6
Developing economies 297.4 298.4 309.8 328.4 351.4 372.9
Sub-Saharan Africa 61.8 62.1 62.4 60.9 62.3 63.6
excluding South Africa 28.0 28.1 28.1 27.9 28.5 29.2
South Asia 63.9 65.0 67.9 71.2 76.3 82.1
excluding India 61.7 64.3 65.6 68.3 73.8 79.6
Middle East and North Africa 330.0 330.1 344.8 359.3 381.5 398.1
excluding Turkey 313.3 323.0 335.4 346.9 365.9 381.4
Latin America and the Caribbean 745.4 721.7 703.2 706.7 748.7 761.2
excluding Mexico 663.6 647.9 630.2 641.1 687.3 703.2
East Asia and the Pacific 409.6 420.5 451.9 495.6 536.1 582.3
excluding China 613.7 598.2 630.5 659.4 713.2 750.0
Least developed countries 25.9 26.7 27.5 28.6 29.8 31.4
Manufactured exports per capital
Region or country 2000 2001 2002 2003 2004 2005
World 824.0 784.4 818.1 935.4 1,120.0 1,235.3
Industrialized economies 3,720.3 3,593.8 3,743.8 4,258.0 5,019.2 5,428.2
Countries with economies in transition
261.1 257.5 287.7 365.6 509.2 618.4
Developing economies 291.3 271.2 287.6 336.8 419.8 487.2
Sub-Saharan Africa 50.2 51.3 50.2 59.0 69.5 81.2
excluding South Africa 23.3 22.2 25.1 28.1 32.4 38.5
South Asia 38.2 39.2 44.3 52.8 64.6 74.3
excluding India 41.7 50.4 51.2 60.3 67.0 51.9
Middle East and North Africa 251.9 254.0 266.1 316.6 416.3 474.7
excluding Turkey 225.4 216.5 217.1 245.2 320.6 367.1
Latin America and the Caribbean 480.1 466.6 445.4 465.7 551.6 642.2
excluding Mexico 245.0 243.0 218.9 249.9 321.3 400.2
East Asia and the Pacific 494.5 450.1 493.9 596.4 754.1 885.6
excluding China 1,117.2 958.2 998.9 1,138.6 1,380.6 1,524.9
Least developed countries 16.4 16.7 15.5 19.8 23.3 12.6
Share of MVA in GDP (percentage)
Region or country 2000 2001 2002 2003 2004 2005
World 18.2 17.7 17.6 17.8 18.0 18.0
Industrialized economies 17.6 16.9 16.7 16.7 16.9 16.8
Countries with economies in transition
18.7 18.9 18.5 19.9 19.0 18.6
Developing economies 20.5 20.4 20.7 21.1 21.4 21.7
Sub-Saharan Africa 11.7 11.7 11.6 11.1 11.1 10.9
excluding South Africa 8.1 8.0 8.0 7.8 7.7 7.6

72
South Asia 14.2 14.1 14.4 14.3 14.4 14.5
excluding India 14.0 14.5 14.6 14.8 15.4 15.9
Middle East and North Africa 12.0 12.1 12.4 12.3 12.5 12.5
excluding Turkey 11.6 11.8 12.1 11.9 12.1 12.1
Latin America and the Caribbean 18.6 18.2 18.1 18.1 18.4 18.2
excluding Mexico 18.7 18.4 18.4 18.6 19.0 18.8
East Asia and the Pacific 27.4 27.2 27.6 28.7 29.0 29.5
excluding China 23.9 23.3 23.7 24.1 24.9 25.2
Least developed countries 9.7 9.7 9.8 9.9 9.9 10.0
Share of manufactured exports in total exports
Region or country 2000 2001 2002 2003 2004 2005
World 82.2 82.4 82.9 82.1 82.3 81.0
Industrialized economies 86.0 86.0 86.6 86.0 85.9 85.7
Countries with economies in transition
51.3 51.3 52.7 52.5 53.2 50.9
Developing economies 76.5 77.1 77.7 77.0 78.0 75.8
Sub-Saharan Africa 37.7 45.1 47.3 45.5 59.3 62.0
excluding South Africa 25.1 29.1 32.6 31.3 50.6 54.9
South Asia 84.5 84.3 84.9 85.8 87.0 86.3
excluding India 88.0 87.2 86.9 87.7 88.5 84.6
Middle East and North Africa 33.1 36.4 36.6 35.1 36.8 31.7
excluding Turkey 26.5 28.5 27.8 25.5 26.8 22.7
Latin America and the Caribbean 70.5 71.7 69.8 67.6 65.3 63.4
excluding Mexico 55.8 57.0 53.3 53.2 52.2 51.9
East Asia and the Pacific 91.4 90.8 91.2 91.3 92.0 91.9
excluding China 91.3 90.2 90.5 90.1 90.7 89.9
Least developed countries 64.2 54.7 50.8 55.2 55.3 43.1
Share of medium/high-technology production in MVA (percentage)
Region or country 2000 2001 2002 2003 2004 2005
World 54.8 53.3 55.4 61.4 70.4 74.8
Industrialized economies 54.8 54.7 56.8 63.1 71.4 75.2
Countries with economies in transition
35.8 33.6 36.3 39.1 53.8 55.1
Developing economies 55.5 50.5 52.4 58.3 68.8 74.9
Sub-Saharan Africa 21.6 19.4 25.4 30.8 37.1 41.3
excluding South Africa 7.4 7.2 15.3 14.4 16.0 17.5
South Asia 9.9 10.3 11.4 13.9 15.5 18.3
excluding India 5.2 5.8 5.6 7.1 6.3 5.2
Middle East and North Africa
16.0 18.4 19.0 23.9 29.3 33.3
excluding Turkey 11.8 12.8 12.1 14.4 15.8 19.2
Latin America and the
Caribbean 38.2 38.4 38.2 38.6 42.4 47.2
excluding Mexico 12.9 13.4 12.7 13.9 17.3 20.9
East Asia and the Pacific 75.9 66.1 68.4 76.2 90.6 97.5
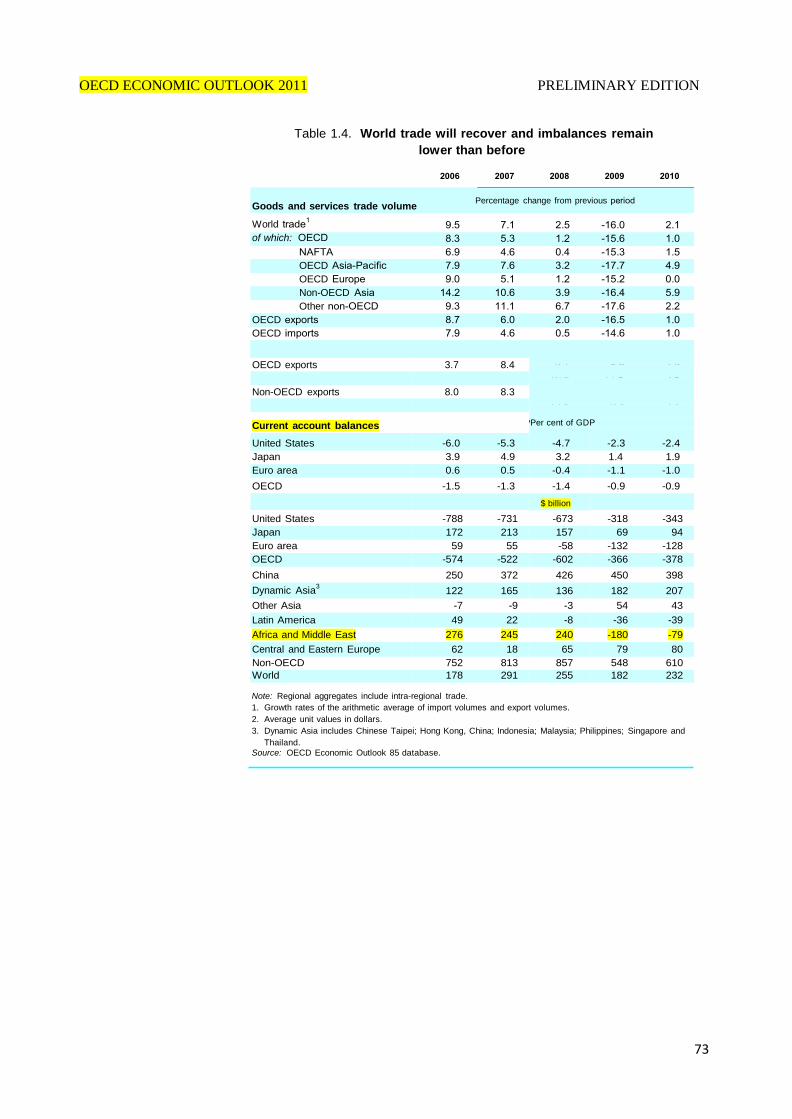
73
Goods and services trade volume Percentage change from previous
World of which:
OECD OECD Non-OECD Other
OECD OECD Trade OECD exports 3.7 8.4 9.1 OECD imports 4.8 7.9 10.8 Non-OECD exports 8.0 8.3 14.2 Non-OECD imports 4.0 7.7 12.6
OECD ECONOMIC OUTLOOK 2011 PRELIMINARY EDITION
Table 1.4. World trade will recover and imbalances remain
lower than before
PPer cent of GDP
Current account balances
United States -6.0 -5.3 -4.7 -2.3 -2.4 Japan 3.9 4.9 3.2 1.4 1.9 Euro area 0.6 0.5 -0.4 -1.1 -1.0 OECD -1.5 -1.3 -1.4 -0.9 -0.9
$ billion United States -788 -731 -673 -318 -343 Japan 172 213 157 69 94 Euro area 59 55 -58 -132 -128 OECD -574 -522 -602 -366 -378 China 250 372 426 450 398 Dynamic Asia
3 122 165 136 182 207 Other Asia -7 -9 -3 54 43 Latin America 49 22 -8 -36 -39 Africa and Middle East 276 245 240 -180 -79 Central and Eastern Europe 62 18 65 79 80 Non-OECD 752 813 857 548 610 World 178 291 255 182 232
Note: Regional aggregates include intra-regional trade.
1. Growth rates of the arithmetic average of import volumes and export volumes.
2. Average unit values in dollars.
3. Dynamic Asia includes Chinese Taipei; Hong Kong, China; Indonesia; Malaysia; Philippines; Singapore and
Thailand.
Source: OECD Economic Outlook 85 database.

74
GD
P g
row
th
ILO Global Wage Report, Africa Brief 2010/11
Figure 1 Real GDP growth in the world, advanced economies and Africa
10.0
8.0
6.0
4.0
2.0
0.0
–2.0
–4.0
World Advanced economies Middle East and North Africa Sub-Saharan Africa
Source: IMF (2010).
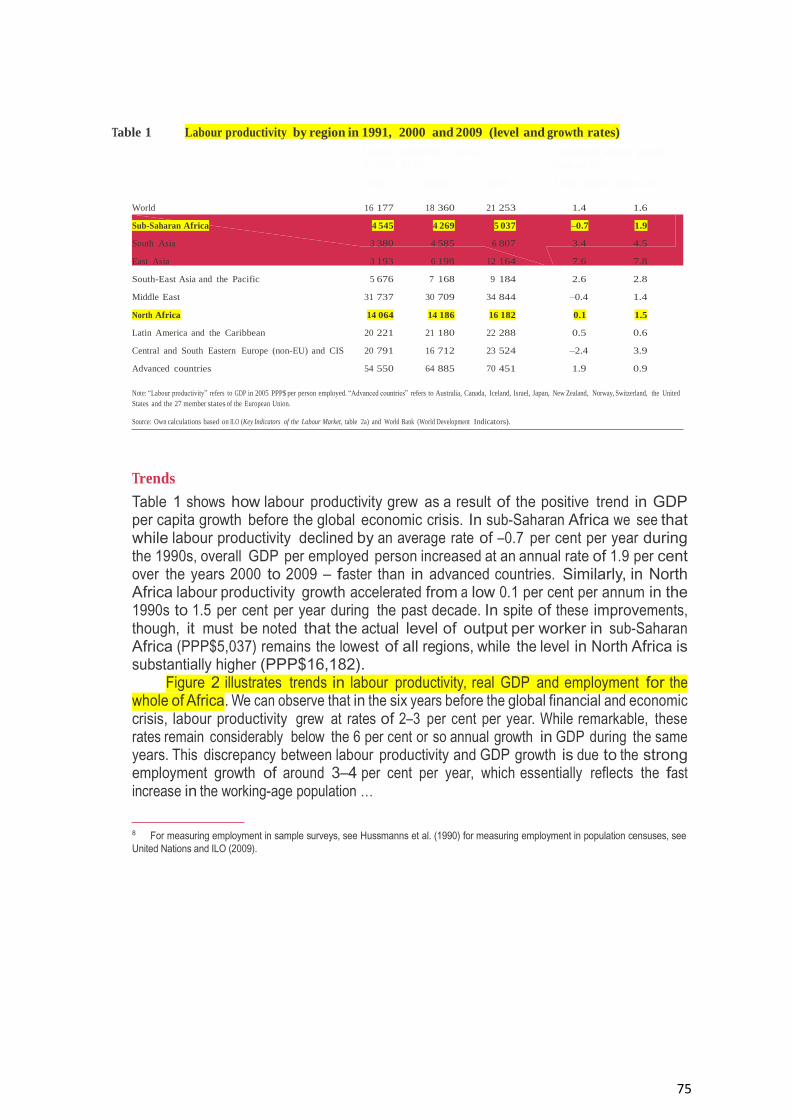
75
Table 1 Labour productivity by region in 1991, 2000 and 2009 (level and growth rates)
Labour productivity levels,
in 2005 PPP$
Compound annual growth
rate, in %
1991 2000 2009 1991–2000 2000–09
World 16 177 18 360 21 253 1.4 1.6 Sub-Saharan Africa 4 545 4 269 5 037 –0.7 1.9 South Asia 3 380 4 585 6 807 3.4 4.5 East Asia 3 193 6 198 12 164 7.6 7.8 South-East Asia and the Pacific 5 676 7 168 9 184 2.6 2.8 Middle East 31 737 30 709 34 844 –0.4 1.4 North Africa 14 064 14 186 16 182 0.1 1.5 Latin America and the Caribbean 20 221 21 180 22 288 0.5 0.6 Central and South Eastern Europe (non-EU) and CIS 20 791 16 712 23 524 –2.4 3.9 Advanced countries 54 550 64 885 70 451 1.9 0.9
Note: “Labour productivity” refers to GDP in 2005 PPP$ per person employed. “Advanced countries” refers to Australia, Canada, Iceland, Israel, Japan, New Zealand, Norway, Switzerland, the United
States and the 27 member states of the European Union.
Source: Own calculations based on ILO (Key Indicators of the Labour Market, table 2a) and World Bank (World Development Indicators).
Trends
Table 1 shows how labour productivity grew as a result of the positive trend in GDP per capita growth before the global economic crisis. In sub-Saharan Africa we see that while labour productivity declined by an average rate of –0.7 per cent per year during the 1990s, overall GDP per employed person increased at an annual rate of 1.9 per cent over the years 2000 to 2009 – faster than in advanced countries. Similarly, in North Africa labour productivity growth accelerated from a low 0.1 per cent per annum in the 1990s to 1.5 per cent per year during the past decade. In spite of these improvements, though, it must be noted that the actual level of output per worker in sub-Saharan Africa (PPP$5,037) remains the lowest of all regions, while the level in North Africa is substantially higher (PPP$16,182).
Figure 2 illustrates trends in labour productivity, real GDP and employment for the whole of Africa. We can observe that in the six years before the global financial and economic crisis, labour productivity grew at rates of 2–3 per cent per year. While remarkable, these rates remain considerably below the 6 per cent or so annual growth in GDP during the same years. This discrepancy between labour productivity and GDP growth is due to the strong employment growth of around 3–4 per cent per year, which essentially reflects the fast increase in the working-age population …
8 For measuring employment in sample surveys, see Hussmanns et al. (1990) for measuring employment in population censuses, see
United Nations and ILO (2009).

76
Gro
wth
Figure 2 Trends in labour productivity, GDP and employment
10
8
6
4
2
0
–2
–4
–6
Real GDP Employment Labour productivity

77
Table 2 Sources of employment-related income data in Africa
Country Mid 1990s
or before Mid 1990s/
early 2000 Latest Source
Household surveys
Benin - 2000/01 2007/08 Enquête ménages Botswana 1984/85 1995/96 2005/06 Labour force survey Burkina Faso - 2003 2007 Enquête emploi Cameroon - 2001 2007 Enquête ménages Burundi - - 2006/07/08 Enquête 1-2-3 Côte d’Ivoire 1998 2002 2008 Enquête niveau de vie Ethiopia - 1999/2000 2005 Labour force survey Ghana 1992 1998 2006 Household survey Liberia - - 2007 Labour force survey Madagascar - 2001 2005 Enquête ménages Malawi 1998 2004/05 2009 Household survey Mali - 2004 2007 Enquête ménages Namibia
Nigeria 1993/94
- -
2003/04 2003/2004
- Household survey
Living standard survey Rwanda - 2000/01 2005/06 Household survey Senegal 1994/95 2001/02 2005/06 Enquête ménages South Africa - 2001 2007 Labour force survey Tanzania 1990/91 2000/01 2006 Labour force survey Uganda - 2002/03 2005/06 Labour force survey Zambia 1986 2005/06 2008 Labour force survey
Establishment surveys Frequency Source
Botswana quarterly Survey of employment and employees
South Africa quarterly Quarterly employment statistics
labour force surveys or other relevant household surveys from which some information on wages and/or wage employment could be extracted.16
Trends in the share of wage earners
Has the proportion of wage earners increased in Africa over the past 10 to 15 years? Based on a sample of 14 countries for which two recent data points can be compared, figure 4 shows that the trend in the proportion of wage earners in both the formal and informal sectors appears to have been growth in a majority of countries. While many countries have recorded relatively modest increases in the share of wage earners (such
16 The analytical report on Tanzania’s 2006 integrated labour force survey for example points out that the income
question is a sensitive one and that reliable answers are difficult to obtain due to the fact that people regard such
questions as a way for the government to acquire evidence for taxation purposes or because they regard the
information as confidential and personal (Tanzania National Bureau of Statistics, 2007, pp. 76–77). Hence, income-
related questions are often deliberately placed at the end of the questionnaires.

78
Sh
are
Figure 4 The share of wage earners in selected African countries (percentage)
90
80
70
60
50
40
30
20
10
0
Mid 1990s / Early 2000 Latest available
Note: The share of wage earners in total employment is taken or estimated from official national sources. In Botswana, the share of wage earners in 1995/96 was
not available from the central statistical office and was therefore estimated as the sum of formal employment (excluding traditional agriculture) plus informal
paid employment. Using the same method for 2005–06 overestimates wage employment by 4 percentage points compared with the official estimate. Hence we
have adjusted our own 1995–96 estimate downwards by 4 percentage points.
as Ghana, United Republic of Tanzania and Uganda) others seem to have made significant progress (in particular Namibia, Rwanda and South Africa). There are also exceptions to the positive trend. Botswana, for example, was one of the fastest growing countries in the world over the period 1995–2006, yet the share of wage earners appears to have decreased�17 although, it nonetheless remains one of the highest in Africa.
Despite the general progress in recent years, wage employment in sub-Saharan Africa remains a relatively small part of total employment – not exceeding an estimated 25 per cent (table 3). This share, however, can be expected to increase in the future along with economic growth. Also, while the number of wage earners may be small in relative size, in absolute terms they amount to about 100 million people. Table 4 shows that, whereas in advanced countries the fraction of men and women in wage
17 One possible reason is that economic growth in Botswana has been achieved in large part due to the export of
diamonds which, together with other mining, represents about 35 per cent of the county’s GDP (Poteete, 2009). This
has created few opportunities for wage employment. Overall, during the past 20 years, the total working-age
population has increased by about 20 per cent, from 950,000 in 1995–96 to 1.15 million in 2005–06. Almost three-
quarters of this additional labour force has been absorbed in the two sectors with the lowest proportion of wage
earners, namely agriculture and wholesale/retail trade.

79
Table 3 All wage and salaried workers in 2008 (percentage of total employment)
1998 2008
World 44 48 Developed 84 86 Eastern Europe and CIS 77 78 East Asia 36 45 South-East Asia and Pacific 33 36 South Asia 18 21 Latin America and the Caribbean 62 63 Middle East 50 62 North Africa 46 54 Sub-Saharan Africa 18 25
Source: ILO (Key Indicators of the Labour Market) http://www.ilo.org/public/english/employment/strat/kilm/index.htm
Table 4 Wage and salaried workers in 2008 by sex (percentage)
Male Female
World 49 47 Developed 84 89 Eastern Europe and CIS 77 80 East Asia 49 41 South-East Asia and Pacific 39 33 South Asia 24 15 Latin America and the Caribbean 62 66 Middle East 65 53 North Africa 57 46 Sub-Saharan Africa 31 17
Source: ILO (Key Indicators of the Labour Market) http://www.ilo.org/public/english/employment/strat/kilm/index.htm
employment is roughly equal, the proportion of women employees in sub-Saharan Africa is substantially smaller than that of men.
Trends in average wages
How has the growth in labour productivity increased the level of wages? The Global Wage Report 2008/09 had little data from Africa, but a substantial effort has been made since then to collect wage statistics from national statistical offices. These efforts now allow for some regional estimates of wage growth. Table 5 shows that real wages across the African continent have increased by about 16 per cent since 199918 against a global increase of 22.6 per cent during the same period, while in advanced countries, real average wages increased by only about 5 per cent in real terms, reflecting a period of wage moderation.
18 This estimate is tentative in the sense that it is based on wage data for 15 large African countries, which cover an
estimated 57 per cent of wage earners and about 76 per cent of the region’s total wage bill (for more details, see the
methodology in the Global Wage Report 2010/11).
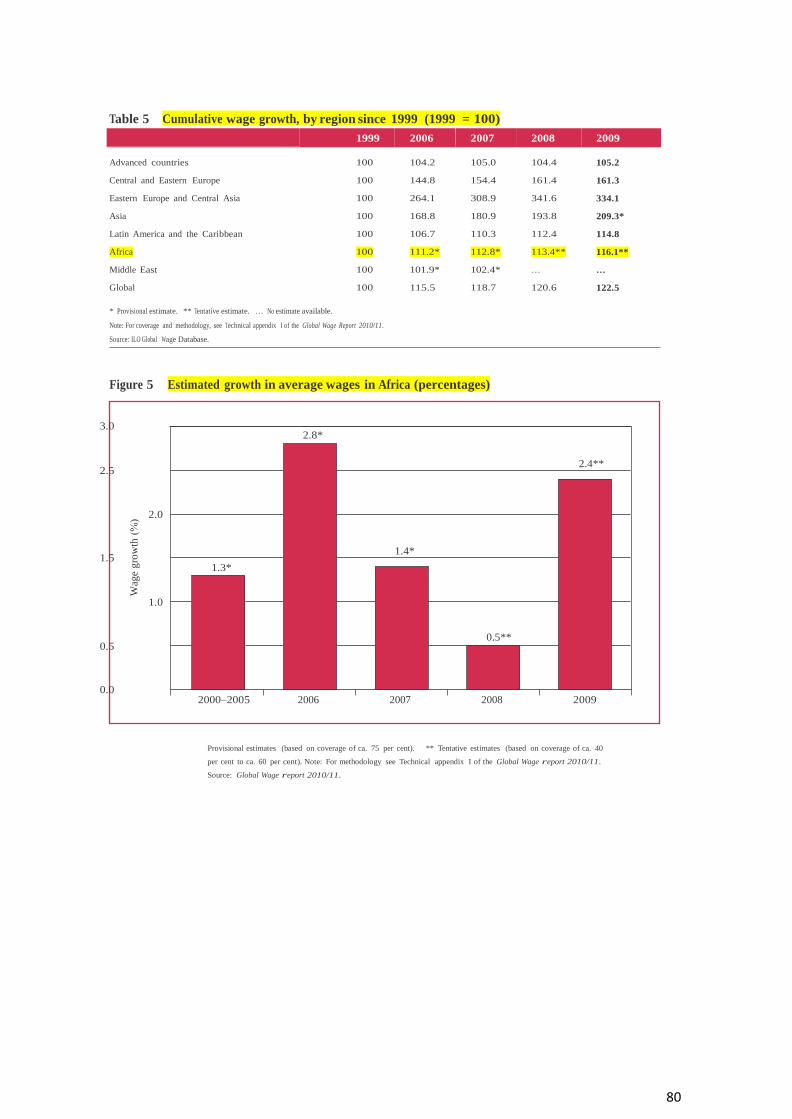
80
Wag
e g
row
th
Table 5 Cumulative wage growth, by region since 1999 (1999 = 100)
1999 2006 2007 2008 2009 Advanced countries
100
104.2
105.0
104.4
105.2
Central and Eastern Europe 100 144.8 154.4 161.4 161.3 Eastern Europe and Central Asia 100 264.1 308.9 341.6 334.1 Asia 100 168.8 180.9 193.8 209.3* Latin America and the Caribbean 100 106.7 110.3 112.4 114.8 Africa 100 111.2* 112.8* 113.4** 116.1** Middle East 100 101.9* 102.4* … … Global 100 115.5 118.7 120.6 122.5
* Provisional estimate. ** Tentative estimate. … No estimate available.
Note: For coverage and methodology, see Technical appendix I of the Global Wage Report 2010/11.
Source: ILO Global Wage Database.
Figure 5 Estimated growth in average wages in Africa (percentages) 3.0
2.8*
2.5 2.4**
2.0
1.5 1.3*
1.4*
1.0
0.5
0.5**
0.0
2000–2005 2006 2007 2008 2009
Provisional estimates (based on coverage of ca. 75 per cent). ** Tentative estimates (based on coverage of ca. 40
per cent to ca. 60 per cent). Note: For methodology see Technical appendix I of the Global Wage report 2010/11.
Source: Global Wage report 2010/11.

81
We estimate that before the crisis (over the years 2000 to 2005), average wages grew at an annual rate of about 1.3 per cent and that wage growth slowed to 0.5 per cent in 2008 before recovering in 2009, probably under the influence of much lower inflation than in previous years (figure 5). It is worth emphasizing, however, that these are estimates based on wage data for 15 African countries, which cover an estimated 57 per cent of all Africa’s wage earners and about 76 per cent of the region’s total wage bill. Since, even for these 15 countries, data are not available for every single year up to 2009, some extrapolation methods were used for the regional estimate.
Table 6 Trade union density
Year Proportion of wage and salary earners Proportion of total employment Cameroon
2005
..
16.0
Egypt 2007 26.1 16.1 Ethiopia 2007 12.9 1.0 Ghana 2006 70.0 .. Kenya 2007 35.5 4.1 Malawi 2006 20.6 2.7 Mauritius 2007 28.2 14.8 Niger 2008 .. 1.1 Sierra Leone 2008 46.8 3.6 South Africa 2008 39.8 24.9 Tanzania 2009 18.7 2.2 Uganda 2005 .. 1.1
Note: .. data not available.
Source: Hayter and Stoevska (2010).
Table 7 Collective bargaining coverage
Year Proportion of wage and salary earners Proportion of total employment. Egypt
2008
3.4
2.1
Ethiopia 2007 22.7 8.3 Ghana 2006 70.0 .. Kenya 2007 3.7 0.4 Malawi 2006 20.8 2.7 Mauritius 2008 16.5 9.9 Sierra Leone 2008 46.8 3.5 South Africa 2008 27.3 17.1 Sudan 2008 .. 0.2
Note: .. data not available.
Source: Hayter and Stoevska (2010).
The Global Jobs Pact, adopted by the ILO in June 2009, further stresses the importance of minimum wages in the context of the global economic crisis and the recovery. The Pact encourages member States to consider strengthening social dialogue, collective bargaining and statutory or negotiated minimum wages.
After years of conscious neglect of minimum wage policies in many countries during the 1980s and 1990s, the Global Wage Report 2008/09 provided indications of their more vigorous use in both developed and developing countries. Among developed countries, the United Kingdom (1999), Ireland (2000) and Austria (2009) introduced a national minimum wage in the past ten years or so. Developing countries, too, rely increasingly on minimum wages. Regional players, such as Brazil, China and South Africa, are among the main drivers of this trend. South Africa, for example, introduced new minimum wage floors in 2002 to support the wages of millions of low-paid workers

82
Un
ion
(% o
f
wag
e
Mid
-wag
e
Hig
h-w
age
Mid
-wag
e
Hig
h-w
age
Mid
-wag
e
Hig
h-w
age
Figure 9 Union membership by pay level in selected countries (as percentage of workers)
45 39.4
40
35
31.4
30
25
27.4
24.4
20
13.2
15
10
8.7
9.9
19.7
16.6
5 2.2
4.3
0
South Africa (2007) Republic of Korea (2009) Indonesia (2007) Brazil (2008)
Note: Mid-wage earners refer to workers earning between two-thirds and four-thirds of the median wages. All the figures refer to union members as a percentage
of total wage earners, except Brazil where only formal wage earners are considered.
Source: ILO estimates from national labour force surveys (“national technical reports” and estimation by Janine Berg for Brazil).
in a variety of economic sectors, including domestic workers. Of 55 countries in Africa, 37 (67 per cent) were found to have a minimum wage currently in place in 2007 and/or 2008. As can be seen in figure 10, the level of minimum wage varies considerably across African countries. The design of minimum wage systems also varies widely across countries. While 70 per cent of African countries for which data are available implement relatively simple national minimum wages (with a few possible adjustments by region, sector or broad categories of workers), the other 30 per cent implement more complex systems by industry and/or occupations.
One key challenge is to determine the right level of the minimum wage. ILO Convention No. 131, which considers that minimum wage systems are necessary to protect wage earners against unduly low wages, calls for setting levels that take into consideration (a) the needs of workers and their families – taking into account the general level of wages in the country, the cost of living, social security benefits and the relative living standards of other social groups – as well as (b) economic factors, including the requirements of economic development, levels of productivity and the desirability of attaining and maintaining a high level of employment. The extent to which these factors are balanced can be approximated by some rough indicators, such as the level of the minimum wage relative to the median or mean wage, or the proportion of workers whose wages are affected by the statutory minimum wage this requires statistics on average wages and the distribution of wages.

83
Figure 10 Minimum wage per month in PPP US$ (most recent year)
Burundi
Uganda
Egypt
Gambia
Malawi
Ethiopia
Madagascar
Zambia
Nigeria
Central African Rep
Angola
Cameroon
Mali
Niger
Benin
Côte d’Ivoire
Senegal
Ghana
Burkina Faso
Botswana
Mauritius
Gabon
Kenya
Algeria
Tunisia
Morocco
0 50 100 150 200 250 300 350 400

84
ILO Global Wage Report 2010 / 11
Table SA 1 Growth of real average monthly wages, in % p.a (Extract)
G
r
o
w
t
h
o
f
r
e
a
l
a
v
e
r
a
g
e
m
o
n
t
h
l
y
w
a
g
e
s
,
i
n
%
p
.
a
.
Country/Territory
2000-05
2006 2007 2008 2009 Source
NSO provided
data/ assistance
Africa
Algeria
–0.1
6.6
4.7
..
..
Algeria National Statistical
Office
x
Botswana 2.1 0.1 3.0 –4.8 5.4 Central Statistical
Office of Botswana
Egypt 1.7 6.1 –0.8 .. .. Egypt Central Agency for Public
Mobilization and Statistics x
Kenya .. –1.8 0.9 .. .. Kenya National
Bureau of Statistics
Malawi 12.5 –6.3 .. .. .. National Statistical
Office of Malawi x
Mauritius 3.2 –3.9 –2.5 –1.8 .. Central Statistics
Office of Mauritius
Morocco .. –0.3 0.8 1.7 5.2 Morocco National Social
Security Fund x
Reunion .. 0.1 1.4 .. .. France National Institute
of Statistics and Economic
Studies
Senegal 2.5 2.2 .. .. .. Senegal Les salaires: état des
lieux, tendances et evolution
recentes, Momar Ballé Sylla,
August 2009, mimeo
South Africa .. .. 1.0 0.0 3.5 Statistics South Africa x
Swaziland –0.4 .. .. .. .. Swaziland Central Statistics
Office
Tanzania 7.1 .. .. .. .. Tanzania National Bureau of
Statistics
Tunisia 2.7 1.2 2.2 0.0 2.3 Tunisian National Institute of
Statistics
Uganda .. 4.7 7.9 .. .. Uganda Bureau of Statistics x
Zimbabwe –7.4 .. .. .. .. Central Statistical Office of
Zimbabwe

85
Table SA 2 Minimum wages (extract)

86
ILO and Decent Jobs, 2009
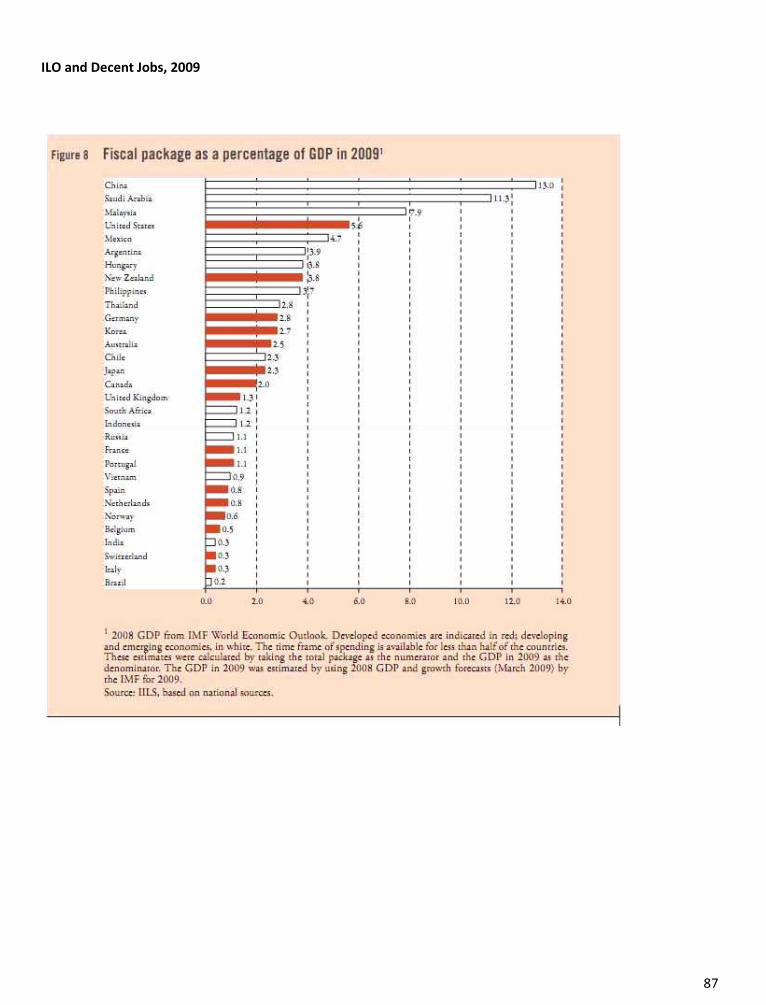
87
ILO and Decent Jobs, 2009

88
UNCTAD 2009 Rethinking the Role of the State in LDCs* — Towards Development Governance
(*Least Developed Countries)
Table 5
The challenge of financing governance in LDCs:
GDP per capita, Government current expenditure and domestic resources
available for financing governance and investment (DRAF), 2006
GDP per capita
(in current
2006 $)
Government final
consumption
expenditure
(as % of GDP)
Government final
consumption
expenditure
per capita
DRAF
per capita
DRAF per
capita per
day
(in cents) Total LDCs 462.1 12.9 59.8 150.5 41.2
LDCs: Africa and Haiti 493.7 15.5 76.6 180.7 49.5 Angola 2 998.7 21.2 636.3 2 050.5 561.8 Benin 537.9 12.1 65.0 127.6 35.0 Burkina Faso 418.9 21.1 88.3 105.0 28.8 Burundi 117.3 29.4 34.5 21.8 6.0 Central African Republic 346.3 10.6 36.8 40.5 11.1 Chad 634.0 24.0 152.3 481.5 131.9 Democratic Republic of the Congo 140.9 8.8 12.4 16.7 4.6 Djibouti 940.4 29.4 276.4 389.1 106.6 Equatorial Guinea 16 747.5 2.9 494.0 15 106.5 4 138.8 Eritrea 258.1 35.6 92.0 53.6 14.7 Ethiopia 164.0 12.4 20.3 32.8 9.0 Gambia 305.3 9.3 28.3 60.8 16.6 Guinea 357.8 7.5 26.9 59.4 16.3 Guinea-Bissau 185.0 15.6 28.8 40.3 11.0 Lesotho 749.2 18.1 135.3 23.2 6.4 Liberia 170.9 9.5 16.3 14.8 4.1 Madagascar 287.9 8.7 25.2 52.0 14.2 Malawi 234.6 9.6 22.6 5.6 1.5 Mali 511.6 17.3 88.4 177.4 48.6 Mauritania 874.3 19.5 170.8 333.2 91.3 Mozambique 325.8 13.0 42.2 59.7 16.4 Niger 258.9 15.4 39.8 67.3 18.4 Rwanda 312.5 18.0 56.3 52.4 14.4 Senegal 767.7 13.1 100.8 168.5 46.2 Sierra Leone 288.2 13.3 38.2 43.5 11.9 Somalia 299.8 8.7 26.0 82.8 22.7 Sudan 1 163.9 16.2 188.7 353.1 96.7 Togo 342.8 13.4 45.9 15.1 4.1 Uganda 339.8 14.3 48.6 74.4 20.4 United Republic of Tanzania 339.5 7.3 24.9 59.5 16.3 Zambia 930.7 20.0 186.4 382.7 104.9 Haiti 503.7 8.5 43.0 -3.5 -1.0
LDCs: Asia 406.5 7.4 30.2 100.2 27.5 Afghanistan 285.2 10.9 31.0 -28.9 -7.9 Bangladesh 386.6 5.5 21.4 99.7 27.3 Bhutan 1 421.9 22.0 312.8 728.3 199.5 Cambodia 512.4 5.3 27.0 97.5 26.7 Lao People's Democratic Republic 605.1 7.3 44.2 263.9 72.3 Myanmar 284.0 4.6 13.0 56.2 15.4 Nepal 357.8 8.4 30.2 63.7 17.4 Yemen 878.0 13.8 120.8 343.3 94.1
LDCs: Islands 927.1 32.5 301.0 318.2 87.2 Comoros 492.6 12.6 62.1 -6.8 -1.9 Kiribati 659.3 64.3 424.0 -60.0 -16.4 Maldives 3 020.0 37.9 1 145.4 2 120.5 581.0 Samoa 2 425.1 22.1 537.1 199.5 54.7 Sao Tome and Principe 788.0 46.3 364.7 176.1 48.2 Solomon Islands 877.0 31.9 279.8 451.7 123.7 Timor-Leste 316.5 53.8 170.3 24.4 6.7 Tuvalu 2 427.4 54.2 1 316.6 216.4 59.3 Vanuatu 1 763.1 22.7 400.3 625.5 171.4
Low-income countries 673.0 11.0 73.7 248.6 68.1 Lower-middle-income countries 2 167.4 13.6 294.5 1 165.4 319.3 Upper-middle-income countries 6 571.0 16.0 1 050.9 2 736.6 749.7 High-income countries 36 048.0 18.2 6 561.1 14 007.4 3 837.7

89
Table 8
LDCs with high real interest rate,a 2004–2006 (Per cent, period averages)
Group Country Real interest rate Africa and Haiti Gambia 24.5
Haiti 23.2
Angola 19.1
Malawi 15.6
Central African Republic 15.4
Mozambique 11.8
Uganda 11.6
Madagascar 11.2
Zambia 8.8
Burundi 8.3
Sierra Leone 8.1
Lesotho 7.9
Djibouti 7.8
Liberia 7.5
United Republic of Tanzania 6.8
Mauritania 6.4
Rwanda 6.2 Asia Lao People’s Democratic Republic 19.6
Cambodia 11.3
Bhutan 9.5
Bangladesh 9.4 Islands Sao Tome and Principe 19.2
Maldives 12.0
Comoros 8.4
Solomon Islands 6.7
Vanuatu 6.2
Samoa 6.1 Source: World Bank, World Development Indicators 2008, CD-ROM.
Monetary policies should support the leading role of fiscal policies in trying to prevent a substantial fall in aggregate demand. In
other words, monetary policies should operate in a counter-cyclical fashion. If, instead, central banks insist on maintaining high
rates of interest, monetary policies will operate pro-cyclically and will make any downturn even sharper and more protracted.

90
Current account and trade balances of LDCs, by groups, cent of GDP, period
Oil
Current account Balance of trade of goods and
Mineral Current account Balance of trade of goods and
Agricultural Current account Balance of trade of goods and
Other LDCs Current account Balance of trade of goods and
Source: UNCTAD based on data from IMF, International Statistics, online (February

91

92
Table 10
Stock of accumulated capital flight over the period 1970–2004
in sub-Saharan Africa (Per cent of the foreign debt stock in 2004)
LDC ODC Angola 535.2 Benin -399.9 Botswana -207.4 Burkina Faso 369 Burundi 185.3 Cameroon 287.4 Cape Verde 523.6 Central African Republic 257.4 Chad 137.9 Comoros -55.2 Congo 299.8 Côte d'Ivoire 460 Democratic Republic of the Congo 310.3 Ethiopia 342.6 Gabon 289.1 Ghana 159.3 Guinea 29.6 Kenya 93.3 Lesotho 117 Madagascar 276.4 Malawi 111.9 Mali -12.8 Mauritania 174.4 Mauritius 28.3 Mozambique 306.9 Niger -447.8 Nigeria 670.9 Rwanda 355.7 Sao Tome and Principe 292.4 Senegal -332 Seychelles 485.7 Sierra Leone 406.6 South Africa 176 Sudan 84.4 Swaziland 285.6 Togo -224.3 Uganda 142.1 United Republic of Tanzania 127.7 Zambia 272.2 Zimbabwe 511.9 Sample total 291.3 Source: Ndikumana and Boyce (2008).

93

94
Table 17
Trends in industrial sector composition in LDCs, 1970–2007 (Percentage contribution to GDP)
Period average
2005
2006
2007 1970–1979 1980–1989 1990–1994 1995–1999 2000–2005
All LDCs
GDP at
current
prices
Industry 22.10 20.52 21.08 22.26 26.02 31.97 33.39 32.49 Manufacturing 11.49 11.35 10.17 10.19 10.24 10.03 9.94 10.08 Mining and utilities 5.97 4.31 6.26 6.51 10.02 16.14 17.48 16.49 Construction 4.64 4.86 4.65 5.56 5.76 5.80 5.98 5.93
Real GDP
at 1990
prices
Industry 19.69 20.39 20.38 22.34 24.99 27.08 27.63 28.08 Manufacturing 10.11 10.92 10.08 10.58 11.42 12.13 12.26 12.40 Mining and utilities 4.95 4.66 5.73 6.67 7.85 8.84 9.13 9.55 Construction 4.63 4.80 4.57 5.09 5.72 6.11 6.24 6.13
LDCs:
Africa
and
Haiti
GDP at
current
prices
Industry 24.68 21.79 21.97 21.78 26.12 34.36 35.88 34.80 Manufacturing 11.27 10.86 8.99 8.13 7.98 7.85 7.70 7.82 Mining and utilities 8.28 6.13 8.55 8.39 13.03 21.45 22.79 21.62 Construction 5.13 4.80 4.43 5.27 5.12 5.06 5.39 5.37
Real GDP
at 1990
prices
Industry 21.57 22.13 21.05 22.32 25.31 28.05 28.53 28.94 Manufacturing 9.84 10.55 9.29 9.09 9.83 10.67 10.58 10.59 Mining and utilities 6.63 6.60 7.35 8.51 10.37 11.99 12.43 13.01 Construction 5.11 4.98 4.41 4.72 5.11 5.39 5.52 5.35
LDCs:
Asia
GDP at
current
prices
Industry 16.28 18.40 19.68 23.12 26.13 28.34 29.10 28.54 Manufacturing 12.04 12.30 12.20 13.00 13.38 13.80 14.32 14.47 Mining and utilities 0.79 1.15 2.47 4.14 6.12 7.48 7.68 7.08 Construction 3.45 4.94 5.01 5.98 6.63 7.06 7.11 6.99
Real GDP
at 1990
prices
Industry 14.75 17.04 19.24 22.56 24.60 25.59 26.29 26.75 Manufacturing 10.92 11.77 11.70 13.37 14.24 14.74 15.28 15.72 Mining and utilities 0.49 0.85 2.66 3.43 3.60 3.51 3.50 3.52 Construction 3.34 4.42 4.88 5.76 6.76 7.33 7.50 7.51
LDCs:
Islands
GDP at
current
prices
Industry 18.88 14.11 14.05 14.00 15.05 15.51 14.82 15.20 Manufacturing 7.29 6.70 7.24 7.05 6.74 6.50 6.02 6.09 Mining and utilities 5.82 1.61 1.89 2.25 2.75 3.05 2.91 2.90 Construction 5.77 5.80 4.92 4.71 5.55 5.96 5.89 6.21
Real GDP
at 1990
prices
Industry 18.39 13.42 12.97 13.51 16.14 16.06 15.08 15.66 Manufacturing 6.34 6.15 6.41 6.07 6.74 6.27 5.69 5.66 Mining and utilities 5.77 1.57 1.83 2.47 2.99 3.23 3.07 3.09 Construction 6.28 5.70 4.74 4.98 6.41 6.56 6.32 6.91
Source: UNCTAD secretariat calculations, based on data from the GlobStat database.
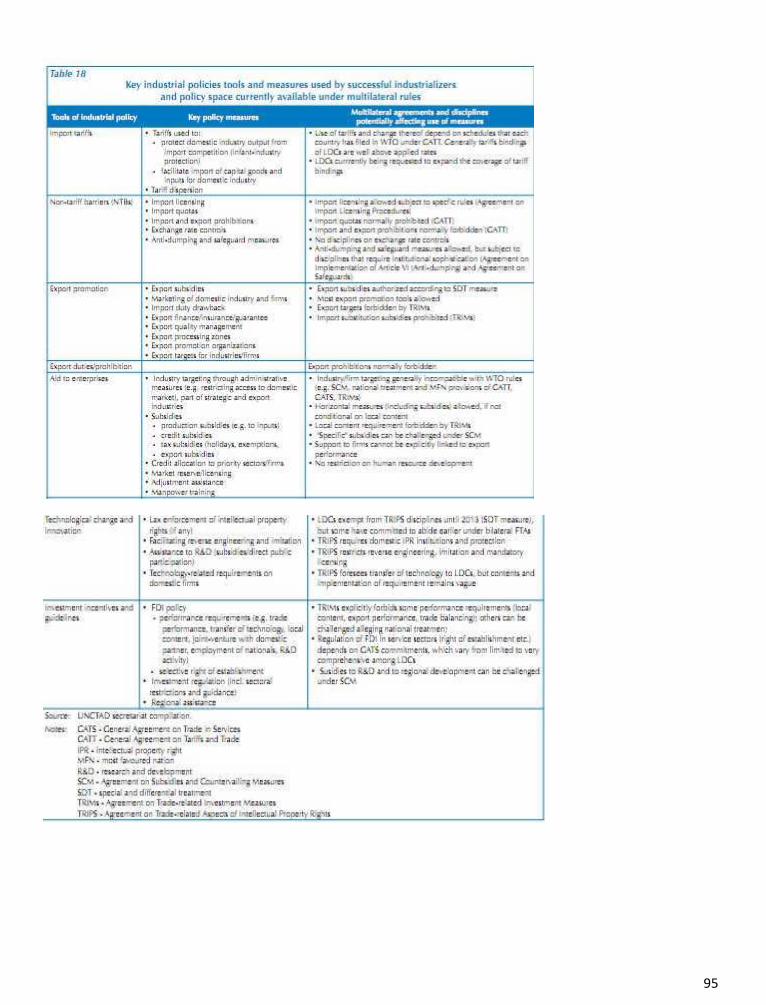
95

96

97
World Bank World development Report, 2009

98
BOX 5 .1 Regional labor mobility has been falling in Sub-Saharan Africa
The rate of labor migration within devel-
oping regions is highest in Sub-Saharan
Africa, but it has fallen since the 1960s.
More than 60 percent of emigrants from
Sub-Saharan countries move to other
countries in the region. The higher rate of
labor movement within the region rela-
tive to other developing world regions is
partly a consequence of the large number
of land borders, but also of the relative
permeability of these borders and the dif-
ficulty of monitoring the flow of people
crossing them, despite numerous legal
restrictions.
Migrants represented just over 3.5
percent of the population in Sub-Saharan
Africa in 1960 but only 2.3 percent by
2000. In 1960 the stock of migrants rela-
tive to the population was much higher in
Southern Africa than in other corners of
the region, but it has since fallen to about
the level of migrants in Western Africa
(see the table below). In Eastern Africa
and Central Africa the stock of migrants
has fallen significantly.
Voluntary migration across borders
in Sub-Saharan Africa is motivated by
the same reasons that prompt people
to move within a country: to pursue job
opportunities and to diversify risks to
income. Indeed, the economic rationale
for movement from a lagging to a leading
area of the same country is virtually indis-
tinguishable from that for moving across
a border in a region like Sub-Saharan
Africa, where these movements are over
relatively small distances and for the most
part unmonitored. But many migrants
also move across borders within a frame-
work of formal agreements between
countries. Since the 1960s, a web of
bilateral and multilateral agreements has
grown in an attempt to reap the benefits
and control the costs of labor mobility
within subregional neighborhoods.
In West Africa governments have
attempted to manage population move-
ments within the Economic Community
of West African States (ECOWAS), which
has had the most influence on the flow
and composition of migration in Sub-
Saharan Africa. Established in 1975,
ECOWAS includes a protocol allowing the
free movement of people and the right
of residence and establishment for the
citizens of its member countries.
The Southern African Development
Community (SADC), a loose alliance of
nine countries of Southern Africa formed
in 1980, coordinated development proj-
ects to lessen economic dependence on
South Africa during the Apartheid era.
Part of this alliance was a provision for the
flow of labor between member countries.
The recent anti-immigrant violence in
South Africa is a setback for regional inte-
gration and migration.
Kenya, Tanzania, and Uganda have
formed the East African Community (EAC),
a regional intergovernmental organiza-
tion for interterritorial cooperation with
roots extending to 1948 before indepen-
dence. The EAC, gaining strength as a
framework for economic integration since
1999, recently introduced East African
passports and temporary passes to speed
the movement of labor.
The movement of labor across borders in
Sub-Saharan Africa’s neighborhoods could
be encouraged. During economic
contractions, policy makers in these neigh-
borhoods feel the same xenophobic politi-
cal pressures as governments in rich coun-
tries do to favor native workers and ration
public services to nonnatives. Less than
one-third of governments in Sub-Saharan Sub-Saharan Africa’s stock of migrants has fallen since 1960 Per 1,000 population, by regional neighborhood
Neighborhood 1960 1970 1980 1990 2000
Eastern Africa 37.3 31.6 35.3 31.2 17.9
Central Africa 40.7 44.2 35.9 20.6 16.0
Southern Africa 49.7 40.6 33.3 34.5 30.6
Western Africa 28.0 27.3 34.6 28.5 30.0
Sub-Saharan Africa 35.6 32.8 35.0 29.0 23.0
Source: UN Population Division, in Lucas 2006.
Africa have ratified the International Con-
vention on the Protection of the Rights of
All Migrant Workers and Members of Their
Families. To really reap the benefits from
labor mobility for faster economic growth
with convergence across Sub-Saharan Afri-
ca’s regional neighborhoods, much more
can be done to welcome migrants and
open channels for the flow of remittances
to their home countries.
Source: Lucas 2006.

99
MNA SAR SSA
in electrical connection (days)
19.4 9.3 32.9 53.7 56.3 43.8 9.7
Number of outages (days)
9.3 14.0 17.8 46.1 121.5 56.4 1.5
lost due to outages of
2.5 3.1 3.6 4.2 5.6 5.7 2.3
Number of water supply failures (days)
3.5 7.5 14.5 41.7 12.0 37.2 0.3
in a mainline telephone connection (days)
15.8 13.4 45.1 49.9 66.3 58.4 9.0
using the Web in interaction with
23.7 56.7 40.9 34.2 29.2 20.4 80.2
BOX 9 .2 Diversifying production through regional cooperation
Diversifying an economy is no easy task.
Hidalgo, Barabasi, and Haussman (2007)
show that the current export structure
of a country determines how easy it will
be to diversify its production base over
higher-value products. They use the
metaphor of a forest representing the
product space (the same for all countries
in the world). Each tree is a product, and
firms are monkeys that can climb higher
on a tree to improve their value added
(intensive diversification) or jump to
another tree with higher value (extensive
diversification).
Developing country firms find it easiest
to grow through intensive diversifica-
tion, which builds on capabilities they
already possess. The alternative, required
at higher incomes or in response to even
lower-cost competitors, is to jump to
higher value trees. Even if a country is
lucky enough to have such higher value
trees close to its production base, the
jump remains costly and risky. It may
require physical infrastructure, specific
know-how, knowledge of the tastes and
standards in the targeted markets, and
easy and cheap access to specific inputs.
Haussman and Rodrik (2003) called these
initial investment needs “cost discovery,”
a search by the first firms to explore these
new opportunities. Cost discovery can
be facilitated in several ways. Foreign
direct investment can provide much of
the required information and know-how.
So can learning from one’s neighbors.
Cooperation between neighboring coun-
tries can therefore help, providing the
scale attractive for foreign investors and
the access to critical intermediate goods
that makes the leap to a new product less
costly and risky. Cooperation can provide
an outlet for intermediate goods produc-
ers who sell to innovating firms elsewhere
in the neighborhood.
When African exports during 1980–
2004 are mapped against a global prod-
uct space of some 800 products (four-digit
industries), the Central African Economic
and Monetary Community appears to
have only a few options for diversification
(wood and its manufactures). Members
of the East African Community have
more options because their exports are
more diversified (fruits and vegetables,
prepared food, fish, wood and its manu-
factures, cotton, textiles, low-tech manu-
factures, metallic products, chemicals,
and minerals). Other countries with similar
production structures have gone on to
diversify into such clusters as cotton, tex-
tiles, and garments, which currently enjoy
preferences under the African Growth and
Opportunity Act in the U.S. market.
Nearly all members of the West African
Economic and Monetary Union can ben-
efit from cooperation in at least seven
product clusters (fruits and vegetables
and their products, wood and its manu-
factures, cotton, low-tech manufactures,
chemicals, and minerals) to reduce their
overdependence on traditional agricul-
tural exports, such as coffee and cocoa.
Southern Africa Customs Union mem-
bers, except for South Africa, can gain
significantly more than other unions from
cooperation in natural-resource-based
and manufacturing clusters, because they
have much easier diversification options
driven by the logistics, finance, skills, and
infrastructure that reflect their middle-
income status.
By looking at which areas of economic
activity offer the most promise for further
development, countries can focus coop-
eration on sector-specific infrastructure,
such as common standards, compliance
and metrology systems, and specific cur-
ricula to build a skilled labor force and
adapt new technologies. That can serve
as a complement to the general areas of
cooperation in regional infrastructure,
better business regulations, and a strong
judicial systems.
Based on contributions from Vandana Chan- dra, Jessica Boccardo, and Israel Osorio.
Table 9.2 Sub-Saharan Africa, South Asia, and the Middle East and North Africa are most affected by unreliable infrastructure, East Asia the least
World regions
Suppliers
Source: World Bank ICA database.
Note: EAP = East Asia and the Pacific; ECA = Europe and Central Asia; LAC = Latin America and the Caribbean; MNA = Middle East and North Africa; SAR = South Asia Region; SSA =
Sub-Saharan Africa;

100
Map G4.1 Africa’s borders were charted before World War I
Source: http://www.voiceseducation.org.
Africa is the world’s least urbanized
continent, with only one-third of the
population living in urban areas in 2000,
according to the UN’s World
Urbanization Prospects. Due to the lack
of regular and recent censuses, even this
may over- state the urbanization in
Africa.5
The agglomeration index in
chapter 1 gives Africa a score of 30
percent, compared with about 50
percent for the rest of the world.
Divisions between countries in Africa
can distort the pattern of urbanization.
One simulation suggests that if Africa’s
50 countries were 50 states in one
country, like the United States, the
largest cities would be even bigger than
they are today, capable of sustaining
diversified economies and incubating
entrepre- neurship, skills, and
innovation. Without such prospects
Africa’s skilled labor has migrated to
other continents.
Long distances raise
transport costs and
reduce factor mobility
Distance reinforces the effects of low
population density on productivity in
Africa. While much is made of Africa’s
distance from world markets, the
primary problem is domestic—long
dis- tances within countries.6
Table
G4.1 indicates that Africa has one of the
lowest road densities in the world,
second only

101
Table G4.1 The most distant and divided regions—trading and transport are expensive
Region
Trading time
across borders Average transport
costs
Population in
Ratio of number Road density
(km2 of road per Estimated
number of civil for exports ($ per container to landlocked countries to surface area) conflicts,
(days)a Baltimore)b countries (%)b surface areab (1999)c (1940–2000)d
East Asia & Pacific 24 3,900 0.42 1.44 0.72 8
Europe & Central Asia 29 – 23.00 1.17 – 13
Latin America & Caribbean 22 4,600 2.77 1.52 0.12 15
Middle East & North Africa 27 2,100 0 1.60 0.33 17
South Asia 34 3,900 3.78 1.67 0.85 24
Sub-Saharan Africa 40 7,600 40.20 2.00 0.13 34
Sources: a. World Bank 2006b, p. 44; b. Ndulu and others 2007, p. 101; c. Ndulu and others 2007, p. 29; d. Fearon and Laitin 2003, pp. 7–10.
Note: – = not available
to Latin America. But unlike Latin America—where the population lives largely along the coast, making it unnecessary to build
roads into the interior—Africa has a third of its population in landlocked countries and even more far from access to global
markets. Economic distance in Africa—in the sense of market access (see chapter 2)—is further lengthened by armed
conflicts and linguistic diversity (see map G4.1). Economic distance has isolated a large proportion of Africans from access to
domestic and global markets. Physical factors, such as the relative absence of navigable rivers and natural harbors, have been
serious barriers to trade. Low levels of domestic and international trade, in turn, limit the potential for growth.
Deep divisions raise transport costs
Sub-Saharan Africa is a highly fragmented continent with many borders, many neighbors, and high transport costs.
Africa is as physically close to global markets as is East Asia—about
7,500 kilometers—and closer than Latin America (9,000 kilometers).7
But it still costs almost twice as much to ship a
container to the east coast of the United States from Africa as from other regions (see table G4.1). Compound- ing expensive
access to global markets is costly access to regional markets. It takes an African exporter about 40 days to cross the border
into a neighboring country, compared with 22 days for a Latin American counterpart. For the third of Africans who live
in landlocked countries, the costs of division are even greater. They must move goods long distances over land—expensive,
because each 1 percent increase in distance increases transport costs by approximately 0.25 percent.8
And landlocked
countries must rely on the goodwill (and efficient investment) of neighbors for access to ports and markets.
Meeting the challenge—better urbanization, more domestic specialization, and more regional
integration
Africa can reduce the limitations of its poor economic geography. Better urban agglomerations can deliver scale efficiencies.
Transport links can help domestic markets grow. And regional and global integration can promote trade. Regional integration,
labor mobility, investments in trade, communication and transport infrastructure, and peace and stability should remain high
on the agenda. They create good neighborhoods, and better neighborhoods will facilitate investment, trade, and factor mobility in
a cycle of prosperity.
• Urbanization. Contrary to some thinking, urbanization, done right, can help development more in Africa than elsewhere.
Despite five decades of low-quality urbanization, living standards in Africa’s cities are much higher than in the
countryside. If urbanization can be managed better, along the lines proposed in chapter 7, significant gains can be expected
in productivity and poverty reduction.
• Territorial development. The guidance from economic geography is unambiguous: firms and workers seek
agglomeration, and migration is a natural way to increase density and reduce distance to markets. Chapter 8 proposes some
principles and priori- ties for countries where lagging areas are sparsely populated and divided along ethnic, linguistic,
or religious lines. Agriculture is one priority, but policies to help leading areas exploit scale economies may be
especially important in Africa as a latecomer to economic development.
• Regional integration. Given its his- tory, political regionalism may have to take the lead in African regional integration.
The experience of Western Europe summarized earlier in this Report spotlights the importance of starting small and
keeping expectations realistic. Regional integration takes time and will not happen in all parts of Africa at once.
Infrastructure projects are a good place to start. But through regional integration, Africa can undo some of what Bismarck
and his guests did in 1884. Chapter 9 showed that many African countries have taken the first steps, outlining what the
rest of the world can do to help.

102
Based on a contribution by Wim Naudé.
Classification of economies by region and income, FY2009
East Asia and the Pacific American Samoa Cambodia China Fiji Indonesia Kiribati Korea, Dem. People’s Rep. of
Lao PDR Malaysia Marshall Islands Micronesia, Fed. States of
Mongolia Myanmar Palau Papua New Guinea Philippines Samoa Solomon Islands
Thailand Timor-Leste Tonga Vanuatu Vietnam
Europe and Central Asia
Albania Armenia Azerbaijan Belarus Bosnia and Herzegovina
Bulgaria Croatia Georgia Kazakhstan Kyrgyz Republic
Latvia Lithuania Macedonia, FYR Moldova Montenegro Poland Romania Russian Federation
Serbia Tajikistan Turkey Turkmenistan Ukraine Uzbekistan
UMC LIC LMC UMC LMC LMC LIC LIC UMC LMC LMC LMC LIC UMC LIC LMC LMC LIC LMC LMC LMC LMC LIC
LMC LMC LMC UMC LMC UMC UMC LMC UMC LIC UMC UMC LMC LMC UMC UMC UMC UMC UMC LIC UMC LMC LMC LIC
Latin America and the Caribbean
Argentina Belize Bolivia Brazil Chile Colombia Costa Rica Cuba Dominica Dominican Republic Ecuador
El Salvador Grenada Guatemala Guyana Haiti Honduras Jamaica Mexico Nicaragua Panama Paraguay Peru St. Kitts and Nevis St. Lucia St. Vincent and the Grenadines
Suriname Uruguay Venezuela, R.B.
Middle East and North Africa Algeria Djibouti Egypt, Arab Rep. of Iran, Islamic Rep. of Iraq Jordan Lebanon Libya Morocco Syrian Arab Republic Tunisia West Bank and Gaza Yemen, Rep. of
UMC UMC LMC UMC UMC LMC UMC UMC UMC LMC LMC LMC UMC LMC LMC LIC LMC UMC UMC LMC UMC LMC LMC UMC UMC UMC UMC UMC UMC
LMC LMC LMC LMC LMC LMC UMC UMC LMC LMC LMC LMC LIC
South Asia
Afghanistan Bangladesh Bhutan India Maldives Nepal Pakistan Sri Lanka
Sub-Saharan Africa
Angola Benin Botswana Burkina Faso Burundi Cameroon Cape Verde Central African Republic Chad Comoros Congo, Dem. Rep. of
Congo, Rep. of Côte d’Ivoire Eritrea Ethiopia Gabon Gambia, The Ghana Guinea Guinea-Bissau
Kenya Lesotho Liberia Madagascar Malawi Mali Mauritania Mauritius Mayotte Mozambique Namibia Niger Nigeria Rwanda São Tomé and Príncipe
Senegal Seychelles Sierra Leone Somalia South Africa Sudan Swaziland Tanzania Togo Uganda Zambia Zimbabwe
LIC LIC LMC LMC LMC LIC LIC LMC
LMC LIC UMC LIC LIC LMC LMC LIC LIC LIC LIC LMC LIC LIC LIC UMC LIC LIC LIC LIC LIC LMC LIC LIC LIC LIC LIC UMC UMC LIC LMC LIC LIC LIC LIC LIC UMC LIC LIC UMC LMC LMC LIC LIC LIC LIC LIC
High income OECD
Australia Austria Belgium Canada Czech Republic Denmark Finland France Germany Greece Hungary Iceland Ireland Italy Japan Korea, Rep. of Luxembourg Netherlands New Zealand Norway Portugal Slovak Republic
Spain Sweden Switzerland United Kingdom United States
Other high income Andorra Antigua and Barbuda
Aruba Bahamas, The Bahrain Barbados Bermuda Brunei Darussalam Cayman Islands Channel Islands Cyprus Equatorial Guinea Estonia
Faeroe Islands French Polynesia Greenland Guam Hong Kong, China
Isle of Man Israel Kuwait Liechtenstein Macao, China Malta Monaco Netherlands Antilles New Caledonia Northern Mariana Islands
Oman Puerto Rico Qatar San Marino Saudi Arabia Singapore Slovenia Taiwan, China Trinidad and Tobago United Arab Emirates Virgin Islands (U.S.)
This table classifies all World Bank member economies and all other economies with populations of more than 30,000. Economies are divided among income groups according to
2007 GNI per capita, calculated using the World Bank Atlas method. The groups are low income (LIC), $935 or less; lower middle income (LMC), $936–3,705; upper middle income
(UMC), $3,706–11,455; and high income, $11,456 or more.
Source: World Bank data.

103
Table 1 Key indicators of development
Population Population
age
GNI
a PPP GNI
b Gross
domestic
Life expectancy at birth Adult literacy
Carbon dioxide
Millions 2007
Average annual % growth 2000–07
Density
people per sq. km 2007
composition %
ages 0–14 2007
$ billions
2007
$ per
capita 2007
$ billions
2007
$ per
capita 2007
product per capita % growth 2006–07
Male years 2006
Female years 2006
rate % ages 15 and older
2005
emissions per capita metric tons
2004
Afghanistan .. .. .. .. 10.1 ..c 27.2
d ..d .. .. .. .. 0.0
Albania 3 0.5 116 25 10.5 3,290 20.9 6,580 5.7 73 80 99 1.2 Algeria 34 1.5 14 28 122.5 3,620 258.8
d 7,640d 1.6 71 73 70 6.0
Angola 17 2.9 14 46 43.6 2,560 74.9 4,400 20.1 41 44 67 0.5 Argentina 40 1.0 14 26 238.9 6,050 513.0 12,990 7.6 71 79 97 3.7 Armenia 3 –0.4 106 19 7.9 2,640 17.7 5,900 14.0 68 75 99 1.2 Australia 21 1.3 3 19 755.8 35,960 700.6 33,340 2.9 79 83 .. 16.2 Austria 8 0.5 101 15 355.1 42,700 316.8 38,090 3.0 77 83 .. 8.5 Azerbaijan 9 0.9 104 23 21.9 2,550 54.6 6,370 18.0 70 75 .. 3.8 Bangladesh 159 1.8 1,218 34 75.1 470 212.7 1,340 4.8 63 65 47 0.3 Belarus 10 –0.4 47 15 40.9 4,220 104.2 10,740 8.5 63 74 .. 6.6 Belgium 11 0.5 352 17 432.5 40,710 373.1 35,110 2.1 77 82 .. 9.7 Benin 9 3.2 82 44 5.1 570 11.9 1,310 1.5 55 57 35 0.3 Bolivia 10 1.9 9 37 12.0 1,260 39.4 4,140 2.8 63 67 87 0.8 Bosnia and Herzegovina 4 0.3 74 17 14.3 3,790 28.6 7,280 6.8 72 77 97 4.0 Brazil 192 1.4 23 27 1,133.0 5,910 1,795.7 9,370 4.2 69 76 89 1.8 Bulgaria 8 –0.8 70 13 35.1 4,590 85.4 11,180 6.9 69 76 98 5.5 Burkina Faso 15 3.1 54 46 6.4 430 16.5 1,120 1.0 50 53 24 0.1 Burundi 8 3.5 331 44 0.9 110 2.8 330 –0.3 48 50 59 0.0 Cambodia 14 1.8 82 36 7.9 540 24.5 1,690 8.4 57 61 74 0.0 Cameroon 19 2.2 40 41 19.5 1,050 39.2 2,120 1.3 50 51 68 0.2 Canada 33 1.0 4 17 1,300.0 39,420 1,164.2 35,310 1.7 78 83 .. 20.0 Central African Republic 4 1.7 7 42 1.7 380 3.2 740 2.3 43 46 49 0.1 Chad 11 3.4 9 46 5.8 540 13.8 1,280 –2.1 49 52 26 0.0 Chile 17 1.1 22 24 138.6 8,350 209.0 12,590 4.1 75 81 96 3.9 China 1,320 0.6 142 21 3,120.9 2,360 7,083.5 5,370 11.2 70 74 91 3.9
Hong Kong, China 7 0.5 6,647 14 218.9 31,610 305.1 44,050 5.3 79 85 .. 5.5 Colombia 46 1.4 42 29 149.9 3,250 306.2 6,640 6.2 69 76 93 1.2 Congo, Dem. Rep. of 62 3.0 28 47 8.6 140 17.9 290 3.5 45 47 67 0.0 Congo, Rep. of 4 2.3 11 42 5.8 1,540 10.4 2,750 –3.6 54 56 85 1.0 Costa Rica 4 1.8 87 27 24.8 5,560 47.7
d 10,700d 4.8 76 81 95 1.5
Côte d’Ivoire 19 1.7 61 41 17.5 910 30.7 1,590 –0.1 47 49 49 0.3 Croatia 4 –0.2 79 15 46.4 10,460 66.8 15,050 5.6 73 79 98 5.3 Czech Republic 10 0.1 134 14 149.4 14,450 225.5 21,820 5.0 73 80 .. 11.5 Denmark 5 0.3 129 19 299.8 54,910 200.6 36,740 1.4 76 80 .. 9.8 Dominican Republic 10 1.6 202 33 34.6 3,550 61.8
d 6,340d 7.0 69 75 87 2.1
Ecuador 13 1.2 48 32 41.2 3,080 93.9 7,040 0.9 72 78 91 2.3 Egypt, Arab Rep. of 75 1.8 76 33 119.4 1,580 407.6 5,400 5.2 69 73 71 2.2 El Salvador 7 1.4 331 33 19.5 2,850 38.6
d 5,640d 2.8 69 75 81 0.9
Eritrea 5 3.9 48 43 1.1 230 2.5d 520
d –2.3 55 60 .. 0.2 Ethiopia 79 2.6 79 44 17.6 220 61.7 780 8.4 51 54 36 0.1 Finland 5 0.3 17 17 234.8 44,400 186.5 35,270 4.0 76 83 .. 12.6 France 62 0.7 112 18 2,447.1 38,500
e 2,065.4 33,470 1.6 77 84 .. 6.2 Georgia 4 –1.0 63 18 9.3 2,120 21.0 4,770 13.4 67 75 .. 0.9 Germany 82 0.0
f 236 14 3,197.0 38,860 2,782.7 33,820 2.6 76 82 .. 9.8 Ghana 23 2.2 103 38 13.9 590 31.2 1,330 4.3 59 60 58 0.3 Greece 11 0.4 87 14 331.7 29,630 364.1 32,520 3.6 77 82 96 8.7 Guatemala 13 2.5 123 43 32.6 2,440 60.4
d 4,520d 3.2 66 74 69 1.0
Guinea 9 1.9 38 43 3.7 400 10.5 1,120 –0.6 54 57 29 0.2 Haiti 10 1.6 349 37 5.4 560 11.1
d 1,150d 1.4 59 62 .. 0.2
Honduras 7 1.9 63 39 11.3 1,600 25.7d 3,620
d 4.5 66 73 80 1.1 Hungary 10 –0.2 112 15 116.3 11,570 175.2 17,430 1.5 69 77 .. 5.7 India 1,123 1.4 378 32 1,069.4 950 3,078.7 2,740 7.7 63 66 61 1.2 Indonesia 226 1.3 125 28 373.1 1,650 807.9 3,580 5.1 66 70 90 1.7 Iran, Islamic Rep. of 71 1.5 44 27 246.5 3,470 766.9 10,800 6.2 69 72 82 6.4 Iraq .. .. .. .. .. ..
g .. .. .. .. .. .. 3.0 Ireland 4 2.0 63 21 210.2 48,140 161.7 37,040 2.8 77 82 .. 10.4 Israel 7 1.9 331 28 157.1 21,900 186.0 25,930 3.4 78 82 .. 10.5 Italy 59 0.6 202 14 1,991.3 33,540 1,775.3 29,900 0.8 78 84 98 7.7 Japan 128 0.1 351 14 4,813.3 37,670 4,420.6 34,600 2.1 79 86 .. 9.8 Jordan 6 2.5 65 36 16.3 2,850 29.5 5,160 2.6 71 74 91 3.1 Kazakhstan 15 0.6 6 24 78.3 5,060 150.1 9,700 7.3 61 72 .. 13.3 Kenya 38 2.6 66 43 25.6 680 57.8 1,540 4.1 52 55 74 0.3 Korea, Rep. of 49 0.5 492 18 955.8 19,690 1,201.1 24,750 4.7 75 82 .. 9.7 Kyrgyz Republic 5 0.9 27 30 3.1 590 10.2 1,950 6.4 64 72 .. 1.1 Lao PDR 6 1.6 25 38 3.4 580 11.4 1,940 5.3 63 65 69 0.2 Lebanon 4 1.2 401 28 23.7 5,770 41.2 10,050 1.0 70 74 .. 4.1 Liberia 4 2.9 39 47 0.6 150 1.1 290 4.3 44 46 52 0.1 Libya 6 2.0 4 30 55.5 9,010 90.6
d 14,710d 4.8 71 77 84 10.3
Lithuania 3 –0.5 54 16 33.5 9,920 58.0 17,180 9.4 65 77 100 3.9 Madagascar 20 2.8 34 43 6.3 320 18.2 920 3.7 57 61 71 0.2 Malawi 14 2.6 148 47 3.5 250 10.5 750 4.7 47 48 .. 0.1 Malaysia 27 1.9 81 30 173.7 6,540 360.2 13,570 4.0 72 76 89 7.0 Mali 12 3.0 10 48 6.1 500 12.8 1,040 –0.3 52 56 24 0.1 Mauritania 3 2.8 3 40 2.6 840 6.3 2,010 –0.6 62 66 51 0.9 Mexico 105 1.0 54 30 878.0 8,340 1,324.6 12,580 2.3 72 77 92 4.3 Moldova 4 –1.3 115 19 4.3 1,260
h 11.1 2,930 4.1 65 72 99 2.0 Morocco 31 1.2 69 29 69.4 2,250 123.3 3,990 1.1 69 73 52 1.4 Mozambique 21 2.3 27 44 6.8 320 14.8 690 5.0 42 43 .. 0.1 Myanmar 49 0.9 74 26 .. ..
c .. .. 4.1 59 65 90 0.2

104
Population
Population
age
GNI
a
PPP GNIb
Gross
domestic Life expectancy at
birth
Adult literacy
Carbon dioxide
Average composition product rate % emissions annual % Density % $ per $ per per capita Male Female ages 15 per capita
Millions growth p eople per ages 0–14 $ billions capita $ billions capita % growth years years and older metric tons 2007 2000–07 s q. km 2007 2007 2007 2007 2007 2007 2006–07 2006 2006 2005 2004
Nepal 28 2.0 197 38 9.7 340 29.2 1,040 0.8 63 64 49 0.1 Netherlands 16 0.4 484 18 750.5 45,820 647.1 39,500 3.3 78 82 .. 8.7 New Zealand 4 1.3 16 21 121.7 28,780 111.4 26,340 2.3 78 82 .. 7.7 Nicaragua 6 1.3 46 37 5.5 980 14.1
d 2,520d 2.9 70 76 77 0.7
Niger 14 3.5 11 48 4.0 280 9.0 630 –0.1 57 56 29 0.1 Nigeria 148 2.4 162 44 137.1 930 262.5 1,770 4.0 46 47 69 0.8 Norway 5 0.7 15 19 360.0 76,450 252.8 53,690 2.4 78 83 .. 19.1 Pakistan 162 2.3 211 36 141.0 870 417.5 2,570 4.2 65 66 50 0.8 Panama 3 1.8 45 30 18.4 5,510 35.4
d 10,610d 9.4 73 78 92 1.8
Papua New Guinea 6 2.3 14 40 5.4 850 11.8d 1,870
d 4.2 55 60 57 0.4 Paraguay 6 1.9 15 35 10.2 1,670 26.8 4,380 4.6 69 74 93 0.7 Peru 28 1.2 22 31 96.2 3,450 201.9 7,240 7.8 69 74 88 1.2 Philippines 88 2.0 295 35 142.6 1,620 327.8 3,730 5.3 69 74 93 1.0 Poland 38 –0.1 124 15 374.6 9,840 593.3 15,590 6.7 71 80 .. 8.0 Portugal 11 0.5 116 16 201.1 18,950 219.0 20,640 1.7 75 82 94 5.6 Romania 22 –0.6 94 15 132.5 6,150 236.6 10,980 6.4 69 76 97 4.2 Russian Federation 142 –0.5 9 15 1,071.0 7,560 2,039.1 14,400 8.8 59 73 99 10.6 Rwanda 10 2.5 395 43 3.1 320 8.4 860 3.0 44 47 65 0.1 Saudi Arabia 24 2.3 12 34 373.5 15,440 554.3 22,910 1.2 71 75 83 13.7 Senegal 12 2.6 64 42 10.2 820 20.3 1,640 1.9 61 65 39 0.4 Serbia 7i –0.3i 95i 18 35.0 4,730i 75.5 10,220 6.9 70i 76i .. .. Sierra Leone 6 3.7 82 43 1.5 260 3.9 660 4.6 41 44 35 0.2 Singapore 5 1.9 6,660 18 149.0 32,470 222.7 48,520 3.3 78 82 93 12.5 Slovak Republic 5 0.0
f 112 16 63.3 11,730 104.3 19,330 10.3 70 78 .. 6.7 Somalia 9 3.0 14 44 .. ..
c .. .. .. 47 49 .. .. South Africa 48 1.1 39 32 274.0 5,760 454.8 9,560 4.4 49 53 .. 9.4 Spain 45 1.6 90 15 1,321.8 29,450 1,351.1 30,110 2.0 78 84 .. 7.7 Sri Lanka 20 0.4 309 23 30.8 1,540 84.0 4,210 6.5 72 78 91 0.6 Sudan 39 2.1 16 40 37.0 960 72.6 1,880 7.8 57 60 61 0.3 Sweden 9 0.4 22 17 421.3 46,060 327.9 35,840 1.8 79 83 .. 5.9 Switzerland 8 0.7 189 16 452.1 59,880 325.3 43,080 2.2 79 84 .. 5.5 Syrian Arab Republic 20 2.7 108 36 35.0 1,760 87.0 4,370 4.0 72 76 81 3.7 Tajikistan 7 1.3 48 38 3.1 460 11.5 1,710 6.2 64 69 99 0.8 Tanzania 40 2.5 46 44 16.3 400
j 48.7 1,200 4.5 51 53 69 0.1 Thailand 64 0.7 125 21 217.4 3,400 503.1 7,880 4.1 66 75 93 4.3 Togo 7 2.8 121 43 2.4 360 5.2 800 –0.5 56 60 53 0.4 Tunisia 10 1.0 66 25 32.8 3,200 73.0 7,130 5.1 72 76 74 2.3 Turkey 74 1.3 96 27 592.9 8,020 893.1 12,090 3.2 69 74 87 3.2 Turkmenistan 5 1.4 11 30 .. ..
g 21.0d 4,350
d .. 59 67 .. 8.8 Uganda 31 3.2 157 49 10.5 340 28.5 920 2.9 50 51 67 0.1 Ukraine 46 –0.8 80 14 118.4 2,550 315.9 6,810 8.2 62 74 99 7.0 United Arab Emirates 4 4.2 52 20 .. ..
k .. .. 4.4 77 82 89 37.8 United Kingdom 61 0.5 252 18 2,608.5 42,740 2,097.9 34,370 2.3 77 81 .. 9.8 United States 302 0.9 33 20 13,886.5 46,040 13,829.0 45,850 1.5 75 81 .. 20.6 Uruguay 3 0.1 19 23 21.2 6,380 36.6 11,040 7.3 72 80 .. 1.7 Uzbekistan 27 1.2 63 32 19.7 730 65.3
d 2,430d 7.9 64 71 .. 5.3
Venezuela, R.B. de 27 1.7 31 31 201.2 7,320 327.5 11,920 6.6 72 77 93 6.6 Vietnam 85 1.3 275 28 67.2 790 216.9 2,550 7.2 68 73 .. 1.2 West Bank and Gaza 4 3.8 643 45 4.5 1,230 .. .. –4.9 71 74 92 .. Yemen, Rep. 22 3.0 42 45 19.4 870 49.3 2,200 0.6 61 64 54 1.0 Zambia 12 1.9 16 46 9.5 800 14.6 1,220 4.0 41 42 .. 0.2 Zimbabwe 13 0.8 35 38 4.5 340 .. .. –6.0 43 42 89 0.8 World 6,612s 1.2w 51w 28w 52,621.4t 7,958w 65,144.4t 9,852w 2.6w 66w 70w 82w 4.3w Low income 1,296 2.2 61 39 748.8 578 1,935.2 1,494 4.3 56 58 61 0.6 Middle income 4,260 1.0 57 27 12,234.7 2,872 25,353.6 5,952 6.9 67 71 90 3.2
Lower middle income 3,437 1.1 100 27 6,485.0 1,887 15,613.9 4,543 8.6 67 70 89 2.6 Upper middle income 823 0.7 20 24 5,749.6 6,987 9,765.9 11,868 5.1 67 74 93 5.5
Low and middle income 5,556 1.3 58 29 12,985.9 2,337 27,283.9 4,911 6.5 64 68 79 2.6 East Asia & Pacific 1,914 0.8 121 23 4,173.5 2,180 9,449.8 4,937 9.6 69 73 91 3.3 Europe & Central Asia 445 0.0
f 19 19 2,693.7 6,051 4,947.7 11,115 6.7 64 74 97 7.1 Latin America & the 563 1.3 28 29 3,118.0 5,540 5,245.9 9,321 4.5 70 76 90 2.6
Caribbean Middle East & North Africa 313 1.8 36 32 875.6 2,794 2,314.7 7,385 4.0 68 72 73 3.8 South Asia 1,520 1.6 318 33 1,338.6 880 3,856.7 2,537 7.0 63 66 58 1.1 Sub-Saharan Africa 800 2.5 34 43 761.6 952 1,496.1 1,870 3.7 49 52 59 0.9
High income 1,056 0.7 32 18 39,682.1 37,566 38,133.5 36,100 2.0 76 82 99 13.1 a. Calculated using the World Bank Atlas method. b. PPP is purchasing power parity; see Technical notes. c. Estimated to be low income ($935 or less). d.The estimate is based on
regression; others are extrapolated from the latest International Comparison Program benchmark estimates. e. The GNI and GNI per capita estimates include the French overseas
departments of French Guiana, Guadeloupe, Martinique, and Réunion. f. Less than 0.05. g. Estimated to be lower middle income ($936 to $3,705). h. Excludes data for Transnistria. i.
Excludes data for Kosovo and Metohija. j. Data refer to mainland Tanzania only. k. Estimated to be high income ($11.456 or more).

105
Table 2 Millennium Development Goals: eradicating poverty and improving lives
Eradicate extreme poverty and hunger Achieve Promote gender Improve maternal health Combat universal equality HIV/AIDS
Share of poorest primary Ratio of girls to Reduce child Contraceptive and other
quintile in national Prevalence of
education boys enrolllments mortality Prevalence rate diseases consumption or
child malnutrition Primary in primary and Under-five Births attended % of married HIV prevalence
income
% b
% of children under 5
completion ratea
% secondary school
a
% mortality rate
per 1,000
b y skilled health staff
% of total women ages
15–49 % of population
ages 15–49
1992–2005
1990 2000–07b
1991
2006
1991
2006
1990
2006
1990 2000–07b
1990 2000–07b
2005 Afghanistan .. .. .. .. .. .. .. .. .. .. .. .. .. .. Albania 8.2
c .. 17.0 .. 96 96 97 45 17 .. 100 .. 60 0.2 Algeria 7.0
c .. 10.2 80 85 83 99 69 38 77 95 47 61 0.1 Angola .. .. 27.5 35 .. .. .. 260 260 .. 45 .. 6 3.7 Argentina 3.1d,e .. 2.3 .. 97 .. 104 29 16 96 99 .. .. 0.6 Armenia 8.5
c .. 4.2 .. 91 .. 104 56 24 .. 98 .. 53 0.1 Australia 5.9
e .. .. .. .. 101 97 10 6 100 100 .. .. 0.1 Austria 8.6
e .. .. .. 103 95 97 10 5 .. .. .. .. 0.3 Azerbaijan 7.4
c .. 14.0 .. 92 100 96 105 88 .. 100 .. 55 0.1 Bangladesh 8.8
c .. 39.2 49 72 .. 103 149 69 .. 20 31 58 <0.1 Belarus 8.8
c .. 1.3 94 95 .. 101 24 13 .. 100 .. 73 0.3 Belgium 8.5
e .. .. 79 87 101 98 10 4 .. .. 78 .. 0.3 Benin 7.4
c .. 21.5 21 64 49 73 185 148 .. 79 .. 17 1.8 Bolivia 1.5
e 8.9 5.9 .. 101 .. 98 125 61 43 67 30 58 0.1 Bosnia and Herzegovina 7.0
c .. 1.6 .. .. .. .. 22 15 97 100 .. 36 <0.1 Brazil 2.9
e .. 3.7 93 106 .. 103 57 20 72 97 59 .. 0.5 Bulgaria 8.7
c .. 1.6 84 98 99 97 19 14 .. 99 .. .. <0.1 Burkina Faso 6.9
c .. 35.2 20 31 62 80 206 204 .. 54 .. 17 2.0 Burundi 5.1
c .. 38.9 46 36 82 89 190 181 .. 34 .. 9 3.3 Cambodia 6.8
c .. 28.4 .. 87 73 89 116 82 .. 44 .. 40 1.6 Cameroon 5.6
c .. 15.1 53 52 83 83 139 149 58 63 16 29 5.5g
Canada 7.2e .. .. .. .. 99 98 8 6 .. 100 .. .. 0.3
Central African Republic 2.0c .. 21.8 27 24 60 .. 173 175 .. 53 .. 19 10.7
Chad .. .. 33.9 18 31 42 61 201 209 .. 14 .. 3 3.5 Chile 3.8
e .. .. .. 95 100 99 21 9 .. 100 56 .. 0.3 China 4.3
e .. 6.8 105 .. 87 100 45 24 50 98 71 87 0.1h
Hong Kong, China 5.3e .. .. 102 100 103 98 .. .. .. 100 86 .. ..
Colombia 2.9e .. 5.1 70 105 108 104 35 21 82 96 66 78 0.6
Congo, Dem. Rep. of .. .. 33.6 46 .. .. .. 205 205 .. 74k 8 21
k 3.2 Congo, Rep. .. .. 11.8 54 73 85 90 103 126 .. 86 .. 44 5.3 Costa Rica 4.1
e .. .. 79 89 101 102 18 12 98 99 .. 96 0.3 Côte d’Ivoire 5.2
c .. 20.2 43 43 65 .. 153 127 .. 57 .. 13 7.1 Croatia 8.8
c .. .. .. 92 102 102 12 6 100 100 .. 69 <0.1 Czech Republic 10.3
e .. 2.1 .. 94 98 101 13 4 .. 100 78 .. 0.1 Denmark 8.3
e .. .. 98 101 101 101 9 5 .. .. 78 .. 0.2 Dominican Republic 4.1
e 8.4 4.2 .. 83 .. 104 65 29 93 96 56 61 1.1 Ecuador 3.3
c .. 6.2 .. 106 .. 100 57 24 .. 75 53 73 0.3 Egypt, Arab Rep. of 8.9
c .. 5.4 .. 98k 81 95 91 35 37 74 38 59 <0.1
El Salvador 2.7e 11.1 6.1 41 88 102 99 60 25 52 92 47 67 0.9
Eritrea .. .. 34.5 .. 49 .. 72 147 74 .. 28 .. 8 2.4 Ethiopia 9.1
c .. 34.6 26 46k 68 83
k 204 123 .. 6 4 15 1.4i
Finland 9.6e .. .. 97 97 109 102 7 4 .. 100 77 .. 0.1
France 7.2e .. .. 104 .. 102 100 9 4 .. .. 81 .. 0.4
Georgia 5.4c .. .. .. 85 98 103 46 32 .. 92 .. 47 0.2
Germany 8.5e .. .. 100 97 99 98 9 4 .. 100 75 .. 0.1
Ghana 5.6c 24.1 18.8 61 71 79 95
k 120 120 40 50 13 17 2.3 Greece 6.7
e .. .. 99 103 99 98 11 4 .. .. .. .. 0.2 Guatemala 3.9
e .. 17.7 .. 77 .. 92 82 41 .. 41 .. 43 0.9 Guinea 7.0
c .. 22.5 17 64 45 74 235 161 31 38 .. 9 1.5 Haiti 2.4
e .. 18.9 27 .. 94 .. 152 80 23 26 10 32 2.2j
Honduras 3.4e .. 8.6 64 89 106 109 58 27 45 67 47 65 1.5
Hungary 8.6c 2.3 .. 93 96 100 99 17 7 .. 100 .. .. 0.1
India 8.1c .. 43.5 64 86 70 91 115 76 .. 47 43 56 0.9
Indonesia 7.1c 31.0 24.4 91 99 93 98 91 34 32 72 50 57 0.1
Iran, Islamic Rep. of 6.5c .. .. 91 101 85 105 72 34 .. 90 49 74 0.2
Iraq .. .. .. 58 .. 78 .. 53 .. 54 .. 14 .. .. Ireland 7.4
e .. .. .. 96 104 103 9 5 .. 100 60 .. 0.2 Israel 5.7
e .. .. .. 101 105 101 12 5 .. .. 68 .. 0.2 Italy 6.5
e .. .. 104 100 100 99 9 4 .. 99 .. .. 0.5 Japan 10.6
e .. .. 101 .. 101 100 6 4 100 100 58 56 <0.1 Jordan 6.7
c 4.8 3.6 72 99 101 102 40 25 87 100 40 56 0.2 Kazakhstan 7.4
c .. .. .. 101k 102 99
k 60 29 .. 100 .. 51 0.1 Kenya 6.0
c .. 16.5 .. 93 94 96 97 121 50 42 27 39 6.1 Korea, Rep. of 7.9
e .. .. 98 101k 99 96
k 9 5 98 100 77 .. <0.1 Kyrgyz Republic 8.9
c .. .. .. 99 .. 100 75 41 .. 98 .. 48 0.1 Lao PDR 8.1
c .. 36.4 46 75 76 85 163 75 .. 19 .. 32 0.1 Lebanon .. .. 3.4 .. 80 .. 103 37 30 .. 98 .. 58 0.1 Liberia .. .. 22.8 .. 63 .. .. 235 235 .. 51 .. 10 .. Libya .. .. .. .. .. .. 105 41 18 .. .. .. .. 0.2 Lithuania 6.8
c .. .. .. 93 .. 100 13 8 .. 100 .. .. 0.2 Madagascar 4.9
c 35.5 36.8 33 57 98 96 168 115 57 51 17 27 0.5 Malawi 7.0
c 24.4 18.4 29 55 81 100 221 120 55 54 13 42 14.1 Malaysia 4.4
e .. .. 91 98 101 104 22 12 .. 98 50 .. 0.5 Mali 6.1
c .. 30.1 13 49 57 74 250 217 .. 41 .. 8 1.7 Mauritania 6.2
c .. 30.4 34 47 71 102 133 125 40 57 3 8 0.7 Mexico 4.3
c 13.9 3.4 88 104 97 99 53 35 .. 83 .. 71 0.3 Moldova 7.8
c .. 3.2 .. 98 106 103 37 19 .. 100 .. 68 1.1 Morocco 6.5
c 8.1 9.9 48 84 70 87 89 37 31 63 42 63 0.1 Mozambique 5.4
c .. 21.2 26 42 71 85 235 138 .. 48 .. 17 16.1 Myanmar .. .. 29.6 .. 95 97 101 130 104 .. 68 17 34 1.3

106
of children ratea ol
y skilled staff women of population
5 1,000 of total 15–49 ages 15–49
Eradicate extreme poverty and hunger Achieve
universal Promote gender
equality Improve maternal health Combat HIV/AIDS
Share of poorest quintile in national
Prevalence of
primary
education
Ratio of girls to boys enrolllments
Reduce child mortality
Contraceptive Prevalence rate
and other diseases
consumption or
child malnutrition
income
% b
Primary in primary and Under-five Births attended % of married HIV prevalence
1992–2005 1990 2000–07b
1991 2006 1991 2006 1990 2006 1990 2000–07b
1990 2000–07b
2005
Nepal 6.0c .. 38.8 51 76 59 93 142 59 7 19 23 48 0.5
Netherlands 7.6e .. .. .. .. 97 98 9 5 .. 100 76 .. 0.2
New Zealand 6.4e .. .. 100 .. 100 103 11 6 .. 97 .. .. 0.1
Nicaragua 5.6c .. 7.8 42 73 109 102 68 36 .. 67 .. 69 0.2
Niger 2.6c 41.0 39.9 18 33 53 70 320 253 15 18 4 11 1.1
Nigeria 5.0c 35.1 27.2 .. 76 77 83 230 191 33 36 6 13 3.9
Norway 9.6e .. .. 100 96 102 100 9 4 100 .. 74 .. 0.1
Pakistan 9.1c 39.0 31.3 .. 62 .. 78 130 97 19 31 15 28 0.1
Panama 2.5e .. .. 86 94 .. 101 34 23 .. 91 .. .. 0.9
Papua New Guinea 4.5c .. .. 46 .. 80 .. 94 73 .. 42 .. .. 1.8
Paraguay 2.4e 2.8 .. 68 95 98 99 41 22 66 77 48 73 0.4
Peru 3.7e 8.8 5.2 .. 101 96 101 78 25 80 87 59 46 0.6
Philippines 5.4c .. 20.7 86 94 100 102 62 32 .. 60 36 49 <0.1
Poland 7.4c .. .. 98 97 101 99 18 7 .. 100 49 .. 0.1
Portugal 5.8e .. .. 95 104 103 101 14 5 98 100 .. .. 0.4
Romania 8.2c .. 3.5 96 101 99 100 31 18 .. 98 .. 70 <0.1
Russian Federation 6.1c .. .. .. 94 104 99 27 16 .. 99 34 .. 1.1
Rwanda 5.3c 24.3 18.0 35 35 92 102 176 160 26 39 21 17 3.0
i Saudi Arabia .. .. .. 55 .. 84 .. 44 25 .. 96 .. .. 0.2 Senegal 6.6c .. 14.5 42 49 69 92 149 116 .. 52 .. 12 0.7i Serbia 8.3c,f .. 1.8 .. .. .. .. .. 8 .. 99 .. 41 0.2f Sierra Leone 6.5
c .. 24.7 .. 81k 67 86
k 290 270 .. 43 .. 5 1.6 Singapore 5.0
e .. 3.3 .. .. 95 .. 8 3 .. 100 65 .. 0.3 Slovak Republic 8.8
e .. .. 96 93 .. 100 14 8 .. 100 74 .. <0.1 Somalia .. .. 32.8 .. .. .. .. 203 145 .. 33 1 15 0.9 South Africa 3.5
c .. .. 76 100 104 100 60 69 .. 92 57 60 18.8 Spain 7.0
e .. .. .. 103 104 103 9 4 .. .. .. .. 0.6 Sri Lanka 7.0
c .. 22.8 102 108 102 .. 32 13 .. 96 .. 70 <0.1 Sudan .. .. 38.4 42 47 77 89 120 89 69 49 9 8 1.6 Sweden 9.1
e .. .. 96 .. 102 100 7 3 .. .. .. .. 0.2 Switzerland 7.6
e .. .. 53 88 97 97 9 5 .. 100 .. .. 0.4 Syrian Arab Republic .. .. 8.5 89 115 85 95 38 14 .. 93 .. 58 0.2 Tajikistan 7.8
c .. .. .. 106 .. 88 115 68 .. 83 .. 38 0.1 Tanzania 7.3
c 25.1 16.7 62 85k 97 .. 161 118 53 43 10 26 6.5
Thailand 6.3c .. 7.0 .. .. 97 104 31 8 .. 97 .. 77 1.4
Togo .. 21.2 .. 35 67 59 73 149 108 31 62 34 17 3.2 Tunisia 6.0
c 8.5 .. 74 120 86 104 52 23 69 90 50 63 0.1 Turkey 5.3
c .. 3.5 90 96 81 90 82 26 .. 83 63 71 0.2 Turkmenistan 6.1
c .. .. .. .. .. .. 99 51 .. 100 .. 48 <0.1 Uganda 5.7
c 19.7 19.0 .. 54 82 98 160 134 38 42 5 24 6.4l
Ukraine 9.0c .. 4.1 94 105 .. 99 25 24 .. 100 .. 66 1.4
United Arab Emirates .. .. .. 103 100 104 101 15 8 .. 100 .. .. 0.2 United Kingdom 6.1
e .. .. .. .. 102 102 10 6 .. .. .. 84 0.2 United States 5.4e .. 1.1 .. 95 100 100 11 8 99 99 71 .. 0.6 Uruguay 4.5d,e .. 6.0 94 99 .. 106 23 12 .. 99 .. .. 0.5 Uzbekistan 7.2
c .. 4.4 .. 100 94 98k 74 43 .. 100 .. 65 0.2
Venezuela, R.B. de 3.3e .. .. 43 96 105 103 33 21 .. 95 .. .. 0.7
Vietnam 7.1c .. 20.2 .. .. .. .. 53 17 .. 88 53 76 0.5
i West Bank and Gaza .. .. .. .. 95 .. 104 40 22 .. 99 .. 50 .. Yemen, Rep. 7.2
c .. 41.3 .. 60 .. 66 139 100 16 27 10 23 0.2 Zambia 3.6
c 21.2 23.3 .. 84 .. 93 180 182 51 43 15 34 17.0 Zimbabwe 4.6
c 8.0 14.0 97 .. 92 97 76 105 70 80 43 60 18.1j
World ..w 23.9w 79w 86w ..w 95w 92w 72w 49w 65w 57w 60w 1.0w Low income .. 28.9 49 65 76 88 164 135 33 41 22 33 2.5 Middle income .. 22.9 82 93 86 97 75 49 48 73 61 69 0.7
Lower middle income .. 25.2 83 91 83 96 81 54 44 69 63 69 0.5 Upper middle income .. .. 88 101 99 100 46 26 79 94 50 67 1.6
Low and middle income .. 24.9 77 85 84 94 101 79 45 62 54 60 1.1 East Asia & Pacific .. 13.3 101 98 90 100 56 29 47 87 75 79 0.2 Europe & Central Asia .. .. 90 98 98 97 49 26 81 95 44 63 0.6 Latin America & the .. 5.1 82 100 99 101 55 26 75 88 57 67 0.6
Caribbean Middle East & North .. .. 77 90 79 93 78 42 48 77 42 60 0.1 Africa South Asia
.. 41.3 62 80 70 90 123 83 30 41 40 53 0.7
Sub-Saharan Africa .. 26.8 51 60 82 87 184 157 44 45 15 22 5.8 High income .. .. .. 97 100 99 12 7 .. 99 71 .. 0.4 a. Because of the change from International Standard Classification of Education 1976 (ISCED76) to ISCED97, data before 1998 are not fully comparable with data from 1999 onward.
b. Data are for the most recent year available. c. Refers to expenditure shares by percentiles of population, ranked by per capita expenditure. d. Urban data. e. Refers to income
shares by percentiles of population, ranked by per capita income. f. Includes Montenegro. g. Survey data, 2004. h. Includes Hong Kong, China. i. Survey data 2005. j. Survey data
2005–2006. k. Data are for 2007. l. Survey data, 2004–2005.

107
of annual worker dollars growth $
Table 3 Economic activity
Gross domestic product Agricultural tchr Value added as % of GDP External productivity Household General gov’t. Gross balance of GDP implicit Agricultural value final cons. final cons. capital goods and deflator
expenditure expenditure formation
services Avg. annual Agriculture Industry Services % of GDP % of GDP % of GDP % of GDP % growth
2007 2000–07 1990–92 2003–05 2007 2007 2007 2007 2007 2007 2007 2000–07 Afghanistan 11,627 11.5 .. .. 36 24 39 111 10 28 –49 5.9 Albania 10,569 5.3 778 1,449 23 22 56 90 9 27 –26 3.5 Algeria 135,285 4.5 1,911 2,225 8 61 30 34 12 30 24 8.8 Angola 58,547 13.1 165 174 10 68 22 59 ..
a 14 26 55.3 Argentina 262,331 4.7 6,767 10,072 8 36 56 59 12 24 6 12.3 Armenia 9,177 12.7 1,476
b 3,692 18 44 38 74 9 32 –15 4.2 Australia 821,716 3.3 20,838 29,924 3 28 69 57 18 27 –1 3.7 Austria 377,028 1.9 12,048 22,203 2 31 67 56 18 21 6 1.8 Azerbaijan 31,248 17.2 1,084
b 1,143 6 62 32 32 13 27 27 9.3 Bangladesh 67,694 5.8 254 338 19 29 53 77 6 24 –7 4.3 Belarus 44,771 8.3 1,977
b 3,153 9 40 51 62 20 28 –9 27.6 Belgium 448,560 1.9 21,479 41,631 1 24 75 53 23 22 3 2.0 Benin 5,428 3.8 326 519 32 13 54 78 15 20 –13 2.9 Bolivia 13,120 3.6 670 773 14 32 54 68 13 13 5 6.8 Bosnia and Herzegovina 14,661 5.3 .. 8,270 10 26 64 76 24 18 –18 3.8 Brazil 1,314,170 3.3 1,506 3,126 5 31 64 48 28 22 2 8.5 Bulgaria 39,549 5.7 2,500 7,159 8 33 59 75 12 35 –22 5.0 Burkina Faso 6,767 5.8 110 173 33 22 44 75 22 18 –15 2.2 Burundi 974 2.7 108 70 35 20 45 91 29 17 –37 8.4 Cambodia 8,628 9.8 .. 306 30 26 44 82 3 21 –7 3.8 Cameroon 20,644 3.5 389 646 19 29 52 73 9 17 1 2.2 Canada 1,326,376 2.7 28,243 43,055 .. .. .. 55 19 22 4 2.0 Central African Republic 1,712 0.1 287 381 56 16 28 88 10 9 –7 1.9 Chad 7,085 12.2 173 215 23 44 32 60 6 19 15 8.2 Chile 163,915 4.5 3,600 5,308 4 48 48 55 10 21 14 7.0 China 3,280,053 10.2 254 401 12 48 40 34 14 44 8 3.7
Hong Kong, China 206,706 5.2 .. .. 0 9 91 60 8 21 11 –2.3 Colombia 171,979 4.5 3,405 2,847 11 29 60 63 13 24 –1 6.3 Congo, Dem. Rep. of 8,955 5.0 184 149 42 28 29 82 9 18 –9 31.0 Congo, Rep. of 7,646 4.1 .. .. 5 60 35 29 14 27 30 5.7 Costa Rica 25,225 5.2 3,143 4,499 9 31 60 75 5 27 –7 9.8 Côte d’Ivoire 19,570 0.2 598 795 23 26 51 73 8 10 8 3.1 Croatia 51,277 4.8 4,921
b 9,987 7 32 61 56 20 33 –8 3.7 Czech Republic 168,142 4.5 .. 5,423 3 39 58 48 21 27 3 2.1 Denmark 308,093 1.8 15,190 40,780 2 26 72 49 26 23 3 2.2 Dominican Republic 36,686 4.8 2,268 4,586 12 28 60 80 7 20 –6 17.4 Ecuador 44,184 5.0 1,686 1,676 7 35 58 67 13 21 –1 9.6 Egypt, Arab Rep. of 128,095 4.5 1,528 2,072 13 36 51 75 11 22 –8 6.9 El Salvador 20,215 2.7 1,633 1,638 11 29 60 93 11 16 –21 3.4 Eritrea 1,201 2.3 .. 61 18 24 58 81 42 19 –42 14.8 Ethiopia 19,395 7.5 146 158 46 13 40 84 11 25 –19 6.6 Finland 246,020 3.1 18,822 31,214 3 32 65 51 21 21 7 0.9 France 2,562,288 1.7 22,234 44,017 2 21 77 57 24 21 –1 2.0 Georgia 10,176 8.3 2,443
b 1,790 11 24 65 75 22 29 –26 6.9 Germany 3,297,233 1.1 13,724 26,549 1 30 69 58 18 18 5 1.0 Ghana 15,246 5.5 293 320 36 25 38 78 13 33 –23 19.5 Greece 360,031 4.3 7,668 9,011 3 21 76 68 14 26 –8 3.4 Guatemala 33,432 3.6 2,119 2,350 12 27 60 87 9 20 –16 4.7 Guinea 4,564 2.8 142 190 17 45 38 84 6 13 –2 18.1 Haiti 6,137 0.2 .. .. .. .. .. 91 9 29 –29 16.5 Honduras 12,279 5.3 1,193 1,483 13 28 58 79 15 28 –23 6.2 Hungary 138,182 4.0 4,105 6,987 4 29 66 66 10 22 2 5.1 India 1,170,968 7.8 324 392 18 29 53 55 10 38 –3 4.4 Indonesia 432,817 5.1 484 583 14 47 39 63 8 25 4 10.1 Iran, Islamic Rep. of 270,937 5.9 1,954 2,542 9 42 49 47 14 37 3 16.9 Iraq .. –11.4 .. 1,756 .. .. .. .. .. .. .. .. Ireland 254,970 5.2 .. 17,879 2 36 62 44 16 27 13 3.1 Israel 161,822 3.3 .. .. .. .. .. 56 26 20 –1 1.2 Italy 2,107,481 0.8 11,542 23,967 2 27 71 59 20 21 –1 2.7 Japan 4,376,705 1.7 20,445 35,517 2 30 69 57 18 23 1 –1.2 Jordan 15,832 6.3 1,892 1,360 3 32 65 89 20 26 –35 3.0 Kazakhstan 103,840 10.0 1,795
b 1,557 7 44 49 48 11 31 9 14.3 Kenya 29,509 4.4 333 332 23 19 58 75 16 20 –10 6.0 Korea, Rep. of 969,795 4.7 5,679 11,286 3 39 58 55 15 29 1 1.7 Kyrgyz Republic 3,505 4.0 675
b 979 33 20 47 101 19 17 –37 5.8 Lao PDR 4,008 6.6 360 458 42 32 26 65 9 33 –6 9.4 Lebanon 24,001 3.3 .. 30,099 6 23 71 89 15 12 –16 2.0 Liberia 725 –2.7 .. .. 66 16 18 86 11 16 –14 10.0 Libya 58,333 3.7 .. .. .. .. .. .. .. .. .. 21.0 Lithuania 38,328 8.0 .. 4,703 5 33 61 66 17 30 –12 2.9 Madagascar 7,326 3.3 186 174 27 15 58 81 10 29 –19 11.6 Malawi 3,552 3.2 72 116 34 20 45 71 12 28 –11 21.3 Malaysia 180,714 5.1 3,803 5,126 9 51 41 50 13 23 14 4.8 Mali 6,863 5.4 208 241 37 24 39 76 11 23 –10 3.6 Mauritania 2,644 5.1 574 356 13 47 41 61 20 26 –7 11.3 Mexico 893,364 2.6 2,256 2,792 4 25 71 71 9 23 –2 6.3 Moldova 4,396 6.5 1,286
b 816 17 15 67 97 18 30 –44 11.5 Morocco 73,275 4.9 1,430 1,775 12 29 59 58 16 32 –6 1.1 Mozambique 7,752 8.0 109 153 28 27 45 72 12 24 –8 7.8 Myanmar .. 9.2 .. .. .. .. .. .. .. .. .. 21.2

108
Gross domestic product Agricultural tchr Value added as % of GDP External productivity Household General gov’t. Gross balance of GDP implicit Agricultural value final cons. final cons. capital goods and deflator
Millions of Avg. annual added per worker expenditure expenditure formation
services Avg. annual dollars % growth 2000 $ Agriculture Industry Services % of GDP % of GDP % of GDP % of GDP % growth
2007 2000–07 1990–92 2003–05 2007 2007 2007 2007 2007 2007 2007 2000–07
Nepal 10,207 3.2 191 207 35 16 49 82 9 25 –16 5.6 Netherlands 754,203 1.6 24,914 42,198 2 25 73 47 25 20 8 2.1 New Zealand 129,372 3.2 19,204 25,109 .. .. .. 60 18 25 –3 2.4 Nicaragua 5,676 3.5 .. 2,071 20 30 51 92 9 29 –30 7.6 Niger 4,170 3.9 152 157
b .. .. .. 75 12 23 –9 2.1 Nigeria 165,690 6.7 .. .. 33 39 28 .. .. .. 9 17.8 Norway 381,951 2.5 19,500 37,776 2 45 54 41 19 22 18 4.0 Pakistan 143,597 5.8 593 695 20 27 54 75 10 23 –8 6.5 Panama 19,740 6.0 2,363 3,914 7 16 77 71 7 23 –1 1.8 Papua New Guinea 6,261 2.4 500 595 36 45 19 47 12 20 21 7.2 Paraguay 12,004 3.3 1,596 2,052 26 20 54 74 9 21 –4 10.6 Peru 109,088 5.4 930 1,498 6 35 59 63 9 20 8 3.8 Philippines 144,129 5.1 905 1,075 14 31 55 80 10 15 –5 5.1 Poland 420,321 4.1 1,502
b 2,182 4 30 66 63 17 22 –1 2.4 Portugal 220,241 0.8 4,612 5,980 3 25 72 65 21 22 –8 3.0 Romania 165,980 6.1 2,196 4,646 8 26 65 77 14 22 –13 18.0 Russian Federation 1,291,011 6.6 1,825
b 2,519 5 39 57 50 17 25 8 16.7 Rwanda 3,320 5.8 168 182 36 14 50 85 11 22 –18 9.7 Saudi Arabia 381,683 4.1 7,875 15,780 3 65 32 28 23 22 27 8.1 Senegal 11,151 4.5 225 215 15 22 63 76 10 32 –18 2.2 Serbia 41,581 5.5 .. .. 13 26 62 73 22 25 –20 19.5 Sierra Leone 1,672 11.2 .. .. 44 24 32 84 13 17 –14 8.9 Singapore 161,347 5.8 22,695 40,419 0 31 69 38 10 23 29 1.0 Slovak Republic 74,932 6.0 .. 5,026 3 37 60 55 18 27 0 3.9 Somalia .. .. .. .. .. .. .. .. .. .. .. .. South Africa 277,581 4.3 1,786 2,484 3 31 66 64 20 20 –4 6.6 Spain 1,429,226 3.4 9,511 19,030 3 30 67 58 18 31 –6 4.0 Sri Lanka 32,354 5.3 679 702 12 30 58 68 15 27 –10 10.0 Sudan 47,632 7.1 418 666 32 28 41 68 14 24 –6 9.6 Sweden 444,443 2.8 21,463 33,023 1 29 70 47 27 18 8 1.5 Switzerland 415,516 1.6 22,344 23,418 1 28 70 60 11 22 7 0.9 Syrian Arab Republic 38,081 4.5 2,344 3,261 20 32 48 71 12 16 2 6.2 Tajikistan 3,712 8.8 397
b 465 21 28 51 113 9 23 –45 20.5 Tanzania
c 16,181 6.7 238 295 45 17 37 73 16 17 –6 9.0 Thailand 245,818 5.4 497 621 11 44 45 57 10 30 4 2.9 Togo 2,493 2.6 312 347 43 23 34 85 10 18 –13 0.8 Tunisia 35,020 4.8 2,422 2,719 11 27 62 64 13 23 0 2.7 Turkey 657,091 5.9 .. 1,846 9 28 63 71 12 22 –5 18.8 Turkmenistan 12,933 .. 1,222
b .. .. .. .. 46 13 23 17 .. Uganda 11,214 5.7 184 229 29 18 53 80 14 24 –19 6.2 Ukraine 140,484 7.6 1,195
b 1,702 7 32 61 66 15 22 –4 14.0 United Arab Emirates 129,702 8.2 10,454 25,841 2 56 42 46 11 24 18 4.9 United Kingdom 2,727,806 2.6 22,659 26,933 1 24 75 64 22 18 –4 2.6 United States 13,811,200 2.7 20,793 41,797 1 23 76 71 16 19 –6 2.6 Uruguay 23,087 3.3 5,714 7,973 9 32 59 73 11 18 –2 9.4 Uzbekistan 22,308 6.2 1,272
b 1,800 24 27 49 54 16 20 10 26.5 Venezuela, R.B. de 228,071 4.7 4,483 6,292 .. .. .. 48 11 24 17 26.8 Vietnam 71,216 7.8 214 305 20 42 38 67 6 35 –8 6.7 West Bank and Gaza 4,007 0.4 .. .. .. .. .. 96 33 23 –52 3.0 Yemen, Rep. of 22,523 4.0 271 328
b .. .. .. .. .. .. .. 13.5 Zambia 11,363 –5.7 159 204 22 38 40 59 10 24 6 18.3 Zimbabwe 3,418 –4.4 240 222 19 24 57 72 27 17 –16 232.0 World 54,347,038t 3.2w 730w 911w 3w 28w 69w 61w 17w 22w 0w Low income 810,300 5.6 259 321 25 28 48 74 9 24 –6 Middle income 13,342,194 6.2 454 654 8 32 59 60 15 25 0 Lower middle income 6,888,343 8.0 370 509 13 41 46 49 13 35 3 Upper middle income 6,450,429 4.3 2,134 2,954 5 31 64 59 17 23 1 Low and middle income 14,155,882 6.2 417 583 10 32 59 61 15 25 –1 East Asia & Pacific 4,438,135 8.9 303 446 12 47 41 41 13 38 7 Europe & Central Asia 3,155,221 6.1 1,588 2,109 7 33 60 61 16 24 –1 Latin America & the 3,444,374 3.6 2,155 3,053 5 29 66 60 17 22 1 Caribbean
Middle East & North
Africa
828,691 4.5 1,583 2,205 11 35 53 62 14 26 –1
South Asia 1,438,594 7.3 335 406 18 29 53 59 10 35 –4 Sub-Saharan Africa 842,914 5.0 246 281 15 32 54 67 16 21 –3
High income 40,197,253 2.4 14,586 25,456 2 26 72 62 18 21 –1 a. Data on general government final consumption expenditure are not available separately; they are included in household final consumption expenditure. b. Data for all three
years are not available. c. Data refer to mainland Tanzania only.

109
Table 4 Trade, aid, and finance
Merchandise trade
Manufactured High technology
Domestic
Exports Imports
exports
% of total
exports
% of
Current account
Foreign direct investment
Official development
External debt
Present
credit provided by banking
$ millions $ millions
merchandise exports
manufactured exports
balance
$ millions
net inflows
$ millions assistance
a
$ per capita Total $
millions value % of
GNI
sector
% of GDP Net migration
thousands
2007 2007 2006 2006 2007 2006 2006 2006 2006 2007 2000–05b
Afghanistan 480 2,950 .. .. .. .. .. 1,771 18d
0 1,112 Albania 1,072 4,196 27 13 –671 325 101 2,340 21 64 –110 Algeria 59,518 27,439 1 2 .. 1,795 6 5,583 5 –3 –140 Angola 38,100 11,400 .. .. 10,690 –38 10 9,563 33 2 175 Argentina 55,933 44,780 32 7 7,210 4,840 3 122,190 68 29 –100 Armenia 1,219 3,282 56 1 –571 343 71 2,073 29 12 –100 Australia 141,079 165,331 23 12 –56,783 26,599 .. .. .. 142 593 Austria 162,204 161,800 80 13 12,031 157 .. .. .. 124 180 Azerbaijan 9,300 6,050 8 2 9,019 –584 24 1,900 12 18 –100 Bangladesh 12,360 18,470 92 0 1,196 697 8 20,521 22 59 –500 Belarus 24,339 28,674 50 3 –2,944 354 7 6,124 17 27 .. Belgium 432,327 415,752 77 8
c 8,254 61,990 .. .. .. 114 180
Benin 590 1,110 9 0 –226 63 43 824 12d 9 99 Bolivia 4,485 3,446 7 4 1,319 240 62 5,292 20
d 54 –100
Bosnia and Herzegovina 4,155 9,726 62 3 –1,939 423 126 5,669 43 56 115 Brazil 160,649 126,581 51 12 1,460 18,782 0 194,150 26 96 –229
Bulgaria 18,450 30,034 53 6 –8,592 5,172 .. 20,925 74 59 –43 Burkina Faso 660 1,700 8 10 .. 26 61 1,142 11
d 12 100
Burundi 55 350 6 4 –135 0 51 1,411 105 38 192
Cambodia 4,400 5,300 97 0 –506 483 37 3,527 48 13 10
Cameroon 3,750 3,760 3 3 .. 309 93 3,171 4d
6 6
Canada 418,493 389,670 56 15 12,815 69,068 .. .. .. 166 1,041
Central African Republic 195 230 36 0 .. 24 31 1,020 53d
18 –45
Chad 3,450 1,500 .. .. .. 700 27 1,772 23d
0 219
Chile 68,296 46,108 11 7 7,200 7,952 5 47,977 42 90 30
China 1,217,939e
955,845 92e
30 249,866 78,095 1 322,845 14 136 –1,900 Hong Kong, China 349,663 370,733 91 11 27,405 42,891 .. .. .. 126 300
Colombia 29,360 32,897 37 4 –5,851 6,463 22 39,698 32 50 –120
Congo, Dem. Rep. of 2,600 2,950 .. .. .. 180 34 11,201 119d
5 –237
Congo, Rep. of 6,100 2,900 .. .. 903 344 69 6,130 108d
–10 –10
Costa Rica 9,367 12,955 65 45 –1,499 1,469 5 6,832 35 48 84
Côte d’Ivoire 8,400 6,100 15 42 –146 315 13 13,840 72d
21 –339 Croatia 12,360 25,830 66 10 –4,412 3,376 45 37,480 93 83 100 Czech Republic 122,414 117,980 89 14 –4,586 6,021 .. .. .. 55 67 Denmark 103,307 99,375 65 20 4,279 3,343 .. .. .. 207 46 Dominican Republic 6,700 13,100 .. .. –2,231 1,183 6 8,905 35 54 –148 Ecuador 13,751 13,565 10 8 1,503 271 14 16,536 52 19 –400 Egypt, Arab Rep. of 16,201 27,064 21 1 2,635 10,043 12 29,339 28 91 –525
El Salvador 3,980 8,677 55 3 –855 204 23 9,136 55 46 –143
Eritrea 15 515 .. .. .. 4 28 800 49d
139 229
Ethiopia 1,290 5,320 .. .. –1,786 364 25 2,326 8d
47 –140 Finland 89,656 81,145 81 22 11,402 5,311 .. .. .. 85 33 France 552,193 613,224 79 21 –30,567 81,045 .. .. .. 123 722 Georgia 1,240 5,217 48 16 –1,931 1,060 81 1,964 22 32 –248
Germany 1,326,521 1,059,439 83 17 150,746 43,410 .. .. .. 126 1,000 Ghana 4,320 7,980 31 0 –1,040 435 51 3,192 21
d 33 12
Greece 23,574 75,553 52 11 –29,565 5,401 .. .. .. 95 154
Guatemala 6,926 13,578 35 3 –1,592 354 37 5,496 18 42 –300
Guinea 1,100 1,190 .. .. .. 108 18 3,281 58d
16 –425
Haiti 550 1,550 .. .. 1 160 62 1,189 22d
25 –140
Honduras 2,160 6,760 21 1 –195 385 84 4,076 25d
51 –150 Hungary 94,160 94,792 84 24 –7,421 6,098 .. 107,677 100 75 65 India 145,228 216,682 70 5 –9,415 17,453 1 153,075 15 63 –1,350 Indonesia 118,163 91,715 45 13 11,009 5,580 6 130,956 45 41 –1,000 Iran, Islamic Rep. of 83,000 45,000 10 6 .. 901 2 20,113 10 48 –1,250 Iraq 36,400 29,020 .. .. .. .. .. .. .. .. –375 Ireland 121,068 81,678 85 34 –12,695 –882 .. .. .. 199 188 Israel 54,065 58,950 82 14 4,994 14,302 .. .. .. 76 115 Italy 491,532 504,591 85 7 –51,032 38,884 .. .. .. 129 1,125 Japan 712,839 620,967 91 22 210,490 –6,784 .. .. .. 294 270 Jordan 5,760 13,310 71 1 –1,909 3,219 105 8,000 58 124 130 Kazakhstan 46,540 32,940 13 21 –7,184 6,143 11 74,148 132 41 –200 Kenya 4,140 9,210 26 3 –526 51 26 6,534 26 34 25
Korea, Rep. of 371,554 356,648 89 32 5,954 3,645 .. .. .. 110 –80 Kyrgyz Republic 1,105 2,475 46 3 –234 182 60 2,382 52
d 15 –75
Lao PDR 980 1,400 .. .. .. 187 63 2,985 87 8 –115 Lebanon 3,574 12,251 70 2 –2,046 2,794 174 23,963 116 190 .. Liberia 157 490 .. .. –138 –82 75 2,674 1,128
d 92 –119
Libya 45,000 8,600 .. .. 22,170 .. 6 .. .. –70 10
Lithuania 17,173 24,116 58 8 –3,218 1,812 .. 18,955 79 61 –30
Madagascar 1,190 2,590 41 1 –554 230 39 1,453 13d
9 –5
Malawi 670 1,380 13 11 .. 30 49 850 6d
16 –30
Malaysia 176,211 146,982 74 54 28,931 6,064 9 52,526 39 117 150
Mali 1,620 2,000 10 4 –231 185 69 1,436 15d
15 –134
Mauritania 1,360 1,510 0 .. .. –3 62 1,630 93d
.. 30 Mexico 272,044 296,578 76 19 –1,993 19,222 2 160,700 21 43 –3,983 Moldova 1,370 3,720 31 5 –695 242 60 2,416 65 40 –250
Morocco 14,646 31,468 68 10 1,851 2,699 34 18,493 30 92 –550
Mozambique 2,650 3,210 5 2 –634 154 77 3,265 12d
10 –20 Myanmar 5,350 3,250 .. .. 802 279 3 6,828 47 28 –99

110
Merchandise trade
Manufactured High technology Domestic
Exports Imports
exports
% of total
exports
% of
Current account
Foreign direct investment
Official development
External debt
Present
credit provided by banking
$ millions $ millions
merchandise exports
manufactured exports
balance
$ millions
net inflows
$ millions assistance
a
$ per capita Total $
millions value % of
GNI
sector
% of GDP Net migration
thousands
2007 2007 2006 2006 2007 2006 2006 2006 2006 2007 2000–05b
Nepal 888 2,904 .. .. 6 –7 19 3,409 27d
49 –100 Netherlands 550,636 490,582 66 28 50,706 7,197 .. .. .. 208 110
New Zealand 26,950 30,890 27 11 –10,233 7,941 .. .. .. 152 102
Nicaragua 1,210 3,510 9 7 –855 282 132 4,391 30d
74 –210
Niger 650 970 15 11 –312 20 29 805 8d
7 –29 Nigeria 66,500 27,500 .. .. 24,202 5,445 79 7,693 9 4 –170 Norway 139,424 80,347 16 19 64,070 4,653 .. .. .. .. 84 Pakistan 17,457 32,598 81 1 –8,253 4,273 14 35,909 26 46 –1,239 Panama 1,200 7,010 10 0 –1,577 2,574 9 9,989 77 88 8 Papua New Guinea 4,610 2,950 .. .. 640 32 45 1,675 35 23 .. Paraguay 3,374 7,280 16 8 –217 189 9 3,426 43 20 –45 Peru 27,956 20,185 14 2 2,589 3,467 17 28,174 42 16 –510 Philippines 50,276 57,160 87 68 5,897 2,345 7 60,324 57 41 –900 Poland 137,609 160,804 79 4 –15,794 19,198 .. 125,831 41 47 –200 Portugal 50,994 77,050 74 9 –18,281 7,366 .. .. .. 174 276 Romania 40,257 69,712 79 4 –23,136 11,394 .. 55,114 58 36 –270
Russian Federation 355,177 223,059 17 9 78,310 30,827 .. 251,067 34 25 917 Rwanda 165 600 .. .. –147 11 62 419 8
d 9 43
Saudi Arabia 228,550 94,235 8 1 99,066 660 1 .. .. 18 285
Senegal 1,650 4,250 44 6 .. 58 68 1,984 14d
25 –100
Serbia 8,780 18,295 .. 4 .. 5,128 214 13,831 52 30 –339
Sierra Leone 260 420 .. .. –101 59 63 1,428 10d
10 472
Singapore 299,271e
263,150 80e
58 36,326 24,191 .. .. .. 81 200 Slovak Republic 58,082 60,103 85 6 .. 4,165 .. 27,085 58 52 3
Somalia .. .. .. .. .. 96 46 2,836 .. .. 100 South Africa 69,788 90,990 53
f 6 –20,631 –120 15 35,549 15 89 75
Spain 241,962 373,585 76 6 –145,275 20,167 .. .. .. 194 2,846
Sri Lanka 7,750 10,840 70 2 –1,334 480 40 11,446 40 47 –442
Sudan 8,160 8,450 0 1 –4,722 3,534 55 19,158 77d
0 –532 Sweden 168,223 150,039 78 16 28,413 27,299 .. .. .. 135 152 Switzerland 171,621 160,798 91 22 72,354 27,185 .. .. .. 194 100 Syrian Arab Republic 11,330 14,820 32 1 920 600 1 6,502 23 33 200
Tajikistan 1,468 2,455 .. .. –21 339 36 1,154 36 15 –345 Tanzania 2,005 5,337 18 0 –1,442 474 46 4,240 16
d,g 13 –345
Thailand 152,469 141,347 76 27 14,921 9,010 –3 55,233 30 96 231
Togo 690 1,450 58 0 –461 57 12 1,806 68d
22 –4 Tunisia 15,029 18,980 75 4 –634 3,270 43 18,480 66 72 –29 Turkey 107,154 169,987 42 .. –32,774 20,070 8 207,854 61 49 –30
Turkmenistan 8,920 4,460 .. .. .. 731 5 881 11 .. –10 Uganda 1,530 3,350 21 34 –745 392 52 1,264 6
d 9 –5
Ukraine 49,100 60,440 73 3 –5,927 5,604 10 49,887 58 62 –173 United Arab Emirates 154,000 121,100 .. .. .. .. .. .. .. 59 577 United Kingdom 435,615 617,178 77 34 –115,243 139,745 .. .. .. 194 948 United States 1,163,183 2,016,978 79 30 –738,641 180,580 .. .. .. 240 6,493 Uruguay 4,480 5,480 32 3 –186 1,346 6 9,804 66 25 –104 Uzbekistan 8,040 4,470 .. .. .. 164 6 3,892 26 .. –300 Venezuela, R.B. de 69,165 48,591 5 2 20,001 –543 2 44,635 34 23 40 Vietnam 48,387 60,830 50 5 –6,992 2,315 22 20,202 33 96 –200 West Bank and Gaza .. .. .. .. .. .. 384 .. .. 9 11
Yemen, Rep. of 7,160 5,890 1 5 206 1,121 13 5,563 25 10 –100
Zambia 4,876 4,014 6 2 –505 575 122 2,325 9d
17 –82
Zimbabwe 2,050 2,420 38 2 .. 40 21 4,677 110 93 –75
World 13,899,267t 14,107,100t 74w 20w 1,352,442s 16w ..s 167w ..wh
Low income 230,215 251,819 .. .. 20,380 35 201,382 30 –2,858 Middle income 3,919,104 3,641,914 60 20 334,242 9 2,642,418 77 –15,770
Lower middle income 2,179,289 1,947,080 69 25 162,047 9 1,080,416 102 –11,295 Upper middle income 1,738,728 1,690,142 52 16 172,195 7 1,562,002 55 –4,475
Low and middle income 4,149,329 3,893,700 60 20 354,621 19 2,843,800 75 –18,629 East Asia & Pacific 1,783,695 1,475,731 80 33 104,972 4 659,985 119 –3,847 Europe & Central Asia 874,122 935,854 39 8 114,318 14 912,265 38 –1,798 Latin America & the
Caribbean Middle East & North
Africa
750,092 732,907 53 12 70,457 12 734,499 63 –6,811 297,678 234,252 19 5 26,551 54 136,499 49 –2,618
South Asia 184,991 286,021 72 4 22,916 6 227,303 60 –2,484 Sub-Saharan Africa 261,373 237,971 .. .. 15,408 52 173,248 48 –1,070
High income 9,752,088 10,219,990 77 21 997,821 0.1 196 18,522
a. The distinction between official aid, for countries on the Part II list of the OECD Development Assistance Committee (DAC), and official development assistance was dropped in
2005. Regional aggregates include data for economies not listed in the table. World and income group totals include aid not allocated by country or region. b. Total for the 5-year
period. c. Includes Luxembourg. d. Data are from debt sustainability analysis undertaken as part of the Heavily Indebted Poor Countries (HIPC) initiative. e. Includes re-exports.
f. Data on total exports and imports refer to South Africa only. Data on export commodity shares refer to the South African Customs Union (Botswana, Lesotho, Namibia, and South
Africa). g. GNI refers to mainland Tanzania only. h. World total computed by the UN sums to zero, but because the aggregates shown here refer to World Bank definitions, regional
and income group totals do not equal zero.

111