africa regional data cube pilot use cases report: …
TRANSCRIPT

AFRICA REGIONAL DATA CUBE PILOT USE CASES REPORT:
SENEGAL
March 2020

To address data gaps in monitoring and achieving the Sustainable Development Goals (SDGs) in the environmental sector, key stakeholders in Senegal, led by Direction de la Planification et de la Veille Environnementale (DPVE) of the Ministry of Environment and Sustainable Development and Initiative Prospective Agricole et Rural (IPAR), developed a national coordination and collaboration mechanism called the Technical Group of Stakeholders Platform for the Monitoring of SDGs of the Environment Sector (GTPODE). The GTPODE is part of a national stakeholders’ platform for monitoring the SDGs, which was launched in 2018 and builds on ongoing efforts to strengthen data since 20161. The Global Partnership for Sustainable Development Data (Global Partnership), with support from the Islamic Development Bank (IsDB), intentionally leveraged this existing mechanism through advice from country partners to test the feasibility of using alternative data sources to fill environment data gaps, particularly by piloting the Africa Regional Data Cube (ARDC). The ARDC is a technological innovation that layers 17+ years of satellite imagery and Earth observation data and makes it available through both an online user interface and Jupyter notebooks, in analysis-ready formats.
The GTPODE collaboratively identified eight SDG indicators with which to test the ARDC’s applicability in producing timely data and insights:
The Global Partnership facilitated engagement sessions that helped strengthen the governance infrastructure, use case development processes, and technical capacity building in the use of Earth observation (EO) data and the ARDC. The technical capacity building activities involved a series of four in-person trainings between April and September 2019, including one session with a partner scientist from the National Aeronautics and Space Administration (NASA), as well as ongoing virtual technical support on the identified use cases from the Global Partnership’s GIS Manager, NASA partners, and targeted connections to other relevant EO specialists. Three of the trainings were national trainings held in Dakar and one was a sub-regional training facilitated by NASA, which brought together users from the three West African ARDC countries – Senegal, Ghana, and Sierra Leone – to share experiences and learnings. Results from feedback surveys administered after each of the in-country training sessions showed that 92 percent of respondents acquired valuable information, with 78 percent reporting that they acquired valuable skills. In addition, 94 percent of respondents rated their experience as good, very good, or excellent.
The progress and results from the pilot phase demonstrate that the ARDC is a useful tool and data source for some indictors. In addition, the process highlighted that the collaborative approach to using a new tool and data source is effective in harmonizing expectations and activities across stakeholders and building buy-in. Key benefits include increased timelines of data collection and analysis, time and cost savings through better targeting of ground work, and standardization of approach and methodology across relevant stakeholders. Additionally, the activities highlighted that while the ARDC has limitations in addressing some indicators, there is interest in exploring how these could be addressed. Key areas for continued focus and support moving forward are technical capacity building and validation of results.
INTRODUCTION
• 2.4.1 – Proportion of agricultural area under productive and sustainable agriculture
• 6.3.2 – Proportion of bodies of water with good ambient water quality
• 6.6.1 – Change in the extent of water-related ecosystems over time
• 4.5.1 – Coverage of protected areas in relation to marine areas (exclusive economic zones)• 11.3.1 – Ratio of land consumption rate to population growth rate• 15.1.1 – Forest area as a percentage of total land area • 15.2.1 – Progress towards sustainable forest management • 15.3.1 – Proportion of land that is degraded over total land area
1 Refer to the Capitalization Report produced by IPAR for more details about the governance mechanisms and processes relating to the national stakeholders’ platform for monitoring the SDGs and the GTPODE.
| 01
PROGRESS TO-DATE
| 02INTRODUCTION
The eight indicators selected were structured into six unique use cases – indicators 6.3.2 and 6.6.1 and indicators 15.1.1 and 15.2.1 were grouped respectively. Of the six use cases, one demonstrated impact through data use (2.4.1), two demonstrated significant results and potential for use after validation (15.1.1/15.2.1 and 6.3.2/6.6.1), two faced technical limitations (11.3.1 and 14.5.1), and one was not pursued because it was already being addressed with another data source (15.3.1).
Work on this use case focused on the agriculture productivity component of the indicator. ARDC data, in combination with other data sources, and partial UN proposed methodology was used to test indicator calculation. While the indicator calculation approach is yet to be validated and requires further alignment with the UN proposed methodology to incorporate the sustainability components of the indicator, data accessed and analyzed using the ARDC through this process has been used to inform several agriculture data-related insights and decisions.
In testing the utility of the ARDC to inform indicator 2.4.1, it was used as a complementary data source to strengthen the agricultural campaign and specifically make Senegal’s agricultural survey more efficient. The ARDC was used to spatially identify areas being used for agricultural activity nation-wide, across all 45 departments and more accurately identify target areas for survey data collection. By allowing technicians in the office to pre-identify agriculturally productive areas, the sampling for the agriculture survey was more accurate and ensured that enumerators did not find themselves being deployed to areas that were no longer agriculturally productive. Previously, field deployment was based on data from the last agriculture survey, which by nature was not up-to-date information. Using traditional data collection methods, the agriculture survey data collection process took about five months. However, with the use of EO data, the process took only two months, making it much more time and cost-efficient.
The agriculture commercialization campaign in Senegal is directly influenced by the data collected through agriculture surveys. For example, the price of groundnuts is determined based on the productivity data and projections generated through the agriculture campaign data. Senegal is one of the main groundnut producers globally, making data on groundnut production an important focus area for policymakers and farmers. The productivity data informs the projection of groundnut supply within the country, which in turn informs the price the government sets. This process kicks off the commercialization campaign, which is the period farmers sell the most products. In the past, this process is often started in March or later, well after the yield period of groundnuts ending around November. This is because of the amount of time it takes to generate the relevant data through the agriculture surveys. However, with the use of EO data, the productivity estimates were generated faster, enabling the commercialization campaign to start in December or January. Assuming that the agriculture commercialization campaign directly affects farmers’ sales, the availability of timely productivity data could mean that farmers are able to make sales and see profits earlier.
In addition, the timely data generated through the ARDC, in combination with other traditional data on agriculture productivity was used to identify regions that were at high risk for low or no agricultural productivity. Climate change has had severe impacts in Senegal including low, delayed, or no rainfall. Two specific areas that were identified as high-risk areas were Matam in the northeast and Baba Garage in the west. This information was shared with relevant stakeholders such as the Ministry of Agriculture and CILLS (Permanent Interstate Committee for Drought Control
Agriculture Productivity 2.4.1: Proportion of agricultural area under productive and sustainable agriculture
PROGRESS TO DATE
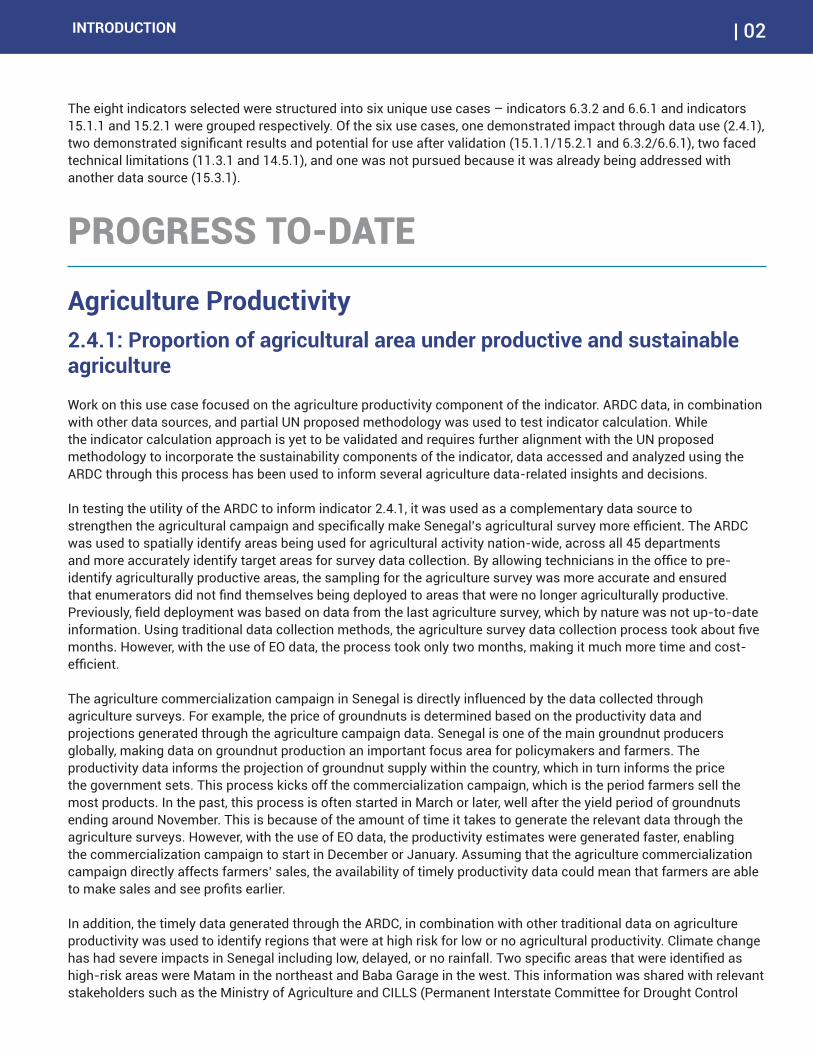
Figure 1: Deforestation in Kolda Region. Areas in RED have experienced deforestation
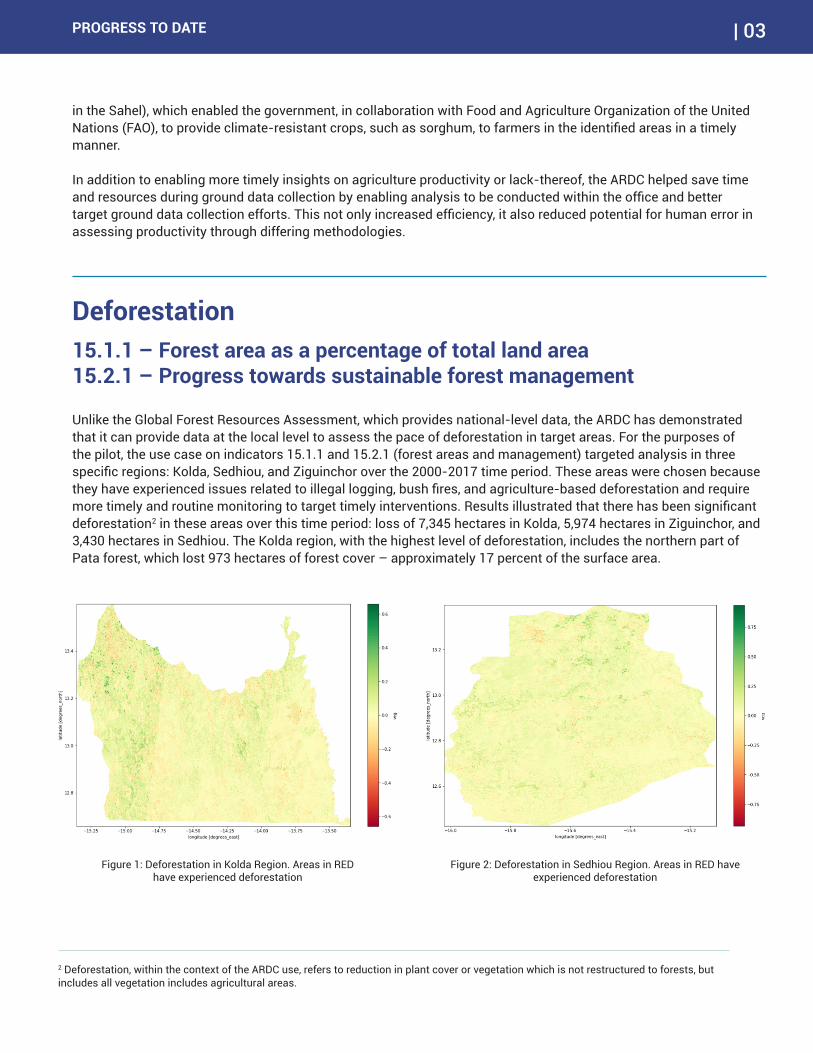
Figure 2: Deforestation in Sedhiou Region. Areas in RED have experienced deforestation
| 03
in the Sahel), which enabled the government, in collaboration with Food and Agriculture Organization of the United Nations (FAO), to provide climate-resistant crops, such as sorghum, to farmers in the identified areas in a timely manner.
In addition to enabling more timely insights on agriculture productivity or lack-thereof, the ARDC helped save time and resources during ground data collection by enabling analysis to be conducted within the office and better target ground data collection efforts. This not only increased efficiency, it also reduced potential for human error in assessing productivity through differing methodologies.
Unlike the Global Forest Resources Assessment, which provides national-level data, the ARDC has demonstrated that it can provide data at the local level to assess the pace of deforestation in target areas. For the purposes of the pilot, the use case on indicators 15.1.1 and 15.2.1 (forest areas and management) targeted analysis in three specific regions: Kolda, Sedhiou, and Ziguinchor over the 2000-2017 time period. These areas were chosen because they have experienced issues related to illegal logging, bush fires, and agriculture-based deforestation and require more timely and routine monitoring to target timely interventions. Results illustrated that there has been significant deforestation2 in these areas over this time period: loss of 7,345 hectares in Kolda, 5,974 hectares in Ziguinchor, and 3,430 hectares in Sedhiou. The Kolda region, with the highest level of deforestation, includes the northern part of Pata forest, which lost 973 hectares of forest cover – approximately 17 percent of the surface area.
Deforestation15.1.1 – Forest area as a percentage of total land area 15.2.1 – Progress towards sustainable forest management
2 Deforestation, within the context of the ARDC use, refers to reduction in plant cover or vegetation which is not restructured to forests, but includes all vegetation includes agricultural areas.

While the results are yet to be validated with ground or field data, the initial results have highlighted significant rates of deforestation over between 2000 and 2017 and demonstrated the benefits of accessing timely data. In particular, the access to timely and historical data on deforestation will not only allow users to observe the rate of deforestation but will also allow them to better understand specific drivers of deforestation in a timely manner and enable appropriate updates on forest management practices. The Forest Risk Assessment Report is generally completed every five years, which requires significant data collection and collation across relevant stakeholders, including inputs from the Forest Inventory. In addition to generating the data, the process involves time and effort in comparing information as stakeholders sometimes use different definitions and methods for similar factors of interest. Due to the high cost of field surveys and financial constraints, the last inventory was completed in 2004.
Time and cost savings are two main benefits of using EO data to monitor and understand deforestation, particularly as a result of accessing analysis-ready data. Without the ARDC, it would have taken at least three months to obtain the results and analysis presented above. This is because it would have involved either manual mapping activities through ground/field surveys or time and personnel investment in looking for the appropriate satellite images/EO data, identifying the analytical software, and bringing the various elements together to obtain insights. Given the additional technical capacity necessary to conduct each of these steps, manual/ground mapping was preferred. One of the other ways in which deforestation at the local level is currently estimated is through analysis of administrative records documenting criminal charges against illegal logging. This is done through ground patrolling staff who manually document the amount of wood cut per incident. One of the challenges, in both cases, is that ground data collection on forest cover or deforestation can only cover a small sample of total area due to resource constraints. This takes anywhere from several weeks to many months depending on the size of the area to be covered. With tools like the ARDC, users are able to access data across regions as well as specific parts of forests to better target ground data collection efforts. In addition, the collaborative approach undertaken for this and the other use cases ensured that relevant stakeholders agreed on the tool and methodology, enabling harmonization across stakeholders and agreement (post-validation) on results.
Work on the 2025 Forest Risk Assessment Report will begin soon and includes plans to use data generated through the ARDC. In particular, EO data will be used to obtain localized results that will inform targeting of field data collection, reducing the time and cost involved in planning and field execution, thus increasing accuracy of targeted areas. This highlights the utility of this data for not only SDG indicator calculation, but also for more routine forest management activities.
PROGRESS TO DATE
Figure 3: Deforestation in Ziguinchor Region. Areas in RED have experienced deforestation
| 04

PROGRESS TO DATE | 05
Lake Guiers, located in northern Senegal, is the primary source of fresh water for Dakar, with about 40 percent of the city’s water coming from it. The lake is surrounded by fertile shores. The north shore is primarily used for growing sugar cane irrigated by water from the lake. The cane is grown in close proximity to other supply chain actors in the sugar industry such as refineries. Given the strategic importance of the lake, it was identified as a good use case to test the utility of the ARDC in providing water quality and water extent insights.
Analysis was conducted on a subsection of the lake and indicated that the overall water extent decreased by 1.203 percent between 2014 and 2018. As the images below highlight, analysis illustrated the variations in water extent each year, as well as the net change over that time period, which can be attributed to extreme weather events and farming around the lake. Spatial imagery helps understand what the changes are and where they are. Similarly, analysis indicated areas with water quality issues through the presence of particles (total suspended matter) and chlorophyll in the water. This information is useful in assessing the amount of water available for the year and informing the need for mitigation strategies if there are indications of water shortage. In addition, routine and timely water quality insights can help identify contamination hotspots, efficiently investigate causes, and rapidly undertake mitigation strategies.
Similar to the other use cases, one of the main benefits of using EO data to measure water extent and quality are time and cost savings. For example, ground measurements of water extent at any given time, would take at least two days to cover the area of the lake. In addition to generating this data on a routine basis, it would involve additional time to conduct the analysis. With the ARDC, it takes approximately half a day to generate water quality and quantity insights. In addition to the ability to observe incremental changes in a timely manner, it was noted that the ARDC also allows access to difficult-to-reach areas through ground data collection methods.
Once the initial results have been validated with ground data, the analysis will be expanded to cover the full lake. However, one of the issues observed with this use case was the inability of the water quality algorithm to provide additional details on the presence of chemicals in the water. For example, traditional water quality testing methods
Water extent and quality6.6.1 – Change in the extent of water-related ecosystems over time6.3.2 – Proportion of bodies of water with good ambient water quality
Figure 4: Water extent in Lake Guiers from 2014 (baseline on the Left) to 2018 (analysis on the right)
Figure 5: Combined Water extent in Lake Guiers from 2014 (baseline) to 2018 (analysis)

| 06
Figure 6: Vegetation loss in the Point of Sangomar
include chemical testing on the pH levels, level of oxygen dissolved, and other similar characteristics. It is worth noting that EO data, by nature of being a spatial data source or imagery-based, faces limitations in providing water chemical content analysis. While these elements are necessary for a full package picture of water quality, the ARDC provides general insights on the presence of observable pollutants to highlight hotspots for further investigation and is useful as a complementary data source.
The use cases on marine protected areas and urbanization both faced technical challenges that indicated that the ARDC, in its current iteration, is not the most effective tool to provide relevant insights. In particular, both use cases highlighted the need for specific distinctions between factors of interest that are not observable through current ARDC data.
For the use case on marine protected areas, the Point of Sangomar, the biggest marine protected area, was selected. However, during analysis, users found that the data could not differentiate between marine water and ground/inland water. This distinction is necessary for the indicator and for insights relevant to the economic zone. Given this obstacle, no further progress was made on this indicator. However, users were interested in using the tool to conduct other types of analysis including detecting water pollution in the sea and collecting data about the coverage of interior water bodies in coastal regions. Assessing sea water quality in and around marine protected areas is of particular interest as blocs of offshore petroleum have been erected in front of marine protected areas and will soon be used for offshore oil exploration. In addition, insights on the coverage of interior water bodies, including changes in mangrove ecosystems are of interest given climate change and sustainable biodiversity conservation mandates.
Marine protected areas and Urbanization14.5.1 – Coverage of protected areas in relation to marine areas (exclusive economic zones)11.3.1 – Ratio of land consumption rate to population growth rate
Users anticipate both time and cost savings if the ARDC can be effectively leveraged for these insights. For example, it was noted that using traditional data collection methods in the field, it cost approximately 3 million Franc CFA for data collection in two marine protected areas to assess sea water quality. With good internet connection, it takes an estimated 30 to 40 minutes to run results for a 5 km2 area. As such, despite limitations in gleaning insights on this specific indicator, users see potential for the use of ARDC in their work.
In addition, land change analysis for Point of Sangomar highlighted the extent of loss in vegetation or deforestation between 2000 and 2017 at 690,300 m2. This is shown in red in the figure below and indicates coastal erosion due to oil exploration in the Point of Sangomar.
PROGRESS TO DATE

Similarly, for the urbanization use case, analysis indicated limitations in the ARDC data’s ability to differentiate between bare soil and buildings in rural areas. The use case focused analysis on the city of Mbour in the Theis region for the time period from 2010 to 2017 using the Normalized Difference Built-Up Index (NDBI). The results showed that urbanization increased by 32 percent. However, some biases were noted, for example: some pixels were classified as urbanized areas due to sun reflection, or some urbanized area pixels were excluded because of cloud coloration. The primary limitation was an inaccuracy in classifying urbanization in rural areas given the inability to differentiate between bare soil, vegetation, and structures, the proxy for land consumption. It is possible that this limitation can be addressed through higher resolution data or improvements in the algorithm. For example, Open Data Cube (ODC) is exploring other methods to address this issue, including experimentation with the Ratio-based Impervious Surface Index (RISI) algorithm. The Global Partnership will continue to share learnings as they become available.
These methodological issues with differentiation between bare soil and structure, however, were not an issue in urban areas, and therefore could be used to calculate population growth over time. In particular, users noted the potential for using ARDC insights to improve population estimations and census activities. While there are 17,000 districts across Senegal, all of which must be accounted for in the data generation process, only three people within the Office of Statistics focus on population growth estimations. As such, using the ARDC from the central office to generate population estimations will allow the limited staff to inform census target areas more accurately and efficiently. Through traditional data collection methods, it takes a minimum of one month to collect and process population estimation data within a sample urban area. In comparison, the same insights could be derived using the ARDC within one day, given good Internet connectivity.
As noted above, time and cost savings were highlighted as common benefits across all the use cases, regardless of stage of progress. In addition to improving the efficiency of data collection and processing, and enabling better targeting of ground data collection efforts, the ARDC allows users to observe incremental changes in various factors such as crop yield, deforestation, and water extent through access to timely and historical data. In addition, all users highlighted the benefit of using a multi-stakeholder approach to piloting a new data source and method. Collaborating across multiple stakeholders from different agencies on the same use case improved coordination and increased feasibility of standardizing methodologies.
However, users also noted some common challenges in undertaking the use cases. One challenge mentioned multiple times is the ARDC analysis radius being limited to 5 km2. Given that most users are looking to gain insights to large areas, this was noted as an area for improvement. While this reflects the capacity of the ARDC infrastructure, it is also a concern that can be addressed through increased technical capacity. One user was able to overcome this challenge by training multiple students to be able to run the analysis, increasing human resources and covering analysis across larger areas as a result.
The ability to use a new tool and data source relies on building technical capacity. Given the varying levels of GIS and Jupyter notebook skill levels among users, it was noted that more tailored trainings for various skill levels would be beneficial, especially in interpreting results. While some users have significant background in GIS and remote sensing, many are new to the field. On average, across all three ARDC trainings conducted, the majority of respondents (67 percent) reported that more than 60 percent of the material covered during the training was new to them. Thirty one percent of trainees reported that less than half (40 percent) of the material was new, and 3 percent reported that only a small percentage (20 percent) of it was new. These figures demonstrate the diversity of familiarity with the materials and value in continued and tailored technical support. In particular, users noted that
COMMON BENEFITS AND CONSIDERATIONS
| 07PROGRESS TO DATE

The main next step for most of the use cases is to go through a validation process, to validate ARDC-generated results with ground data to ensure consistency and accuracy. This will then allow users to use the methods and algorithms with confidence to analyze larger or different areas and on a more routine basis. The validation process includes ground validation as well as technical and political validation through the governance mechanisms further detailed in the process report. In addition, the technical committee has highlighted social validation as an important component to ensure that citizen groups are incorporated in the process to build awareness and trust.
In addition, the technical committee has also discussed developing more concrete links between data, indicators, and policy decisions and outcomes. While the pilot use cases were chosen both for areas of priority and indicators that were best suited for EO data, defining the target policy outcomes will encourage more effective uptake and use of the data and insights. Plans are underway to convene policy dialogues to make progress in this area.
In order to more effectively address capacity building needs, the Global Partnership is in the process of discussing how best to institutionalize training within country. As mentioned, there are varying levels of technical expertise. In order to leverage the existing technical capacity within country, future plans include the implementation of a training-of-trainers model, which will ensure that more individuals can be trained and that there will be on-site technical support that is consistently accessible.
In addition to continuing work in improving the ARDC user interface based on user feedback, the Global Partnership is also working on improving the granularity of data that will be available. While the ARDC and EO data will not be relevant for all indicators and use cases, it is possible to address some challenges through improvements in the granularity of data as mentioned above. In addition, some challenges can be addressed through improved methodologies. One way to do this is through continued knowledge sharing across EO data users and specifically ARDC users to share lessons and experiences from working on similar indicators and challenges.
| 08
while the data cube’s user interface is not difficult to master, the Jupyter notebook, which houses the algorithms and codes, requires training. In addition, users also highlighted the benefits of extending the trainings to multiple relevant staff within a given office or agency. In addition to increasing human resources, this also helps mitigate personnel turnover. For example, if the person trained within one office moves or leaves, there will still be others within the office or institution who can pass on the skills and continue making progress.
Multiple users also highlighted the desire to be able to customize algorithms in order to more precisely target analysis. However, given that the ARDC aims to develop standardized algorithms that can be used within and across countries on a routine basis, customization is approached as a collaborative process with users, rather than an independent process for individuals.
NEXT STEPS

We thank the Islamic Development Bank (IsDB), all our partners in Senegal, and our Earth observations (EO) partners including the National Aeronautics and Space Administration (NASA) for making this pilot possible. In particular, we thank the Technical Group - La Plateforme Nationale des Acteurs pour le Suivi des ODD Relevant du Secteur de l’Environnement (GTPODE) for their reflections and insights that made this report possible, and Davis Adieno, Victor Ohuruogu, Kenneth Mubea, and Francois Kamano from the Global Partnership for Sustainable Development Data for their inputs.
Charu Vijayakumar, on behalf of the Global Partnership for Sustainable Development Data (the Global Partnership). The Global Partnership, hosted at the United Nations Foundation, is a network of over 250 partner organizations including governments, businesses, civil society, international organizations, academia, foundations, and statistics agencies from across the globe working together to ensure the opportunities of the data revolution are available to and for all of humanity, helping to achieve sustainable development. The Global Partnership’s goal is to drive better decisions and better lives for all by facilitating the production and use of better data through strategic partnerships, advocacy, technical assistance, and pilot initiatives to support our partners at the global, regional, and national levels. To join the conversation, please visit www.data4sdgs.org and follow @Data4SDGs on Twitter.
ACKNOWLEDGEMENT
AUTHOR
| 09
• Abdoulaye Sarr, ANSD• Aminata Sall, DPN• Babacar Ndao, CSE• Benilde Oudiane, ANAT• Binta Ba, DAMCP• Bocar Abdallah Sall, DGPRE• Ibrahima Hathie, IPAR• Mamadou Dieng Ngom, DAPSA• Sanou Nadeye Bassee, DPVE• Tapha Sarr, DEFCCS
APPENDIX: KEY INFORMANT INTERVIEWEES
Cover Lake Guiers and the Senegal River NASA Johnson https://flic.kr/p/2i4jxxi
PHOTO CREDITS
