africa region’s finance and private sector development...
TRANSCRIPT

Africa Region’s Finance and Private Sector Development Department (AFTFP)
Sub Saharan Africa Tourism Industry Research
Final Report
November 18, 2009
Prepared by
Dr. Louise Twining-Ward
For World Bank, Washington, D.C.
Task Team Leader: Vincent Palmade, TTL and Lead Private Sector Development Specialist
Task Manager: Hannah R. Messerli, Senior Private Sector Development Specialist in Tourism

Final Report, November 2009
2
Sub Saharan Africa Tourism Industry Research
Table of Contents
Summary of Findings 2 Executive Summary 2 Acknowledgements 2 Introduction 2
TOURISM CONTEXT 2 Global Trends in Tourism Demand 2 Tourism in Sub Saharan Africa 2 Tourism and Poverty Alleviation 2 Tourism and Competitiveness 2
RESULTS 2 Tourism Performance 2 Tourism Economics 2 Tourism Products 2 Accommodation 2 Airline Connections 2
ANALYSIS 2 Destination Groups 2
CONSTRAINTS 2 Level 1. Preconditions 2 Level 2. Enablers 2 Level 3. Attractors 2 Level 4. Enhancers 2 Level 5. Delighters 2
STRATEGIES 2 Level 1. Coping Strategies 2 Level 2. Enabling Strategies 2 Level 3. Growing Strategies 2 Level 4. Flourishing Strategies 2
Summary 2
Recommendations 2
LIST OF SOURCES 2
APPENDIX 2 Methodology 2 Glossary 2 Country Profiles 2
List of Tables

Final Report, November 2009
3
Table 1. International Tourism Demand and Economic Impact 2004-2009
Table 2. International Tourist Arrivals by Region, 2000-2008
Table 3. Tourist Arrivals to Sub Saharan Africa by Rank and Region, 2007
Table 4. Key Source Markets for Long-haul Tourist Arrivals, 2007
Table 5. Long and Short-haul Arrivals to Sub Saharan Africa by Region, 2007
Table 6. Average Length of Stay and Purpose of Visit for Sub Saharan Countries, 2007
Table 7. Key Economic Indicators for Tourism in Sub Saharan Africa, 2007 and 2008
Table 8. Niche Tourism Products by Sub Saharan Country, 2009
Table 9. Long-haul Flight Connections to Sub Saharan Africa on Major Airlines by Population, 2009
Table 10. Sub Saharan Africa Destination Group Results, 2009
Table 11. Sub Saharan Africa Destination Group Ranking Scores, 2009
Table 12. List of Interviewees
Table 13. List of Data Availability by Country and Data Type
List of Figures
Figure 1. Pie Chart of International Tourist Arrivals and Receipts by Region, 2008
Figure 2. Map of Long-haul Tourist Arrivals, 2007
Figure 3. Pie Chart of Market Share of Top Five Long-haul Markets, 2007
Figure 4. Map of Key Source Market for Long-haul Tourist Arrivals, 2007
Figure 5. Pie Chart of Purpose of Visit for Visitors to Sub Saharan Africa, 2007
Figure 6. Pie Chart of Total Tourist Arrivals and Receipts, 2007
Figure 7. Map of the Contribution of Tourism to GDP in Sub Saharan Africa, 2007
Figure 8. Map of Tourism Employment in Sub Saharan Africa
Figure 9. Map of Key Product Types in Sub Saharan Africa, 2009
Figure 10. Distribution of International and Regional Hotel Brands in Sub Saharan Africa by Region
Figure 11. Number of Long-Haul Flights to Sub Saharan Africa per Week by Destination and Airline, 2009
Figure 12. Map of Sub Saharan Africa Destination Groups, 2009
Figure 13. Hierarchy of Destination Needs
Figure 14. Strategies for Climbing the Destination Hierarchy

Final Report, November 2009
4
List of Acronyms and Abbreviations
ADB Asian Development Bank
APIX Senegal Investment Promotion Agency, APIX
ASSET Association of Small Scale Enterprises in Tourism
Congo DR Democratic Republic of the Congo
FDI Foreign and Direct Investment
FIAS Foreign Investment Advisory Service
FEDHASA Federated Hospitality Association of South Africa
GDP Gross Domestic Product
HATAB Hospitality and Tourism Association of Botswana
IMF International Monetary Fund
IUCN International Union for the Conservation of Nature
MTWC Malawi Ministry of Tourism
OAG Official Airline Guide
ODI Overseas Development Institute
OECD Organization for Economic Co-operation and Development
OMATHO Mali Office of Tourism
ORTPN Rwanda Office of Tourism and National Parks
PROMEX Promotion of Tourism Investment and Exports
RETOSA Regional Tourism Organization of Southern Africa
SAPCO Société d’Aménagement et de Promotion des Côtes et Zones Touristiques du Sénégal
SSA Sub-Saharan Africa
TTCI Travel and Tourism Competitiveness Index
UNCTAD United Nations Conference on Trade and Development
UNEP United Nations Environment Program
UNESCO United National Educational, Scientific, and Cultural Organization
UNIVISA Regional tourist visa
UNWTO United Nations World Tourism Organization
UWA Uganda Wildlife Authority
VFR Visiting Friends and Relatives
WEF World Economic Forum
WTTC World Travel and Tourism Council
ZTB Zambia Tourist Board
Final Report, November 2009
5
Summary of Findings
1. Tourism is an extraordinary industry
Tourism offers economic promise to even the most isolated wilderness. With low barriers to entry, a seasonal flow of visitors, a simple product, and consumption at the point of production, tourism has significant potential as a poverty alleviation tool.
2. Tourism is vital to the economy of Sub Saharan Africa
More than 29 million tourists arrivals were recorded in Sub Saharan Africa in 2007. The tourism sector directly employs almost four million people.
3. Not all countries in the region have been equally successful in tourism
While some countries have well-developed tourism industries, others have failed to generate significant revenues from tourism, despite having strong tourism products. Destinations can be grouped according to their tourism performance and potential.
4. East Africa and Southern Africa are the most successful tourism regions
West Africa’s tourism sector is expected to grow the fastest over the next decade.1 Central Africa has not been successful in developing its tourism industry.
5. SSA has considerable potential for further growth
Even with the global economic slowdown, Sub Saharan Africa’s travel and tourism industry is expected to achieve an annual growth rate of 5.5% over the next ten years. The world average of 4.1%.2
6. Key constraints to tourism include business climate, political support, and air access
Ease of doing business, visas, political support for tourism, free movement of labor, quality of labor, land security, and air transport liberalization are all crucial to tourism development.
7. To develop tourism, destinations first need to get the basics right
There are a number of fundamental preconditions that are needed for tourism to develop. These include political stability, health, and safety.
8. Before tourism can take off, some crucial enablers are needed
Borders need to be accessible. Political support for tourism needs to be proactive. Air access needs to be viable. Standard accommodation needs to be in place.
9. To be competitive, tourism destinations need to attract guests and enhance experiences
SSA tourism takes place in a global tourism marketplace and has to compete favorably with attractions, facilities, entertainment, and the cost of tourism products elsewhere in the world.
10. To be successful, SSA tourism has to delight visitors with high quality, innovative products
Sub Saharan Africa has considerable tourism potential. Successful tourism, however, does not develop on its own. Strategies crucial to tourism’s long-term success are: service quality, product innovation, value for money, and intelligent marketing.
1 WTTC (2009) Travel and Tourism Economic Impact, Sub Saharan Africa, WTTC, London 2 UNWTO (2009) Tourism 2020 Vision, UNWTO, Madrid

Final Report, November 2009
6
Executive Summary
Tourism is widely regarded as one of the largest and fastest growing economic sectors in the world. UNWTO estimates that tourism contributes 30% to world exports of services, 6% to all exports, and 5% to world GDP. Furthermore, early reports on the impact of the global economic crisis on tourism suggest the industry has proved more resilient than many other sectors. The long-term prospects for the sector also look good.
Sub Saharan Africa (SSA) receives a growing share of world tourist arrivals. More than 29 million tourists visited the region in 2007, generating more than US$21.8 billion in tourist receipts and contributing an average of 6% to GDP. SSA attracts more visitors than the Caribbean and Central America combined. Tourist arrivals to the region over the next ten years are forecast to grow faster than the world average.
Some countries have excellent flight connections to long-haul destinations, a high level of political support for tourism, and simple visa requirements. These countries are performing well. Other countries can only be reached on expensive inter-regional flights, have little or no political support for tourism, have complex visa procedures; as a result they have almost no tourism industry at all.
The report provides a summary of the patterns of tourism success and failure in Sub Saharan Africa. It analyzes the information collected for the SSA Tourism Database, identifies the regions and destinations that are winners and losers, explains the constraints facing SSA tourism, and suggests strategies for the future.
Tourism Performance
The report finds that SSA attracted just over 29 million tourists3 in 2007. The top five destinations for tourist arrivals are South Africa, Botswana, Kenya, Nigeria, and Mauritius. Southern Africa is the top SSA region for arrivals; it attracted just over 13 million visitors in 2007. East Africa received over 11 million visitors. West Africa received 4.6 million visitors, and Central Africa received only 762,000 visitors.4
Tourism Demand
The report highlights the top five long-haul markets for SSA: France, UK, US, Germany, and Portugal. France is the most important long-haul source market for 18 Sub Saharan countries. Burkina Faso, Madagascar, Mauritius, and Senegal are the most significant destinations for French visitors. UK visitors are the main long-haul tourists to South Africa, Botswana, Kenya, The Gambia, Zambia, and Malawi. The US is the dominant source market for Ghana, Ethiopia, Rwanda, Tanzania, and Zimbabwe. Portuguese visitors mainly travel to Angola, Cape Verde, Mozambique, and São Tomé and Príncipe. German visitors dominate long-haul arrivals in Lesotho, Namibia, and Swaziland. Smaller markets for Sub Saharan Africa include the Netherlands, Italy, Belgium, Sweden, India, Canada, and Ireland. Emerging markets for SSA include Spain, Australia, India, China, and Russia.
3 International arrivals are all visitors recorded at border crossings staying one night or more by region regardless of their purpose of visit or country of origin. Data sources include UNWTO and National Tourism Offices. 4 Based on UNWTO 2007 figures as 2008 figures are not available for all countries
Final Report, November 2009
7
The report notes that many countries in the region, particularly French-speaking countries, are reliant on just one long-haul source market.5 This makes these SSA destinations vulnerable to changes in market demand and to economic downturns.
The report finds that the average length of stay for tourists in SSA is 5.6 nights. Leisure tourism is predominant in East and Southern Africa. West and Central Africa have only small pockets of leisure tourism but attract significant numbers of business tourists.6 Destinations with a higher percentage of leisure visitors tend to have a longer length of stay. SSA island countries were found to have a longer length of stay and a larger percentage of leisure visitors than landlocked destinations.
Tourism Economics
The report studies three main indicators of tourism’s economic impact: tourism receipts, the contribution of tourism to GDP, and tourism employment. Tourism receipts were estimated to be US$21.8 billion for SSA in 2007. Southern Africa had the most tourism receipts, US$11 billion, a little under half of all receipts for the region. East Africa had US$7.4 billion in tourist receipts, West Africa US$2.6 billion, and Central Africa US$680 million. Countries that perform considerably better7 on tourist receipts than they do on tourist arrivals include: Angola, Cameroon, Tanzania, Madagascar, Ethiopia, Seychelles, and Ghana. This is a good indication of the competitiveness of these destinations.
The average contribution of tourism to GDP across SSA is 5.9%. Tourism’s contribution to GDP is highest in Seychelles at 50.3% and lowest in Sudan at 0.6%.
The report finds that just under half of all SSA’s travel and tourism jobs are located in East Africa. Southern Africa reports 527,000 jobs. In West Africa, Nigeria has the most tourism employment, 287,000. Central Africa has only 100,000 tourism jobs, half of them in Cameroon. Tourism employment appears to have grown the fastest in Mauritius over the last five years. WTTC expect Seychelles, Namibia, Togo, Zambia, and Ghana to have the fastest growth in tourism employment in 2009.
Tourism Products
The SSA Tourism Database divides tourism products into five groups for analysis and mapping: safari (defined as “big-five–watching” from jeep, elephant, or on foot), other nature products (includes sightseeing, hiking, birdwatching, and tracking gorillas/chimpanzees), resort (beach tourism, lake tourism, and watersports), cultural products (archeology, village tourism, cultural heritage, historic architecture, and traditional markets), or business products (conferences, meetings, and trade).
Safari tourism is a key product for East Africa and Southern Africa. The main East Africa safari destinations are Kenya and Tanzania. Resort tourism is also a key product in East Africa. The main East Africa resort destinations are Mauritius, Seychelles, and Mozambique. West Africa has small pockets of resort tourism in Cape Verde, Senegal, and The Gambia but mainly attracts business tourists. In Central Africa there is almost no resort or safari tourism, but business tourism is growing. Angola, Cameroon, Chad, and Republic of Congo are business destinations. Cultural tourism is perhaps the most underdeveloped key product. Every country has some cultural heritage attractions, indigenous culture, and/or craft products. Cultural tourism has the most potential in the Sahel countries of West and East Africa.
In addition to the main types of products mapped above, SSA offers a large range of nature, cultural, business, and resort-based niche products. Examples include archeological expeditions in Sudan and Ethiopia, fishing in The Gambia and Guinea-Bissau, and trophy-hunting in South Africa. Where SSA appears to have a distinct competitive advantage, is in the delivery of combination products. Combo-holidays which combine and extend traditional products with experience-based add-ons, are SSA’s emerging “trump card”. Combo-holidays offer multiple experiences, and appeal to the growing segment of
5 “Reliance” on one source market is when the largest market provides more than twice as many tourist arrivals as the secondary market 6 See Table 3. for list of countries in each region 7 Countries whose SSA rank for tourist receipts in 2007 is ten or more places higher than their SSA rank for tourist arrivals

Final Report, November 2009
8
the market that is well-traveled, active, and interested in holidays that combine relaxation with adventure, culture, nature, or business.
Tourism Accommodation
Many factors affect the location of international hotels. These factors are: domestic, inter-regional, and international demand; business security (legislation to protect franchises and intellectual property, ability to repatriate management fees and profits, absence of corruption); availability of debt financing; free movement of labor (ease of access to visas and work permits for non-nationals); and land security. Not surprisingly, a positive correlation was found between the number of rooms and the performance of the destination. Of the 28 countries with 2006 data8, South Africa had the greatest number of rooms: 61,417. Tanzania was next with 30,600 rooms. Kenya was third with 24,000 rooms. There appears to be substantial underutilization of capacity across SSA. The highest average occupancy rate was reported by Kenya at 87% in 2006. Togo reported the lowest average occupancy rate: 10.7%.
A total of 382 branded/chain hotels were identified in the region (35,862 rooms); 122 hotels belonged to international hotel groups and 260 were regionally branded hotels. The Accor group is the most important international hotel group in Sub Saharan Africa with 46 hotels. Starwood and Intercontinental, the next largest players in the region, have just over 20 hotels each. Southern Africa has 57% of the branded hotels, East Africa 25%, West Africa 15%, and Central Africa 3%.
Although a larger number of international hotels generally means the destination is successful at attracting visitors, the reverse is not always true. The Gambia has created a high performing tourism industry with few international hotel chains. Mozambique has very few international hotels but a number of independently run high-end resorts and lodges. The same is true of Botswana and Tanzania. Further research into the relative strengths and weaknesses of branded versus independent hotels is needed.
Airline Connections
Sub Saharan Africa is under-served by major airlines. Sixty-six percent of countries have either no major carrier connections or are dependent on just one airline. Decisions on airline routings are driven by a mix of domestic, inter-regional, international, and cargo demands. They are also affected by air transport liberalization, ease and cost of doing business (landing rights, baggage handling), and the cost of fuel.
A strong correlation is found between the number of long-haul flights per week and the performance of the destination. The top three countries for tourist arrivals, South Africa, Nigeria, and Kenya, are also the top three countries for long-haul flights per week. Countries with the fewest connections, such as Comoros, Central African Republic, and Liberia, have very limited tourism development. Exceptions include countries such as Botswana and Namibia which have strong hubs in neighboring countries and frequent regional connections.
East Africa is the best-connected region for long-haul flights. West Africa is the best connected region for regional flights. Southern Africa has fewer long-haul and inter-regional flights per week due to the long distance from major markets and the fact that South Africa is the only hub in the region. Central Africa has the worst long-haul connections in SSA.
Long-haul connections to SSA are dominated by a small number of international airlines. The top five airlines serving the SSA region (Air France, South African Airways, Brussels Air, British Airways, and Ethiopian Airlines) provide 61% of the long-haul flights. As with source markets, this makes destinations vulnerable to changes in demand. Recent growth in “no-frills” airlines such as Fly540, as well as the use of charter flights, help ease air isolation, but inter-regional travel is still challenging. There is slow progress towards “open skies”, air liberalization policies, and an increasing dominance of regional gateway hubs.
Tourism Potential
8 UNWTO has data on the number of hotel rooms for 28 SSA countries in 2006 but for only 21 SSA countries in 2007. 2008 figures are not yet available

Final Report, November 2009
9
The report uses six indicators to estimate the relative tourism potential for each country: tourist receipts per arrival, WTTC forecasted growth rate 2009-2019, World Bank’s Ease of Doing Business Index, TTCI regulatory framework index, TTCI business and infrastructure index, and TTCI human and cultural resources index. These indicators were selected to minimize the bias caused by small countries and those with large numbers of land border crossings. Indicators also needed to be forward-looking, and to rate the quality of human and natural resources as well as the political and regulatory climate for tourism. The World’s Bank’s Ease of Doing Business index was used to recognize the importance of an attractive business climate.
Destination Groups
As a result of the rankings using the six indicators above, the 47 SSA countries are arranged in five groups, corresponding to their future potential for tourism.
• Group One countries are SSA’s top destinations. These destinations are expected to perform best over the next five years. These are: Seychelles, Mauritius, Namibia, Cape Verde, South Africa, and Kenya
• Group Two countries are emerging as significant players in tourism, but each has some reason it has not quite made the top group. These are: Ghana, Tanzania, Botswana, Zambia, The Gambia, Uganda, Senegal, Ethiopia, Madagascar, and Nigeria
• Group Three are countries where the tourism sectors are in transition. Each of these countries has significant potential to make tourism a growth industry, but each also has constraints that need to be addressed before joining the emerging destinations. These are: Sierra Leone, Malawi, Angola, Mozambique, Burkina Faso, Cameroon, Mauritania, Benin, Rwanda
• Group Four countries are those countries whose tourism sectors are still in their early stages. These countries have potential as tourism destinations but they are not expected to take off without significant investment and without change in the policy and public sector environment. Group Four countries are: Zimbabwe, Mali, Côte D’Ivoire, Comoros, São Tomé and Príncipe, Gabon, Sudan, Lesotho, Chad, Eritrea, and Swaziland
• Group Five countries are not expected to take off as tourism destinations any time soon. Nearly all of these countries are experiencing political instability or have very high crime rates. Group Five countries are Burundi, Guinea, Togo, Niger, Congo DR, Central African Rep., Guinea-Bissau, Republic of Congo, Equatorial Guinea, Liberia, Somalia
Constraints
Information collected for the SSA Tourism Database reveals that although many SSA countries face constraints to the development of their tourism sectors, not all destinations face the same constraints, nor are all constraints of the same order of magnitude. The report explains the constraints facing SSA tourism development as a “Hierarchy of Destination Needs.”
• Preconditions. At the bottom of the triangle are the most basic destination needs, the “preconditions” for tourism to develop: political stability, health, and safety. Without these conditions in place, very few visitors, apart from international aid workers, are likely to visit.
• Enablers. Once these conditions are met, entry procedures, infrastructure, and facilities take over as the most important destination needs. These are the “enablers.” When the enablers are developed to a reasonable standard, other considerations move up in importance.

Final Report, November 2009
10
• Attractors. The attractiveness of the product, the culture, and the cost of the destination are the factors that draw the tourists to the destination. These are the “attractors.”
• Enhancers. Then, considerations such as service, tourist experience, and environmental quality become more important. These are called the “enhancers.”
• Delighters. At the top of the pyramid are the “delighters,” the factors that make visitors return year after year and recommend the destination to their family and friends: quality of the facilities, innovation of the product, and the marketing effort.
Strategies for Success
Even the most challenged countries have the potential to become successful. Cameroon’s tourism industry has learned to cope with less political support that they would like. Namibia’s tourism industry has managed to grow without direct flights. Botswana has fought an AIDS epidemic, and The Gambia has coped without international hotels. Burkina Faso has made up for a lack of beaches with a well-organized film festival.
To reach their potential and move up in the destination groupings, destination constraints need to be addressed with suitable action strategies. Not all destinations face the same constraints, nor are all constraints of the same order of magnitude. While some countries are still struggling with the basics of safety, security, and visa processing, others are more challenged by product development and airline agreements. Clustering countries according to key constraints may be an efficient way of to build strategies for success.
When destinations fail to solve the preconditions and enablers, tourism development becomes a difficult, uphill struggle. When destinations get the basics right and maintain them, investor confidence increases, hotel developers arrive, airlines create new routes, tourist arrivals increase, and tourism benefits start to spread.
Limitations of Data
The information included in the database and in this report, has, where possible, been cross-checked. But measuring and analyzing tourism demand and supply is not a perfect science and desk-based studies are limited by the quality of information sources.
While a few countries have well-organized data collection processes and post monthly arrival statistics online within a few weeks, others have no tourism statistics available at all. Typical data processing shortfalls include: haphazard collection of arrival cards and hotel data, poor coordination between offices involved in data processing, lack of capacity in the departments where statistics are processed, lack of understanding of the importance of timely and consistent data publication, and low level of political support for data publication.
Other challenges occur when comparing different sources of data such as UNWTO, WTTC, and National tourism office data. Whereas UNWTO data relies on inputs from national tourism offices, WTTC data is based upon a simulated Tourism Satellite Accounting (TSA) model. The TSA model uses historic data as well as economic research to make assumptions and forecasts. The model is a useful tool for countries that do not have their own TSA model in place, but they are not always reliable. Care should be taken in their interpretation, and the information should be used alongside other economic data.
Supply-side research such as the ranking of products, explanation of public and private sector activity, analysis of tourism constraints and potential are based on secondary sources, interviews around the region, and the judgement of the consultant. This report is designed as a starting point for further in-depth discussion and analysis and would benefit from further in-country diagnostic work that is not within the current scope of work.
Recommendations
This report is one step towards improved understanding of the opportunities and constraints facing tourism development in Sub Saharan Africa. Further work is needed both to understand the issues better and to create viable solutions. The report offers ten recommendations for next steps:

Final Report, November 2009
11
Institutions: build capacity Governments are often interested in developing tourism but are sometimes ill-equipped to know what needs to be done. Tourism awareness training, aimed at ministries of tourism and national tourism offices, is needed. It should emphasize tourism preconditions and how to create an enabling business environment for tourism. Policy: improve tourism policy Another common issue is tourism policy failure. Creating policies is difficult because the cross-sectorial nature of the industry requires interdisciplinary skills and complex decisionmaking. A prototype tourism policy document should be produced for each group of destinations. It should identify essential elements: regulatory framework, licensing, health and safety standards, as well as other key areas noted below. Partnerships: support tourism associations Supporting tourism associations with skills training and using tourism associations as vehicles for private sector up-skilling can be an efficient and effective way to stimulate small-scale private sector development. Information: collect, manage, and use There are significant shortfalls in data collection, management, and analysis in SSA. Good information is crucial to decisionmaking for both the public sector and for private sector investors. A program of training and capacity building focused on tourism information is needed. Borders: streamline visas The difficulty of obtaining visas, particularly for inter-regional travelers, is a considerable constraint to tourism development in SSA. Streamlined border formalities and visa processing is a crucial tourism enabler. Work is needed to demonstrate the clear relationship between relaxed visa arrangements and tourism success. Access: improve infrastructure Air and road transportation is essential for tourism. Cost, safety, and efficiency are required if regional airlines are to increase their flight frequency and market share. Greater efforts are needed to liberalize air transport. Improved road, rail, and waterway infrastructure is needed to encourage international, inter-regional, and domestic trade, travel, and to provide access to tourist attraction sites. Business: strengthen reforms Tourism can be a starting point for the reform of business laws. Initiatives are needed across the region to improve the climate for business and boost investor confidence. Particular focus is needed on commercial codes, land policies, the impact of taxation and incentives on business, work permits, investment protection legislation, and respect for the rule of law. Products: innovate and package Many countries have underdeveloped tourism resources. Product innovation, interpretation, and packaging are essential. Training is needed to help countries convert resources such as parks, waterways, and cultural heritage sites into attractive tourism products. Training can take place in country clusters and focus on improving safety, customer management, and interpretation. Sustainability: encourage and certify Environmental, social, and economic sustainability initiatives, such as fair trade tourism certificates and labels, can help tourism be a catalyst for conservation and poverty alleviation. Work is needed to strengthen and support NGO and community-based programs and their linkages to larger projects. Research: explore issues This study provides an overview of SSA tourism. Not all issues could be included. Areas where further research can be usefully directed include: size of demand for different tourism segments; land costs and availability; business costs; investment promotion; institutional function and structure.
Acknowledgements
I would like to express sincere gratitude to everyone who gave their time to assist with this study. I would especially like to acknowledge the tireless work of Martine Bakker in assembling

Final Report, November 2009
12
information for country profiles and brainstorming country analyses. I would also like to thank Diana Ditto, for her research assistant work, Claire Maytom for her cartography, and Robert Frumkin for copyediting.
This work would not have been possible without the guidance of Hannah Messerli and Vincent Palmade at the World Bank. I am also extremely grateful to Iain Christie for his useful comments on early drafts of this report.
I am particularly grateful to those individuals who agreed to be interviewed for this study. These include: Ms. Kirti Surendran at Kenya Airways, M. Philippe Saeys-Desmedt at Brussels Airlines, Mr. Gregg Truman at South African Airways, Mr. Guus Jonger at KLM, Mr. Abdulmalek Virani at Serena Hotels, Mr. Serge Hattier at Accor, Mr. Patrick Fitzgibbon at Hilton Worldwide, Mr. Peter Ngori at Abercrombie and Kent, Mr. Jim Louth at Undiscovered Destinations, Mr. Chris Badger and Mr. Ron Goatley at Wilderness Safaris, Mr. Timothy Mushibwe at the Zambia Tourism Board, Mr. Momodou Jobe at the Gambia Tourism Authority, Mr. Seydou Nourou Diouf at the Senegal Investment Promotion Agency and Mr. Jerry Manussa at the Mozambique Ministry of Tourism, Ms. Chatal Lewat at the Cameroon Hotel and Tourism Association, Ms. Moronogue Ntloedibe-Disele at Hotel and Tourism Association of Botswana, Mr. Adam Pope in Zambia, Mr. Jean Christophe Ngo, Dr. Charles Schlumberger, Mr. Roger Christen at the World Bank, and Mr. Bryan Kinkade at National Geographic Adventures.
Many other individuals from around the SSA region helped by providing tourism statistics. The assistance of the following individuals is also gratefully acknowledged: Mr. Jay Vom Vaudeville of the Cameroon Tourism Office in Quebec, Ms. Lily Rakarong at the Hotel and Tourism Association of Botswana, Innocent Bash at the World Bank, Mr. Alvin Rosenbaum of the Citizen Development Corporation in Nigeria, Ms. Anna Morris at the World Bank office in Zambia, Ms. Karen Hoffman of the Bradford Group, Ms. Temalo Maggie Lesetlhe at the Botswana Department of Tourism, Mr. Martin Mhando of the Zanzibar Film Festival, Mr. Deogratias Malogi of the Tanzania Tourist Board, Ms. Olga Cruz at The National Institute of Statistics Cape Verde, Ms. Suzette Ferreira Gama at the Guinea-Bissau tourism office, Mr. Gilberto de Barros at the World Bank, and Mr. Brad Weiss of Solimar International.

Final Report, November 2009
13
Introduction
This is the final report for the Sub Saharan Tourism Industry Research Project, a market research study designed to inform the tourism section of the World Bank AFTFP 2010 flagship report, Competitive Africa—How to Double Africa’s Market Share in 15 Years.
The purpose of the report is to answer the following key questions:
• What are the main tourist flows to and within Sub Saharan Africa? • What is the current pattern of demand for tourism in Sub Saharan Africa? • What types of tourism products are available, how have they evolved, and what are the
demand patterns for these products?
The methodology for this study involved collecting, compiling, and evaluating existing statistics and information on the Sub Saharan tourism industry.9 Data sets used in the report were selected to achieve the best possible combination of: reliability, timeliness, comparability, and completeness. Where possible, information collected from key sources was then cross-checked for consistency and reliability with other available sources.
Availability of tourism statistics varies significantly across Sub Saharan Africa (SSA). While a few countries have well-organized data collection processes and present monthly arrival statistics online within a few weeks, others have no tourism statistics available. Completeness of data was an issue for a number of countries. For some countries, the UNWTO only has a limited set of indicators, or no data at all. UNWTO does not provide tourism statistics for the Republic of Congo, Equatorial Guinea, Liberia, and Somalia and has limited statistics for Burundi and Gabon.10
Interviews with government officials, hotel companies, airlines, and tour operators were used to further validate quantitative and qualitative data. A total of 21 phone interviews were conducted; each lasted between 20 minutes and one hour. A list of people who were interviewed is included in Table 12 in the Appendix.
The information included in the database and in this report, has, where possible, been cross-checked. However, given the large number of countries, the difficulty of contacting national tourism offices around the region, and the short time span of this project, some inaccuracies are inevitable. Measuring and analyzing tourism demand and supply is not an exact science. Further in-country diagnostic work is needed to verify individual country results.
This report provides the analysis of the results of tourism demand and supply data for the 47 SSA countries; it identifies the main constraints to competitiveness and looks at what strategies can be used to address these. The first section of the report outlines the global context for tourism in SSA, explains the relationship between poverty and alleviation, and introduces the concept of tourism competitiveness. The second section of the report examines the results of the tourism demand and supply research. Using examples from around the region, constraints to growth are explained and some of the strategies that can help destinations succeed are discussed. The report concludes with a set of ten recommendations designed to help policymakers in Sub Saharan Africa improve tourism competitiveness and move towards sustained, inclusive economic growth. Accompanying this report is a database containing the profile of tourism demand and supply in every Sub Saharan country and a powerpoint presentation. The report should be used in tandem with the database.
9 See Appendix for full account of methodology and database construction 10 See Appendix Table 13 for data availability by country

Final Report, November 2009
14
TOURISM CONTEXT
Tourism’s ability to create jobs, boost economies, provide foreign exchange, improve infrastructure, and promote environmental conservation has been well researched and systematically demonstrated.11
Reasons to Develop SSA Tourism
• Tourism has a wide employment multiplier-effect, low barriers to entry, and is more likely to employ women and minority groups than other industries12
• Because tourism is consumed at the point of production, it provides opportunities for the development of small local businesses and informal economic activities such as handicrafts and food stalls, often in peripheral locations where poverty rates are highest
• Tourism taxes can provide significant government revenues. Revenues from landing fees, departure taxes, VAT, park entrance fees, and use of public utilities can make a significant difference to government income
• The infrastructure required by tourism can also benefit resident communities. Improving roads, water supply, electricity, and communications can make a major difference to the lives of the poor
• Tourism, when carefully managed, is non-extractive and can support conservation measures, raise incomes, and provide employment without denuding the country of its resource base
Tourism presents a vast opportunity for many countries in Sub Saharan Africa. Tourism already provides more than 5% of the region’s GDP and half of all service sector exports. Tourism is also growing faster in the Sub Saharan region than in the rest of the world. But performance varies widely across the region. Some countries have excellent flight connections to long-haul destinations, a high level of political support for tourism, and simple visa requirements. These countries are performing well. Other countries can only be reached on expensive inter-regional flights, have little or no political support for tourism, and have complex visa procedures; as a result, they have almost no tourism industry at all.
Global Trends in Tourism Demand
Tourism is widely regarded as one of the largest and fastest growing economic sectors in the world. From 1990 to 2000, world international tourism arrivals grew from 438 million to 684 million. From 2001 to 2007, tourist arrivals grew a further 32% to 908 million. By 2008, there were 924 million international tourist arrivals.13 UNWTO estimates that tourism now contributes 30% to world exports of services, 6% to all exports, and 5% to world GDP. This puts tourism fourth in rank after fuel, chemicals, and automotive products.
11 de Kadt, E. (ed.) (1979) Tourism - Passport to Development? Perspectives on the Social and Cultural Effects of Tourism in Developing Countries, Oxford University Press for the World Bank and UNESCO, New York
Mathieson, A. and Wall, G. (1982) Tourism: Economic, Physical and Social Impacts, Longman Scientific and Technical, Harlow
Sinclair, M. T. (1992) "Tourism Economic Development and the Environment: Problems and Policies", in Cooper, C. P. and Lockwood, A. (eds.), Progress in Tourism and Hospitality Research, John Wiley and Sons, Chichester, Vol. 4, pp. 75-81
Mowforth, A. and Munt, I. (1998) Tourism and Sustainability: New Tourism in the Third World, Routledge, London 12 UNEP and UNWTO (2005) Making Tourism more Sustainable: A Guide for Local Policy Makers, UNEP and UNWTO, Paris and Madrid 13 UNWTO (2009) Tourism Highlights 2009 Edition, UNWTO, Madrid

Final Report, November 2009
15
International tourism receipts14 grew to US$944 billion in 2008.15 If the receipts spent on international passenger transport are included, UNWTO estimates that tourism generated US$1.1 trillion in 2008, or US$3 billion a day. Spending per tourist arrival has increased almost 20% over the last five years from US$818 in 2004 to US$1,020 in 2008.16 Much of this spending directly benefits residents in tourism destinations by raising demand for local products and services, creating investment opportunities, increasing demand for land, communication, transportation, construction labor, retail, and providing myriad formal and informal income-generating activities.
As a result, the impact of the industry on employment is impressive. According to UNWTO, the tourism sector employs 220 million people directly and indirectly across the globe; 6% to 7% of jobs worldwide.17 WTTC estimates tourism’s employment effect to be even higher: 7.4% of total world employment.18 Further positive economic impacts result from the significant contribution of tourism to government revenues around the world.
Table 1. International Tourism Demand and Economic Impact 2004-2009
Travel & Tourism Activity (US$ bn) 2004 2005 2006 2007 2008 2009
International Tourists (million) UNWTO 763 805 850 908 924 855
International Tourism Receipts (US$ billion) UNWTO
624 680 745 858 944 International tourism receipts per arrival (US$) UNWTO
818 845 876 945 1,020 Average trip travel spend (US$) 435 446 467 511 561 541 Average trip fare spend (US$) 72 78 82 92 103 99Industry Aggregates (WTTC) Gross Domestic Product 2,811 2,973 3,110 3,464 3,769 3,567 Employment (000s) 206,069 212,586 220,186 224,467 226,039 219,810 Direct Gross Domestic Product 1,467 1,553 1,627 1,816 1,976 1,870 Employment (000s) 72,242 73,232 76,118 77,864 78,748 77,276 Indirect Gross Domestic Product 1,344 1,420 1,482 1,649 1,793 1,697 Employment (000s) 133,827 139,354 144,068 146,603 147,291 142,534 Notes 2009 data are estimates
Source: UNWTO, 2009 and WTTC, 2009
Tourism, which often involves discretionary spending, has been and continues to be affected by the global economic recession of 2008-2009, compounded by concerns about the outbreak of “swine ‘flu” (H1N1). Nevertheless, early reports on the impact of the crisis on tourism suggest the industry has proved more resilient than many other sectors. Moderate growth was experienced in 2008. The expectation in 2009 is for a drop in arrivals and receipts of 4% to 6%, and for a drop in arrivals to about 885 million.19 The long-term prospects for the sector are, however, still good. UNWTO’s Tourism Highlights, released on the occasion of World Tourism Day, September 27th 2009, recalls that international arrivals have grown consistently over the last six decades and are expected to reach 1.6 billion by 2020.20
14 International tourism receipts include all direct expenditure made by visitors from abroad on lodging, food and drinks, fuel, transport in the country, entertainment, shopping, etc. They exclude expenditure on international transport to the destination 15 UNWTO (2009) op. cit., p.12 16 Ibid 17 Ibid 18 WTTC (2009) Travel and Tourism Economic Impact, Sub Saharan Africa, WTTC, London 19 For further discussion of the impact of economic recession on tourism see Messerli, H., R. Shendy and Gurcanlar, T. (2009) Tourism Trends in Sub Saharan Africa, September 2009 Sector Update. World Bank, Washington, D.C. and www.unwto.org/trc 20 UNWTO (2009) Tourism Highlights 2009, UNWTO, Madrid.

Final Report, November 2009
16
Tourism in Sub Saharan Africa
Sub Saharan Africa receives a small but growing share of world tourism arrivals. The pie chart below shows the regional breakdown of tourist arrivals in 2008. Europe received just over half of all international tourism arrivals. Twenty percent of tourists went to Southeast Asia and the Pacific, 16% to the Americas, 6% to the Middle East, and 5% to Africa.
Figure 1. Pie Chart of International Tourist Arrivals and Receipts by Region, 2008
Table 2. International Tourist Arrivals by Region, 2000-2008
World Region 1990 1995 2000 2005 2007 2008 % Change 06-07
% Change 07-08
Northern Europe 28.6 35.8 43.7 52.8 58.1 57.0 2.8 -1.9
Western Europe 108.6 112.2 139.7 142.6 154.9 153.2 3.5 -1.1
Central/Eastern Europe 33.9 58.1 69.4 87.5 96.5 98.9 5.5 2.5
South Med. Europe 93.9 103.4 139.8 158.7 177.9 178.9 4.6 0.6
Subtotal Europe 265 309.5 392.5 441.6 487.3 487.9 4.2 0.1
North-East Asia 26.4 41.3 58.3 85.9 100.9 101.0 9.8 0.1
South-East Asia 21.2 28.4 36.1 48.5 59.7 61.6 12.3 3.3
Oceania 5.2 8.1 9.6 11 11.2 11.1 1.7 -1.0
South-Asia 3.2 4.2 6.1 8.1 10.1 10.4 2.6 3.3
Subtotal Asia/Pac. 55.8 82 110.1 153.6 181.9 184.1 9.7 1.2
North America 71.7 80.7 91.5 89.9 95.3 97.8 5.2 2.6
Caribbean 11.4 14.0 17.1 18.8 19.8 20.3 1.6 2.4
Central America 1.9 2.6 4.3 6.3 7.8 8.3 12.0 7.2
South America 7.7 11.7 15.3 18.3 20.0 20.8 6.5 3.9
Subtotal Americas 92.8 109 128.2 133.3 142.9 147.2 5.2 3.0
North Africa 8.4 7.3 10.2 13.9 16.3 17.2 8.5 5.4
Sub Saharan Africa 6.7 12.7 17.6 23.4 28.8 29.7 9.1 3.4
Subtotal Africa 15.1 20.0 27.9 37.3 45.1 47 8.9 4.1
Subtotal Middle East 9.6 13.7 24.9 37.9 47.0 55.6 14.6 18.2
Total World 438 534 684 804 904 922 6.1 1.9 Source: UNWTO, 2009
Sub Saharan Africa’s share of international tourist arrivals increased from 6.7 million in 1990 to 17.6 million in 2000, and to 29.7 million in 2008. From 2006 to 2007, tourist arrivals increased by 9.1%, one of the highest regional rates of growth in the world. Furthermore, Africa was the only region to have seen growth in tourist arrivals despite the global economic crisis in 2008. From

Final Report, November 2009
17
January to April 2008, arrivals to the Middle East fell by 18% and arrivals to Asia Pacific fell 6%, yet arrivals to Africa increased by 3.4%.21
Sub Saharan Africa now attracts more tourists than the Caribbean and Central America combined. The region generated approximately US$21.7 billion in tourist receipts in 2007. WTTC estimate direct tourism employment for SSA is 3.4 million in 2008, and 10.1 million if direct and indirect employment are considered. This comprises 5.6% of employment for the region.22
Even with the global economic slowdown, Sub Saharan Africa’s travel and tourism industry is expected to achieve an annual growth rate of 5.5% over the next ten years. This compares with the world average of 4.1%.23
Tourism and Poverty Alleviation
There is significant evidence to suggest that tourism has an important role to play in poverty alleviation.24 Links between tourism and poverty alleviation are particularly relevant to Sub Saharan Africa, the poorest region in the world.25 The poverty rate in Sub Saharan Africa is just under 50 per cent of the population, or 300 million people.26 Seventy percent of countries in Sub Saharan Africa are on the UN’s list of least-developed countries.27 The UNWTO Sustainable Tourism–Eliminating Poverty (ST-EP) initiative identifies seven key ways that tourism can help fight poverty in developing countries28:
• Employment of the poor in tourism enterprises • Supply of goods and services to tourism enterprises by the poor • Direct sales of goods and services to visitors by the poor (informal economy) • Establishment and running of tourism enterprises by the poor • Tax on tourism income with proceeds benefiting the poor • Voluntary giving by tourism enterprises and tourists to the poor • Investment in infrastructure stimulated by tourism which benefits the poor
The example of value chain work in The Gambia illustrates how the poor can receive substantial benefits even from package tourism.
The Gambia “The great achievement of Gambian tourism is the scale of the pro-poor benefits derived from the relatively high levels of out-of-pocket, or discretionary, expenditure by tourists. Items such as food and beverages, shopping, and excursions account for less than one-third of the tourism value chain but are highly pro-poor in their impacts. Most of these expenditure items help Gambians who sell goods and services directly to tourists, such as craft market stall-holders, fruit and juice sellers, taxi drivers, and
21 UNWTO (2009) World Tourism Barometer, June, Volume 7 (2), World Tourism Organization, Madrid 22 WTTC (2009) Travel and Tourism Economic Impact, Sub Saharan Africa, WTTC, London. Note: these figures are estimates based on economic modeling and may not be reliable in each case. Check SSA Tourism Database for further information. 23 UNWTO (2009) Tourism 2020 Vision, UNWTO, Madrid 24 During the 16th meeting of the Commission of Sustainable Development (CSD) in New York in 2008, a special session on Africa noted the continent’s strong and untapped potential for tourism development and confirmed how tourism can constitute a powerful tool for poverty alleviation. UNWTO, (2008) Sustainable Development of Tourism, E-bulletin No. 15 25 More than a 1.4 billion people in the world are living in extreme poverty. Recent increases in the price of food and the economic downturn are expected to drive a further 100 million people into absolute poverty and leave 2 billion people undernourished 26 The new threshold for extreme poverty is now $1.25 a day. UN (2008) End Poverty 2015, Millennium Development Goals, UN, New York. http://www.un.org/millenniumgoals/2008highlevel/pdf/newsroom/Goal%201%20FINAL.pdf Handley, G. Higgins, K. Sharma, B. (2009) Poverty and Poverty Reduction in Sub-Saharan Africa: An Overview of the Issues. Working Paper 299, Overseas Development Institute (ODI), London 27 UN List of Least Developed Countries. http://www.unohrlls.org/en/ldc/related/62/ 28 UNWTO (2004) Tourism and Poverty Alleviation: Recommendations for Action, UNWTO, Madrid

Final Report, November 2009
18
guides. The pro-poor impact of these activities (meaning the wages earned or revenue received by the informal sector and employees) make up between one-quarter to one-half of expenditure on these items.”
Source: Michell, J. and Faal, J. (2008)29
Notwithstanding these successes, most observers contend that tourism is still performing considerably under its potential.30 SSA’s competitive challenge is significant and in the face of the global economic crisis, the need to be competitive is that much more urgent.31
Tourism and Competitiveness
In economic terms, a destination’s competitive advantage is thought to be related to the “factor endowments,” or resources, that a country is fortunate enough to have. Factor endowments can include land, natural resources, labor, and the size of the local population. Michael Porter, a professor at Harvard Business School, explains how countries can create new endowments by building capacity, improving technology, and increasing the national knowledge base.32 In this way, countries that are factor-disadvantaged often find innovative ways to overcome comparative weaknesses with competitive strengths. Crouch and Ritchie use the example of Singapore as a tourist destination that had few resources but overcame this weakness through effective marketing and a clean and safe environment.33
Based on Porter’s work, competitiveness is understood as a firm’s or a country’s ability “to compete globally based on their embedded comparative advantage as well as the ability to acquire new competitive advantages in higher value-added activities.”34 Physical productivity, efficiency, quality, and innovation along with factor costs and transaction costs are central concerns to this understanding of competitiveness.
Productivity is difficult to calculate in the service sector, however.35 Competitiveness in tourism is not just a result of the quantity of a particular product that is sold and of the price paid for the product, but is the result of the value of the whole bundle of goods and services that make up the tourism experience, how well this matches with the cost, how much effort is put into promotion, and what other destinations have to offer. This means there are many ways that destinations can improve their competitiveness, but it also makes tourism competitiveness extremely difficult to quantify. Understanding the complex factors that affect a destination’s competitiveness is the first step to enhancing it.
The World Economic Forum’s Travel and Tourism Competitiveness Index (TTCI) uses fourteen different related factors to measure competitiveness 36:
29 Michell, J. And Faal, J. (2008) The Gambian Tourist Value Chain and Prospects for Pro-Poor Tourism, Working Paper 289, Overseas Development Insititute, London, p. vii 30 Christie, I. and Crompton, D. E. (2001) Tourism in Africa, Working Paper Series No. 12, World Bank, New York 31 World Economic Forum (WEF) (2009) The Africa Competitiveness Report, 2009, WEF, Geneva 32 Porter, M. E. (1980) Competitive Strategy: Techniques for Analysing Industry and Competitors. The Free Press, New York. Porter’s Diamond model has been widely used to compare competitiveness between regions and destinations. The model identifies four key forces as interacting corners of a diamond (factor conditions, demand conditions, supporting industries, and firm strategy) 33 Crouch, G. I. And Ritchie, B. J. R. (1999) “Tourism, Competitiveness, and Societal Prosperity”, Journal of Business Research, Vol. 44,137-152 34 World Bank, (2009) Competitive Africa Strategies to Leverage the New Global Economy, Report Concept Note, Washington D.C., p. 7 35 In tourism, “capacity utilization” can be used as a proxy measure for competitiveness. Hotel occupancy rates, plane load factors, and REVPAR (revenue per occupied room) may be useful in this regard. These are areas where further research is needed. 36 World Economic Forum (WEF) (2009) Travel and Tourism Competitiveness Report 2009: Managing in a Time of Turbulence, WEF, Geneva. Fifteen of the 25 SSA countries included in the survey were right on the bottom of the competitiveness tables. Mauritius is ranked the highest in SSA. South Africa is next in the region but only 62nd overall due to concerns about health, safety, and sanitation. Botswana is third in the region

Final Report, November 2009
19
• Policy rules and regulations: the extent to which the policy environment is conducive to developing tourism in that country
• Environmental regulations: how the environment is being taken care of • Safety and Security: crime, violence, and terrorism risk • Health and hygiene: food and water quality and the quality of medical services • Government priority: budgetary preference given to the tourism sector and investment in
marketing • Air transport: quality, seats, departures, airport density • Ground transport: quality of roads, rails, and ports • General tourism infrastructure (rooms, car rental, ATMs) • ICT infrastructure: internet access and communications • Price competitiveness: taxes, airport charges, and cost of goods • Human resources: education, health, and training levels of the workforce • Affinity for travel and tourism: attitudes to tourists and importance of the industry • National perception: how open the culture and society are to the development of tourism • Natural and cultural resources: critical measure of tourism assets
The TTCI does not include all aspects of competitiveness, but it is a useful starting point for discussion. SSA results have been included in the tourism database for this project.
RESULTS
The second section of the report examines the results of the tourism demand and supply research by region. Details of the results for each country are contained in the tourism database.
Tourism Performance
Tourism performance for SSA was assessed by analysis of patterns of tourist arrivals (by source market, length of stay, and purpose of visit) and by analysis of patterns of tourism receipts (including employment, investment, and contribution to GDP and exports).
Tourism Arrivals
Analysis of tourist arrivals in 200737 shows that at a regional level, Southern Africa and East Africa are performing considerably better than West Africa and Central Africa. Southern Africa is the top SSA region for arrivals; it attracts just under half (44%) of all arrivals to SSA. East Africa attracts 37% of SSA tourists. West Africa gets 15%. Central Africa receives only 3% of SSA tourists.
Tourist arrival figures in some countries are inflated by large numbers of land border crossings, however. These can be eliminated from the analysis by just analyzing long-haul tourist arrivals38, shown in Figure 2.
Figure 2. Map of Long-haul Tourist Arrivals, 2007
37 2008 data is not yet available for all countries. Where data other than 2007 is used, this is shown in the table 38 Long-haul tourist arrivals are defined as all tourists from outside of the SSA region (total tourist arrivals minus total Africa arrivals)

Final Report, November 2009
20
• East Africa attracts almost half of all long-haul tourists (47%). Kenya attracts the most long-haul visitors (805,000). Mauritius and Tanzania are next in long-haul arrivals
• Southern Africa receives just 22% of long-haul visitors. South Africa is the highest performer in Southern Africa. It attracts 1.3 million long-haul tourists
• West Africa receives 28% of long-haul visitors. Nigeria is the highest performer in long-haul arrivals (939,324). Senegal is next with 436,673 arrivals
• Central Africa receives 3% of long-haul tourists to the region. Angola receives the most long-haul arrivals (163,287)
The countries that received a considerably higher ranking39 for long-haul arrivals than for total tourist arrivals include: Angola, Tanzania, Sudan, Madagascar, Ethiopia, Senegal, Cape Verde, Mali, The Gambia, Sierra Leone, and Guinea Bissau. The most surprising results were that Botswana, which ranks 3rd in SSA for total tourist arrivals, ranks only 17th for long-haul arrivals. This is due to nearly 2 million regional tourists every year. Other countries that ranked considerably lower for long-haul arrivals than for total tourists include: Zimbabwe, Rwanda, Mozambique, Namibia, Swaziland, Lesotho, and Côte D’Ivoire.
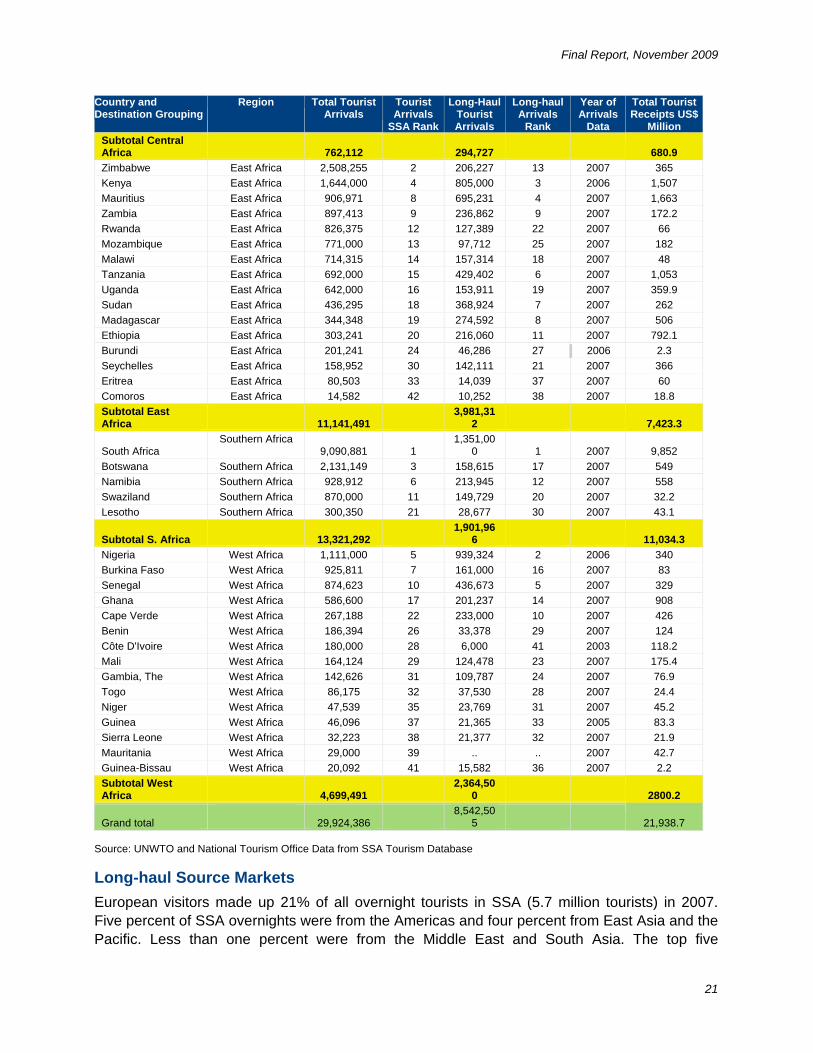
Table 3. Tourist Arrivals to Sub Saharan Africa by Rank and Region, 2007
Country and Destination Grouping
Region Total Tourist Arrivals
Tourist Arrivals
SSA Rank
Long-Haul Tourist Arrivals
Long-haul Arrivals
Rank
Year of Arrivals
Data
Total Tourist Receipts US$
Million Gabon Central Africa 222,257 23 .. .. 2003 74
Angola Central Africa 194,730 25 163,287 15 2007 236
Cameroon Central Africa 185,000 27 80,000 26 2006 212.4
Chad Central Africa 64,992 34 17,000 35 2007 63.6
Congo, Dem. Rep. Central Africa 47,492 36 19,725 34 2007 26.2
Congo, Rep. of Central Africa 21,611 40 .. .. 2002 58
Central African Republic
Central Africa 13,764 43 6,622 40 2007 7.3
São Tomé and Príncipe
Central Africa 12,266 44 8,093 39 2006 3.4
39 More than five rank places higher
Final Report, November 2009
21
Country and Destination Grouping
Region Total Tourist Arrivals
Tourist Arrivals
SSA Rank
Long-Haul Tourist Arrivals
Long-haul Arrivals
Rank
Year of Arrivals
Data
Total Tourist Receipts US$
Million Subtotal Central Africa
762,112 294,727 680.9
Zimbabwe East Africa 2,508,255 2 206,227 13 2007 365
Kenya East Africa 1,644,000 4 805,000 3 2006 1,507
Mauritius East Africa 906,971 8 695,231 4 2007 1,663
Zambia East Africa 897,413 9 236,862 9 2007 172.2
Rwanda East Africa 826,375 12 127,389 22 2007 66
Mozambique East Africa 771,000 13 97,712 25 2007 182
Malawi East Africa 714,315 14 157,314 18 2007 48
Tanzania East Africa 692,000 15 429,402 6 2007 1,053
Uganda East Africa 642,000 16 153,911 19 2007 359.9
Sudan East Africa 436,295 18 368,924 7 2007 262
Madagascar East Africa 344,348 19 274,592 8 2007 506
Ethiopia East Africa 303,241 20 216,060 11 2007 792.1
Burundi East Africa 201,241 24 46,286 27 2006 2.3
Seychelles East Africa 158,952 30 142,111 21 2007 366
Eritrea East Africa 80,503 33 14,039 37 2007 60
Comoros East Africa 14,582 42 10,252 38 2007 18.8
Subtotal East Africa
11,141,491
3,981,312 7,423.3
South Africa Southern Africa
9,090,881 1 1,351,00
0 1 2007 9,852
Botswana Southern Africa 2,131,149 3 158,615 17 2007 549
Namibia Southern Africa 928,912 6 213,945 12 2007 558
Swaziland Southern Africa 870,000 11 149,729 20 2007 32.2
Lesotho Southern Africa 300,350 21 28,677 30 2007 43.1
Subtotal S. Africa
13,321,292 1,901,96
6 11,034.3
Nigeria West Africa 1,111,000 5 939,324 2 2006 340
Burkina Faso West Africa 925,811 7 161,000 16 2007 83
Senegal West Africa 874,623 10 436,673 5 2007 329
Ghana West Africa 586,600 17 201,237 14 2007 908
Cape Verde West Africa 267,188 22 233,000 10 2007 426
Benin West Africa 186,394 26 33,378 29 2007 124
Côte D'Ivoire West Africa 180,000 28 6,000 41 2003 118.2
Mali West Africa 164,124 29 124,478 23 2007 175.4
Gambia, The West Africa 142,626 31 109,787 24 2007 76.9
Togo West Africa 86,175 32 37,530 28 2007 24.4
Niger West Africa 47,539 35 23,769 31 2007 45.2
Guinea West Africa 46,096 37 21,365 33 2005 83.3
Sierra Leone West Africa 32,223 38 21,377 32 2007 21.9
Mauritania West Africa 29,000 39 .. .. 2007 42.7
Guinea-Bissau West Africa 20,092 41 15,582 36 2007 2.2
Subtotal West Africa
4,699,491
2,364,500 2800.2
Grand total
29,924,386 8,542,50
5 21,938.7
Source: UNWTO and National Tourism Office Data from SSA Tourism Database
Long-haul Source Markets
European visitors made up 21% of all overnight tourists in SSA (5.7 million tourists) in 2007. Five percent of SSA overnights were from the Americas and four percent from East Asia and the Pacific. Less than one percent were from the Middle East and South Asia. The top five

Final Report, November 2009
22
international source markets are France (32%), UK (31%), US (17%), Germany (16%), and Portugal (16%).40
Figure 3. Market Share of Top Five Long-Haul Markets, 2006 and 2007
France
France is in the top five markets for 66% of Sub Saharan African countries and French visitors make up almost a third of the long-haul arrivals to SSA. The most popular destinations for French visitors in 2007 were Mauritius, Senegal, Madagascar, and Burkina Faso, all of which received over 175,000 French visitors. France is also the primary market for Benin, Cameroon, Central African Rep., Chad, Comoros, Côte D'Ivoire, Guinea, Mali, Niger, Seychelles, and Togo.
United Kingdom
The UK is the second most important long-haul source market for SSA, just 1% less than France in 2007. UK visitors are in the top five markets for 57% of Sub Saharan African countries. The most popular destinations for UK visitors in 2007 were South Africa, Kenya, Mauritius, and The Gambia. The UK is also the primary source market for Botswana, Malawi, Swaziland, Uganda, and Zambia. The fastest growing destinations for UK visitors are Malawi, Madagascar, Mauritius, Namibia, and Uganda. The UK is also an important market for Tanzania.
USA
The US is the third most important long-haul market for SSA. Americans are top source market Tanzania, Ghana, Rwanda, Ethiopia, and Zimbabwe, but the primary destination for American tourists is South Africa (287,438). Tanzania and Ghana are the second most important destinations for American tourists. The US is also a growing market for Uganda and Zambia. The fastest growing destinations for American visitors are Lesotho and Malawi. As flight connections improve and the US economy recovers, the American market has great potential for growth. However, Americans are cautious travelers and have a poor geographic understanding of SSA. This, along with high flight costs and long travel times, are significant deterrents.
Germany
German visitors made up 16% of all long-haul visitors to SSA in 2007. The most popular destinations for German visitors to SSA in 2007 were South Africa, Namibia, and Mauritius. German tourists are also primary long-haul source markets for Lesotho and Swaziland. The fastest growing destinations for German markets are Cape Verde and Ethiopia. German tourists are experienced travelers and are found in at least small numbers in virtually all SSA countries.
Portugal
Portuguese visitors accounted for about 3% of long-haul visitors to SSA in 2006 and 2007. Portugal is in the top five source markets for just 10% of Sub Saharan countries. The favorite SSA destination for Portuguese visitors is Cape Verde. Portuguese visitors also visit Angola, Mozambique, and, to a lesser extent, Guinea-Bissau and São Tomé and Príncipe. All of these countries have historical ties to Portugal. Mozambique and Angola are the fastest growing markets for Portugal.
Smaller Markets
40 Pie charts are constructed by adding together arrivals to the top five markets for each country in the SSA Database
Source: UNWTO and National Tourism Office data from SSA Tourism Database

Final Report, November 2009
23
Smaller markets for Sub Saharan Africa include the Netherlands, Italy, Belgium, Sweden, India, Canada, and Ireland. The Netherlands market is important to South Africa, The Gambia, and Ghana. Belgium is the primary market for Congo DR and also for Rwanda. Italians are important for Nigeria, Eritrea, Mauritius, Cape Verde, Tanzania, Seychelles. The fastest growing destinations for Italian visitors are Burkina Faso and Mauritius.
Figure 4. Map of Key Source Markets for Long-haul Tourist Arrivals, 2007
Table 4. Key Source Markets for Long-haul Tourist Arrivals, 2007 France UK US Germany Portugal
Comoros Gambia, The Tanzania Lesotho São Tomé and Príncipe
Senegal South Africa Ghana Namibia Guinea-Bissau
Cameroon Kenya Rwanda Swaziland Cape Verde
Togo Sierra Leone Ethiopia Mozambique
Benin Malawi Zimbabwe Angola
Sudan Botswana Madagascar Zambia Congo, Dem. Rep. Uganda Chad Central African Republic Côte D'Ivoire Niger Burkina Faso Seychelles Mali Guinea
Source: UNWTO and National Tourism Office Statistics from SSA Tourism Database
Final Report, November 2009
24
France UK US Germany Portugal
Mauritius Nigeria
18 8 5 3 5
Source: UNWTO and National Tourism Office from SSA Tourism Database
Emerging Source Markets
Emerging source markets for SSA include Spain, Australia, India, China, Spain, and Russia. Potential markets include Brazil, Japan, and Lebanon. The number of SSA destinations that have received Chinese Approved Destination Status has increased and now includes South Africa, Tanzania, Ethiopia, Kenya, Seychelles, Zambia, Zimbabwe, and Mauritius. The actual numbers of Chinese visitors to SSA is, however, still small. The top destinations for Chinese visitors are Angola (18,500 in 2007) and Nigeria (33,290 in 2005).
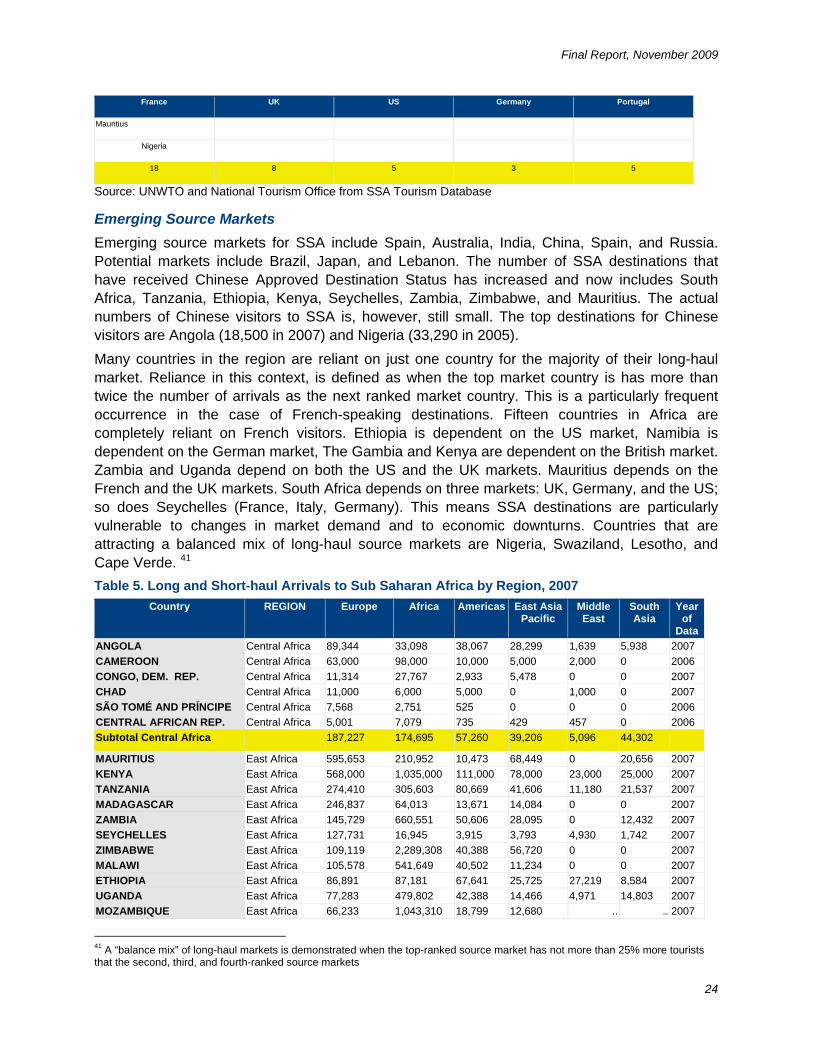
Many countries in the region are reliant on just one country for the majority of their long-haul market. Reliance in this context, is defined as when the top market country is has more than twice the number of arrivals as the next ranked market country. This is a particularly frequent occurrence in the case of French-speaking destinations. Fifteen countries in Africa are completely reliant on French visitors. Ethiopia is dependent on the US market, Namibia is dependent on the German market, The Gambia and Kenya are dependent on the British market. Zambia and Uganda depend on both the US and the UK markets. Mauritius depends on the French and the UK markets. South Africa depends on three markets: UK, Germany, and the US; so does Seychelles (France, Italy, Germany). This means SSA destinations are particularly vulnerable to changes in market demand and to economic downturns. Countries that are attracting a balanced mix of long-haul source markets are Nigeria, Swaziland, Lesotho, and Cape Verde. 41
Table 5. Long and Short-haul Arrivals to Sub Saharan Africa by Region, 2007
Country REGION Europe Africa Americas East Asia Pacific
Middle East
South Asia
Year of
Data
ANGOLA Central Africa 89,344 33,098 38,067 28,299 1,639 5,938 2007
CAMEROON Central Africa 63,000 98,000 10,000 5,000 2,000 0 2006
CONGO, DEM. REP. Central Africa 11,314 27,767 2,933 5,478 0 0 2007
CHAD Central Africa 11,000 6,000 5,000 0 1,000 0 2007
SÃO TOMÉ AND PRÍNCIPE Central Africa 7,568 2,751 525 0 0 0 2006
CENTRAL AFRICAN REP. Central Africa 5,001 7,079 735 429 457 0 2006
Subtotal Central Africa 187,227 174,695 57,260 39,206 5,096 44,302
MAURITIUS East Africa 595,653 210,952 10,473 68,449 0 20,656 2007
KENYA East Africa 568,000 1,035,000 111,000 78,000 23,000 25,000 2007
TANZANIA East Africa 274,410 305,603 80,669 41,606 11,180 21,537 2007
MADAGASCAR East Africa 246,837 64,013 13,671 14,084 0 0 2007
ZAMBIA East Africa 145,729 660,551 50,606 28,095 0 12,432 2007
SEYCHELLES East Africa 127,731 16,945 3,915 3,793 4,930 1,742 2007
ZIMBABWE East Africa 109,119 2,289,308 40,388 56,720 0 0 2007
MALAWI East Africa 105,578 541,649 40,502 11,234 0 0 2007
ETHIOPIA East Africa 86,891 87,181 67,641 25,725 27,219 8,584 2007
UGANDA East Africa 77,283 479,802 42,388 14,466 4,971 14,803 2007
MOZAMBIQUE East Africa 66,233 1,043,310 18,799 12,680 .. .. 2007
41 A “balance mix” of long-haul markets is demonstrated when the top-ranked source market has not more than 25% more tourists that the second, third, and fourth-ranked source markets

Final Report, November 2009
25
Country REGION Europe Africa Americas East Asia Pacific
Middle East
South Asia
Year of
Data
SUDAN East Africa 56,718 65,444 15,526 296,680 0 0 2007
RWANDA East Africa 39,707 732,464 23,349 39,707 1,872 22,754 2007
BURUNDI East Africa 32,199 140,868 4,025 10,062 0 0 2006
COMOROS East Africa 9,450 4,241 420 382 0 0 2007
ERITREA East Africa 5,408 5,051 1,474 1,935 2,249 2,973 2007
Subtotal East Africa 2,546,946 7,682,382 524,846 703,618 75,421 130,481
SOUTH AFRICA Southern Africa 998,000 4,272,000 193,000 122,000 0 38,000 2007
NAMIBIA Southern Africa 194,603 690,148 19,342 0 0 0 2007
SWAZILAND Southern Africa 118,536 1,075,005 19,184 12,009 0 0 2007
BOTSWANA Southern Africa 89,000 1,758,285 41,769 27,846 0 0 2005
LESOTHO Southern Africa 19,772 271,475 3,385 5,120 400 0 2007
Subtotal S. Africa 1,419,911 8,066,913 276,680 166,975 400 38,000
NIGERIA West Africa 506,000 2,107,870 129,219 177,001 55,104 72,000 2006
SENEGAL West Africa 324,080 437,970 26,004 86,589 0 0 2007
CAPE VERDE West Africa 228,000 300 5,000 0 0 0 2007
BURKINA FASO West Africa 127,000 121,000 20,000 12,000 2,000 0 2007
GAMBIA, THE West Africa 108,148 17,541 1,639 0 0 0 2007
MALI West Africa 104,308 29,378 17,564 1,416 1,190 0 2007
GHANA West Africa 95,728 140,066 73,858 7,917 9,602 14,132 2007
TOGO West Africa 31,181 48,526 2,928 2,649 772 0 2007
BENIN West Africa 26,283 153,000 2,299 780 1,762 2,254 2007
NIGER West Africa 17,589 23,770 3,898 1,778 504 0 2007
GUINEA West Africa 14,622 18,118 1,883 2,997 1,000 863 2006
SIERRA LEONE West Africa 11,327 10,846 6,169 2,916 965 0 2007
GUINEA-BISSAU West Africa 10,289 13,354 2,409 2,884 0 0 2007
Subtotal West Africa 1,604,555 3,121,739 292,870 298,927 78,899 89,249
Grand TOTAL 5,758,639 19,045,729 1,151,656 1,208,726 159,816 302,032
Notes Excluded from this table are Gabon, Congo Republic, Equatorial Guinea, Liberia, and Somalia which do not have recent tourist arrival data by region. Some countries include all Asian arrivals in East Asia Pacific so the total may be artificially high.
Source: UNWTO and National Tourism Office from SSA Tourism Database
Short-haul Source Markets
Statistics on inter-regional travel were available from 34 of the 47 countries in the study. South Africa is the largest source market for inter-regional travel, supplying about 47% of all inter-regional visitors. Lesotho is, surprisingly, the next largest source market for inter-regional travel. More than two million visitors travel from Lesotho to South Africa every year. The third largest flow of inter-regional visitors is from South Africa to Zimbabwe (1,362,982).
• In West Africa, people from Niger travel to Nigeria, Gambians travel to Senegal, Nigerians travel to Ghana, Burkinabe people travel to Côte D’Ivoire, and people from the Congo Republic go to Benin. Nigeria is the only country to receive over a million inter-regional visitors.
• For Central Africa, South Africa, Cameroon, and Angola are the most significant inter-regional source markets. Cameroon receives the largest number of inter-regional travelers in Central Africa.
• In East Africa, South Africa is the main source market for inter-regional travel. Kenyans and Tanzanians are secondary regional source markets for East Africa. There are also significant “nearest neighbor” tourist flows: Kenyans and Tanzanians to Uganda and Zambia, Burundians to Rwanda, Ugandans to Rwanda, and Rwandans to Uganda. Kenya, Mozambique, and Zimbabwe all receive over a million inter-regional tourists every year.

Final Report, November 2009
26
• In Southern Africa, South Africans and people from Lesotho travel the most. Zimbabweans travel in large numbers to Botswana. Botswana and Lesotho are the largest destinations for inter-regional visitors after South Africa.
Short-haul travel patterns in Sub Saharan Africa are closely related to geography, trading partners, population, nearest neighbors, and relative incomes. Interviews with key stakeholders in the region suggest that, except for South Africans (who seem to travel mostly for holiday), a large proportion of inter-regional travel is for shopping, family, or commercial reasons. As incomes rise, the number of inter-regional leisure tourists is likely to rise. Markets to watch for increasing inter-regional travel include Nigeria and Zimbabwe.
Purpose of Visit
The SSA Tourism Database has information on purpose of visit for 33 countries in SSA. On average, 36% of visitors to SSA are engaged in leisure activities and 25% are engaged in business activities. The SSA Tourism Database has information on the proportion of visitors whose purpose is “visiting friends and relatives” for only four countries (Namibia, South Africa, Botswana, and Guinea-Bissau). But based on these examples, it seems likely that around 25% of visitors to SSA are VFR. This would explain the large number of visitors currently in the “other” category (see Table 6.)
• East Africa has the highest percentage of leisure visitors in SSA, 47%. The destinations in East Africa with the highest proportion of leisure visitors are Seychelles (89%), Mauritius (87%).
• Southern Africa has the second highest proportion of leisure tourists: 36% of all visitors are traveling for leisure purposes. Namibia has the largest proportion of leisure visitors in East Africa (51.1%)
• West Africa has the largest proportion of business tourists in SSA compared to all visitors to West Africa: 37%. Burkina Faso and Niger record that more than 50% of their visitors are arriving on business.
• Central Africa has an almost equal number of leisure and business tourists. Business tourism is most important to Congo and leisure tourism is important to São Tome and Príncipe.
Figure 5. Pie Chart of Purpose of Visit for Visitors to Sub Saharan Africa, 2007
Length of Stay

Final Report, November 2009
27
The SSA Tourism Database has information on purpose of visit for 33 countries in SSA. The average length of stay for tourists to SSA is 5.6 nights.
• East Africa visitors have an average length of stay of eight nights. Kenya, Tanzania, Madagascar, Seychelles, and Malawi all have an average length of stay of more than ten nights.
• Southern Africa visitors have an average length of stay of eight nights. In Southern Africa, Namibia is, surprisingly, the high performer for length of stay. At 17.1 nights, Namibia has the longest length of stay in the whole SSA region by a substantial amount.
• West Africa visitors have an average length of stay of 4.6 nights. Ghana has the longest average length of stay in West Africa: 9.9 nights.
• Central Africa visitors have the shortest average length of stay: 3.2 nights
Those destinations with a higher percentage of leisure visitors tend to have a longer length of stay. SSA island countries were found to have a longer length of stay and a larger percentage of leisure visitors. SSA landlocked countries have a higher number of business visitors and shorter length of stay.

Final Report, November 2009
28
Table 6. Average Length of Stay and Purpose of Visit for Sub Saharan Countries, 2007
Country Region Length of Stay (days)
Leisure (%) Business (%) Visiting Friends & Rels. (%)
Other (%)
CONGO, DEM. REP. Central Africa .. .. 55.0 .. 28.0
SÃO TOMÉ AND PRÍNCIPE Central Africa .. 54.0 5.0 .. 41.0
ANGOLA Central Africa 4.0 28.0 14.0 .. 57.0
CENTRAL AFRICAN REP. Central Africa 3.8 13.7 40.5 .. 44.9
CONGO, REP. OF Central Africa 3.5 .. .. .. CHAD Central Africa 3.0 .. .. CAMEROON Central Africa 1.8 .. .. .. Average Central Africa 3.2 28.2 28.6 42.7
BURUNDI East Africa .. 33.0 32.0 .. 35.0
UGANDA East Africa .. 21.8 17.1 .. 61.1
RWANDA East Africa .. 6.0 35.0 .. 34.0
MADAGASCAR East Africa 17.0 62.0 29.0 .. 9.0
KENYA East Africa 12.1 71.0 18.0 .. 11.0
TANZANIA East Africa 11.0 81.0 8.0 .. 11.0
MALAWI East Africa 11.0 26.0 49.0 .. 25.0
SEYCHELLES East Africa 10.1 89.0 6.0 .. 5.0
MAURITIUS East Africa 9.7 87.8 3.7 .. 8.4
SUDAN East Africa 8.0 64.0 23.0 .. 13.0
COMOROS East Africa 7.0 19.8 30.0 .. 50.0
ZAMBIA East Africa 6.9 22.7 37.9 .. 39.3
ERITREA East Africa 3.1 8.0 12.0 .. 80.0
ZIMBABWE East Africa 3.0 84.0 15.0 .. 1.0
ETHIOPIA East Africa 3.0 42.2 20.1 .. 37.9
MOZAMBIQUE East Africa 2.1 34.0 46.0 .. 20.0
Average East Africa 8.0 47.0 23.9 27.5
NAMIBIA Southern Africa 19.1 51.1 9.6 37.7 1.6
SOUTH AFRICA Southern Africa 8.2 25.3 17.9 24.2 31.5
LESOTHO Southern Africa 3.0 37.8 13.2 .. 49.0
BOTSWANA Southern Africa 1.8 15.8 4.2 21.1 45.8
SWAZILAND Southern Africa 1.0 48.0 13.0 .. 39.0
Average S. Africa 6.6 35.6 11.6 8.3 29.1
BENIN West Africa 2.9 .. BURKINA FASO West Africa 2.9 22.2 56.6 .. 21.4
CAPE VERDE West Africa 4.3 .. CÔTE D’IVOIRE West Africa 3.4 34.3 4.2 .. 11.3
GAMBIA, THE West Africa 7.0 86.0 1.0 .. 11.0
GHANA West Africa 9.9 20.0 38.0 .. 42.0
GUINEA West Africa 3.3 17.3 43.3 .. 38.6
GUINEA-BISSAU West Africa .. 27.0 42.0 30.0 1.0
MALI West Africa 2.4 .. .. .. MAURITANIA West Africa .. 54.0 46.0 .. 0.0
NIGER West Africa 7.0 22.9 52.0 .. 25.0
NIGERIA West Africa .. 40.0 50.0 .. 10.0
SENEGAL West Africa 3.5 .. .. .. SIERRA LEONE West Africa 7.0 12.5 34.3 .. 53.0
TOGO West Africa 1.7 .. .. .. Average West Africa 4.6 33.6 36.7 21.3

Final Report, November 2009
29
Country Region Length of Stay (days)
Leisure (%) Business (%) Visiting Friends & Rels. (%)
Other (%)
SSA Average 5.6 36.1 25.2 30.2
Note Year of data varies 2004-2008. Only countries with data for one or more of these years are included. Source: UNWTO and National Tourism Office data from SSA Tourism Database
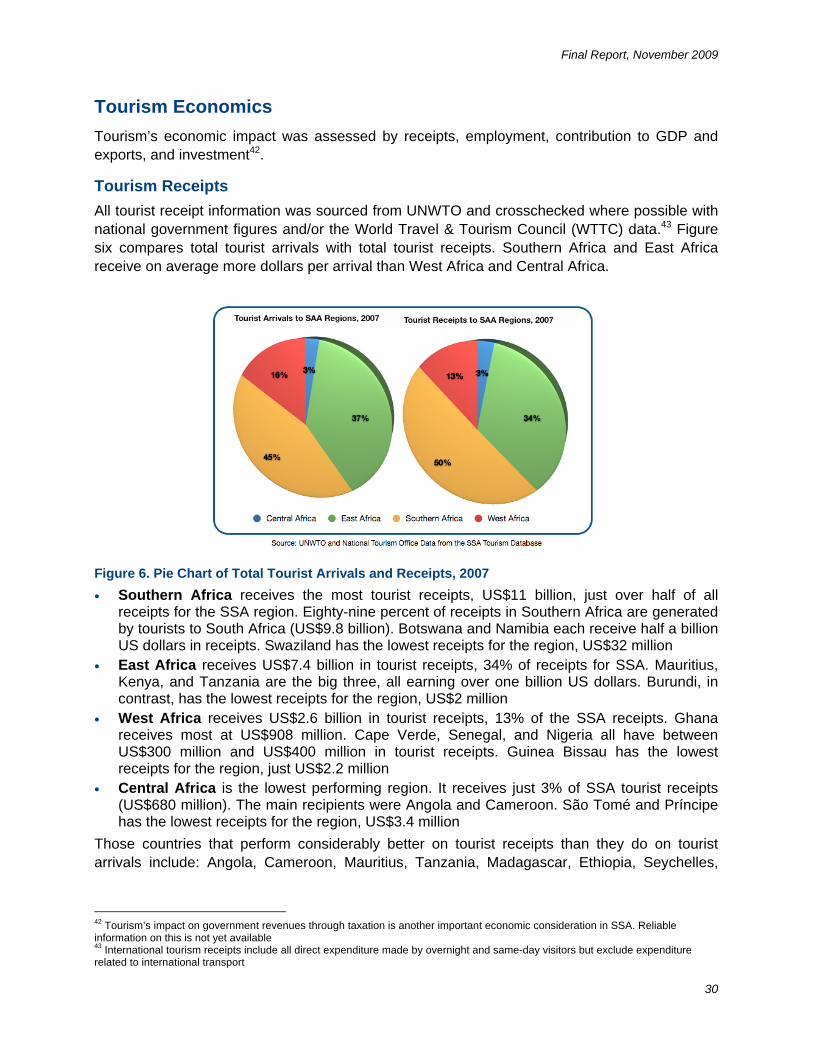
Final Report, November 2009
30
Tourism Economics
Tourism’s economic impact was assessed by receipts, employment, contribution to GDP and exports, and investment42.
Tourism Receipts
All tourist receipt information was sourced from UNWTO and crosschecked where possible with national government figures and/or the World Travel & Tourism Council (WTTC) data.43 Figure six compares total tourist arrivals with total tourist receipts. Southern Africa and East Africa receive on average more dollars per arrival than West Africa and Central Africa.
Figure 6. Pie Chart of Total Tourist Arrivals and Receipts, 2007
• Southern Africa receives the most tourist receipts, US$11 billion, just over half of all receipts for the SSA region. Eighty-nine percent of receipts in Southern Africa are generated by tourists to South Africa (US$9.8 billion). Botswana and Namibia each receive half a billion US dollars in receipts. Swaziland has the lowest receipts for the region, US$32 million
• East Africa receives US$7.4 billion in tourist receipts, 34% of receipts for SSA. Mauritius, Kenya, and Tanzania are the big three, all earning over one billion US dollars. Burundi, in contrast, has the lowest receipts for the region, US$2 million
• West Africa receives US$2.6 billion in tourist receipts, 13% of the SSA receipts. Ghana receives most at US$908 million. Cape Verde, Senegal, and Nigeria all have between US$300 million and US$400 million in tourist receipts. Guinea Bissau has the lowest receipts for the region, just US$2.2 million
• Central Africa is the lowest performing region. It receives just 3% of SSA tourist receipts (US$680 million). The main recipients were Angola and Cameroon. São Tomé and Príncipe has the lowest receipts for the region, US$3.4 million
Those countries that perform considerably better on tourist receipts than they do on tourist arrivals include: Angola, Cameroon, Mauritius, Tanzania, Madagascar, Ethiopia, Seychelles,
42 Tourism’s impact on government revenues through taxation is another important economic consideration in SSA. Reliable information on this is not yet available 43 International tourism receipts include all direct expenditure made by overnight and same-day visitors but exclude expenditure related to international transport
Final Report, November 2009
31
and Ghana. 44 This is a good indication of the competitiveness of these destinations, as it means there is higher average spending by tourists in these countries. Tanzania produced especially good results and ranked 4th in SSA for receipts, yet it was only 15th for arrivals. Ghana performed best in West Africa and ranked 5th for receipts yet only 17th for arrivals. Ethiopia has good potential. It ranked 6th for receipts while only 20th for arrivals.
Those countries doing considerably less well on receipts compared to arrivals include: Malawi, Burundi, Botswana, Swaziland, Lesotho, Nigeria, Burkina Faso. All these countries except Malawi have a short length of stay. Most have a large percentage of inter-regional visitors. 45
Contribution to GDP and Service Exports
Tourism’s contribution to GDP in the SSA region varies between the highest, in Seychelles at 50.3%, and the lowest, in Sudan at 0.6%. The average contribution of tourism to GDP across the whole SSA region is 5.9%.
On a sub-regional basis, tourism contributes most to East Africa’s GDP (average 8.9%). West Africa’s tourism industry contributes an average of 5.59% to GDP, higher than Southern Africa’s average of 3.9%. Tourism contributes just 1.1% to Central Africa’s GDP.
In countries with diverse economies and economies reliant on oil, gold, and mining, such as South Africa, tourism’s contribution to GDP may not be the best measure of tourism’s importance. Other economic indicators included in the database are the contribution of tourism to service exports and the employment effect of tourism.
Tourism contributes an average of 52% to the export of services across the region.
• In Central Africa, tourism makes up 61% of service exports. Angola and São Tomé and Príncipe rely most on tourism exports.
• In Southern Africa, tourism accounts for 57% of service exports. Tourism contributes most to exports in Namibia (90%) and South Africa (72%).
• In East Africa, tourism accounts for 54% of service exports. Mauritius and Seychelles are the countries most reliant on tourism exports.
• In West Africa, tourism accounts for 54% of tourism exports. Cape Verde and The Gambia have highest reliance on tourism exports.
Tourism Employment
WTTC estimates that direct travel and tourism employment in the region totals 3.3 million.46
• East Africa has 43% of all tourism jobs (1.1 million) • West Africa, rather surprisingly, has 30% of SSA tourism employment (814,500). Nigeria
has the most tourism employment, 287,000. • South Africa reports just 22% of SAA tourism jobs: 527,000. • Central Africa reports only 100,000 tourism jobs, half of them in Cameroon.
Employment in tourism appears to have grown the fastest in Mauritius over the last five years. WTTC expect Seychelles, Namibia, Togo, Zambia, and Ghana to have the fastest growth in tourism employment in 2009.
44 SSA rank for tourist receipts is more than 10 places higher than the SSA rank for arrivals 45 SSA rank for tourist receipts is more than 10 places lower than the SSA rank for arrivals 46 WTTC data is based upon simulated Tourism Satellite Accounting (TSA) model that forecasts tourism’s effect on economic activity and employment. The TSA model uses historic data as well as economic research to make assumptions and forecasts. The model is a useful tool for countries that do not have their own TSA model in place but they are not 100% reliable. Care should be taken in their interpretation, and the information should be used in combination with other economic data

Final Report, November 2009
32
Figure 7. Map of the Contribution of Tourism to GDP in Sub Saharan Africa, 2007
Figure 8. Map of Tourism Employment in Sub Saharan Africa, 2007
Table 7. Key Economic Indicators for Tourism in Sub Saharan Africa, 2007 and 2008
Country Region Total Tourism Receipts
(US$ Million)
Contribution of Tourism
to GDP
Exports of Services
Travel and Tourism
Employment
ANGOLA Central Africa 236.00 0.40 75.90 31,400
CAMEROON Central Africa 212.40 1.10 36.40 50,000
GABON Central Africa 74.00 1.00 47.40 3,500
CHAD Central Africa 63.60 0.70 .. 7,100
CONGO, REP. OF Central Africa 58.00 .. .. 1,900
CONGO, DEM. REP. Central Africa 26.20 1.40 .. ..
CENTRAL AFRICAN REP. Central Africa 7.30 .. .. 7,400
SÃO TOMÉ AND PRÍNCIPE
Central Africa 3.40 2.30 85.00 1,300
Subtotal Central Africa 680.90 1.15 61.18 102,600
MAURITIUS East Africa 1,663.00 26.10 75.40 77,700
KENYA East Africa 1,507.00 5.10 55.80 168,200
TANZANIA East Africa 1,053.00 6.50 61.40 288,700
ETHIOPIA East Africa 792.10 4.00 57.80 ..
MADAGASCAR East Africa 506.00 6.90 51.70 156,700
SEYCHELLES East Africa 366.00 50.30 77.50 17,600
ZIMBABWE East Africa 365.00 6.50 .. 47,900
UGANDA East Africa 359.90 8.70 71.90 177,100
SUDAN East Africa 262.00 0.60 68.20 39,200
MOZAMBIQUE East Africa 182.00 2.30 39.70 ..
ZAMBIA East Africa 172.20 1.20 49.50 20,900
RWANDA East Africa 66.00 5.30 36.90 33,700
ERITREA East Africa 60.00 .. .. ..
MALAWI East Africa 48.00 1.40 .. 83,500
Source: UNWTO and National Tourism Office Statistics from SSA Tourism Database
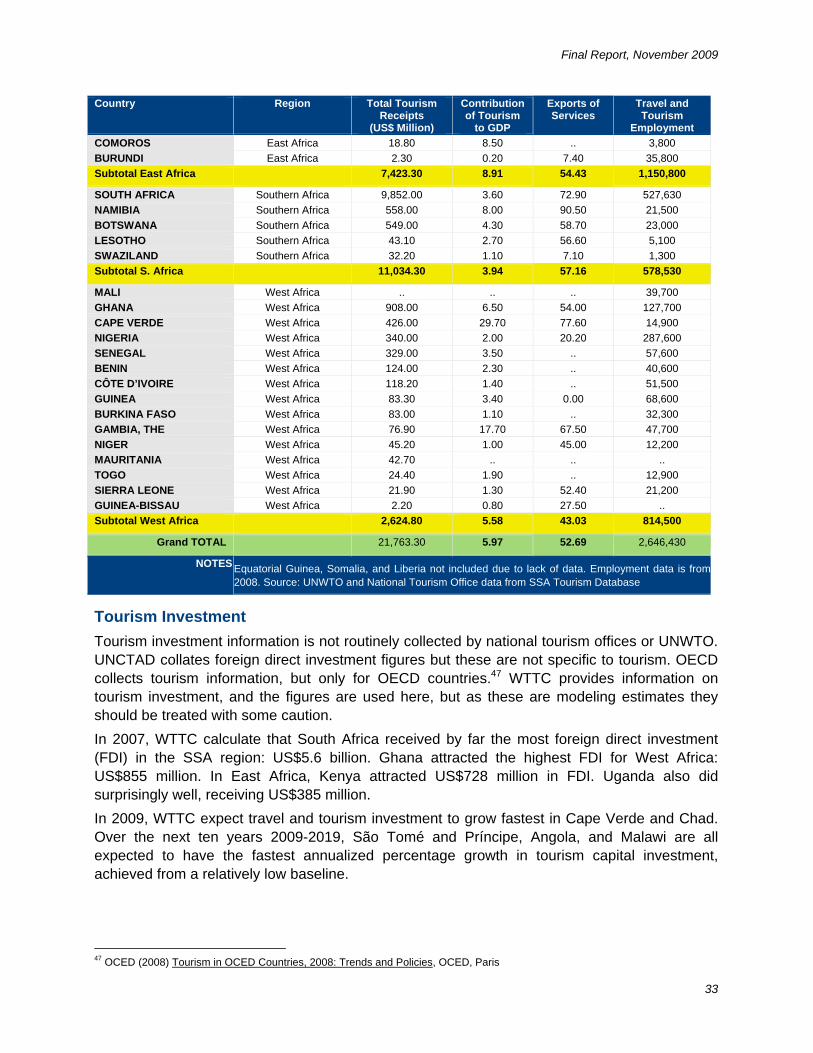
Final Report, November 2009
33
Country Region Total Tourism Receipts
(US$ Million)
Contribution of Tourism
to GDP
Exports of Services
Travel and Tourism
Employment
COMOROS East Africa 18.80 8.50 .. 3,800
BURUNDI East Africa 2.30 0.20 7.40 35,800
Subtotal East Africa 7,423.30 8.91 54.43 1,150,800
SOUTH AFRICA Southern Africa 9,852.00 3.60 72.90 527,630
NAMIBIA Southern Africa 558.00 8.00 90.50 21,500
BOTSWANA Southern Africa 549.00 4.30 58.70 23,000
LESOTHO Southern Africa 43.10 2.70 56.60 5,100
SWAZILAND Southern Africa 32.20 1.10 7.10 1,300
Subtotal S. Africa 11,034.30 3.94 57.16 578,530
MALI West Africa .. .. .. 39,700
GHANA West Africa 908.00 6.50 54.00 127,700
CAPE VERDE West Africa 426.00 29.70 77.60 14,900
NIGERIA West Africa 340.00 2.00 20.20 287,600
SENEGAL West Africa 329.00 3.50 .. 57,600
BENIN West Africa 124.00 2.30 .. 40,600
CÔTE D’IVOIRE West Africa 118.20 1.40 .. 51,500
GUINEA West Africa 83.30 3.40 0.00 68,600
BURKINA FASO West Africa 83.00 1.10 .. 32,300
GAMBIA, THE West Africa 76.90 17.70 67.50 47,700
NIGER West Africa 45.20 1.00 45.00 12,200
MAURITANIA West Africa 42.70 .. .. ..
TOGO West Africa 24.40 1.90 .. 12,900
SIERRA LEONE West Africa 21.90 1.30 52.40 21,200
GUINEA-BISSAU West Africa 2.20 0.80 27.50 ..
Subtotal West Africa 2,624.80 5.58 43.03 814,500
Grand TOTAL 21,763.30 5.97 52.69 2,646,430
NOTES Equatorial Guinea, Somalia, and Liberia not included due to lack of data. Employment data is from 2008. Source: UNWTO and National Tourism Office data from SSA Tourism Database
Tourism Investment
Tourism investment information is not routinely collected by national tourism offices or UNWTO. UNCTAD collates foreign direct investment figures but these are not specific to tourism. OECD collects tourism information, but only for OECD countries.47 WTTC provides information on tourism investment, and the figures are used here, but as these are modeling estimates they should be treated with some caution.
In 2007, WTTC calculate that South Africa received by far the most foreign direct investment (FDI) in the SSA region: US$5.6 billion. Ghana attracted the highest FDI for West Africa: US$855 million. In East Africa, Kenya attracted US$728 million in FDI. Uganda also did surprisingly well, receiving US$385 million.
In 2009, WTTC expect travel and tourism investment to grow fastest in Cape Verde and Chad. Over the next ten years 2009-2019, São Tomé and Príncipe, Angola, and Malawi are all expected to have the fastest annualized percentage growth in tourism capital investment, achieved from a relatively low baseline.
47 OCED (2008) Tourism in OCED Countries, 2008: Trends and Policies, OCED, Paris
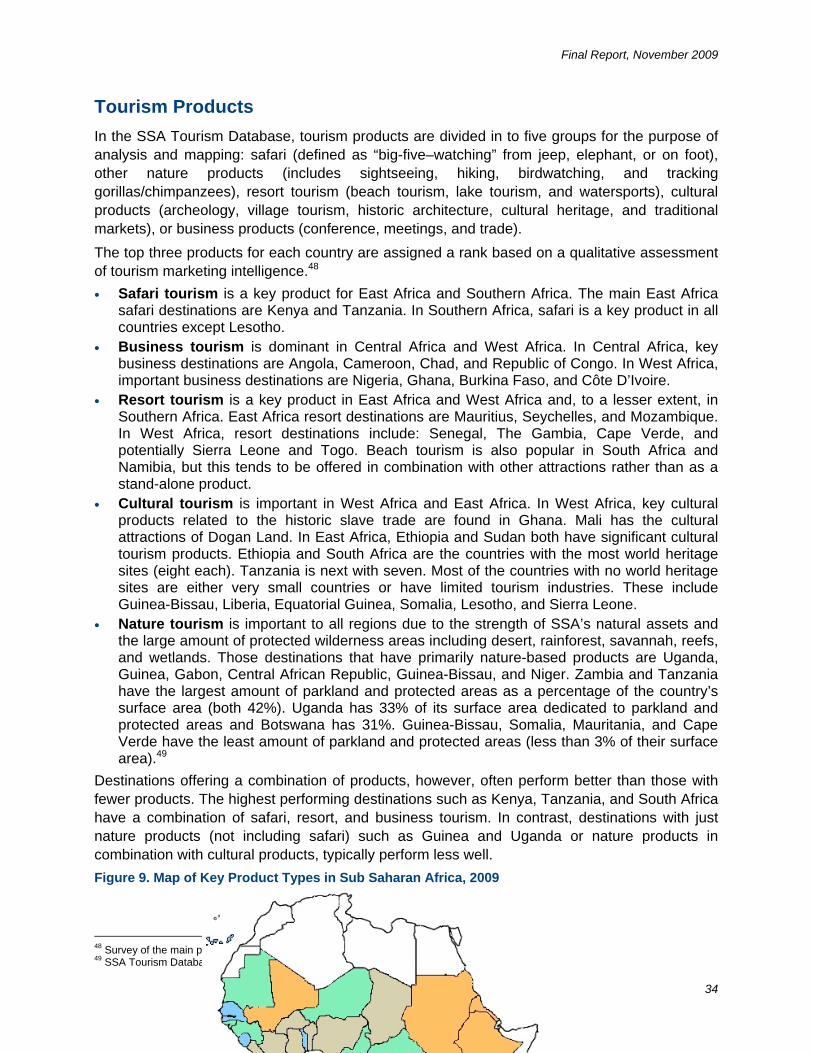
Final Report, November 2009
34
Tourism Products
In the SSA Tourism Database, tourism products are divided in to five groups for the purpose of analysis and mapping: safari (defined as “big-five–watching” from jeep, elephant, or on foot), other nature products (includes sightseeing, hiking, birdwatching, and tracking gorillas/chimpanzees), resort tourism (beach tourism, lake tourism, and watersports), cultural products (archeology, village tourism, historic architecture, cultural heritage, and traditional markets), or business products (conference, meetings, and trade).
The top three products for each country are assigned a rank based on a qualitative assessment of tourism marketing intelligence.48
• Safari tourism is a key product for East Africa and Southern Africa. The main East Africa safari destinations are Kenya and Tanzania. In Southern Africa, safari is a key product in all countries except Lesotho.
• Business tourism is dominant in Central Africa and West Africa. In Central Africa, key business destinations are Angola, Cameroon, Chad, and Republic of Congo. In West Africa, important business destinations are Nigeria, Ghana, Burkina Faso, and Côte D’Ivoire.
• Resort tourism is a key product in East Africa and West Africa and, to a lesser extent, in Southern Africa. East Africa resort destinations are Mauritius, Seychelles, and Mozambique. In West Africa, resort destinations include: Senegal, The Gambia, Cape Verde, and potentially Sierra Leone and Togo. Beach tourism is also popular in South Africa and Namibia, but this tends to be offered in combination with other attractions rather than as a stand-alone product.
• Cultural tourism is important in West Africa and East Africa. In West Africa, key cultural products related to the historic slave trade are found in Ghana. Mali has the cultural attractions of Dogan Land. In East Africa, Ethiopia and Sudan both have significant cultural tourism products. Ethiopia and South Africa are the countries with the most world heritage sites (eight each). Tanzania is next with seven. Most of the countries with no world heritage sites are either very small countries or have limited tourism industries. These include Guinea-Bissau, Liberia, Equatorial Guinea, Somalia, Lesotho, and Sierra Leone.
• Nature tourism is important to all regions due to the strength of SSA’s natural assets and the large amount of protected wilderness areas including desert, rainforest, savannah, reefs, and wetlands. Those destinations that have primarily nature-based products are Uganda, Guinea, Gabon, Central African Republic, Guinea-Bissau, and Niger. Zambia and Tanzania have the largest amount of parkland and protected areas as a percentage of the country’s surface area (both 42%). Uganda has 33% of its surface area dedicated to parkland and protected areas and Botswana has 31%. Guinea-Bissau, Somalia, Mauritania, and Cape Verde have the least amount of parkland and protected areas (less than 3% of their surface area).49
Destinations offering a combination of products, however, often perform better than those with fewer products. The highest performing destinations such as Kenya, Tanzania, and South Africa have a combination of safari, resort, and business tourism. In contrast, destinations with just nature products (not including safari) such as Guinea and Uganda or nature products in combination with cultural products, typically perform less well.
Figure 9. Map of Key Product Types in Sub Saharan Africa, 2009
48 Survey of the main products offered by tour operators, information provided in brochures and guidebooks 49 SSA Tourism Database: from World Bank Development Indicators, 2009

Final Report, November 2009
35
Niche Products In addition to the main types of products mapped above, SSA offers a large range of nature, cultural, business, and resort niche products. Examples include ski tourism in Lesotho, sport tourism in Angola and South Africa, surfing in Benin and Côte D’Ivoire, golf in Cape Verde and Mauritius, and fishing in Guinea-Bissau. Identifying clusters of countries that are developing these niche products can help to develop linkages and support networks for these products.
Cultural Heritage Niches
• Archeological expeditions are popular in Sudan and Ethiopia. Archeological tourism is also emerging in Eritrea, Chad, and Mali
• Tourism related to the historic slave trade is growing to Ghana, Senegal, and Sierra Leone. There is further potential for this in Benin, Côte D’Ivoire, and Liberia
Safari Tourism Niches
• Gorilla and chimpanzee tracking is most popular in Uganda and Rwanda but also possible in Cameroon, Central African Republic, Republic of Congo, Congo DR, Gabon, and Burundi
• Birdwatching is most popular in Botswana, Cameroon, The Gambia, Kenya, Niger, Malawi, Senegal, South Africa, and Mauritania. There is potential for birdwatching in most SSA countries
Resort Tourism Niches
• Scuba diving is popular in Seychelles, Mauritius, Tanzania, and Kenya. Dive tourism is developing in Mozambique and Malawi. There is potential for diving in Comoros, Eritrea, São Tomé and Príncipe
Business Tourism Niches
• Sport tourism is a popular and growing sector, particularly for inter-regional travel. Soccer, cricket, sailing, and car rallies are all popular events in the region. Considerable tourism is expected to be generated by the World Cup Soccer in 2010 in South Africa and neighboring countries
• Fishing (river and deep sea) is popular in Zambia, The Gambia, and Guinea-Bissau. Fishing is also developing in Mozambique, Nigeria, and Zambia. There is potential for fishing in Comoros, Republic of Congo, Congo DR, Guinea, and Sierra Leone. Fishing and golf are popular add-ons for business tourists
Nature Tourism Niches
• River rafting, kayaking, and boat trips have been developed in Zambia, Zimbabwe, The Gambia, and Uganda. There is potential for river-based tourism in Republic of Congo, Congo DR, Central African Republic, and Niger
• Adventure tourism is popular in Namibia and Zambia. It is emerging in Malawi, Lesotho, Uganda, and Swaziland
• Trophy hunting occurs in 23 Sub Saharan countries and generates an estimated US$201 million a year.50 South Africa has the largest trophy hunting industry, but there is also hunting in Zimbabwe, Namibia, and Botswana. In East Africa, hunting is limited to Tanzania. In West Africa, trophy hunting is mostly confined to bird shooting which occurs in Chad, Cameroon, and Central African Republic
50 Lindsey, P. A. (2008) “Trophy Hunting in Sub Saharan Africa: Economic Scale and Conservation Significance,” Best Practices in Sustainable Hunting, pp. 41-47

Final Report, November 2009
36
Table 8. Niche Tourism Products by Sub Saharan Country, 2009 Culture Tourism
NichesNature Tourism Niches Resort Tourism Niches Safari Tourism Niches Business Tourism Niches
Historic Slave Trade Hiking Scuba Diving Wildlife Tracking Sports TourismGhana Angola Seychelles Madagascar South Africa
Senegal Burundi Mauritius Central African Rep. Mozambique
Sierra Leone Cameroon Tanzania Congo, Rep. of Cameroon
Benin Comoros Kenya Côte D’Ivoire Seychelles
Cote D’Ivoire Ethiopia Eritrea Ethiopia
Liberia Guinea Malawi Guinea
Nigeria Lesotho São Tomé & Príncipe Guinea Bissau
Swaziland Rwanda
Zimbabwe Sierra Leone
Music/Festivals Trophy Hunting Birdwatching Gorilla Tourism Golf Tourism
Ghana South Africa Botswana Uganda Cape Verde
Guinea Namibia Cameroon Rwanda Mauritius
Burkina Faso Tanzania Gambia, The Cameroon South Africa
Nigeria Zimbabwe Niger Central African Rep.
Mali Chad Malawi Gabon
Cape Verde Cameroon South Africa Congo, DR
CAR Mauritania Burundi
Madagascar Central African Rep.
Archeology Rafting Horse riding Adventure Fishing
Ethiopia Zambia Mauritius Namibia The Gambia
Sudan Zimbabwe Lesotho Zambia Guinea Bissau
Mali The Gambia South Africa Lesotho Zambia
Chad Uganda Swaziland Mauritania Congo, Rep of
Eritrea Congo, Rep of Niger Congo, DR
Congo, DR Swaziland Guinea
CAR Uganda Sierra Leone
Indigenous Culture Desert Whale watching MalawiEthiopia Botswana South Africa Mali
Namibia Mauritania Madagascar
Mali Namibia Gabon
Kenya Niger
Sudan
Source: SSA Tourism Database
Potential Products
SSA has a potential competitive advantage in the delivery of “combo-holidays”. Combo-holidays are holidays which incorporate one or more of the traditional and niche products. They offer multiple experiences, and appeal to the growing segment of the market that is well-traveled, active, and interested in holidays that combine relaxation with adventure, culture, nature, or business.
• The Adventure tourism combo has huge potential throughout Sub Saharan Africa. Almost limitless opportunities exist for both hard-core and soft adventure holidays, including desert expeditions on camels, river rafting, rainforest hikes, desert island experiences, and wildlife tracking
• The Business tourism combo potential is highly correlated with economic growth. Business tourists tend to have a shorter length of stay than leisure tourists, but their higher daily spend and tendency to travel outside traditional holiday periods makes them a desirable market segment. There are significant opportunities to “add-value” to existing business tourism products with “soft adventure”, retail, entertainment, and tourist attractions. Destinations with high business tourism potential are Nigeria, Ghana, and Cameroon
• The Cultural heritage tourism combo is perhaps the most underdeveloped of Africa’s tourism products. Every country has cultural heritage attractions, indigenous culture, and/or craft products. Often access, signage, and interpretation are needed. Assistance with
Final Report, November 2009
37
product development and marketing are also needed. Combining cultural heritage with adventure, can help raise interest for this product
• The Nature tourism combo was found to have most potential in East and Central Africa. To date, hiking and birdwatching have occurred in relatively low numbers apart from a couple of locations such as Mt. Kilimanjaro. With improved trails, signage, facilities, and marketing there are opportunities for significant increase in revenue from this sector, particularly when sold as combo-holidays
• The Safari combo is gaining momentum. To maintain market share in the face of new entrants, traditional safari destinations are adding to their core product. Safaris on foot, on horseback, or in combination with a cultural experience or visit to a transfrontier park are now becoming more common
• Resort combos also hold great potential. Most long-haul tourists now want to do more than lie on a beach for a week. To stay popular, destinations such as Seychelles, Mauritius, The Gambia, and Senegal need to expand their product base to include inland “soft adventure” as well as beach-based activities
Accommodation
Data on accommodation stock and occupancy rates is poorly documented in Sub Saharan Africa. Although most national tourism office websites include a list of accommodation, very few include the county’s room inventory. Some countries such as Senegal, The Gambia, Burkina Faso, Lesotho, Seychelles, and Namibia publish accommodation statistics, but they are the exception.
Two main sources of accommodation information used in the SSA Tourism Database: UNWTO and hotel chain websites. UNWTO has data on the number of rooms in commercial accommodation (and sometimes occupancies rates) for 28 of the 47 SSA countries in 2006 and for 21 countries in 2007. In addition to this, the profile of twenty-one different international and inter-regional hotel chains operating in SSA was researched and the size and location of the hotels were noted.
Room Stock
Of the 28 countries studied for 2006, South Africa had the greatest number of rooms in the region:61,417. Tanzania was next with 30,600 rooms. Kenya was third with 24,000. Cameroon has a surprisingly high number of rooms (24,803) as does Ghana (21,159). Other countries with over 10,000 rooms include Senegal, Ethiopia, Mozambique, Mauritius, and Benin.
The highest growth in rooms in commercial accommodation from 2004 to 2007 was seen in Ethiopia and Benin. These countries reported a more than 300% increase in their rooms stock during this period. The Gambia and Mali doubled their room stock from 2004 to 2008.
Countries with plans to significantly increase their hotel rooms in the next five years include Angola, Senegal, Cape Verde, Mozambique, Mali, and Benin. In Benin, more than 2,000 additional three-star and four-star rooms are planned for the new tourism development area on the south coast called “the Fishing Route.” In Cape Verde, a large portion of beachfront property on Sal and Boa Vista has been sold to developers to be built upon. Mali doubled its hotel capacity in four years as the economy expanded; its capacity looks likely to grow more.
Occupancy
There appears to be substantial underutilization of capacity across SSA. The highest average occupancy rate in 2006 for those countries with data was Kenya with 87%. Togo reported the

Final Report, November 2009
38
lowest average occupancy rate at 10.7%. Occupancy rates were only available for 16 countries in 2007. Properties in Mauritius reported the highest occupancy rate at 76%, and Togo accommodation again reported the lowest occupancy rates at 9.7%. The average rate across the region in 2007 was 28%. The best growth in occupancy rates from 2006 to 2007 was reported by Mauritius, from 66% occupancy in 2006 to 76% in 2007.
Hotel Brands
A total of 382 branded (chain) hotels were identified in the region (35,862 rooms); 122 hotels belonged to international hotel groups and 260 were regionally-branded hotels.51 The Accor group is the most important international hotel group in Sub Saharan Africa with 46 hotels. Starwood and Intercontinental, the next largest players in the region, have just over 20 hotels each.
• Southern Africa has 57% of the branded hotels in SSA (11,479 rooms52). Ninety per cent of international hotels (197) in this region are located in South Africa. Swaziland and Lesotho have just five international hotels between them.
• East Africa has 25% of the branded hotels in SSA (11,856 rooms). Within East Africa, Tanzania, Kenya, and Mauritius together have two-thirds of the branded hotels. Burundi, Comoros, Eritrea, Somalia, and Sudan have no international hotel brands present. These countries have experienced political instability in recent years.
• West Africa has 15% of the region’s branded hotels. The hotels are much larger in this region, and there are 10,123 branded rooms. The clear high performer in this SSA region is Nigeria, with 20 international hotels. Cape Verde has a number of hotels in development and its hotel stock is expected to increase significantly within the next few years. The low-performers are Niger, Liberia, and Sierra Leone, all post-conflict countries.
• In Central Africa, there are only 12 branded hotels but most are well over 100 rooms. These hotels provide 2,404 rooms. Gabon and Cameroon have the most branded rooms. There are no international hotel chains in Central African Rep, Congo DR, or São Tomé and Príncipe.
The significant differences in the distribution of international and regional hotels can be seen in Figure 10. Most of the regional brands are located in Southern or East Africa, while international hotels have more balanced interests in West and East Africa. The South African chain Protea is the most important regional player (125 hotels, mostly in Southern Africa). Serena Hotels and Sun International are the other important regional chains. While Serena operates exclusively in East Africa, Sun International hotels are mostly in Southern Africa (exception include hotels in Zambia and Nigeria There are two regional brand hotels in Central Africa. These are both Laico hotels.
Hotel Sub-Brand Affiliations Accor: Sofitel, Novotel, Mercure, Ibis, Club Med, and Hotel Formule 1 Intercontinental Group includes: InterContinental, Crowne Plaza, Holiday Inn, and Holiday Inn Express Starwood: Sheraton, Four Points, St. Regis, the Luxury Collection, and Le Meridien Carlson: Radisson and Radisson Blu Hilton: Hilton Hotels
Figure 10. Distribution of International and Regional Hotel Brands in Sub Saharan Africa
51 Includes Serena, Sun International, Protea, Azalai, Laico, Beachcomber, and Three Cities 52 Due to the large number of hotels in South Africa, an average of 50 rooms per hotel was used to calculate total rooms

Final Report, November 2009
39
Although larger numbers of international hotels generally mean the destination is successful at attracting visitors, the reverse is not always true. The Gambia has created a high performing tourism industry without international hotel chains, although a Sheraton is opening there in 2008. Mozambique has very few international hotels but a number of high-end resorts and lodges that are independently branded. Tanzania also has a number of high-end lodges that are operated by small hotel operators, such as CC Africa and Singita, which specialize in upscale properties. Further research is needed to assess the relative strengths and weaknesses of branded versus independent hotels.
Interviews with hotel operators and developers in SSA suggest the following trends in accommodation:
• More hotels are focusing on business rather than leisure markets as business tourism is not so seasonal or vulnerable to economic crises
• There is an increase in independently branded boutique hotels and lodges • There is a growth in mid-range hotels that appeal to regional travelers • Hotel brands are developing in countries where they can operate a cluster of hotels not just
in the capital but also in secondary cities
Airline Connections
SSA is served by both scheduled and charter airlines. This phase of the research focused on scheduled airlines (the role of charter airlines is discussed later in this report). Data concerning scheduled airline flight routings and frequency to and within SSA was obtained from a professional online flight planner (Official Airline Guide (OAG) and cross-checked against individual airline websites. Detailed analysis was made of the routing and schedules of 13 major international airlines53 flying to Sub Saharan Africa. The routes of five regional airlines were also researched. Airlines schedules are dynamic; the results should be interpreted as an indication of the current status of airline connection.
Intercontinental Connections
There are about 733 long-haul flights to SSA each week.
53 Air France, KLM, British Airways, Lufthansa, TAP, Delta, South African Airways, Kenya Airways, Ethiopian Airlines, Emirates, Virgin Atlantic, Brussels Air, and SWISS Air

Final Report, November 2009
40
• East Africa is the best-connected SSA region. It receives 37% of long-haul flight connections; four of the five largest regional airlines serve this region
• West Africa receives 30% of long-haul flights and is the best connected region for regional flights. All the top five regional airlines fly to West Africa
• Southern Africa has fewer connections (23%) due to the long distance from major markets and the fact that South Africa is the only hub in the region. Regional flight connections are dominated by South Africa Airlines
• Central Africa has the worst long-haul connections and receives just 10% of long-haul flights to SSA, but it is connected by four regional airlines: South African Airways, Ethiopia, Kenyan, and Virgin Nigeria
Long-haul connections to SSA are dominated by a small number of international airlines. The top five long-haul airlines serving the region (Air France, South African Airways, Brussels Air, British Airways, and Ethiopian Airlines) provide 61% of the long-haul flights. TAP, Emirates, Virgin Atlantic, Delta, and Swiss Air are the minor long-haul airlines
• Air France is the most important carrier for West and Central Africa, providing 122 flights a week and connecting to 23 of the 47 Sub Saharan countries. Air France has 63 flights a week to West Africa and is the only major airline serving many West African countries. Air France also has 31 flights a week to Central Africa
• South African Airlines has the second most long-haul flights to the region per week (82) but has only two long-haul destinations outside South Africa: Senegal and Mauritius. Similarly, Ethiopian and Kenya Airways have a large number of flights per week (110 in total) but for long-haul flights they only fly into their respective capital cities
• British Airways flies to 12 destinations in the region. All BA flights go to East Africa and Southern Africa except Nigeria, where it flies 13 times a week, and Ghana which receives seven British Airways flights a week. KLM has similar routing to British Airways
• Brussels Air and Lufthansa have the most even distribution of flight destinations across all regions. Brussels Air is particularly important to Rwanda, The Gambia, and Liberia
Analysis of the five main regional airlines54 found Kenya Airways and Ethiopian Airlines fly to the most destinations: 27 and 26 destinations respectively. Virgin Nigeria is the main airline for West African destinations. Ethiopian Airlines serves seven Central African destinations. Kenya Airways is the main player in West Africa. Southern Africa is served by South African Airways.
Not surprisingly, there is a strong correlation between the number of long-haul flights per week and the performance of the destination. The top three countries for tourist arrivals, South Africa, Nigeria, and Kenya, are also the top three countries for long-haul flights per week. Countries with the fewest connections, such as Comoros, Central African Republic, and Liberia, have very limited tourism development. However, there are also some exceptions to this pattern. Botswana, Namibia, Lesotho, Swaziland, The Gambia, and Zambia all have poor international flight connections, but significant tourism industries. These countries are lucky to have strong hubs in neighboring countries and frequent regional or charter connections. Conversely, Angola attracts less than 200,000 tourist arrivals a year, but has more than 20 long-haul flights a week and is served by five major European airlines. It is the second largest oil producing country in the world.
Figure 11. Number of Long-Haul Flights to Sub Saharan Africa per Week by Destination and Airline, 2009
54 South African Airways, Kenya Airways, Ethiopian Airlines, Emirates, Virgin Nigeria

Final Report, November 2009
41
Another important factor for airline connections, particularly regional connections, is domestic demand. Countries with higher populations such as Nigeria (147 million) and Ethiopia (79 million) tend to have better connections. The exception here is Seychelles with a population of just 85,000 and five intercontinental flights a week. GDP is also relevant. Countries that are oil-dependent and have higher GDP, such as Angola, Sudan, Côte D’Ivoire, Benin, Equatorial Guinea, and Gabon, have more flight connections than would be expected given their arrivals numbers. The countries with the poorest airline connections are the countries that have little tourism, small populations, low GDP, are geographically isolated and/or are experiencing political unrest.
The use of charter flights as well as the recent growth in “no-frills” airlines such as Fly540, help ease air isolation, but inter-regional travel is still challenging. There is slow progress towards “open skies” policies and an increasing dominance of regional gateway hubs. IATA55 notes that African Aviation has come a long way but to avoid losing market share, airlines must focus on safety, efficiency, environmental performance, and matching investment with returns.
Airline Alliances Members of Star Alliance include: Air Canada, Air China, Air New Zealand, ANA, Asiana Airlines, Austrian Airlines, bmi British Midland, Brussels Airline, Continental, EgyptAir, LOT Polish Airlines, Lufthansa, SAS Scandinavian Airlines, Shanghai Airlines, Singapore Airlines, South African Airways, Spanair, SWISS, TAP Portugal, Thai Airways International Turkish Airways United Airlines US Airways. Members of One World include: American Airlines, British Airways, Cathay Pacific, Finnair, Iberia, Japan Airlines, LAN, Malev Hungarian Airlines, Qantas, Royal Jordanian Members of SkyTeam include: Aeroflot Russian Airlines, AeroMexico, Air France, Alitalia, China Southern Airlines, CSA Czech Airlines, Delta Air Lines, KLM, Korean Air Lines. Air Europa and Kenya Airways are associate members.
Source: SSA Tourism Database
55 Brogden, L. (2009) Development Trends in the Airline Industry, IATA Regional Vice President, Africa, Windhoek, 3 March
Source: SSA Tourism Database

Final Report, November 2009
42
Table 9. Long-haul Flight Connections to Sub Saharan Africa on Major Airlines by Population, 2009
Country Region Population No. Long-haul Airlines Serving*
Total Long-haul flights per week*
Angola Central Africa 16,949,000 5 17
Congo, Dem. Rep. Central Africa 62,399,000 2 11
Equatorial Guinea Central Africa 508,000 0 9
Gabon Central Africa 1,330,000 2 9
Chad Central Africa 10,764,000 1 7
Cameroon Central Africa 18,533,000 3 11
Congo, Rep. Central Africa 3,767,000 1 4
Sao Tome and Principe Central Africa 158,000 1 2
Central African Republic Central Africa 4,343,000 1 1
Sub Total Central Africa 118,751,000 71
Ethiopia East Africa 79,087,000 5 91
Kenya East Africa 37,531,000 8 95
Mauritius East Africa 1,261,000 3 18
Sudan East Africa 38,556,000 4 17
Uganda East Africa 30,916,000 3 12
Tanzania East Africa 40,432,000 3 15
Rwanda East Africa 9,736,000 1 5
Eritrea East Africa 4,842,000 1 4
Madagascar East Africa 19,670,000 1 4
Mozambique East Africa 21,372,000 1 4
Seychelles East Africa 85,000 1 4
Zambia East Africa 11,920,000 1 3
Burundi East Africa 8,496,000 1 2
Comoros (incl. Moyote) East Africa 10,764,000 0 0
Malawi East Africa 13,920,000 0 0
Somalia East Africa 8,696,000 0 0
Zimbabwe East Africa 13,403,000 0 0
Sub Total East Africa 350,687,000 274
South Africa Southern Africa 47,851,000 10 177
Botswana Southern Africa 11,881,000 0 0
Lesotho Southern Africa 2,006,000 0 0
Namibia Southern Africa 2,080,000 0 0
Swaziland Southern Africa 1,148,000 0 0
Sub Total Southern Africa 64,966,000 177
Nigeria West Africa 147,983,000 6 58
Senegal West Africa 12,411,000 1 43
Ghana West Africa 23,462,000 5 33
Cape Verde West Africa 5,300,004 1 14
Côte d'Ivoire West Africa 19,268,000 2 13
Burkina Faso West Africa 14,777,000 1 7
Mali West Africa 12,334,000 1 7
Guinea West Africa 9,380,000 2 6
Sierra Leone West Africa 5,848,000 2 6
Benin West Africa 9,025,000 1 5
Mauritania West Africa 3,121,000 1 5
Niger West Africa 14,195,000 1 4
Guinea-Bissau West Africa 1,695,000 1 3
Togo West Africa 6,581,000 1 3
Gambia, The West Africa 1,707,000 1 2
Liberia West Africa 3,714,000 1 2
Sub Total West Africa 290,801,004 211

Final Report, November 2009
43
Country Region Population No. Long-haul Airlines Serving*
Total Long-haul flights per week*
Grand Total 825,205,004 733
Notes * AIrlines included: Air France, KLM, British Airways, Lufthansa, TAP, Delta, South African Airways, Kenya Airways, Ethiopian Airlines, Emirates, Virgin Atlantic, Brussels Air, Swiss Air Source: Airline websites and schedules
ANALYSIS
This section takes a forward-looking approach to the country results and makes an assessment of the relative potential of each Sub Saharan destination. The assessment is based on the sum of six SSA ranked indicators. The indicators have been selected to provide the following:
• An indication of current performance that is not biased by the size of the country or the number of regional travelers: receipts (in US$) per arrival
• An indication of future growth expectations over the next ten years based on modeling economic data: WTTC economic forecast for 2009-2019
• An assessment of the level of political support for tourism in the country: Travel and Tourism Competitiveness Subindex for travel and tourism regulatory framework
• An evaluation of the human and natural resources available to support tourism product development: Travel and Tourism Competitiveness SubIndex for travel and tourism human, cultural, and natural resources
• An indication of the tourism business infrastructure: Travel and Tourism Competitiveness Subindex for tourism business environment and infrastructure
• An evaluation of the ease of doing business in the country: assessed using the World Bank’s “Ease of Doing Business” index
These indicators are each explained here before the results are provided.
Receipts per Arrival
Receipts per arrival was selected as in indicator of current performance after multiple sensitivity testing with other possible indicators was conducted.
Initial tests focused just on total arrival numbers, but this give larger countries, and countries with large numbers of regional tourists, an elevated ranking. Similar problems were found when just long-haul arrival figures or just receipts were used. Receipts per arrival is more useful as an indicator of current and future performance as it provides an indication of how effective the tourism industry is in a country, regardless of its size. As the indicator measures dollars per tourist, the size of the destination does not play such a strong role in the rankings and small island countries were able to score well.
Data on receipts per arrivals was able to be calculated for 27 of the 47 SSA countries. Those countries getting the most out of their tourists are Ethiopia56, Seychelles, and Mauritius. The bottom three countries which net the least amount of receipts per tourist are: Swaziland, Malawi, and Rwanda.
Growth Rates
WTTC ten year forecasts were used as an indication of the future potential of SSA countries. First the ten-year annualized growth rate was identified for each country. Then the countries were ranked according to the size of the expected growth. There are critics of WTTC forecasting
56 There are some concerns about the quality of data collection in Ethiopia so caution should be used with these results

Final Report, November 2009
44
methodology, which is based on economic modeling rather than actual projected performance. Consequently, caution should be employed in the analysis of individual rates.
• West Africa is expected to experience the highest rate of growth in demand in the next five years (5.2%). Cape Verde has the highest expected growth rate for the whole of SSA at 7.7%. Nigeria, Sierra Leone, and Burkina Faso are next in West Africa
• Central Africa is expected to grow slightly faster than East and Southern Africa. Fastest growth is expected from Cameroon (7.6%); Angola and Chad are next. Lowest rates are expected for Congo DR (-1.3%)
• In East Africa, Malawi and Mozambique are expected to show the highest growth (6.9%). Lowest average growth rates are expected for Burundi (1.7%) and Seychelles (0.6%)
• In Southern Africa, Namibia is expected to have the highest average growth rate (6.9%). Swaziland is expected to grow the slowest at 2.5%
Ease of Doing Business
Many destinations in SSA have appealing tourism products. Many, however have a business climate that is not conducive to international or domestic investment, have low political support for tourism, and/or have poor ground transportation. Any of these factors can significantly reduce the potential of the destination for tourism.
The business climate in SSA countries is assessed using the World Bank’s “Ease of Doing Business” index. The Index measures ten key business climate indicators such as the time and difficulty/ease involved in starting a business, dealing with construction permits, and registering property.57 It provides data for 44 of the 47 SSA countries.
The top five countries for “ease of doing business” are identified as Mauritius, South Africa, Botswana, Namibia, and Kenya. Those countries that are struggling on “ease of doing business” include: Congo DR, Central African Republic, Guinea-Bissau, Republic of Congo, and Burundi.
Travel and Tourism Competitiveness Index
The World Economic Forum’s Travel and Tourism Competitiveness Index (TTCI), as explained earlier, measures fourteen different indicators for tourism in three subindices: travel and tourism regulatory framework, travel and tourism business environment and infrastructure, and travel and tourism human, cultural, and natural resources.58 TTCI covers 26 of the 47 SSA countries. Unfortunately no island countries were included.
Review of the results of these indices across the region shows that for the top five countries there is a significant correlation between the “ease of doing business” and “tourism competitiveness.” The top five countries on the TTCI are: Mauritius, South Africa, Botswana, Namibia, and Kenya. The bottom of the list also shows consistent results, although there is missing data. Chad, Republic of Congo, Congo DR, Guinea Bissau, and Central African Republic rank very low in both areas.
The middle section is less consistent. Some countries like Malawi rank relatively highly in tourism regulatory framework but rank very low in tourism business infrastructure. Senegal ranks high in its tourism regulatory framework but has a lower rating for “ease of doing business.” Countries such as Cameroon have strong tourism resources but have a less
57 World Bank and IMF (2009) Doing Business 2009, World Bank, Washington, D.C. 58 World Economic Forum (WEF) (2009) Travel and Tourism Competitiveness Report 2009: Managing in a Time of Turbulence, WEF, Geneva

Final Report, November 2009
45
competitive business environment and complicated tax structure. The Gambia ranks very high in its tourism policy but only 15th for “ease of doing business”.
Destination Groups
In this section, the 47 countries in SSA have been arranged into five groups according to the sum of their SSA rank for each of the previously explained six indicators: tourist receipts per arrival, WTTC forecasted growth rate 2009-2019, World Bank’s Ease of Doing Business Index, TTCI regulatory framework index, TTCI business and infrastructure index, and TTCI human and cultural resources index.
The purpose of these groupings is to give an indication of the future potential of these destinations. Although all reasonable measures have been taken to ensure the objectivity of the groupings, caution and judgement is needed in interpreting the results. For those countries where data was not available for all six indicators, an average figure was calculated based on the data that was available. For example, for Togo only three out of six indicators was available, so the average of the three results was used as a proxy in place of each of the missing indicators to calculate the total. The average result can be influenced by outliers (see the results for Cape Verde) and is not a perfect solution. Decisions on where the group boundaries fall can also influence the results. An effort was made to place the boundaries in naturally occurring breaks in the results.
Forecasting tourism potential is not an exact science, but the following groups more or less indicate the relative potential of SSA destinations.
Table 10. Sub Saharan Destination Group Results
Group One Group Two Group Three Group Four Group Five
Seychelles Ghana Sierra Leone Zimbabwe Burundi
Mauritius Tanzania Malawi Mali Guinea
Namibia Botswana Angola Côte D'Ivoire Togo
Cape Verde Zambia Mozambique Comoros Niger
South Africa Gambia, The Burkina Faso São Tomé and Príncipe Congo, Dem. Rep.
Kenya Uganda Cameroon Gabon Central African Republic
Senegal Mauritania Sudan Guinea-Bissau
Ethiopia Benin Lesotho Congo, Rep. of
Madagascar Rwanda Chad Equatorial Guinea
Nigeria Eritrea Liberia
Swaziland Somalia
Group One. Seychelles, Mauritius, Namibia, Cape Verde, South Africa, and Kenya
Group One countries are SSA’s top-tier destinations—those destinations that are expected to perform best over the next five years. Group One countries scored 60 or less in the total of the six ranked indicators (in the top ten for each).
Mauritius scored at the top for three indicators but has a low expected growth rate as does South Africa and Kenya. Cape Verde has a high forecast growth rate but a low ranking on ease of doing business. As Seychelles has only two Cape Verde is not included in the TTCI index, its Group One status is debatable. A more accurate ranking for Seychelles and Cape Verde will be available once they are included in the TTCI index.

Final Report, November 2009
46
Group Two. Ghana, Tanzania, Botswana, Zambia, The Gambia, Uganda, Senegal, Ethiopia, Madagascar, and Nigeria
Group Two countries are SSA’s second-tier destinations. These countries are emerging as significant players in tourism in the region, but each has some reason it has not quite made the top group. This could be due to the difficult business climate or to tourism policy. These countries scored between 65-100 on the ranking of the six indicators. Ghana, Tanzania, and Botswana are all close contenders for Group One, but they have lower expected growth rates than the Group One countries.
Individual high performers in the group are The Gambia which has a second-to-top score on tourism regulation and policy, and Ethiopia with a top score on receipts per arrival. The Gambia scored low on forecasted growth rates and Senegal scored low on ease of doing business.
Group Three. Sierra Leone, Malawi, Angola, Mozambique, Burkina Faso, Cameroon, Mauritania, Benin, Rwanda
Group Three countries are the third-tier destinations. These are countries where the tourism sectors are in transition. Each of these countries has significant potential to make tourism a growth industry, but each also has constraints that need to be addressed before joining the emerging destinations. These destinations scored between 101 and 120 points. The ranking is very close.
Individual higher performers are Cameroon and Angola. Both these countries have high expected growth rates but difficult business environments. Benin scores lowest for ease of doing business but highest for tourism regulatory framework.
Group Four. Zimbabwe, Mali, Côte D’Ivoire, Comoros, São Tomé and Príncipe, Gabon, Sudan, Lesotho, Chad, Eritrea, and Swaziland
Group Four countries have tourism sectors that are still in their early stages. These countries still have potential as tourism destinations but they are not expected to take off without significant investment and without change in the policy and public sector environment. These countries score 121-165 for the six indicators.
São Tomé and Príncipe and Chad are expected to grow the fastest in this group, but both have very challenging business environments. Lesotho has the highest ranked tourism regulatory framework but significant investment is still needed in product development and infrastructure.
Group Five. Burundi, Guinea, Togo, Niger, Congo DR, Central African Rep., Guinea-Bissau, Republic of Congo, Equatorial Guinea, Liberia, Somalia
Group Five countries are in the bottom tier. These countries are not expected to take off as tourism destinations any time soon. Nearly all of these countries are experiencing insecurity or have very high crime rates. The business environment in these countries is not currently conducive to tourism development.

Final Report, November 2009
47
Figure 12. Map of Sub Saharan Africa Destination Groups, 2009

Final Report, November 2009
48
Table 11. Sub Saharan Africa Destination Groups Ranking Scores, 2009 Country Rank of Total
Receipts per Arrival
WTTC Growth Rate
2009-2019 Rank/40
Ease of Doing
Business SSA Rank/44
TTCI Regulatory Framework
Rank/26
TTCI BIz. &
Infrastructure Rank/26
TTCI Human & Cultural
Resources R k/26
SUM OF 6 RANKINGS
AVERAGE RANKING
GROUP ONE (0-60) a b
Seychelles 2 8 30 5 0Mauritius 3 22 1 1 1 3 31 5 2Namibia 18 3 4 4 4 9 42 7 0Cape Verde 4 1 19 48 8 0South Africa 11 32 2 5 2 1 53 8 8Kenya 14 22 5 7 6 4 58 9 7GROUP TWO (60-100)Ghana 5 22 6 10 7 12 62 10 3Tanzania 6 17 14 9 14 2 62 10 3Botswana 29 18 3 3 3 8 64 10 7Zambia 31 13 7 6 11 7 75 12 5Gambia, The 22 28 15 2 5 10 82 13 7Uganda 20 21 10 14 12 5 82 13 7Senegal 23 15 23 8 9 6 84 14 0Ethiopia 1 29 11 22 10 11 84 14 0Madagascar 8 19 20 12 8 19 86 14 3Nigeria 18 9 12 25 13 15 92 15 3
GROUP THREE (101-120)Sierra Leone 16 10 26 104 17 3Malawi 36 6 16 11 24 13 106 17 7Angola 10 3 33 108 15 3Mozambique 30 6 18 17 22 22 115 19 2Burkina Faso 26 10 22 16 17 24 115 19 2Cameroon 2 31 21 25 17 115 19 2Mauritania 7 28 19 21 23 115 19 6Benin 17 19 34 15 16 16 117 19 5Rwanda 35 16 17 118 22 7GROUP FOUR (121-Zimbabwe 32 10 27 20 19 14 122 20 3Mali 12 25 32 13 20 20 122 20 3Côte D'Ivoire 13 29 24 18 18 122 20 4Comoros 9 30 25 128 21 3São Tomé and 28 3 39 140 23 3Gabon 24 27 24 140 25 0Sudan 13 37 21 142 23 7Lesotho 33 33 13 18 23 26 146 24 3Chad 8 38 26 26 25 148 24 6Eritrea 15 37 156 26 0Swaziland 37 36 9 164 27 3
GROUP FIVE (>165)Burundi 38 38 40 23 15 21 175 29 2Guinea 25 35 180 30 0Togo 27 34 30 182 30 3Niger 25 36 183 30 5Congo, Dem. Rep. 21 39 44 208 34 7Central African Rep. 30 43 219 36 5Guinea-Bissau 34 42 228 38 0Congo, Rep. of 35 41 228 38 0Equatorial Guinea .. ..Liberia .. ..Somalia .. ..
NOTES a) Countries with no TCCI data were not included in the TTCI survey through no fault of their own. No SSA island countries were included in 2009 b) Where data was not available for all 6 indicators an average figure was calculated for the missing indicators on the data that is available. For example, for Togo only 3 out of 6 indicators is available, so the average of the 3 results, is used in place of each of the missing indicators to calculate the total
Source: SSA Tourism Database, World Bank and IMf (2009), WTTC (2009)
CONSTRAINTS
The constraints section of the report analyzes the constraints section of the SSA Tourism Database. Constraints were found to exist where certain fundamental tourism needs were not met. For example, where the need for security is not met, lack of security is a major constraint to tourism development. Similarly when the need for political support for tourism is not met, the

Final Report, November 2009
49
lack of political support is a major constraint. Not all destination needs are of the same order of magnitude, however. In a ranking based on Maslow’s Hierarchy of Needs59, this section groups destination needs according to their importance at different stages of the development of a tourism destination.
• Preconditions. At the bottom of the Hierarchy of Destination Needs are the most fundamental requirements for tourism. These are the “preconditions” for tourism to develop: security, safety, and health. Without these conditions in place, very few visitors apart from international aid workers are likely to visit.
• Enablers. Once these conditions are met, entry procedures, infrastructure, and facilities take over as more important destination needs. These are the “enablers.”
• Attractors. When the enablers are developed to a reasonable level, addressing other considerations such as the attractiveness of the product, the language, and the cost of the destination becomes more urgent. These considerations are called the “attractors.” They are the factors that draw the tourists to a destination.
• Enhancers. When all the attractors are in place, considerations such as service quality, experience, and environmental quality need to be addressed. These are called the “enhancers.”
• Delighters. At the top of the pyramid are the “delighters,” the factors that make visitors return year after year and recommend the destination to their family and friends: quality of the facilities and services, innovation of the product, and marketing.
Figure 13. Hierarchy of Destination Needs
Level 1. Preconditions
Security
Security is a fundamental preconditions for tourism.
59 The Hierarchy of Destination Needs was developed by the author based on Maslow’s hierarchy of needs. Maslow argued that human needs could be depicted as a triangle. At the lowest level of the triangle are the most basic human needs: food, water, and shelter. Once these needs are met, the next level becomes more important, and so on until the peak of the triangle is reached: self-actualization. If at any time a lower level of need ceases to be met, then the needs are re-prioritized downwards

Final Report, November 2009
50
Tourists are unlikely to visit countries where there is political unrest or where their lives are going to be put at risk as result of rebel activities. Twelve of the 47 SSA countries are identified as having significant security concerns: Central African Republic, Chad, Republic of Congo, Burundi, Ethiopia, Guinea, Mali, Mauritania, Sudan, Togo, Uganda, Zimbabwe
Safety
High crime rates, unsafe roads, airlines, and building practices can also be a major constraint to tourism development. IATA reports that the airline accident rate in Africa (1: 471,000) is twice that of the rest of the world.60 Countries where crime is identified as a major constraint to tourism include: Benin, Burundi, Congo DR, Côte D’Ivoire, Guinea, Lesotho, Liberia, Mali, Nigeria. Crime is a crippling constraint to the development of tourism.
Congo, DR Political insecurity and the high rate of violent crime are the main constraints for tourism development in the Democratic Republic of Congo. Large parts of the country are too dangerous to travel in. Infrastructure is also a major problem. Less than 1% of roads are paved. National airlines are considered unsafe according to international standards. All five UNESCO designated natural parks are listed as “in danger.” The parks are home to a number of rare and endemic species of chimpanzee, mountain gorilla, and the white rhino. But because park wardens have been forced to abandon their posts, the animal population is dwindling. Somalia Insecurity is the main constraint of travel to Somalia. The capital, Mogadishu, is considered one of the most dangerous places in the world. The country ranks 142 out of 144 countries on the Global Peace Index, with only Iraq and Afghanistan ranking lower. There are no direct flights to Somalia from Europe. Regional flights are possible through Nairobi and Dubai.
Source: Adapted from SSA Tourism Database Constraints Section
Health
Health is another precondition for tourism. Tourists are unlikely to want to visit a country they perceive as posing serious health risks. Tourists are also less likely to visit places where they know the standard of medical care is extremely poor. When health issues become serious, the impact the ability of the workforce to service the tourism industry.
Countries with serious health constraints affecting their tourism sectors include Zimbabwe, Mozambique, Malawi, Swaziland, Burundi, and Lesotho. For these countries to move up the destination group list, healthcare will need to be prioritized.
Investment in healthcare makes a difference. Botswana is an example of a country where the rate of HIV Aids infection was so high that it was having a major impact on the workforce. Significant investment in healthcare has paid off. Botswana has made it to Group One destination status.
Swaziland Swaziland has the highest rate of HIV/AIDS in the world. Thirty percent of the population is infected with the virus. The epidemic is hindering the country’s economic and social development. Another major constraint to further growth in arrivals is poor air access; there are no direct flights to the long-haul source markets.
60 Brogden, L. (2009) Development Trends in the Airline Industry, IATA Regional Vice President, Africa, Presentationin Windhoek, 3 March
Final Report, November 2009
51
Lesotho Lesotho still lacks some basic infrastructure necessary for the successful development of its tourism potential. Health facilities and quality of service are low. These are major concerns for tourism development. Roads are in poor condition and there are few gas stations. Access to tourist attractions is extremely difficult. This problem is compounded by a lack of signage. Crime is high in the capital and in rural areas. Begging and stone-throwing are a problem in rural areas.
Source: Adapted from SSA Tourism Database Constraints Section
Level 2. Enablers
Visa Processing
Streamlined immigration and visa processing is a crucial enabler for tourism. If tourism is to be a viable sector, the first step is to open the borders.
Visa requirements were studied across the 47 countries in the region. A clear correlation was found between ease of visa processing and tourism performance. All the Group One countries have removed visa requirements for their key source markets. In contrast, Group Five countries and most of Group Four countries have complex visa requirements. Visas can be a particular constraint for small countries. If the visa is too expensive or difficult to obtain, tour operators may opt to not include the country as part of a regional tour.
All the countries in Southern Africa have removed their visa requirements for major source markets. In West Africa only Senegal and The Gambia have relaxed their visa requirements and they are the highest performers in the region. Countries with extremely difficult visa procedures include Angola, Equatorial Guinea, Benin, and Cameroon.
Equatorial Guinea While crime is relatively low, the very high level of corruption and the complex entry regulations make entering and traveling in the country almost impossible. The visa application process requires proof of good character, proof of financial means, and vaccinations for yellow fever, cholera, and smallpox. Visitors also need travel and photography permits. Police roadblocks are an additional hazard. There is very limited tourism infrastructure on the mainland. Tourism growth is not expected under the current circumstances. Angola Angola’s tourism development is inhibited by poor infrastructure, insufficient and expensive air service, and a shortage of quality hotel rooms. It is extremely difficult to get a visa for Angola unless traveling for business purposes. Prospective visitors are required to show a letter of invitation, proof of employment, proof of address, and many other forms of documentation which may take weeks to process. Source: Adapted from SSA Tourism Database Constraints Section
Political Support for Tourism
The degree of political support for tourism is the second important enabler considered here.
Political support for tourism across SSA was gauged using the TTCI regulatory framework index, looking at how governments prioritize tourism compared to other industries (whether there is an up-to-date tourism plan and policies in place, how much red tape is involved in entry, what incentives are in place for investment) and by assessing the degree of effort in marketing (number of overseas offices, the existence of an information office and website).
The results of the TTCI show a high correlation between a high scoring tourism regulatory framework and high tourism performance. All Group One destinations are in the top ten for their tourism regulatory framework. Political support for tourism was found to be higher in agricultural

Final Report, November 2009
52
economies than in economies based on oil and mining. Of the five main oil producing countries, only Gabon has developed a tourism strategy.
The ability of local authorities to collect and publish accurate and timely tourism statistics is a good indication of the level of support for tourism. Whereas countries in Southern Africa collect 91% of major tourism indicators, countries in Central Africa collect just 49% of data.
The presence or absence of overseas marketing offices is also a good indication of the level of political support for tourism. Fifteen SSA countries have dedicated overseas marketing offices. All Group One destinations have marketing offices overseas. Group Two countries such as Ghana, Ethiopia, Uganda, and Tanzania may need to consider this in the future. Lower cost option used by Tanzania is to contract out the overseas work to a PR firm in the source market. Having overseas marketing representation provides the destination with a distinct advantage in reaching international markets.
Ghana Tourism is Ghana is geographically concentrated. The only international-standard hotels are in the capital. The lack of quality accommodation and poor infrastructure in the rest of the country hinder the growth of tourism activities. Currently only 15% of the roads are paved. The 2009-2012 tourism marketing strategy plan identifies the lack of overseas tourism information offices and the general low level of services as challenges facing the sector. Nigeria The oil sector provides 95% of foreign exchange earnings for Nigeria. Tourism development has not been a government priority. Travel by road is difficult not just because of the poor quality of the roads and the traffic, but also because of the danger of attack by thieves or kidnappers. Tourism development is also restricted due to the lack of investment in modern infrastructure. The government will need to undertake major marketing efforts and considerable social improvements if it wants to attract long-haul tourists in the future.
Source: Adapted from SSA Tourism Database Constraints Section
Air Access
The third key enabler is air access.
Sub Saharan Africa is under-served by major airlines. Sixty-six percent of countries have either no major carrier connections or are dependent on just one airline. Lack of competition on intercontinental flights results in high prices.
Interviews with international and inter-regional airline management found that decisions on airline routings are driven by a mix of domestic, inter-regional, international, and cargo demands. They are also affected by air transport liberalization, ease and cost of doing business (landing rights, baggage handling), and the cost of fuel.61
Many countries in the region do not allow the “fifth freedom of the air”: the right of foreign airlines to fly into the country, pick up passengers and take them on to a third country.62 This form of airline protectionism restricts competition and drives up prices. In Zambia and Botswana the issue of liberalization of air transport is key.
As might be expected, countries that have a high frequency of long-haul flights tend to have stronger tourism sectors. The reverse is not always true. Botswana, Namibia, and The Gambia
61 According to one airline, fuel costs used to be just 10% of the airfare and are now 30%. This had made a significant impact on airline profitability 62 “Freedoms of the Air” are commercial aviation rights granting airlines the ability to land and cross other country’s airspace. The fifth freedom allows an airline to carry traffic from its own country to a first foreign country, pick up passengers and then fly on to another. The Yamoussoukro Decision aims to liberalize intra-African air transport Schlumbergerger, C. E. (2009) The Implementation of the Yamoussoukro Decision, World Bank, Washington, D.C.

Final Report, November 2009
53
all lack direct flights but have strong tourism sectors due to their reliance on neighboring countries (South Africa and Senegal) and on frequent regional and charter flights. Island countries, due to the low domestic demand, are often severely constrained by air access.
Comoros The development of tourism on Comoros is marred by extreme isolation, exclusion from major airline routes, political instability, and poor tourism infrastructure. The lack of competitive air service is a major constraint to development. The low level of arrivals and the seasonal nature of visits to the Comoros have so far not attracted any of the airlines serving the region (Air Seychelles, Air Mauritius, and Air Austral). São Tomé and Príncipe Low name recognition as a tourism destination combined with geographic isolation and limited airlift are the main constraints to tourism growth. General infrastructure such as water, sanitation, roads, and health services all need improvement. There is a lack of trained personnel as well as a high risk of water pollution due to poor sanitation. The location of the country makes for a small regional market. The country is highly dependent on aid from bilateral and multilateral donors. Source: Adapted from SSA Tourism Database Constraints Section
Accommodation and Hotel Investment
The last enabler considered here is accommodation and hotel investment.
This is a constraint across the region, but it is particularly prominent in those countries in West and Central Africa that are politically stable but not yet investor-friendly. These include Gabon, Angola, Sierra Leone, and Burkina Faso. Some mature destinations, such as Kenya, Tanzania, and The Gambia, also have problems maintaining investment in accommodation.
Information collected from interviews with three of the largest hotel development and management companies in the region suggests that factors affecting the location of international hotels include: domestic, inter-regional, and international demand; business security (legislation to protect franchise and intellectual property, ability to repatriate management fees and profits, absence of corruption); availability of debt financing; free movement of labor (ease of access to visas and work permits for non-nationals); and land security.
Despite significant demand, Angola is one of the hardest places in SSA to develop a hotel. In this case, development has been hindered by the difficulty of obtaining visas, corruption, lack of private sector activity, lack of a land title office, and general business insecurity. Mozambique also faces challenges with land-use rights.63 The restrictions Tanzania places on the movement of workers makes it particularly difficult for Kenyans to fill needed skill areas. Indian labor is used as a result.
Level 3. Attractors
Once there is a safe environment for tourism and it is possible to reach the country, the tourism product, the culture and language, and the costs involved in travel to the destination become more important.
Tourism Product
The tourism product is a key attractor.
Earlier discussion of products across the region found that destinations with a combination of products such as safari, business, and resort often perform better than those with fewer products. Destinations with just nature products or cultural products were found to perform less 63 FIAS (2006) The Tourism Sector in Mozambique: A Value Chain Analysis, World Bank and OECD Development Centre.
Final Report, November 2009
54
well. There are multiple reasons for this, including the relative value that different tourists place on different types of tourism products. For example, a safari trip is generally viewed as having higher status than a hiking vacation. A beach resort holiday may cater to a mass audience whereas visits to archeological remains and to indigenous groups may attract smaller niche travelers.
Tourism products become a constraint when they do not receive sufficient investment and management. Spectacular beaches with no roads to access them are not viable tourism products. Similarly, world class cultural heritage sites such as Sudan’s pyramids are not attractive if they lack interpretation and protection. Countries facing challenges developing their product include Ethiopia, Eritrea, Mali, and Republic of Congo. Senegal, The Gambia, Cape Verde, and Mauritius are constrained by their lack of product diversity.
Culture and Language
The culture and historical ties between the destination and source markets are also significant attractors.
English speakers are typically averse to speaking foreign languages and prefer to travel to countries where they can make themselves understood easily in English. Countries sharing the same language are often culturally closer to each other, making tourists feel more secure. As there are far more source market countries that speak English than French, English-speaking countries tend to have higher tourist arrivals than the French-speaking countries in SSA. Exceptions are in politically unstable English-speaking countries such as Eritrea and Sudan or very small English-speaking countries such as The Gambia. Although France is the number one source market for the region, there are just two French-speaking countries in the top ten arrival destinations: Burkina Faso and Senegal.
Travel and Tourism Costs
Travel and tourism costs are important attractors. This study examined “flight costs,” based on average flight cost to the destination64, and “destination costs,” based on a combination of per diems65and visa processing costs. The database also includes information on room tax and departure tax.
Flight costs vary across the region depending on distance to the source country, time of year, and competition on the route. At the high end of the flight cost scale66 were all the island countries (except Cape Verde), many of the smaller countries, and landlocked countries such as Lesotho, Botswana, Zambia, Zimbabwe, and some of the countries with a very low volume of tourists such as Guinea-Bissau, Central African Republic, Guinea, Chad, and Republic of Congo. At the lower end of the flight cost scale67 were the higher performing destinations: Kenya, Tanzania, Senegal, South Africa, Ethiopia. Exceptions include Mauritius and Seychelles which have high flight costs and high performance and Sudan which has low flight costs and low performance.
64 Flight costs were calculated using the an average of the three lowest scheduled fares for December 2009 and May 2010. Fare averages do not include charter airlines as pricing is not normally available more than a few months ahead of departure 65 Donor per diems are the amount given to diplomats and UN staff to cover the costs of hotels, food, and travel in a particular city. These rates are updated annually based on the actual cost of goods. Both UN and EU per diems are used here as an indication of the combined price of hotel, food, and travel costs 66 Flight costs for the five key source markets are all over $1,000 67 Flight costs for the five key source markets are all under $1,000

Final Report, November 2009
55
A clear correlation was found between destination cost and performance. All the destinations in Southern Africa and the most popular destinations in East Africa are at the lower end of the cost scale. In contrast, seven of the nine Central Africa countries are high or medium cost. Countries in West Africa were found to be mostly medium or high cost. The highest-cost destinations were found to be the oil producing nations which primarily attract business tourists: Angola, Chad, Congo DR, and Equatorial Guinea. Exceptions include small islands like São Tomé and Príncipe and Comoros and conflict destinations such as Somalia and Liberia all of which are low-cost and low-performing tourism destinations.
Departure taxes vary across SSA between US$0 and US$50. They are highest in Ghana, Liberia, Sierra Leone, Malawi, and Zambia. The average is $11.51. Room tax (VAT) varies between 0% and 20%. The average is US$13.28. The highest room tax are in Sierra Leone, Tanzania, Benin, Burkina Faso, and Chad.
Business Climate
An attractive business climate is an essential element of a successful tourism destination. Well-managed tourism can be an entry point for reform in other sectors of the business environment. Hotels and airlines are unlikely to locate an office in cities where corruption is high, taxation is high, and there are few incentives for developers. For hotels developers, the freedom to import skilled labor, sound land policy, good infrastructure, and the ability to export profits are defining factors in the location decision. High taxation and high visa fees can reduce demand for tourism products, or end up making the destination so expensive that it loses out to neighboring countries. Insecure land tenure conditions can make it difficult if not impossible to raise capital for development. Land tenure and its implications for tourism development were not the focus of this study but will be emphasized in future work. Interviews with operators in Kenya, Cameroon, Zambia, and Malawi all raise the issue of taxation.
Malawi Malawi’s tourism industry is growing slowly but faces several constraints. These include high taxes, expensive transport infrastructure both to and in the country, and lack of direct flights to the main source markets. Businesses note that the current tax climate is not conducive to reinvestment and makes doing business in Malawi a challenge. Malawi is also perceived as an expensive destination by its target markets; the country is dependent on the UK market. Tourism is highly seasonal due to heavy rainfall in the rainy season. The wildlife is not as diverse and plentiful as in neighboring countries; poaching is a problem. While the government sees tourism as a priority, financial resources are limited and marketing is haphazard. There are no international hotel brands. Source: Adapted from SSA Tourism Database Constraints Section
Level 4. Enhancers
When a destination has its safety, access, and basic product in place, more advanced needs such as service standards, tourist experiences, and environmental quality become a higher priority.
Service

Final Report, November 2009
56
Raising service standards is an important step towards a more professional tourism industry. Service standards are difficult to assess in a desk-based study. Three main sources of information were used as proxy indicators for this variable: the TTCI index, tourism planning documents, and industry interviews. The highest level of professionalism was found in South Africa and Kenya. Service quality was identified as more of a constraint in West Africa than in East Africa and Southern Africa. Countries with particular training needs are Cameroon, Burkina Faso, and Ghana. In Lesotho, 60% of hotel employees are thought to be unskilled.68 In Malawi, most hotels rely on expatriate staff for upper-level management positions.
Lesotho Basotho people have traditionally worked in the gold mines of South Africa. Cutbacks in the South African mining sector in the 1990s eliminated many jobs. Employment statistics are incomplete but suggest that up to 9,000 direct and indirect jobs may exist in tourism. About 60% of hotel employees are thought to be unskilled. This is supported by a recent World Bank study that found that a low level of understanding of tourism and of the essentials of customer care is a significant constraint to competitiveness. Burkina Faso There is a scarcity of skilled labor in Burkina Faso but Burkinabés have a strong work ethic. There are two tourism training schools (one public and one private). More than 30,000 people are thought to work in the travel and tourism sector. Business is conducted exclusively in French. There is a small but dynamic Chamber of Commerce which conducts training, develops business links, and organizes trade shows. About half the population adheres to traditional beliefs and the other half is Muslim. Source: Adapted from SSA Tourism Database Constraints Section
Tourist Experiences
The second destination enhancer is tourist experiences.
Developing tourism products into tourism experiences requires an active and competent private sector and some degree of small-business support. SSA has almost limitless opportunities for the development of successful tour packages. There is, however, a lack of experienced workers to run and manage tour operations and a lack of support services for small entrepreneurs. A desk-based survey of the number of ground operators in each country69 showed some degree of correlation with the development of the destination. South Africa has about 620 ground tour operators, Namibia has 138, Tanzania 107, Botswana 73, Sierra Leone 7, Republic of Congo 3, and Chad just one.
Environment
Environmental quality and sustainable practices are important destination enhancers.
Environmental quality is moving up on the list of traveler priorities. A study by the International Ecotourism Society found that 73% of US travelers attach great importance to clean, unpolluted environments when choosing their vacations. A similar number indicate that it is very important to them that their trip does not damage the environment.70
Poor environmental stewardship can be a considerable constraint to tourism in SSA. Countries where the poor environment is mentioned as a constraint to tourism in the SSA Tourism Database are Central African Republic, Ghana, Comoros, and São Tomé and Príncipe.
Ghana
68 McKinnon, J. And Rozga, Z. (2007) Private Sector Competitiveness Project: Strengthening the Tourism Market in Lesotho, Ministry of Trade, Industry, Cooperatives and Marketing and Ministry of Tourism, Environment and Culture, Maseru 69 As reported on National Tourism Office website 70 TIES (2008) TIES Global Ecotourism Factsheet, TIES, Washington, D.C.

Final Report, November 2009
57
Tourism is Ghana is highly geographically concentrated. The only international-standard hotels are in the capital. The lack of quality accommodation and poor infrastructure in the rest of the country hinder the growth of tourism activities. Currently only 15% of the roads are paved. The 2009-2012 tourism marketing strategy plan identifies the lack of overseas tourism information offices and the general low level of service as challenges facing the sector. The short season, tropical heat, and rain create further difficulties. The low level of environmental awareness amongst the local population is an ongoing risk; beaches are reportedly trash-ridden. Source: Adapted from SSA Tourism Database Constraints Section
Level 5. Delighters
At the top of the pyramid of destination needs are quality, innovation, and marketing. Getting these factors right can result in sustained success in tourism. Conversely, failing to prioritize quality, encourage innovation, and fund marketing may hold an otherwise growing destination back.
Quality, Innovation, Marketing
Maintaining a high quality of product makes visitors feel they are getting value for their money. Innovation keeps the product fresh and inviting. It also allows the product to keep up with changes in demand. Effective marketing is important because tourism takes place in a global context where visitors can choose between numerous options.
This constraint is only mentioned as a key issue in four countries (Ghana, Malawi, Nigeria and Uganda) but this is not because the rest have these issues solved, but because most of the other countries are dealing with lower-order concerns such as tourism infrastructure, access, and safety.
Malawi and Uganda are just two examples of where lack of funds for marketing is considered a constraint to development.
STRATEGIES
Even the most challenged countries have the potential to become successful. Cameroon’s tourism industry has learned to cope with less political support than it would like. Namibia’s tourism industry has managed to grow without direct flights to the country. Botswana has fought an AIDS epidemic, and The Gambia has coped without international hotels. Burkina Faso has made up for a lack of beaches with a well-organized film festival.
Examples from around the region demonstrate how destinations missing one or more of the basic preconditions for tourism can make up for it with strategic interventions. Four levels of intervention are discussed here: “coping strategies” to address shortfalls in the fundamental preconditions for tourism; “planning strategies” to help open the doors for tourism; “growth strategies,” to help take tourism to the next level; and finally, “flourishing strategies” to sustain and enhance the performance of the destination.
Figure 14. Strategies for Climbing the Destination Hierarchy
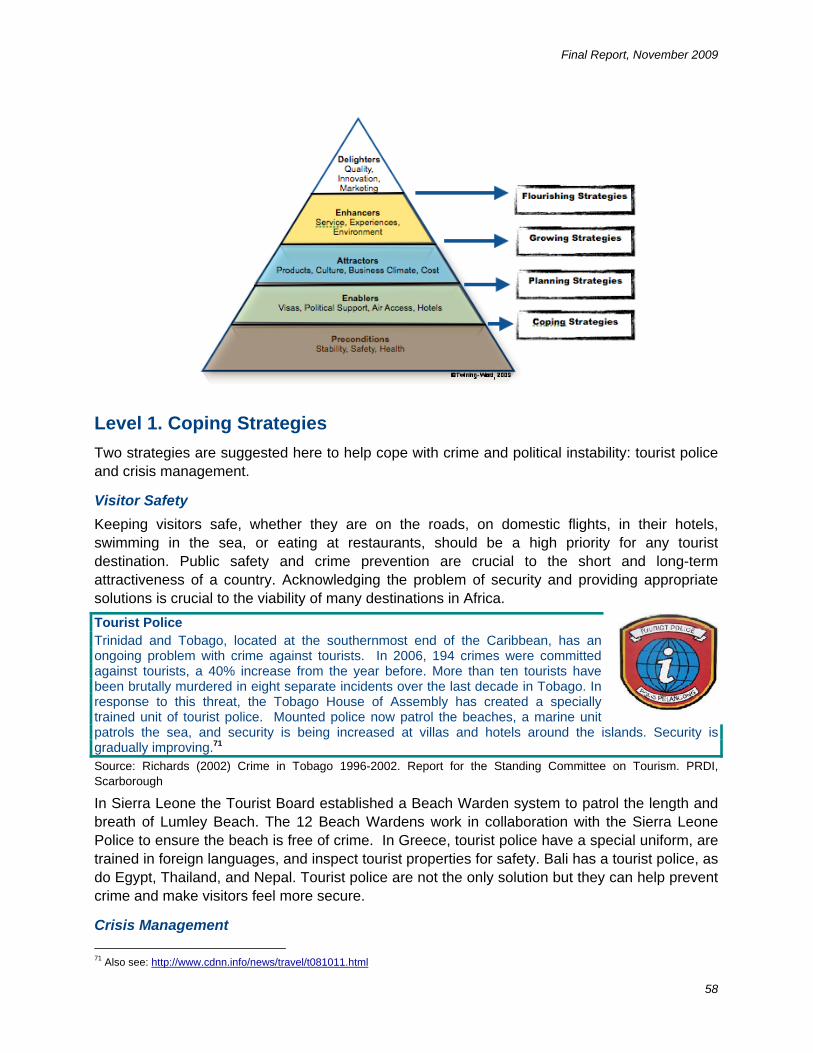
Final Report, November 2009
58
Level 1. Coping Strategies
Two strategies are suggested here to help cope with crime and political instability: tourist police and crisis management.
Visitor Safety Keeping visitors safe, whether they are on the roads, on domestic flights, in their hotels, swimming in the sea, or eating at restaurants, should be a high priority for any tourist destination. Public safety and crime prevention are crucial to the short and long-term attractiveness of a country. Acknowledging the problem of security and providing appropriate solutions is crucial to the viability of many destinations in Africa.
Tourist Police Trinidad and Tobago, located at the southernmost end of the Caribbean, has an ongoing problem with crime against tourists. In 2006, 194 crimes were committed against tourists, a 40% increase from the year before. More than ten tourists have been brutally murdered in eight separate incidents over the last decade in Tobago. In response to this threat, the Tobago House of Assembly has created a specially trained unit of tourist police. Mounted police now patrol the beaches, a marine unit patrols the sea, and security is being increased at villas and hotels around the islands. Security is gradually improving.71 Source: Richards (2002) Crime in Tobago 1996-2002. Report for the Standing Committee on Tourism. PRDI, Scarborough
In Sierra Leone the Tourist Board established a Beach Warden system to patrol the length and breath of Lumley Beach. The 12 Beach Wardens work in collaboration with the Sierra Leone Police to ensure the beach is free of crime. In Greece, tourist police have a special uniform, are trained in foreign languages, and inspect tourist properties for safety. Bali has a tourist police, as do Egypt, Thailand, and Nepal. Tourist police are not the only solution but they can help prevent crime and make visitors feel more secure.
Crisis Management
71 Also see: http://www.cdnn.info/news/travel/t081011.html

Final Report, November 2009
59
Political turmoil, social unrest, and natural disasters are devastating for tourism destinations. Examples include the political crisis in Fiji in 1987 and 2000, natural disasters such as the tsunami in Thailand in 2004, and terrorist attacks such as those on resort towns in Egypt. While a crisis nearly always has serious short-term effects on the tourism sector, the medium and long-term effects depend on how the crisis is managed. Kenya has considerable experience in managing crises. Following the election riots of 2008, tourism dropped by 49% during the first three months. The same months in 2009 showed a 64% increase. Ongoing communication with international tour operators, media, and the local tourism private sector helped Kenya’s tourism industry to bounce back quickly. This kind of resilience is important in the context of Sub Saharan Africa, where unexpected events are frequent.
Restoring Tourism after a Crisis Political unrest during elections in January of 2008 caused Kenya’s tourism arrivals to collapse. While the unrest was mainly in the west of the country and in the slums of Nairobi, tourists left the country. Countries such as the UK and the US issued travel warnings and tour operators cancelled trips. Tourism arrivals dropped significantly during the first quarter of 2008 resulting in a 30% overall decline in 2008. Fortunately, the Kenya Tourist Board (KTB) did have a crisis management plan. The following strategies were used to assist the recovery effort: • Visa fees for adults were reduced by 50% while visa fees for children up to 16 years were waived • KTB marketing efforts focused on getting repeat visitors to come back • Marketing efforts in the US were increased to capitalize on publicity generated by President Obama • Marketing efforts were made in China as Asian visitors have shorter lead-times for their vacations • New tourism routes were opened in the Northern Circuit • Tour operators and KTB hosted 200 international travel writers and travel agents from key source
markets Source: Beirman, D. (2003) Restoring Tourism Destinations in Crisis, CABI Publishing, Oxon Tourism Review (2009) Kenya: Tourism Proves Resilient in Times of Trouble, May 2009, Tourism Review, Olomouc
Level 2. Enabling Strategies
Enabling strategies help facilitate the mechanics of travel to a destination. Three strategies are reviewed here: facilitating visas, airline access, and stimulating the private sector.
Opening Borders
Visa requirements and costs are key constraints for tourism development in Sub Saharan Africa. While some countries such as the Seychelles require no visa, other countries such as Gabon require visitors to apply for a visa long before arrival.
Considerable progress has been made toward regional visa cooperation. The Economic Community of West African States (ECOWAS) signed a treaty in 1979 to encourage the free movement of people among its member states. Under the treaty, member states do not require a tourist visa for entry into any of the other member states. The East African Community (EAC) has a similar treaty in place.
There are also processes underway in both East and Southern Africa to ease border crossing bureaucracies. The East African Community (EAC) has advanced plans to create one single tourist entry visa for all five partner states. A single EAC visa would allow tourists to travel freely within the member states and would help promote the region as a single destination.
Regional Tourist Visas
The Southern African Development Community (SADC) has been working on a single regional visa (UNVISA) since 1998. A common visa would facilitate regional travel in much the same way as the

Final Report, November 2009
60
Schengen Visa allows non-EU citizens to obtain one visa to visit all Schengen countries. The main obstacles for implementation at this time are the price difference in current national visas. While visas for South Africa, Botswana and Namibia are free, Zambia and Zimbabwe have costly visas. If these difficulties were overcome and UNIVISA were implemented, long-haul visitors would require just one visa to travel to and within all the countries in the region that are party to the agreement. The UNIVISA would be especially beneficial for countries with transfrontier parks: South Africa, Mozambique, Lesotho, Botswana, Namibia, Zambia, and Zimbabwe. The introduction of the UNIVISA has been delayed a number of times but is expected to be in place before the 2010 FIFA Word Cup soccer tournament in South Africa. Source: RETOSA (2009) The Tourist Visa (UNIVISA), RETOSA, Midrand
Overcoming Air Isolation
Airline transportation is crucial both to and around SSA due to the large distances and poor road transportation. Air transport can be a particular challenge for the smaller countries and countries located far from source markets. Two enabling strategies are discussed here: the use of a gateway hub, and the use of charter airlines.
The development of a strong neighboring gateway hub can be a lifeline for isolated destinations that are not large enough to justify intercontinental flights. Tambo International Airport in Johannesburg, with its new terminal and multiple runways, has become the intercontinental entry point for Southern Africa. Namibia, Botswana, Lesotho, Swaziland, Zambia, Mozambique, and Malawi all rely on South Africa for intercontinental connections. Control over arrivals provides South Africa with a substantial tourism advantage.
Other ways of overcoming air isolation include low cost or “no-frills” regional airlines. Examples are Kulula Air and Mango (which is owned by South African Airways) in South Africa and Fly540 in Kenya. The French tour operator Point Afrique flies between France and destinations in Mauritania, Mali, Senegal, and Burkina Faso. Airline industry analysts expect the number of low-cost airlines in Africa to increase over the next ten years.
Fly540 Fly540 is 49% owned by Lonrho, an African investment group based in London, which bought the low-cost airline in 2006. The airline plans to operate from three hubs in Africa: Kenya (East Africa), Angola (Southern Africa), and Ghana (West Africa). By October 2009, the company operated routes between Kenya, Sudan, Tanzania, and Uganda. The company received permission to fly into Angola in April 2009 and will commence flying into Zimbabwe in the fall of 2009. Fly540 has plans to have operations established in 15 African countries by the end of 2010. The company has no plans to operate fights to and from South Africa.
Source: Fly540 (2009) Fly540 – Africa’s Low Cost Airline, Nairobi www.fly540.com,
Charter airlines have also been attracted to SSA. Charter airlines operate non-scheduled flights which are often part of a package which includes accommodation. These packages are sold by tour operators. Charter airlines can offer cheaper rates than scheduled airlines as they have a higher passenger load and only operate flights during high season. The popularity of charter airlines soared during the 1970s and 1980s in Europe when mass tourism was at its peak. Now, successful charter airlines are suffering due to competition and changes in patterns of demand.
SSA destinations with charter connections include The Gambia, Cape Verde, Kenya, and Angola. Some of the major European charter airlines flying to destinations in SSA are Martinair, Thomsonfly, Air Berlin, and Thomas Cook Airlines. Small regional charter airlines are also important for South Africa, Tanzania, and Kenya where they transport tourists between the different national parks and game reserves.

Final Report, November 2009
61
Managing Without Hotel Brands
This report has placed considerable importance on the need for branded (chain) hotels. Having an international or well-known regional brand name hotel can help raise the status of a destination, and can help attract tour operators, charter flights, and other businesses. It can also help raise the standard of service, as staff that are trained at the hotel move on to train other staff elsewhere.
However, it is also important to note that SSA destinations can still be successful without branded hotels. There is an increasing trend towards independently branded boutique hotels and lodges, particularly in East Africa. Mozambique has very few international hotels but a large number of independently branded high-end resorts and lodges. Tanzania has some high-end lodges that are operated by small hotel operators, such as CC Africa and Singita, that are specialized in managing upscale properties. Zambia’s development around Livingstone was opened up by Sun International but largely financed by small local investors.
In some situations, locally owned and operated hotels and guesthouses may be more successful at stimulating the economy and reducing economic leakage. Work on value-chain analysis in The Gambia and the north of Mozambique has shown how community-based tourism ventures are more likely to use local financing, local labor, and local suppliers. Instead of a polarized debate, however, it is useful to consider that a combination of these products can be mutually beneficial. Large hotels provide a ready market for community-based tourism attractions. Community-based tourism attractions add-value to the experience of the tourist staying in the large hotels. Further work on value-chain analysis from around the region will be helpful in establishing the most effective forms of tourism investment for economic development.
Strengthening the Public Sector
The public sector plays a crucial role in enabling the takeoff of a successful tourism industry.
Organizational Structure
Having the right organizational structure and developing and implementing tourism plans and policies are key enabling factors. A review of SSA tourism organization structures found that at ministerial level, tourism can be either part of a shared ministerial portfolio (with, for example, transportation or culture), or it can be an independent ministry. National tourism organizations (NTO), which are usually responsible for promotion, research, and education, can be structured in one of the following ways:
• As a governmental agency that falls directly under the tourism ministry. Organizations like these usually have a broad range of responsibilities and functions. Examples are Burundi National Tourism Office, Office National du Tourisme in Democratic Republic of Congo, and the Mali Tourism Office (OMATHO)
• As a semi-public, government-funded commission, board, or authority. These boards draw extensively from the private sector but are mostly government-funded. Examples are Seychelles Tourism Board, Ghana Tourism Federation, and the Lesotho Tourism Development Corporation
• As a private association indirectly funded by the government. This approach is more unusual. An example is the Mauritius Tourism Promotion Authority, which works in tandem with the Mauritius Tourism Office
Other, more unusual, structures are found in Cape Verde, Senegal, and Seychelles. The Center for the Promotion of Tourism Investment and Exports (PROMEX) in Cape Verde does not have
Final Report, November 2009
62
a specific NTO. Senegal has a Ministry for Tourism and a public developer for tourism projects, SAPCO72. The Investment Promotion Agency, APIX, also plays a role in tourism development. The Seychelles government has turned a majority of the tourism board responsibilities and all marketing activities over to the private sector. The board is supported financially by the government and the private sector.
The success of the different models clearly depends on the actual execution of the model and the stage of tourism development the country has reached. In some of the developed destinations such as Seychelles, it appears that semi-public boards work well. In other cases, such as Lesotho, budgets scarcely cover staff costs and the there is little left over for promotion. Further research is needed to identify the types of functions that need to be carried out at different levels of development and the best types of agencies to carry out these functions.
Planning
Once the organizational structure is in place, having a plan and a tourism policy is the next essential enabling factor for tourism. The development of a planning document provides the opportunity for collective visioning and helps avoid costly environmental mistakes.
Unlike oil, gold, diamonds, and copper, tourism has the potential to be a renewable resource. To secure its long-term viability, considerable care is needed, particularly in the development of hotels and in the granting of tour licenses. Individual tourism entrepreneurs are likely to act in their own self-interest, which can mean bringing more tourists to an area than the area can sustain. This has been seen in parts of Tanzania and Kenya.
There are many examples worldwide where tour operator or hotelier greed, and local authority ambivalence, have led to haphazard and unsightly development spoiling the very landscape the tourists come to see.
It is important that parts of Sub Saharan Africa do not make the same mistakes as mass tourism developments in other parts of the world such as the Costa del Sol, Waikiki in Hawaii, and Phuket in Thailand.
Building the capacity of the public sector to plan for growth and manage and control development is a crucial strategy for success. It can take some time. Many countries in Sub Saharan Africa suffer from an inexperienced public-sector tourism department. Government ministries frequently rotate their senior staff, which can result in a poor understanding of the importance of the tourism sector. It can also result in limited skills to manage the development process. In Botswana a strong private-sector association helped fill the gap left by public sector ambivalence to tourism, raised the profile of the industry, and eventually gained public-sector support.
The Hospitality and Tourism Association of Botswana (HATAB) The Hospitality and Tourism Association of Botswana (HATAB) was established on January 22nd, 1981, to address the lack of a tourism regulatory framework in Botswana. While regulation is normally the role of the public sector, HATAB knew this would take time to happen. Rather than waiting for the public sector to catch up, they decided to take the lead in raising industry standards from within. HATAB now has more than 180 members, 40% of all operating and registered tourism enterprises in the country.
72 Société d’Aménagement et de Promotion des Côtes et Zones Touristiques du Sénégal (SAPCO), formerly Société d'Aménagement de la Petite Côte (SAPCO). SAPCO, reporting to the presidency, was originally set up to develop the Petite Côte but has since expanded

Final Report, November 2009
63
HATAB seeks to “promote, encourage, and police excellence in hospitality and tourism in Botswana.” It realizes the collective importance of maintaining high standards of operation for the entire hospitality and tourism industry, and takes it upon itself to make this a reality. It has become the industry’s “watchdog.” It also lobbies government to create an enabling environment for hospitality and tourism enterprises to thrive and prosper. HATAB’s next venture is to lead the way in the monitoring of tourism’s economic impact in the country. If HATAB can show the true value of tourism for employment generation and its contribution to GDP, it can more successfully compete for public-sector support. HATAB is able to achieve all this because of its strong financial structure. While most tourism associations are operated by volunteers on a shoestring budget, the HATAB secretariat has a full time staff of four. The association has membership subscriptions, runs two popular conferences every year, and manages 32 campsites in the Northern part the country. The revenue generated by the campsites is used to fund HATAB management and to fund operations to augment member subscriptions. Source: HATAB (2009) Mission Statement. HATAB, Gaboronne. Ntloedibe-Diselem M., (2009) Personal Communication 9/16/09.
Level 3. Growing Strategies
Once the basic strategies are in place, tourism product development and environmental sustainability become crucial.
Product Development
Today’s traveler is more experienced and more interested in adventure, culture, and “real experiences” than previous generations. Understanding changes in market demand and keeping up with what the competition is offering are vital. This section provides some examples of how the main types of products in SSA are keeping up with market demand.
Safari
Safaris are an important tourism product for a number of countries in Southern Africa such as Tanzania, Kenya, South Africa, and Botswana. Traditional safari holidays give visitors the opportunity to experience and photograph wildlife in its natural habitat, traveling in four-wheel-drive jeeps and staying in tented safari camps or lodges. Safaris have long been popular with British travelers to Tanzania and Kenya, but these destinations now face stiff competition. Visitors can choose from half a dozen Sub Saharan destinations offering a spectrum of different safari opportunities. To maintain market share, tour operators in Kenya are having to “add-on” adventure activities and cultural opportunities to the traditional safari activities.
Reinventing Safari Tour operators in Tanzania, Kenya, and South Africa have started to offer walking safaris, kayak safaris, and mobile camping safaris. In Kenya, a 14-day walking safari in the Rift Valley is offered with local Samburu and Maasai warriors acting as guides. The tourists sleep in tents and travel by camel for part of their trip. Luxury tour operator Abercrombie & Kent offers their guests in Tanzania the opportunity to visit a local school or involves them in other philanthropic projects. Other traditional safari operators now offer visits to local tribes as part of a safari vacation. Source: Abercrombie & Kent (2009) Travel destinations, www.abercrombiekent.com, Downers Grove
Nature Tourism
Nearly all countries in SSA have significant nature tourism potential. Gorillas and other primates have become important sources of revenue for countries such as Uganda, Rwanda, and the Democratic Republic of Congo. There are just over 700 mountain gorillas in the Virunga Volcano Mountains which connect all three countries. While some visitors are willing to endure considerable hardship and pay high prices for the chance to spend just a short time viewing
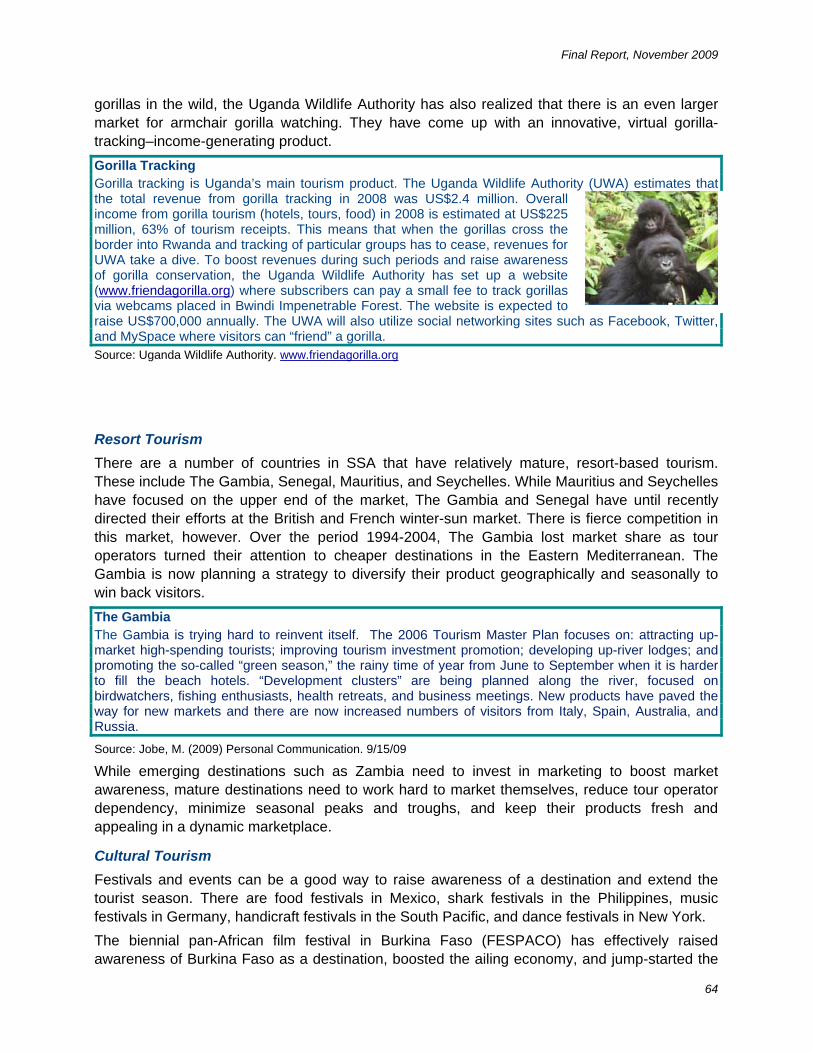
Final Report, November 2009
64
gorillas in the wild, the Uganda Wildlife Authority has also realized that there is an even larger market for armchair gorilla watching. They have come up with an innovative, virtual gorilla-tracking–income-generating product.
Gorilla Tracking Gorilla tracking is Uganda’s main tourism product. The Uganda Wildlife Authority (UWA) estimates that the total revenue from gorilla tracking in 2008 was US$2.4 million. Overall income from gorilla tourism (hotels, tours, food) in 2008 is estimated at US$225 million, 63% of tourism receipts. This means that when the gorillas cross the border into Rwanda and tracking of particular groups has to cease, revenues for UWA take a dive. To boost revenues during such periods and raise awareness of gorilla conservation, the Uganda Wildlife Authority has set up a website (www.friendagorilla.org) where subscribers can pay a small fee to track gorillas via webcams placed in Bwindi Impenetrable Forest. The website is expected to raise US$700,000 annually. The UWA will also utilize social networking sites such as Facebook, Twitter, and MySpace where visitors can “friend” a gorilla. Source: Uganda Wildlife Authority. www.friendagorilla.org
Resort Tourism
There are a number of countries in SSA that have relatively mature, resort-based tourism. These include The Gambia, Senegal, Mauritius, and Seychelles. While Mauritius and Seychelles have focused on the upper end of the market, The Gambia and Senegal have until recently directed their efforts at the British and French winter-sun market. There is fierce competition in this market, however. Over the period 1994-2004, The Gambia lost market share as tour operators turned their attention to cheaper destinations in the Eastern Mediterranean. The Gambia is now planning a strategy to diversify their product geographically and seasonally to win back visitors.
The Gambia The Gambia is trying hard to reinvent itself. The 2006 Tourism Master Plan focuses on: attracting up-market high-spending tourists; improving tourism investment promotion; developing up-river lodges; and promoting the so-called “green season,” the rainy time of year from June to September when it is harder to fill the beach hotels. “Development clusters” are being planned along the river, focused on birdwatchers, fishing enthusiasts, health retreats, and business meetings. New products have paved the way for new markets and there are now increased numbers of visitors from Italy, Spain, Australia, and Russia.
Source: Jobe, M. (2009) Personal Communication. 9/15/09
While emerging destinations such as Zambia need to invest in marketing to boost market awareness, mature destinations need to work hard to market themselves, reduce tour operator dependency, minimize seasonal peaks and troughs, and keep their products fresh and appealing in a dynamic marketplace.
Cultural Tourism
Festivals and events can be a good way to raise awareness of a destination and extend the tourist season. There are food festivals in Mexico, shark festivals in the Philippines, music festivals in Germany, handicraft festivals in the South Pacific, and dance festivals in New York.
The biennial pan-African film festival in Burkina Faso (FESPACO) has effectively raised awareness of Burkina Faso as a destination, boosted the ailing economy, and jump-started the

Final Report, November 2009
65
tourism sector. Similarly the Zanzibar International Film Festival (ZIFF) has attracted cultural tourists to the region.
Film Festivals FESPACO festival is a celebration of African film, but it also serves a significant economic purpose: helping to reduce Burkina Faso’s reliance on foreign aid. Held every other year for the last 17 years, the festival now attracts thousands of film producers, directors, actors, and critics from around the world, including France, Italy, and Brazil. Participants vie for the “Golden Stallion” award, which comes with a monetary prize of €15,000. A significant industry has developed around the festival, including thriving hospitality and handicraft industries. The Zanzibar International Film Festival (ZIFF) celebrated its 12th year in 2009. Held in the UNESCO World Heritage city of Stone Town, the ten-day festival highlights films with an African focus as well as music, arts, and crafts. The Ministry of Tourism and Investment of Zanzibar estimated that approximately 6,000 international visitors come to Zanzibar for the ZIFF festival each year. Every evening a minimum of 250 international visitors join the 2,000 other festival visitors. The ZIFF is the largest film festival in Eastern and Central Africa. Source: Ngo J.C. (2009) Personal Communication, 9/22/09 and Martin Mhando, (2009) Personal Communication, 10/06/09. www.wcs.org/where-we-work/africa/gabon.aspx
Business Tourism
Business tourism is very important to SSA tourism. West and Central Africa rely on business tourism for the majority of their tourism revenues. However, many key business destinations are suspicious of tourism development. Lack of understanding has resulted in poor private-sector support. Angola is an example where a private-sector stimulus package is urgently needed.
Angola The discovery of new oil fields off the coast of Angola over the last five years has quickly made it one of the main oil-producing countries in the region and the fastest growing economy in Africa in 2008. Despite the complex visa procedures, travel to Luanda has doubled in the last six years. US charter Airline SonAir operates three flights a week between Houston and Luanda, catering almost exclusively to oil executives. Lufthansa, Brussels Airlines, Air France, and British Airways also operate direct flights to Luanda. The sudden increase of business travel to Luanda creates a significant opportunity for the development of hotels, tour, and other supporting businesses. While oil contributes significantly to the GDP, it has limited impact on unemployment and oil reserves are limited. Investing in tourism makes long-term financial sense. Source: www.sonairsarl.com
Environmental and Social Sustainability
Carefully planned community-based tourism can be a catalyst for conservation, poverty alleviation, and small-scale business development. The SSA Tourism Database notes The Gambia, Mozambique, Seychelles, South Africa, Uganda, Rwanda, and Eritrea are taking action to promote sustainable travel that protects the environment and helps communities.
Non Governmental Organizations (NGOs) are actively involved in linking ecotourism and community-based tourism to pro-poor development strategies in many countries in the region. NGOs active in tourism include: Conservation International IUCN, USAID, World Wildlife Fund, Overseas Development Institute (UK), Wildlife Conservation Society, and SNV. Gabon is a good example of how an international NGO and a private-sector sponsor can work together to create a tourism initiative that benefits the local community and support conservation efforts in the area.
Gabon

Final Report, November 2009
66
Gabon is slowly building its tourism industry. The most recent statistics available are from 2003 when the country received almost 225,000 international tourists. This figure may now be twice that, owing to the growth in oil-related business travel to Gabon. Oil is not all Gabon has to offer. Gabon is home to Central Africa’s largest population of forest elephants as well as the world’s largest population of leatherback turtles and silverback gorillas. In 2002, the late President Bongo designated 10% of the country as a protected area, creating 13 national parks. The Wildlife Conservation Society (WCS) was instrumental in establishing the parks by training local people and supporting ecotourism initiatives. In Loango National Park a partnership was forged between WCS and Societé de Conservation et Développement (SCD). It is supported by Africa’s Eden, a tour and ground operator. Africa’s Eden operates a luxury lodge and three eco-camps in Gabon while its sister company, Africa’s Connection, until recently provided regional air transportation. Africa’s Eden is thought to have created 300 jobs and contributed more than US$4.5 million towards conservation in Gabon since 2001. Recent changes in the political situation in Gabon, however, have put its future at risk. Source: Wildlife Conservation Society (2009), Gabon, Wildlife Conservation Society, New York
Adventure Travel
Adventure travel is another means of generating tourism income in isolated locations. Adventure travel combines risk-taking with discovery. It is defined as exploration or travel to remote or exotic areas, where the traveler should “expect the unexpected.” Fueled by active lifestyles, the rapid growth in adventure travel equipment manufacturing, and reality TV shows like Survivor, adventure tourism is a high-growth industry.
There is enormous variety in the adventure travel and tourism products available around the world. SSA destinations are just beginning to explore this potential. In Zambia, expedition-style rafting has opened up an entire “soft adventure” industry. In Namibia, a business that started with wave surfing now also offers dune boarding, camel riding, and parachuting. But adventure tourism does not need to involve dangerous activities. Sometimes just getting to the destination is adventure enough. Undiscovered Destinations has built a business model around this concept.
Undiscovered Destinations Undiscovered Destinations is a company based in the UK that specializes is organizing trips for very well-travelled people to hard-to-get-to places. Their list of destinations in Africa includes Angola, Comoros, Congo DR, Gabon, Eritrea, Sudan, and São Tomé and Príncipe. The Director, Jim Louth, explained that by sending tourists to these places, many amongst the world’s poorest countries, he can provide a direct stream of revenue to local businesses and help increase awareness of these places in the travel industry. Source: Louth, J. (2009) Personal Communication, 9/10/09
Small Business Development
One of the benefits of tourism, particularly for poorer nations, is the opportunity it provides for small-scale enterprise. Assisting local people to develop tourism business through soft loans, business training, and marketing initiatives can be an effective tool for poverty alleviation.
Association of Small Scale Enterprises in Tourism (ASSET) In The Gambia, considerable progress has been made in spreading the benefits of tourism to local people through fair trade and responsible tourism policies. The Association of Small Scale Enterprises in Tourism (ASSET) was established in April 2000 to advocate for and to promote locally owned tourism businesses in The Gambia. Its 80 members include taxi drivers, market and craft venders, tourist guides, and fruit sellers who previously did not have a voice in tourism affairs. ASSET hosted an international conference on Fair Trade in Tourism and provides training to its members. It won the Best for Poverty Reduction Award during the First Choice Responsible Tourism Awards 2005 held at the World Travel Market in
Final Report, November 2009
67
London. The event was sponsored by First Choice Holidays PLC in association with The Times, and Geographical Magazine, giving The Gambia considerable positive exposure. Source: www.asset-gambia.com/
Level 4. Flourishing Strategies
On-going success in tourism requires delivery of a high-quality product, constant innovation, and effective marketing. Marketing and monitoring are key winning strategies.
Marketing and Promotion
Communicating with customers and building destination awareness in potential source markets requires costly marketing campaigns that few small countries can afford. Emerging destinations often lack name recognition or have a poor image overseas. One strategy to address this is participation in regional tourism organizations.
South Africa South Africa has a modern, diversified economy and an extremely active private, public, and nonprofit sector engaged in tourism. The large number of tour operators (including travel agents) and longer-than-average length of stay indicate the strength of the sector. South Africa Tourism is a well-financed tourism organization, responsible for the marketing and development of tourism in the country. The Federated Hospitality Association of South Africa (FEDHASA) is the main private sector association. There is also a Tourism Training Authority and Tourism Grading Council in charge of standards. Source: Federated Hospitality Association of South Africa (FEDHASA) www.fedhasa.co.za
Regional tourism organizations work particularly well for small, isolated nations. Regional training, websites, business support, hotel accommodation rating, and marketing assistance can all be effective means of supporting small countries. The Caribbean Tourism Organization (CTO) has helped boost tourism and sustainability in the Caribbean. South Pacific Tourism (formerly SPTO) is planning, training, gathering statistics, and assisting with marketing for 14 countries in the South Pacific. In SSA, the Regional Tourism Organization of Southern Africa (RETOSA) has done similar work.
Regional Tourism Organization of Southern Africa (RETOSA) Since the creation of RETOSA, member country representation at international tourism trade shows has increased significantly. Other successful initiatives initiated by RETOSA include:
• The creation and implementation of a 2010 FIFA World Cup regional tourism plan • Development of community-based tourism projects in the region • The creation of Transfrontier Conservation Areas (TFCA) which made ecological and socioeconomic
improvements to shared international protected areas • Developing the UNIVISA, a tourism visa which will facilitate movement of international and regional
tourists in SADC countries The example of RETOSA could be considered by other parts of Sub Saharan Africa where economic development communities already exist and small marketing budgets and image problems constrain the effective marketing of a single destination. Source: RETOSA (2009) About RETOSA, RETOSA, Midrand. www.retosa.co.za
Monitoring Performance
The timely, consistent, and complete collection and analysis of tourism statistics is extremely important for a number of reasons. First, it provides evidence of the importance of tourism to the country. This helps governments prioritize spending on infrastructure, marketing, and product development. Second, it helps keep the private sector stay up to date with trends in the industry.

Final Report, November 2009
68
Third, it raises the profile of tourism in the country as a desirable and profitable business to be in.
The quality of tourism monitoring across SSA is very low. Typical data processing shortfalls include: haphazard collection of arrival cards and hotel data, poor coordination between offices involved in data processing, lack of capacity in one or all the departments where statistics are processed, lack of understanding of the importance of timely and consistent data publication, and low levels of political support for data publication.
Other problems arise when data collection systems are changed without explanation, resulting in a sudden increase or decrease in recorded numbers. Creative data processing, such as including same-day arrivals with overnight arrivals to artificially boost arrivals numbers, undermines progress made in many parts of the region to improve statistics and is a significant constraint to tourism analysis.
Building capacity to accurately monitor tourism demand and supply across SSA is an urgent need. Comparable methodologies and high standards of data analysis are needed. The Rwanda Office of Tourism and National Parks (ORTPN) has since June, 2007, embarked on improving the country’s tourism statistics with financial assistance from the World Bank.
Rwanda The World Bank project in Rwanda has assisted the Rwanda Tourism Agency with the development of a series of monthly Highlights of Tourist Arrivals. New immigration arrival and departure forms have been developed in cooperation with the Directorate General of Immigration and Emigration (DGI) using internationally accepted definitions of tourism terms and concepts, notably of the travelers’ purpose of visiting Rwanda and their length of stay in the country. The new forms were introduced by 1st January, 2008, at all the country’s border stations. DGI is also in the process of computerizing the border stations to accommodate the information provided on the new arrival and departure forms. The computerization is still ongoing and only when all border stations have been computerized and interconnected with the DGI HQ can all the information from the new arrival and departure forms be electronically compiled and analyzed. Source: ORTPN (2009) Highlights of International Visitor Arrivals in Rwanda, 2008. Rwanda Office of Tourism and National Parks, Kigali. www.rwandatourism.com
The new improved tourism monitoring in Rwanda now distinguishes between same-day visitors and overnight tourists. Once arrival statistics are improved and standardized through the region, tourism satellite accounting73 will be the next priority to show the full value of tourism for the region.
73 Tourism Satellite Accounting (TSA) is a method of tracking tourism’s economic impact on a more equal footing with other sectors of the economy. The preparation of a TSA involves household surveys as well as other detailed economic analysis which allows tourist spending and expenses to be tracked as they move through the economy
Final Report, November 2009
69
Summary
This report has provided an analysis of the results of a 47-country comparative tourism research study. It has identified the main patterns of demand and supply across Sub Saharan Africa, and has analyzed these by region and by country.
The report has also assessed the future potential of SSA destinations. By analyzing current demand, forecasted growth rates, business climate, and tourism competitiveness, five destination groups have been identified.
• Group One: Seychelles, Mauritius, Namibia, Cape Verde, South Africa, and Kenya • Group Two: Ghana, Tanzania, Botswana, Zambia, The Gambia, Uganda, Senegal,
Ethiopia, Madagascar, and Nigeria • Group Three: Sierra Leone, Malawi, Angola, Mozambique, Burkina Faso, Cameroon,
Mauritania, Benin, and Rwanda • Group Four: Zimbabwe, Mali, Côte D’Ivoire, Comoros, São Tomé and Príncipe, Gabon,
Sudan, Lesotho, Chad, Eritrea, and Swaziland • Group Five: Burundi, Guinea, Togo, Niger, Congo DR, Central African Rep., Guinea-
Bissau, Republic of Congo, Equatorial Guinea, Liberia, Somalia
Group One countries are the highest performing destinations. Group Two and Group Three countries have great potential for successful tourism but each has constraints that need to be addressed. Group Four countries face considerable constraints to successful tourism development, and Group Five countries are not currently considered viable destinations.
The constraints facing these destinations have been discussed as a “Hierarchy of Destination Needs.” The hierarchy demonstrates how destinations need to resolve fundamental preconditions like safety and political stability before tourism development can proceed. Easy visa processing is a key “enabler” for tourism along with air access and hotel development. Product development, culture, and costs are the key “attractors.” Towards the top of the pyramid, service quality, tourist experiences, and environmental sustainability are highlighted. Then, at the very top, quality, innovation, and marketing are the focus.
The strategy section demonstrated how different levels of intervention are required for different levels of destination need. Examples from around the region and globe were provided to illustrate different approaches to resolving common issues.
Tourism holds considerable promise for Sub Saharan Africa. But many destinations have considerable constraints to address before they will be able to reach their potential. Not all destinations face the same constraints, nor are all constraints of the same order of magnitude. While some countries are still struggling with the basics of security and visas, others are more challenged by product development and airline agreements. Clustering countries according to key constraints may be an efficient way of to build strategies for success.
When destinations fail to solve the preconditions and enablers, tourism development becomes a difficult, uphill struggle. When destinations get the preconditions right and create an enabling business climate, investor confidence increases, hotel developers arrive, airlines create new routes, tourist arrivals increase, and tourism benefits start to spread.
Final Report, November 2009
70
Recommendations
This report takes a step towards a better understanding of the potential and constraints facing tourism development in Sub Saharan Africa. Further work is now needed to understand the issues better and to create viable solutions. Due to the cross-sectorial and interdisciplinary nature of tourism, the recommendations span a wide range of tourism and business-related issues. The recommendations are not numbered because the priority with which they are addressed will depend on the stage of development of individual destinations and the challenges facing them.
Institutions: build capacity
Governments are often interested in developing tourism but are sometimes ill-equipped to know what needs to be done. Tourism awareness training, aimed at ministries of tourism and national tourism offices, is needed. It should emphasize tourism preconditions and how to create an enabling business environment for tourism. Training should be aimed at Destination Groups Two, Three, and Four.
Policy: improve tourism policy
Another common issue is tourism policy failure. Creating policies is difficult because the cross-sectorial nature of the industry requires interdisciplinary skills and complex decisionmaking. A prototype tourism policy document should be produced for each group of destinations. It should identify essential elements: regulatory framework, licensing, health and safety standards, as well as other key areas noted below. It should be aimed at all destination groups.
Partnerships: support tourism associations
Supporting tourism associations with skills training and using tourism associations as vehicles for private sector up-skilling can be an efficient and effective way to stimulate small-scale private sector development. This support should be aimed at Destination Groups Two, Three, and Four.
Information: collect, manage, and use
There are significant shortfalls in data collection, management, and analysis in SSA. Good information is crucial to decisionmaking for both the public sector and for private sector investors. A program of training and capacity building focused on tourism information is needed. The program should be aimed at Destination Groups Two, Three, and Four.
Borders: streamline visas
The difficulty of obtaining visas, particularly for inter-regional travelers, is a considerable constraint to tourism development in SSA. Streamlined border formalities and visa processing is a crucial tourism enabler. Work is needed to demonstrate the clear relationship between relaxed visa arrangements and tourism success. It should be aimed at ministries and governments in all destination groups.
Access: improve infrastructure
Air and road transportation is essential for tourism. Cost, safety, and efficiency are required if regional airlines are to increase their flight frequency and market share. Greater efforts are needed to liberalize air transport. Improved road, rail, and waterway infrastructure is needed to encourage international, inter-regional, and domestic trade, travel, and to provide access to tourist attraction sites. These initiatives should be aimed at Groups Two and Three.

Final Report, November 2009
71
Business: strengthen reforms
Tourism can be a starting point for the reform of business laws. Initiatives are needed across the region to improve the climate for business and boost investor confidence. Particular focus is needed on commercial codes, land policies, the impact of taxation and incentives on business, work permits, investment protection legislation, and respect for the rule of law. Training should be aimed at Destination Groups Three and Four.
Products: innovate and package
Many countries have underdeveloped tourism resources. Product innovation, interpretation, and packaging are essential. Training is needed to help countries convert resources such as parks, waterways, and cultural heritage sites into attractive tourism products. Training can take place in country clusters and focus on improving safety, customer management, and interpretation. This should be aimed at Destination Groups One, Two, and Three.
Sustainability: encourage and certify
Environmental, social, and economic sustainability initiatives, such as fair trade tourism certificates and labels, can help tourism be a catalyst for conservation and poverty alleviation. Work is needed to strengthen and support NGO and community-based programs and their linkages to larger projects. These initiatives should be aimed at all destination groups.
Research: explore issues
This study provides an overview of SSA tourism. Not all issues could be included. Areas where further research can be usefully directed include: size of demand for different tourism segments; land costs and availability; business costs; investment promotion; institutional function and structure.

Final Report, November 2009
72
LIST OF SOURCES
Ashley, C. and Mitchell, J. (2005) Can Tourism Accelerate Pro-Poor Growth in Africa? ODI Opinion Paper No. 60, Overseas Development Institute, London.
Bahrampour, T. (2004) “Eritrea Emerges,” Travel + Leisure Magazine, American Express Publishers, New York. Bank of Ghana (2007) The Tourism Industry and the Ghanaian Economy, Accra. Botswana Department of Tourism (2008) Tourism Facts and Figures, Department of Tourism, Gaborone. Botswana Department of Tourism (2008) Visitor Survey 2008, Department of Tourism, Gaborone. Botswana Tourism Development Programme (2000) Botswana Tourism Master Plan: Final Report. Botswana Tourism Development Programme, Gaborone. Brogden, L. (2009) Development Trends in the Airline Industry, IATA Regional Vice President, Africa, Presentationin Windhoek, 3 March. Brown, M. (2008) “Poor Image Robs Sudan of Tourism Windfall,” September 23 2008, The National, Abu Dhabi. Burundi National Tourism Office (2009) Tourism Vision, BNTO, Bujumbura. Christie, I. and Crompton, D. E. (2001) Tourism in Africa, Working Paper Series No. 12, World Bank, Washington D. C.
Christie, I. and Crompton, D. E. (2002) Tourism in Africa, Environmental Rural and Social Development, July, 187, World Bank, Washington D. C.
Christie, I. and Crompton, E. (2003) Republic of Madagascar: Tourism Sector Study, Africa Region Working Paper Series No. 63, World Bank Group, Washington D.C. Clarke, R. (2009) Liberia/Namibia Sign Communiqué, STAR Radio Liberia, Monrovia. Cohen, S. (2008) Maloti Drakensberg Transfrontier Project. Ministry of Tourism, Environment and Culture.
Columbia University (2008) The Investor’s Guide to São Tomé and Príncipe, The Earth Institute at Columbia University, New York. Condé Nast Traveler (2009) “Verde Vibes”, Condé Nast Traveler, July 2009, New York. Crouch, G. I. and Ritchie, B. J. R. (1999) “Tourism, Competitiveness, and Societal Prosperity”, Journal of Business Research, Vol. 44,137-152.
de Kadt, E. (ed.) (1979) Tourism - Passport to Development? Perspectives on the Social and Cultural Effects of Tourism in Developing Countries, Oxford University Press for the World Bank and UNESCO, New York.
Dept. of Environmental Affairs and Tourism (2005) State of the Environment Report. Pretoria. Emerging Markets Group Ltd (2009) Tourism Market Research Study for East Africa - European Market, Emerging Markets Group, London. eStandardsForum (2009) Country Brief Equatorial Guinea, April 28 2009. Euromonitor (2006) Travel and Tourism in Chad, Euromonitor, London. Euromonitor (2007) Travel and Tourism in Benin, Euromonitor, London. Euromonitor (2007) Travel and Tourism in Central African Republic, Euromonitor, London. Euromonitor (2007) Travel and Tourism in Comoros, Euromonitor, London. Euromonitor (2008) Travel and Tourism in Liberia, Euromonitor, London. Euromonitor (2008) Travel and Tourism in Mauritania, Euromonitor, London. Euromonitor (2008) Travel and Tourism in Niger, Euromonitor, London. Euromonitor (2008) Travel and Tourism in Rwanda, Euromonitor, London. Euromonitor (2008) Travel and Tourism in Togo, Euromonitor, London.
Euromonitor (2008) Travel and Tourism in Uganda, Euromonitor, London.
Euromonitor (2008) Travel and Tourism in Zambia, Euromonitor, London.
Euromonitor (2009) Travel and Tourism in Democratic Republic of Congo, Euromonitor, London. Euromonitor (2009) Travel and Tourism in Equatorial Guinea, Euromonitor, London.

Final Report, November 2009
73
Euromonitor (2009) Travel and Tourism in Somalia, Euromonitor, London. FIAS (2006) The Tourism Sector in Mozambique: A Value Chain Analysis, World Bank and OECD Development Centre.
Gambia Tourism Authority (2006) The Gambia Tourism Development Master Plan, GTA, Kololi. Gambia Tourism Authority (2008) Tourism Statistics 2004-2007, Gambia Tourism Authority, Kololi. GATO (2005) Tourism Master Plan Madagascar, International Tourism Organization for Development and Tourism, München. Gelb, A. and Tidrick, G. (2000) “Growth and Job Creation in Africa: Mauritius from Hard Case to Success Story,” In, Strategies for Growth and Job Creation in Southern Africa, World Bank, Gaborone, p.121-134. Ghana Tourist Board (2008) Tourism Statistical Fact Sheet on Ghana, GTB, Accra. Global Development Solutions, LLC. (2006) Value Chain Analysis for the Tourism Sector in Ethiopia, Government of Ethiopia and the World Bank, Addis Ababa. Government of Mauritius (2006) The Tourism Authority Act of 2006 Amended 27 December 2008, Port Louis. Government of the Seychelles (2007) Seychelles Strategy 2017, Government of the Seychelles, Victoria. Graham Muller Associates (2005) Preparation of a National Tourism Development Plan: Phase 1- The Swaziland Tourism Environment: A Situation Analysis, Durban. Graham Muller Associates (2006) Preparation of a National Tourism Development Plan: Phase 2-National Tourism Development Plan: Long-Term Plan to 2020, Durban. Graham Muller Associates (2006) Preparation of a National Tourism Development Plan: Phase 3-National Tourism Development Plan: Short-Term Action Plan to 2010, Durban. Hamilton, K. Tembo, G. Sinyenga, G. Bandyopadhyay, S. Pope, A. Guillon, B. Muwele, B. Mann, S. and Pavy, J. M. (2007) The Real Economic Impact of Nature Tourism in Zambia, Nature Resources Consultative Forum, Lusaka.
Handley, G. Higgins, K, Sharma,B. , Bird, K. and Cammark, D. (2009) Poverty and Poverty Reduction in Sub Saharan Africa: An Overview of Key Issues, Overseas Development Institute, London.
Handley, G. Higgins, K. Sharma, B. (2009) Poverty and Poverty Reduction in Sub-Saharan Africa: An Overview of the Issues. Working Paper 299, Overseas Development Institute (ODI), London.
HATAB (2009) Mission Statement. HATAB, Gaborone. Holder, C. (2009) “Seeking a Peace Dividend in Liberia,” April 23, 2009, The Washington Times, Washington D.C. IMF (2006) The Tourism Sector in Mozambique: A Value Chain Analysis, International Monetary Fund, Washington D.C. Institute for Economics and Peace (2009) Global Peace Index; 2009 Methodology, Results & Findings, Institute for Economics & Peace, Sydney. Instituto Nacional de Estancia Cabo Verde (2008) Estatisticas do Turismo, Cidade da Praia. Inter-Arab Investment Guarantee Corporation (2008) Investment Climate in the Arab Countries 2007, Inter-Arab Investment Guarantee Corporation, Safat. IUCN and Symbiosis Consulting (2002) Bostwana National Ecotourism Strategy, IUCN, Gaborone. Jolloh, C. A. (no date) Tourism and Cultural Sector Review by the Minister of Tourism and Culture, Government of Sierra Leone, Freetown. Kenya Tourism Board (2009) Tourism Performance 2008, Q1 2009, Kenya Tourism Board, Nairobi. Leechor, C. (2005) Developing Tourism in Botswana: Progress and Challenges, Discussion Draft. The World Bank and the Botswana Institute for Development Policy Analysis. Washington D.C. Lesotho Tourism Development Corporation (2008) Analysis of 2007 Arrival Statistics. LTDC, Maseru.
Lesotho Tourism Development Corporation (2008) Analysis of 2007 Accommodation Statistics, LTDC, Maseru.
Lesotho Tourism Development Corporation (2008) Comparative Analysis of Visitor Surveys Aug-Sept 2007 and Dec 2007-Jan 2008, LTDC, Maseru.
Lesotho Tourism Development Corporation (2008) Peak Season Survey Dec 2006-Jan 2007, LTDC, Maseru.

Final Report, November 2009
74
Lesotho Tourism Development Corporation (2009) 2008 Arrival Statistics Annual Report, Research and Development Department LTDC, Maseru.
Lindsey, P. A. (2008) “Trophy Hunting in Sub Saharan Africa: Economic Scale and Conservation Significance,” Best Practices in Sustainable Hunting, pp. 41-47.
Malawi Ministry of Tourism, Wildlife and Culture (1999) Report on a Survey of Tourist Attractions and Events of Tourism Significance, Lilongwe. Malawi Ministry of Tourism, Wildlife and Culture (2007) National Tourism Policy for Malawi, MTWC, Lilongwe. Malawi Ministry of Tourism, Wildlife and Culture (2007) Tourism Report 2006, MTWC, Lilongwe. Malawi National Statistics Office (2008) Statistical Yearbook 2008, Malawi National Statistics Office, Lilongwe. Mathieson, A. and Wall, G. (1982) Tourism: Economic, Physical and Social Impacts, Longman Scientific and Technical, Harlow.
McKinnon, J. and Rozga, Z. (2007) Private Sector Competitiveness Project: Strengthening the Tourism Market in Lesotho, Ministry of Trade, Industry, Cooperatives and Marketing and Ministry of Tourism, Environment Messerli, H., R. Shendy and Gurcanlar, T. (2009) Tourism Trends in Sub Saharan Africa, September 2009 Sector Update. World Bank, Washington, D.C.
Michell, J. and Faal, J. (2008) The Gambian Tourist Value Chain and Prospects for Pro-Poor Tourism, Working Paper 289, Overseas Development Institute, London.
MIGA (2007) Snapshot Africa Mali; Benchmarking FDI Competitiveness, World Bank Group, Washington D.C. Ministère de la Culture, de la Culture, du Tourisme et de la Communication (Burkina Faso) (2008) Rapport sur L’Herbergement Touristique, DRST, Ouagadougou. Ministère de la Culture, de la Culture, du Tourisme et de la Communication (Burkina Faso) (2007) Politique Nationale de la Culture et du Tourisme, DRST, Ouagadougou. Ministry of Environment, Forestry, and Tourism (Madagascar) (2008) Tourism Statistics 2007, Antananarivo. Ministry of Natural Resources and Tourism (Tanzania) (2008) Tanzania Tourism Statistics 2008, Ministry of Natural Resources and Tourism, Dar es Salaam.
Ministry of Natural Resources and Tourism (Tanzania) (2008) Tanzania Tourism Statistics 1995-2007, Ministry of Natural Resources and Tourism, Dar es Salaam.
Ministry of Tourism (Malawi) (2008) Malawi Tourism Sector Programme; Human Resources Plan, Tourism Intelligence International, Lilongwe. Ministry of Tourism (Malawi)(2008) Malawi Tourism Sector Program; Marketing Plan, Tourism Intelligence International, Ministry of Tourism, Lilongwe. Ministry of Tourism (Malawi) (2008) Malawi Tourism Sector Program; Proposals for Institutional Reform, Tourism Intelligence International, Ministry of Tourism, Lilongwe. Ministry of Tourism (Malawi) (2008) Malawi Tourism Sector Program; Tourism Strategic Plan Revision, Tourism Intelligence International, Ministry of Tourism, Lilongwe. Ministry of Tourism and Crafts (Guinea Bissau) (2009) Tourism Statistics 2008, MTC, Bissau. Ministry of Tourism and Wildlife (Sudan) (2009) Tourism Statistics 2005 and 2006, MTW, Khartoum. Ministry of Tourism Mozambique (2003) Tourism Policy and Strategy, Government of Mozambique, Maputo. Ministry of Tourism Mozambique (2004) Strategic Plan for the Development of Tourism in Mozambique, (2004-2013), Maputo. Ministry of Tourism Mozambique (2008) Tourism: Where to Invest? Mozambique Trade and Investment Conference, Hotel Polana, June 19-20, 2008, Maputo. Ministry of Tourism Mozambique (2009) Movimento de Viajantes e Inquerito Pilot a Despesa do Turista, Nampula 17-19 Agosto, Maputo Ministry of Tourism, Leisure and External Communications (Mauritius) (2004, 2005, 2006) Tourist Arrivals Statistics, Government of Mauritius, Port Louis.
Final Report, November 2009
75
Ministry of Tourism, Leisure and External Communications (Mauritius) (2004) Survey of Outgoing Tourists 2004. Government of Mauritius, Port Louis. Ministry of Tourism, Wildlife and Culture (2008) Tourism Investment Opportunities in Malawi, Lilongwe. Mintel (2004) Kenya Travel and Tourism Intelligence, Mintel, London. Mintel (2006) Madagascar Travel and Tourism Intelligence, Mintel, London. Mintel (2006) Mozambique Travel and Tourism Intelligence, Mintel, London. Mintel (2007) Ethiopia Travel and Tourism Intelligence, Mintel, London. Mintel (2007) Ghana Travel and Tourism Intelligence, Mintel, London. Mintel (2007) Nigeria Travel and Tourism Intelligence, Mintel, London. Mintel (2007) Senegal Travel and Tourism Intelligence, Mintel, London. Mintel (2007) Tanzania Travel and Tourism Intelligence, Mintel, London.
Mintel (2007) Zimbabwe Travel and Tourism Intelligence, Mintel, London.
Mitchell, J. and Faal, J. (2008) The Gambian Tourist Value Chain and Prospects for Pro-Poor Tourism. Overseas Development Institute, London. Mowforth, A. and Munt, I. (1998) Tourism and Sustainability: New Tourism in the Third World, Routledge, London.
Mozambique Tourism Anchor Investment Program (2008) The Anchor Investment Sites, Mozambique Tourism Anchor Investment Program, Maputo. Mzembi, W. (2009) Tourism Investment Opportunities in Zimbabwe, Government of Zimbabwe, Harare. www.zimtreasury.org/downloads/284.pdf
Namibia Ministry of Environment and Tourism (2004) Statistical Report 2004. MET, Windhoek. Namibia Tourism Board (2005, 2006, 2007) Tourism Arrival Statistics 2005, 2006, 2007, Windhoek. Namibia Tourism Board (2008) Namibia Tourism Satellite Account: 2nd Edition, Namibia Tourism Board, Windhoek. National Heritage Commission (2009) Southwest Region Victoria Falls World Heritage Site, Visitor Statistics.
National Investment Commission (2008) The Investor’s Guide to Liberia, National Investment Commission, Monrovia. National Statistics Bureau (2009) Migration and Tourism Statistics 2008, National Statistics Bureau, Victoria. OCED (2008) Tourism in OCED Countries, 2008: Trends and Policies, OCED, Paris.
ODI/SNV (2009) Making Success Work for the Poor-Package Tourism in Northern Tanzania, Overseas Development Institute, London.
ORTPN (2009) Highlights of International Visitor Arrivals in Rwanda, 2008, Rwanda Office of Tourism and National Parks, Kigali. www.rwandatourism.com
PCIM (2009) Investment opportunities in tourism, Presidential Council for Investment, www.investinmauritania.gov.mr/entourisme.html, Nouakchott. Poon, A. (1993) Tourism, Technology and Competitive Strategy, CAB International, Wallingford.
Porter, M. E. (1980) Competitive Strategy: Techniques for Analysing Industry and Competitors, The Free Press, New York.
Porter, M. E. (1990) Competitive Advantage of Nations, The Free Press, New York.
Potter, B. (2005) Sustainable Tourism in São Tomé Príncipe, Island Resources Foundation for The Earthwatch Institute at Columbia University, New York. Reserve Bank of Zimbabwe (2006) Investment Opportunities in Zimbabwe: A Guide to Foreign Investors, Reserve Bank of Zimbabwe, Harare.
RETOSA (2009) About RETOSA, RETOSA, Midrand. www.retosa.co.za
Schlumberger, C. E. (2009) The Implementation of the Yamoussoukro Decision. World Bank, Washington, D.C.
Sinclair, M. T. (1992) “Tourism Economic Development and the Environment: Problems and Policies”, in Cooper, C. P. and Lockwood, A. (eds.), Progress in Tourism and Hospitality Research, John Wiley and

Final Report, November 2009
76
Sons, Chichester, Vol. 4, pp. 75-81.
South Africa Tourism (2008, 2007, 2006, 2005, 2004, 2003, 2002) Highlights of Tourism's Performance, South Africa Tourism (2009) Tourism Satellite Account for South Africa, Statistics South Africa, Pretoria. Statistics South Africa, (2004) Hotel Trading Statistics, Statistics South Africa, Pretoria. Statistics South Africa, Pretoria. Steinmetz, T. (2008) “Mauritania’s Tourism Fails to Rebound Following Attacks”, June 24 2008, eTurboNews, www.eturbonews.com/3302/mauritanias-tourism-fails-rebound-following-a, Haleiwa. Steinmetz, T. (2008) “Terrorism Kills Tourism in Mauritania”, November 19 2008, eTurboNews, www.eturbonews.com/6312/terrorism-kills-tourism-mauritania, Haleiwa. Steinmetz, T. (2008) “Tourism Industry Suffers Financial Fallout after Spate of Attacks”, March 25 2008, eTurboNews, www.eturbonews.com/1865/tourism-industry-suffers-financial-fallout-af, Haleiwa. Steinmetz, T. (2009) “First Suicide Bomb Attack Hits Mauritania”, August 10 2009, eTurboNews, www.eturbonews.com/10918/first-suicide-bomb-attack-hits-mauritania-highlighting-challenge, Haleiwa. Swaziland Tourism Authority (2009) International Arrival Figures. www.welcometoswaziland.com, Mbabane. The Gambia Tourism Authority (2009) Monthly Arrivals Statistics 2007-8, Gambia Tourism Authority, Kololi. TIES (2008) TIES Global Ecotourism Factsheet, TIES, Washington, D.C.
UNCTAD (2008) World Investment Report 2008, United Nations Conference on Trade and Development, New York. [and country study for each country] UNEP and UNWTO (2005) Making Tourism More Sustainable: A Guide for Local Policy Makers, UNEP and UNWTO, Paris and Madrid.
United Nations Development Programme and World Tourism Organization (2002) Strategic Tourism Development Plan in Malawi, Madrid. UNWTO (2002) Plan Stratégique de Développement du Tourisme Sao Tomé et Principe, UNWTO, Madrid. UNWTO (2004) Tourism and Poverty Alleviation: Recommendations for Action, UNWTO, Madrid.
UNWTO (2005) Tourism Market Trends Africa, UNWTO, Madrid. UNWTO (2006) Nigeria Tourism Development Master Plan- Final Report Executive Summary, Madrid. UNWTO (2009) Tourism Highlights 2009 Edition, UNWTO, Madrid.
UNWTO (2009) World Tourism Barometer, Interim Update, April, World Tourism Organization, Madrid.
UNWTO (2009) World Tourism Barometer, Interim Update, Volume 7 (1), World Tourism Organization, Madrid.
UNWTO (2009) World Tourism Barometer, June, Volume 7 (2), World Tourism Organization, Madrid.
UNWTO (2009) Tourism 2020 Vision, UNWTO, Madrid.
UNWTO, (2008) Sustainable Development of Tourism, E-bulletin No. 15, World Tourism Organization, Madrid.
USAID (2008) Sustainable Tourism on the Move in Mali, United States Agency for International Development, www.usaid.gov/ml/en/aeg_sustainable_tourism.html. Van Beek, W. Rutten, M. and Spierenburg, M. (2008) Tourism in Africa, ASC Info Sheet 3, African Studies Centre, Leiden.
Verdugo, D. (2006) Tourism and Development Aid: an International Organization’s Perspective in East and Southern Africa, SNV Framework Letter 2005-6.
WEF (2009) World Economic Forum Travel and Tourism Competitiveness Indicator, World Economic Forum, Geneva.
Wildlife Conservation Society (2007) A Vision for Gabon- Tourism, Parks and Sustainable Development in the 21st Century, New York. World Bank (2003) Senegal Tourism Sector Study/ Africa Region, Working Paper No. 46, World Bank, Washington, D.C. World Bank (2006) Ethiopia: Towards a Strategy for Pro-Poor Tourism Development, Private Sector

Final Report, November 2009
77
Development Department for Ethiopia, World Bank, Washington, D.C. World Bank (2008) Kenya Tourism: Integrated Value Chain Analysis - Draft Final Report, Washington D.C. World Bank (2009) Republic of Mali Growth Support Project: Project Paper Data Sheet, Washington D.C. World Bank (2009) Tourism Market Research Study for East Africa - European Market, World Bank, Washington D.C.
World Bank and IMF (2009) Doing Business 2009, World Bank, Washington, D.C.
World Bank, (2009) Competitive Africa Strategies to Leverage the New Global Economy, Report Concept Note, Washington D.C.
World Economic Forum (2008) “Enhancing Competitiveness in Four African Economies: The Case of Botswana, Mauritius, Namibia and Tunisia.” In The Africa Competitiveness Report, World Economic Forum, Geneva, pp. 139-161. World Economic Forum (2008) The Global Gender Gap Report, WEF, Geneva.
World Economic Forum (WEF) (2009) The Africa Competitiveness Report, 2009, WEF, Geneva.
World Economic Forum (WEF) (2009) Travel and Tourism Competitiveness Report 2009: Managing in a Time of Turbulence, WEF, Geneva.
WTTC (2000) Tourism Satellite Accounting Research Estimates and Forecasts for Governments and Industry, Year 2000, CD-ROM, London. WTTC (2006) Namibia The Impact of Travel and Tourism on Jobs and the Economy, WTTC, London. WTTC (2007) Botswana: The Impact of Travel and Tourism on Jobs and the Economy, WTTC, London. WTTC (2009) Travel and Tourism Economic Impact, WTTC, London. [for each country] WTTC (2009a) Travel and Tourism Economic Impact: Sub Saharan Africa 2009, WTTC.
WTTC (2009b) Travel and Tourism Economic Impact 2009 Executive Summary, WTTC.
WTTC (2002) South Africa: The impact of Travel and Tourism on Jobs and the Economy, WTTC, London www.estandardsforum.org/secure_content/country_profiles/cp_68.pdf Zambia Tourist Board (2008) 2008 Tourism Analytical Report, ZTB, Lusaka.

Final Report, November 2009
78
APPENDIX
Methodology
Data Collection
The data collection process for this study was primarily desk-based. It involved collecting, compiling, and evaluating existing statistics and information on the Sub Saharan tourism industry. Data sets used in the report were selected to achieve the best possible combination of reliability, timeliness, comparability, and completeness. Where possible, information was collected from the main source, and then cross-checked for consistency and reliability with other available sources. Three data types are included in the report: generic country data, third party data, and country-specific data.
Generic Country Data
Generic country data includes the social and economic data set that could be compiled for all countries in the region using the same source. The main sources for generic data are the World Bank and the International Monetary Fund (IMF). Both organizations provide data for almost all countries in Sub Saharan Africa, which enables comparisons to be made between countries. The World Economic Forum Global Competitiveness Report was used for a number of indicators on business and tourism competitiveness because it is broad in coverage of the issues and includes most of the countries in the study.
Third Party Data
Third party data includes airline and hotel statistics. Data concerning airline flight frequency and cost was obtained from a professional online flight planner and cross-checked against individual airline websites. Flight costs were calculated using the Official Airline Guide (OAG) to obtain an average of the three lowest scheduled fares for May and December. Fare averages do not include charter airlines, as pricing for charters is not normally available more than a few months ahead of departure. Data on internationally branded hotels were sourced directly from hotel companies and cross-checked with online travel agents.
Country-specific Data
Country-specific tourism research was needed to find information on tourism demand, tourism economics, tourism competitiveness, and to compile the country profile. Tourism demand statistics were sourced where possible from national tourism offices and tourism ministries. Where this was not possible, or the data provided from national sources was incomplete, tourism arrival data were sourced from the United Nations World Tourism Organization.
International tourism receipts include all direct expenditure made by overnight and same-day visitors but exclude expenditures related to international transport. For the sake of consistency, all the tourism receipt information is from UNWTO. Where possible this has been cross-checked with national government figures and/or the World Travel & Tourism Council (WTTC). WTTC data are used primarily for tourism employment information.74
74 WTTC data are based upon a simulated Tourism Satellite Accounting (TSA) model that forecasts tourism’s effect on economic activity and employment. The TSA model uses historic data as well as economic research to make assumptions and forecasts. The model is a useful tool for countries that do not have their own TSA model in place and have limited tourism statistics. However, figures on travel and tourism employment by the WTTC sometimes appear unusually high or low compared to the number of visitors and other indicators

Final Report, November 2009
79
Information about tourism products and attractions was gathered from a variety of sources including national tourism planning documents, tourism office websites, tour operator websites, and up-to-date travel guidebooks. All tourism supply data was cross-checked with two or more sources.
Interviews with government officials, hotel companies, airlines, and tour operators were used to further validate quantitative and qualitative data. A total of 21 phone interviews were conducted of between 20 minutes and one hour. These were “guided discussions” rather than formal interviews, designed to cross-check the information collected and to test report assumptions. A list of people interviewed is included in Table 11 of the Appendix.
Data Availability
Availability of tourism-related statistics varies significantly across in Sub Saharan Africa. While a few countries have well-organized data collection processes and present monthly arrival statistics online within a few weeks, others have no tourism statistics available at all.
Data analysis by region shows Southern Africa has the best data collecting systems. The five countries in Southern Africa all have 91% of the basic tourism demand data available from 2004-2007. East African countries have 75% of basic data available. West Africa has only 61% of basic tourism data available and Central Africa has only 49%.
• In Southern Africa, South Africa, Swaziland, and Lesotho have the best basic tourism data availability. Botswana is the lowest performer in the region due to the late publication of statistics.
• In East Africa, Seychelles, Tanzania, Kenya and Madagascar all make basic tourism data available. Somalia and Burundi have the least data available. Zimbabwe’s data is of questionable quality.
• In West Africa, The Gambia is the only destination with all basic tourism statistics available. Liberia and Mauritania have the least data available.
• In Central Africa, Angola has the most data available and Equatorial Guinea has the least. Details of data availability by country are shown in Table 13 of the Appendix.
The countries that have published 2008 tourist arrivals data include: Botswana (total arrivals only), The Gambia, Guinea-Bissau, Kenya, Lesotho, Rwanda, Seychelles, South Africa, Swaziland, Tanzania, and Zambia. Unfortunately, Kenya, Tanzania, and Swaziland have included same-day visitors in their tourist arrivals figures so these data are not comparable with previous years.
The biggest improvement in data collection has been seen in Rwanda. No basic tourism data at all is available for Republic of Congo, Equatorial Guinea, Liberia, or Somalia.
Data Quality
Data quality varies significantly between countries and between regions. Tourism statistics in Sub Saharan African countries are typically collected at one or more of the following locations:
• National borders: statistics collected at borders typically include data on nationality and purpose of visit. Statistics are least likely to be reliable as there is often no formal entry registration at all borders
• International airports: statistics at international airports are collected through embarkation cards that visitors need to fill out. These cards provide statistics on nationality, purpose and length of stay, repeat visitation, and type of accommodation used

Final Report, November 2009
80
• Hotels and other types of paid accommodation: statistics received through hotels usually provide data on nationality and length of stay
• Occasional exit surveys at airports and tourist sites: these surveys are typically used to collect tourist satisfaction and expenditure data. The reliability of visitor surveys is highly dependent on such variables as sample size, quality of the interviewer, quality of the survey, and location and timing of the survey. South Africa is one of the few countries that conduct frequent visitor exit surveys at its international airports
Arrival statistics are usually collected by departments of immigration, and/or the ministries of tourism. The national tourism office or the national statistics office most likely perform the analysis. Statistics on tourism expenditures and tourism’s impact on the economy are typically generated by the national banks and by the ministries of finance.
Typical data processing shortfalls include: haphazard collection of arrival cards and hotel data, poor coordination between offices involved in data processing, lack of capacity in the departments where statistics are processed, lack of understanding of the importance of timely and consistent data publication, and low level of political support for data publication.
Other problems arise when data collection systems are changed without explanation, resulting in a sudden increase or decrease in recorded numbers. Creative data processing such as including same-day arrivals with overnight arrivals to artificially boost arrivals numbers undermines progress made in many parts of the region to improve statistics and is a significant constraint to tourism analysis.
Database Design The main considerations for the design of this database75 were that it be easy to use and update, easy to understand, and appealing to look at. The database used for this project was designed in Filemaker Pro. Each country was allocated one “record” in the database and the information was divided into the following seven tabs:
• Highlights: includes key tourism information and tourism analysis, including a map showing the distribution of tourism attractions
• Overview: provides a list of key geographic, economic, social, and transport indicators. It also explains the availability of tourism data and has a location map and photo of a key attraction
• Economics: presents tourism economic data including tourist receipts, employment, and a description of the tourism investment climate and of the tourism workforce’s characteristics. It also shows a bar chart of tourist arrivals and source markets
• Demand: shows tables of key tourism demand data including arrivals, source markets, seasonality, purpose of visit, and length of stay
• Supply: presents information about tourism products and activities, the accommodation profile, and public and private sector tourism activity
• Competitiveness: compares a variety of cost indicators including flights costs, park entrance fees, and tourism competitiveness rankings. It also shows a line graph of tourist arrivals by month
• Analysis: presents a written analysis of tourism performance, potential, constraints to growth, and tourism strategy. It includes a list of references and key stakeholders with their websites
A glossary of terms and indicators is available as a separate pdf.
75 A database is a system for storing and organizing information

Final Report, November 2009
81
Database Use
The database has two main uses: reference and analysis.
The country profiles mode is mostly for reference. The database has 47 stand-alone country profiles which can be used as individual country briefs. The profiles can also be downloaded in groups of countries. The countries can be sorted in any number of ways, alphabetically, by region, by GDP, by those with a primary focus on, for example, business tourism, or any combination of these characteristics. Country profiles can be exported in whole or part as pdf documents and shared with users in electronic or hard copy.
The database can also be reviewed in “table layout.” Table layout is mostly used for analysis purposes. In this view, each country is listed in spreadsheet format and individual datasets can be selected for comparison. For example, population size or GDP can be placed alongside tourist receipts and then sorted by region or GDP. Database tables can be exported into Excel for further analysis.
In order for multiple users to be able to search, update, and organize data in the database, it can be hosted online using Filemaker Server, and shared within a network of computers that use Filemaker Pro. The database can also be shared online with users who do not have Filemaker Pro installed by using “instant web publishing.” In this way, the database is a dynamic reference and analysis system that can be customized to the needs of specific users.
Analysis
Filemaker Pro was the main tool used to analyze database results. Search words and countries were used to identify patterns in demand and supply. Tables were produced with the results and can be exported to Excel for further analysis by region. Ranking was the main comparative analysis tool used. Ranking is useful as it identifies the relationship between countries, showing how countries are performing compared to their neighbors.
For example, countries were ranked according to their tourist arrivals, receipts, growth rates, ease of doing business, and TTCI index. To construct the destination groupings, six indicator rankings were summed and ranked, providing a total rank. Where data was missing, the average ranking of existing data was used as a proxy.
Limitations of the Study The information included in the database and in this report, has, where possible, been cross-checked. However, measuring and analyzing tourism demand and supply is not an exact science, and desk-based research has its limitations.
For demand-side information, desk-based studies are limited by the quality of the information sources. Supply-side research such as the ranking of products, explanation of public and private sector activity, analysis of tourism constraints and potential are to a certain extent based on the judgement of the consultant. Assessment of these elements has been cross-checked where possible through in-depth interviews, but these reviews would benefit from further in-country diagnostic work that is not within the current scope of work.
Table 12. List of Interviewees
Name Position Company Location Date of Interview
AIRLINES Ms. Kirti Surendran Marketing and Sales North America Kenya Airways New York September 25th, via
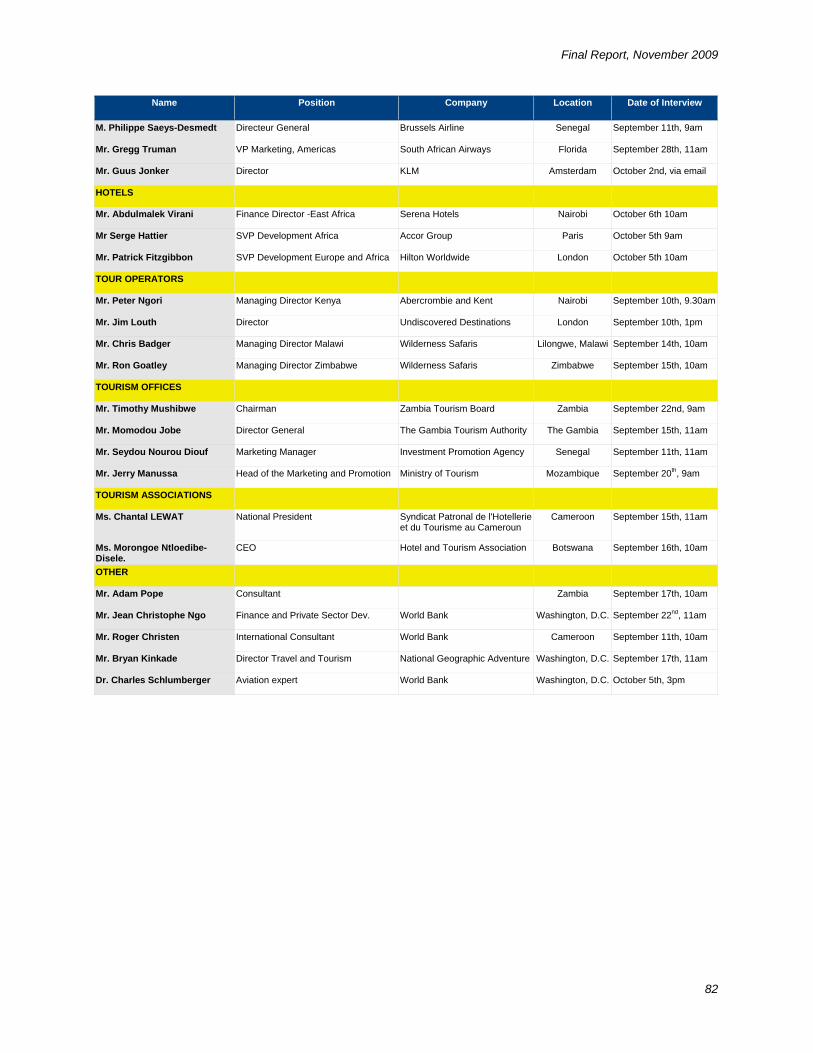
Final Report, November 2009
82
Name Position Company Location Date of Interview
M. Philippe Saeys-Desmedt Directeur General Brussels Airline Senegal September 11th, 9am
Mr. Gregg Truman VP Marketing, Americas South African Airways Florida September 28th, 11am
Mr. Guus Jonker Director KLM Amsterdam October 2nd, via email
HOTELS Mr. Abdulmalek Virani Finance Director -East Africa Serena Hotels Nairobi October 6th 10am
Mr Serge Hattier SVP Development Africa Accor Group Paris October 5th 9am
Mr. Patrick Fitzgibbon SVP Development Europe and Africa Hilton Worldwide London October 5th 10am
TOUR OPERATORS Mr. Peter Ngori Managing Director Kenya Abercrombie and Kent Nairobi September 10th, 9.30am
Mr. Jim Louth Director Undiscovered Destinations London September 10th, 1pm
Mr. Chris Badger Managing Director Malawi Wilderness Safaris Lilongwe, Malawi September 14th, 10am
Mr. Ron Goatley Managing Director Zimbabwe Wilderness Safaris Zimbabwe September 15th, 10am
TOURISM OFFICES Mr. Timothy Mushibwe Chairman Zambia Tourism Board Zambia September 22nd, 9am
Mr. Momodou Jobe Director General The Gambia Tourism Authority The Gambia September 15th, 11am
Mr. Seydou Nourou Diouf Marketing Manager Investment Promotion Agency Senegal September 11th, 11am
Mr. Jerry Manussa Head of the Marketing and Promotion Ministry of Tourism Mozambique September 20th, 9am
TOURISM ASSOCIATIONS Ms. Chantal LEWAT National President Syndicat Patronal de l'Hotellerie
et du Tourisme au Cameroun Cameroon September 15th, 11am
Ms. Morongoe Ntloedibe-Disele.
CEO Hotel and Tourism Association Botswana September 16th, 10am
OTHER Mr. Adam Pope Consultant Zambia September 17th, 10am
Mr. Jean Christophe Ngo Finance and Private Sector Dev. World Bank Washington, D.C. September 22nd, 11am
Mr. Roger Christen International Consultant World Bank Cameroon September 11th, 10am
Mr. Bryan Kinkade Director Travel and Tourism National Geographic Adventure Washington, D.C. September 17th, 11am
Dr. Charles Schlumberger Aviation expert World Bank Washington, D.C. October 5th, 3pm

Final Report, November 2009
83
Table 13. List of Data Availability by Country and Data Type (1=Present 0=Not Present)
Country Region
Arrivals [At least
2004-07 with regions]
Source Mkts [At least two years of data for long-
haul]
Season [At least one year of data]
Purpose [At least two
years of data]
Length of Stay [At least two years of
data]
Receipts [At least
2004-2007 receipts]
Employment [At least 2004-
2007 employment]
Count/7
Angola Central Af i
1 1 0 1 0 1 1 5
Central African R
Central Africa
0 1 0 1 1 1 1 5
Chad Central 1 1 0 0 1 1 1 5Congo, Dem. Central 1 1 0 1 0 1 1 5São Tomé & Central 0 1 0 1 0 1 1 4Cameroon Central 0 1 0 0 0 1 1 3Congo, Rep. Central 0 0 0 0 1 1 1 3Gabon Central 0 0 0 0 0 0 1 1Equatorial Guinea Central 0 0 0 0 0 0 0 0Sub total 3 6 0 4 3 7 8 49%Madagascar East Africa 1 1 1 1 1 1 1 7Seychelles East Africa 1 1 1 1 1 1 1 7Tanzania East Africa 1 1 1 1 1 1 1 7Kenya East Africa 1 1 1 1 1 1 1 7Comoros (incl. East Africa 1 1 0 1 1 1 1 6Eritrea East Africa 1 1 0 1 1 1 1 6Malawi East Africa 1 0 1 1 1 1 1 6Mauritius East Africa 1 1 1 1 0 1 1 6Sudan East Africa 1 0 1 1 1 1 1 6Zimbabwe East Africa 1 1 0 1 1 1 1 6Ethiopia East Africa 1 1 0 1 0 1 0 4Mozambique East Africa 1 1 0 1 1 1 0 5Uganda East Africa 1 1 0 1 0 1 1 5Zambia East Africa 1 1 0 1 0 1 1 5Rwanda East Africa 0 0 1 1 0 1 1 4Burundi East Africa 0 0 0 1 0 1 1 3Somalia East Africa 0 0 0 0 0 0 0 0Subtotal 14 12 8 16 10 16 14 75%Lesotho Southern 1 1 1 1 1 1 1 7South Africa Southern 1 1 1 1 1 1 1 7Swaziland Southern 1 1 1 1 1 1 1 7Namibia Southern 0 1 1 1 1 1 1 6Botswana Southern 0 0 1 1 1 1 1 5Subtotal 3 4 5 5 5 5 5 91%Gambia, The West Africa 1 1 1 1 1 1 1 7Burkina Faso West Africa 1 1 0 1 1 1 1 6Cape Verde West Africa 1 1 1 0 1 1 1 6Guinea West Africa 1 1 0 1 1 1 1 6Niger West Africa 1 1 0 1 1 1 1 6Benin West Africa 1 1 0 0 1 1 1 5Ghana West Africa 0 1 0 1 1 1 1 5Sierra Leone West Africa 1 0 0 1 1 1 1 5Togo West Africa 1 1 0 0 1 1 1 5Guinea-Bissau West Africa 1 1 1 1 0 0 0 4Mali West Africa 1 1 0 0 1 0 1 4Nigeria West Africa 0 1 0 1 0 1 1 4Senegal West Africa 0 1 1 0 1 0 1 4Côte D'Ivoire West Africa 0 0 0 0 0 1 1 2Liberia West Africa 0 0 0 0 0 0 0 0Mauritania West Africa 0 0 0 0 0 0 0 0Subtotal 10 12 4 8 11 11 13 62%TOTAL 30 34 17 33 29 39 40
Glossary
Accommodation: Statistics on changes in total number of hotel rooms, beds, and occupancy rates over time. Data sources include UNWTO, National Tourism Statistics, and Tourism Reports

Final Report, November 2009
84
Available Air Seat Km/wk: Number of seats on planes into the country per week from World Economic Forum (2009) Africa Competitiveness Report
Best Potential Products: Products considered by database author to have the best potential
Branded Hotels: Hotels that are part of a chain like Accord, Starwood, and Intercontinental
Businesses Concerned about Crime (in %): Percentage of businesses surveyed by World Bank that stated they were anxious about crime. World Bank, (2008) The Little Data Book on Africa, World Bank, Washington, D.C.
Business Competitiveness: Index developed by the World Economic Forum to measure national competitiveness on the basis of 12 different pillars including institutions, infrastructure, macroeconomic stability, health, and primary education. Here the index is expressed as a ranking of all the countries in the Sub-Saharan region for which data was available. Sourced from World Economic Forum (2009) The Africa Competitiveness Report
Business Environment and Infrastructure: Shows the strength of the business environment and infrastructure expressed as a ranking of all those countries in the Sub Saharan region for which TCCI data was available. Sourced from World Economic Forum (2009) The Travel and Tourism Competitiveness Report 2009
Coastline in (Km): Length of Coastline in Kilometers from World Bank Group (2009) Africa Development Indicators
Constraints: Author’s review of the obstacles currently inhibiting the country’s tourism potential
Current Key Tourism Product: Tourism product considered by database author to be most important to international markets
Destination Group: the 47 countries in SSA have been arranged into five “destination groups” according to the sum of their SSA rank for each of the previously explained six indicators: tourist receipts per arrival, WTTC forecasted growth rate 2009-2019, World Bank’s Ease of Doing Business Index, TTCI regulatory framework index, TTCI business and infrastructure index, and TTCI human and cultural resources index
Ease of Doing Business: Index created by the World Bank and the IFC to measure how easy it is to do business in a country based on the time required to start a business and other administrative processes. Sourced from World Bank and IFC (2009) Doing Business 2009
Economic Zone: African Economic Community Membership(s)
Export of Goods: Tourist expenditure expressed as a percentage of all good exported from the country
Export of Services:Tourist expenditure expressed as a percentage of all services exported from the country
Flight Cost and Frequency: Average high season and low season fare, flight connections, and flight frequency from five key international markets. The information is sourced from OAG Travel Solutions database
GDP Current Prices (US$ billion): Gross Domestic Product calculated in billions of US Dollars by the International Monetary Fund (2009) World Economic Outlook Database.
GDP Per Capita (US$): Gross Domestic Product calculated as average per person income in US dollars by the International Monetary Fund (2009) World Economic Outlook Database
GDP Annual Change (%): Annual % change in Gross Domestic Product calculated by the International Monetary Fund (2009) World Economic Outlook Database
Gender Gap Index: an index developed by the World Economic Forum to capture and express the magnitude and scope of the disparities between genders in different countries across the world. Sourced from World Economic Forum (2008) The Global Gender Gap Report, WEF, Geneva

Final Report, November 2009
85
Human Development Index, Rank/46: A combined measure of social and economic development which includes life expectancy, educational attainment, and income. Produced by UNDP Human Development Reports and ranked here out of 46 Sub Saharan countries (Zimbabwe not included)
Human, Natural, and Cultural Resources: Shows the strength of the business environment and infrastructure expressed as a ranking of all those countries in the Sub-Saharan region for which TCCI data was available. Sourced from World Economic Forum (2009) The Travel and Tourism Competitiveness Report 2009, WEF, Geneva.
International Hotel Brands: List of Internationally branded hotels, by brand, number of rooms, date established, and location. Sourced from hotel brand websites
Income Category: World Bank Classification for income levels
Key Challenges: Constraints facing tourism development in this country as identified by database author
Long-Haul Hub: City in key international source market where most flights leave from
Short-Haul Hub: City in key regional source markets where most flights leave from
No. of International Airports: Number of airports receiving international flights, CIA (2009) The World Factbook
No. of Domestic Airports: Number of airports receiving only domestic flights, CIA (2009) The World Factbook
No. of Ports and Terminals: Major ports and terminals on the basis of the amount of cargo tonnage shipped through the facilities on an annual basis. In some instances, the number of containers handled or ship visits were also considered. CIA (2009) The World Fact Book
Occupancy: Rooms (capacity) utilized on average per year expressed as a percentage of all rooms available
Overall Tourism Competitiveness: Index developed by the World Economic Forum to measure national competitiveness of tourism on the basis of three key pillars: regulatory framework, business environment, and human, natural, and cultural resources. Sourced from World Economic Forum (2009) The Travel and Tourism Competitiveness Report 2009, WEF, Geneva.
Parkland (in km2): Total area of parks and protected areas from World Bank Group (2009) Africa Development Indicators
Parkland as % of Surface Area: Calculated on the basis of surface area and total parkland. From World Bank Group (2009) Africa Development Indicators
Paved Runways: Percentage of airports that have paved runways, CIA (2009) The World Factbook
Percentage of Tourism Expenditure in GDP, Exports of Good and Services: Tourism expenditure calculated as a percentage of exported goods and services. Main source is UNWTO (2009) Compendium of World Tourism Statistics (2004-2007)
Performance: Author’s review of the successfulness of tourism in the country concerned. Mentions the key products and source markets, describes how arrivals and expenditure have changed over time, and makes observations concerning length of stay and purpose of visit
Potential: Author’s review of the country’s key selling points and their distribution across the country. Niche products and markets with possibilities for growth highlighted
Public and Private Sector Activity: Explanation of the names and roles of key public and private sector organizations involved in tourism in the country
Purpose of Visit: Main reason for the trip: holiday, business, visiting friends, or other

Final Report, November 2009
86
Quality of Roads: Information collected by the World Economic Forum to measure the infrastructure indicator of national competitiveness. The index is expressed as ranking of all those countries in the Sub Saharan region for which data on quality of roads was available. Sourced from World Economic Forum (2009) The Africa Competitiveness Report
Quality of Air Infrastructure: Information collected by the World Economic Forum to measure the infrastructure indicator of national competitiveness. The index is expressed as ranking of all those countries in the Sub-Saharan region for which data on quality of airports was available. Sourced from World Economic Forum (2009) The Africa Competitiveness Report
Rail (Km): Total length of railway system in kilometers. World Bank (2009) Africa Development Indicators
Roads (Km): Number of kilometers of road (paved and unpaved) in the country, World Bank (2009) Africa Development Indicators
Roads (% paved): Percentage of road kilometers that are paved. World Bank (2009) The Little Data Book on Africa
Region: SSA is subdivided into four subregions: Central Africa, East Africa, Southern Africa, and West Africa
Regulatory Framework for Tourism: Shows the strength of the regulatory framework expressed as a ranking of all those countries in the Sub-Saharan region for which TCCI data were available. Sourced from World Economic Forum (2009) The Travel and Tourism Competitiveness Report 2009. Sourced from World Economic Forum (2009) Tourism Competitiveness Indicator
Secondary School Enrollment (in %): Percentage of children starting secondary school from age group. World Bank, (2008) The Little Data Book on Africa
Stage of Tourism: Descriptor for the stage of development of the tourism industry in this country
Strategy: Overview of existing tourism plan, along with the date, goals, implementation process, funding, and future targets
Source Market: Country where visitors originate from
Sub Saharan Average: Average score across all those countries that have data on that particular indicator
Supply: Lists key products and facilities available to tourists. Includes: number of internationally branded hotels and rooms, local tour operators and travel agencies, number of tourism information centers, overseas marketing and promotion offices, world heritage sites, and protected areas and parks
Surface Area: Area of the country (in km2), from The World Bank (2009) Key Development Data and Statistics Database
Top Five Long Haul Markets: Top five countries from outside of Africa in terms of arrivals recorded at border crossings. Data sources include UNWTO, National Tourism Statistics, and Tourism Reports
Top Three Regional Markets: Top three countries from inside Africa in terms of arrivals recorded at border crossings. Data sources include UNWTO, National Tourism Statistics, and Tourism Reports
Top Tourism Products: A ranking of what the author considers the country’s top three tourism attractions for international markets
Tourist Arrivals: International tourist arrivals, recorded at border crossings, staying one night or more by region. Data sources include UNWTO, National Tourism Statistics, and Tourism Reports
Tourist Arrivals by Length of Stay: Average number of days spent in the country by tourists during their visit. Data sources include UNWTO, National Tourism Statistics, and Tourism Reports
Tourist Arrivals by Month: Total international arrivals per month over one or two years. Data sources include UNWTO, National Tourism Statistics, and Tourism Reports

Final Report, November 2009
87
Tourist Arrivals by Purpose of Visit (%): Share of international arrivals that are visiting for holiday, business, or visiting friends. Data sources include UNWTO, National Tourism Statistics, and Tourism Reports
Tourism Employment Direct and Indirect: This table shows the employment effect of tourism in the country. Direct employment is in tourism accommodation, tourism transport, tour operations, and food and beverage. Indirect employment includes jobs created in other sectors due to tourism, such as banking, entertainment, retail, agriculture, and fishing. Most information is from WTTC (2009) Country Reports
Tourist Receipts: Total spending by tourists on travel, accommodation, and other items in the destination
Tourism Investment and Linkages: This section reviews the business climate, main investor countries, and opportunities for backward linkages which tourism presents in the context of the country’s economy
Tourism Workforce: This section includes information related to tourism employment including population, education, unemployment, language, social issues of note, and tourism training schools
Various Tourism Cost Indicators: These cost indicators may be used to assess the comparative price differences between countries. Room tax is normally equivalent to VAT. Park entrance fees are calculated as the standard 2009 price of the most popular park in the country. EU and UN per diems are 2008 figures from their respective websites
Visa Requirements: Explains the visa requirements for international visitors to the country. Sourced from National Tourism Board websites and Lonely Planet Africa Guidebook
World Heritage Sites: Names of the sites classified by UNESCO as being World Heritage. Sourced from whc.unesco.org/
Country Profiles
There are 47 seven-page country profiles included in the SSA Tourism Database. To provide a glimpse of the database result, the last page of each profile, the analysis page, follows. The analysis page includes a review of the country’s tourism performance, potential, constraints, strategies, key stakeholders, and references. The references are not all visible on the attached copies as a scroll bar has been used. The SSA Tourism Database is dynamic and updated on an ongoing basis. Readers are encouraged to review the full SSA Tourism database and submit comments and recommendations for improvement.