african american males in the criminal justice system american... · 2013-12-20 · african...
TRANSCRIPT
African American Males in the Criminal Justice System
Purpose and Background
The purpose of this report is to examine the experience of African American males in the criminal justice system. The focus is on males, 18 to 30 years old who are arrested, convicted, and sentenced in Hennepin County District Court. Data on arrests are from the Minneapolis Police Department and the Bureau of Criminal Apprehension (BCA). Data on jail bookings were obtained from the Hennepin County Sheriff. Data on court dispositions and sentences were provided by Hennepin County District Court. The information contained in this report reflects some of the data being compiled as part of a larger effort to examine the nature, extent, and causes of racial disparities throughout Minnesota’s criminal justice system. Compared to other states, Minnesota has the greatest black-to-white disparity in imprisonment rates. In 1997, the most recent year for which state-by-state data are available, the ratio of African Americans to whites in state prison was 25.09 to 1. This is the highest ratio of all states. In 2000, 37.2% of the state’s prisoners were African American. By comparison only 3.5% of the population of Minnesota was African American. The disparities are not limited to the “back end” of the criminal justice system. For violent offenses, the arrest rate of African Americans in 1999 was 1,621 per 100,000. The comparable arrest rate for whites was 76 per 100,000 resulting in African Americans being 21 times more likely to be arrested for violent crimes than whites. In Hennepin County in 1999, African Americans represented over half (51.5%) of the arrests for violent crimes1 and whites represented 29.5% of violent crime arrests. Of all counties in Minnesota only Ramsey County was higher in the percentage of African Americans arrested for violent crimes (52.9%). African Americans accounted for a smaller percentage of arrests for property crimes (33.3%) than whites (40%). The percentage of African Americans arrested for violations of narcotic drug laws was twice as high as the percentage of whites arrested, 58.7% compared to 30%.
1 Violent crimes include murder, rape, robbery and aggravated assault.
1
Data
The Council on Crime and Justice analyzed data on traffic stops collected by the Minneapolis Police Department during a six-month period from May to October 2000. The driver’s race/ethnicity was identified, however data on the driver’s gender and age were not collected. Findings from the report issued to the Minneapolis Police Department in April 2001 are included in the data presented here. Data on adult arrests from the Minneapolis Police Department were analyzed separately from data for Hennepin County as a whole. Data on arrests from the Minneapolis Police Department were also combined with arrest data for the other Hennepin County law enforcement agencies obtained from the BCA. Arrests are reported using the FBI Uniform Crime Reporting Program (UCR) categories: Homicide, rape, robbery and aggravated assault, burglary, larceny-theft, motor vehicle theft, arson (Part I crimes). Also included are other assaults, forgery, fraud, embezzlement, stolen property, vandalism, weapons, prostitution, sex offenses, narcotic drug laws, gambling, offenses against family and children, driving under the influence, liquor laws, disorderly conduct, vagrancy, and all other offenses excluding traffic (Part II crimes). Data from the Hennepin County Adult Detention Center on all 18 – 30 year old males booked and released between January 1, 2000 and January 14, 2001 were obtained and analyzed by the Office of Planning and Development. Data on factors that contribute to the length of stay (prior criminal record, current number of charges, ability to pay bail, and length of residence in Minnesota, among others) are not included in the analysis. Data on court dispositions and sentences include all charges disposed in 1998 in the Fourth Judicial District criminal court (Hennepin County). Sentences for cases involving multiple criminal charges reflect the most punitive sentence. To allow for a comparison to arrests, dispositions and sentences are categorized according to the UCR crime types listed above. Data on defendants’ criminal histories, a factor used in determining sentence length, are not included in the data presented.
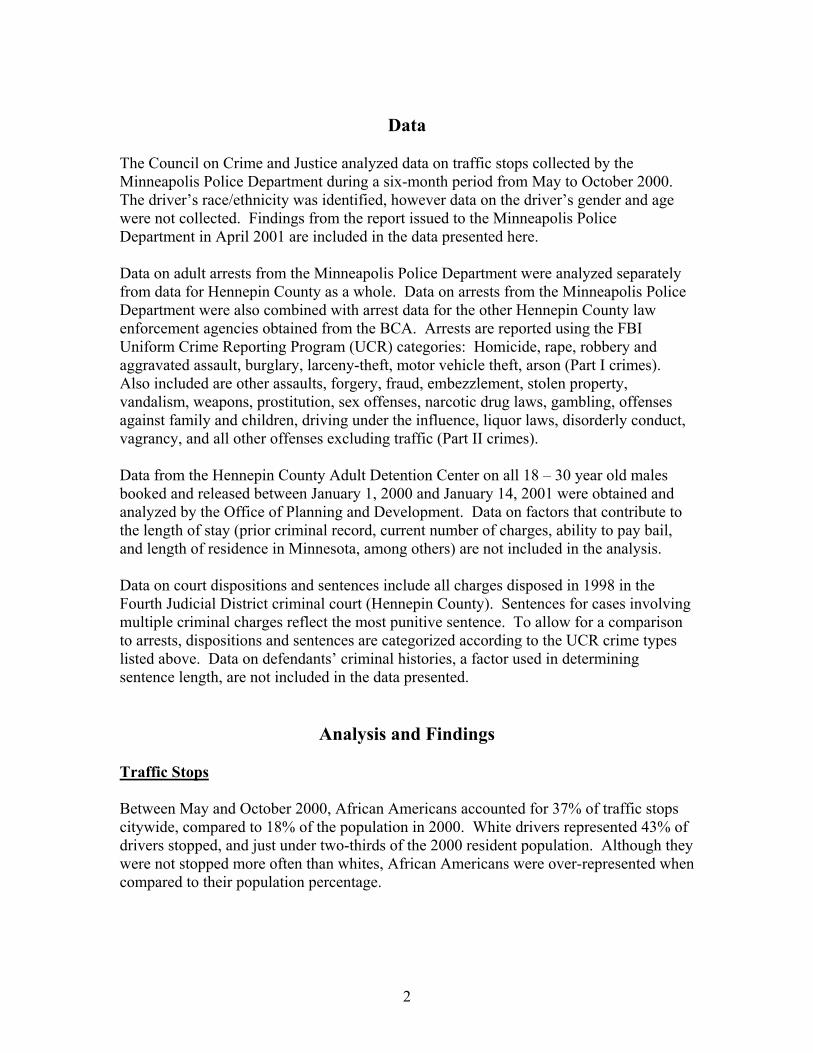
Analysis and Findings Traffic Stops Between May and October 2000, African Americans accounted for 37% of traffic stops citywide, compared to 18% of the population in 2000. White drivers represented 43% of drivers stopped, and just under two-thirds of the 2000 resident population. Although they were not stopped more often than whites, African Americans were over-represented when compared to their population percentage.
2
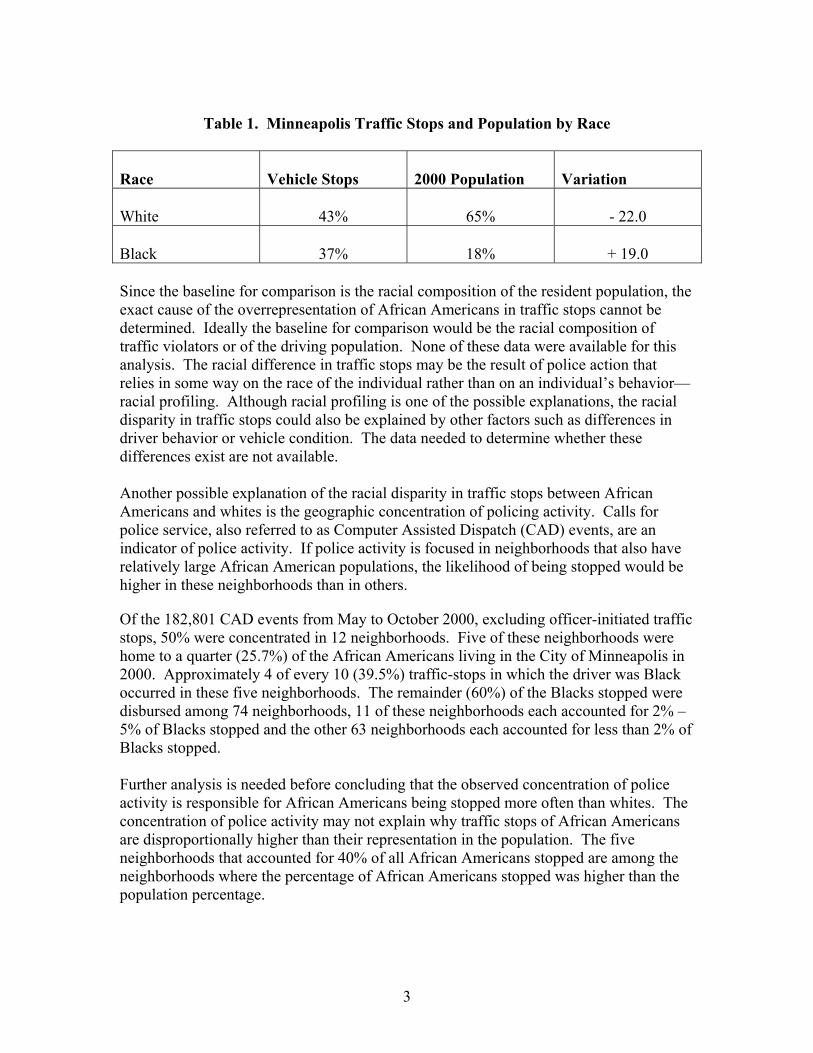
Table 1. Minneapolis Traffic Stops and Population by Race
Race
Vehicle Stops
2000 Population
Variation
White
43%
65%
- 22.0
Black
37%
18%
+ 19.0
Since the baseline for comparison is the racial composition of the resident population, the exact cause of the overrepresentation of African Americans in traffic stops cannot be determined. Ideally the baseline for comparison would be the racial composition of traffic violators or of the driving population. None of these data were available for this analysis. The racial difference in traffic stops may be the result of police action that relies in some way on the race of the individual rather than on an individual’s behavior—racial profiling. Although racial profiling is one of the possible explanations, the racial disparity in traffic stops could also be explained by other factors such as differences in driver behavior or vehicle condition. The data needed to determine whether these differences exist are not available. Another possible explanation of the racial disparity in traffic stops between African Americans and whites is the geographic concentration of policing activity. Calls for police service, also referred to as Computer Assisted Dispatch (CAD) events, are an indicator of police activity. If police activity is focused in neighborhoods that also have relatively large African American populations, the likelihood of being stopped would be higher in these neighborhoods than in others.
Of the 182,801 CAD events from May to October 2000, excluding officer-initiated traffic stops, 50% were concentrated in 12 neighborhoods. Five of these neighborhoods were home to a quarter (25.7%) of the African Americans living in the City of Minneapolis in 2000. Approximately 4 of every 10 (39.5%) traffic-stops in which the driver was Black occurred in these five neighborhoods. The remainder (60%) of the Blacks stopped were disbursed among 74 neighborhoods, 11 of these neighborhoods each accounted for 2% – 5% of Blacks stopped and the other 63 neighborhoods each accounted for less than 2% of Blacks stopped. Further analysis is needed before concluding that the observed concentration of police activity is responsible for African Americans being stopped more often than whites. The concentration of police activity may not explain why traffic stops of African Americans are disproportionally higher than their representation in the population. The five neighborhoods that accounted for 40% of all African Americans stopped are among the neighborhoods where the percentage of African Americans stopped was higher than the population percentage.
3
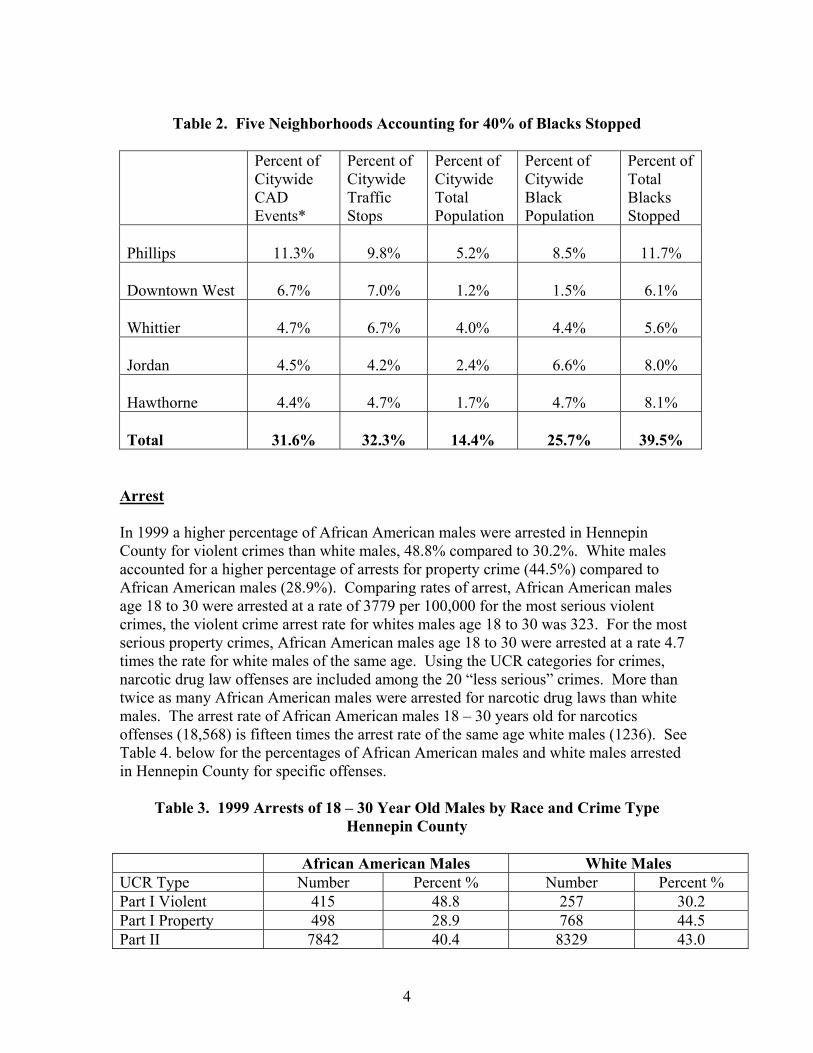
Table 2. Five Neighborhoods Accounting for 40% of Blacks Stopped
Percent of
Citywide CAD Events*
Percent of Citywide Traffic Stops
Percent of Citywide Total Population
Percent of Citywide Black Population
Percent of Total Blacks Stopped
Phillips
11.3%
9.8%
5.2%
8.5%
11.7%
Downtown West
6.7%
7.0%
1.2%
1.5%
6.1%
Whittier
4.7%
6.7%
4.0%
4.4%
5.6%
Jordan
4.5%
4.2%
2.4%
6.6%
8.0%
Hawthorne
4.4%
4.7%
1.7%
4.7%
8.1%
Total
31.6%
32.3%
14.4%
25.7%
39.5%
Arrest In 1999 a higher percentage of African American males were arrested in Hennepin County for violent crimes than white males, 48.8% compared to 30.2%. White males accounted for a higher percentage of arrests for property crime (44.5%) compared to African American males (28.9%). Comparing rates of arrest, African American males age 18 to 30 were arrested at a rate of 3779 per 100,000 for the most serious violent crimes, the violent crime arrest rate for whites males age 18 to 30 was 323. For the most serious property crimes, African American males age 18 to 30 were arrested at a rate 4.7 times the rate for white males of the same age. Using the UCR categories for crimes, narcotic drug law offenses are included among the 20 “less serious” crimes. More than twice as many African American males were arrested for narcotic drug laws than white males. The arrest rate of African American males 18 – 30 years old for narcotics offenses (18,568) is fifteen times the arrest rate of the same age white males (1236). See Table 4. below for the percentages of African American males and white males arrested in Hennepin County for specific offenses.
Table 3. 1999 Arrests of 18 – 30 Year Old Males by Race and Crime Type Hennepin County
African American Males White Males UCR Type Number Percent % Number Percent % Part I Violent 415 48.8 257 30.2 Part I Property 498 28.9 768 44.5 Part II 7842 40.4 8329 43.0
4
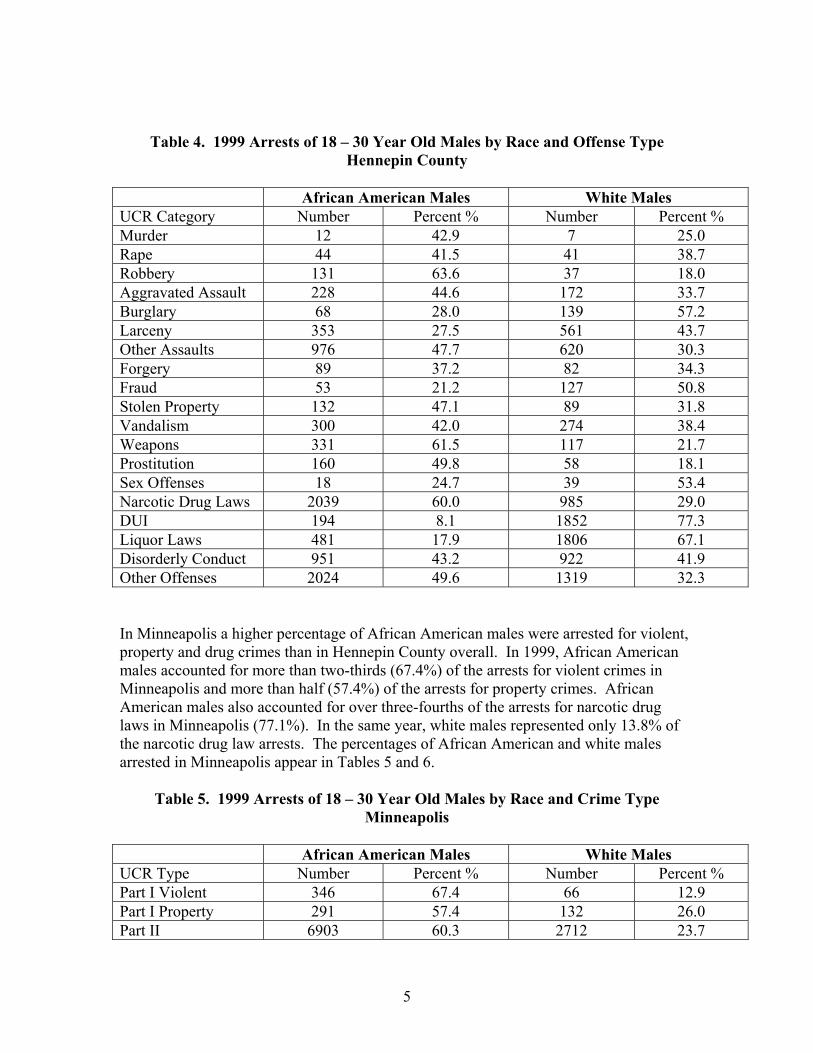
Table 4. 1999 Arrests of 18 – 30 Year Old Males by Race and Offense Type Hennepin County
African American Males White Males UCR Category Number Percent % Number Percent % Murder 12 42.9 7 25.0 Rape 44 41.5 41 38.7 Robbery 131 63.6 37 18.0 Aggravated Assault 228 44.6 172 33.7 Burglary 68 28.0 139 57.2 Larceny 353 27.5 561 43.7 Other Assaults 976 47.7 620 30.3 Forgery 89 37.2 82 34.3 Fraud 53 21.2 127 50.8 Stolen Property 132 47.1 89 31.8 Vandalism 300 42.0 274 38.4 Weapons 331 61.5 117 21.7 Prostitution 160 49.8 58 18.1 Sex Offenses 18 24.7 39 53.4 Narcotic Drug Laws 2039 60.0 985 29.0 DUI 194 8.1 1852 77.3 Liquor Laws 481 17.9 1806 67.1 Disorderly Conduct 951 43.2 922 41.9 Other Offenses 2024 49.6 1319 32.3 In Minneapolis a higher percentage of African American males were arrested for violent, property and drug crimes than in Hennepin County overall. In 1999, African American males accounted for more than two-thirds (67.4%) of the arrests for violent crimes in Minneapolis and more than half (57.4%) of the arrests for property crimes. African American males also accounted for over three-fourths of the arrests for narcotic drug laws in Minneapolis (77.1%). In the same year, white males represented only 13.8% of the narcotic drug law arrests. The percentages of African American and white males arrested in Minneapolis appear in Tables 5 and 6.
Table 5. 1999 Arrests of 18 – 30 Year Old Males by Race and Crime Type Minneapolis
African American Males White Males UCR Type Number Percent % Number Percent % Part I Violent 346 67.4 66 12.9 Part I Property 291 57.4 132 26.0 Part II 6903 60.3 2712 23.7
5
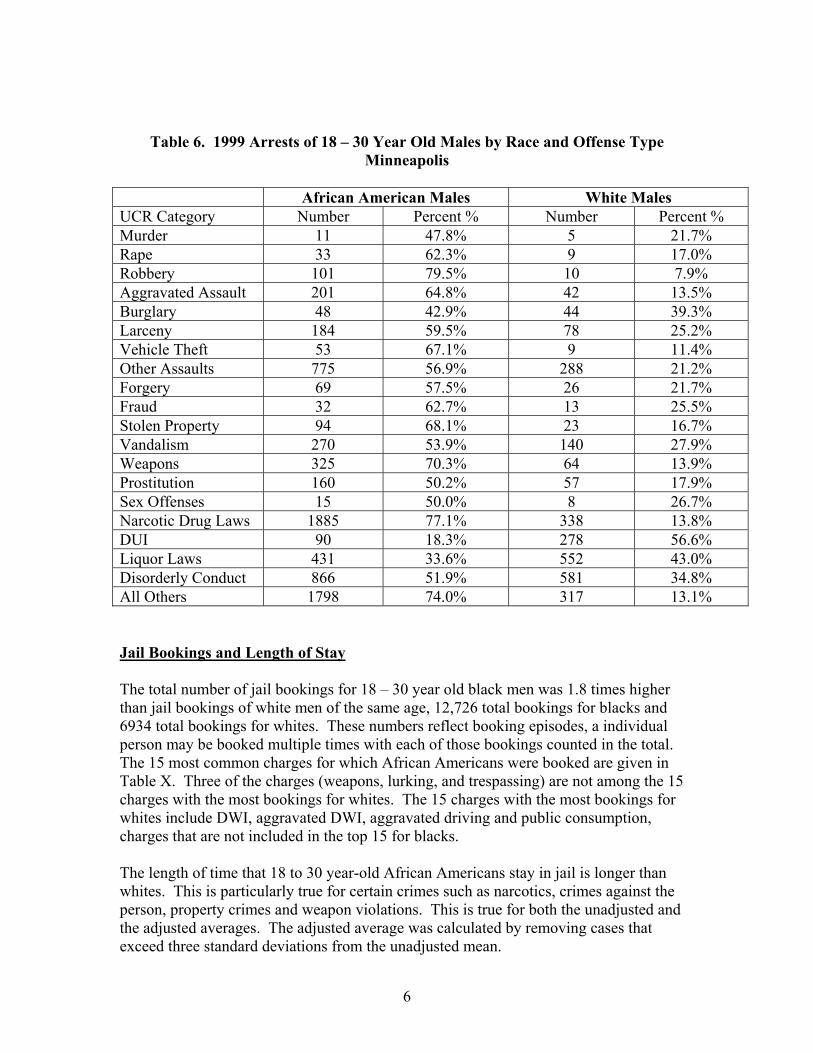
Table 6. 1999 Arrests of 18 – 30 Year Old Males by Race and Offense Type Minneapolis
African American Males White Males UCR Category Number Percent % Number Percent % Murder 11 47.8% 5 21.7% Rape 33 62.3% 9 17.0% Robbery 101 79.5% 10 7.9% Aggravated Assault 201 64.8% 42 13.5% Burglary 48 42.9% 44 39.3% Larceny 184 59.5% 78 25.2% Vehicle Theft 53 67.1% 9 11.4% Other Assaults 775 56.9% 288 21.2% Forgery 69 57.5% 26 21.7% Fraud 32 62.7% 13 25.5% Stolen Property 94 68.1% 23 16.7% Vandalism 270 53.9% 140 27.9% Weapons 325 70.3% 64 13.9% Prostitution 160 50.2% 57 17.9% Sex Offenses 15 50.0% 8 26.7% Narcotic Drug Laws 1885 77.1% 338 13.8% DUI 90 18.3% 278 56.6% Liquor Laws 431 33.6% 552 43.0% Disorderly Conduct 866 51.9% 581 34.8% All Others 1798 74.0% 317 13.1%
Jail Bookings and Length of Stay The total number of jail bookings for 18 – 30 year old black men was 1.8 times higher than jail bookings of white men of the same age, 12,726 total bookings for blacks and 6934 total bookings for whites. These numbers reflect booking episodes, a individual person may be booked multiple times with each of those bookings counted in the total. The 15 most common charges for which African Americans were booked are given in Table X. Three of the charges (weapons, lurking, and trespassing) are not among the 15 charges with the most bookings for whites. The 15 charges with the most bookings for whites include DWI, aggravated DWI, aggravated driving and public consumption, charges that are not included in the top 15 for blacks. The length of time that 18 to 30 year-old African Americans stay in jail is longer than whites. This is particularly true for certain crimes such as narcotics, crimes against the person, property crimes and weapon violations. This is true for both the unadjusted and the adjusted averages. The adjusted average was calculated by removing cases that exceed three standard deviations from the unadjusted mean.
6

Table 7. 2000 Main Booking Charge and Unadjusted Average Length of Jail Stay
AVERAGE LENTH OF STAY IN HOURSMain Booking Charge
Number Avg. LOS Number Avg. LOSALL CRIMES* 12,726 96.86 6,934 67.22NARCOTICS (FELONY)* 2,164 108.02 519 69.09DAS/DAR/DAC (TRAFFIC) 1,207 13.33 412 14.24DOMESTIC VIOLENCE (MISDEMEANOR) 821 80.46 430 60.04CRIME/PERSON (FELONY)* 807 358.67 391 251.93NO VALID DL (TRAFFIC)* 663 14.65 178 9.76CRIME/PROPERTY (FELONY)* 440 224.25 388 127.05DISORDERLY CONDUCT (MISDEMEANOR)* 425 27.30 321 15.21HOLD FOR OTHER MISDEMEANOR 408 18.33 542 18.08UUOMV/AUTO THEFT (FELONY)* 365 105.99 89 150.66OTHER TRAFFIC* 361 21.12 180 17.46LURKING (MISDEMEANOR) 283 22.11 54 15.26WEAPONS (FELONY)* 270 307.92 58 186.35TRESPASSING (MISDEMEANOR) 248 31.88 57 28.81INSURANCE (TRAFFIC) 231 11.56 167 11.86THEFT (MISDEMEANOR) 228 33.50 100 20.36
Black (non-Hispanic) White (non-Hispanic)
*indicates statistically significant differences between means Table 8. 2000 Main Book Charge and Adjusted Length of Stay
Main Booking ChargeNumber Avg. LOS Number Avg. LOS
ALL CRIMES* 12,507 59.2104 6,837 41.6112NARCOTICS (FELONY)* 2,132 83.52 507 54.4704DAS/DAR/DAC (TRAFFIC) 1,193 10.8216 406 12.1872DOMESTIC VIOLENCE (MISDEMEANOR)* 808 59.0688 424 40.9224CRIME/PERSON (FELONY)* 787 271.488 379 154.3968NO VALID DL (TRAFFIC)* 655 11.268 173 7.6416CRIME/PROPERTY (FELONY)* 424 139.4208 379 90.636DISORDERLY CONDUCT (MISDEMEANOR)* 421 18.7392 315 10.416HOLD FOR OTHER MISDEMEANOR 402 16.9872 535 16.0152UUOMV/AUTO THEFT (FELONY)* 354 73.1616 86 106.2912OTHER TRAFFIC 351 17.58 175 15.3648LURKING (MISDEMEANOR) 278 16.932 52 12.3264WEAPONS (FELONY)* 259 203.7576 57 113.2464TRESPASSING (MISDEMEANOR) 241 22.8792 56 16.5528INSURANCE (TRAFFIC) 225 8.7504 164 10.0056THEFT (MISDEMEANOR)* 227 23.6784 98 18.0312
Black (non-Hispanic) White (non-Hispanic)
*indicates statistically significant differences between means
7
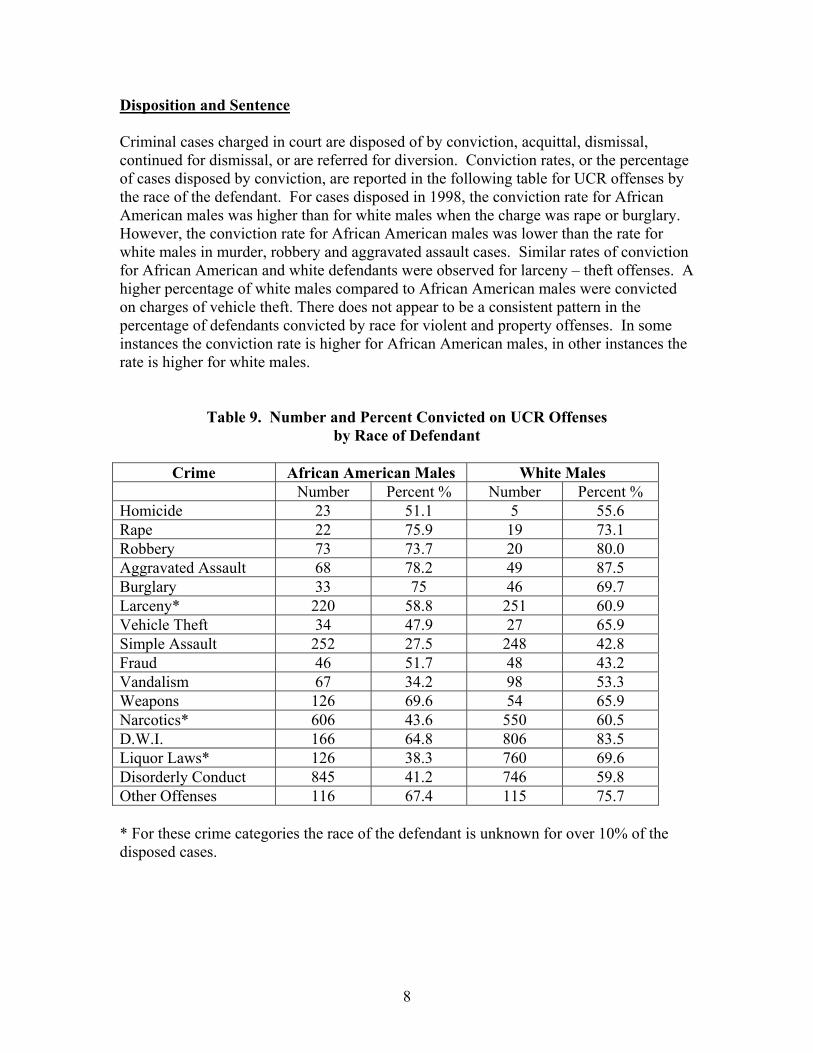
Disposition and Sentence Criminal cases charged in court are disposed of by conviction, acquittal, dismissal, continued for dismissal, or are referred for diversion. Conviction rates, or the percentage of cases disposed by conviction, are reported in the following table for UCR offenses by the race of the defendant. For cases disposed in 1998, the conviction rate for African American males was higher than for white males when the charge was rape or burglary. However, the conviction rate for African American males was lower than the rate for white males in murder, robbery and aggravated assault cases. Similar rates of conviction for African American and white defendants were observed for larceny – theft offenses. A higher percentage of white males compared to African American males were convicted on charges of vehicle theft. There does not appear to be a consistent pattern in the percentage of defendants convicted by race for violent and property offenses. In some instances the conviction rate is higher for African American males, in other instances the rate is higher for white males.
Table 9. Number and Percent Convicted on UCR Offenses by Race of Defendant
Crime African American Males White Males
Number Percent % Number Percent % Homicide 23 51.1 5 55.6 Rape 22 75.9 19 73.1 Robbery 73 73.7 20 80.0 Aggravated Assault 68 78.2 49 87.5 Burglary 33 75 46 69.7 Larceny* 220 58.8 251 60.9 Vehicle Theft 34 47.9 27 65.9 Simple Assault 252 27.5 248 42.8 Fraud 46 51.7 48 43.2 Vandalism 67 34.2 98 53.3 Weapons 126 69.6 54 65.9 Narcotics* 606 43.6 550 60.5 D.W.I. 166 64.8 806 83.5 Liquor Laws* 126 38.3 760 69.6 Disorderly Conduct 845 41.2 746 59.8 Other Offenses 116 67.4 115 75.7 * For these crime categories the race of the defendant is unknown for over 10% of the disposed cases.
8
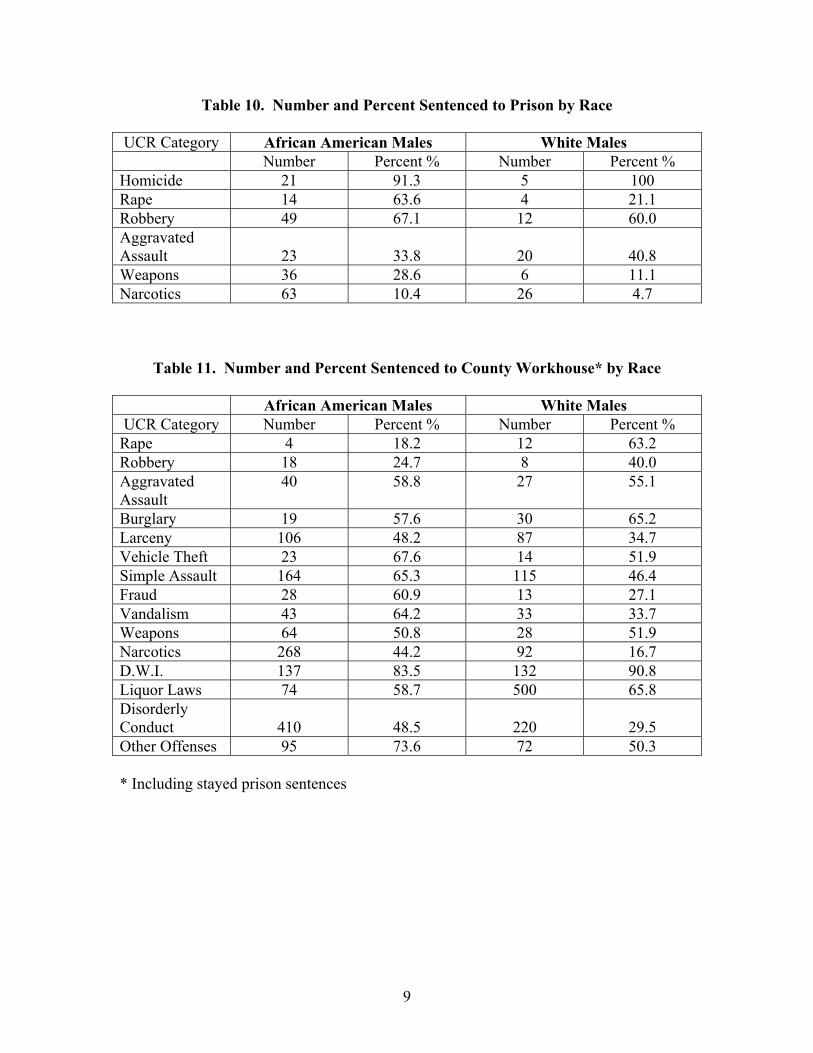
Table 10. Number and Percent Sentenced to Prison by Race UCR Category African American Males White Males
Number Percent % Number Percent % Homicide 21 91.3 5 100 Rape 14 63.6 4 21.1 Robbery 49 67.1 12 60.0 Aggravated Assault
23
33.8
20
40.8
Weapons 36 28.6 6 11.1 Narcotics 63 10.4 26 4.7
Table 11. Number and Percent Sentenced to County Workhouse* by Race African American Males White Males UCR Category Number Percent % Number Percent % Rape 4 18.2 12 63.2 Robbery 18 24.7 8 40.0 Aggravated Assault
40 58.8 27 55.1
Burglary 19 57.6 30 65.2 Larceny 106 48.2 87 34.7 Vehicle Theft 23 67.6 14 51.9 Simple Assault 164 65.3 115 46.4 Fraud 28 60.9 13 27.1 Vandalism 43 64.2 33 33.7 Weapons 64 50.8 28 51.9 Narcotics 268 44.2 92 16.7 D.W.I. 137 83.5 132 90.8 Liquor Laws 74 58.7 500 65.8 Disorderly Conduct
410
48.5
220
29.5
Other Offenses 95 73.6 72 50.3 * Including stayed prison sentences
9
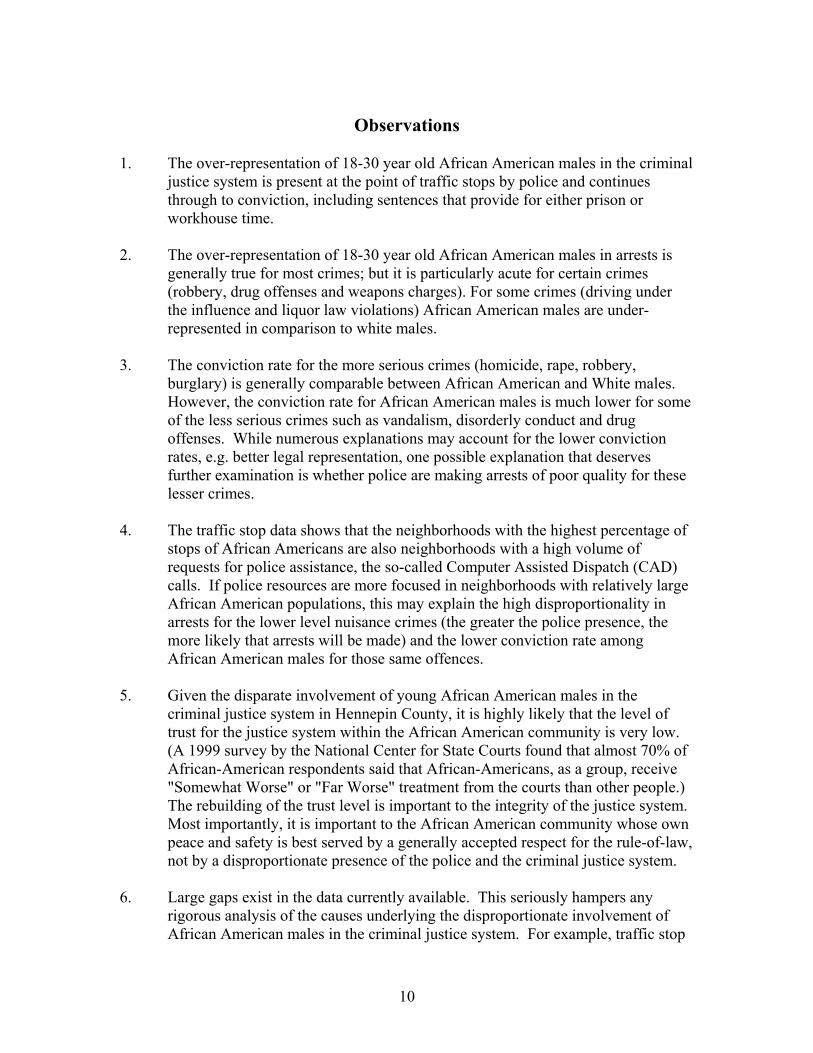
Observations
1. The over-representation of 18-30 year old African American males in the criminal
justice system is present at the point of traffic stops by police and continues through to conviction, including sentences that provide for either prison or workhouse time.
2. The over-representation of 18-30 year old African American males in arrests is
generally true for most crimes; but it is particularly acute for certain crimes (robbery, drug offenses and weapons charges). For some crimes (driving under the influence and liquor law violations) African American males are under-represented in comparison to white males.
3. The conviction rate for the more serious crimes (homicide, rape, robbery,
burglary) is generally comparable between African American and White males. However, the conviction rate for African American males is much lower for some of the less serious crimes such as vandalism, disorderly conduct and drug offenses. While numerous explanations may account for the lower conviction rates, e.g. better legal representation, one possible explanation that deserves further examination is whether police are making arrests of poor quality for these lesser crimes.
4. The traffic stop data shows that the neighborhoods with the highest percentage of
stops of African Americans are also neighborhoods with a high volume of requests for police assistance, the so-called Computer Assisted Dispatch (CAD) calls. If police resources are more focused in neighborhoods with relatively large African American populations, this may explain the high disproportionality in arrests for the lower level nuisance crimes (the greater the police presence, the more likely that arrests will be made) and the lower conviction rate among African American males for those same offences.
5. Given the disparate involvement of young African American males in the
criminal justice system in Hennepin County, it is highly likely that the level of trust for the justice system within the African American community is very low. (A 1999 survey by the National Center for State Courts found that almost 70% of African-American respondents said that African-Americans, as a group, receive "Somewhat Worse" or "Far Worse" treatment from the courts than other people.) The rebuilding of the trust level is important to the integrity of the justice system. Most importantly, it is important to the African American community whose own peace and safety is best served by a generally accepted respect for the rule-of-law, not by a disproportionate presence of the police and the criminal justice system.
6. Large gaps exist in the data currently available. This seriously hampers any
rigorous analysis of the causes underlying the disproportionate involvement of African American males in the criminal justice system. For example, traffic stop
10
data is now limited in Hennepin County to the data collected by the Minneapolis Police Department. The data currently available from the Minneapolis Department is incomplete in that it does not include the reason for the stop (this data is now being collected). Further there are no data by race that would allow a systematic examination of police arrests brought to the prosecutor’s office for review, nor for those cases brought forward, what cases are declined, changed or diverted.
Recommendations
1. Hennepin County, through its criminal justice entities, should explore the feasibility of a pilot project that would make additional options available to low-risk arrestees for release from detention prior to their first court appearance. These options should utilize community resources to provide safe housing, counseling services, and referrals to community programs. The options would build defendants’ self-improvement skills and increase the likelihood that they will appear in court.
2. Efforts to recruit and retain personnel with culturally diverse backgrounds in the
criminal justice system should be increased in order to better reflect the diversity of the clients. Cultural diversity training of criminal justice personnel should be increased to enhance their ability to work more effectively with clients from culturally diverse backgrounds.
3. Existing gaps in available data should be filled. All police departments in
Hennepin County should minimally collect the following data:
• location of the stop; • date and time of the stop; • age, race/ethnicity, and gender of the driver; • reason for the stop; • disposition of the stop (arrest, citation, warning, or no action); • whether a search was conducted of the driver, passengers or vehicle; • the authority for the search, if conducted • the result of the search—whether any contraband was discovered or seized
and the nature of the contraband. Additionally, county and city prosecutors’ offices should record the race of defendants in all cases reviewed and the decision to decline, charge, divert, etc.
4. A rigorous analysis of the causes underlying the disproportionate involvement of
18 to 30 year old African American males in the criminal justice system should be undertaken. To the extent that such an analysis is possible as part of the research being conducted by the Council on Crime and Justice, the Council’s efforts
11
12
should be given the full support and cooperation of all stakeholders in the justice system in Hennepin County.
I:\RDI Activity and Outcomes\Appendix 10\African American Males in the Criminal Justice System.doc1