african barrick gold - acacia mining/media/files/a/acacia/presentations/2014/... · african barrick...
TRANSCRIPT

African Barrick Gold Buzwagi - Site Presentation March 2014

Contents
1. Introduction 1
2. Life of Mine 7
3. Processing Operations 17
4. Cost Improvements 20
5. Summary 27
1

Biography
2
Philbert Rweyemamu was appointed Buzwagi General Manager in October 2014 having been General Manager of Tulawaka since September 2012. Prior to this Philbert has worked in a variety of roles within ABG including Mining Manager at North Mara and as Government Relations Manager. Philbert is one of the most experienced Tanzanian mining executives, has more than 30 years professional mining experience and has previously worked for DeBeers, Shanta Mining and Namaqualand Mines. Philbert holds a Masters of Science degree in Mining Engineering, Geomechanics, from the University of Exeter, Camborne School of Mines in England. He also holds a Bachelor of Engineering in Mining Engineering from Camborne School of Mines and a Mining Technology Diploma from Hailey School of Mines, Ontario in Canada.

Location
3
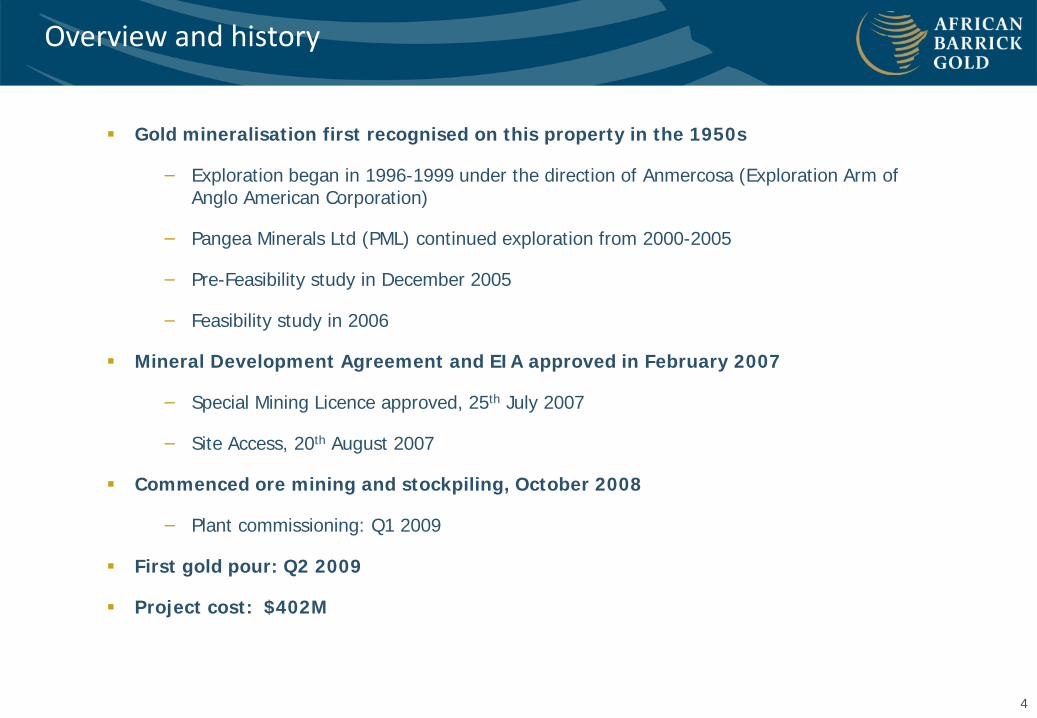
Overview and history
Gold mineralisation first recognised on this property in the 1950s
− Exploration began in 1996-1999 under the direction of Anmercosa (Exploration Arm of Anglo American Corporation)
− Pangea Minerals Ltd (PML) continued exploration from 2000-2005
− Pre-Feasibility study in December 2005
− Feasibility study in 2006
Mineral Development Agreement and EIA approved in February 2007
− Special Mining Licence approved, 25th July 2007
− Site Access, 20th August 2007
Commenced ore mining and stockpiling, October 2008
− Plant commissioning: Q1 2009
First gold pour: Q2 2009
Project cost: $402M
4

Safety and environment
Impressive safety performance in 2013 with TRIFR 0.27 and one LTI
Obtained first stage of ICMI Certification in 2014
Designed as a zero discharge mine
Low rainfall environment (c. 900mm per annum)
Constructed 73 hectare rain water catchment area to minimise environmental impact
5
8.59
3.79
1.46
0.57 0.27 0
2
4
6
8
10
2009 2010 2011 2012 2013
TRIFR
TRIFR
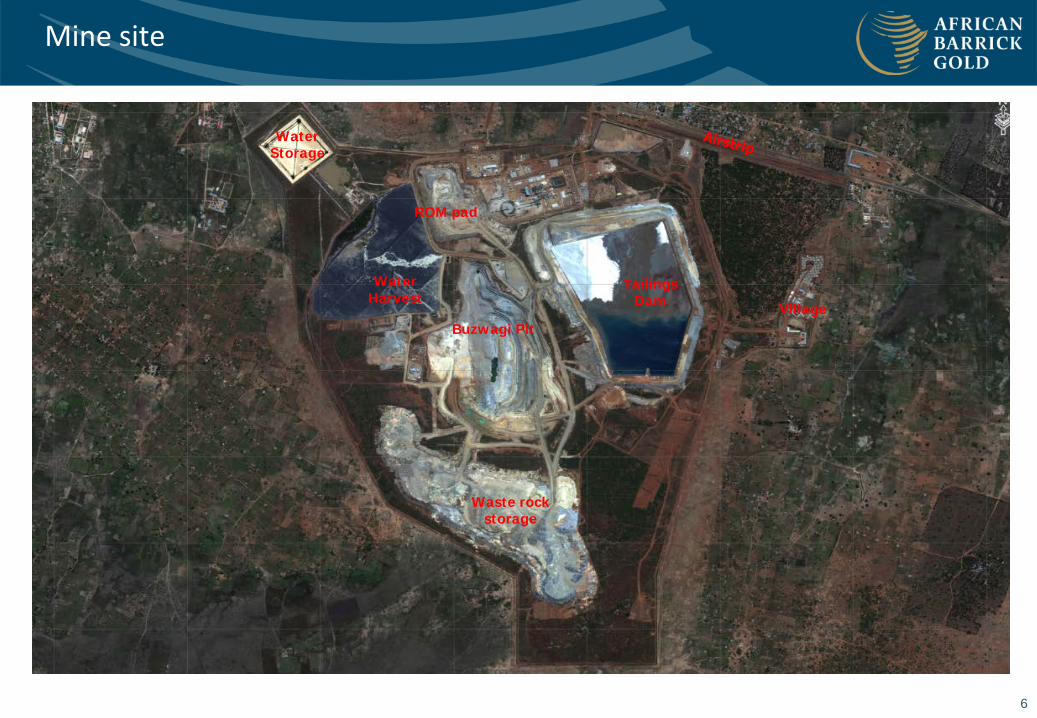
Mine site
Buzwagi Pit
Waste rock storage
Tailings Dam
Water Harvest
Water Storage
ROM pad
Village
6

1. Mine Operations Overview 1
2. Life of Mine 7
3. Processing Operations 17
4. Cost Improvements 20
5. Summary 27
7
Contents

Life of Mine: options review
In June 2013 work began to assess mine planning options to reverse Buzwagi's negative cashflow:
Survival mode in the short to medium term, generate maximum possible free cashflow in the next 5 years
Possibility of future re-capitalisation to continue the mine to its designed end life
Such re-capitalisation will be dependant on prevailing future gold price and the extent of funds required for ramping up back to full production
Key strategies adopted in June 2013 were:
Minimising capital expenditure, including capitalised waste stripping
Deferring any rebuild or major component replacements not required for meeting the 5-year objective
Maximising the mill feed grade
Major labour and associated cost reduction across the board
Minimising the hauling distances
8

Life Of Mine
9

Life of Mine: 2012 vs 2013 year end ore reserves
Tonnes (000's)
Grade Au (g/t)
Ounce (000's)
Tonnes (000's)
Grade Au (g/t)
Ounce (000's)
Tonnes (000's)
Grade Au (g/t)
Ounce (000's)
Proven and Probable 24,105 1.445 1,120 63,333 1.325 2,697 -39,228 1.251 -1,577
Mineral Resource 49,109 1.291 2,038 14,875 1.019 487 34,234 1.409 1,551
2013 YE 2012 YE Variance
2,697
1,120
100 -
754
- 330
106
1,033
-
708
-
38 -
- -
-
500
1,000
1,500
2,000
2,500
3,000
3,500
End 2012 Depletion - H1 Mining Cost Gold Price Process Cost Others (cost) Depletion - H2 Scope Change End 2013
Oun
ces
(koz
)
10
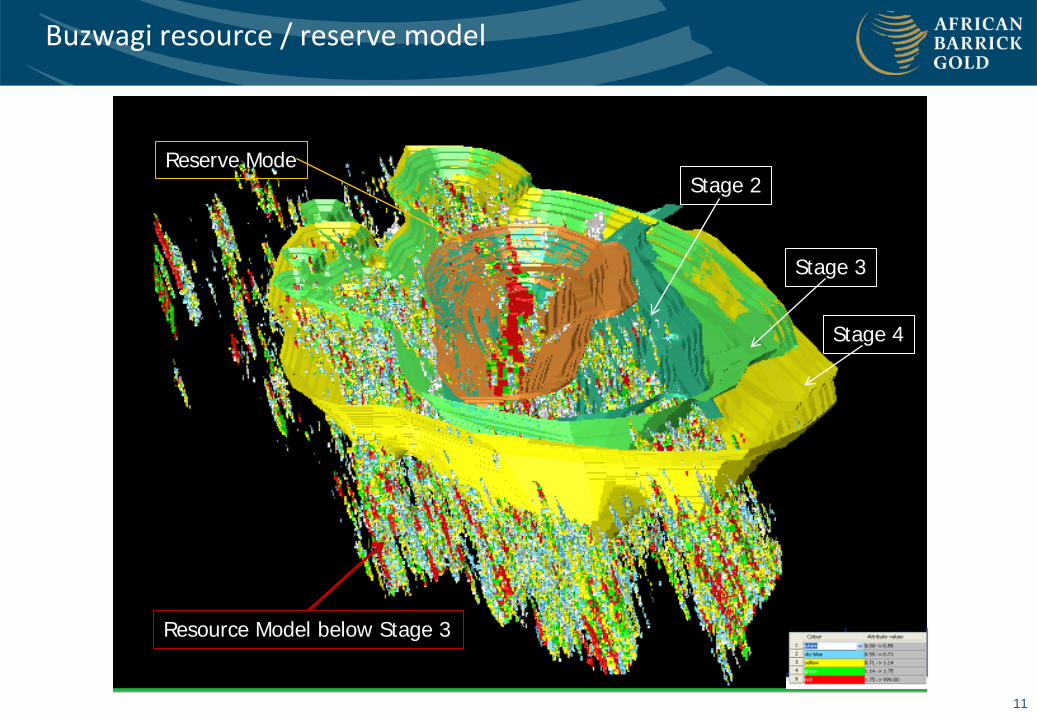
Buzwagi resource / reserve model
Resource Model below Stage 3
Stage 2
Stage 3
Stage 4
Reserve Mode
11

Plans of stage 2 and 3 pits with location of orebody
Stage 2
Stage 3
12
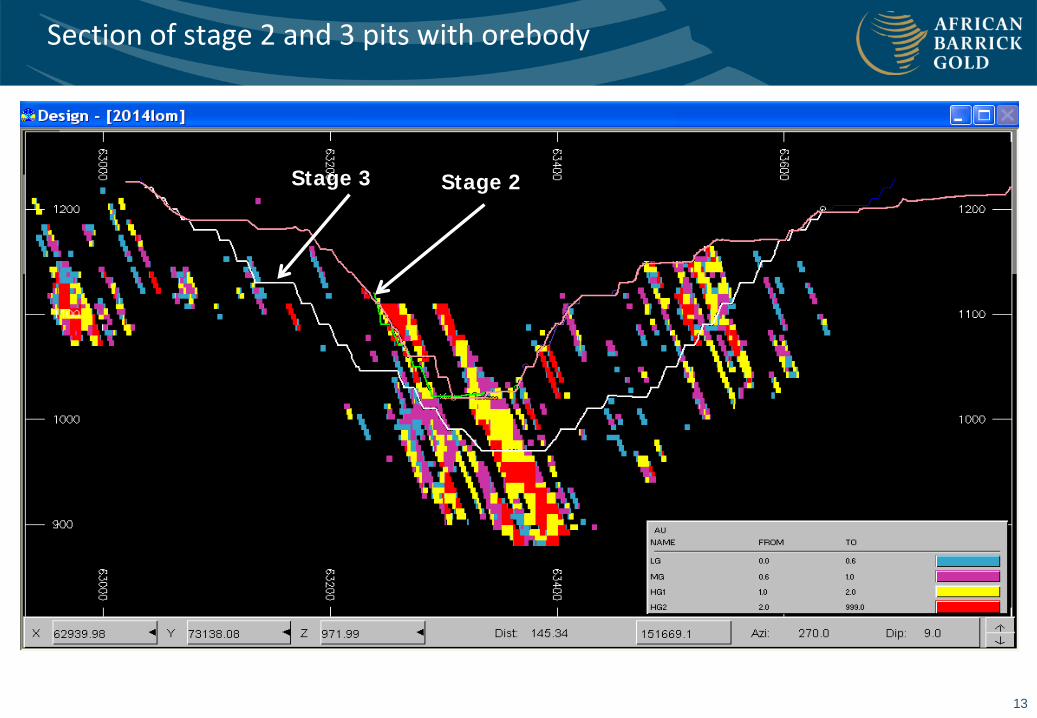
Section of stage 2 and 3 pits with orebody
Stage 2 Stage 3
13
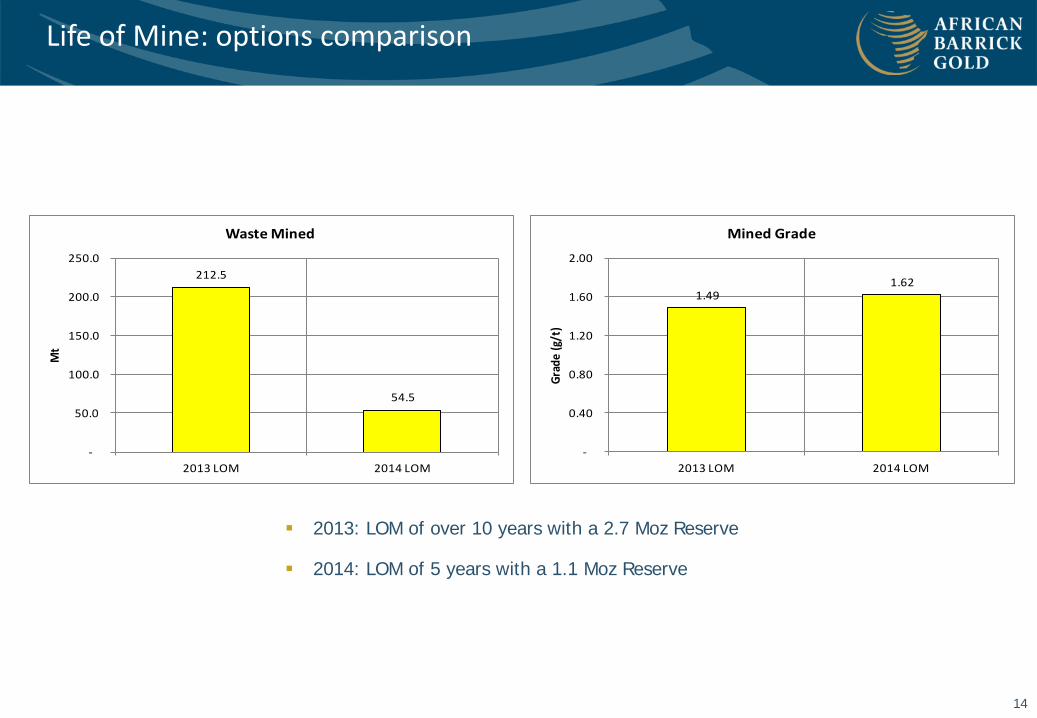
Life of Mine: options comparison
1.49 1.62
-
0.40
0.80
1.20
1.60
2.00
2013 LOM 2014 LOM
Grad
e (g
/t)
Mined Grade
212.5
54.5
-
50.0
100.0
150.0
200.0
250.0
2013 LOM 2014 LOM
Mt
Waste Mined
2013: LOM of over 10 years with a 2.7 Moz Reserve
2014: LOM of 5 years with a 1.1 Moz Reserve
14

0
100
200
300
2013 2014 2015 2016 2017 2018 2019 2020 2021 2022 2023
Koz
Annual Gold Produced (Koz)
2014 LOM (Exc Cut 4) 2013 LOM (Inc Cut 4)
Gold production profile
Accelerated Stage 2 and 3 mining
Treating of low grade stockpiles
Re-worked plan in 2014 to achieve budgeted ounces post isolated SE western wall instability
15

0
5
10
15
20
25
30
35
40
2013 2014 2015 2016 2017 2018 2019 2020 2021 2022 2023
Mill
ion
Tonn
es
Annual Total Tonnes Mined
2014 LOM (Exc Cut 4) 2013 LOM (Inc Cut 4)
Ore mined
Reduced tonnes mined – Standing down equipment
16
0
2
4
6
8
10
2013 2014 2015 2016 2017 2018 2019 2020 2021 2022 2023
Ore
Ton
nes
(Mill
ion)
Annual Ore Tonnes Mined
2014 LOM (Exc Cut 4) 2013 LOM (Inc Cut 4)

1. Mine Operations Overview 1
2. Life of Mine 7
3. Processing Operations 17
4. Cost Improvements 20
5. Summary 27
17
Contents

Processing overview
Capacity of 4.4 million tonnes milled per annum (c.12,000tpd)
Gravity, flotation & CIL to produce dore and copper concentrate
Concentrate trucked to port and sold to smelter
107 km power line, 400 person village
73 ha water harvest area
Full back-up power capacity
Infrastructure
Process
18
Capacity

Processing improvements and future strategies
Achieved the plant designed capacity of 4.4 Mt in 2013 due to:
− Higher mill throughput rates
− Reduced unplanned shutdowns
− Implementation of short interval controls (SICs)
Future strategies to maintain and exceed the nameplate capacity for LOM:
− Improved mill throughputs
− Mining to Mill ore blend strategy
− Reduced planned & un-planned shutdown times
− Maintain high crushed ore stockpile
− Better plant control strategies by SICs
19

1. Mine Operations Overview 1
2. Life of Mine 7
3. Processing Operations 17
4. Cost Improvements 20
5. Summary 27
20
Contents

Cost savings
Key 2014 cost saving initiatives are:
Labour - FY impact of expat labour reduction
Power – Grid power mix
Maintenance – improved condition-based monitoring and root cause analysis processes
Mining consumables – focused on tyre life management program and improved control around fuel and lubrication issuing
Processing consumables – trialling of more cost efficient grinding media in progress/ short interval control system on CIL
External services – improved contract management (rates and fixed cost reduction)
Working capital management - centered on supplies on hand and initiatives include category management
-
50,000
100,000
150,000
200,000
250,000
300,000
350,000
2012A 2013A 2014E
Progression of Total Site Costs
Labour Energy/Diesel
Consumables Maintenance
Contracted services G&A costs
Sales related costs Sustaining Capital
Activity/One-off cost adjustment Total Direct Costs - Absolute
Total Direct Costs - Activity adj
21

Cost saving: labour head count reductions
-
20
40
60
80
100
120
2012 2013 2014 2015 2016 2017 2018 2019 2020 2021 2022 2023
Life-of- Mine Human Resources - Internationals Head Count 2013 versus 2014
2013 LOM 2014 LOM
-
200
400
600
800
1,000
1,200
1,400
2012 2013 2014 2015 2016 2017 2018 2019 2020 2021 2022 2023
Life-of- Mine Human Resources - Total Head Count 2013 versus 2014
2013 LOM 2014 LOM
22
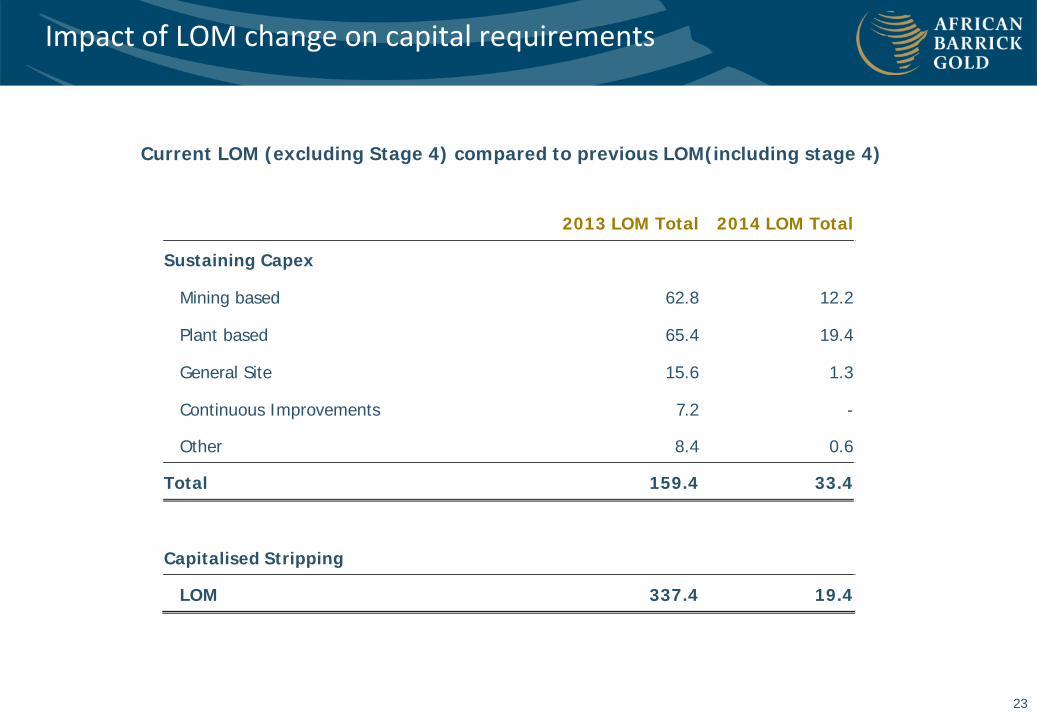
Impact of LOM change on capital requirements
Current LOM (excluding Stage 4) compared to previous LOM(including stage 4)
23
2013 LOM Total 2014 LOM Total
Sustaining Capex
Mining based 62.8 12.2
Plant based 65.4 19.4
General Site 15.6 1.3
Continuous Improvements 7.2 -
Other 8.4 0.6
Total 159.4 33.4
Capitalised Stripping
LOM 337.4 19.4
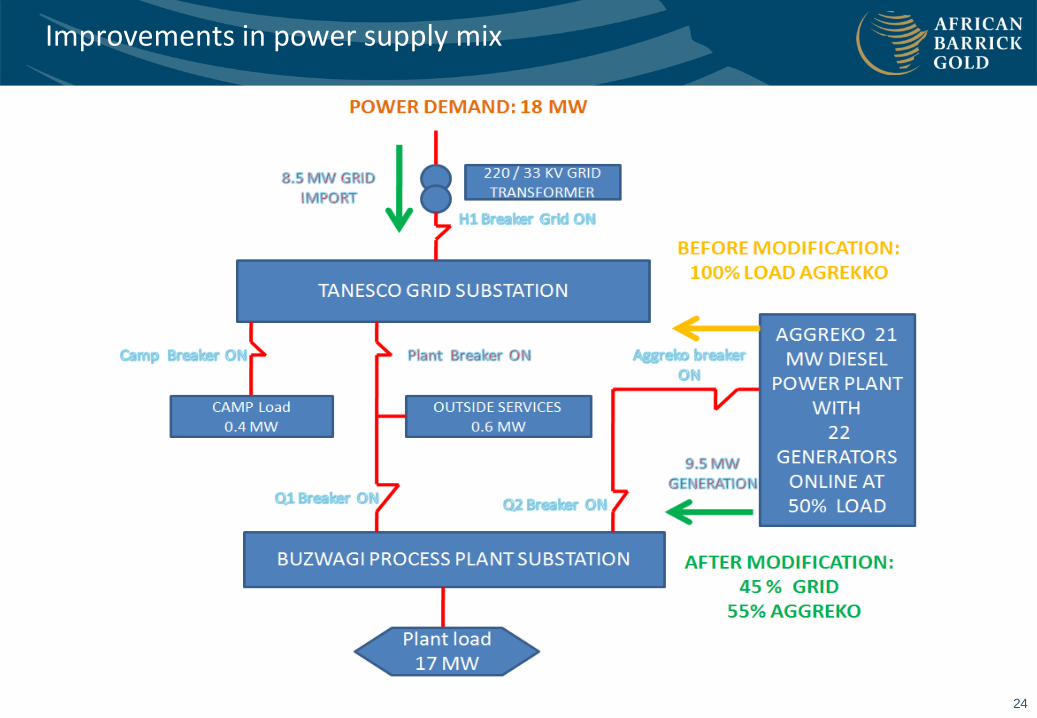
Improvements in power supply mix
24

Leading to power cost savings
11 11
11.8 11.5
10.5 10
9.6
11.4
6.8 7 6.8 6.5
7.3 6.9
0.02 0.48
0.7
1.5 0.28
5.1
4.8
3.1
4.2
5.4
4.1
0
2
4
6
8
10
12
14
Jan-13 Feb-13 Mar-13 Apr-13 May-13 June-13 July-13 Aug-13 Sep-13 Oct-13 Nov-13 Dec-13 Jan-14 Feb-14
MW
h
Increasing Grid Power as a Proportion of Power Mix
Site Generation MWh
Tanesco Grid MWh
25

2014 Business Improvement priorities
26
Mine to mill productivity improvements Improve grade control and block model Mining process improvements (fragmentation, services) Mining fleet optimisation (dispatch upgrade, payloads, reduced idling time) Improve overall equipment effectiveness
Maintenance Increase mean time between failure (MTBF) and spares management Reduced maintenance cost per hour, reduce downtime and mean time to repair (MTTR)
Process plant Improve stockpile management and blending to drive improved mill throughput and plant
recoveries Appropriate maintenance strategies in place
Other costs Supply chain optimisation (warehouse and inventory improvements) Labour optimisation (right people, right structure and motivation) Integrate asset protection into business processes

1. Mine Operations Overview 1
2. Life of Mine 7
3. Processing Operations 17
4. Cost Improvements 20
5. Summary 27
27
Contents

Summary
Life of Mine has been rescheduled, in order to deliver:
a significant reduction in material moved
an improved grade profile
reduced capital spend
Together, these mean that the mine is expected to be cash flow positive in each year of the LOM
28