african continental free trade area: developing and strengthening regional value...
TRANSCRIPT

U N I T E D N AT I O N S C O N F E R E N C E O N T R A D E A N D D E V E L O P M E N TM E N T
AFRICAN CONTINENTAL FREE TRADE AREA: Developing and strengthening
Regional Value Chains in Agricultural Commodities and Processed Food Products


UUNITED NATIONS CONFERENCE ON TRADE AND DEVELOPMENT
AFRICAN CONTINENTAL FREE TRADE AREA: Developing And Strengthening
Regional Value Chains In Agricultural Commodities And Processed Food Products
New York and Geneva, 2016

Note
The material contained in this publication may be freely quoted or reprinted but acknowledgement is
requested, together with a reference to the document number. A copy of the publication containing
the quotation or reprint should be sent to the UNCTAD Secretariat, at: Palais de Nations, 1211,
Geneva 10, Switzerland.
The designations employed and the presentation of the material do not imply the expression of any
position whatsoever on the part of the United Nations Secretariat concerning the legal status of any
country, territory, city area, or its authorities, or concerning the delimitations of its frontiers and
boundaries, or regarding its economic system or degree of development.
The views expressed in this publication reflect solely the views of the author.
This is an unedited publication
Acknowledgements
This study was prepared for UNCTAD by Ms. Emilie Dairon under the framework of a Development
Account Project 1213 AR on "Strengthening Capacities of African Countries in Boosting Intra-African
Trade". It was supervised by Mr. Bonapas Onguglo, Senior Economic Affairs Officer, UNCTAD, and
Mr. Ahmed Mutkhar, Economic Affairs Officer, UNCTAD. It was also reviewed by Mr. Joseph Kodzo
Banini, consultant with UNCTAD.
UNCTAD/WEB/DITC/2016/4
United Nations Publication
Copyright©United Nations, 2016
All rights reserved

II
Table of contents
Table of contents ............................................................................................................................................. II
INTRODUCTION……………………………………………………………………………………………………….. 1
A: Background…………………………………………………………………………………………………… 1
B: Focus on regional value chains in agricultural commodities and processed food products……… 1
C: Continental mechanisms linked to agriculture development…………………………………………… 2
D: Experience in regional free trade areas impacting agriculture………………………………….. ……...2
E: Objectives and methodology of the report………………………………………………………………… 2
CHAPTER 1……………………………………………………………………………………………………………. 4
LITERATURE REVIEW OF REGIONAL VALUE CHAINS IN AGRICULTURAL COMMODITIES AND PROCESSED FOOD PRODUCTS IN AFRICA……………………………………………………………………… 4
A: SOME KEY NOTIONS……………………………………………………………………………………… 4
1. Defining the value chain concept ......................................................................................................... 4
2. Key notions in the value chain approach ............................................................................................. 4
3. Applications at the regional level ......................................................................................................... 5
4. Limitations of the value chain concept ................................................................................................ 8
B: LITERATURE REVIEW……………………………………………………………………………………….. 8
1. The value chain approaches ................................................................................................................ 8
2. Value chains in Africa ......................................................................................................................... 10
3. Database: ITC Trade Map .................................................................................................................. 11
4. Websites ............................................................................................................................................ 11
5. Continental integration in Africa......................................................................................................... 11
CHAPTER 2…………………………………………………………………………………………………………… 12
EXISTING AGRICULTURAL REGIONAL VALUE CHAINS IN AFRICA…………………………………………. 12
A: METHODOLOGY AND SELECTION OF SECTORS…………………………………………………… 12
1. Outline of the value chain analysis .................................................................................................... 12
2. Existing value chains ......................................................................................................................... 14
B: AGRICULTURE IN AFRICA: OVERVIEW OF THE VALUE CHAIN…………………………………… 17
1. Macroeconomic profile ...................................................................................................................... 17
2. Gross mapping of the agricultural value chain .................................................................................. 18
3. Competitiveness ................................................................................................................................ 19
4. Investment and finance ...................................................................................................................... 22
5. Market access.................................................................................................................................... 24
6. Regional business environment ......................................................................................................... 26
7. Summary of the main features of agriculture and regional trade in Africa ........................................ 28
C: OVERVIEW OF THE VALUE CHAINS OF COMMODITIES HIGHLIGHTED BY THE ABUJA FOOD SUMMIT…………………………………………………………………………………………………… 30
1. Macroeconomic indicators ................................................................................................................ 30
2: Socioeconomic indicators ................................................................................................................. 34

III
3: Elements about the mapping of the chains ....................................................................................... 34
4: Competitiveness ................................................................................................................................ 35
SUMMARY ............................................................................................................................................. 36
CHAPTER 3…………………………………………………………………………………………………………… 38
ESTABLISHING NEW REGIONAL VALUE CHAINS TO ENHANCE VALUE ADDED IN AGRICULTURAL COMMODITIES AND PROCESSED FOOD PRODUCTS: SOME KEY ELEMENTS………………………….. 38
A: PRIORITIZATION: METHODOLOGIES…………………………………………………………………….38
B: BUILDING A PRIORITISATION SHEET FOR AGRICULTURAL RVCs………………………………… 43
1. Economic criteria ............................................................................................................................... 43
2. Social criteria ..................................................................................................................................... 44
3. Environmental criteria ........................................................................................................................ 44
4. Regional integration criteria ............................................................................................................... 44
5. Criteria and their respective weight ................................................................................................... 44
C: SELECTION OF PROMISING COMMODITIES FOR RVCS……………………………………………. 45
1. The tea value chain: an existing RVC with growth potential at the regional and global levels……. 49
2. Competitiveness…………………………………………………………………………………………… 50
3. Potential to develop VA in the tea RVC…………………………………………………………………… 51
4. The potato value chain: a promising RVC with food security benefits……………………………… 52
5.Competitiveness………………………………………………………………………………………………53
6. Potential to develop VA in the potato RVC………………………………………………………………. 54
SUMMARY……………………………………………………………………………………………………. 55
CHAPTER 4…………………………………………………………………………………………………………… 56
RECOMMENDATIONS FOR FOSTERING AND ESTABLISHING REGIONAL VALUE CHAINS IN AGRICULTURAL COMMODITIES AND PROCESSED FOOD FOR AFRICA…………………………………... 56
1. Interventions at the “macro” level ...................................................................................................... 56
2. Interventions impacting competitiveness .......................................................................................... 57
3. Access to facilities and information ................................................................................................... 57
4. Investment and funding ..................................................................................................................... 57
5. Market access.................................................................................................................................... 58
6. Business environment........................................................................................................................ 58
7. The role of international organizations ............................................................................................... 58
REFERENCES………………………………………………………………………………………………………… 60
Notes………………………………………………………………………………………………………………….. 63

IV
List of tables
Table 1: Countries and geographic regions, income groups, AU-recognized REC, UN classification, and
other inter-governmental organizations in Africa ............................................................................... 6
Table 2: Recap of the main features of principal VC methodologies ............................................................ 10
Table 3: Outline of the analysis of the agricultural sector ............................................................................. 13
Table 4: Overview of intra-African and worldwide trade flows for the nine (9) Abuja commodities .............. 15
Table 5: List of the first ten agricultural products exported by Africa ........................................................... 18
Table 6: List of the first ten agricultural products exported by Africa to Africa ............................................. 18
Table 7: List of research centres and institutes on agriculture ..................................................................... 21
Table 8: A sample of market information systems in agriculture in Africa ................................................... 22
Table 9: Sample of regional-scale partnerships ........................................................................................... 23
Table 10: Average tariffs on agricultural products applied by the first ten African importers of agricultural
products ........................................................................................................................................ 24
Table 11 : Some sector associations ............................................................................................................ 26
Table 12: A list of sector-specific bodies ...................................................................................................... 26
Table 13: A list of some farmers’ associations .............................................................................................. 27
Table 14: A sample of other actors working on agriculture ......................................................................... 27
Table 15 : Parliamentarians’ associations and regional Parliaments interested in the development of
agriculture in Africa ....................................................................................................................... 28
Table 16: A summary of the agriculture sector in Africa ............................................................................... 29
Table 17 :Supplying countries to African markets for the nine continental commodities ............................. 31
Table 18: Export value per country for the nine continental commodities ................................................... 32
Table 19: Importing markets sourcing the nine continental commodities from African suppliers ................ 33
Table 20 Main priority criteria for the identification of value chains to be developed ................................... 39
Table 21: Main priority criteria for the identification of value chains to be developed .................................. 42
Table 22: Proposal for a customized assessment sheet to prioritize agricultural RVCs ............................... 43
Table 23: Proposed weighted assessment sheet to prioritize agricultural RVCs.......................................... 45
Table 24: Assessment of priority commodities for the development of VA-oriented RVCs ......................... 47
Table 25:Tariff applied to tea exports from the 3 main African suppliers by their top 5 African markets ..... 50
Table 26: tariffs applied by Morocco for the product 090240 ....................................................................... 51
Table of figures
Figure 1 NTMs faced by Burkina Faso and Kenya’s exporters (percentage) ................................................ 25
Figure 2: main outputs of the meat value chain in Eastern Africa (in percentage of exports) ....................... 34
Figure 3: Differences in processing green and black tea leaves ................................................................... 50
Figure 4 : basic representation of the potato value chain in West Africa ...................................................... 53

V
List of abbreviations and acronyms
ACP African, Caribbean and Pacific Group of States
AFD French Agency for Development
AIDA Action Plan for Accelerated Industrial Development of Africa
AU African union
CAADP Comprehensive Africa Agricultural Development Program
CFC Common Fund for Commodities
CFTA Continental Free Trade Area
CGIAR Global Agricultural Research Partnership
COMESA Common Market for Eastern and Southern Africa
DRC Democratic Republic of Congo
EAC East African Community
EU European Union
FAO Food and Agriculture Organization
FDI Foreign Direct Investment
FTA Free Trade Agreement
GDP Gross Domestic Product
GVC Global Value Chain
HS Harmonized System
ITC International Trade Centre
KTDA Kenya Tea Development Agency
LDC Least Developed Countries
LLDC Landlocked Developing Countries
MDG Millennium Development Goals
NEPAD New Partnership for Africa’s Development
OECD Organization for Economic Cooperation and Development
R&D Research and Development
REC Regional Economic Communities
ReSAKSS Regional Strategic Analysis and Knowledge Support System
ROPPA Réseau des Organisations Paysannes et de Producteurs de l'Afrique de l'Ouest
RVC Regional Value Chain
SADC Southern African Development Community
SSA Sub-Saharan Africa
SIDS Small Islands Developing States
SPS Sanitary and Phytosanitary
TNC Transnational Corporations
UN United Nations
UNCTAD United Nations Conference on Trade and Development
UNECA United Nations Economic Commission for Africa
USD United States Dollars
VA Value Added
VC Value Chain
VCA Value Chain Analysis
WB World Bank
WTO World Trade Organization

INTRODUCTION
A: Background
The African Union Assembly decided in 2012 during its 18th Ordinary Session to boost intra-African trade and to fast track the Continental Free Trade Area (CFTA). This CFTA is expected to boost intra-African
trade expansion, stimulate sustained economic growth and foster inclusive development. The CFTA is more than a free trade agreement. It is perceived as a platform that would facilitate a process of inclusive structural transformation of African countries, contributing to meeting Africa's 2063 Vision. In this process,
the CFTA would also help Africa to make progress in implementing the 2030 Agenda and Sustainable Development Goals.
The present study aims to enhance knowledge among policy-makers, experts and private sector on
requisite policies and measures for fostering the development and strengthening of regional supply and value chains in agricultural commodities and processed food products. This would contribute to the development of intra-African trade in agricultural and food products including through the setting up and
strengthening of regional agro-food supply chains.
B: Focus on regional value chains in agricultural commodities and processed food products
The focus on regional value chains in agricultural commodities and processed food products comes at a crossroads between different focus of the development community positively impacting the role of agriculture in the African economy. Agriculture has been highlighted as an effective means to fight
poverty1. This is particularly noticeable in 2014, which was observed as the International Year of Family Farming by the UN2. It is also celebrated as the Year of Agriculture and Food Security by the African Union. For the regional organization, it is the opportunity to emphasize the central role of agriculture in
Africa’s economic growth3.
Such renewed focus comes with an increased awareness of the benefits and drawbacks of the sector for the development of Africa. If agriculture is a unique vector for development, as an economic activity, as a livelihood and as a provider of environmental services4, the heavy dependence of many African countries
to a restricted number of agricultural commodities and products5 has to be taken into account. For many decades, African countries had been planning to diversify from commodities; now they have come again at the centre of economic preoccupations, because of their socio-economic importance, illustrated inter alia
by the relevance of the sector for food security.
Nonetheless, according to regional institutions, Africa’s agriculture is characterized by low input, low
output and low value added, and ample opportunities exist for increased value addition in agriculture and regional trade in Africa6. This is one of the reasons why agriculture and agri-food products are considered under the prism of linkages development and upgrading, and against the paradigm of value chain
development. It is expected that, by moving up the value chain and developing backward and forward linkages to the commodity sector, African countries can maximize direct and indirect effects, such as job creation, environmental sustainability and social progress7.
The value chain concept has gained significant interest in the recent years, and is now broadly used as a synonym of sector analysis and development8. The notion of “Global Value Chains” – GVC – has recently served as a focus of some flagship events and publications in the trade and development community, being the core issue of the Organization for Economic Cooperation and Development (OECD) and World
Trade Organization (WTO) Aid for Trade Review in 20139, and the central topic of the World Investment Report of UNCTAD that same year10. However, for an improved and accelerated continental development, it is now largely accepted that developing regional value chains for strategic agricultural commodities is
essential 11 . Developing regional value chains could exploit scale economies, lower production and marketing costs, and help removing non-tariff barriers12 . As most countries export primary commodities, some of them selling packaged and processed goods and other involved in marketing and branding13,
there seems to be room to develop synergies and ultimately stimulate intra-African trade.
The subject of agricultural regional value chains in Africa is thus at the turning point of the renewed focus on agriculture, the concept of value chains and the relevance of the regional approach. Furthermore, it is
backed up by the existence of continental frameworks supporting agri-food development.
2
C: Continental mechanisms linked to agriculture development
Many regional frameworks exist on regional coordination in agriculture and development in Africa. In 2003,
member States of the African Union committed to the Maputo Declaration. They pledged to engage 10% of their national budgets to agriculture and reach a 6% annual agricultural growth by 200814. In the aftermath of the meeting, the Comprehensive Africa Agricultural Development Program (CAADP) was
created. It is a programme of the New Partnership for Africa’s Development (NEPAD) and it provides a vehicle for implementing the Maputo commitments through country-owned agricultural development programs involving multiple stakeholders (i.e. technical experts, farmer organizations, agribusiness
companies, and governments)15. In December 2013, forty countries were involved in the programme16.
In 2006, the African Union Abuja Food Security Summit validated the selection of twelve commodities, identified as vital for enhancing food production at continental and sub-regional levels17. In 2007, the
Conference of African Ministers of Industry endorsed the Action Plan for Accelerated Industrial Development of Africa (AIDA). The Plan and its strategy for implementation adopted in 2008 has an impact on agriculture, as it recognizes the scope for increased participation by Africa in commodity-based GVCs and proposes tracks for improvement18. In 2012, the African Union Summit decided to fast track the
establishment of the CFTA by the indicative date of 2017, which would include liberalizing trade in agriculture and commodities. These visionary and policy documents set the scene for the underlying focus of the influence of the CFTA on the development of agriculture in Africa.
D: Experience in regional free trade areas impacting agriculture
Intra-regional trade flows among African countries remain low: between 6 and 12% according to sources. When narrowing the focus on the sub-Saharan Africa agricultural market, figures amount from 1 to 6%19. For the African Union, one of the main reasons lies in the slow progress by the Regional Economic Communities (RECs) in becoming customs unions20. In this regard, the experience gained by the Common
Market for Eastern and Southern Africa (COMESA), the East African Community (EAC) and the Southern African Development Community (SADC) is particularly interesting. They set up a Tripartite Free Trade Agreement (FTA) which could pave the way for an Africa-wide elimination of trade barriers. Since
agriculture represents a large share of the three REC’s GDP, the experience can be of particular relevance to assess the impact of a regional free trade area on agricultural commodities and processed goods, with the objective of scaling it up to the continental level.
E: Objectives and methodology of the report
The report aims at presenting key modalities for fostering or adding value in regional supply chains in agricultural commodities and processed food products, in relation to helping to establish the CFTA and
boosting intra-African trade. The target audience is African policy-makers, experts of the African Union Commission, the regional economic communities and AU member States. It is intended to propose guidelines on establishing regional value chains in agricultural commodities and processed food products.
The focus of this report is as follows:
- To provide a literature review on the many methodologies on value chain analysis and development, particularly in the sector of agri-food products and in the African region, recapping the definitions of the concepts used in the value chain paradigm (Chapter 1)
- To give an overview of the regional agriculture value chains of specific commodities existing at the regional level, including mapping, presentation of actors and focus on special issues such as trade barriers (Chapter 2)
- To suggest methods for prioritization of regional agricultural value chains to be further developed, and to test this approach with the analysis of two priority commodities, the potential development of regional value chains in these sectors, with a view on value addition (Chapter 3)
- To draw conclusions and policy recommendations for fostering and establishing regional value chains in agricultural commodities and processed food products in Africa (Conclusion chapter).
The report is based on analysis of existing documentation (including books, reports, best practices, etc.)
and consultation of trade databases. The study was made out of secondary data review. No “fresh” data – e.g. through interviews of stakeholders – was collected for this assignment. Furthermore, the fixed length of the report (forty pages plus annexes) contained the scope. The study cannot be considered as an

3
exhaustive value chain analysis of determined agricultural sectors in Africa. It is aimed at examining the
concept of regional value chains, applied to agricultural commodities in Africa, for policy-makers willing to quickly grasp the issues at stake and to understand the main features of value chain prioritization.

4
CHAPTER 1
LITERATURE REVIEW OF REGIONAL VALUE CHAINS IN AGRICULTURAL COMMODITIES AND
PROCESSED FOOD PRODUCTS IN AFRICA
Prior to entering into a recapitulation of publications, reports and other documents concerning value
chains in agriculture, it is helpful to provide a brief review of the concepts considered in this study and their relative importance in recent economic analysis.
A: SOME KEY NOTIONS
1. Defining the value chain concept
The recent growing interest for “chains” and the multiplication of publications on the matter highlights the
need for this study to set up a clear definition of the kind of chains that it will be scrutinize. Indeed, the literature often talks about productive chains, value chains, marketing chains, supply chains, distribution chains21, without giving the boundaries existing between these different approaches. It appears that in the
end, all these concepts tend to describe the same reality.
A value chain can be defined as the full range of activities which are required to bring a product or a service
from conception to delivery to final consumer and final disposal after use through different phases of
production22. It therefore includes primary production, transformation, marketing and final consumption.
A value chain does not necessarily mean that activities are constrained within one country. The trends in
global economy from the 1960’s, with globalization leading to an increasing fragmentation of production processes, has led to an international dispersion of production activities that have seen the emergence of borderless production systems23. When at least two countries are involved into production networks, this
characterises a global value chain24 (GVC).When placing the scope on agriculture, an agricultural value chain can be defined as the set of actors and activities that bring a basic agricultural product from the field
to final consumption, and add value at each stage of the production process25. Here lies a fundamental
difference between the value chain concept and other well-known notion: a value chain focuses on how value is created and added along the way, while a supply chain, for instance, highlights logistics and procedures in order to maximize efficiency26. The ultimate goal of a value chain would be to analyse and
understand how incremental value can be created and distributed in the different segments of a production chain, involving different actors and, in the case of a transnational chain, different countries. Thus, the concept of value chain brings along other notions such as value addition, participation, linkages,
competitive advantage, and upgrading.
2. Key notions in the value chain approach
When considering transnational chains, value can be added at the domestic level or in another country.
Foreign value added measures the share of inputs that have been produced in other countries, and which does not add to the country’s GDP. Domestic value added is the part of exports created in-country, contributing to its GDP27. The role that countries or regions play in international production networks is
called GVC participation. Even if it is often considered by policy-makers as less important than domestic value added, it is a useful indicator of how the exports of a country are integrated in the global economy.
It is underlying in the value chain approach that the concept of value chain is all about relations, interactions and links. Here the notion of linkages is useful, as it is broadly used in the value chain
literature. Linkages can be defined as proactive approaches to connect producers (often it is implied that they are smallholders) to consumers28.
The notion of competitive advantage is first a concept to use at company level. The competitive advantage
can be defined as the elements a company uses to provide customers with a product of equivalent value compared with competitors, but a lower cost (strategy of cost reduction) or for which customers are willing to pay a higher price (strategy of differentiation)29. At country level, the competitive advantage in a given
commodity is a result of interrelationships among activities involved in the production and delivery of the product30.

5
Such concepts are useful when coming to the end objective of a value chain: the allocation of incremental
value all along the process. In the end, analysing a value chain is made to achieve a desirable development outcome. It will allow identifying gaps, shortages and actors experiencing difficulties; all of these leading to a less important domestic value added, and to a lesser contribution to GDP. It will
eventually segment the chain and highlight the most sustainable segments, where most countries want to stay because they generate higher value added. This process is called upgrading31, or moving up. Countries want to move up in the value chain, because capturing value added can mean gains for
producers (wages), for asset owners (return on investment), for consumers (better quality), and for governments (tax revenues).
Upgrading relies on the combination of several factors: a policy component (trade policies to improve productivity and quality); and a “progressive” component (testing the approach by selling final products
with higher value added to developing countries, before trying to comply with Northern markets’ requirements)32. This is where the regional approach in value chains can be of particular interest.
3. Applications at the regional level
(a) Regional value chains in agriculture
Recent GVC research has identified the growing importance of value chains organized at the regional, rather than global, level33. Value chains are qualified as regional when their activities are spread beyond
national borders34, in the same region or, in the case of Africa, in the same continent. Regional value chains (RVC) can cover two realities:
- when production is regional, and intended for regional consumption
- When production is regional, and supplies global markets35.
The latter is quite close to the global value chain concept.
In recent literature, despite their being relatively less numerous than global value chains, regional value
chains have been praised as the source of many benefits, especially for least developed and developing countries. In agricultural commodities, they build on the competitive advantages offered by two or more countries in a given agro-economic zone. Thus they could compensate the drawbacks of raw products
(perishability, bulkiness, quality variability and seasonality) 36 . They could enhance productivity and competitiveness, inter alia, by fostering innovation and allowing economies of scale37. Then, they could
help countries to expand markets, through investment (considered as more viable at regional level38) and regain power towards transnational corporations (TNC), which coordinate most of the GVC and are said to be involved in 80% of global trade39. Ultimately, they could lead to an increase in value added, thereby resulting in a growth of GDP. In a continent like Africa, benefitting from a great variety of conditions and
geographic basins, having unified regional governance with the African Union, it becomes particularly relevant to analyse the mechanisms to stimulate the establishment of RVC.
(b) Current situation in the African region
Africa is composed of 54 countries. The Regional Strategic Analysis and Knowledge Support System (ReSAKSS)40 provides a convenient classification of countries, according to income groups (mineral-rich
countries (LI-1), countries with more favourable agricultural conditions (LI-2), countries with less favourable agricultural conditions (LI-3), and middle-income countries (MI)) and Regional Economic Communities, 8 of them being recognized by the African Union41. Africa can also be divided into five geographic regions:
Central, Eastern, Northern, Southern, and Western.
There are other distinctions qualifying African countries, and potentially giving them special benefits or programmes, such as the UN-led classification of Least Developed Countries (LDC), Landlocked Developing Countries (LLDC) and Small Islands Developing States (SIDS)42.
The following table recapitulates the different memberships, geographical and policy classifications of the 54 countries of the African continent.

6
Table 1: Countries and geographic regions, income groups, AU-recognized REC, UN classification, and other inter-governmental organizations in Africa

7
Source: Author, adapted from ReSAKSS and UNOHRLLS.

8
This table shows the existing mechanisms and inter-relations between countries of the continent, and highlights the potential of setting up the CFTA. Realizing the potential of intra-African trade requires overcoming a number of challenges43, including overlapping memberships44; but if the continent could
eliminate barriers and constraints to regional trade, by setting up real RVCs, regional markets might be instrumental in exploiting economies of scale and in selling the intermediate and final goods that have value added locally and regionally.
4. Limitations of the value chain concept
The value chain approach is broadly accepted by the development community as an approach to promoting development. It is the cornerstone of this study. Yet it has certain limitations. Hence it is useful to keep in mind that developing value chains is not the only way to boost trade, development and
productive capacities in a given country or region.
One major limitation of the value chain approach concerns its methodology: it is said to be quite donor and agency-led, with few tools to foster ownership. It is linked to another drawback, which is the lack of
unification of the concept: for instance, UN agencies – which are strong promoters of the concept – do not have clear and unique definitions of the various notions, which would be largely communicated internally or with partner institutions45. No international task force is working on VC46, to develop a coherent set of
concepts to be used by the development community and allow effective comparisons. As a result, there are different methodologies to analyse a value chain or prioritize sectors47.
Another disadvantage lies in the fact that a value chain analysis is a snapshot48 of a certain sector, at a given time; and it cannot capture the variation of one sector overtime. It is sector-specific and does not
take into account, to a certain extent, the influences that other segments of the economy can have over the chain. Furthermore, to prepare a fully-fledged value chain analysis, the authors need time, relevant and up-to-date documentation, field visits and sustained contacts with all the chain stakeholders, including
with government authorities. These features are often incompatible with the work of the development agencies, constrained with time and financial limits. Therefore, many times agencies commissioning VC analysis often find that such analyses cannot be used as a guide to make informed decisions49.
B: LITERATURE REVIEW
To prepare this study, a number of publications have been consulted. They can be classified into several categories:
- General literature about the value chain approach and its methodologies, including in the
agricultural sector; - Value chains in Africa; and - Continental integration in Africa.
The most important are briefly described below50.
1. The value chain approaches
M4P (2008) Making Value Chains Work Better for the Poor: A Toolbook for Practitioners of Value Chain
Analysis, Version 3. Making Markets Work Better for the Poor (M4P) Project, UK Department for
International Development (DFID). Agricultural Development International. Phnom Penh.
The M4P tool book is a useful and practical guide, clearly written and with a number of figures and tables to facilitate the understanding of sometimes complex economic concepts, aimed at clarifying the main
concepts of the value chain approach and providing clear tools to undertake an analysis of determined value chains. It has a determined pro-poor bias, oriented towards smallholders but mainly towards analysing the contribution to value chains of the poorest actors. It places a strong focus on stakeholders
and governance mechanisms.

9
ITC (2008). Sector Analysis for Value Chain Development. Geneva, June.
The International Trade Centre (ITC) methodology is addressed to national consultants assigned to collect
data for a value chain analysis. Thus it gives pertinent indications on the sort of information needed to prepare a comprehensive report. It also provides a structure for value chain analysis, and illustrates with examples the economic indicators that should be included in such a report.
Springer-Heinze, Andreas and Eiligmann, Alfons (2009). Value links: training seminar.
The ValueLinks methodology is used by the German Development Agency (GIZ). The ValueLinks manual provides definition of the main concepts and details the main tools for value chain analysis, especially on mapping, segmenting, chain design, partnerships and impact. It describes the
mechanisms of chain governance as well.
UNIDO (2009). Agro-value chain analysis and development. The UNIDO Approach. A staff working paper.
Vienna.
The working paper provides a hands-on approach to agricultural value chain. It gives to policy-makers and value chain practitioners' quick tools for the prioritization of agricultural sectors, including assessment
score sheets. It considers the various components of sustainable development, including the impact of value chain development on poverty reduction and employment in rural areas. It provides figures on agricultural development and examples on value chain prioritization.
Webber, C. Martin (2010). Agriculture and Rural Development: Building Competitiveness in Africa's
Agriculture: A Guide to Value Chain Concepts and Applications. World Bank Publications. Washington DC
The report gives a progressive and comprehensive overview of key concepts of the value chain. It gives a methodology with tools essential to value chain analysis, development and upgrading. Furthermore, it gives pertinent indications, steps and case studies to design prioritization methods for value chain
interventions. It provides concrete cases on agricultural sectors in different countries to illustrate the value chain tools.
UNCTAD (2013). World Investment Report. Geneva.
The UNCTAD report focuses on Global Value Chains and provides data on international trade. Its interest for this study lies in its review of crucial concepts – value added, GVC participation, etc. – and its analysis of the allocation of incremental value added following policy interventions and economic interactions.
OECD, World Trade Organization (2013). Aid For Trade 2013: Connecting to value chains.
The background report of the this AidForTrade review is mainly based on a large survey addressed to trade partners: policy-makers, entrepreneurs, etc. As a result, it highlights concerns and preoccupations of
different stakeholders facing the many challenges of developing value chains in all sectors. It thus gives a reliable image of the reality of value chains today.
FAO (2014). Developing sustainable food value chains – Guiding principles. Rome.
This publication focus on food sectors and designs a hands-on and convenient method to choose and develop value chains. It functions as a cycle, with three stages and ten steps – guiding principles, based on sustainable development. All the interactions and segments of value chains are covered: economic, social and environmental impacts, systems, governance and market orientation, vision, upgrading
mechanisms, scale and multilateral interventions.

10
Table 2: Recap of the main features of principal VC methodologies
Source: Author, based on: M4P (2008) Making Value Chains Work Better for the Poor: A Toolbook for Practitioners of Value Chain Analysis, Version 3. Making Markets Work Better for the Poor (M4P) Project,
UK Department for International Development (DFID). Agricultural Development International. Phnom Penh;
ITC (2008). Sector Analysis for Value Chain Development. Geneva, June; Springer-Heinze, Andreas and Eiligmann, Alfons (2009). Value links: training seminar; Webber, C. Martin (2010). Agriculture and Rural
Development : Building Competitiveness in Africa's Agriculture : A Guide to Value Chain Concepts and
Applications. World Bank Publications. Washington DC; FAO (2014). Developing sustainable food value chains – Guiding principles. Rome.
2. Value chains in Africa
Economic Commission for Africa and African Union (2009). Economic Report on Africa 2009. Developing African Agriculture Through Regional Value Chains. Addis Ababa.
The Economic Commission for Africa (ECA) and AU annual report in 2009, fully develops the concepts of agricultural value chains in Africa. It puts into perspective the different steps of regional integration in
agriculture, such as the Abuja Food Security Summit (2006). It analyses the different gaps that countries have to face to develop RVCs, like tariff, trade facilitation and ICT low coverage. It reviews major constraints to VC development and provides a number of relevant policy recommendations.
Proctor, F., Lucchesi, V. (2012). Mapping Study on Value Chain Initiatives in ACP regions. Technical Centre for Agricultural and Rural Cooperation (ACP-EU).
The CTA (Technical Centre for Agriculture and Rural Cooperation between African, Caribbean and Pacific Countries (ACP) and the European Union (EU)) provides many reports on agriculture development. This
report provides an overview of the state of the art on value chain development, including the limitations of the VCA approach, and it evaluates the situation in each of the main geographical regions. It provides indications on policy orientations by the regional economic communities, data on intra-regional trade, and
policy recommendations differentiated for each area. It if of interest for all the stakeholders directly and indirectly involved in VC development – Parliamentarians, research institutes, business associations.
Technical Centre for Agricultural and Rural Cooperation (ACP—EU) (2013). Executives briefs
The CTA publishes these briefs focussing on one sector and analysing the most recent trends and figures. Even if they are not in principle region-specific, the analysis of a region depends on the sectors; for instance, the brief on the tea sector is oriented towards eastern Africa and the role of Kenya and
neighbouring countries.
Name Institution Date Sector-
specific
Region-
specific
Providing
methodological
tools
Case
studies
Making Value Chains Work Better for the
Poor
M4P,
DFID
2008 No No Yes No
Sector Analysis for Value Chain
Development
ITC 2008 No No Yes No
Value Links GIZ 2008 No No Yes No
Agro-value chain analysis and development UNIDO 2009 Yes No Yes Yes
Agriculture and Rural Development :
Building Competitiveness in Africa's
Agriculture : A Guide to Value Chain
Concepts and Applications
WB 2010 Yes Yes Yes Yes
Developing sustainable food value chains –
Guiding principles
FAO 2014 Yes No Yes Yes

11
3. Database: ITC Trade Map
Trade Map is a database developed by ITC to provide users with indicators and data of export performance. It aims at facilitating strategic market research, reveal comparative and competitive advantage and enabling identification of products with potential. It is based on trade data communicated
by countries. It uses the Harmonized System (HS), the international product classification protocol used by customs officials which serves as a foundation for the international import and export classification systems. The consequence is that the correspondence is not total between the agricultural products
chosen by policy-makers and the results in Trade Map (HS codes often more specific, or sometimes overlapping). Furthermore, trade data are never complete, mirror data is sometimes used, and the phenomenon of double counting (countries counting re-exports in export statistics, though only domestic VA contributes to GDP) cannot be avoided.
4. Websites The ReSAKSS website, along with 8 AU-recognized REC websites, are instrumental in giving policy
background, trends and figures. However, sometimes, they are not the most up-to-date.
5. Continental integration in Africa African Union Commission and Economic Commission for Africa (2012). Boosting Intra-African Trade.
Issues Affecting Intra-African Trade, Proposed Action Plan for boosting Intra-African Trade and Framework
for the fast tracking of a Continental Free Trade Area. Addis Ababa.
The report comes back on the different steps to set up a CFTA, including since the Abuja Treaty in 1991,
and draws on the experience of the Tripartite Free Trade Area to formulate policy recommendations. It highlights the roles and responsibilities of the African REC in the slow process of the CFTA establishment. It details the functions of the different bodies proposed to monitor the CFTA implementation, such as the
High Level African Trade Committee or the African Business Council.
Economic Commission for Africa and African Union (2013). Economic Report on Africa 2013. Making the
Most of Africa’s Commodities: Industrializing for Growth, Jobs and Economic Transformation. Addis Ababa.
The annual report 2013, insists on the creation of forward and backward linkages between developing, commodity-exporting countries. It provides agricultural case studies (cocoa, coffee) and illustrates the
barriers to trade with national examples. It presents regional initiatives on commodities, derived from the twelve products selected in 2006 by the Abuja Summit. It gives strong justification to the establishment of the CFTA.
Economic Commission for Africa, African Union and African Development Bank (2012). Assessing Regional
Integration in Africa (ARIA V): Towards an African Continental Free Trade Area. Addis Ababa.
The ARIA V publication gives the case for the establishment of the CFTA, in terms of economic impact, movements of goods, current initiatives of the REC and regional financial integration. It analyses the implications of the CFTA, its potential gains and losses, while raising awareness on the possible
inequalities in the distribution of these gains.
As a conclusion, it has to be noted that the literature specific to regional value chains in agriculture and processed food – especially when it comes to developing “new” value chains” – in Africa is scarce. The
field of agricultural RVC in Africa is vast, every publishing entity (international or regional organizations, technical cooperation bodies, etc.) has its own focus. Information has to be collected from different sources, policy reports, technical briefs, etc., and is sometimes hard to compare.

12
CHAPTER 2
EXISTING AGRICULTURAL REGIONAL VALUE CHAINS IN AFRICA
This chapter presents the existing value chains in agricultural commodities and processed food products. As the scope is large, it will be narrowed based on the priorities identified by the African regional
institutions. The chapter starts, firstly, with an introduction on the methodology and the selected value chains; secondly, some main elements for the value chain analysis of agriculture in Africa are discussed; and finally, a review is provided of the structures of the value chain in the selected sectors.
A: METHODOLOGY AND SELECTION OF SECTORS
1. Outline of the value chain analysis
In most of the cases, an exhaustive value chain analysis for a given sector requires the constitution of a team to collect first-hand information, organize field visits and interviews, gather the relevant literature and
set up a plan to prepare the report. It is a work of several months and the result – often amounting to more than 100 pages – has to be discussed with the concerned stakeholders, to draw conclusions and policy interventions. The requests for value chain analysis addressed to international organizations are submitted by member States, partner institutions or donor agencies51, but they are generally broadly accepted and
backed-up by the stakeholders at the national level (if the VC is national).
Preparing a proper value chain analysis for each regional value chain existing on the African continent would not have been possible in this report. Nonetheless, the value chain approach as defined in the first
chapter has been followed in its main features. Based on the main methodologies presented in the first chapter52 and on the requirements, a framework for the value chain overview has been defined.

13
Table 3: Outline of the analysis of the agricultural sector
Source: Author
Macroeconomic profile
Macroeconomic indicators
Contribution to GDP
Export value / market value
Export destinations
Value added
Socioeconomic indicators
Workforce including number of smallholders
% of women in total workforce
Level of skills of labour force and management
Mapping
Type of products sold
Segments
Surface
Issues (seasonality, environmental risks)
Competitiveness
Production costs
Productivity
Labour costs
Exchange rates
Access to facilities
Existing infrastructure (roads, etc.)
Energy supply
Access to technology / research / innovation / information
Investment
Domestic investment
FDI
Incentives to investors
Market access
Tariffs
Non-tariff measures
Certification and standards
Trade facilitation
Business environment
Business actors
Competition framework
Intellectual property

14
The table above shows a perfect image of information that would be required in order to present a fully-fledged value chain analysis. The following parts of the study will display information corresponding to most of the sections of the table; in some occasions, secondary data could not be obtained.
2. Existing value chains
In Africa, agriculture accounts for approximately 25% of GDP and more or less 70% of the labour force53, depending on various sources. The sector could be worth 313 billion USD in 201354. Regional value chains
exist in the sense that demand exist in some African countries that can be satisfied by supply existing in
other African countries.
In 2006 during the African Union Food Security Summit in Abuja, twelve commodities were recognized as
vital for enhancing food production at continental and sub regional levels55. Nine of them were considered
as continental. They are:
Rice Legumes
Maize Cotton Palm oil
Beef Dairy Poultry
Fisheries.
Three of them were considered as regional. They are:
Cassava Sorghum
Millet.
The table below provides data on trade in the nine continental commodities in terms of intra-African trade and global trade covering both exports and imports. It shows the existence of exchanges (supply and
demand) and potential for growth in intra-African trade. As the commodities selected by the Abuja Summit cover often a bunch of different products, the collection of data was made out of specific Harmonized System (HS) codes at four or two digits56.

15
Table 4: Overview of intra-African and worldwide trade flows for the nine (9) Abuja commodities
Abuja commodities Rice Legumes Maize Cotton Oil palm Beef/ livestock Dairy Poultry Fisheries
HS code in Trade
Map
1006
Rice
07 Edible
vegetables and
certain roots
and tubers
1005
Maize - Corn
52 1511
Palm oil & its
fraction
0202
Meat of bovine
animals, frozen
04 Dairy
products,
eggs, honey,
edible animal
product nes
0207Meat &
edible offal of
poultry meat
03Fish, crustaceans,
molluscs, aquatic
invertebrates nes
Exports to Africa 249765 465,219 495,053 239,679 198,598 87,750 626,866 88,026 704,450
Export to World
(total)
409416 3, 008,684 983,009 2, 103,184 240,235 145,507 1, 064,977 91,266 3, 967,569
Imports from Africa 250,271 438,975 429,820 207,677 215,976 77,770 601,235 73,692 766,395
Imports from world
(total)
5, 166,860 2, 134,713 4, 361,271 425133 3, 744,034 1, 540,749 5, 442,940 2, 158,434 3, 571,313
African exporters to
Africa
South Africa, Egypt, Uganda, Tanzania, Botswana, Rwanda, Benin, Liberia, Côte d'Ivoire, Malawi
South Africa, Zambia, Uganda, Morocco, Tanzania, Burkina Faso, Rwanda, Benin, Kenya, Malawi
South Africa, Zambia, Uganda, Morocco, Tanzania, Burkina, Rwanda, Kenya, Benin, Malawi
Zimbabwe, Zambia, Burkina Faso, Benin, Sudan, Mozambique, South Africa, Malawi, Togo, Swaziland
Côte d'Ivoire, Togo, Uganda, Kenya, Ghana, South Africa, DRC, Congo, Benin, Egypt
Botswana, South Africa, Namibia, Kenya, Zambia, Uganda, Rwanda, Malawi, Senegal, Burundi
South Africa, Egypt, Tunisia, Morocco, Senegal, Uganda, Rwanda, Togo, Kenya
South Africa, Namibia, Tunisia, Malawi, Ghana, Morocco, Kenya, Uganda Zambia, Seychelles
Namibia, Senegal, South Africa, Seychelles, Morocco, Guinea Bissau, Ghana, Mauritania, Mozambique,
Zimbabwe
African importers
from Africa
Libya, DRC, Zimbabwe, Botswana, Swaziland, Senegal, Sudan, Nigeria, Morocco, Kenya
Libya, Botswana, Algeria, Angola, Namibia, South Africa, Lesotho, Mozambique, Sudan, Zimbabwe
Zimbabwe, Namibia, Botswana, Tanzania, Kenya, Swaziland, Malawi, Lesotho, Mozambique, Rwanda
South Africa, Mauritius, Egypt, Lesotho, Morocco, Algeria, Zimbabwe, Tunisia, Swaziland, Kenya
Senegal, Niger, Rwanda, Zambia, DRC, Tanzania, Ghana, Burundi, Burkina Faso, Zimbabwe
South Africa, Angola, Mozambique, Nigeria, Lesotho, Tanzania, DRC, Swaziland, Egypt, Zambia
Libya, Botswana, Namibia, Angola, Zimbabwe, Mozambique, DRC, Swaziland, Lesotho, Kenya
Lesotho, DRC Namibia, Botswana, Zimbabwe, Mozambique, , Swaziland, Libya, Angola, Malawi
DRC, South Africa, Mozambique, Côte d'Ivoire, Mauritius, Angola, Zambia, Cameroon, Benin, Togo
African exporters
to world
Egypt, South Africa, Uganda, Niger, Tanzania, Botswana, Rwanda, Benin, Liberia, Côte d'Ivoire
Egypt, Morocco, Kenya, South Africa, Ethiopia, Tanzania, Tunisia, Senegal, Ghana, Madagascar
South Africa, Zambia, Uganda, Morocco, Tanzania, Burkina, Rwanda, Kenya, Benin, Malawi
Burkina Faso, Mali, Benin, Côte d'Ivoire, Egypt, Tanzania, Mozambique, Zimbabwe, Zambia
Cameroon,
Côted'Ivoire, Togo, Uganda, Ghana, Kenya, Niger, Egypt, South Africa, DRC, Congo
Botswana, Namibia, South Africa, Swaziland, Kenya, Senegal, Zambia, Uganda, Egypt
Egypt, South Africa, Morocco, Tunisia, Senegal, Uganda, Rwanda, Togo, Kenya, Ghana
South Africa, Namibia, Tunisia, Malawi, Morocco, Egypt, Ghana, Kenya, Uganda, Zambia
Morocco, Namibia, South Africa, Uganda, Mauritania, Senegal, Seychelles, Tunisia, Tanzania, , Madagascar

16
African importers
from world
South Africa, Benin, Senegal, Côte d'Ivoire, Cameroon, Ghana, Mozambique, Kenya, Niger, Madagascar
Egypt, Algeria, South Africa, Angola, Libya, Sudan, Morocco, Senegal, Kenya, Côte d'Ivoire
Egypt, Algeria, Morocco, Tunisia, Libya, Zimbabwe, Namibia, Botswana, Nigeria, Senegal
Egypt, South Africa, Morocco, Mauritius, Tunisia, Lesotho, Algeria, Zimbabwe, Swaziland, Ethiopia, Kenya
Egypt, South Africa, Djibouti, Angola, Ghana, Uganda, Kenya, Tanzania, Nigeria, Algeria
Egypt, Angola, Algeria, South Africa, Libya, Morocco, Gabon, Congo, Ghana, Equatorial Guinea
Algeria, Egypt, Nigeria, Libya, Morocco, Angola, South Africa, Ghana, Sudan, Mauritius
Angola, South Africa, Benin, Ghana, Libya, Egypt, DRC, Gabon, Congo, Equatorial Guinea
Nigeria, Egypt, Mauritius, South Africa, Côte d'Ivoire, Cameroon, DRC, Morocco, Angola, Seychelles
Source: Trade Map, accessed on 27 November 2014

17
It also presents the first ten African suppliers or importers for each commodity. For the beef sector, many HS codes were potentially matching. In order to keep the same criteria than the other sectors (one single HS code), the HS code corresponding to frozen beef has been chosen, as it was the most important in
terms of value. Units are in thousands of US dollars (USD).
The following remarks can be highlighted:
- 10 countries out of 54 never appear in the importers or suppliers of commodities. It can be an indication of the size or structure of their economy (resource-based or service-oriented), or of
their lesser participation in commodity GVCs. They are: Cape Verde, Central African Republic,
Chad, Comoros, Eritrea, Gambia, Guinea, Sao Tomé and Principe, Sierra Leone and Somalia;
and - There is continental demand in all of these sectors, and a continental supply base exists.
Therefore, it is logical that these sectors are analysed as regional value chains.
B: AGRICULTURE IN AFRICA: OVERVIEW OF THE VALUE CHAIN
1. Macroeconomic profile
(a) Macroeconomic indicators
Figures vary from one report to another, but remain in the same gross proportion. In terms of contribution to GDP, agriculture is said to be worth 25% in most countries57. It can amount to 35% in some countries and great variations are seen in the different RECs: for instance in SADC, the share of agriculture in
countries’ GDP is between 4 to 27%58. The share of total agricultural GDP per region is as follows: 36.4% for Western Africa, 5.3% for Central Africa, 23.6% for Eastern Africa, 26.7% for Northern Africa and 8% for Southern Africa59.
As for export value, figures vary. It is estimated to amount to approximately 68 billion USD annually60 (to be compared to the total value of Africa’s exports to the world of 581,8 billion USD in 201361), and was considered to be 2% of the global agricultural exports in 200662. The phenomenon of double counting exist – as we can see in table 4, some countries are importers and exporters for the same product,
meaning for instance that they have imported a product, processed it and re-exported it. It is though less important than in other countries, because many countries export natural resources or commodities with little foreign input63.
Agricultural African exports go mainly to Europe and the Americas. The main importers of African agri-food products are South Africa, Libya, Democratic Republic of Congo, Zimbabwe, Botswana, Namibia, Mozambique, Angola, Lesotho and Mauritius.
In terms of value added, it is quite challenging to obtain an absolute value or a proportion. Authors generally agree on the fact that VA in agriculture in Africa is low64, and has contracted or marginally increased in most of the countries65. Although two thirds of agricultural value is added in developing
countries, it is worth 4.5 times less than value added in industrialized countries. Another striking figure is that developing countries process only 38% of their agricultural products, compared to 98% in developed
countries66. However, measuring value added is a key indicator of the performance of a value chain67.
Efforts have to be put on measuring VA and on preparing strategies for higher VA products. Most reports highlight that more VA can be obtained by more processing68; and that space exist for more processing
since a large share of agricultural exports in Africa are primary products and raw material.
(b) Socioeconomic indicators
Agriculture provides jobs to approximately 70% of the labour force in most countries69, and a continental average gives the figure of 60% of the total workforce employed in the sector70. As for the level of employment of the rural workforce, it is evaluated between 75% and 90%71. The proportion of women in
this workforce is high; they are said to produce more than 70% of food in most countries, and they are generally considered as the dominant producers, traders and nutrition providers72.
Calculating income generation without having access to producers is arduous. Sources converge on the fact that 70% to 80%73 of population living in rural areas, depends on agriculture for food, employment
and income.
The skills level of agri-food producers in general in Africa is assessed as low. One of the main challenges is the lack of market information and marketing skills. Other shortages concern management tools and a bias
towards production techniques74. Training in fields such as certification, SPS regulations, production

18
techniques, is needed. Awareness around these issues has risen in the recent years. The development community and partner countries are willing to raise the profile of agricultural workers, and the development of skills to increase productivity is now embedded in most of the development initiatives in
agriculture75.
2. Gross mapping of the agricultural value chain
The products sold by African suppliers are diversified. Apart from the nine commodities identified during the Abuja 2006 Summit, which will be scrutinized in the next section, the main agricultural commodities and agri-food products exported by Africa to the world and to Africa are described in the following tables.
Table 5: List of the first ten agricultural products exported by Africa
HS group Product Export value in 2013
18 Cocoa and cocoa preparations 8,716,337
08 Edible fruit, nuts, peel of citrus fruit, melons 6,717,259
03 Fish, crustaceans, molluscs, aquatic invertebrates nes 3,967,569
09 Coffee, tea, mate and spices 3,581,151
07 Edible vegetables and certain roots and tubers 3,008,684
24 Tobacco and manufactured tobacco substitutes 2,999,244
17 Sugars and sugar confectionery 2,988,207
52 Cotton 2,890,413
12 Oil seed, oleagic fruits, grain, seed, fruit, etc, nes 2,421,699
22 Beverages, spirits and vinegar 2,335,350
Source: Trade Map, accessed on 23 November 2014
Table 6: List of the first ten agricultural products exported by Africa to Africa
HS group Product Export value in 2013
24 Tobacco and manufactured tobacco substitutes 1,713,156
17 Sugars and sugar confectionery 1,497,272
33 Essential oils, perfumes, cosmetics, toileteries 1,281,881
22 Beverages, spirits and vinegar 1,120,022
09 Coffee, tea, mate and spices 997,120
10 Cereals 899,894
15 Animal,vegetable fats and oils, cleavage products, etc 864,282
03 Fish, crustaceans, molluscs, aquatic invertebrates nes 704,450
11 Milling products, malt, starches, inulin, wheat gluten 639,076
04 Dairy products, eggs, honey, edible animal product nes 626,866
Source: Trade Map, accessed on 23 November 2014
There are some variations between regions: for instance, in COMESA starchy staples, pulses, fresh fruits and vegetables, meat, fish and dairy products account for nearly 75% of the value of all regional

19
agricultural production; and in general, domestic markets for food staples dominate agricultural markets in Africa76.
To produce these stocks, several functions are needed. They can be divided into several occupations:
- Input suppliers (seeds, fertilizers, etc.) - Farmers - Processing industries
- Service providers - Traders - Retailers
- Etc.
Generally, it is considered that a local supply base (such as pesticide manufacturers or seedling suppliers) contributes to secure access to inputs for exporting firms77. Thus it is crucial, for an agricultural sector
willing to be export-oriented, to have an easy access to such segments of the VC. It is usually mentioned that most of African agriculture is characterized by low input.
No detailed description of each segment will be made in this section; however, a common assertion about the processing segment, in the specialized literature, says that African manufacturers mainly concentrate
on light consumer goods and agro-processing, generally with a limited size and scope, though, according to OECD the industries and services linked to agriculture in value chains often account for more than 30% of GDP in emerging and urbanized countries78. African agro-processors are said to be vulnerable to the
end or erosion of trade preferences as trade liberalization goes further79.
The farming segment of the agriculture VC is one of the most studied parts. Generic figures concerning arable land in Africa, turn around 733 million hectares80, with Sub-Saharan Africa accounting for 12% of
the world arable land81. Authors usually agree on the fact that the surface of arable land is enough to feed the African population, if efficiently farmed82.
It is underlying in many of the publications, that most of the stakeholders – at least for the farming
segment – are smallholders, most of them with poor vertical or horizontal linkages to other segments of the VC. This aspect will be further explained in the specific description of the commodities.
Concerning cross-sector issues linked to the different segments – such the effects of climate change – there is a broad bunch of aspects to be covered; they will just be mentioned here. Climate change is an
issue; it may cause losses of 25% of agricultural output in Africa83, but forecasts by 2100 predict a loss of 6 to 47% of agricultural revenue in Africa84 because of climate change. As the sector heavily depends on rain-fed production, especially in Eastern and Southern Africa85, the question is particularly striking.
Agriculture as a sector is not exempt of criticism, as it is the larger user of water (70% of the world consumption) and one of the main contributors to greenhouse gas emissions (30%). But the awareness on environmental issues is growing; and today, trends in agro ecology and agro-forestry seek to enhance
yield, quality of production and soil regeneration86. It has to be mentioned as well that the sector is also a provider of environmental services – which is generally unrecognized, and non-remunerated sequestering carbon, managing watersheds, and preserving biodiversity87.
3. Competitiveness
(a) Production costs
Production costs are major aspects to deal with in agricultural value chain. They are the main decision factors for sourcing and investing in value chains, as they represent a comparative advantage. Figures vary, but in general there is agreement around the fact that agricultural productivity in Africa is inferior to
the world average. More details will be provided in the sections on specific commodities. Some authors advance the fact that agricultural productivity is the lowest of the world, with 335 USD of VA per worker88. Labour productivity highly depends on education, and access to education has increased in rural areas
thanks – inter alia – to the context of the Millennium Development Goals89. Therefore a movement in labour productivity is expected in the near future.
There is growth in yield – 6 to 9% on average – but at a slower path than for other regions of the world, and for some sectors, prospects of yield growth are negative because of climate change90. Minor
variations between RECs exist in yield growth. Yield enhancing practices are still rare, especially in Sub-Saharan Africa91.
Labour costs are challenging to calculate. The circulation of workers remains an issue, as the free mobility
of persons in Africa is not attained yet, except for some groups in some RECs. Most of the RECs – at least

20
CEMAC, CEN-SAD, COMESA, EAC, ECCAS, ECOWAS, SACD, UEMOA and UMA have protocols and regulations on the free movement of people, labour, services, right of establishment and right of residence92. There are variations among on the concrete implementation of mobility of workers: in general,
protocols on FTAs often allow for the temporary entry of business people into the territory of the trading partners and they also permit movement of labour to take up work93. However, a large share of labour migrations in agriculture is informal and non-declared.
Exchange rates variability is a crucial factor to take into account, as multiple and different national currencies almost all of which are non-convertible also raise trade costs94. Some RECs are already monetary unions (UEMOA, CEMAC). Others are making progress to address currency convertibility in their
regions, such as COMESA and ECOWAS95
(b) Access to facilities
A common assertion when tackling the issue of agriculture in Africa – especially in Sub-Saharan Africa – is to point out the lack of infrastructure, especially when it comes to transportation. In Sub-Saharan Africa,
the lowest coverage in road density is 31 km for 1000 km2, though the average road density is 137 km for 1000 km296. Furthermore, unpaved road are impassable during the wet season or violent rain episodes. Bad transport conditions are major explanations for food waste: they can result in inadequate storage,
rupture of the cold chain and increase maintenance costs for trucks and transports companies. Inadequate infrastructure, especially for road, is often quoted by donor countries and partner countries as a major barrier for firms97. A project exists for a trans-African road network, connecting cities of more than
500000 inhabitants98.
Africa produces approximately 3% of the world electricity99. Power outages are frequent and are a threat to the development of a modern agriculture. But developments are under implementation in the energy
sector: RECs have evolved towards establishing regional power pools, interconnected electricity grids, formulating master plans for regional power development, and developing environmentally benign power sources. SADC, UEMOA, ECOWAS and EAC have launched pools100. Other transnational electricity supply initiatives exist, not necessarily involving the RECs; but efforts on the development of a coherent, efficient
energy supply have to be boosted.
As for the access to research, technology, innovation and generic information, the lack of ambition and thus investment in research and development (R&D) is a subject of concern. Worldwide, developing
countries have usually a higher percentage of total agriculture spending in research than developed countries: 2.5% versus 1%. In Africa, this figure is 0.7%. If analysed as a share gross national product, R&D expenditures amount to 0.28% in Sub-Saharan Africa, compared to 0.39% on average in developing
countries, and 0.72% in Asia101. Furthermore, the private sector is not committed enough to R&D, amounting for only 2% of total agricultural research102. R&D investments are necessary to maintain and expand the presence of a country in global markets103, and are vital to enhance yield. Geographical areas
facing this limited access to technology are mainly Western, Eastern and Southern Africa104. However, it does not impede some interesting initiatives to be implemented, especially in soil (interactions soil / plant) and production systems in the context of agro ecology105. There are a number of research centres on agriculture operating in Africa, some Africa-originated, others from a global origin.

21
Table 7: List of research centres and institutes on agriculture
Research centres and institutes
CGIAR Global Agricultural Research Partnership
IFPRI International Food Policy Research Institute
ASARECA Association for strengthening Agricultural Research in Eastern and Central
Africa
CORAF / WECARD Conseil Ouest et Centre Africain pour la Recherche et le Développement
Agricole / West and Central African Council for Agricultural Research and
Development
FANRPAN Food, Agriculture and Natural Resources Policy Analysis Network
FARA Forum for Agricultural Research in Africa (in English)
AERC African Economic Research Consortium
IITA International Institute for Tropical Agriculture
PRASAC-CEMAC Pôle Régional de Recherche Appliquée au Développement des Systèmes
Agricoles d'Afrique Centrale
Source: Proctor, F., Lucchesi, V. (2012). Mapping Study on Value Chain Initiatives in ACP regions. Technical Centre for Agricultural and Rural Cooperation (ACP-EU); IRD (2013). Sciences au Sud. 72.
Novembre – Décembre.
As for market information, progress has been boosted by the implementation of the CAADP, and systems
are being implemented in the context of development projects, regional initiatives or private sector opportunities.

22
Table 8: A sample of market information systems in agriculture in Africa
Name Regional Economic Community Country
Regional Agricultural Trade Intelligence Network (RATIN)
Kenya Agricultural Commodity Exchange (KACE) Kenya
Malawi Agricultural Commodity Exchanges (MACE) Malawi
COMESA-wide Food and Agricultural Marketing Information
System (FAMIS)
COMESA
COMESA Trade Information Network (TINET) COMESA
SADC Agricultural Information Management System (AIMS) SADC
SADC Livestock Information Management System (LIMS) SADC
African Agricultural Markets Programme (AAMP) Kenya, Uganda, Tanzania, Malawi, Zambia, and Mozambique
Agricultural Information System (AGRIS) Compact CAADP / ECOWAS
Réseau des systèmes d’information des marchés agricoles en
Afrique de l’Ouest (RESIMAO)
Benin, Burkina Faso, Côte d'Ivoire, Guinea, Niger, Mali, Senegal, Togo, Nigeria
Esoko Africa (private SME)
CommodAfrica
CopHorti - Communauté de pratiques sur l'Horticulture
Border Information Centers (BIC) project on the Ghana-Togo
Aflao border
ECOWAS, UEMOA, Abidjan-Lagos Corridor Organization (ALCO) sponsored by the World Bank, the USAID-sponsored West Africa Trade Hub
Ghana, Togo
EAC information Centre in Dar-es Salaam EAC
Source: Proctor, F., Lucchesi, V. (2012). Mapping Study on Value Chain Initiatives in ACP regions.
Technical Centre for Agricultural and Rural Cooperation (ACP-EU); http://www.sadc.int ; http://www.comesa.int ; https://esoko.com ; http://www.eac.int ; http://www.resimao.net ; http://www.resakss.org
4. Investment and finance In 2012, for the first time ever, developing economies absorbed more Foreign Direct Investment (FDI) than developed countries106. This can be an opportunity for agricultural VCs. However, Africa is by far the area
with less FDI: around 60 billion of USD, 107stagnating in 2011 – 2012. Both domestic investment and FDI in agriculture are considered as low108, and the inability to attract foreign investment is seen as a critical issue. As risks and thus income uncertainty is a major hurdle to investment – harder to overcome in agriculture, multilateral initiatives have been taken on agricultural risk management. Other initiatives to
boost investment in agriculture thanks to easier connections have been launched, through platforms.
It is expected that some of these platforms foster investments. It is also expected that incentives will be developed109 by countries willing to multiply FDI in their territory.

23
Table 9: Sample of regional-scale partnerships
Name Countries Partners Sector / scope
Grow Africa Ghana, Ethiopia, Rwanda, Tanzania, Mozambique, Burkina Faso and Kenya
AUC, WEF, NPCA, USAID, WB, FAO and others
Platform for investment
3ADI Africa AUC, AFDB, FAO, IFAD, UNIDO Technical assistance on value chains
African Agriculture Fund Africa IFAD, UNIDO, AFD, AfDB, AECID, FISEA, DBSA, BOAD, EBID
Investment
Africa-Brazil Marketplace Initiative Africa FARA, Embrapa, ABC, DFID, GATES, IFAD, WB.
Partnership on innovation
Making Finance Work For Africa Africa AUC, GIZ, BMZ, AfDB, AFRACA Agricultural finance
Pan African Agribusiness and Agro
Industry Consortium (PanAAC)
Africa AU, NEPAD Platform for agribusiness partnerships
African Agricultural Growth and
Investment (AAGI) Task Force
Africa World Economic Forum, Governments of Tanzania, Mozambique, NEPAD
Platforms for public-private investment in agriculture
Platform for Agricultural Risk
Management (PARM)
Africa Afd, IFAD, FAO, WFP, World Bank Platform on agricultural risk management
Forum for Agricultural Risk
Management
Africa SECO, WB, Dutch Ministry of Foreign Affairs
Platform on agricultural risk management
Source: OECD, World Trade Organization (2013). Aid for Trade and Value Chains in Agrifood.

24
5. Market access Measuring market access consists in examining potential barriers to the entry in a specific market: tariffs barriers, non-tariff measures 110 including certification and standards, sanitary and phyto-sanitary
measures. Trade facilitation (i.e. export procedures such as custom delays) will also be tackled in this section.
According to regional institutions, intra-African trade in agriculture faces a higher rate of protection than
non-agricultural sectors. It means that, on average, African countries impose higher tariffs to agricultural products supplied by African countries than to agricultural products supplied by other countries in the world111.
The tariffs applied by African countries to agricultural products are by no means unified. On average, they
apply higher tariffs to agricultural products than to other kinds of products.
Table 10: Average tariffs on agricultural products applied by the first ten African importers of
agricultural products
Average MFN tariffs on
agricultural products
Average of preferential tariffs on
agricultural products
Angola 18.21 18.21
Botswana 17.39 16.53
Congo Democratic Republic of 11.76 11.76
Kenya 28.27 26.34
Lesotho 17.62 16.75
Libya 0 0
Mozambique 11.57 11.06
Namibia 17.62 16.75
South Africa 17.53 14.71
Swaziland 17.62 16.75
Zimbabwe 24.84 23.22
Source: Market Access Map, accessed on 27 November 2014
Generally, import tariffs increase according to the degree of processing: this is called tariff escalation. Tariff escalation dissuades countries from moving up in the commodity value chains112. Furthermore, tariffs applied by African countries to have been growing in the recent years
Non-tariff measures (NTMs) are a major impediment to international trade and can prevent market
access. They can be defined as policy measures, other than custom tariffs and including technical regulations, product standards and customs procedures, that may have an impact on international trade113.
It is challenging to obtain information about NTM faced by individual countries in Africa, especially in the agri-food. The International Trade Centre’s Market Access Map114 compiles data (based on what is reported by countries) and runs surveys among exporting companies. Since 2012, the organization has
published monographs on company perspectives for Burkina Faso, Morocco, Peru, Malawi, Madagascar, Mauritius, Rwanda, Kenya, Senegal, Côte d’Ivoire and Tunisia115. Other African countries, such as Egypt, Guinea or Tanzania, have been or are being surveyed. Figures show that a large number of African
exporting companies are facing NTMs: from 38% of companies in Egypt, up to 95% in Guinea. There is a wide variation of NTMs according to the sector, but of them are technical measures including certification requirements and technical regulations. Internal barriers exist, such as national impediments (export-related measures within the exporting countries) and barriers applied to trade within regional trade
agreements116.

25
Figure 1: NTMs faced by Burkina Faso and Kenya’s exporters (percentage)
Source: International Trade Centre, http://www.intracen.org/itc/market-info-tools/non-tariff-measures/
UNCTAD also provides NTMs through its database on TRAINS NTMs. These cover official measures as reported by government authorities.
Certifications and standards are a major impediment to agri-food trade. It is often quoted by developing
countries, and especially LDCs, as a barrier to enter high-end markets – for instance, Botswana unable to enter the EU beef market, or Namibia the grape market117. But it is also crucial in intra-African trade. In general, 60% of firms cite quality and safety standards compliance as the main factor influencing sourcing
and investment decisions118. To meet standards and to be certified, products need to be tested in laboratories: often such structures do not exist in LDC, and products must be sent to a country where a certifying structure exist, before being shipped to the end market119.
In addition to compliance to mandatory regulations, voluntary sustainability standards exist, that can be an asset for sustainable production and trade. According the ITC’s Standards Map, at least 49 standards exist for agriculture products supplied by African countries to African importers120.
Trade facilitation is a very important in cross-border trade. Trade facilitation practices, like customs
procedures and delays, are cumbersome and slow, and have a great impact on the final price of the
8.1
54.7
1.2
9.3
5.8
20.9
Burkina Faso
Technical regulations
Certification requirements
Pre-shipment inspectionsand other formalities
Taxes and other charges
Rules of origin
Export-related measures(applied by the exportingcountry)
13
42
91
27
04
13
Kenya
Technical regulations
Conformity assessment
Pre-shipment inspections and otherformalitiesCharges, taxes and other para-tariffmeasuresRules of origin
Export-related measures (applied by theexporting country)Quantity control measures
Price control measures
Anti-competitive measures

26
product, by increasing the cost of moving the raw, semi-finished or finished agrifood product 121 . Obviously, it also has an impact on the perishability of the item. For 60% of lead firms in importing agricultural products from developing countries, customs delays are the main trade problem when dealing
with developing country suppliers122. Delays at customs amount to 12 days in Sub-Saharan Africa, compared with 7 days in Latin America and 6 days in Central and East Asia123.
The problem has been identified and tackled by many institutions. The World Bank has been working on
public-private partnerships to facilitate goods clearance. UNCTAD has developed the ASYCUDA 124 system, a computerised customs management system covering foreign trade procedures showing impressive efficiency gains: in Cambodia for instance, at the checkpoints served by ASYCUDA, more than
90% of import and export goods are cleared from customs within 24 hours after the presentation of customs declaration125. African RECs, particularly COMESA, ECOWAS, EAC and SADC, together with partners, are working on harmonizing, simplifying and automating customs procedures and
documentation126. Other kinds of partnerships, like African Alliance for E-Commerce (AAEC), are facilitating exchange of information and experiences on trade facilitation, and promoting a “single window” concept127.
6. Regional business environment The business environment around the agriculture sector in Africa is generally described as not favourable. The regional and continental integration is weak128. There are sector actors working on regional issues,
including regional business associations, but they often lack of recognition, support and funding.
Professional networks and associations representing actors of the commodities value chains can be classified into several categories:
- Sector-specific bodies
Table 11 : Some sector associations
Sector Associations
EAGC East African Grain Council East Africa Grains Council Training Institute
ESADA Eastern and Southern Africa Dairy Association
EAFCA Eastern Africa Fine Coffee Association
RECAO Network of Chambers of Agriculture of West Africa
Source: Proctor, F., Lucchesi, V. (2012). Mapping Study on Value Chain Initiatives in ACP regions. Technical Centre for Agricultural and Rural Cooperation (ACP-EU).
Table 12: A list of sector-specific bodies
Sector-specific centres
AfricaRice Africa Rice Centre
CIP International Potato Centre
World Cocoa Foundation World Cocoa Foundation
CARBAP Africa Centre for Research on Banana and Plantain
Source: Proctor, F., Lucchesi, V. (2012). Mapping Study on Value Chain Initiatives in ACP regions. Technical Centre for Agricultural and Rural Cooperation (ACP-EU).
- Producers’ associations

27
Table 13: A list of some farmers’ associations
Farmers' associations
PAFO Pan African Farmers Organization
EAFF Eastern Africa Farmers Federation
PROPAC Plateforme Régionale des Organisations Paysannes d'Afrique Centrale
ROPPA Réseau des Organisations Paysannes et de Producteurs de l'Afrique de l'Ouest
SACAU Southern African Confederation of Agricultural Unions
Source: Proctor, F., Lucchesi, V. (2012). Mapping Study on Value Chain Initiatives in ACP regions. Technical Centre for Agricultural and Rural Cooperation (ACP-EU).
- Other actors intervening in agriculture in Africa
Table 14: A sample of other actors working on agriculture
OTHERS
AGRA Alliance for a Green Revolution in Africa
ATC Agri and Co-operative Training and Consultancy Services Ltd
HubRural
CTA Technical Centre for Agricultural and Rural Cooperation ACP EU
CFC Common Fund for Commodities
IFDC International Fertilizer Development Centre
AFOMDNet Réseau d'Analyse sur les Facteurs d'Offres Vivrières, de Marché et de Diversification
FIDAfrique-IFADAfrica International Fund for Agricultural Development - Fonds International de Développement Agricole
ACTESA Alliance for Common Trade in Eastern and Southern Africa
African Alliance for E-Commerce (AAEC) Trade facilitation
Pan-African Chamber of Commerce and Industry
Source: Proctor, F., Lucchesi, V. (2012). Mapping Study on Value Chain Initiatives in ACP regions.
Technical Centre for Agricultural and Rural Cooperation (ACP-EU).
The role of Parliamentarians has recently been highlighted by several actors and initiatives.
Parliamentarians are responsible for drafting, voting and assessing trade policies conducive to a better and more integrated continental agriculture. They have to be knowledgeable of the particular issues of agriculture. Regional Parliaments exist, and are mobilized in support of sustainable agricultural sector.

28
Table 15 : Parliamentarians’ associations and regional Parliaments interested in the development of
agriculture in Africa
Parliaments
AWEPA Association of European Parliamentarians with Africa
EALA East African Legislative Assembly
SADC-PF Southern African Development Community Parliamentary Forum
PF-ICGLR Parliamentary Forum of the International Conference on the Great Lakes Region (ICGLR)
PAP Pan-African Parliament
CEMAC-P Parliament of the Economic and Monetary Community of Central Africa
ECOWAS-P Parliament of the Economic Community of West African States
Source: Proctor, F., Lucchesi, V. (2012). Mapping Study on Value Chain Initiatives in ACP regions. Technical Centre for Agricultural and Rural Cooperation (ACP-EU).
When it comes to competition framework and intellectual property rights, most RECs do not have regional frameworks to comply with. Some countries have not established independent competition authorities and
do not possess a corpus of legislation on the matter. On the contrary, some RECs have their department on competition and in most cases, a regional competition policy, such as COMESA, CEMAC, SADC or WAEMU.
Though the general regional policy environment is described as unfavourable by regional institutions129, it is true that such environment has been positively evolving, with continent-wide initiatives to boost the sector, and with the marked political will towards the establishment of the CFTA. However, the region will be evaluated on results. For the moment, only 9 out of 54 countries130 have complied with the Maputo rule,
edited in 2003, and has invested at least 10% of their national budget in agriculture. This is a good indicator of the long road remaining for regional institutions to encourage the development of agriculture as a part of regional policies.
7. Summary of the main features of agriculture and regional trade in Africa
Many issues have been tackled in this chapter. Precisions about the sectors defined by the Abuja Summit in 2006 will be given in the following section, mainly on export values and competitiveness issues. A table recapping the figures and trends examined in this section is useful.
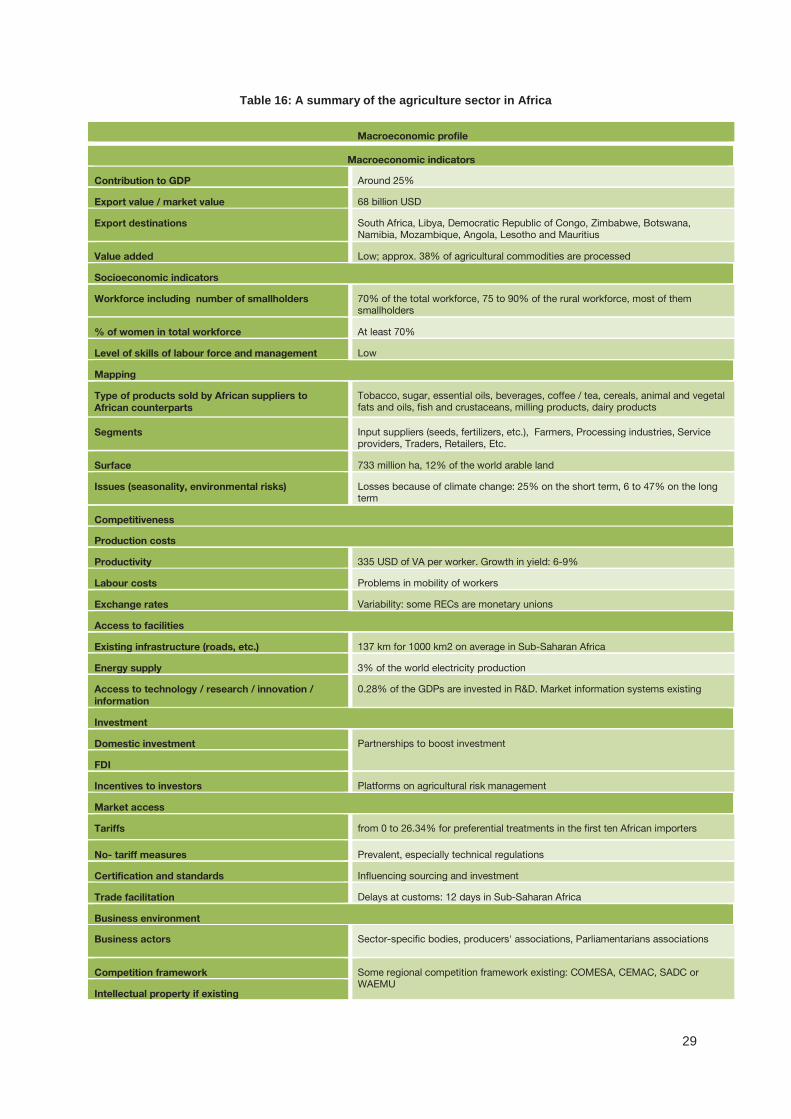
29
Table 16: A summary of the agriculture sector in Africa
Macroeconomic profile
Macroeconomic indicators
Contribution to GDP Around 25%
Export value / market value 68 billion USD
Export destinations South Africa, Libya, Democratic Republic of Congo, Zimbabwe, Botswana, Namibia, Mozambique, Angola, Lesotho and Mauritius
Value added Low; approx. 38% of agricultural commodities are processed
Socioeconomic indicators
Workforce including number of smallholders 70% of the total workforce, 75 to 90% of the rural workforce, most of them smallholders
% of women in total workforce At least 70%
Level of skills of labour force and management Low
Mapping
Type of products sold by African suppliers to
African counterparts
Tobacco, sugar, essential oils, beverages, coffee / tea, cereals, animal and vegetal fats and oils, fish and crustaceans, milling products, dairy products
Segments Input suppliers (seeds, fertilizers, etc.), Farmers, Processing industries, Service providers, Traders, Retailers, Etc.
Surface 733 million ha, 12% of the world arable land
Issues (seasonality, environmental risks) Losses because of climate change: 25% on the short term, 6 to 47% on the long term
Competitiveness
Production costs
Productivity 335 USD of VA per worker. Growth in yield: 6-9%
Labour costs Problems in mobility of workers
Exchange rates Variability: some RECs are monetary unions
Access to facilities
Existing infrastructure (roads, etc.) 137 km for 1000 km2 on average in Sub-Saharan Africa
Energy supply 3% of the world electricity production
Access to technology / research / innovation /
information
0.28% of the GDPs are invested in R&D. Market information systems existing
Investment
Domestic investment Partnerships to boost investment
FDI
Incentives to investors Platforms on agricultural risk management
Market access
Tariffs from 0 to 26.34% for preferential treatments in the first ten African importers
No- tariff measures Prevalent, especially technical regulations
Certification and standards Influencing sourcing and investment
Trade facilitation Delays at customs: 12 days in Sub-Saharan Africa
Business environment
Business actors Sector-specific bodies, producers' associations, Parliamentarians associations
Competition framework Some regional competition framework existing: COMESA, CEMAC, SADC or WAEMU
Intellectual property if existing

30
C: OVERVIEW OF THE VALUE CHAINS OF COMMODITIES HIGHLIGHTED BY THE ABUJA FOOD SUMMIT
Carlos Lopes, Executive Secretary of the United Nations Economic Commission for Africa (UNECA), had
declared: “Africa can feed Africa”131. This assertion could be the rationale behind the selection of nine “continental” commodities and three “regional” ones, most of them being of paramount importance for RVCs. Following on the presentation of the main features of agriculture in Africa in the former chapter, this
section provides a rapid overview on RVCs for these 9 + 3 commodities132. It is mainly an illustration of the general characteristics described earlier.
1. Macroeconomic indicators
Countries and RECs have different positions towards the 9 + 3 sectors. Most RECs have their own
agricultural strategy and place emphasis on commodities, often belonging to the Abuja list. For instance, COMESA places strong emphasis on food staples, including starchy staples, pulses, fresh fruits and vegetables, livestock, fisheries and dairy133. Such commodities are given special attention, from regional
institutions and international cooperation, however some others are overlooked in spite of their being essential to food security, like roots and tubers. In WAEMU / UEMOA, five commodities were selected in 2006 to develop a regional approach: rice, maize, livestock and meat, poultry and cotton. Other important crops for food security and regional trade include millet, sorghum, yam, cassava and pulse crops134.
The market value of these commodities is high. While Africa was said to produce 6.6% of the global agricultural output in 2007135, it could be around 10% today136, and obviously these commodities amount for a large share of this contribution. The total export value of the nine continental commodities is worth
around 15 billion USD (2013)137, but out of this sum, 12 billion USD are exported out of Africa. It has also to be compared with the import value of these commodities, around 31 billion USD in 2013, 10% of which is supplied by African countries.
A large number of African supplying countries are selling these nine commodities to African countries. The ten first African countries exporting them to other African countries are South Africa, Namibia, Egypt, Zambia, Uganda, Morocco, Senegal, Zimbabwe, Côte d’Ivoire and Togo138.

31
Table 17: Supplying countries to African markets for the nine continental commodities
Supplying market Total export value of the Abuja
commodities within Africa
Number of Abuja commodities exported
within Africa
Benin 30641 4
Botswana 65762 2
Burkina Faso 21292 2
Burundi 1 1
Congo 3589 1
Congo Democratic Republic of 5629 1
Côte d'Ivoire 70769 2
Egypt 280178 4
Ethiopia 16016 1
Ghana 30098 4
Guinea Bissau 16873 1
Kenya 40104 6
Liberia 3511 1
Malawi 22316 6
Mauritania 10772 1
Morocco 124311 5
Mozambique 17244 2
Namibia 318610 3
Niger 19280 1
Rwanda 39010 4
Senegal 121927 3
Seychelles 54591 2
South Africa 989150 9
South Sudan 10753 1
Sudan
Swaziland 5017 1
Tanzania 39589 3
Togo 67704 3
Tunisia 52116 2
Uganda 145084 7
Zambia 224378 5
Zimbabwe 105430 2
Source: TradeMap, accessed on 27 November 2014 139
Some countries seem very well integrated in RVCs: for instance, countries selling 5 or more continental
commodities on the continent.
The export values in each country vary from a commodity to another.

32
Table 18: Export value per country for the nine continental commodities
Abuja
commodities
Rice Legumes Maize Cotton Oil palm Beef/ livestock Dairy Poultry Fisheries
HS code in
Trade Map
Rice 1006 Edible vegetables
and certain roots
and tubers 07
Maize - Corn 1005 Cotton 52 1511 Palm oil &
its fraction
0202 Meat of
bovine animals,
frozen
04 Dairy products,
eggs, honey,
edible animal
product nes
0207 Meat & edible
offal of poultry
meat
03 Fish, crustaceans,
molluscs, aquatic
invertebrates nes
Exports to
Africa
249,765 465,219 495,053 239,679 198,598 87,750 626,866 88,026 704,450
Export to
World (total)
409,416 3, 008,684 983,009 210,3184 240,235 145,507 106,4977 91266 396,7569
Imports
from Africa
250,271 438975 429820 207677 215976 77,770 601,235 73,692 766,395
Imports
from world
(total)
5, 166,860 2, 134,713 4, 361,271 425,133 3, 744,034 1, 540,749 544,2940 2, 158,434 3, 571,313
African
exporters to
Africa
South Africa
75,426 South Africa
164,375 South Africa
280,413 Zimbabwe 97,170 Côte d'Ivoire
67,990 Botswana 48,238 South Africa
284,437 South Africa
82,539 Namibia 341,045
Egypt 64,701 Egypt 114,372 Zambia 153,015 Zambia 40,363 Togo 41,819 South Africa
20,354 Egypt 99,495 Namibia 2,333 Senegal 90,435
Uganda 36,965 Zambia 29,908 Uganda 26,750 Burkina Faso
18,782 Uganda 40,344 Namibia 17,332 Tunisia 50,879 Tunisia 1,237 South Africa 66,048
Tanzania 20,004 Morocco 21,056 Morocco 10,849 Benin 15,652 Kenya 13,131 Kenya 1,135 Morocco 47,072 Malawi 887 Seychelles 54,536
Botswana 17,524 Uganda 20,179 Tanzania 8,857 Sudan 10,753 Ghana 11,642 Zambia 424 Senegal 37,490 Ghana 384 Morocco 45,108
Rwanda 12,248 Niger 19,280 Burkina Faso
2,510 Mozambique 8,396 South Africa
7,501 Uganda 237 Uganda 25,514 Morocco 226 Guinea Bissau
16,873
Benin 9,903 Ethiopia 16,016 Rwanda 2,507 South Africa 8,057 DRC 5,629 Rwanda 24 Rwanda 24,231 Kenya 134 Ghana 11,692
Liberia 3,511 Kenya 12,473 Benin 2,429 Malawi 7,758 Congo 3,589 Malawi 2 Togo 20,027 Uganda 95 Mauritania 10,772
Côte d'Ivoire
2,779 Tanzania 10,728 Kenya 2,338 Togo 5,858 Benin 2,657 Senegal 2 Kenya 10,893 Zambia 68 Mozambique 8,848
Malawi 1,599 Malawi 10,370 Malawi 1,700 Swaziland 5,017 Egypt 1,610 Burundi 1 Ghana 6,380 Seychelles 55 Zimbabwe 8,260
Source: Trade Map, accessed on 27 November 2014

33
The first ten export destinations for the nine continental commodities supplied by African markets are South Africa, Libya, Democratic Republic of Congo, Zimbabwe, Botswana, Namibia, Mozambique, Angola, Lesotho, and Mauritius. Only seven countries source more than five commodities of the Abuja list, or more,
from African counterparts.
Table 19: Importing markets sourcing the nine continental commodities from African suppliers
Importing market Total importing value of
the Abuja commodities
Number of Abuja commodities sourced
from Africa
Algeria 45476 2
Angola 119396 5
Benin 26014 1
Botswana 184975 5
Burkina Faso 7688 1
Burundi 8059 1
Cameroon 31521 1
Congo Democratic Republic of 211302 6
Côte d'Ivoire 63446 1
Egypt 42005 2
Ghana 8291 1
Kenya 55688 4
Lesotho 106602 6
Libya 256477 4
Malawi 20995 2
Mauritius 98123 2
Morocco 18697 2
Mozambique 150730 6
Namibia 157816 4
Niger 28457 1
Nigeria 11422 2
Rwanda 38578 2
Senegal 68940 2
South Africa 282053 4
South Sudan 26236 2
Sudan
Swaziland 74593 6
Tanzania, United Republic 49690 3
Togo 23759 1
Tunisia 4372 1
Zambia 56555 3
Zimbabwe 197103 7
Source: Trade Map, accessed on 27 November 2014
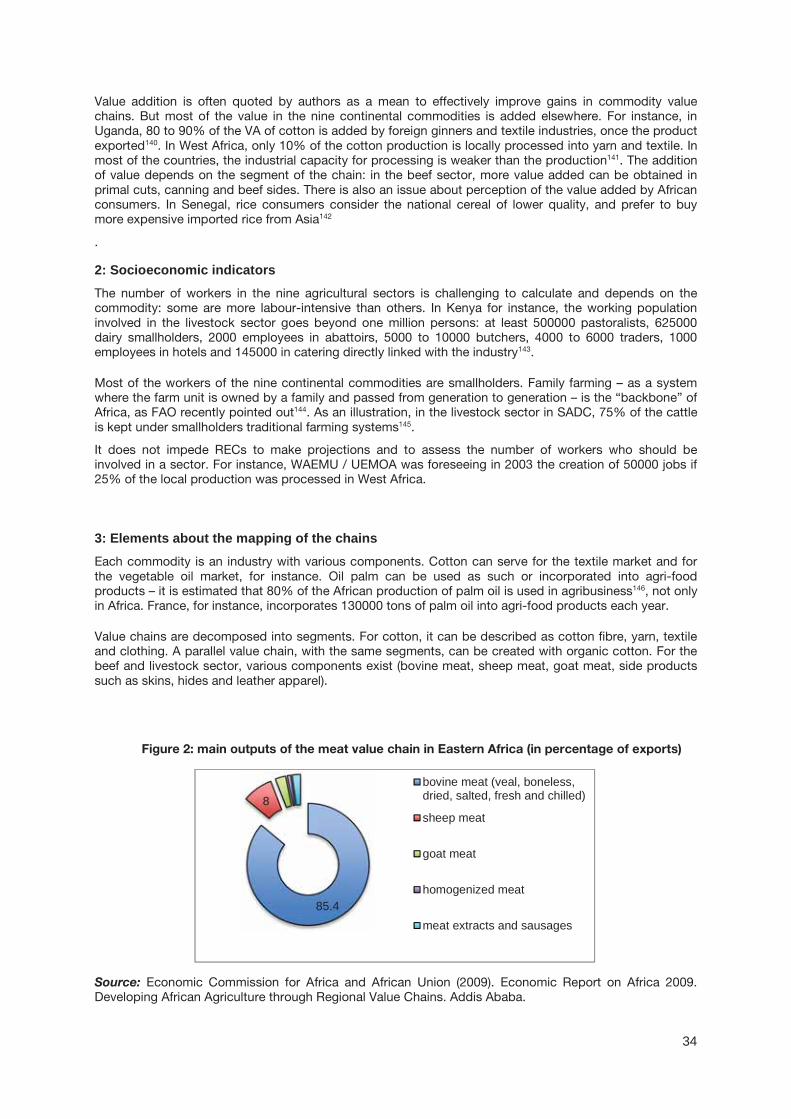
34
Value addition is often quoted by authors as a mean to effectively improve gains in commodity value chains. But most of the value in the nine continental commodities is added elsewhere. For instance, in Uganda, 80 to 90% of the VA of cotton is added by foreign ginners and textile industries, once the product
exported140. In West Africa, only 10% of the cotton production is locally processed into yarn and textile. In most of the countries, the industrial capacity for processing is weaker than the production141. The addition of value depends on the segment of the chain: in the beef sector, more value added can be obtained in
primal cuts, canning and beef sides. There is also an issue about perception of the value added by African consumers. In Senegal, rice consumers consider the national cereal of lower quality, and prefer to buy more expensive imported rice from Asia142
.
2: Socioeconomic indicators The number of workers in the nine agricultural sectors is challenging to calculate and depends on the commodity: some are more labour-intensive than others. In Kenya for instance, the working population
involved in the livestock sector goes beyond one million persons: at least 500000 pastoralists, 625000 dairy smallholders, 2000 employees in abattoirs, 5000 to 10000 butchers, 4000 to 6000 traders, 1000 employees in hotels and 145000 in catering directly linked with the industry143.
Most of the workers of the nine continental commodities are smallholders. Family farming – as a system where the farm unit is owned by a family and passed from generation to generation – is the “backbone” of Africa, as FAO recently pointed out144. As an illustration, in the livestock sector in SADC, 75% of the cattle
is kept under smallholders traditional farming systems145.
It does not impede RECs to make projections and to assess the number of workers who should be involved in a sector. For instance, WAEMU / UEMOA was foreseeing in 2003 the creation of 50000 jobs if 25% of the local production was processed in West Africa.
3: Elements about the mapping of the chains Each commodity is an industry with various components. Cotton can serve for the textile market and for
the vegetable oil market, for instance. Oil palm can be used as such or incorporated into agri-food products – it is estimated that 80% of the African production of palm oil is used in agribusiness146, not only in Africa. France, for instance, incorporates 130000 tons of palm oil into agri-food products each year.
Value chains are decomposed into segments. For cotton, it can be described as cotton fibre, yarn, textile and clothing. A parallel value chain, with the same segments, can be created with organic cotton. For the beef and livestock sector, various components exist (bovine meat, sheep meat, goat meat, side products
such as skins, hides and leather apparel).
Figure 2: main outputs of the meat value chain in Eastern Africa (in percentage of exports)
Source: Economic Commission for Africa and African Union (2009). Economic Report on Africa 2009. Developing African Agriculture through Regional Value Chains. Addis Ababa.
85.4
8bovine meat (veal, boneless,dried, salted, fresh and chilled)
sheep meat
goat meat
homogenized meat
meat extracts and sausages

35
The surface used for the nine continental commodities has increased. It is estimated that 93 million
hectares on the continent are dedicated to cereals, out of which 29% serve for maize, 8.4% for rice and 23.7% for sorghum. The surface area for cotton has recently grown, especially in some countries such as Cameroon where the crop represents 30% of cultivated areas in the North of the country147. Oil palm
spreads over 7% of the agricultural surface in Africa, and represents 39% of the surface dedicated to vegetable oil production. For roots and tubers, cassava production is equal to 48.6% of land under root crops. But according to the specialization of the area, the land can be used for livestock farming, which is
the case for 60% of total land area in SADC148.
The issues linked to seasonality and climate change vary depending on the commodity. A dominance of rain-fed production is observed, especially for sectors such as cotton, cultivated in sub-humid and semi-
arid areas149. Climate change leads to a change in cycles: they are shortened. Oil palm production takes place in tropical humid zones, and its culture is said to affect rain forests150.
4: Competitiveness
(a) Production costs
As discussed earlier, productivity has grown in Africa but it is still much weaker than in other parts of the
world. For instance, growth in yield has reached more than 9% for maize, but is equal to 34% of the world average. Yield in rice is equivalent to 55% of the world average, and 69% for sorghum151. For oil palm, the best yield is around 3.8 tons per hectare, while in Asia it amounts to 6 tons in the best farms. Yield growth in the livestock / meat sector has reached 9%, but there is variation between RECs, especially in SADC
where productivity is considered as low. Productivity in milk production has gained 10%.
In cotton, the increased productivity has recently accelerated. While it was restricted to 0.5% per hectare between 1998 and 2007, it is now worth 6.6% in Southern Africa, and 1.3 kg per hectare and per year in
Cameroon for instance152. In Western and Central Africa, in order to improve yields, a 153part of the sector has decided to turn to organic cotton.
The cost of inputs represents a large share of the incomes and costs in each sector. For instance,
livestock purchasing costs: 65.5 of total chain revenue and costs. When calculating the production costs for a sector like cotton, the charges for land rent, seeds, fertilizers and chemicals, workforce for harvesting and ginning, must not be put aside. Seeds and pesticides are often costly, especially because they have to
be bought from abroad.
Exchange rates variations are an interesting parameter to take into account as well154.
(b): Access to facilities and infrastructures
As underlined earlier, the overall development of infrastructures in Africa is weak and it affects the continental commodities. It is particularly true for transportation: bad road conditions are affecting the export of products in good shape. Shortages in electricity impede a good deployment of processing
industries, for instance in the cotton sector. But the limited access to post-harvest handling technologies (cotton) or animal disease control (livestock) is a major problem. Some technical sector actors are working on more cooperation and sharing of experiences about this, such as the SADC Livestock Technical
Committee for SADC155.
As for the access to services and credit, it is certainly a subject of concern. Regional sector initiatives have been implemented in order to face the lack of funding through credit. For instance, for the cotton sector, in
Western and Central Africa, advance and recovery of credit, based on single-channel input and seed supply, is possible156.
(c) Market access
Market access is generally a major subject of concern for African exporters when planning to export to other continents, as tariffs (even with the preferential treatment due to LDCs, or special agreements such as AGOA157 or EBA) remain a barrier and NTMs are common. However, the level of protection from African
importers towards African suppliers, in the nine commodities, is far from being insignificant: in general, intra-regional exports of the nine commodities face an average tariff of 21.99%158.

36
This is maybe the aspect where the implementation of the CFTA will have more impact. When the CFTA will be operational, no tariff barriers in goods will remain. Various scenarios have been projected by
economists to assess the impact of tariff elimination thanks to a CFTA on African exports. It is expected
that intra-African exports in agriculture will increase by at least 10% by 2022 (the CFTA being implemented as of 2017). This increase is much less important for exports to other destinations (barely positive, or even
negative, for export to other developing countries and developed countries)159.
The experience of the Tripartite Free Trade Area is pertinent in a perspective of scaling up and paving the way for the CFTA. COMESA, EAC and SADC decided in 2005 to establish a tripartite structure, aiming, inter alia, at implementing a single Free Trade Area. This FTA covers 26 African countries, representing
more than half of AU membership, with a combined population of 530 million persons (57% of Africa’s population) and a total GDP representing 53% of Africa’s total GDP160. Prospects would expect a boosting
effect of the Tripartite FTA on regional commerce between the 3 RECs. Few data is available on the matter. According to preliminary findings of pilot experiences separately led on livestock, rice and maize, in ECOWAS and COMESA, intra-REC export increase of 15% on average in livestock can be expected,
while intra-African exports showed growth of 25%. It seems thus that continental trade is more optimal than intra-REC trade. This provides an additional incentive to accelerate the implementation of the CFTA, which should be operational by 2017.
(d) Business environment
Important characteristics of the regional and continental business environment have been provided in the previous section of this chapter, inter alia concerning business actors in agriculture. Other mechanisms
exist, at the regional level (e.g. for dairy products, with the Eastern and Southern Africa Dairy Association (ESADA) or at the national level (Meat Board of Namibia).
As seen earlier, competition frameworks are not fully operational in all RECs.
As for marketing, the existence of RECs encourages the creation of formalized or semi-formalized regional marketing channels. This is particularly true for livestock in SADC161, or to a lesser extent for cotton in
WAEMU / UEMOA. It is relevant to organize a marketing structure at the regional level, as it provides for economies of scale, enhanced coherence and elimination of unnecessary competition. Such marketing channels need funding and institutionalization through regional cooperation to maximize their efficiency.
The regional policy environment for the nine Abuja commodities is generally marked by the upcoming implementation of the CFTA and its impact on the other aspects of continental integration. The existence of RECs could be seen as irrelevant with the arrival of the CFTA, but it is not the case. RECs have a precious knowledge of their regional context and opportunities, which cannot be transferred to a
continental degree, or with costly procedures. For instance, threatened sectors can be supported and revitalized within the context of a REC: that is the case of the cotton sector in Malawi, United Republic of Tanzania and Zambia, which experienced a revival thanks to intra-regional opportunities in COMESA162.
It is also in the context of the RECs that regional technical cooperation projects, often funded by large cooperation partners, can take place. Important agriculture partners such as the World Bank, UNIDO, the Common Fund for Commodities (CFC), the Bill and Melinda Gates Foundation, USAID, or IFAD163 are
targeting commodities belonging to the Abuja list, whether at the regional or sub-regional levels. They do not necessarily use the RECs as supporting or implementing partners, but many technical assistance programmes see the RECs as essential partners for an efficient and result-conducive approach in
agriculture development in Africa.
SUMMARY
This chapter introduced a simplified methodology for the description of agricultural value chains by presenting all aspects of regional production, sales and consumption in agriculture. The subject is far too
vast to be captured in a handful of pages, especially when no field investigation is undertaken to collect first-hand data from stakeholders. However, some relevant remarks can be gathered after this rapid overview of a sector employing 70 % of the African population:
- Though the share intra-African trade in agricultural products is estimated to less than 10%, there are regional value chains in agricultural products in Africa: a supply base exists and the continental demand is growing;
- There are variations in the degree of participation of countries in these chains. Some are well integrated, as importers and exporters for instance. Some others are less integrated, either

37
because of the structure of their economy, or because they tend to source products from other areas;
- There is space to increase value added in exported products. Opportunities exist to further
develop value chains already existing but with a minimum regional component; - Political will is needed to accelerate the development of agricultural RVCs, especially through a
rapid implementation of the CFTA in order to eliminate barriers to trade and provide for economies
of scale.
Chapter 3 will set up a simplified method for value chain prioritization, and thereby identifying at least two commodities, not belonging to the Abuja list, that could be further developed through RVCs in Africa.
38
CHAPTER 3
ESTABLISHING NEW REGIONAL VALUE CHAINS TO ENHANCE VALUE ADDED
IN AGRICULTURAL COMMODITIES AND PROCESSED FOOD PRODUCTS:
SOME KEY ELEMENTS
The purpose of this chapter is twofold: first, it will suggest a way to prioritize regional agricultural value chains to be further developed, based on a review of existing methods and criteria to select promising sectors in a particular area. Then, it will test this approach by screening several social, economic and
environmental indicators for different commodities already cultivated in Africa (and not belonging to the list of commodities selected by the Abuja summit) and selecting two of them, while focusing on developing the addition of value in these sectors.
A: PRIORITIZATION: METHODOLOGIES
The first chapter of this study provided a quick review of publications on, inter alia, value chain analysis methodologies. It showed that almost each development agency has developed its own methodology to
assess the degree of development of a value chain. Most of these publications assume that the sectors to be scrutinized are not pre-selected beforehand. Generally, a government or a partner institution submits a request to a specialized agency with the objective of determining the most promising sectors to be
developed. Then a value chain analysis will study all the aspects of the sector in order to design interventions aimed at improving it.
Pre-selections should be avoided by governments and programmes164, in order not to create bias in
favour of a particular sector. But it is costly and time-consuming to analyse a large bunch of sectors. Generally, a prioritization exercise is undertaken, in order to identify chains with the most promising prospects for economic growth165. Such exercise can be prepared by desk review and analysis, through
national and international references. However, the ideal way is to organize the exercise with the participation of broad range of concerned stakeholders, in order to take into consideration all the different components and possible consequences of the development of a value chain166.
Different methods for rapid sector prioritization are presented below. They include the VC methodologies
reviewed in Chapter 1 of this study, and two other publications which provide a list of priority issues when establishing a value chain.

39
Table 20 Main priority criteria for the identification of value chains to be developed
Agro value chain analysis and
development ( UNIDO)
2009
Economic Report on
Africa 2009 Economic
commission for Africa
and Africa Union 2009
Developing sustainable food
value chain- guiding principles
FAO , 2014
Making value chain work
better for the poor
DFID/MAP 2008
Connecting local
producers in developing
countries to
regional and global value
chains, OECD, 2013
Building Competitiveness
in Africa's Agriculture : A
Guide to Value Chain
Concepts and
Applications, World Bank,
2010
Poverty reduction
Pre requisites Measuring performance Potential of the value
chains to improve
livelihoods of the
poor people
Productive capacity Pre-requisites
Fits in the country's strategy
Refinement of definition of strategic commodities for the region
Economically
sustainable
(profitable) -
economic
impacts
Profits
Jobs/incomes
Tax revenues
Food supply
Present integration of the poor in the market (what are they producing, selling, employment)
Human capital Initial list: combinations and
product category, target markets,
and resulting VC and supply
chains that could be prioritized
Potential for employment
generation
2. Socially
sustainable
(inclusive) -
social impacts
Added value
distribution
Cultural traditions
Nutrition and
health Worker
rights and safety
Animal welfare
Institutions
Potential of the product/activity
for poverty reduction
Standards and certification Market analysis
Number of smallholders in the
sector
3.
Environmentally
sustainable
(green) -
environmental
Carbon footprint
Water footprint
Soil conservation
Biodiversity Food
Potential for labour intensive
technology
Infrastructure
and services
Nature of demand – size

40
impacts loss and waste
Toxicity
Required investments
Improvement of agricultural
productivity and local market
access by smallholders
Understanding performance Low barriers to entry for the
poor (capital, knowledge)
National systems of innovation
Tendencies, segments, potential niches due to seasonality
Entry-barrier levels for poor
agro-processors
Macroeconomic stability and national economic policy coordination
4. Dynamic systems Low risk Transportation, ICT, energy and water
Price tendencies
Geographical location of
producers
Short term regional strategy
5. Governance-centred Poverty incidence and/or
absolute poverty figures
Business environment Customer preferences
Macroeconomic stability and
public governance
Current competitors
Economic growth
Rationalizing business and
financial regulations, including eliminating
trade and barriers
6. End-market driven Market potential Ease of opening a business and
permitting / licensing
Improving performance Strong domestic and/or
international demand for the product
Access to finance Domestic capacity and
economic impact
Contribution to GDP - export
earnings
Simplifying and harmonizing cross-borders regulations and documentation
7. Vision - strategy -driven
Growth potential of certain
products/activities
Trade and investment policy Capacity to competitively respondto opportunities
Potential for domestic /
international demand
Improving regional
infrastructure
8. Upgrading focused Possibility for scaling up Market access
Public and private investment
prospects
Standardizing consumer and industrial regulations
9. Scalable
Potential for leveraging public investment with private investment
Import tariffs Analysis of institution
Potential for market integration
of local SMESs
Long term regional strategy
10. Multilateral Involves a large number of
people
Export-import procedures Analysis of technology
Creating regional institutions to progress
Other criteria, such as Border transit times Analysis of service providers

41
towards common monetary instruments
Promotion of policy changes Identify and develop cross border clusters that have direct dealings with strategic value chains
Value chain actors have
entrepreneurial capacity to
achieve improvement.
Industry-specific policies Analysis of policies
Scaling up potential
Pragmatic aspect
Environmental sustainability Industry institutionalisation industry maturity and coordination
Analysis of production conditions
Extent of value adding potentials
Production cost in comparison to
competitors
Within framework of national and regional strategies
Public private coordination
Available resources and number of
operators
Social inclusion and gender Other factors affecting chain participation of developing countries
Availability of raw materials and
other inputs Labour cost availability and
skill level
SPS Standards and their
implementation
Transport cost quality and regulation in industry maturity including the presence of upstream and downstream chain.
Access to micro finance and micro economic stability , business environment import and export restrictions trade policy
Vulnerability to climate disease and natural disasters

42
Table 21: Main priority criteria for the identification of value chains to be developed
Source: UNIDO (2009). Agro-value chain analysis and development. The UNIDO Approach. A staff working paper. Vienna; Economic Commission for Africa and African Union (2009). Economic Report on Africa 2009. Developing African Agriculture Through Regional Value Chains. Addis Ababa; FAO (2014). Developing sustainable food value chains – Guiding principles. Rome; M4P (2008) Making Value Chains Work Better for the Poor: A Toolbook for Practitioners of Value Chain Analysis, Version 3. Making Markets Work Better for the Poor (M4P) Project, UK Department for International Development (DFID). Agricultural Development International. Phnom Penh; OECD (2013). Connecting local producers in developing countries to regional and global value chains – update. OECD Trade Policy Paper (160). December. Webber, C. Martin (2010). Agriculture and Rural Development: Building Competitiveness in Africa's Agriculture: A Guide to Value Chain Concepts and Applications. World Bank Publications. Washington DC
.

43
B: BUILDING A PRIORITISATION SHEET FOR AGRICULTURAL RVCs
The particular purpose of this report, and the fact that none of the methods presented above is exact science and they can all be expanded or modified to better fit the situation or environment of the analysis167, led to a decision to build a proper list of criteria. The rationale behind the choice of each criterion is explained below.
Table 22: Proposal for a customized assessment sheet to prioritize agricultural RVCs
Economic criteria
Export value in Africa
Growth of market demand in Africa
Contribution to GDP
Start-up costs
Existence of a competitive advantage
Potential for VA growth
Social criteria
Workforce
Potential for income generation
Potential for skills development
Other effects on rural life
Environmental criteria
Impact of the infrastructures needed (existing and future) on the environment
Existence of sustainable certifications and standards
Impact on biodiversity and soil conservation
Regional integration criteria
Potential impact on regional employment
Complementarities between countries
Potential for developing African infrastructures
Potential for innovation and R&D
Source: Author.
1. Economic criteria Export value and its growth on the continent are basic indicators that can be obtained through databases such as Comtrade168 or Trade Map169. Learning about start-up costs consists in gathering information about
the existence of the commodity chain in the area (is there a strong base? How much would it cost to create it?), including the availability of resources and inputs, and the mechanisms and efficiency assessment of the chain. This leads to the evaluation of a competitive advantage, based on the productivity, costs of production, infrastructure and business environment, if such elements are available at an early stage of analysis. As the
focus of the report is about value addition, there will be a particular emphasis on VA.

44
2. Social criteria
Knowing about the workforce – is it a family farming system with smallholders or an extensive farming system with rural employees – and the potential for income growth can help assessing if it is worth putting resources in the VC and if it will affect the fight against poverty in the area. Other impacts, such as the prevalence of
women workers and the possibility of skills development (with the existence of training centres or programmes, for instance), have to be taken into account.
3. Environmental criteria Most of the prioritization methods put a strong emphasis on the economic and financial aspects, without
considering (or only marginally) the social and environmental impacts 170 . As the preservation of the environment is a key issue in agriculture development – e.g. in the attention given to soil regeneration, etc. – it seems evident to include environmental criteria in this assessment sheet. Moreover, many sustainable
certifications and standards exist for agri-food products. They are mainly used for high end developed markets, but as the level of exigency of the African consumers will grow, they will be more and more crucial to continental trade.
4. Regional integration criteria Most of the methodologies for prioritization methods are based on a national perspective or the objective of
national integration into a GVC. For the purpose of this report, a degree of adaptation to the regional context – especially in the situation of the future CFTA – is needed. The choice is put on the synergies between countries (LDC producer vs. importer, intra-REC trade, etc.) and on the maximization of effects at the regional
level (possibility to foster infrastructures at the regional level, potential to create regional innovation centres, etc.).
5. Criteria and their respective weight
The UNIDO methodology proposes to assign weight to each criterion, in order for the appraisal to be rapid and reasoned171. The weight attached to the indicators depends on the importance given to them by the
institution or authority in charge of the prioritization. Each category (economic, social, environmental and regional) is given a weight. Each line is attributed a score (from 1 – low score – to 5 – high score), then a sub-total is calculated and changed into a percentage. A total weighted score is calculated at the end.
This methodology seems efficient and quick for a prioritization based on desk review, as it is the case in this study. The proposed weights are based on the objectives of this study (value addition, regional integration) and are described in the table below.
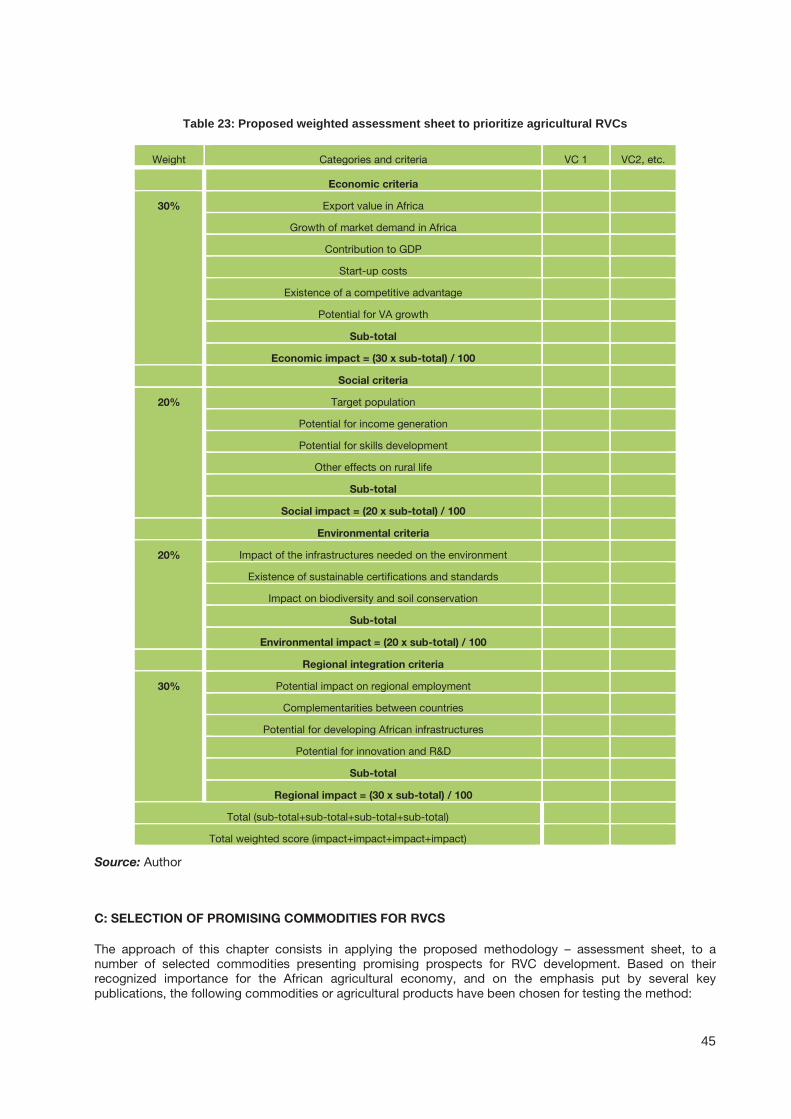
45
Table 23: Proposed weighted assessment sheet to prioritize agricultural RVCs
Weight Categories and criteria VC 1 VC2, etc.
Economic criteria
30% Export value in Africa
Growth of market demand in Africa
Contribution to GDP
Start-up costs
Existence of a competitive advantage
Potential for VA growth
Sub-total
Economic impact = (30 x sub-total) / 100
Social criteria
20% Target population
Potential for income generation
Potential for skills development
Other effects on rural life
Sub-total
Social impact = (20 x sub-total) / 100
Environmental criteria
20% Impact of the infrastructures needed on the environment
Existence of sustainable certifications and standards
Impact on biodiversity and soil conservation
Sub-total
Environmental impact = (20 x sub-total) / 100
Regional integration criteria
30% Potential impact on regional employment
Complementarities between countries
Potential for developing African infrastructures
Potential for innovation and R&D
Sub-total
Regional impact = (30 x sub-total) / 100
Total (sub-total+sub-total+sub-total+sub-total)
Total weighted score (impact+impact+impact+impact)
Source: Author
C: SELECTION OF PROMISING COMMODITIES FOR RVCS
The approach of this chapter consists in applying the proposed methodology – assessment sheet, to a number of selected commodities presenting promising prospects for RVC development. Based on their recognized importance for the African agricultural economy, and on the emphasis put by several key
publications, the following commodities or agricultural products have been chosen for testing the method:

46
- floriculture172 - cashew173 - pineapples174
- avocados175 - tea176 - onion / shallot177
- potato178.
Their degree of priority for the development of RVCs is assessed and summarized in the following table. This this assessment was made out of global desk review; therefore, the information might be missing and
decision bias based on the availability of information might occur. It has to be noted that the following rapid analysis of two sectors aims at illustrating the methodology and at being part of a set on decision instruments for policy-makers, and not at being the unique support in the decision to develop a commodity chain.

47
Table 24: Assessment of priority commodities for the development of VA-oriented RVCs
Weight Categories and criteria Floriculture Cashew Pineapples Avocados Tea Onion / shallot Potato
HS code HS0603 HS 0801 HS 080430 HS 080440 HS 0902 HS 0703 HS 0701
Economic criteria
30% Export value in Africa 3 2 1 1 5 4 4
Growth of market demand in Africa 3 2 4 4 5 2 4
Contribution to GDP 3 3 5 3 2
Start-up costs 3 3 3 3 3 3 3
Existence of a competitive advantage 3 3 2 2 2 2 2
Potential for VA growth 3 4 4 4 5 3 4
Sub-total 15 17 14 17 25 17 19
Economic impact = (30 x sub-total) / 100 4.5 5.1 4.2 5.1 7.5 5.1 5.7
Social criteria
20% Target population 3 4 2 4 2 3
Potential for income generation 3
Potential for skills development 2
Other effects on rural life 2 2 5
Sub-total 3 9 2 2 6 2 8
Social impact = (20 x sub-total) / 100 0.6 1.8 0.4 0.4 1.2 0.4 1.6
Environmental criteria
20% Impact of the infrastructures needed on the environment -1
Existence of sustainable certifications and standards 3 3 3 3 3 3 3
Impact on biodiversity and soil conservation -2 3
Sub-total 3 3 3 3 1 3 5
Environmental impact = (20 x sub-total) / 100 0.6 0.6 0.6 0.6 0.2 0.6 1
Regional integration criteria

48
30% Potential impact on regional employment 4 3 3 2 3 2 2
Complementarities between countries 4 4 4 3 4 3 3
Potential for developing African infrastructures 3 2 2 3 3 2
Potential for innovation and R&D 3 3 3 3 3 4
Sub-total 14 12 12 8 13 8 11
Regional impact = (30 x sub-total) / 100 4.2 3.6 3.6 2.4 3.9 2.4 3.3
Total (sub-total+sub-total+sub-total+sub-total) 35 41 31 30 45 30 43
Total weighted score (impact+impact+impact+impact) 9.9 11.1 8.8 8.5 12.8 8.5 11.6
Source: Author
49
As a result, the following two sectors will be briefly analysed: the tea sector and the potato sector. The modalities for this analysis will follow the main lines highlighted in the quick value chain analysis as discussed previously.
1. The tea value chain: an existing RVC with growth potential at the regional and global levels
Macroeconomic profile
Tea production worldwide was worth 8.17 billion USD in 2012, with an average growth of 6% between
2008 and 2012, but at a slower pace between 2011 and 2012 (1%)179. Kenya is the second largest exporting country in the world, just behind Sri Lanka, and the first for black tea180. Other regional producers were in descending order Rwanda, Zimbabwe, Malawi and the United Republic of Tanzania. Burundi, Madagascar, Uganda, DRC, Mozambique, South Africa and Zimbabwe are involved as well in tea
export181. Together, these producers account for more than 15% of the world output.
The domestic market is key, amounting to 10 to 30% of sales182. Various programmes are trying to boost consumption in Eastern African countries. As for continental demand, it is extremely important as well,
with Morocco among the world top exporter183, but also Sudan, Somalia, Djibouti, Nigeria or Egypt. Continental demand is said to be worth around 20% of sales of Kenyan tea184.
Potential to boost value added is high in the tea sector – e.g. most of the tea from Eastern Africa is
exported in bulk shape. Several opportunities exist:
- In packaging, more processing can be done to export smaller, branded retail packages, or packing into tea bags, instant tea and ready-to-drink beverages
- In product diversification, niche markets can be attained by producing more green tea or flavoured tea, or tea with health benefits, such as the Zimbabwe’s Makoni or the South Africa’s Rooibos
- In certification and standards, the interest for organic tea or Fairtrade-labelled tea is growing
among domestic consumers, ready to pay a higher price.
The workforce is mostly composed of smallholders: they are approximately 450000 in Kenya185. They are said to be among the small-scale tea farmers that are the highest paid in the world, with a growth in
income having risen by 12.5% in 2012186. The chain in Kenya is well structured, and is even seen as “one of the most successful cases of smallholder farmer inclusion in a VC”187. The farmers sell their tea to buying centres (around 4000 in total in the country), which are in charge of quality control and
transportation to one of the 63 tea factories in Kenya (around 60 buying centres for each factory). Committee members of the buying centres are elected from the farmers, and some members of the factory board are elected from the buying centres committee members. The factories are owned by
farmers: 150000 farmers are shareholders of the Kenyan tea factories.
Then, the tea factories own the Kenya Tea Development Agency (KTDA), a private company since 2000. All tea farmers in Kenya are required to sell their output through KTDA. Most of the tea is sold in auction in Mombasa, but a growing part is sold directly to tea packers, including national ones. One of them, Kenya
Tea Packers (KETEPA), is even indirectly owned by farmers, as it has KTDA as one of its major shareholders. KTDA is also responsible for providing inputs to farmers and human resources services for the factories.
As a result, Kenyan tea growers capture around 75% of factory-gate tea price, while farmers in Rwanda, Uganda and Tanzania obtain only 25% of this price188. However, the system is not exempt of problems, with small holders increasingly unsatisfied with the payment structure imposed by KTDA, its non-
transparent communication and its business strategy189.
The tea sector is therefore quite structured and its governance chain is well installed, at least in Kenya. Other tea boards exist, such as the Tanzania Tea Board or the Office du Thé in Burundi. The East African
Tea Trade Association is also an actor intervening in the VC. The sector can be said to act already regional, as Kenya’s auction centres market domestic tea and tea from the sub-region (mainly from
Burundi, Rwanda, DRC, Uganda, Madagascar, United Republic of Tanzania, Malawi and Mozambique)190.
In the tea sector, inputs and raw material are locally or regionally purchased, and there is no known issue concerning a problematic availability of inputs. However, the cost of inputs is rising191.
The VC segments are quite different between green tea and black tea.

50
Figure 3: Differences in processing green and black tea leaves
Source: Economic Commission for Africa and African Union (2013). Economic Report on Africa 2013.
Making the Most of Africa’s Commodities: Industrializing for Growth, Jobs and Economic Transformation. Addis Ababa.
2. Competitiveness Production costs have risen in the recent year, to reach a growth of 15% in 2012. This is mainly due to
energy costs, which are estimated to be at least 30% of the production costs. Improving sourcing of energy to buy a cheaper and more predictable energy (e.g. hydro-energy) would increase the producers’ margins192.When exporting to continental destinations, tariffs remain an issue.
Table 25: Tariff applied to tea exports from the 3 main African suppliers by their top 5 African markets
Kenya Uganda Rwanda
Importers Tariffs Importers Tariffs Importers Tariffs
Egypt 0 Kenya 0 Kenya 0
Sudan 0 Sudan 2 Uganda 0
Nigeria 5 DRC 20 Tanzania 0
South Africa 14.77 Chad 30 DRC 20
Somalia n.a. Rwanda 0 Burundi 0
Source: Trade Map, accessed on 30 November 2014
The table shows that African tea exporters are still heavily impacted by tariffs applied by their buyers. Tariffs in tea can amount to 30% and more. For instance, Morocco, the 14th largest tea importer in the world with 167.4 million USD in 2012193 and importing 283,000 USD of black tea from Kenya in 2013,
imposes to Kenyan tea a tariff of 32.5%.
Green tea
Tea leaves heated
Tea leaves rolled or twisted
Tea leaves dried
Black tea
Tea leaves withered / partially dried
Tea leaves rolled up or cut
Tea leaves fermented
Tea leaves dried
Tea leaves sorted by size

51
Table 26: Tariffs applied by Morocco for the product 090240
MFN 32.5
Preferential tariff for AGADIR countries 0
Preferential tariff for Algeria 0
Preferential tariff for LDC 0
Preferential tariff for Libya 0
Preferential tariff for the League of Arab States 0
Source: Market Access Map, accessed on 30 November 2014
3. Potential to develop VA in the tea RVC
The tea RVC is an adequate sector for VA development: it has a strong macroeconomic profile, including a strong regional and domestic market; a regional production capacity internationally competitive; and a
favourable business environment, with a governance chain well established in the leading country and replicable in other territories, and the arrival of the CFTA which will foster continental integration.
Current drawbacks are:
- the heavy tariffs imposed by some important continental buyers. - the rather unstable international demand, which can be compensated by a faster development of
continental sales.
- the high costs of production, especially due to insufficient infrastructures in energy supply. - the threats posed by climate change, which will soon oblige to redesign the tea growing map in
Eastern Africa194.
According to the Economic Commission for Africa195, upgrading trajectories for commodity value chains can be organized around four blocks:
1- processes: increasing the efficiency of internal processes. 2- products: introducing new products or improving existing ones.
3- functions: changing the mix of activities or moving to different links in the value chain. 4- chains: moving to a new value chain..
An analysis of VA growth potential against these four blocks seems pertinent. It could be196:
1- Processes: in Kenya, the difficulties linked to the KTDA monopoly and methods should be solved, through consultations and dialogue supported by the government. However, the system, which gives an important place to smallholders, could be improved and scaled up at the regional levels:
i.e. by creating or reinforcing national tea institutions and participatory mechanisms, and strengthening existing regional ones. A clear organizational scheme at the regional level could be proposed and sustained contacts established. Development cooperation and aid for trade
mechanisms could be instrumental in this regard: aid for trade funds are often used for institutional strengthening, and examples exist in the tea sector (e.g. a programme by the French Agency for Development – AFD – to reinforce the trading capacities of the Burundi tea structure, the Office du Thé du Burundi197). A strong regional institutional mechanism could take the lead in
designing a marketing strategy, oriented towards boosting regional consumption and promoting
the sector at the continental level, e.g. by campaigning for an early eradication of high tariffs in importing markets.
2- Products: the regional processing of new outputs could be developed. New products could
including ready-made beverages, green tea, flavoured tea and better-packaged or conditioned teas. Such products should be ahead of the curve in certification and standard requirements, as transnational corporations have been pushing increasing pressure on tea factories on
sustainability standards in the recent years198. Seeking standards and certification opportunities is relevant at the regional level, as regional cooperation can help identify best practices to allow economies of scale. Furthermore, regional cooperation, as seen earlier, can be instrumental in the
promotion of regional certification standards targeting the African consumers. It can also support

52
the securing of intellectual property rights and trademark protection199 for specialty tea products, such as teas with particular health benefits.
3- Functions: linkage development can help maximize positive externalities derived from cooperation
between firms and institutions. A linkage development strategy has to be carefully designed, after a thorough examination of the sector and its segments. At first glance, the tourism sector seems to be a value chain with which the tea sector could have benefits creating an alliance. The number
of foreign visitors in East Africa has been steadily increasing in the recent years, amounting to more than 5 million200. The total GDP of the travel and tourism sector in Africa reached 75 billion USD in 2013201. Tea is already marketed to tourists as a souvenir, but emphasis could be put on
the local production and the sustainability certification. Tours to tea growing communities, visits to sustainable tea factories, etc., could be potential by-products providing additional income for farming communities.
4- Chains: the creation of a new VC does not seem relevant here, however, developing organic tea could be assimilated to setting up a new, parallel VC to traditional tea production.
4. The potato value chain: a promising RVC with food security benefits
Potato is “more than an ordinary food for the poor” and provides solid nutritional benefits202. 2008 was
celebrated as the International Year of the Potato, in a context of upheaval in international food markets, leading to a re-assessment of the crop as a source of food, employment and income203. The potato production is rapidly increasing in developing countries, with a growth of cultivated areas of 25% between 1997 and 2007204. In Africa, the increase over the same period has reached 50%205. According to Trade
Map, the total export value of potato production in Africa (exports to world + exports to Africa) reached 369 million USD in 2013, with a relative increase since 2009; while at the same time, imports from world reached 432 million USD.
African main suppliers are South Africa, Ethiopia, Morocco, Namibia, Tunisia, Kenya, Egypt, Rwanda, Nigeria and Swaziland. Nonetheless, the potato value chain is often said to be promising in Western Africa, with production amounting to more than 156,000 tons a year (8% of the total production in SSA) for the
five leading producing countries: Mali, Niger, Guinea, Senegal and Burkina Faso, as well as Mali accounting for more than 70% of the total production. A Central African country, Cameroon, is also a leading potato producer206. Potato is identified as a priority sector in National Agricultural Investment
Programmes by the governments of Mali and Senegal207. However, it has to be noted that potatoes cultivated in West Africa are mainly sold on local markets; inter-regional trade is still weak208
For most of West African producers, potato is a cash crop209. However, its nutritive value and its importance for food security are undeniable. Thus some experts highlight the “twin role of potato”, a staple
food crop for household consumption and food security and a cash crop210. As the population is growing in the region – probably 450 million persons to feed in Sahel and West Africa by 2030211, cultivation of efficient staples crops, with potential for additional revenues if sold to other continental markets, is
particularly relevant. Consumption is mainly urban; however, except The Gambia, Mauritania, Senegal, Côte d’Ivoire and Nigeria, consumption is not very well developed212.
Women play an important role in the VC. They represent more than a half of the producers in Guinea, and
are the most active in the commercialization process213.
The potato sector in West Africa has reached a critical level of output, making processing viable. Hence the potential for adding value exist:
- In packaging and storing potato production - In product diversification, since potato can be sold chilled, cut, prepared, or incorporated in food
preparation (frozen or dehydrated potato products ; chips – the main use of potato in the processing sector214, crisps)
- In certification and standards: according to Market Access Map, 27 voluntary standards could potentially apply to the cultivation of potato in Africa, exported in Africa.
The potato VC can be decomposed as follows:

53
Figure 4 : basic representation of the potato value chain in West Africa
Source: Centre pour le Développement de l’Entreprise (2009). Guide technique de la culture de la pomme de terre en Afrique de l’Ouest. October; FAO and CFC (2010). Strengthening potato value chains.
Technical and policy options for developing countries. Rome.
5. Competitiveness
Start-up costs are said to be quite important. It is important that the producer carefully assess the market potential before setting or extending production areas215. It seems that production costs have been rising
by 5 – 10% per year216 in the recent period. Seeds represent the main production cost (40 – 60% total production costs).
Yields in potato production have been growing these last years. One of the main benefits of potato
growing in West Africa is that the crop can be cultivated during the rainy and dry season. Average yield reach 22 tons per hectare in West Africa217, but some varieties introduced in the sub-region could give up to 27 – 38 tons per hectare218.
Most of the production is based on rain-fed agriculture. However, the irregularity of rain in the Sahel area
remains an issue219. Potato is the plant producing the biggest quantity of food per soil occupation day;
Inputs: seeds and fertilizers
Cultivation
Harvesting and post-harvest
handling
Commercialization
Processing into food products
Storage
Consumption
54
comparatively, it needs less work and less water220. Nonetheless, often motorized pumps are needed to pump water from streams and rivers, resulting in an increase in production costs221.
The weakness and the inadequacy of infrastructure such as storage facilities, remains a problem222; it
leads to bad conservation and quality of sold crops. Transport costs and the need for appropriate handling remain a major constraint for smallholders.
As it is the case for other commodities, access to credit is problematic. However, there are differences in
prices, depending on the season and the distance for delivery. Prices are highest in August – September (inter-season), and in December – May (dry season)223.
As for other commodities, market access is not free of charges. For a country potentially exporting
potatoes, like Mali, protection rates can reach 50% on the continent (by Angola) and are on average between 20 and 30%.
6. Potential to develop VA in the potato RVC
The potato RVC in West Africa is an interesting sector, because of its interest for food security and as a
compensatory mechanism against volatile cereal prices224. It draws attention from the development cooperation sector, with technical cooperation projects being implemented by development partners such as FAO, the Common Fund for Commodities (CFC) jointly with European Co-operative for Rural
Development (EUCORD), or smaller-scale NGOs. It has not been given special emphasis in the Abuja selection of commodities, and it has space to develop its potential for value addition.
Current drawbacks encompass:
- the conditions of production, largely depends on rain-fed agriculture.
- the supply of seeds and inputs. - the technical skills of producers, especially in terms of post-harvest handling and pest
management.
- the development of a regional demand. - the lack of infrastructures for adequate storage and value-adding processing.
The same four blocks used above for the tea sector will serve as a framework for the analysis of a possible
VA optimization strategy for the potato sector in West Africa.
1- Processes: institutional strengthening in the sector should be sought, by building or reinforcing potato growers associations and federations. Some of them exist at the local level, for instance,
the Farmer Federation of Fouta-Djallon (FPFD) in Guinea. However, their existence at the national level should be fortified. Contacts and leakages with the regional structures of producers, like ROPPA, could be developed. These institutions could potentially lead changes in several segments of the chain, like fostering policy decisions on developing adequate storing or
processing units, promoting policy coordination, improving transportation conditions, or designing a regional marketing channel. They should be instrumental in the development of national and regional markets, like broadcasting promotion campaigns aimed at boosting regional
consumption. If there are surplus, they could provide advice on export procedures towards other countries of the continent. The regional level is also pertinent to organize training and skills development among producers and to disseminate the results of research; and research is
particularly active in the potato sector, with the International Potato Centre based in Quito (Ecuador) and research programs of the Global Agricultural Research Partnership (CGIAR). Exchange of best practices with other developing countries – for instance, Latin American
countries which have the strongest potato cultivation and consumption culture, or Asia where consumption is rapidly growing – could be helpful. The development of local seed production and an increase in yield are also crucial to the sector.
2- Products: there is space for the development of new potato products in West Africa. First, the consumption potato (with local varieties for instance) could be developed. Then, the processing into chips, potato flours, food preparations and other edible products should be developed. In
Eastern Africa, potato chips are the main output of processing industries and their rapid growth is due to changes in eating habits and growing urbanization and tourism225. West Africa is likely to follow the same trends. Research programmes and households surveys could tell what could be
the outputs of potato processing industries. Furthermore, these products – as well as potato crops – need packaging; a packaging industry could be further developed, along with an efficient marketing channel.

55
3- Functions: linkages with other agricultural sectors can be found. For instance, the onion sector, strong in West Africa, could benefit from a stronger packaging industry. A linkage development strategy should be carefully developed. The tourism sector (Senegal, Cape Verde) and the
expatriate segment (Nigeria) could provide interesting opportunities.
4- Chains: moving to a new value chain does not seem necessary. However, developing a stronger
sustainability certification culture – and therefore, a parallel VC – could be instrumental to tap into new high-end markets, like the tourism market or the urbanized middle class.
SUMMARY
This third chapter briefly discussed two “new” potential RVCs that could be developed. It is hoped that its logical and progressive structure will provide policy-makers with mechanisms to better understand the
prioritization of value chains, a process which has to mix research, participatory assessment, field investigation and political will. The methodology presented here is only an introduction.
This chapter also presented the two potential RVCs as perfect illustrations of the benefits that the CFTA
should provide. For the tea sector, the main gain could be the elimination of tariff barriers at the continental level, allowing Eastern African countries to freely sell to expanding markets out of their RECs. For the potato sector, one of the principal advantages lays in the fact that policy coordination and dialogue
will be enhanced through the CFTA, providing for a better strategy towards trade development and food security. In a nutshell, chains as different as tea and potato will equally benefit from the implementation of the CFTA.
Eventually, the CFTA will support the strengthening of a coherent continental market potentially able to
fulfil all its needs in food and agri-food products.

56
CHAPTER 4
RECOMMENDATIONS FOR FOSTERING AND ESTABLISHING REGIONAL
VALUE CHAINS IN AGRICULTURAL COMMODITIES AND PROCESSED FOOD
FOR AFRICA
This study was intended to provide an overview of existing value chains in agricultural commodities in Africa and to select promising ones, with a particular focus on the incremental creation of value linked to the upcoming implementation of the CFTA. As nine commodities (selected by the AU in 2006 in Abuja)
plus two (prioritized through a new methodology) have been scrutinized, it is logical that the conclusion of the study provides a digest of potential policy recommendations and guidelines in order to move forward with the “scaling up” and “moving up” exercises in value chains.
A number of policy recommendations have already been provided in the study, especially in its third chapter about potential RVCs. Most of them are sector-specific and will not be repeated in this chapter. It seems useful to prepare a kind of compendium of general recommendations targeted at policy-makers willing to address the challenges to agricultural development in Africa. This compendium is mostly focused
on the regional and continental levels.
As the value chain approach has been the underlying principle of this study, it is logical to use the VC methodology to organize the recommendations.
1. Interventions at the “macro” level A VA optimization strategy in agricultural commodities and agri-food products would require interventions on a large bunch of categories and sub-categories of the VCs.
A first group of recommendations would concern productive capacities: while productivity and yield-enhancing techniques should be promoted, the protection of environment should not be ignored. The issues of degraded land, land property issues, water management and quality of fertilizers should be at the
core of discussion on boosting productivity226. A steady supply of inputs, in qualitative and quantitative terms, should be secured227.
However this would be possible only if sector actors are strong, aware and capacitated. Therefore – and
particularly in the context of enhanced integration with the establishment of the CFTA – the creation and strengthening of specialized structures should be developed. It is crucial to create multi stakeholders structures in sectors where none exist (like some roots and tubers)228, to strengthen farmers’ organisations
and trade associations, but also to involve actors at the policy-making level. This can be done by fostering or setting up the national agriculture committees in national and regional Parliaments, and by organizing “value chains sessions” at important continental events a such as meetings of the AU or UNECA229. As policy-makers are responsible for the implementation of cross-sector or sector-specific programmes, such
as the AIDA, the programmes for infrastructure development or the Maputo commitments, it is crucial that they are aware of issues and evolutions, and that they are connected to professional groups. The lobbies in agriculture are often under-capacitated and in need of skills development; capacity-building activities
exist but should be fostered, maybe at RECs level first, and extended then at the continental level. Exchange of best practices could be sought with other continents – Asia, and Latin America.
Capacitating professional associations will allow them to better understand policy-making decision
processes, impact of the CFTA and will enhance their role in agricultural policy negotiations. Capacitating policy-makers will facilitate the comprehension of sector-specific problems and the resolution of blockages and protests at the national and regional levels.

57
2. Interventions impacting competitiveness
Competitiveness is the largest group of recommendations when the scope is on value chains. For instance, when asked about the most effective ways in helping developing countries to better participate in GVCs, business leaders talk about infrastructure development230, which is an important sub-category of
the competitiveness aspect of value chains. Trade facilitation, barriers to investment and access to information are other decisive issues in the competitiveness pool.
The costs of production could be monitored by the concerned institutions strengthened at the national, regional and continental level. By securing a steady access to inputs and encouraging the development of local inputs (by establishing a fertilizer factory, for instance), governments or professional groups will help mastering the costs. To control the costs, free movements of goods and workers is crucial. This is where
the involvement at the political level is key, and governments and RECs need now to operationalize the existing policies or protocols on free movement of people and labour migration231.
Skilled labour migration is relevant if skills are largely recognized. Thus agreements on mutual recognition
of qualifications and competences, oriented towards agriculture, are needed232.
3. Access to facilities and information Infrastructures are one of the major blocking points in developing trade, whether regionally, continentally
or internationally. Many actions plans and implementation strategies for Africa have been prepared and agreed on the issue. A Programme for Infrastructure Development in Africa (PIDA) exists. Its implementation should be prioritized and operationalized233. Road infrastructure, energy and water supply
are common constraints to producers and processors; tackling these issues at national, regional and continental level will incrementally help the addition of value in agricultural VCs.
Information is power. Almost all the actors of the agricultural VC in Africa lack adequate access to
information -- either farmers, with prices or weather information; the processors, with export information; the professional associations; or the policy-makers. It should be a priority to develop or strengthen and generalize information systems. Some Market Information Systems exist but should be given attention and
adequate resources (funding, staff, etc.). Alternative systems (by mobile phone, radio, etc.) should be expanded. Considering these issues at the regional or continental levels could allow economies of scale and enhanced coherence.
Macro-information on value chains is also key. Often countries and RECs depend on donors to obtain
information about the value chains to be prioritized, the good practices implemented and the ones to be avoided234. An endogenous capacity on VC should be created and disseminated. Channels already exist, with networks and associations. They should be identified and fortified.
Access to information is also about access to research findings. Currently, funding on research is scarce and should be increased to 2% of agricultural GDP235. Regional centres of excellence of agricultural research could be strengthened when existing, and created where there is none236.
4. Investment and funding Accessing to funding and investment is currently challenging, especially for smallholders. Investment should be boosted, but safeguards should be given to investors. Current initiatives on risk information and
management are promising, but more needs to be done, for instance by encouraging investments through established frameworks for the strengthening of regional and continental complementarities237.
Tax and investment incentives should be created, but foreign and national investors should be assured
that no non-technical barriers, such as corruption, will interfere with their investment. Tax incentives and progress towards the transparency of the regulatory environment could be promoted. In fostering large-scale investments, the promotion of public-private partnerships schemes is pertinent.
Access to credit is often denied to agricultural producers – especially smallholders. Policy-makers and professional associations should lobby for a better access to credit, to buy inputs or to modernize their production systems. RECs and governments could be instrumental in establishing finance institutions, including cross-border ones, to fund micro-credit for producers and exporters238.

58
5. Market access
The main immediate gain of the CFTA implementation will be the abolition of tariffs, allowing for the effective creation of a continental market. However, special attention should be given to non-tariff barriers and quantitative restrictions in food products. The creation of an Africa marketplace is feasible, given that
trading interests of countries are not necessarily confined to the borders of their RECs (this was evidenced by some results of the brief value chain analysis in this report) and that tariffs will soon be part of history.
However, the eradication of tariff is a fear for many economic actors on the continent. For some of them, it
is true that the establishment of the CFTA will have short-term adverse impacts239. This is the reason why adjustment mechanisms should be put in place, to address the adjustment costs such as revenue shortfalls240 and industry decline.
But market access is not only about tariffs. It is also about trade facilitation and custom procedures, that
will not be automatically abolished by the establishment of the CFTA. Important efforts should be put at the continental level to harmonize procedures and to reduce delays, by standardizing the nature of the required documents, for instance, or promoting the use of ICT in this area with online hubs about trade
procedures, transportation and custom documentation241. The fight against illegal practices, such as road blockages or illegal fees at customs offices, could be strengthened.
Standards and certifications are part of market access issues. Regional standards, when existing, should
be disseminated, explained and understood by chain stakeholders. New ones should be developed, to promote inclusiveness in productive processes and sustainability in consumption.
6. Business environment The improvement of the business climate environment is also quoted by business leaders as one of the priorities to develop inclusive VCs242. This can be done by several actions. First, securing contractual arrangements and business models, will automatically foster investment and improve levels of trust
between different economic actors. But the dialogue between stakeholders, through forums, fairs, events or other mechanisms (Chambers of Commerce, Chambers of Agriculture) should be dramatically expanded.
Awareness actions among populations, on the importance of agriculture for local development and the respective roles of the VC actors, could globally contribute to a better business environment
It is also through joint marketing that the business climate will improve, if it results in an increase of sales. And the regional and continental levels are particularly relevant for that. Sector marketing strategies could
be developed first at the regional, than at the continental level. Electronic vectors of communication (Internet campaigns) and traditional means (TV or poster announcements) could serve.
7. The role of international organizations International organizations, particularly continental ones or trade-oriented ones like UNCTAD, can play an important role in supporting the African continent for the development of viable and sustainable agricultural VCs. Many organizations, including UNCTAD, have been a long-standing development partner
of African countries, RECs and the African Union.
The study opened with criticism towards the capacity of development partners, and particularly UN agencies, to design and promote a single concept of value chain. This is a concrete action that
international organizations could take: organizing rapidly a task force or a committee in order to harmonize views and methodologies on the VC concept. This does not mean abolishing differences and expertise of each organization. Every organization has its scope, its experience and its competence. But the growing
interesting for VC calls for an inter-organization standing mechanism to share knowledge, concepts and experience on the concept. It could also aimed at disseminating VC knowledge, and ensuring that VC knowledge created within the UN system is turned into concrete and efficient policy interventions243. If
adequately designed and equipped, it will eventually avoid overlaps and join the voices calling for an enhanced efficiency of the UN development system.
International organizations could also be instrumental in fostering and mandating research on relevant topics. As the emergence of regional chains is a relatively new trend244, a better understanding of their
mechanisms and benefits would require more statistical research and field investigations. This would eventually feed policy interventions and RVC development.

59
This list of possible policy interventions is not exhaustive, and should be customized and adapted to each commodity, each segment, or each level of focus (national, regional or continental). It however provides a basis, some food for thought. As the Economic Commission for Africa recently highlighted, developing
regionally integrated VCs and markets is both feasible and important245, and this study is an attempt to contribute to the process.

60
REFERENCES
AFD, CIRAD and FIDA (2011). Les cultures vivrieres pluviales en Afrique de l’Ouest et du Centre Elements
d’analyse et propositions pour l’action. A savoir (06). May.
African Development Bank (2013). Agricultural Value Chain Financing (AVCF) and Development for Enhanced Export Competitiveness. Tunis.
African Union (2006). Resolution of the Abuja Food Security Summit. Addis Ababa.
African Union Commission and Economic Commission for Africa (2012). Boosting Intra-African Trade. Issues Affecting Intra-African Trade, Proposed Action Plan for boosting Intra-African Trade and Framework for the fast tracking of a Continental Free Trade Area. Addis Ababa.
Benin, S., Kennedy, A., Lambert, M., McBride, L. (2010). Monitoring African agricultural development processes and performance: A comparative analysis. ReSAKSS Annual Trends and Outlook Report 2010. International Food Policy Research Institute (IFPRI).
Centre pour le Développement de l’Entreprise (2009). Guide technique de la culture de la pomme de terre en Afrique de l’Ouest. October.
Chen, Y. (2011). Literature Review – Value Chains. George Washington University – IDS Capstone project.
European Parliament, Directorate-General for External Policies, Policy Department (2014). African, Caribbean and Pacific (ACP) Countries’ position on Economic Partnership Agreements (EPAs). Brussels.
Economic Commission for Africa and African Union (2013). Economic Report on Africa 2013. Making the
Most of Africa’s Commodities: Industrializing for Growth, Jobs and Economic Transformation. Addis Ababa.
Economic Commission for Africa and African Union (2009). Economic Report on Africa 2009. Developing
African Agriculture Through Regional Value Chains. Addis Ababa.
Economic Commission for Africa, African Union and African Development Bank (2013). Assessing Regional Integration in Africa (ARIA VI): Harmonizing Policies to Transform the Trading Environment. Addis
Ababa.
Economic Commission for Africa, African Union and African Development Bank (2012). Assessing Regional Integration in Africa (ARIA V): Towards an African Continental Free Trade Area. Addis Ababa.
Economic Commission for Africa (2012). Livestock value chains in Eastern and Southern Africa: a regional perspective ECA-AUC-FAO. Powerpoint presentation. Addis-Ababa.
Economic Commission for Africa, Sub-regional office for West Africa (2012). Regional Integration : agricultural value chains to integrate and transform agriculture in West Africa. Niamey.
Economic Commission for Africa, Southern Africa Office (2010). Agricultural Input Business Development in Africa: Opportunities, Issues and Challenges.
European Union (2013). Using trade to promote development in countries in Sub-Saharan Africa, the
Caribbean & the Pacific.
FAO (2014). Developing sustainable food value chains – Guiding principles. Rome.
FAO (2007). Governance, coordination and distribution along commodity value chains. Commodity and
Trade proceedings. Rome.
FAO and CFC (2010). Strengthening potato value chains. Technical and policy options for developing countries. Rome.
FAO and IFAD (2013). Rebuilding West Africa’s food potential: Policies and market incentives for smallholder-inclusive food value chains. Rome.
GTZ (2008). ValueLinks Manual. The Methodology of Value Chain Promotion. January.
ICTSD (2013). Special Edition. Aid For Trade: Into the future. Bridges Africa. Trade and Sustainable
Development News and Analysis on Africa. 2 (4). July. Geneva.
ICTSD (2013). Tackling Africa’s trade challenges. Bridges Africa. Trade and Sustainable Development
News and Analysis on Africa. 2 (1). March. Geneva.

61
IFAD (2010). Rural poverty report 2011. New realities, new challenges: new opportunities for tomorrow’s generation. Rome.
ITC (2013). LDCs and Global Value Chains: Using Aid for Trade to Seize New Opportunities. Technical
paper. Geneva.
ITC (2013). Improving Africa’s Cotton Value Chain for Asian Markets. Technical paper. Geneva.
ITC (2012). The participation of LDCs in value chains. Geneva.
ITC (2012). Africa’s trade potential. Export opportunities in growth markets. Technical paper. Geneva.
ITC (2009). Medicinal plants and extracts. Market News Service. Geneva, December.
ITC (2008). Sector Analysis for Value Chain Development. Geneva, June.
ITC. Export potential assessment. Identifying priority sectors and attractive markets for better targeted export promotion actions.
IRD (2013). Sciences au Sud. 72. Novembre – Décembre.
Lavigne Delville, P., (2014). “Les Africains resteront-ils maitres de l’amenagement de leur territoire et les
paysans de leurs terres ?”. Débats et controverses (9), 2014 (1). GRET. Nogent-sur-Marne.
M4P (2008) Making Value Chains Work Better for the Poor: A Toolbook for Practitioners of Value Chain Analysis, Version 3. Making Markets Work Better for the Poor (M4P) Project, UK Department for International Development (DFID). Agricultural Development International. Phnom Penh.
Mitchell, J., Keane, J., Coles, C. (2009). Trading Up: How a Value Chain Approach Can Benefit the Rural
Poor. ODI. London, December.
Morris, M., Kaplinsky, R., Kaplan, D. (2012). One Thing Leads To Another. Promoting Industrialisation by Making the Most of the Commodity Boom in Sub-Saharan Africa.
OECD (2013). Connecting local producers in developing countries to regional and global value chains – update. OECD Trade Policy Paper (160). December.
OECD, World Trade Organization (2013). Aid For Trade 2013: Connecting to value chains.
OECD, World Trade Organization (2013). Aid for Trade and Value Chains in Agrifood.
Proctor, F., Lucchesi, V. (2012). Mapping Study on Value Chain Initiatives in ACP regions. Technical Centre
for Agricultural and Rural Cooperation (ACP-EU).
SADC Secretariat (2011). Regional Agricultural Policy (RAP) Country Summary Agricultural Policy Review Reports. January.
Schaffnit-Chatterjee, C. (2014). “Agricultural value chains in Sub-Saharan Africa”. Current issues Emerging markets, 14 April 2014. Deutsche Bank Research. Frankfurt.
South Centre (2014). Addressing the issue of commodities. South Bulletin (80), 30 June 2014.
South Centre (2014). Global value chains: unpacking the issues of concern for developing countries. South Bulletin (77), 4 February 2014.
South Centre (2013). Global value chains (GVCs) from a development perspective. Analytical note. Geneva.
Springer-Heinze, Andreas and Eiligmann, Alfons (2008). Value links: training seminar.
Technical Centre for Agricultural and Rural Cooperation (ACP—EU) (2013). Executive brief. Tea sector.
Agritrade. October.
Technical Centre for Agricultural and Rural Cooperation (ACP—EU) (2013). Executive brief. Cotton sector.
Agritrade. October.
Technical Centre for Agricultural and Rural Cooperation (ACP—EU) (2013). Executive brief. ACP–EU
fisheries: Market access and trade. Agritrade. October.
Technical Centre for Agricultural and Rural Cooperation (ACP—EU) (2013). Executive brief. Oil crops
sector. Agritrade. October.
Technical Centre for Agricultural and Rural Cooperation (ACP—EU) (2013). Executive brief. Poultry sector.
Agritrade. September.
Technical Centre for Agricultural and Rural Cooperation (ACP—EU) (2013). Executive brief. Rice. Agritrade.
September.

62
UNCTAD (2014). Economic Development in Africa Report 2014. Catalysing investment for transformative growth in Africa. Geneva.
UNCTAD (2014). Trade and Development Report 2014. Global governance and policy space for
development. Geneva.
UNCTAD (2013). Global supply chains: trade and economic policies for developing countries. Policy issues
in international trade and commodities study series (55). Geneva.
UNCTAD (2013). Economic Development in Africa Report 2013. Intra-African trade: unlocking private
sector dynamism. Geneva.
UNCTAD (2013). Regional integration and foreign direct investment in developing and transition economies. Note by the UNCTAD secretariat. Geneva.
UNCTAD (2013). World Investment Report. Geneva.
UNCTAD (2013). Global Commodities Forum. 2013 Report. Recommitting to commodity sector development as an engine of economic growth and poverty reduction. Geneva.
UNCTAD (2012). Enabling the Graduation of LDCs: Enhancing the Role of Commodities and Improving Agricultural Productivity. Geneva.
UNCTAD (2012). Global Commodities Forum. 2012 Report. Harnessing development gains from
commodities production and trade. Geneva.
UNCTAD (2012). Economic Development in Africa Report 2012. Structural transformation and sustainable development in Africa. Geneva.
UNCTAD (2012). Evolution of the international trading system and its trends from a development
perspective. Note by the UNCTAD secretariat. Geneva.
UNCTAD (2011). Integration of developing countries in global supply chains, including through adding value to their exports. Note by the UNCTAD secretariat. Geneva.
UNCTAD (2011). Report of the Trade and Development Commission on its third session. Geneva.
UNCTAD (2009). Economic Development in Africa Report 2009. Strengthening regional economic integration for Africa’s development. Geneva.
UNCTAD (2007). Trade and Development Report 2007. Regional cooperation for development. Geneva.
UNDPI (2014). Briefing by African Regional Economic Communities to UN Member States. Africa Renewal.
New York. October.
UNDPI (2014). 2014 Special Edition. Agriculture is Africa’s next frontier. Africa Renewal. New York.
UNDPI (2014). Trade in Africa: unfinished business. Africa Renewal. New York, August.
UNIDO (2009). Agro-value chain analysis and development. The UNIDO Approach. A staff working paper.
Vienna.
USAID (2008). Participatory market system development. Best practices in implementation of value chain development programs. September.
Webber, C. Martin (2010). Agriculture and Rural Development : Building Competitiveness in Africa's Agriculture : A Guide to Value Chain Concepts and Applications. World Bank Publications. Washington DC
--- Databases and websites ---
Eurostat, http://epp.eurostat.ec.europa.eu/portal/page/portal/eurostat/home/
FAOSTAT, http://faostat3.fao.org/faostat-gateway/go/to/download/G1/*/E
Integrated Trade Intelligence Portal (World Trade Organization), http://i-tip.wto.org
Market Access Map (ITC), http://www.macmap.org
Regional Trade Agreements Information System (RTA-IS) (World Trade Organization), http://rtais.wto.org/UI/PublicMaintainRTAHome.aspx
Statistics Database (World Trade Organization), http://stat.wto.org/Home/WSDBHome.aspx?Language=
Standards Map (ITC), http://www.standardsmap.org
63
Tariff Download Facility (World Trade Organization), http://tariffdata.wto.org
Trade Competitiveness Map (ITC), http://legacy.intracen.org/appli1/tradecom/TPIC.aspx
Trade Map (ITC), http://www.trademap.org/Index.aspx
UN Commodity Trade Database (UN Comtrade), http://comtrade.un.org
United States International Trade Commission, www.usitc.gov
World Customs Organization, http://www.wcoomd.org/en.aspx
Notes 1 Webber, C. Martin (2010). Agriculture and Rural Development : Building Competitiveness in Africa's
Agriculture : A Guide to Value Chain Concepts and Applications. World Bank Publications. Washington DC.
2 http://www.fao.org/family-farming-2014/en/ 3 UNDPI (2014). 2014 Special Edition. Agriculture is Africa’s next frontier. Africa Renewal. New York. 4 OECD, World Trade Organization (2013). Aid For Trade 2013: Connecting to value chains. 5 Economic Commission for Africa and African Union (2013). Economic Report on Africa 2013. Making
the Most of Africa’s Commodities: Industrializing for Growth, Jobs and Economic Transformation. Addis Ababa.
6 Economic Commission for Africa and African Union (2009). Economic Report on Africa 2009. Developing African Agriculture Through Regional Value Chains. Addis Ababa.
7 Economic Commission for Africa and African Union (2013). Economic Report on Africa 2013, op.cit. 8 Please refer to Part 1 of this report. 9 OECD, World Trade Organization (2013). Aid For Trade 2013: Connecting to value chains. 10 UNCTAD (2013). World Investment Report. Geneva. 11 Economic Commission for Africa and African Union (2009). Economic Report on Africa 2009, op.cit. 12 Ibid. 13 OECD (2013). Connecting local producers in developing countries to regional and global value chains –
update. OECD Trade Policy Paper (160). December. 14 OECD, World Trade Organization (2013). Aid for Trade and Value Chains in Agrifood, op.cit. 15 Ibid. 16 UNDPI (2014). 2014 Special Edition, op.cit. 17 Economic Commission for Africa and African Union (2009). Economic Report on Africa 2009, op.cit. 18 Economic Commission for Africa and African Union (2013). Economic Report on Africa 2013, op.cit. 19 Economic Commission for Africa and African Union (2009). Economic Report on Africa 2009, op.cit. 20 African Union Commission and Economic Commission for Africa (2012). Boosting Intra-African Trade.
Issues Affecting Intra-African Trade, Proposed Action Plan for boosting Intra-African Trade and
Framework for the fast tracking of a Continental Free Trade Area. Addis Ababa. 21 Webber, C. Martin (2010), op.cit. 22 Kaplinsky and Morris (2001), quoted in Proctor, F., Lucchesi, V. (2012). Mapping Study on Value Chain
Initiatives in ACP regions. Technical Centre for Agricultural and Rural Cooperation (ACP-EU). 23 UNCTAD (2013). World Investment Report, op.cit. 24 Ibid. 25 OECD, World Trade Organization (2013). Aid for Trade and Value Chains in Agrifood, op.cit. 26 Webber, C. Martin (2010), op.cit.
27 UNCTAD (2013). World Investment Report, op.cit. 28 Economic Commission for Africa and African Union (2009). Economic Report on Africa 2009, op.cit. 29 M4P (2008) Making Value Chains Work Better for the Poor: A Toolbook for Practitioners of Value Chain
Analysis, Version 3. Making Markets Work Better for the Poor (M4P) Project, UK Department for International Development (DFID). Agricultural Development International. Phnom Penh.
30 Economic Commission for Africa and African Union (2009). Economic Report on Africa 2009, op.cit. 31 Economic Commission for Africa and African Union (2013). Economic Report on Africa 2013, op.cit. 32 Ibid. 33 OECD (2013). Connecting local producers in developing countries to regional and global value chains –
update, op.cit. 34 Proctor, F., Lucchesi, V. (2012), op.cit.

64
35 OECD, World Trade Organization (2013). Aid for Trade and Value Chains in Agrifood, op.cit. 36 Economic Commission for Africa and African Union (2009). Economic Report on Africa 2009, op.cit. 37 Ibid. 38 Ibid. 39 UNCTAD (2013). World Investment Report, op.cit. 40 Established in 2006 under the Comprehensive Africa Agriculture Development Programme (CAADP), it
supports efforts to promote evidence and outcome-based policy planning and implementation as part of the CAADP agenda. http://www.resakss.org
41 Economic Commission for Africa, African Union and African Development Bank (2012). Assessing
Regional Integration in Africa (ARIA V): Towards an African Continental Free Trade Area. Addis Ababa. 42 UN Office of the High Representative for the Least Developed Countries, Landlocked Developing
Countries and Small Island Developing States, http://unohrlls.org 43 African Union Commission and Economic Commission for Africa (2012). Boosting Intra-African Trade,
op.cit. 44 Economic Commission for Africa, African Union and African Development Bank (2012). ARIA V, op.cit. 45 FAO (2014). Developing sustainable food value chains – Guiding principles. Rome. 46 Proctor, F., Lucchesi, V. (2012), op.cit. 47 Please see below. 48 Proctor, F., Lucchesi, V. (2012), op.cit. 49 Webber, C. Martin (2010), op.cit. 50 It has to be mentioned that the bibliography in annex of this report, presents a very large selection of
publications on value chains, agriculture and regional integration. Not all of them have been used to prepare this document.
51 UNIDO (2009). Agro-value chain analysis and development. The UNIDO Approach. A staff working
paper. Vienna. 52 Please refer to Table 2. 53 Economic Commission for Africa and African Union (2009). Economic Report on Africa 2009, op.cit. 54 UNDPI (2014). 2014 Special Edition, op.cit. 55 Ibid. 56 In the Harmonized System, the more digits are provided, the more specific the product will be. HS
codes up to 6-digit level are followed internationally and are common to all countries. Because greater commodity details are needed than the 4- and 6-digit HS headings and subheadings, and to suit the national requirements, national customs usually determine an 8-digit level.
57 Economic Commission for Africa and African Union (2009). Economic Report on Africa 2009, op.cit. 58 Source: http://www.sadc.int 59 Source : http://www.resakss.org/region/monitoring-progress/africa-wide 60 Economic Commission for Africa and African Union (2009). Economic Report on Africa 2009, op.cit. 61 Source : Trade Map, accessed 2 October 2014. 62 Webber, C. Martin (2010), op.cit. 63 UNCTAD (2013). World Investment Report, op.cit. 64 Ibid. 65 Economic Commission for Africa and African Union (2013). Economic Report on Africa 2013, op.cit. 66 OECD, World Trade Organization (2013). Aid for Trade and Value Chains in Agrifood, op.cit. 67 Webber, C. Martin (2010), op.cit. 68 Economic Commission for Africa and African Union (2013). Economic Report on Africa 2013, op.cit. 69 Economic Commission for Africa and African Union (2009). Economic Report on Africa 2009, op.cit. 70 Proctor, F., Lucchesi, V. (2012), op.cit. 71 Ibid; Webber, C. Martin (2010), op.cit. 72 Economic Commission for Africa and African Union (2009). Economic Report on Africa 2009, op.cit. 73 Source: http://www.sadc.int ; http://www.comesa.int ; OECD, World Trade Organization (2013). Aid for
Trade and Value Chains in Agrifood, op.cit. 74 OECD (2013). Connecting local producers in developing countries to regional and global value chains –
update, op.cit. 75 OECD, World Trade Organization (2013). Aid for Trade and Value Chains in Agrifood, op.cit. 76 Economic Commission for Africa and African Union (2009). Economic Report on Africa 2009, op.cit. 77 OECD (2013). Connecting local producers in developing countries to regional and global value chains –
update, op.cit. 78 Ibid. 79 Economic Commission for Africa and African Union (2013). Economic Report on Africa 2013, op.cit. 80 Economic Commission for Africa and African Union (2009). Economic Report on Africa 2009, op.cit. 81 Webber, C. Martin (2010), op.cit.

65
82 Economic Commission for Africa and African Union (2009). Economic Report on Africa 2009, op.cit. 83 Ibid. 84 UNDPI (2014). 2014 Special Edition, op.cit. 85 Proctor, F., Lucchesi, V. (2012), op.cit. 86 IRD (2013). Sciences au Sud. 72. Novembre – Décembre. 87 OECD (2013). Connecting local producers in developing countries to regional and global value chains –
update, op.cit. 88 Webber, C. Martin (2010), op.cit. 89 Economic Commission for Africa and African Union (2009). Economic Report on Africa 2009, op.cit. 90 IRD (2013). Sciences au Sud, op.cit. 91 Economic Commission for Africa and African Union (2009). Economic Report on Africa 2009, op.cit. 92 Economic Commission for Africa, African Union and African Development Bank (2012). ARIA V, op.cit. 93 Ibid. 94 African Union Commission and Economic Commission for Africa (2012). Boosting Intra-African Trade,
op.cit. 95 Ibid. 96 Economic Commission for Africa and African Union (2009). Economic Report on Africa 2009, op.cit. 97 OECD (2013). Connecting local producers in developing countries to regional and global value chains –
update, op.cit. 98 Economic Commission for Africa and African Union (2009). Economic Report on Africa 2009, op.cit. 99 OECD (2013). Connecting local producers in developing countries to regional and global value chains –
update, op.cit. 100 African Union Commission and Economic Commission for Africa (2012). Boosting Intra-African Trade,
op.cit. 101 Economic Commission for Africa and African Union (2013). Economic Report on Africa 2013, op.cit. 102 Economic Commission for Africa and African Union (2009). Economic Report on Africa 2009, op.cit. 103 OECD (2013). Connecting local producers in developing countries to regional and global value chains –
update, op.cit. 104 Proctor, F., Lucchesi, V. (2012), op.cit. 105 IRD (2013). Sciences au Sud, op.cit. 106 UNCTAD (2013). World Investment Report, op.cit. 107 Ibid. 108 Economic Commission for Africa and African Union (2009). Economic Report on Africa 2009, op.cit. 109 OECD, World Trade Organization (2013). Aid for Trade and Value Chains in Agrifood, op.cit. 110 Non-tariff measures (NTMs) are a major impediment to international trade and can prevent market
access. They can be defined as policy measures, other than custom tariffs and including technical
regulations, product standards and customs procedures, that may have an impact on international trade.
111 African Union Commission and Economic Commission for Africa (2012). Boosting Intra-African Trade,
op.cit. 112 Economic Commission for Africa and African Union (2013). Economic Report on Africa 2013, op.cit. 113 International Trade Centre (ITC), http://www.intracen.org 114 http://www.macmap.org 115 Source: http://www.intracen.org/itc/publications/publications-catalogue/?taxid=2267 116 Source : http://www.intracen.org/itc/market-info-tools/non-tariff-measures/business-
surveys/#summary_of_results 117 Economic Commission for Africa and African Union (2013). Economic Report on Africa 2013, op.cit. 118 OECD, World Trade Organization (2013). Aid for Trade and Value Chains in Agrifood, op.cit. 119 OECD (2013). Connecting local producers in developing countries to regional and global value chains –
update, op.cit. 120 Source : http://www.standardsmap.org, accessed on 27 November 2014 121 OECD (2013). Connecting local producers in developing countries to regional and global value chains –
update, op.cit. 122 OECD, World Trade Organization (2013). Aid for Trade and Value Chains in Agrifood, op.cit. 123 African Union Commission and Economic Commission for Africa (2012). Boosting Intra-African Trade,
op.cit. 124 Automatized System for Customs Data (ASYCUDA), www.asycuda.org 125 Cambodia Development Council. Cambodia Investment Board. Cambodia Special Economic Zone
Board 126 African Union Commission and Economic Commission for Africa (2012). Boosting Intra-African Trade,
op.cit. 127 http://www.aace-africa.net/nouveau_2/

66
128 Economic Commission for Africa and African Union (2009). Economic Report on Africa 2009, op.cit. 129 Economic Commission for Africa and African Union (2009). Economic Report on Africa 2009, op.cit. 130 UNDPI (2014). 2014 Special Edition, op.cit. 131 UNDPI (2014). 2014 Special Edition, op.cit. 132 A lot of relevant information about these sectors has already been provided in the former section;
repetitions will be avoided and references to previous paragraphs will be made. 133 Proctor, F., Lucchesi, V. (2012), op.cit. 134 Ibid. 135 Economic Commission for Africa and African Union (2009). Economic Report on Africa 2009, op.cit. 136 UNDPI (2014). 2014 Special Edition, op.cit. 137 Source : Author’s calculation based on TradeMap. 138 Source : Author’s calculation based on TradeMap. 139 Nota : for each commodity, only the first ten exporters have been selected. 140 Economic Commission for Africa and African Union (2009). Economic Report on Africa 2009, op.cit. 141 Ibid. 142 FAO (2014). Developing sustainable food value chains, op.cit. 143 Economic Commission for Africa and African Union (2009). Economic Report on Africa 2009, op.cit. 144 Source : http://www.fao.org/family-farming-2014/news/news/details-press-room/en/c/218469/ 145 Economic Commission for Africa and African Union (2009). Economic Report on Africa 2009, op.cit. 146 Ibid. 147 IRD (2013). Sciences au Sud, op.cit. 148 Economic Commission for Africa and African Union (2009). Economic Report on Africa 2009, op.cit. 149 IRD (2013). Sciences au Sud, op.cit. 150 Ibid. 151 Economic Commission for Africa and African Union (2009). Economic Report on Africa 2009, op.cit. 152 IRD (2013). Sciences au Sud, op.cit. 153 Economic Commission for Africa and African Union (2009). Economic Report on Africa 2009, op.cit. 154 Please refer to the former section. 155 Economic Commission for Africa and African Union (2009). Economic Report on Africa 2009, op.cit. 156 Ibid. 157 African Growth and Opportunity Act (United States of America), Everything But Arms (European Union). 158 Source : Author’s calculation based on Market Access Map. 159 Economic Commission for Africa, African Union and African Development Bank (2012). ARIA V, op.cit. 160 African Union Commission and Economic Commission for Africa (2012). Boosting Intra-African Trade,
op.cit. 161 Economic Commission for Africa and African Union (2009). Economic Report on Africa 2009, op.cit. 162 Ibid. 163 Proctor, F., Lucchesi, V. (2012), op.cit. 164 Webber, C. Martin (2010), op.cit. 165 UNIDO (2009). Agro-value chain analysis and development, op.cit. 166 Ibid. 167 UNIDO (2009). Agro-value chain analysis and development, op.cit. 168 http://comtrade.un.org 169 http://www.trademap.org/Index.aspx 170 FAO (2014). Developing sustainable food value chains, op.cit. 171 UNIDO (2009). Agro-value chain analysis and development, op.cit. 172 Webber, C. Martin (2010), op.cit. 173 Ibid. 174 FAO (2014). Developing sustainable food value chains, op.cit.; Webber, C. Martin (2010), op.cit. 175 Webber, C. Martin (2010), op.cit. 176 Webber, C. Martin (2010), op.cit.; Economic Commission for Africa and African Union (2013). Economic
Report on Africa 2013, op.cit.; FAO (2014). Developing sustainable food value chains, op.cit.; Technical
Centre for Agricultural and Rural Cooperation (ACP—EU) (2013). Executive brief. Tea sector. Agritrade. October.
177 Proctor, F., Lucchesi, V. (2012), op.cit. 178 Ibid. 179 Source: Comtrade, http://comtrade.un.org 180 Technical Centre for Agricultural and Rural Cooperation (ACP—EU) (2013). Executive brief. Tea sector,
op.cit. 181 Ibid. 182 Economic Commission for Africa and African Union (2013). Economic Report on Africa 2013, op.cit. 183 Source: Comtrade, http://comtrade.un.org

67
184 Technical Centre for Agricultural and Rural Cooperation (ACP—EU) (2013). Executive brief. Tea sector,
op.cit. 185 FAO (2014). Developing sustainable food value chains, op.cit. 186 Technical Centre for Agricultural and Rural Cooperation (ACP—EU) (2013). Executive brief. Tea sector,
op.cit. 187 FAO (2014). Developing sustainable food value chains, op.cit. 188 Ibid. 189 Ibid. 190 Technical Centre for Agricultural and Rural Cooperation (ACP—EU) (2013). Executive brief. Tea sector,
op.cit. 191 Ibid. 192 Ibid. 193 Source : Comtrade, http://comtrade.un.org 194 Technical Centre for Agricultural and Rural Cooperation (ACP—EU) (2013). Executive brief. Tea sector,
op.cit. 195 Economic Commission for Africa and African Union (2013). Economic Report on Africa 2013, op.cit. 196 Such assessment is not exhaustive and should be discussed, designed and amplified through
consultation mechanisms. 197 Technical Centre for Agricultural and Rural Cooperation (ACP—EU) (2013). Executive brief. Tea sector,
op.cit. 198 Economic Commission for Africa and African Union (2013). Economic Report on Africa 2013, op.cit. 199 Technical Centre for Agricultural and Rural Cooperation (ACP—EU) (2013). Executive brief. Tea sector,
op.cit. 200 Source: EAC Statistic Portal,
http://www.eac.int/statistics/index.php?option=com_content&view=frontpage&Itemid=1 201 Source : World Travel and Tourism Council, http://www.wttc.org 202 FAO and CFC (2010). Strengthening potato value chains. Technical and policy options for developing
countries. Rome. 203 Ibid. 204 Source : International Potato Centre, http://cipotato.org 205 Centre pour le Développement de l’Entreprise (2009). Guide technique de la culture de la pomme de
terre en Afrique de l’Ouest. October. 206 FAO and IFAD (2013). Rebuilding West Africa’s food potential: Policies and market incentives for
smallholder-inclusive food value chains. Rome. 207 Ibid. 208 FAO and CFC (2010) , op.cit. 209 Centre pour le Développement de l’Entreprise (2009), op.cit. 210 FAO and CFC (2010) , op.cit. 211 FAO and IFAD (2013) , op.cit. 212 AFD, CIRAD and FIDA (2011). Les cultures vivrieres pluviales en Afrique de l’Ouest et du Centre
Elements d’analyse et propositions pour l’action. A savoir (06). May. 213 FAO and CFC (2010) , op.cit. 214 Ibid. 215 Centre pour le Développement de l’Entreprise (2009), op.cit. 216 Ibid. 217 Ibid. 218 FAO and CFC (2010) , op.cit. 219 Centre pour le Développement de l’Entreprise (2009), op.cit. 220 Ibid. 221 FAO and CFC (2010) , op.cit. 222 Ibid. 223 Ibid. 224 Ibid. 225 Ibid. 226 Economic Commission for Africa and African Union (2013). Economic Report on Africa 2013, op.cit. 227 Proctor, F., Lucchesi, V. (2012), op.cit. 228 Ibid. 229 Ibid. 230 OECD, World Trade Organization (2013). Aid for Trade and Value Chains in Agrifood, op.cit. 231 African Union Commission and Economic Commission for Africa (2012). Boosting Intra-African Trade,
op.cit. 232 Ibid.

68
233 Ibid. 234 Proctor, F., Lucchesi, V. (2012), op.cit. 235 African Union Commission and Economic Commission for Africa (2012). Boosting Intra-African Trade,
op.cit. 236 Proctor, F., Lucchesi, V. (2012), op.cit. 237 African Union Commission and Economic Commission for Africa (2012). Boosting Intra-African Trade,
op.cit. 238 Ibid. 239 Ibid. 240 Economic Commission for Africa and African Union (2013). Economic Report on Africa 2013, op.cit. 241 African Union Commission and Economic Commission for Africa (2012). Boosting Intra-African Trade,
op.cit. 242 OECD, World Trade Organization (2013). Aid for Trade and Value Chains in Agrifood, op.cit. 243 Economic Commission for Africa and African Union (2013). Economic Report on Africa 2013, op.cit. 244 OECD (2013). Connecting local producers in developing countries to regional and global value chains –
update, op.cit. 245 Economic Commission for Africa and African Union (2013). Economic Report on Africa 2013, op.cit.

