african development bank banque africaine de … · congo uganda / ouganda mauritius / maurice...
TRANSCRIPT

AFRICAN DEVELOPMENT BANK
BANQUE AFRICAINE DE DEVELOPPEMENT 2

18
Highlights of ADB Operations
Operations 2004 2005 2006 2007 OpérationsApprovals 1 519.54 868.73 1 045.37 1 670.06 Approbations of which Private Sector 164.38 180.10 280.85 1 001.44 dont secteur privéCommitments 742.85 1 090.80 920.55 472.16 EngagementsCancellations 290.14 166.63 201.87 142.67 AnnulationsDisbursements 630.23 595.35 548.44 884.75 DécaissementsRepayments 1 009.38 713.99 706.41 704.05 Remboursements
Approvals by Financing Instrument 2005 2006 2007
Project Lending 597.25 514.98 1,462.24 Prêts projetsPolicy-Based Lending 147.73 411.18 19.94 Prêts à l'appui de réformesGrants 5.75 8.24 2.52 Dons Project Grant - - - Don au titre des projets Structural Adjustment Grant - - - Dons au titre de l'ajustement structurel Budget Support Grant - 2.40 - Dons au titre de l'appui budgétaire Technical Assistance Grants - - 1.20 Dons d'assistance technique Special Relief Fund 5.75 5.84 1.32 Fonds spécial de secours Special Debt Relief Grant - - - Don spécial au titre de la réd. de la detteTechnical Assistance Loans - - - Prêts d'assistance techniqueInstitutional capacity Loans - - - Prêts de renforcement institutionnelProject Preparation Facility - - - Méc. de fin. de la prép. des projetsDebt and Debt Service Reduction 75.99 102.21 - Réd. du Stock et du ser. de la detteEquity Participation (Public) - - - Prises de participation (secteur public)Equity Participation (Private) 35.11 - 185.36 Prises de participation (secteur privé)Guarantee (Public) - - - Garantie (secteur public)Guarantee (Private) 6.90 8.75 - Garantie (secteur privé)Loan Reallocations - - - Réaffectations de prêtsSpecial Funds for Water - - - Réaffectations de prêts
Loan and Grant Approvals by Sector 2005 2006 2007
Agriculture and Rural Development 23.11 25.37 10.26 Agriculture et dévelop. ruralInfrastructure 270.80 223.26 1,193.66 Infrastructure Transport - 102.52 373.79 Transport Communications - - 32.99 Communications Water Supply and Sanitation - 69.61 13.80 Add. d'eau et assainissement Power 270.80 51.13 773.08 EnergieIndustry, Mining and Quarrying 33.96 55.93 162.65 Industrie, mines et mineraisFinance 211.76 495.12 87.80 FinanceSocial 55.71 61.53 - Social Education 49.97 - - Education Health 1.65 - - Santé Poverty Alleviation and Micro-Finance - 59.63 - Lutte contre la pauvr. et microfin. Gender, Population and Nutrition - - - Genre, population et nutrition Other Social Sector 4.10 1.90 - Autres secteurs sociauxUrban Development - - - Développement urbainEnvironment 57.63 - 9.79 EnvironnementMultisector 97.76 73.20 20.54 Multisecteur
Loan and Grant Disbursements by Sector
2005 2006 2007
Agriculture and Rural Development 15.11 10.39 8.19 Agriculture et dévelop. ruralInfrastructure 225.18 354.69 207.89 Infrastructure Transport 175.39 188.73 100.07 Transport Communications 1.82 35.21 - Communications Water Supply and Sanitation 21.15 113.15 17.55 Add. d'eau et assainissement Power 26.81 17.60 90.27 EnergieIndustry, Mining and Quarrying 10.99 16.24 35.51 Industrie, mines et mineraisFinance 184.98 109.75 515.96 FinanceSocial 58.92 10.65 15.42 Social Education 11.22 9.84 14.79 Education Health 47.70 0.81 0.63 Santé Poverty Alleviation and Micro-Finance - - - Lutte contre la pauvr. et microfin. Gender, Population and Nutrition - - - Genre, population et nutrition Other Social Sector - - - Autres secteurs sociauxUrban Development - - 0.02 Développement urbainEnvironment - - - EnvironnementMultisector 100.16 46.72 101.76 Multisecteur
Note: Amounts are in millions of UA / Montants en millions d'UC.
Approbations des prêts et dons parsecteur
Décaissements des prêts et dons parsecteur
Approbations par instrument de financement
ADB Operations, 2005-2007 (in million UA)
0
200
400
600
800
1 000
1 200
1 400
1 600
1 800
Approvals
Com
mitm
ents
Cancellations
Disbursem
ents
Repaym
ents
2005
2006
2007
ADB Loan and Grant Approvals by Sector (%), 2007
0.0
80.4
5.9
1.4
0.7
11.0
0.7
Social
Environment
Agriculture and RuralDevelopment
Multisector
Finance
Industry, Mining andQuarrying
Infrastructure
ADB Approvals by Financing Instrument, 2005-2007
(in million UA)
- 300 200 700 1 200 1 700 2 200 2 700
Project Lending
Policy-Based Lending
Grants
Debt and DebtService Reduction
Equity Participation(Private)
Guarantee (Private)
2005 2006 2007

19
Faits saillants sur les opérations de la BAD
Cumulative Operations 1967-05 1967-06 1967-07 Montants cumulés des opérationsApprovals 23 300 24 346 26 016 Approbations of which Private Sector 1 303 1 584 2 585 dont secteur privéCommitments 20 024 20 945 21 417 EngagementsCancellations 2 511 2 713 2 856 AnnulationsDisbursements 14 689 15 237 16 122 DécaissementsRepayments 9 601 10 307 11 011 Remboursements
Cumulative Approvals by Financing Instrument
1967-05 1967-06 1967-07
Project Lending 17 008 17 523 18 985 Prêts projetsPolicy-Based Lending 4 316 4 727 4 747 Prêts à l'appui de réformesGrants 31 39 44 Dons Project Grant - - - Don au titre des projets Structural Adjustment Grant - - - Dons au titre de l'ajustement structurel Budget Support Grant - 2 5 Dons au titre de l'appui budgétaire Technical Assistance Grants 2 2 4 Dons d'assistance technique Special Relief Fund 29 35 36 Fonds spécial de secours Special Debt Relief Grant - - - Don spécial au titre de la réd. de la detteTechnical Assistance Loans 12 12 12 Prêts d'assistance techniqueInstitutional Capacity Loans - - - Prêts de renforcement institutionnelProject Preparation Facility - - - Méc. de fin. de la prép. des projetsDebt and Debt Service Reduction 1 363 1 465 1 465 Réd. du Stock et du ser. de la detteEquity Participation (Public) 49 49 49 Prises de participation (secteur public)Equity Participation (Private) 123 123 308 Prises de participation (secteur privé)Guarantee (Public) 250 250 250 Garantie (secteur public)Guarantee (Private) 16 25 25 Garantie (secteur privé)Loan Reallocations 134 134 134 Réaffectations de prêtsSpecial Fund for Water - - - Réaffectations de prêts
Cumulative Loan and Grant Approvals by Sector
1967-05 1967-06 1967-07
Agriculture and Rural Development 2 596 2 621 2 631 Agriculture et dévelop. ruralInfrastructure 8 329 8 553 9 746 Infrastructure Transport 3 314 3 416 3 790 Transport Communications 765 765 798 Communications Water Supply and Sanitation 1 528 1 598 1 612 Add. d'eau et assainissement Power 2 722 2 774 3 547 EnergieIndustry, Mining and Quarrying 1 750 1 806 1 969 Industrie, mines et mineraisFinance 4 525 5 021 5 108 FinanceSocial 1 102 1 164 1 164 Social Education 860 860 860 Education Health 223 223 223 Santé Poverty Alleviation and Micro-Finance - 60 60 Lutte contre la pauvr. et microfin. Gender, Population and Nutrition 10 10 10 Genre, population et nutrition Other Social Sector 8 10 10 Autres secteurs sociauxUrban Development - - - Développement urbainEnvironment 58 58 67 EnvironnementMultisector 3 003 3 077 3 097 Multisecteur
Cumulative Loan and Grant Disbursements by Sector
1967-05 1967-06 1967-07
Agriculture and Rural Development 2 052 2 063 2 071 Agriculture et dévelop. ruralInfrastructure 5 241 5 596 5 804 Infrastructure Transport 2 250 2 439 2 539 Transport Communications 425 460 460 Communications Water Supply and Sanitation 1 000 1 113 1 130 Add. d'eau et assainissement Power 1 567 1 584 1 675 EnergieIndustry, Mining and Quarrying 1 258 1 274 1 309 Industrie, mines et mineraisFinance 3 122 3 232 3 748 FinanceSocial 624 635 650 Social Education 511 521 536 Education Health 102 103 103 Santé Poverty Alleviation and Micro-Finance 11 11 11 Lutte contre la pauvr. et microfin. Gender, Population and Nutrition 0 0 0 Genre, population et nutrition Other Social Sector - - - Autres secteurs sociauxUrban Development 0 0 0 Développement urbainEnvironment - - - EnvironnementMultisector 2 391 2 438 2 540 Multisecteur
Note: Amounts are in millions of UA / Montants en millions d'UC.
Montants cumulés des approbations des prêts et dons par secteur
Montants cumulés des décaissements des prêts et dons par secteur
Montants cumulés des approbations parinstrument de financement
Cumulative ADB Operations, 1967-2007
(in million UA)
0
5 000
10 000
15 000
20 000
25 000
30 000
Approvals Commitments Cancellations Disbursements Repayments
1967-05
1967-06
1967-07
Cumulative ADB Loan and Grant Approvals by Sector (%), 1967-2007
0.3
4.9
8.3
11.1
13.0
21.5
41.0
Environment
Social
Industry, Mining and Quarrying
Agriculture and RuralDevelopment
Multisector
Finance
Infrastructure
Cumulative ADB Loan Disbursements by Sector (%), 1967-2007
0.0
4.0
8.1
12.8
15.8
23.2
36.0
0.0 10.0 20.0 30.0 40.0
Urban Development
Social
Industry, Mining andQuarrying
Agriculture and RuralDevelopment
Multisector
Finance
Infrastructure

20
Cumulative ADB Loan and Grant Approvals by Country in Million UA,1967- 2007
------ Montants cumulés des approbations de prêts et dons de la BAD par pays en millions d'UC, 1967-
2007
1
3
7
8
9
10
12
12
14
15
17
20
22
24
31
33
38
49
60
64
67
85
105
105
117
129
136
172
196
205
224
241
242
245
263
265
267
267
298
322
535
645
690
844
872
924
1 887
2 077
2 513
3 604
4 253
0 1 000 2 000 3 000 4 000 5 000
Eritrea / Erythrée
Chad / Tchad
Equat. Guinea / Guinée Equat.
Djibouti
Somalia / Somalie
Comoros / Comores
Guinea Bissau / GuinéeBissau
Cape Verde / Cap Vert
Sierra Leone
Cent. Afr. Rep. / Rép. Centraf.
Rwanda
Mali
Gambia / Gambie
Benin / Bénin
Burkina Faso
Togo
Niger
Burundi
Tanzania / Tanzanie
Lesotho
Seychelles
Malawi
Mauritania / Mauritanie
Sudan / Soudan
Liberia / Libéria
Mozambique
Namibia / Namibie
Madagascar
Senegal / Sénégal
Angola
Guinea / Guinée
Swaziland
Ethiopia / Ethiopie
Kenya
Ghana
Botswana
Congo
Uganda / Ouganda
Mauritius / Maurice
Zambia / Zambie
Cameroon / Cameroun
Zimbabwe
Congo (DRC) / Congo (RDC)
South Africa / Afrique du Sud
Côte d'Ivoire
Gabon
Algeria / Algérie
Nigeria / Nigéria
Egypt / Egypte
Tunisia / Tunisie
Morocco / Maroc
Cumulative ADB Loan and Grant Disbursements by Country in
Million UA,1967- 2007 ------
Montants cumulés des décaissements de prêts et dons de la BAD par pays en
millions d'UC, 1967-2007
3
5
6
7
7
10
10
10
12
14
17
18
24
26
31
39
41
44
47
57
61
70
73
81
86
100
103
107
121
172
175
182
194
200
200
217
226
266
297
370
373
391
494
803
1 307
1 456
1 511
2 864
2 907
0 500 1 000 1 500 2 000 2 500 3 000 3 500
Rwanda
Djibouti
Mali
Equat. Guinea / Guinée Equat.
Somalia / Somalie
Comoros / Comores
Sierra Leone
Guinea Bissau / GuinéeBissau
Cape Verde / Cap Vert
Cent. Afr. Rep. / Rép. Centraf.
Benin / Bénin
Gambia / Gambie
Togo
Burkina Faso
Niger
Lesotho
Burundi
Seychelles
Angola
Tanzania / Tanzanie
Madagascar
Liberia / Libéria
Malawi
Sudan / Soudan
Namibia / Namibie
Mauritania / Mauritanie
Mauritius / Maurice
Mozambique
Uganda / Ouganda
Swaziland
Guinea / Guinée
Senegal / Sénégal
Botswana
Kenya
Ghana
Ethiopia / Ethiopie
Congo
Zambia / Zambie
South Africa / Afrique du Sud
Cameroon / Cameroun
Zimbabwe
Congo (DRC) / Congo (RDC)
Gabon
Côte d'Ivoire
Algeria / Algérie
Egypt / Egypte
Nigeria / Nigéria
Tunisia / Tunisie
Morocco / Maroc

21
ADB Loan and Grant Approvals by Country in Million UA, 2007
------ Montants des approbations de prêts et dons de la
BAD par pays en millions d'UC, 2007
0
0
0
0
0
0
0
0
0
0
0
0
0
0
0
0
0
0
0
0
0
0
0
0
0
0
0
0
0
0
0
0
0
0
0
0
0
0
0
0
0
0
1
1
34
64
72
88
104
181
238
0 50 100 150 200 250 300
Angola
Benin
Burkina Faso
Burundi
Cameroon
Cape Verde
Central African Rep.
Chad
Comoros
Congo
Cote d'Ivoire
Djibouti
Equatorial Guinea
Eritrea
Gambia
Ghana
Guinea
Guinea Bissau
Kenya
Liberia
Libya
Malawi
Mali
Mauritania
Namibia
Niger
Nigeria
Rwanda
Sao Tome & Principe
Senegal
Seychelles
Sierra Leone
Somalia
Sudan
Swaziland
Tanzania
Togo
Zambia
Zimbabwe
Lesotho
Mozambique
Ethiopia
Algeria
Botswana
Mauritius
Congo, Dem. Rep.
Uganda
Tunisia
Madagascar
Morocco
Gabon
ADB Loan and Grant Disbursements by Country in Million UA, 2007
------Montants des décaissements de prêts et dons de
la BAD par pays en millions d'UC, 2007
0
0
0
0
0
0
0
0
0
0
0
0
0
0
0
0
0
0
0
0
0
0
0
0
0
0
0
0
0
0
0
0
0
0
0
0
0
0
0
0
3
4
4
5
6
8
12
13
21
0 5 10 15 20 25
Algeria
Angola
Benin
Botswana
Burkina Faso
Burundi
Cape Verde
Central African Rep.
Chad
Comoros
Congo
Congo, Dem. Rep.
Cote d'Ivoire
Djibouti
Equatorial Guinea
Eritrea
Ethiopia
Gambia
Ghana
Guinea
Guinea Bissau
Kenya
Lesotho
Liberia
Libya
Malawi
Mali
Mauritania
Niger
Rwanda
Sao Tome & Principe
Seychelles
Sierra Leone
Somalia
South Africa
Sudan
Tanzania
Togo
Uganda
Zimbabwe
Madagascar
Gabon
Senegal
Mozambique
Swaziland
Mauritius
Zambia
Namibia
Cameroon
22
African Development Bank Banque Africaine de Développement
Table 2.01 Tableau 2.01
(in million UA) (en million d'UC)
2001 2002 2003 2004 2005 2006 2007 Total No.
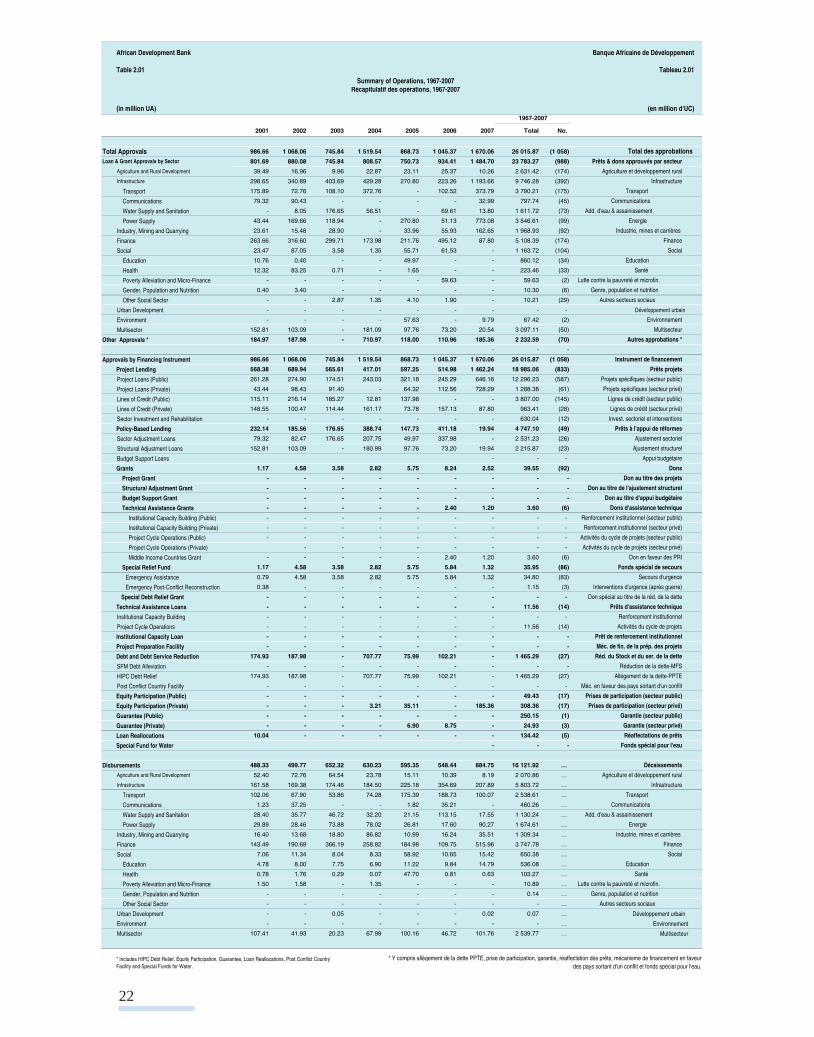
Total Approvals 986.66 1 068.06 745.84 1 519.54 868.73 1 045.37 1 670.06 26 015.87 (1 058)
Loan & Grant Approvals by Sector 801.69 880.08 745.84 808.57 750.73 934.41 1 484.70 23 783.27 (988)
Agriculture and Rural Development 39.49 16.96 9.96 22.87 23.11 25.37 10.26 2 631.42 (174)
Infrastructure 298.65 340.89 403.69 429.28 270.80 223.26 1 193.66 9 746.28 (392)
Transport 175.89 72.76 108.10 372.76 - 102.52 373.79 3 790.21 (175)
Communications 79.32 90.43 - - - - 32.99 797.74 (45)
Water Supply and Sanitation - 8.05 176.65 56.51 - 69.61 13.80 1 611.72 (73)
Power Supply 43.44 169.66 118.94 - 270.80 51.13 773.08 3 546.61 (99)
Industry, Mining and Quarrying 23.61 15.48 28.90 - 33.96 55.93 162.65 1 968.93 (92)
Finance 263.66 316.60 299.71 173.98 211.76 495.12 87.80 5 108.39 (174)
Social 23.47 87.05 3.58 1.35 55.71 61.53 - 1 163.72 (104)
Education 10.76 0.40 - - 49.97 - - 860.12 (34)
Health 12.32 83.25 0.71 - 1.65 - - 223.46 (33)
Poverty Alleviation and Micro-Finance - - - - - 59.63 - 59.63 (2)
Gender, Population and Nutrition 0.40 3.40 - - - - - 10.30 (6)
Other Social Sector - - 2.87 1.35 4.10 1.90 - 10.21 (29)
Urban Development - - - - - - - - - Développement urbain
Environment - - - - 57.63 - 9.79 67.42 (2)
Multisector 152.81 103.09 - 181.09 97.76 73.20 20.54 3 097.11 (50)
Other Approvals * 184.97 187.98 - 710.97 118.00 110.96 185.36 2 232.59 (70)
- - -
Approvals by Financing Instrument 986.66 1 068.06 745.84 1 519.54 868.73 1 045.37 1 670.06 26 015.87 (1 058)
Project Lending 568.38 689.94 565.61 417.01 597.25 514.98 1 462.24 18 985.06 (833)
Project Loans (Public) 261.28 274.90 174.51 243.03 321.18 245.29 646.16 12 296.23 (587)
Project Loans (Private) 43.44 98.43 91.40 - 64.32 112.56 728.29 1 288.38 (61)
Lines of Credit (Public) 115.11 216.14 185.27 12.81 137.98 - - 3 807.00 (145)
Lines of Credit (Private) 148.55 100.47 114.44 161.17 73.78 157.13 87.80 963.41 (28)
Sector Investment and Rehabilitation - - - - - - - 630.04 (12)
Policy-Based Lending 232.14 185.56 176.65 388.74 147.73 411.18 19.94 4 747.10 (49)
Sector Adjustment Loans 79.32 82.47 176.65 207.75 49.97 337.98 - 2 531.23 (26)
Structural Adjustment Loans 152.81 103.09 - 180.99 97.76 73.20 19.94 2 215.87 (23)
Budget Support Loans - - -
Grants 1.17 4.58 3.58 2.82 5.75 8.24 2.52 39.55 (92)
Project Grant - - - - - - - - -
Structural Adjustment Grant - - - - - - - - -
Budget Support Grant - - - - - - - - -
Technical Assistance Grants - - - - - 2.40 1.20 3.60 (6)
Institutional Capacity Building (Public) - - - - - - - - -
Institutional Capacity Building (Private) - - - - - - - - -
Project Cycle Operations (Public) - - - - - - - - -
Project Cycle Operations (Private) - - - - - - - -
Middle Income Countries Grant - - - - - 2.40 1.20 3.60 (6)
Special Relief Fund 1.17 4.58 3.58 2.82 5.75 5.84 1.32 35.95 (86)
Emergency Assistance 0.79 4.58 3.58 2.82 5.75 5.84 1.32 34.80 (83)
Emergency Post-Conflict Reconstruction 0.38 - - - - - - 1.15 (3)
Special Debt Relief Grant - - - - - - - - -
Technical Assistance Loans - - - - - - - 11.56 (14)
Institutional Capacity Building - - - - - - - - -
Project Cycle Operations - - - - - - - 11.56 (14)
Institutional Capacity Loan - - - - - - - - -
Project Preparation Facility - - - - - - - - -
Debt and Debt Service Reduction 174.93 187.98 - 707.77 75.99 102.21 - 1 465.29 (27)
SFM Debt Alleviation - - - - - - - - -
HIPC Debt Relief 174.93 187.98 - 707.77 75.99 102.21 - 1 465.29 (27)
Post Conflict Country Facility - - - - - - - - -
Equity Participation (Public) - - - - - - - 49.43 (17)
Equity Participation (Private) - - - 3.21 35.11 - 185.36 308.36 (17)
Guarantee (Public) - - - - - - - 250.15 (1)
Guarantee (Private) - - - - 6.90 8.75 - 24.93 (3)
Loan Reallocations 10.04 - - - - - - 134.42 (5)
Special Fund for Water - - -
Disbursements 488.33 499.77 652.32 630.23 595.35 548.44 884.75 16 121.92 …
Agriculture and Rural Development 52.40 72.76 64.54 23.78 15.11 10.39 8.19 2 070.86 …
Infrastructure 161.58 169.38 174.46 184.50 225.18 354.69 207.89 5 803.72 …
Transport 102.06 67.90 53.86 74.28 175.39 188.73 100.07 2 538.61 …
Communications 1.23 37.25 - - 1.82 35.21 - 460.26 …
Water Supply and Sanitation 28.40 35.77 46.72 32.20 21.15 113.15 17.55 1 130.24 …
Power Supply 29.89 28.46 73.88 78.02 26.81 17.60 90.27 1 674.61 …
Industry, Mining and Quarrying 16.40 13.68 18.80 86.82 10.99 16.24 35.51 1 309.34 …
Finance 143.49 190.69 366.19 258.82 184.98 109.75 515.96 3 747.78 …
Social 7.06 11.34 8.04 8.33 58.92 10.65 15.42 650.38 …
Education 4.78 8.00 7.75 6.90 11.22 9.84 14.79 536.08 …
Health 0.78 1.76 0.29 0.07 47.70 0.81 0.63 103.27 …
Poverty Alleviation and Micro-Finance 1.50 1.58 - 1.35 - - - 10.89 …
Gender, Population and Nutrition - - - - - - - 0.14 …
Other Social Sector - - - - - - - - …
Urban Development - - 0.05 - - - 0.02 0.07 … Développement urbain
Environment - - - - - - - - … Environnement
Multisector 107.41 41.93 20.23 67.99 100.16 46.72 101.76 2 539.77 … Multisecteur
Décaissements
Lutte contre la pauvreté et microfin.
Genre, population et nutrition
Energie
Santé
Finance
Social
Education
Ajustement structurel
Prises de participation (secteur public)
Activités du cycle de projets
Réd. du Stock et du ser. de la dette
Transport
Add. d'eau & assainissement
Communications
Activités du cycle de projets (secteur privé)
Prises de participation (secteur privé)
Garantie (secteur public)
Garantie (secteur privé)
Infrastructure
Fonds spécial pour l'eau
Autres secteurs sociaux
Industrie, mines et carrières
Projets spécifiques (secteur public)
Multisecteur
Réduction de la dette-MFS
Allégement de la dette-PPTE
Prêts à l'appui de réformes
Ajustement sectoriel
Dons
Don au titre des projets
Dons d'assistance technique
Renforcement institutionnel (secteur public)
Genre, population et nutrition
Autres secteurs sociaux
Invest. sectoriel et interventions
Lignes de crédit (secteur public)
Lignes de crédit (secteur privé)
Agriculture et développement rural
Transport
Infrastructure
Projets spécifiques (secteur privé)
Summary of Operations, 1967-2007Récapitulatif des opérations, 1967-2007
1967-2007
Industrie, mines et carrières
Prêts projets
Autres approbations *
Instrument de financement
Social
Total des approbations Prêts & dons approuvés par secteur
Communications
Environnement
Lutte contre la pauvreté et microfin.
Education
Santé
Finance
Add. d'eau & assainissement
Energie
Renforcement institutionnel (secteur privé)
* Includes HIPC Debt Relief, Equity Participation, Guarantee, Loan Reallocations, Post Conflict Country Facility and Special Funds for Water.
* Y compris allégement de la dette PPTE, prise de participation, garantie, réaffectation des prêts, mécanisme de financement en faveur des pays sortant d'un conflit et fonds spécial pour l'eau.
Méc. de fin. de la prép. des projets
Renforcement institutionnel
Méc. en faveur des pays sortant d'un conflit
Réaffectations de prêts
Agriculture et développement rural
Don spécial au titre de la réd. de la dette
Appui budgétaire
Don au titre de l'ajustement structurel
Don au titre d'appui budgétaire
Prêt de renforcement institutionnel
Activités du cycle de projets (secteur public)
Fonds spécial de secours
Secours d'urgence
Prêts d'assistance technique
Interventions d'urgence (après guerre)
Don en faveur des PRI

23
African Development Bank Banque Africaine de Développement
Table 2.02 Tableau 2.02Loan and Grant Approvals, 1967-2007Prêts et dons approuvés, 1967-2007
(in million UA) (en million d'UC)
Country 2001 2002 2003 2004 2005 2006 2007 Total % No. Pays
Algeria - 148.87 0.35 - - - 0.60 1 887.00 7.9 (35) Algérie
Angola - - - - 0.34 - - 204.93 0.9 (10) Angola
Benin - - - - - - - 24.40 0.1 (9) Bénin
Botswana - - - 34.34 - - 0.60 264.84 1.1 (21) Botswana
Burkina Faso - - - - 0.33 - - 31.37 0.1 (5) Burkina Faso
Burundi - - - - 0.34 - - 49.29 0.2 (8) Burundi
Cameroon - 34.29 - - - 51.13 - 535.09 2.2 (28) Cameroun
Cape Verde - - 0.35 - - - - 12.40 0.1 (3) Cap Vert
Central African Rep. - - - - - - - 15.17 0.1 (3) Rép. Centrafricaine
Chad - - - - 0.33 - - 3.01 0.0 (3) Tchad
Comoros - - - - - - - 10.00 0.0 (1) Comores
Congo - - 0.36 - - - - 267.40 1.1 (24) Congo
Congo, Dem. Rep. 0.38 0.40 - - - - 64.24 689.51 2.9 (33) Congo, Rép.Dém.
Cote d'Ivoire - - - - - - - 871.78 3.7 (32) Côte d'Ivoire
Djibouti - - 6.95 0.34 0.34 0.33 - 8.33 0.0 (5) Djibouti
Egypt 74.92 166.33 - - 284.34 398.55 316.75 2 512.59 10.6 (46) Egypte
Equatorial Guinea - - - - - - - 7.20 0.0 (3) Guinée Equat.
Eritrea - - 0.36 - - - - 0.74 0.0 (2) Erythrée
Ethiopia - - 0.36 - - 0.33 0.33 241.61 1.0 (15) Ethiopie
Gabon - 0.38 - 76.25 15.36 - 238.10 923.69 3.9 (32) Gabon
Gambia - - 0.36 - - - - 22.07 0.1 (7) Gambie
Ghana - 9.11 - - - - - 263.35 1.1 (24) Ghana
Guinea - - - - - - - 224.29 0.9 (19) Guinée
Guinea Bissau - - - - - 0.35 - 11.74 0.0 (4) Guinée Bissau
Kenya - - 5.26 10.09 - 27.39 - 245.43 1.0 (29) Kenya
Lesotho - - - - - - 0.33 63.99 0.3 (7) Lesotho
Liberia - - 0.35 - - - - 116.80 0.5 (20) Liberia
Libya - - - - - - - - - - Libye
Madagascar - - - 0.34 - - 103.65 171.85 0.7 (12) Madagascar
Malawi 0.40 0.38 - - 0.35 - - 85.44 0.4 (16) Malawi
Mali - - - - - - - 19.89 0.1 (5) Mali
Mauritania 23.61 7.55 - - 0.34 - - 104.83 0.4 (9) Mauritanie
Mauritius 91.82 8.05 - - 7.74 - 33.74 297.90 1.3 (26) Maurice
Morocco 133.83 245.27 177.01 369.34 175.71 245.93 180.78 4 253.45 17.9 (87) Maroc
Mozambique 0.40 - 28.90 - 0.35 - 0.33 129.21 0.5 (14) Mozambique
Namibia 26.83 14.72 - 59.10 - - - 135.86 0.6 (8) Namibie
Niger - 9.45 - - 0.67 - - 37.87 0.2 (10) Niger
Nigeria 13.96 113.33 - - 74.11 89.89 - 2 076.72 8.7 (38) Nigéria
Rwanda - - - - - - - 16.87 0.1 (5) Rwanda
Sao Tome & Principe - - - - - - - - - - Sao Tome & Principe
Senegal - - - - 6.69 - - 195.88 0.8 (18) Sénégal
Seychelles - - - - 0.32 - - 67.04 0.3 (14) Seychelles
Sierra Leone - - - - - - - 14.29 0.1 (8) Sierra Leone
Somalia - - - - 0.32 0.35 - 8.54 0.0 (6) Somalie
South Africa - 15.07 106.31 117.07 - - 333.04 844.03 3.5 (10) Afrique du Sud
Sudan - - 0.35 - - 0.33 - 105.43 0.4 (15) Soudan
Swaziland 29.63 9.67 49.96 - 0.35 5.50 - 240.69 1.0 (26) Swaziland
Tanzania - - - - - 0.34 - 60.34 0.3 (14) Tanzanie
Togo - - 14.56 - - - - 33.02 0.1 (7) Togo
Tunisia 362.47 86.23 196.33 140.22 181.69 14.73 87.80 3 604.32 15.2 (94) Tunisie
Uganda 43.44 7.96 - - - - 72.17 267.45 1.1 (23) Ouganda
Zambia - - - - 0.35 28.89 - 322.09 1.4 (27) Zambie
Zimbabwe - - - - 0.35 - - 645.00 2.7 (24) Zimbabwe
Sub-Total 801.69 877.06 588.13 807.09 750.73 864.04 1 432.46 23 246.07 97.7 (944) Sous-Total
(19) (28) (24) (16) (29) (25) (20) (944)
Multinational - 3.02 157.71 1.47 - 70.36 52.24 537.20 2.3 (44) Multinational
Total 801.69 880.08 745.84 808.57 750.73 934.41 1 484.70 23 783.27 100.0 (988) Total
(19) (29) (28) (18) (29) (34) (23) (988)
1967-2007

24
African Development Bank Banque Africaine de Développement
Table 2.03 Tableau 2.03Public & Publicly-Guaranteed Approvals, 1967-2007
Approbations au secteur public et privé garanti, 1967-2007(in million UA) (en million d'UC)
Country 2001 2002 2003 2004 2005 2006 2007 Total % No. Pays
Algeria - 148.87 0.35 - - - 0.60 1 887.00 8.8 (35) Algérie
Angola - - - - 0.34 - - 204.93 1.0 (10) Angola
Benin - - - - - - - 22.86 0.1 (8) Bénin
Botswana - - - - - - 0.60 230.50 1.1 (20) Botswana
Burkina Faso - - - - 0.33 - - 31.37 0.1 (5) Burkina Faso
Burundi - - - - 0.34 - - 49.29 0.2 (8) Burundi
Cameroon - 34.29 - - - - - 480.95 2.2 (25) Cameroun
Cape Verde - - 0.35 - - - - 12.40 0.1 (3) Cap Vert
Central African Rep. - - - - - - - 15.17 0.1 (3) Rép. Centrafricaine
Chad - - - - 0.33 - - 3.01 0.0 (3) Tchad
Comoros - - - - - - - 10.00 0.0 (1) Comores
Congo - - 0.36 - - - - 267.40 1.2 (24) Congo
Congo, Dem. Rep. 0.38 0.40 - - - - - 625.27 2.9 (32) Congo, Rép.Dém.
Cote d'Ivoire - - - - - - - 830.84 3.9 (26) Côte d'Ivoire
Djibouti - - - 0.34 0.34 0.33 - 1.39 0.0 (4) Djibouti
Egypt 20.62 166.33 - - 284.34 398.55 222.42 2 283.44 10.6 (40) Egypte
Equatorial Guinea - - - - - - - 7.20 0.0 (3) Guinée Equat.
Eritrea - - 0.36 - - - - 0.74 0.0 (2) Erythrée
Ethiopia - - 0.36 - - 0.33 0.33 241.61 1.1 (15) Ethiopie
Gabon - 0.38 - 76.25 15.36 - 229.16 914.75 4.2 (31) Gabon
Gambia - - 0.36 - - - - 22.07 0.1 (7) Gambie
Ghana - - - - - - - 245.45 1.1 (19) Ghana
Guinea - - - - - - - 221.53 1.0 (17) Guinée
Guinea Bissau - - - - - 0.35 - 11.74 0.1 (4) Guinée Bissau
Kenya - - 0.36 0.33 - 0.35 - 203.13 0.9 (25) Kenya
Lesotho - - - - - - 0.33 63.99 0.3 (7) Lesotho
Liberia - - 0.35 - - - - 116.80 0.5 (20) Liberia
Libya - - - - - - - - - - Libye
Madagascar - - - 0.34 - - 0.33 68.53 0.3 (10) Madagascar
Malawi 0.40 0.38 - - 0.35 - - 85.44 0.4 (16) Malawi
Mali - - - - - - - 17.54 0.1 (3) Mali
Mauritania 23.61 - - - 0.34 - - 97.28 0.5 (8) Mauritanie
Mauritius 11.54 8.05 - - 7.74 - 33.74 214.19 1.0 (24) Maurice
Morocco 133.83 245.27 177.01 369.34 118.08 245.93 180.78 4 194.92 19.5 (85) Maroc
Mozambique 0.40 - - - 0.35 - 0.33 100.31 0.5 (13) Mozambique
Namibia 26.83 14.72 - 59.10 - - - 135.86 0.6 (8) Namibie
Niger - - - - 0.67 - - 28.42 0.1 (9) Niger
Nigeria - - - - 0.33 0.35 - 1 713.20 8.0 (26) Nigéria
Rwanda - - - - - - - 16.87 0.1 (5) Rwanda
Sao Tome & Principe - - - - - - - - 0.0 - Sao Tome & Principe
Senegal - - - - - - - 185.31 0.9 (15) Sénégal
Seychelles - - - - 0.32 - - 66.03 0.3 (13) Seychelles
Sierra Leone - - - - - - - 14.29 0.1 (8) Sierra Leone
Somalia - - - - 0.32 0.35 - 8.54 0.0 (6) Somalie
South Africa - - 71.38 - - - - 320.28 1.5 (4) Afrique du Sud
Sudan - - 0.35 - - 0.33 - 103.88 0.5 (14) Soudan
Swaziland 29.63 9.67 49.96 - 0.35 - - 233.49 1.1 (24) Swaziland
Tanzania - - - - - 0.34 - 56.71 0.3 (12) Tanzanie
Togo - - - - - - - 18.46 0.1 (6) Togo
Tunisia 362.47 49.81 189.81 140.22 181.69 14.73 - 3 473.57 16.1 (90) Tunisie
Uganda - - - - - - - 139.85 0.6 (18) Ouganda
Zambia - - - - 0.35 - - 282.13 1.3 (24) Zambie
Zimbabwe - - - - 0.35 - - 643.25 3.0 (23) Zimbabwe
Sub-Total 609.70 678.16 491.38 645.92 612.63 661.94 668.62 21 223.21 98.6 (861) Sous-Total
(15) (17) (18) (12) (25) (19) (12) (861)
Multinational - 3.02 48.63 1.47 - 2.77 - 308.28 1.4 (38) Multinational
Total 609.70 681.18 540.01 647.39 612.63 664.71 668.62 21 531.48 100.0 (899) Total
(15) (18) (20) (14) (25) (27) (12) (899)
1967-2007

25
African Development Bank Banque Africaine de Développement
Table 2.04 Tableau 2.04Private Non-Publicly-Guaranteed Approvals, 1991-2007Approbations au secteur privé non garanti, 1991-2007
(in million UA) (en million d'UC)
Country 2001 2002 2003 2004 2005 2006 2007 Total % No. Pays
Algeria - - - - - - - - - - Algérie
Angola - - - - - - - - - - Angola
Benin - - - - - - - 1.54 0.1 (1) Bénin
Botswana - - - 34.34 - - - 34.34 1.5 (1) Botswana
Burkina Faso - - - - - - - - - - Burkina Faso
Burundi - - - - - - - - - - Burundi
Cameroon - - - - - 51.13 - 54.14 2.4 (3) Cameroun
Cape Verde - - - - - - - - - - Cap Vert
Central African Rep. - - - - - - - - - - Rép. Centrafricaine
Chad - - - - - - - - - - Tchad
Comoros - - - - - - - - - - Comores
Congo - - - - - - - - - - Congo
Congo, Dem. Rep. - - - - - - 64.24 64.24 2.9 (1) Congo, Rép.Dém.
Cote d'Ivoire - - - - - - - 40.94 1.8 (6) Côte d'Ivoire
Djibouti - - 6.95 - - - - 6.95 0.3 (1) Djibouti
Egypt 54.31 - - - - - 94.33 229.15 10.2 (6) Egypte
Equatorial Guinea - - - - - - - - - - Guinée Equat.
Eritrea - - - - - - - - - - Erythrée
Ethiopia - - - - - - - - - - Ethiopie
Gabon - - - - - - 8.94 8.94 0.4 (1) Gabon
Gambia - - - - - - - - - - Gambie
Ghana - 9.11 - - - - - 17.90 0.8 (5) Ghana
Guinea - - - - - - - 2.76 0.1 (2) Guinée
Guinea Bissau - - - - - - - - - - Guinée Bissau
Kenya - - 4.90 9.77 - 27.04 - 42.30 1.9 (4) Kenya
Lesotho - - - - - - - - - - Lesotho
Liberia - - - - - - - - - - Liberia
Libya - - - - - - - - - - Libye
Madagascar - - - - - - 103.32 103.32 4.6 (2) Madagascar
Malawi - - - - - - - - - - Malawi
Mali - - - - - - - 2.35 0.1 (2) Mali
Mauritania - 7.55 - - - - - 7.55 0.3 (1) Mauritanie
Mauritius 80.28 - - - - - - 83.70 3.7 (2) Maurice
Morocco - - - - 57.63 - - 58.53 2.6 (2) Maroc
Mozambique - - 28.90 - - - - 28.90 1.3 (1) Mozambique
Namibia - - - - - - - - - - Namibie
Niger - 9.45 - - - - - 9.45 0.4 (1) Niger
Nigeria 13.96 113.33 - - 73.78 89.54 - 363.52 16.1 (12) Nigéria
Rwanda - - - - - - - - - - Rwanda
Sao Tome & Principe - - - - - - - - - - Sao Tome & Principe
Senegal - - - - 6.69 - - 10.57 0.5 (3) Sénégal
Seychelles - - - - - - - 1.01 0.0 (1) Seychelles
Sierra Leone - - - - - - - - - - Sierra Leone
Somalia - - - - - - - - - - Somalie
South Africa - 15.07 34.92 117.07 - - 333.04 523.76 23.3 (6) Afrique du Sud
Sudan - - - - - - - 1.55 0.1 (1) Soudan
Swaziland - - - - - 5.50 - 7.19 0.3 (2) Swaziland
Tanzania - - - - - - - 3.63 0.2 (2) Tanzanie
Togo - - 14.56 - - - - 14.56 0.6 (1) Togo
Tunisia - 36.43 6.53 - - - 87.80 130.75 5.8 (4) Tunisie
Uganda 43.44 7.96 - - - - 72.17 127.61 5.7 (5) Ouganda
Zambia - - - - - 28.89 - 39.96 1.8 (3) Zambie
Zimbabwe - - - - - - - 1.75 0.1 (1) Zimbabwe
Sub-Total 191.99 198.90 96.75 161.17 138.10 202.10 763.84 2 022.87 89.8 (83) Sous-Total
(4) (11) (6) (4) (4) (6) (8) (83)
Multinational - - 109.09 - - 67.60 - 176.68 12.3 (6) Multinational
Total 191.99 198.90 205.84 161.17 138.10 269.70 763.84 2 199.55 102.1 (89) Total
(4) (11) (8) (4) (4) (7) (11) (89)
1991-2007

26
African Development Bank Banque Africaine de Développement
Table 2.05 Tableau 2.05Loan Commitments, 1967-2007
Engagements de prêts, 1967-2007(in million UA) (en million d'UC)
Country 2001 2002 2003 2004 2005 2006 2007 Total % No. Pays
Algeria 90.42 - 143.43 - - - 0.60 1 853.75 8.7 (31) Algérie
Angola - - - - 0.35 - - 204.94 1.0 (10) Angola
Benin - - - - - - 0.32 18.17 0.1 (8) Bénin
Botswana - - - - 32.67 - 1.17 263.74 1.2 (21) Botswana
Burkina Faso - - - - 0.35 - - 27.39 0.1 (4) Burkina Faso
Burundi - - - - 0.35 - - 48.93 0.2 (7) Burundi
Cameroon - - 32.13 - - 52.92 0.32 534.98 2.5 (28) Cameroun
Cape Verde - - 0.34 - - - - 12.39 0.1 (3) Cap Vert
Central African Rep. - - - - - - - 15.17 0.1 (3) Rép. Centrafricaine
Chad - - - - 0.35 - 0.32 0.67 0.0 (2) Tchad
Comoros - - - - - - - 10.00 0.0 (1) Comores
Congo - - 0.35 - - - - 246.33 1.2 (23) Congo
Congo, Dem. Rep. - - - - - - - 624.49 2.9 (30) Congo, Rép.Dém.
Cote d'Ivoire - - - - - - 0.32 867.55 4.1 (27) Côte d'Ivoire
Djibouti - - - - 0.35 6.61 0.32 7.28 0.0 (3) Djibouti
Egypt - 76.30 161.30 - 286.55 388.00 0.32 2 085.30 9.7 (38) Egypte
Equatorial Guinea - - - - - - - 7.20 0.0 (3) Guinée Equat.
Eritrea - - - - - - - - - - Erythrée
Ethiopia - - - - - - 0.32 240.53 1.1 (12) Ethiopie
Gabon 5.00 - 0.37 75.49 15.73 - 236.18 898.28 4.2 (32) Gabon
Gambia - - 0.36 - - - - 21.70 0.1 (6) Gambie
Ghana - 3.71 5.60 - - - - 256.62 1.2 (21) Ghana
Guinea - - - - - - - 212.74 1.0 (17) Guinée
Guinea Bissau - - - - - - - 11.01 0.1 (2) Guinée Bissau
Kenya - - 0.35 4.74 0.35 26.43 - 233.46 1.1 (26) Kenya
Lesotho - - - - - - 0.32 43.98 0.2 (6) Lesotho
Liberia - - - - - - - 98.08 0.5 (18) Liberia
Libya - - - - - - - - - - Libye
Madagascar - - - - - - 5.85 67.84 0.3 (8) Madagascar
Malawi - - 0.36 - - - - 79.43 0.4 (13) Malawi
Mali - - - - - - - 18.14 0.1 (3) Mali
Mauritania 23.95 - 7.27 - - - - 104.54 0.5 (8) Mauritanie
Mauritius 15.13 91.94 - 8.20 - 7.87 32.97 277.31 1.3 (26) Maurice
Morocco 154.00 160.43 153.18 180.69 469.65 251.04 41.47 3 955.96 18.5 (81) Maroc
Mozambique - - - 27.36 - - - 118.72 0.6 (11) Mozambique
Namibia 18.22 5.41 18.00 25.62 51.23 - - 162.30 0.8 (8) Namibie
Niger - - 8.83 - 0.70 - - 37.28 0.2 (10) Niger
Nigeria 23.89 14.45 36.37 - 49.25 26.43 86.48 1 741.50 8.1 (33) Nigéria
Rwanda - - - - - - - 16.10 0.1 (3) Rwanda
Sao Tome & Principe - - - - - - - - - - Sao Tome & Principe
Senegal - - - - - - - 189.19 0.9 (17) Sénégal
Seychelles - - - - 0.35 - - 61.90 0.3 (13) Seychelles
Sierra Leone - - - - - - - 11.40 0.1 (7) Sierra Leone
Somalia - - - - 0.35 - - 7.85 0.0 (4) Somalie
South Africa 77.31 15.12 72.65 142.47 - - 63.82 521.94 2.4 (10) Afrique du Sud
Sudan - - - - - - - 85.81 0.4 (10) Soudan
Swaziland 9.63 - 11.94 48.98 - - 0.46 205.48 1.0 (24) Swaziland
Tanzania - - - - - - - 59.60 0.3 (10) Tanzanie
Togo - - 13.92 - - - - 32.38 0.2 (7) Togo
Tunisia 214.65 304.74 71.48 125.70 182.23 161.25 - 3 376.68 15.8 (93) Tunisie
Uganda - 6.02 - - - - - 149.87 0.7 (20) Ouganda
Zambia 3.95 - - - - - 0.32 283.71 1.3 (25) Zambie
Zimbabwe - - - - - - - 641.85 3.0 (21) Zimbabwe
Sub-Total - 678.12 738.23 639.24 1 090.80 920.55 471.87 21 051.44 98.3 (847) Sous-Total
- - -
Multinational - - - 103.61 - - 0.29 365.64 1.7 (29) Multinational
- - -
Total 636.15 678.12 738.23 742.85 1 090.80 920.55 472.16 21 417.08 100.0 (876) Total
(19) (29) (24) (17) (29) (13) (27) (876)
1967-2007

27
African Development Bank Banque Africaine de Développement
Table 2.06 Tableau 2.06Loan Cancellations, 1967-2007
Annulations des prêts, 1967-2007(in million UA) (en million d'UC)
Country 2001 2002 2003 2004 2005 2006 2007 Total % Pays
Algeria 17.62 72.18 1.22 82.93 8.88 104.54 - 396.33 13.9 Algérie
Angola - 1.10 - 1.44 0.33 - - 75.43 2.6 Angola
Benin - - - - - - - 0.54 0.0 Bénin
Botswana - - - - 0.05 13.97 - 64.50 2.3 Botswana
Burkina Faso - - - - - - - 1.38 0.0 Burkina Faso
Burundi - 0.00 - - - - - 4.20 0.1 Burundi
Cameroon 1.07 1.79 - 0.79 9.59 - - 78.69 2.8 Cameroun
Cape Verde - 0.00 - - - - - 0.00 0.0 Cap Vert
Central African Rep. - - - - - - - 1.43 0.1 Rép. Centrafricaine
Chad - - - - - - - - - Tchad
Comoros - - - - - - - 0.33 0.0 Comores
Congo - - - - - - - 19.83 0.7 Congo
Congo, Dem. Rep. - - - - - - - 151.56 5.3 Congo, Rép.Dém.
Cote d'Ivoire - - - 24.63 4.64 - - 62.70 2.2 Côte d'Ivoire
Djibouti - - - - - - - - - Djibouti
Egypt - 5.42 - 16.97 11.19 1.15 - 225.56 7.9 Egypte
Equatorial Guinea - - - - - - - 0.46 0.0 Guinée Equat.
Eritrea - - - - - - - - - Erythrée
Ethiopia 1.75 - - 0.25 - - - 19.01 0.7 Ethiopie
Gabon 4.68 0.06 - 3.13 56.19 0.50 8.77 110.27 3.9 Gabon
Gambia - - - - - - - 3.48 0.1 Gambie
Ghana - 0.00 - - - - - 56.74 2.0 Ghana
Guinea - - - 0.89 0.02 - - 21.60 0.8 Guinée
Guinea Bissau - - - - - - - 0.98 0.0 Guinée Bissau
Kenya - 0.00 - - - 9.97 25.31 41.76 1.5 Kenya
Lesotho - - - - - - - 25.09 0.9 Lesotho
Liberia - - - - - - - 18.29 0.6 Liberia
Libya - - - - - - - - - Libye
Madagascar - - - - - - - 4.07 0.1 Madagascar
Malawi - 0.00 - - - - - 2.08 0.1 Malawi
Mali - - - - - - - 12.52 0.4 Mali
Mauritania - - - - - 0.00 - 0.20 0.0 Mauritanie
Mauritius 22.94 9.30 - - 8.27 12.01 7.99 86.37 3.0 Maurice
Morocco 14.79 14.06 5.10 - 14.65 18.49 9.51 274.76 9.6 Maroc
Mozambique - - 0.07 - - - - 7.23 0.3 Mozambique
Namibia - 0.17 - - - - - 0.20 0.0 Namibie
Niger - - - - - - - 5.96 0.2 Niger
Nigeria - 1.00 33.65 57.40 0.22 - 5.65 261.87 9.2 Nigéria
Rwanda - - - - - - - 13.13 0.5 Rwanda
Sao Tome & Principe - - - - - - - - - Sao Tome & Principe
Senegal - 0.18 - - - - - 10.48 0.4 Sénégal
Seychelles 7.99 1.03 1.63 7.88 - - - 18.67 0.7 Seychelles
Sierra Leone - - - - - - - 1.49 0.1 Sierra Leone
Somalia - - - - - - - 0.32 0.0 Somalie
South Africa - - - 45.07 - 17.05 47.46 109.58 3.8 Afrique du Sud
Sudan - - - - - - - 5.30 0.2 Soudan
Swaziland - 11.35 - 10.53 1.08 - - 29.44 1.0 Swaziland
Tanzania 0.27 - - - - - - 2.79 0.1 Tanzanie
Togo - - - - - 6.65 - 7.98 0.3 Togo
Tunisia 168.19 4.80 6.32 33.82 13.03 17.54 37.97 245.90 8.6 Tunisie
Uganda - - - 1.61 38.48 - - 67.06 2.3 Ouganda
Zambia 14.88 0.00 - 0.33 - - - 16.80 0.6 Zambie
Zimbabwe 189.79 46.40 - 2.34 - - - 255.05 8.9 Zimbabwe
Sub-Total 443.98 168.85 47.99 290.00 166.63 201.87 142.67 2 819.40 98.7 Sous-Total
Multinational - - - 0.13 - - - 36.16 1.3 Multinational
Total 443.98 168.85 47.99 290.14 166.63 201.87 142.67 2 855.56 100.0 Total
1967-2007
28
African Development Bank Banque Africaine de Développement
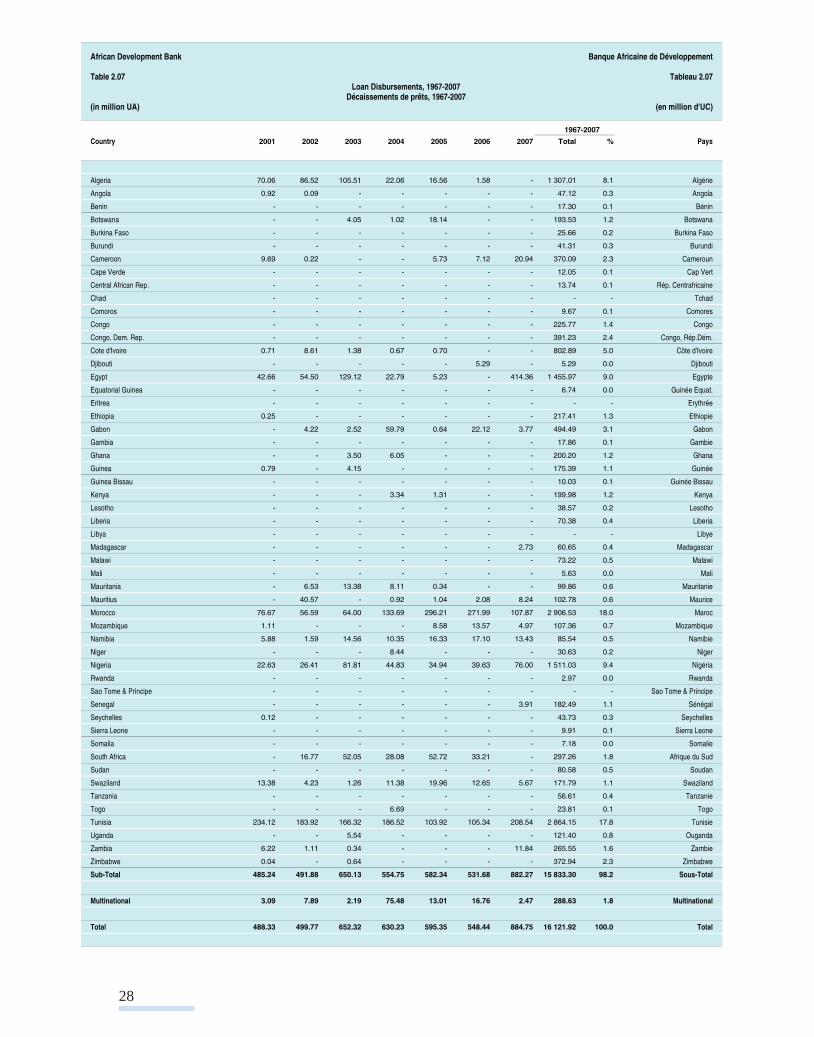
Table 2.07 Tableau 2.07Loan Disbursements, 1967-2007
Décaissements de prêts, 1967-2007(in million UA) (en million d'UC)
Country 2001 2002 2003 2004 2005 2006 2007 Total % Pays
Algeria 70.06 86.52 105.51 22.06 16.56 1.58 - 1 307.01 8.1 Algérie
Angola 0.92 0.09 - - - - - 47.12 0.3 Angola
Benin - - - - - - - 17.30 0.1 Bénin
Botswana - - 4.05 1.02 18.14 - - 193.53 1.2 Botswana
Burkina Faso - - - - - - - 25.66 0.2 Burkina Faso
Burundi - - - - - - - 41.31 0.3 Burundi
Cameroon 9.69 0.22 - - 5.73 7.12 20.94 370.09 2.3 Cameroun
Cape Verde - - - - - - - 12.05 0.1 Cap Vert
Central African Rep. - - - - - - - 13.74 0.1 Rép. Centrafricaine
Chad - - - - - - - - - Tchad
Comoros - - - - - - - 9.67 0.1 Comores
Congo - - - - - - - 225.77 1.4 Congo
Congo, Dem. Rep. - - - - - - - 391.23 2.4 Congo, Rép.Dém.
Cote d'Ivoire 0.71 8.61 1.38 0.67 0.70 - - 802.89 5.0 Côte d'Ivoire
Djibouti - - - - - 5.29 - 5.29 0.0 Djibouti
Egypt 42.66 54.50 129.12 22.79 5.23 - 414.36 1 455.97 9.0 Egypte
Equatorial Guinea - - - - - - - 6.74 0.0 Guinée Equat.
Eritrea - - - - - - - - - Erythrée
Ethiopia 0.25 - - - - - - 217.41 1.3 Ethiopie
Gabon - 4.22 2.52 59.79 0.64 22.12 3.77 494.49 3.1 Gabon
Gambia - - - - - - - 17.86 0.1 Gambie
Ghana - - 3.50 6.05 - - - 200.20 1.2 Ghana
Guinea 0.79 - 4.15 - - - - 175.39 1.1 Guinée
Guinea Bissau - - - - - - - 10.03 0.1 Guinée Bissau
Kenya - - - 3.34 1.31 - - 199.98 1.2 Kenya
Lesotho - - - - - - - 38.57 0.2 Lesotho
Liberia - - - - - - - 70.38 0.4 Liberia
Libya - - - - - - - - - Libye
Madagascar - - - - - - 2.73 60.65 0.4 Madagascar
Malawi - - - - - - - 73.22 0.5 Malawi
Mali - - - - - - - 5.63 0.0 Mali
Mauritania - 6.53 13.38 8.11 0.34 - - 99.86 0.6 Mauritanie
Mauritius - 40.57 - 0.92 1.04 2.08 8.24 102.78 0.6 Maurice
Morocco 76.67 56.59 64.00 133.69 296.21 271.99 107.87 2 906.53 18.0 Maroc
Mozambique 1.11 - - - 8.58 13.57 4.97 107.36 0.7 Mozambique
Namibia 5.88 1.59 14.56 10.35 16.33 17.10 13.43 85.54 0.5 Namibie
Niger - - - 8.44 - - - 30.63 0.2 Niger
Nigeria 22.63 26.41 81.81 44.83 34.94 39.63 76.00 1 511.03 9.4 Nigéria
Rwanda - - - - - - - 2.97 0.0 Rwanda
Sao Tome & Principe - - - - - - - - - Sao Tome & Principe
Senegal - - - - - - 3.91 182.49 1.1 Sénégal
Seychelles 0.12 - - - - - - 43.73 0.3 Seychelles
Sierra Leone - - - - - - - 9.91 0.1 Sierra Leone
Somalia - - - - - - - 7.18 0.0 Somalie
South Africa - 16.77 52.05 28.08 52.72 33.21 - 297.26 1.8 Afrique du Sud
Sudan - - - - - - - 80.58 0.5 Soudan
Swaziland 13.38 4.23 1.26 11.38 19.96 12.65 5.67 171.79 1.1 Swaziland
Tanzania - - - - - - - 56.61 0.4 Tanzanie
Togo - - - 6.69 - - - 23.81 0.1 Togo
Tunisia 234.12 183.92 166.32 186.52 103.92 105.34 208.54 2 864.15 17.8 Tunisie
Uganda - - 5.54 - - - - 121.40 0.8 Ouganda
Zambia 6.22 1.11 0.34 - - - 11.84 265.55 1.6 Zambie
Zimbabwe 0.04 - 0.64 - - - - 372.94 2.3 Zimbabwe
Sub-Total 485.24 491.88 650.13 554.75 582.34 531.68 882.27 15 833.30 98.2 Sous-Total
Multinational 3.09 7.89 2.19 75.48 13.01 16.76 2.47 288.63 1.8 Multinational
Total 488.33 499.77 652.32 630.23 595.35 548.44 884.75 16 121.92 100.0 Total
1967-2007

29
African Development Bank Banque Africaine de Développement
Table 2.08 Tableau 2.08Disbursements on Policy-Based Loans, 1984-2007
Décaissements des prêts à l'appui de réformes, 1984-2007(in million UA) (en million d'UC)
Country 2001 2002 2003 2004 2005 2006 2007 Total % Pays
Algeria - - - - - - - 446.97 10.7 Algérie
Angola - - - - - - - - - Angola
Benin - - - - - - - - - Bénin
Botswana - - - - - - - - - Botswana
Burkina Faso - - - - - - - - - Burkina Faso
Burundi - - - - - - - - - Burundi
Cameroon - - - - - - - 100.00 2.4 Cameroun
Cape Verde - - - - - - - - - Cap Vert
Central African Rep. - - - - - - - - - Rép. Centrafricaine
Chad - - - - - - - - - Tchad
Comoros - - - - - - - - - Comores
Congo - - - - - - - 89.97 2.2 Congo
Congo, Dem. Rep. - - - - - - - 80.00 1.9 Congo, Rép.Dém.
Cote d'Ivoire - - - - - - - 335.00 8.0 Côte d'Ivoire
Djibouti - - - - - - - - - Djibouti
Egypt - - - - - - 329.05 379.05 9.1 Egypte
Equatorial Guinea - - - - - - - - - Guinée Equat.
Eritrea - - - - - - - - - Erythrée
Ethiopia - - - - - - - - - Ethiopie
Gabon - - - 54.27 - 18.75 - 168.02 4.0 Gabon
Gambia - - - - - - - - - Gambie
Ghana - - - - - - - 50.00 1.2 Ghana
Guinea - - - - - - - - - Guinée
Guinea Bissau - - - - - - - - - Guinée Bissau
Kenya - - - - - - - 42.00 1.0 Kenya
Lesotho - - - - - - - - - Lesotho
Liberia - - - - - - - - - Liberia
Libya - - - - - - - - - Libye
Madagascar - - - - - - - - - Madagascar
Malawi - - - - - - - - - Malawi
Mali - - - - - - - - - Mali
Mauritania - - - - - - - - - Mauritanie
Mauritius - - - - - - 6.57 21.57 0.5 Maurice
Morocco - 37.25 56.68 57.39 247.58 229.27 75.52 1 586.87 38.1 Maroc
Mozambique - - - - - - - - - Mozambique
Namibia - - - - - - - - - Namibie
Niger - - - - - - - - - Niger
Nigeria - - - - - - - 179.93 4.3 Nigéria
Rwanda - - - - - - - - - Rwanda
Sao Tome & Principe - - - - - - - - - Sao Tome & Principe
Senegal - - - - - - - - - Sénégal
Seychelles - - - - - - - - - Seychelles
Sierra Leone - - - - - - - - - Sierra Leone
Somalia - - - - - - - - - Somalie
South Africa - - - - - - - - - Afrique du Sud
Sudan - - - - - - - - - Soudan
Swaziland - - - - - - - - - Swaziland
Tanzania - - - - - - - - - Tanzanie
Togo - - - - - - - - - Togo
Tunisia - - - 60.49 48.43 - 52.60 539.06 12.9 Tunisie
Uganda - - - - - - - - - Ouganda
Zambia - - - - - - - 25.00 0.6 Zambie
Zimbabwe - - - - - - - 125.00 3.0 Zimbabwe
Sub-Total - 37.25 56.68 172.15 296.01 248.02 463.74 4 168.43 100.0 Sous-Total
Multinational - - - - - - - - - Multinational
Total - 37.25 56.68 172.15 296.01 248.02 463.74 4 168.43 100.0 Total
1984-2007

30
African Development Bank Banque Africaine de Développement
Table 2.09 Tableau 2.09Loan Repayments, 1967-2007
Remboursements de prêts, 1967-2007(in million UA) (en million d'UC)
Country 2001 2002 2003 2004 2005 2006 2007 Total % Pays
Algeria 36.04 95.02 68.95 480.62 159.77 160.67 - 1 277.32 11.6 Algérie
Angola 2.10 2.13 1.69 1.10 1.08 1.10 0.35 37.11 0.3 Angola
Benin 0.27 0.27 0.25 0.24 0.23 0.12 9.90 26.57 0.2 Bénin
Botswana 9.83 9.27 8.23 7.30 6.25 6.08 - 153.78 1.4 Botswana
Burkina Faso 1.41 1.40 1.43 0.72 - - - 28.83 0.3 Burkina Faso
Burundi - - 0.41 4.69 1.82 17.58 - 58.80 0.5 Burundi
Cameroon 13.66 31.29 19.11 17.63 17.66 - 12.72 291.30 2.6 Cameroun
Cape Verde 0.50 0.13 0.08 - - - - 12.53 0.1 Cap Vert
Central African Rep. - 0.15 - - - - 2.35 14.62 0.1 Rép. Centrafricaine
Chad - - - - - - - - - Tchad
Comoros - - - - - - 6.23 10.75 0.1 Comores
Congo - 0.01 9.55 50.41 20.66 11.68 8.52 197.46 1.8 Congo
Congo, Dem. Rep. - - - - 8.31 12.45 16.13 102.45 0.9 Congo, Rép.Dém.
Cote d'Ivoire 22.07 93.61 0.98 0.93 0.92 0.94 24.55 469.96 4.3 Côte d'Ivoire
Djibouti - - - - - - - - - Djibouti
Egypt 36.35 105.92 156.69 22.56 67.11 23.26 40.57 860.47 7.8 Egypte
Equatorial Guinea 0.28 0.28 0.28 0.15 - - - 7.20 0.1 Guinée Equat.
Eritrea - - - - - - - - - Erythrée
Ethiopia 14.56 15.18 14.71 14.80 15.91 12.57 11.92 189.83 1.7 Ethiopie
Gabon 24.55 13.87 37.81 24.27 24.68 22.89 21.01 301.09 2.7 Gabon
Gambia 0.49 0.51 - - - - - 18.11 0.2 Gambie
Ghana 5.78 13.64 9.53 10.08 10.25 11.37 9.43 192.88 1.8 Ghana
Guinea 7.38 9.55 8.28 27.36 5.02 4.94 4.81 157.06 1.4 Guinée
Guinea Bissau 0.66 0.23 - - - - - 8.82 0.1 Guinée Bissau
Kenya 10.70 6.28 6.18 4.66 5.20 5.68 7.16 188.94 1.7 Kenya
Lesotho 1.19 1.15 1.13 1.14 1.12 0.67 0.63 36.90 0.3 Lesotho
Liberia - - - - - 0.01 37.24 68.12 0.6 Liberia
Libya - - - - - - - - - Libye
Madagascar 3.93 4.46 3.67 1.63 0.09 - - 59.88 0.5 Madagascar
Malawi 2.28 1.79 1.85 1.57 1.27 1.25 1.29 65.32 0.6 Malawi
Mali 0.38 0.38 - - - - - 11.33 0.1 Mali
Mauritania 3.42 3.35 3.13 3.69 4.22 5.18 5.93 74.87 0.7 Mauritanie
Mauritius 2.23 2.38 4.78 7.26 6.61 21.86 0.52 86.35 0.8 Maurice
Morocco 69.82 263.49 400.79 57.16 102.56 28.64 33.93 1 747.28 15.9 Maroc
Mozambique 3.71 0.83 0.88 0.52 - - - 85.17 0.8 Mozambique
Namibia - - 0.20 0.76 1.08 1.41 2.89 6.35 0.1 Namibie
Niger - - - - 1.69 1.71 1.63 30.01 0.3 Niger
Nigeria 84.62 87.69 91.78 85.91 90.90 93.15 97.70 1 130.18 10.3 Nigéria
Rwanda 0.04 0.05 0.02 - - - - 3.61 0.0 Rwanda
Sao Tome & Principe - - - - - - - - - Sao Tome & Principe
Senegal 5.88 11.89 8.46 8.66 8.74 8.48 7.38 156.71 1.4 Sénégal
Seychelles - 0.00 - - - 15.19 1.18 37.74 0.3 Seychelles
Sierra Leone - - - - - - - 9.67 0.1 Sierra Leone
Somalia - - - - - - - 3.85 0.0 Somalie
South Africa - 24.00 5.08 7.51 17.36 16.54 17.18 87.67 0.8 Afrique du Sud
Sudan - - 0.64 2.12 1.46 0.02 - 25.33 0.2 Soudan
Swaziland 4.09 3.77 4.77 4.81 4.85 4.86 5.30 85.47 0.8 Swaziland
Tanzania 1.10 0.64 0.64 0.63 0.63 0.63 0.61 54.97 0.5 Tanzanie
Togo - - - - 0.96 0.97 0.94 20.09 0.2 Togo
Tunisia 103.63 172.33 116.12 137.77 109.66 190.19 294.68 1 831.37 16.6 Tunisie
Uganda 0.54 0.55 0.55 0.56 1.63 1.65 1.61 116.16 1.1 Ouganda
Zambia 11.74 9.68 10.12 10.28 10.34 10.06 8.45 243.24 2.2 Zambie
Zimbabwe - 0.51 - - - - - 165.87 1.5 Zimbabwe
Sub-Total 485.26 987.72 998.79 999.50 710.04 693.81 694.75 10 849.43 98.5 Sous-Total
Multinational 7.30 8.91 9.95 9.88 3.95 12.60 9.30 161.81 1.5 Multinational
Total 492.56 996.64 1 008.74 1 009.38 713.99 706.41 704.05 11 011.24 100.0 Total
1967-2007

31
African Development Bank Banque Africaine de Développement
Table 2.10 Tableau 2.10Outstanding Loans, 2001-2007Encours des prêts, 2001-2007
(in million UA) (en million d'UC)
Country 2001 2002 2003 2004 2005 2006 2007 % Pays
Algeria 783.11 752.97 763.87 296.20 162.29 - - - Algérie
Angola 8.65 6.44 4.68 3.54 2.50 1.39 1.04 0.0 Angola
Benin 1.24 0.89 0.58 0.34 0.12 - - - Bénin
Botswana 51.59 41.41 36.77 30.16 41.71 34.33 24.48 0.4 Botswana
Burkina Faso 3.48 2.15 0.72 - - - - - Burkina Faso
Burundi 6.61 6.84 6.60 1.93 0.00 0.00 0.00 0.0 Burundi
Cameroon 153.18 119.43 99.85 81.25 69.98 58.35 67.43 1.2 Cameroun
Cape Verde 0.22 0.08 - - - - - - Cap Vert
Central African Rep. 2.44 2.39 2.43 2.47 2.39 2.39 - - Rép. Centrafricaine
Chad - - - - - - - - Tchad
Comoros 6.26 6.36 6.39 6.36 6.23 6.03 - - Comores
Congo 138.95 138.03 127.46 78.44 59.21 47.01 38.35 0.7 Congo
Congo, Dem. Rep. 343.49 347.94 346.68 343.47 742.62 708.55 689.52 12.4 Congo, Rép.Dém.
Cote d'Ivoire 439.38 361.05 366.89 366.84 361.61 360.46 341.50 6.2 Côte d'Ivoire
Djibouti - - - - - 5.32 5.06 0.1 Djibouti
Egypt 386.74 330.05 290.22 282.38 235.46 204.60 560.73 10.1 Egypte
Equatorial Guinea 0.68 0.42 0.15 - - - - - Guinée Equat.
Eritrea - - - - - - - - Erythrée
Ethiopia 111.30 96.86 83.00 67.70 51.36 38.25 26.46 0.5 Ethiopie
Gabon 230.36 219.88 183.34 216.13 198.03 191.17 169.62 3.1 Gabon
Gambia 0.51 - 0.00 - - - - - Gambie
Ghana 69.21 55.57 49.34 44.79 34.22 22.37 12.50 0.2 Ghana
Guinea 72.09 61.24 55.97 28.40 23.15 17.85 13.11 0.2 Guinée
Guinea Bissau 0.23 - - - - - - - Guinée Bissau
Kenya 41.79 35.29 28.90 26.97 23.46 16.98 9.67 0.2 Kenya
Lesotho 6.72 5.47 4.37 3.18 1.99 1.25 0.62 0.0 Lesotho
Liberia 42.54 41.59 40.36 39.62 40.44 39.20 3.55 0.1 Liberia
Libya - - - - - - - - Libye
Madagascar 9.50 5.39 1.73 0.09 - - 2.79 0.1 Madagascar
Malawi 12.37 11.46 10.46 9.09 7.36 6.43 5.44 0.1 Malawi
Mali 0.37 - - - - - - - Mali
Mauritania 30.11 32.99 41.67 44.72 42.81 35.75 28.69 0.5 Mauritanie
Mauritius 7.48 44.80 36.88 29.40 25.82 5.16 12.70 0.2 Maurice
Morocco 1 106.64 911.70 595.68 683.49 853.42 1 094.75 1 229.07 22.2 Maroc
Mozambique 2.03 1.34 0.52 - 8.75 21.60 25.31 0.46 Mozambique
Namibia 8.07 12.23 30.41 44.81 59.05 65.97 74.84 1.4 Namibie
Niger 0.00 0.00 - 8.05 7.00 4.99 3.16 0.06 Niger
Nigeria 637.52 574.66 562.68 514.57 462.89 401.44 374.76 6.8 Nigéria
Rwanda 0.07 0.02 - - - - - - Rwanda
Sao Tome & Principe - - - - - - - - Sao Tome & Principe
Senegal 80.89 69.48 64.52 56.04 44.85 36.37 34.14 0.6 Sénégal
Seychelles 19.53 19.98 20.47 20.46 20.01 5.32 4.20 0.1 Seychelles
Sierra Leone - - - - - - - - Sierra Leone
Somalia 3.57 3.72 3.75 3.80 3.69 3.67 3.72 0.1 Somalie
South Africa 91.13 85.54 131.84 154.78 198.42 207.88 182.22 3.3 Afrique du Sud
Sudan 60.13 59.60 58.51 55.37 53.78 51.77 51.28 0.9 Soudan
Swaziland 60.25 61.34 58.41 66.21 82.87 83.51 82.20 1.5 Swaziland
Tanzania 7.10 6.38 5.66 4.97 4.39 3.69 3.06 0.1 Tanzanie
Togo - - - 6.44 6.00 4.75 3.62 0.07 Togo
Tunisia 1 098.23 1 122.76 1 198.74 1 257.38 1 226.73 1 180.34 1 145.23 20.7 Tunisie
Uganda 4.37 3.87 8.76 7.96 6.69 4.83 3.13 0.1 Ouganda
Zambia 77.11 68.43 58.25 47.19 37.07 23.91 27.00 0.5 Zambie
Zimbabwe 211.98 204.00 197.22 192.87 200.02 195.14 191.98 3.5 Zimbabwe
Sub-Total 6 429.20 5 932.07 5 584.74 5 127.82 5 408.37 5 192.75 5 452.18 98.4 Sous-Total
Multinational 36.61 35.59 27.50 94.72 104.07 98.20 87.91 1.6 Multinational
Total 6 465.81 5 967.66 5 612.24 5 222.54 5 512.44 5 290.95 5 540.09 100.0 Total