african development bank – rationale, key design elements and sustainabilty 3.1 link with the csp,...
TRANSCRIPT

Original: English AFRICAN DEVELOPMENT BANK
PROGRAM: ECONOMIC DIVERSIFICATION SUPPORT LOAN COUNTRY: BOTSWANA
APPRAISAL REPORT
Draft (08 May, 2009)
Appraisal Team
Team Leader: Issa Faye, Senior Economist, OSGE.2 Team Members: Stephen Olanrewaju, Consultant, OSGE.2 Sector Manager: Marlene Kanga, OSGE.2 Sector Director: Gabriel Negatu, OSGE.0 Regional Director: Abdirahman Beileh, ORSA.0
Peer Reviewers
Steve Kayizzi Muguera, Lead Economist, OREA Hela Cheikhrouhou, Division Manager, OPSM Charles Muthuthi, Chief Financial Specialist, OSGE2 Negatu Makonnen, Policy Economist, Swareh Darbo, Senior Economist, ORSA Mothobi Matila, Senior Economist, OSGE.2 Kate Tench, Principal Governance Expert, OSGE1 Carlos Mollinedo, Senior Country Economist, OREB

i
TABLE OF CONTENTS CURRENCY EQUIVALENTS FISCAL YEAR WEIGHTS & MEASUREMENTS ACRONYMS & ABBREVIATIONS LOAN INFORMATION PROGRAM EXECUTIVE SUMMARY RESULT-BASED LOGICAL FRAMEWORK PROGRAM TIMEFRAME I –THE PROPOSAL II – COUNTRY AND PROGRAM CONTEXT 2.1 Government overall development strategy and medium-term reforms priorities 2.2 Recent economic and social development, perspectives, constraints and challenges 2.3 Bank Group portfolio status III – RATIONALE, KEY DESIGN ELEMENTS AND SUSTAINABILTY 3.1 Link with the CSP, analytical works underpinnings and country readiness assessment 3.2 Collaboration and coordination with other donors and Stakeholders 3.3 Outcomes and lessons from past similar operations 3.4 Bank comparative advantages 3.5 Application of good practices principles on conditionality
IV – THE PROPOSED PROGRAM AND EXPECTED RESULTS 4.1 Program’s goal and purpose 4.2 Program’s pillars, operational objectives and expected results 4.3 Financing needs and arrangements 4.4 Program Beneficiaries 4.5 Impacts on gender 4.6 Environmental impacts V – IMPLEMENTATION, MONITORING AND EVALUATION 5.1 Implementation arrangements 5.2 Monitoring and evaluation arrangements VI – LEGAL DOCUMENTATION AND AUTHORITY 6.1 Legal Documentation 6.2 Conditions associated with Bank’s intervention 6.3 Compliance with Bank Group Policies VII – RISKS MANAGEMENT VIII – RECOMMENDATION
ii ii ii iii iv v vi 1 1 1 2 7 7 7 9 10 10 10 11 11 11 14 15 15 15 15 15 16 16 16 17 17 17 18
ii
Appendixes Appendix 1 : Map of Botswana Appendix 2 : Medium Term Economic and Financial Indicators, 2007-2011 Appendix 3 : Social Development Indicators Appendix 4 : Millennium Development Goals Appendix 5 : Matrix of Policy Measures Appendix 6 : Summary of PFM Performance Scores, February 2009 Appendix 7 : Bank Group Ongoing Operations Technical Appendixes Appendix 1 : Letter of Development Policy Appendix 2: IMF-Country Relations Note Tables Table 1 : Strategic Pillars Table 2 Key Macroeconomic Indicators, 2004/05-2009/10 Table 3 : A summary Assessment of the Prerequisite Conditions of the Program Table 4 : EDSL - Prior Actions before Board presentation Table 5 : Financing Requirements (in Pula millions) Boxes Box 1 : Impact of the crisis on GoB’s revenue Box 2: Six Hubs to Spearhead Diversification Graphs Graph 1; Ease of Doing Business (Rank) Graph 2: Governance Score (0-3)
Currency Equivalents As of May, 2009
Currency Unit = Botswana Pula 1 UA = 11.5395 Pula 1 US$ = 7.7041 Pula 1 UA = US $1.49783
Fiscal Year 1 April to 31 March
Weights and Measures (If relevant)
1metric tonne = 2204 pounds (lbs) 1 kilogramme (kg) = 2.200 lbs 1 metre (m) = 3.28 feet (ft) 1 millimetre (mm) = 0.03937 inch (“) 1 kilometre (km) = 0.62 mile 1 hectare (ha) = 2.471 acres
iii
Acronyms and Abbreviations AfDB African Development Bank ADF African Development Fund AIDS Acquired Immunodeficiency Syndrome AWF African Water Facility BDC Botswana Democratic Corporation BEDIA Botswana Export Development and Investment Authority BIDPA Botswana Institute for Development Policy Analysis BSE Botswana Stock Exchange CEDA Citizen Entrepreneurial Development Agency CEDAW Convention on the Elimination of All forms of Discrimination
against Women CGP Country Governance Paper DDB Department of Development Budget EC European Commission EDSL Economic Diversification Support Loan GATS General Agreement on Trade in Services GABS Government Accounting and Budgeting System EDSL Economic Development Support Loan GDP Gross Domestic Product GTZ German Technical Cooperation HIV Human Immunodeficiency Syndrome ICA Investment Climate Assessment IFSC International Financial Services Centre IMF International Monetary Fund LEA Local Enterprise Authority MFDP Ministry of Finance and Development Planning MIC Middle Income Countries NBFIRA Nonbank Financial Institutions Regulatory Authority NBFIs Nonbank Financial Institutions NDB National Development Bank NDP National Development Plan PEEPA Public Enterprise Evaluation and Privatisation Agency PEFA Public Expenditure and Financial Accountability PFM Public Financial Management PPP Public Private Partnership PRC Project review Committee PSDS Private Sector Development Strategy RADP Remote Area Development Program RBCSP Results based Country Strategy Paper SACU Southern African Customs Union SMEs Small-Medium Enterprises UNDP United Nations Development Program UNECA United Nations Economic Commission for Africa USAID United States Agency for International Development TI Transparency International

iv
LOAN INFORMATION
Client’s information LOAN RECIPIENT: Republic of Botswana EXECUTING AGENCY: Ministry of Finance and Development Planning Financing Plan for 2008/09
Source Amount (UA) Instrument ADB
1.00 billion (US$1.5 billion)
General Budget Support Loan
TOTAL COST UA 1.00 billion
(US$1.5 b)
ADB/ADF key financing information
Loan currency
USD
Interest type* Fixed or floating Interest rate* Bank’s cost of
funding +40 bp1 Tenor 20 Years Grace period 5 Years
*if applicable Timeframe - Main stepping stones (expected)
OpsCom Clearance May 6th 2009
Board approval May 27th 2009 Effectiveness June 2009 Disbursement (first tranche) Disbursement (second tranche) Completion
June 2009 January 2010 March 2010
Last repayment December 2029
1 Current Bank’s borrowing cost is LIBOR-16 bp

v
Program Executive Summary Paragraph Topics to cover Program Overview
Program Name: Botswana – Economic Diversification Support Loan (EDSL) Geographic Scope: Entire Nation Overall Timeframe: 2009/10 Fiscal Year Overall Loan Amount: UA1.00.billion (US$1.5 billion). Program Output: The program key outputs include reforms in the following areas: (i) NDB Privatisation Strategy; (ii) Public-Private-Partnership Framework, (iii) Competition Law, (iv) Trade Policy, (v) Financial Intelligence Act, and (vi) Securities Bill.
Program Description
The EDSL is designed to support the implementation of the Government’s 2009/10 budget aimed at alleviating the negative impact of the global financial and economic crisis on Botswana’s economy. It will fill part of the budget deficit (13.5% of GDP). Its goal is to create competitive conditions for accelerated private sector growth, economic diversification and poverty reduction. The program focuses on the following key areas of reforms (i) promotion of privatization and Public-Private-Partnership (PPP) initiatives, (ii) Improvement of competitiveness and trade, and (iii) improvement of financial sector governance and strengthening of the regulation of nonbank financial institutions.
Program Outcomes and Beneficiaries
The direct outcomes of the program are: (i) emergence of a vibrant non-mineral private sector activity, (ii) greater application of market efficiencies, (iii) improved private sector regional competitiveness, (iv) improved regulation of nonbank financial institutions, (v) improved capital market development; (vi) increased FDI inflows; (vii) improved governance in the financial sector; and (viii) increased citizen owned business participation in the capital market. The GoB is the direct beneficiary while the private sector actors and the entire population of the country are the indirect beneficiaries.
Needs Assessment
The 2009/10 budget was formulated under a very difficult global financial and economic condition. The performance of the diamond industry, which is the mainstay of the economy, has been hard hit by the financial and economic crisis in the major markets of the USA, Japan and Europe. Thus, after many years of running budget surpluses, Botswana now has to contend with a huge budget deficit of 13.5% of GDP in the 2009/10 budget. This development and the fact that diamond production is expected to cease by 2030, suggest that diversification and a vibrant private sector are essential to ensure long term sustainability of the economy. In doing so, the enabling environment including the removal of infrastructural constraints, needs to be strengthened. To this end Government needs resources to implement key infrastructural development projects many of which are ongoing and are essential to enhance the delivery of social services, improve the prospects for growth, create employment and reduce poverty.
Bank’s Added Value
After a period of non lending activities more than 12 years, the Bank became active again in Botswana in the past five years using largely grants for studies and capacity building. This helps re-establish the Bank’s presence in the country and raise the level of dialogue. Botswana considers borrowing again from the Bank. The Bank brings to bear on this operation experience gained in designing general budget support operations for other African middle income countries (MIC) such as Morocco, Egypt, Tunisia and Mauritius. The key lesson is that such programs should meet the specific needs of these countries, including a high degree of flexibility.
Institutional development and Knowledge building
The program will contribute to institutional development and knowledge building in the area of General Budget Support Operation and PPP. The Bank will capture the knowledge from this program through careful monitoring and the Program Completion Report (PCR).
vi
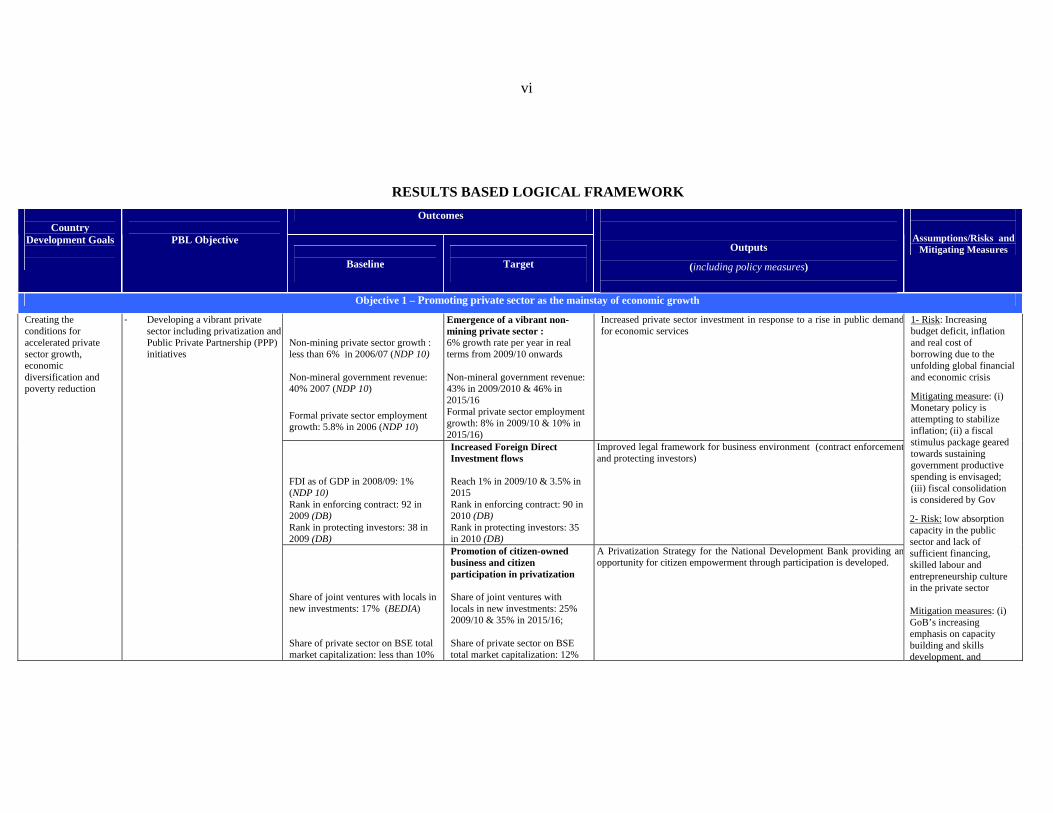
RESULTS BASED LOGICAL FRAMEWORK
Outcomes
Country Development Goals
PBL Objective
Baseline
Target
Outputs
(including policy measures)
Assumptions/Risks and Mitigating Measures
Objective 1 – Promoting private sector as the mainstay of economic growth
Non-mining private sector growth : less than 6% in 2006/07 (NDP 10) Non-mineral government revenue: 40% 2007 (NDP 10) Formal private sector employment growth: 5.8% in 2006 (NDP 10)
Emergence of a vibrant non-mining private sector : 6% growth rate per year in real terms from 2009/10 onwards Non-mineral government revenue: 43% in 2009/2010 & 46% in 2015/16 Formal private sector employment growth: 8% in 2009/10 & 10% in 2015/16)
Increased private sector investment in response to a rise in public demandfor economic services
FDI as of GDP in 2008/09: 1% (NDP 10) Rank in enforcing contract: 92 in 2009 (DB) Rank in protecting investors: 38 in 2009 (DB)
Increased Foreign Direct Investment flows Reach 1% in 2009/10 & 3.5% in 2015 Rank in enforcing contract: 90 in 2010 (DB) Rank in protecting investors: 35 in 2010 (DB)
Improved legal framework for business environment (contract enforcementand protecting investors)
Creating the conditions for accelerated private sector growth, economic diversification and poverty reduction
- Developing a vibrant private sector including privatization and Public Private Partnership (PPP) initiatives
Share of joint ventures with locals in new investments: 17% (BEDIA) Share of private sector on BSE total market capitalization: less than 10%
Promotion of citizen-owned business and citizen participation in privatization Share of joint ventures with locals in new investments: 25% 2009/10 & 35% in 2015/16; Share of private sector on BSE total market capitalization: 12%
A Privatization Strategy for the National Development Bank providing anopportunity for citizen empowerment through participation is developed.
1- Risk: Increasing budget deficit, inflation and real cost of borrowing due to the unfolding global financial and economic crisis
Mitigating measure: (i) Monetary policy is attempting to stabilize inflation; (ii) a fiscal stimulus package geared towards sustaining government productive spending is envisaged; (iii) fiscal consolidation is considered by Gov
2- Risk: low absorption capacity in the public sector and lack of sufficient financing, skilled labour and entrepreneurship culture in the private sector Mitigation measures: (i) GoB’s increasing emphasis on capacity building and skills development. and

vii
in 2008 in 2009/10 & 17% in 2015/16 A PPP policy framework has been developed
Electricity imports from South Africa : 70% of its power requirements in 2008-09 Perception: PPP is ineffective= 54% in 2003/04 (UNECA, Governance survey)
Enhanced quality and efficiency in the delivery of infrastructure phase out electricity imports from South Africa by 2013) Perception: PPP is ineffective= 20% in 2009/10
A Regulatory framework for PPPs has been set up
development of NHRDS and Plan which will guide training and match skills development with labour market needs, (ii) Establishment of vocational training at workplace in 2008 (iii) Mechanisms supporting citizen-owned SMEs such as BEDIA, IFSC, CEDA, BDC, LEA, are being strengthened, including establishment of a Venture Capital Fund
The non competitive policy hampers free trade in certain areas of commercial activity
Greater application of market efficiencies to commercial activities in which Government continues to be involved
Competition Law to curb unfair and restrictive business practices has beenenacted
Share of services in total international trade: 20% in 2006 Contribution of services to women employment: 75% in 2007 (BTTP-BIDPA) Rank of trading across borders: 149 in 2009 (DB)
Enhanced diversification towards the service exports sector and Greater integration into the multilateral trading system share of services in total international trade; 25% 2009/10 & 30% 2015/16 Contribution of services to women employment: 78% in 2009/10; 80% in 2011/12 Rank of trading across borders: 145 in 2010 (DB)
A trade policy promoting the service exports and regional integration isdeveloped.
- Improving competitiveness and Trade
Non traditional exports2 share of total exports: less than 10% (NDP 10)
Improved private sector regional competitiveness: the share of non-traditional exports in total exports: 10% in 2009/10 & 13% 2013/14
Productive investment in relevant infrastructure, skill development andtraining are provided to the private sector
Risks # 1 & 2
3- Risk; Adequate policy and regulatory framework (electronic data exchange, IT, obstacles to liberalization process in transport sector) are lacking
Mitigation measures: (i) GoB is developing a trade policy; (ii) Botswana could consider GATS commitments in banking services; and (iii) SADC consultations
2 Defined as total merchandise exports excluding diamonds, copper-nickel, beef and vehicles

viii
Foreign exchange reserves: 24.4 months in 2007 (NDP 10)
Strengthened competitiveness and external financial position (Increase import cover provided by the foreign exchange reserves to 28 months in 2009/10; and 32 months 2013/14)
The Pula Exchange rate is maintained stable with respect to the country’smajor trading partner currencies (the South Africa Rand)
Objective 2 -- Deepening the financial sector and strengthening the regulation of nonbank financial institutions (NBFIs)
Pension fund industry assets=P30.3 billion in 2008 (Budget speech-NBFIRA) General insurance industry net assets=P423,846,000 in 2007 (NBFIRA) 7 International companies certified by IFSC in 2007
Increased non-banking financial sector: Pension fund industry assets=P35 billion in 2009/10 General insurance industry net assets= P450,000,000 in 2009/10; P500,000,000 in 2011/12 10 International companies certified by IFSC in 2009/10 15 International companies certified by IFSC in 2011/12
A legislative framework to position Botswana as the medium to long termpreferred offshore financial services centre for sub-Saharan Africa ispromulgated
The average trading turnover: P4.8 million/day in 2008 (BSE) % change in BSE Domestic Company Index: -16.5% in 2008/09 Rank of access to credit in 2009: 43 in 2009 (DB) Number of shares traded by BSE: 124.6 millions 2007
Development of the capital market Increase in the average trading turnover: P7 million/day in 2009/10 % change in BSE Domestic Company Index: greater than 0 in 2009/10 Rank of access to credit in 2009: 40 in 2010 (DB) number of shares traded by BSE: 250 millions 2009/10)
Revise the Securities Act to transform the Botswana Stock Exchange (BSE)from a parastatal to a commercial organization.
- Developing financial market and improving governance
Average workload for the investigators from the DCEC: number of cases=16 in 2009
Improved governance in the financial sector Average workload for the investigators from the DCEC : number of cases=12 in 2009/10 & 8 in 2012/13
A Financial Intelligence Law has been enacted and fully operational
4-Risks: Exogenous shocks exacerbating the liquidity constraints of BSE
Mitigation measures: joint ventures with South African managers to inject liquidity in BSE. New instruments and marketing initiatives are being developed: create national credit rating, draft listing rules for securitization
5-Risk: Possible sanctions for money laundering offence are not dissuasive lack of framework to enforce corporate governance Mitigation measures: Botswana has signed and ratified the SADC Protocol Against Corruption, and is actively cooperating in International anti-money laundering activities. The Bank is assisting Botswana to prepare a corporate governance code.

I THE PROPOSAL 1.1 Management submits the following report and recommendations on a proposed loan to the Republic of Botswana for an amount of UA1.00 billion (US$1.5 billion) to finance an Economic Diversification Support Loan (EDSL) program. The loan, in the form of a General Budget Support will partly finance the fiscal deficit (13.5% of GDP) in the 2009/10 budget. The proceeds of the loan will be disbursed in two tranches in the 2009/10 fiscal year (US$1.0 billion and US$0.5 billion respectively). The program was appraised during the period 20–30 April, 2009, following a request of the Government of Botswana (GoB) in March, 2009. The program is consistent with the main thrust of Botswana’s Tenth National Development Plan (NDP-10) [April 2009-March 2016], the reforms articulated in the 2009/10 Budget Speech and the Bank’s Results Based Country Strategy Paper (RBCSP) for Botswana (2009-2013). The design of the EDSL program has taken into account the good practice principles on conditionality and country ownership. 1.2 The goal of the program is to create competitive conditions for accelerated private sector growth, economic diversification and poverty reduction. This will facilitate reduced dependence on mineral revenue, promote fiscal sustainability and help alleviate the negative impact of the global financial and economic crisis. It will also reinforce Government’s efforts to sustain growth, employment creation and poverty reduction in the long run. GoB is trying to do things differently and turning challenges into opportunities. It plans to use a combination of sources to finance the fiscal deficit namely domestic bond issue, borrowing from international financial institutions (IFIs) and draw down on reserves. In addition to being a response strategy to the global crisis, GoB considers borrowing from IFIs as a deliberate policy to ensure that Botswana benefits from international best practices. The operational policy objectives of the program are: (a) promoting the private sector as the mainstay of economic growth and (b) deepening the financial sector and strengthening the regulation of nonbank financial institutions (NBFIs), both of which aim at deepening economic diversification. The expected outcomes include: (i) emergence of a vibrant non-mineral private sector activity, (ii) greater application of market efficiencies, (iii) improved private sector regional competitiveness, (iv) improved regulation of nonbank financial institutions, (v) improved capital market development; (vi) increased FDI inflows; (vii) improved governance in the financial sector; and (viii) increased citizen-owned business participation in the capital market. II – COUNTRY AND PROGRAM CONTEXT 2.1 Government overall development strategy and medium-term reforms priorities 2.1.1 The National Development Plans (NDPs) are the main instruments for implementing the policies and programs to achieve Vision 2016, the country’s long term perspective plan. NDP 10 covers the period April 2009-March 2016 and seeks to translate the Vision 2016 objectives into concrete policies and actions. Its main theme is “Accelerating Achievement of Vision 2016”. The strategic thrust of NDP 10 is to accelerate diversification of the economy, as a means of reducing poverty and expanding employment creation (see table 1). Its main areas of focus include human resource development; infrastructure and utilities; agriculture and environment; and governance. In its Private Sector Development Strategy finalized in November 2008, GoB also lays out the roadmap for expanding and strengthening private sector participation in Botswana's economic development.

2
2.1.2 Due to its small market size, regional integration has been identified as a major cross-cutting issue for Botswana’s economic diversification.3 The country is a member of SADC and SACU. SADC free-trade area launched in August 2008 is expected to generate benefits such as expanded market and opportunities for investment. The harmonization of regulations and standards required to move towards a single market could play a major role in increasing investment and trade within the SADC region and beyond. Together with other SACU members, Botswana has also concluded an Economic Partnership Agreement (EPA) with the EC and the common market of the Southern Cone to expand trade opportunities.
2.2 Recent economic-social developments, perspectives, constraints and challenges
Economic Performance Up to 2007/08 2.2.1 Economic developments in Botswana have been generally positive and the macroeconomic fundamentals have been sound (see Table 2). At the conclusion of the last Article IV Consultation in February 2008, the IMF commended the country for its good track record of sound macroeconomic policies, good governance and high levels of investment made possible by prudent utilization of mineral wealth. The economy recorded strong GDP growth (averaging 4.3%) over the period 2004/05-2007/08, reduction in inflation and continued strong balance of payments and fiscal surpluses. Monetary policy has kept interest rates high to stabilise inflation around the authorities’ inflation objective of 4-7%. The exchange rate policy has had to strike a difficult balance between supporting low inflation on the one hand and maintaining international competitiveness by reducing domestic prices in international terms. External debt is low and gross external reserves have generally been high reaching 25 months import cover in 2006/07 slightly declining to 24.4 months in 2007/08. These sound macroeconomic fundamentals are now being put at risk by the global financial and economic meltdown.
3 Prospects for Export Diversification (2006). BIDPA and the World Bank.
Table 1: Strategic Pillars Overall Goal: Accelerate Diversification of the Economy, as a Means of Reducing Poverty
and Expanding Employment Creation VISION 2016 PILLARS NDP 10 GOALS
1. Educated & informed nation
1. Adequate supply of qualified, productive & competitive human resources 2. Innovative & productive usage of information & technology
2. Prosperous, productive & innovative nation
3. Sustainable rapid economic growth 4. Well developed & reliable infrastructure 5. Sustainable management of natural resources
3. Compassionate, just & caring nation
6. Eradication of absolute poverty 7. Adequate social services 8. Affordable & quality healthcare 9. Prevent new HIV/AIDS infections
4. Safe & secure nation 10. Public safety& protection 11. Territorial integrity & sovereignty
5. Open, democratic & accountable nation
12. Transparency & accountability in all public & private institutions 13. Enhanced & sustainable participatory democracy 14. Rule of law
6. Moral & tolerant nation 15. Enhanced cultural heritage & diversity 7. United & proud nation 16. Strong national identity & unity

3
Table 2: Key Macroeconomic Indicators 2004/05-2009/10
2004/05
2005/06
2006/07
2007/08
2008/09 Proj.
2009/10 Proj.
Real GDP (%) 9.2 -0.8 5.3 3.3 3.0 - 1.2 Consumer Price Index (annual average) (% change)
7.0 8.6 11.6 7.0 13 7.0
Growth in M2 (%) 13.9 10.6 67.4* 23.6 11.5 10.0 Gross Investment (% of GDP) 35.8 26.2 27.4 31.6 35.3 35.8 Gross Domestic Savings (% of GDP) 48.0 44.0 46.7 45.7 44.6 43.4 Saving-investment balance (% of GDP) 12.2 17.8 19.3 14.2 9.3 7.6 Fiscal Balance (% of GDP) 1.2 8.4 11.8 8.0 -4.8 -13.5 Current Account Balance (% of GDP) 2.9 14.4 19.3 20.4 3.4 0.9 Balance of Payments (% of GDP) -0.6 13.2 16.6 17.2 12.1 11.2 External Debt (% of GDP) 4.3 4.1 3.5 2.7 2.2 4.6 External Debt Service (% of exports) 9.5 8.1 6.9 5.1 4.6 9.1 FDI (net) % of GDP 4.4 2.8 2.6 3.4 1.0 1.0 Gross Official Reserves (US$ million) 5,653 6,278 7,954 9,907 11,414 12,898 Gross Reserves (months of imports cover)
18.3 23.0 25.0 24.4 28 18
Source: IMF: Botswana – 2007 Article IV Consultation, Staff Report, February, 2008; 2009 Budget Speech and Risk intelligence services (2009/10). * The jump in M2 growth rate in 2006/07 is due to change in definition. Following the new reporting system, the broad measure of money, M4, ceases to exist. The foreign currency deposits, which were previously reported as part of M4, have been reclassified under transferable and other deposits, which go under M1 and M2, respectively. Following the move by the Bank of Botswana, effective March 2006, to abolish private sector from trading in BoBCs, M2 and M3 converged.
The Impact of the Global Financial and Economic Crisis and Government’s Response
2.2.2 Botswana was hit by the global financial economic crisis in November 2008 and the mining sector has been hardest hit resulting in mine closures and retrenchments. Botswana’s economy is largely dependent on mineral exports, especially diamond. Weak global demand and falling prices of minerals, due to the slowdown in the global economy, have led to lower export receipts and revenues for GoB (see box 1). Up to October 2008, there was high demand for diamonds, and other minerals (copper and nickel) and prices were good. Diamond sales ranged between US$200 million and US$300 million per month, but by November 2008, Botswana hardly had any sales. To contain costs, Debswana (the 50-50 joint venture between GoB and De Beers) has closed Opara 2 and Damtshaa mines for the rest of 2009 and suspended operations at Lethakane and Opara No. 1 until April 2009 leading to decreasing yield from 33 to 22 million carat in 2008. Diamond prices in 2009 are expected to be 15% lower than the 2008 book price. Therefore, the overall Debswana revenue is expected to fall by 50% as a result of reduced production and low diamond prices, leading to reduced export earnings and revenue to GoB from royalties. The reduction in revenues, when set against GoB’s expenditure plans, has resulted in a substantial budget deficit estimated at 13.5% of GDP in 2009/10. Although the GoB is still in the process of revising the projected real GDP growth rates, independent projections indicate negative growth rate for 2009/10 (see Table 2), with the possibility of growth picking up in 2010/11. These projections are however tentative as the impact of the crisis is still unfolding and its magnitude cannot be precisely determined at this stage.4 2.2.3 Other sectors of the economy have also been affected leading to job losses. Non mineral sectors (manufacturing and services, including tourism) which are key to diversification have also been affected. However, the meat sector is in good condition and opportunities exist to fully utilize
4 The ongoing forecast from MFDP has estimated the 2009/10 budget deficit to P16.9 billion, equivalent to 16.4% of GDP. Growth projections for 2008/09 and 2009/10 are also being revised downwards by most analysts (World Bank, and EIU).

4
slaughtering plant capacity by encouraging farmers to increase the volume of cattle brought for slaughter. The financial sector has also been resilient because of low levels of integration with the global financial system and less exposure to complex financial instruments and foreign funding. The negative impact on the real sectors has however led to job losses. From January to March 2009, the Commissioner of Labour received 87 Notices of retrenchment from different companies, mostly from mining and quarrying (39% of the retrenched workers), followed by services (37%) and manufacturing (15%). A total of 1,856 workers were retrenched during the period, thus worsening the unemployment and poverty situation. Furthermore, the global crisis is also having its toll on foreign direct investment (FDI), the stock market, and overall growth of the economy, as well as benefits from regional integration. Net FDI is projected to decline from 3.4% of GDP in 2007/08 to 1.0% in 2008/09 and 2009/10. The domestic capital index of the Botswana Stock exchange (BSE) declined by 16.5% in the last quarter of 2008 and further by 11% during the first quarter of 2009; and market capitalization declined from US$4.79 billion in March 2008 to US$3.25 billion in March 2009. The global crisis has also weakened the benefits from regional integration arrangements, resulting in negative adjustment in SACU revenue pool in 2008/09. A 10% drop in revenue generated from excise duty on goods and services entering and leaving SACU, mostly through South Africa, has affected each country in the region. Box 1: Impact of the crisis on GoB’s revenue The substantial downward revision in mineral revenue has major implications for GoB revenues in terms of receipts from royalties. The revenue and grants in the 2009/10 budget are estimated at P24.39 billion, which is much lower than the P28.63 billion realized in 2007/08. The largest contributor to revenue is Customs and Excise (28.97%) followed by mineral revenue (28.02%). The balance is made up of other non mineral revenue including VAT, Bank of Botswana (BoB) profits and dividends, and registration of vehicles, licenses, etc. The surplus over the last decade has been put in the Pula Fund invested in a balanced international portfolio – bonds and equities across major currencies. The returns on the investments are part of BoB’s revenue shared with the GoB on the basis of its proportion of deposits in the BoB’s balance sheet. That income in turn helps finance the development budget. Poor performance of the international stock markets and possibility of lower bond yields would affect GoB’s share of returns on the Pula Fund. Also, the drop in SACU revenue pool is already leading to a negative adjustment for member countries. This negative revenue outlook, calls for improved efficiency in internal revenue administration. The 2009 PEFA report indicated that tax compliance is poor in Botswana despite the low tax rate. To improve efficiency of revenue management, the Botswana Unified Revenue Services (BURS) is strengthening intelligence gathering activities by opening more offices across the country. Also, technical assistance from the Swedish cooperation aimed at enhancing BURS’ revenue administration capacity, will begin in 2009. 2.2.4 Responding, GoB adopted a stimulus package in the 2009/10 Budget, comprising infrastructural development programs under various sectors (power, roads, telecommunications and dams), labour intensive public works program, and continuation of the various social welfare programs5 but with improved targeting, effectiveness and efficiency to protect the poor and vulnerable groups. The spending plans will stick to the GoB’s commitment to a deficit of not more than 10% of GDP for 2009/10 and 2010/11 averaged over the two years. The idea is to keep the domestic economy going as much as possible without jeopardising the country’s credit rating and the long-term development plans that depend on critical infrastructure investments. Since these investment programs and hence the supporting AfDB loan are already part of the planned expenditures in the 2009/10 budget and are not extra-budgetary expenditures, they are expected to have a positive, non-inflationary, impact on growth, unemployment and poverty reduction. A large fringe of the development macroeconomics’ literature has provided empirical evidence that supports this non-inflationary
5 These include programs for destitute persons, orphans, home based care patients, vulnerable children, school feeding and old age pensions.

5
argument.6 Moreover, GoB has also announced a combination of monetary and fiscal policy measures, aimed at stabilizing the real exchange rate (REER) to its equilibrium level. The shift from a fixed to a crawling peg exchange rate regime in 2005 appears to have resulted in greater stability of the REER. Therefore, consider the entire above; one could consider that, in the short run, the exchange rate level is not likely to be affected by the magnitude of the loan.
Social Conditions
2.2.5 Despite impressive progress in macroeconomic fundamentals, considerable social challenges remain. The HIV/AIDS pandemic remains a serious challenge, though the incidence has started falling (currently estimated at 17.1% of population aged 15-49). Also, poverty incidence (30% of the population), inequality (Gini Coefficient of 0.63), and unemployment (18%) are still at unacceptable levels. Other social indicators such as infant mortality rate (44.7 per 1’000 live births), gross primary school enrolment (112.2 %) and access to safe water (96%) are all better than the average for Africa (see Appendix 3). However, GoB is still committed to further improvements.
Investment Climate
2.2.6 Many aspects of the investment climate are favourable in Botswana. The results of the 2007 Investment Climate Assessment (ICA) for Botswana, was benchmarked against the other SACU countries and four high performing middle income economies: Argentina, Chile, Malaysia and Mauritius with respect to both firm performance and measures of the investment climate. Firms have little or no complaints about aspects of the investment climate relating to regulation, infrastructure, taxation, macroeconomic instability, labour productivity and corruption. Objective indicators of the ICA suggest that Botswana compares relatively well with other middle-income countries in these areas. However, despite this relatively attractive investment climate, there are some areas of concern. Less than a quarter of manufacturing enterprises export and on average exports account for only 10% of output which is lower than in the other MIC comparators. Also, Sales to the GoB and state-owned enterprises are more important in Botswana than in other countries. As a result, firms in Botswana do not appear to be highly competitive. Firms in Botswana finance about 10% of working capital through bank financing compared to between 30 and 35% in comparator countries, implying limited access to credit.7 Only 30% of manufacturing firms in Botswana provide training and this is fewer than in most of the comparators. The cost of crime, estimated at $112 per worker per year or 0.6% of sales, is quite high compared to most comparators. In terms of the Doing Business (DB) indicators, Botswana ranks 7th among the top ten regulatory reformers indicated in the 2009 DB report and rose from 52nd position in 2008 to 38 in 2009 in overall reforms out of 181 countries (see Graph 1 for details). Botswana made the process of business start-ups (rank improved from 102 to 80) easier through computerization while the Companies Act 2003 has strengthened investors protection (rank improved from 110 to 38).
6 In fact, this could be non-inflationary (i) since GoB does not consider seignoriage or base money creation as part of the potential options to finance the deficit; (ii) if the elasticity of money demand with respect to changes in inflationary pressures is weak. (iii) If the public believes that GoB will introduce an effective fiscal consolidation program as stated in the 2009 budget speech to lower or maintain the deficit within manageable range. In the sense that, inflationary expectations will adjust downward and current inflation will fall . See Agenor and Montiel (2008) for more details. 7 While Botswana compares favourably well with other SACU countries, its performance in this regard is inferior to other MIC comparators. The 2009 Doing Business survey also shows a decline of access to credit indicator from a rank of 40 in 2008 to 43 in 2009.

6
Graph 1- Ease of Doing Business (Rank)
Ease of Doing Business
Starting a business
Dealing with licenses
Employing Workers
Registering property
Getting creditProtecting investors
Paying taxes
Trading across borders
Enforcing contracts
Closing a business
Botswana Sub Sahara Highest Africa
Graph 2- Governance (Score 0-3)
0,00,5
1,0
1,5
2,0
2,53,0
Government Effectiveness
Voice and Accountability
Corruption Perception
Rule of Law
Botswana Sub Sahara Highest Africa
Source: AfDB Statistics Department using data from the WGI, WB, 2008 Good Governance Situation
2.2.7 Botswana is regarded as an example of a well governed state with desirable attributes. One of the findings of the Bank’s 2008 Country Governance Profile (CGP) is that Botswana ranks in the top 25% of various governance indices world-wide, and in most cases, tops the African region. This is due to a number of factors including prudent management of the economy, effective national development planning, dedicated leadership, capable state institutions, in-built checks and balances, and an efficient judicial system. This view is also corroborated by another recent report on the Progress of Good Governance in Botswana jointly prepared by the Botswana Institute for Development Policy Analysis (BIDPA) and the United Nations Economic Commission for Africa (UNECA) which also assessed Botswana’s governance performance as very impressive8. Other governance assessments by the World Bank (see Graph 2), the Mo Ibrahim Foundation, World Economic Forum, Transparency International and the Commonwealth Business Council, have all ranked Botswana highly. The Bank CPIA has consistently ranked Botswana in the first quintile consistently for the past five years, with an average overall score of 4.68 over the period 2006-2008; the average score for economic management is 5, structural policy (4.5), policies for social inclusion and equity (4.2) and public sector management and institutions (5).
Key Medium-Term Constraints and Challenges 2.2.8 Although Botswana has a track record of impressive performance, the country still faces a number of key constraints and challenges including: (i) Over-reliance on unsustainable diamond revenue could undermine fiscal sustainability as the
current global economic slowdown has revealed. Although the economy is diversifying slowly, the prospects of a sharp decline in diamond production after 2020 makes it compelling to ensure rapid diversification away from diamonds as a strategy to support long-term growth, employment generation and poverty reduction.
8 BIDPA and UNECA: The Progress of Good Governance in Botswana 2008, Final Report of the UNECA Project measuring and Monitoring Progress Towards Good Governance in Africa: The African Governance Report II (AGR II).

7
(ii) High prevalence of HIV/AIDS continues to exact a heavy toll on the economy and human
capacity development, although there is recent evidence of a decline in the prevalence rate among the 15-59 age bracket from over 30% in 1995 to 17.1% currently.
(iii) Poverty Incidence (30%), inequality (Gini coefficient of 0.63) and unemployment (18%) remain high despite GoB efforts to address them. The prevailing poverty and unemployment stems, in part, from the capital intensive nature of the mining sector which employs less than 5% of the labour force.
(iv) Inadequate and high cost of infrastructure (transport, energy and water) affects competitiveness. As a land-locked country, a well developed physical infrastructure is integral to Botswana’s regional and international competitiveness. Productivity in virtually every sector of the economy is affected by the inadequate quality and performance of the country’s infrastructure.
(v) Capacity constraints, which are partly due to the impact of HIV/AIDS, affect service delivery and constitute a serious constraint to implementation capacity in both the public and private sectors. The situation is compounded by skills mismatch in the labour market in terms of supply of and demand for labour. This might affect the implementation of the infrastructural projects envisaged in the stimulus package. Given that skilled migrants from the region have been filling the manpower gap, the return of peace to Zimbabwe and the potential departure of its nationals might further stress the human capacity problem (see 7.2 for mitigating measures).
2.3 Bank Group Portfolio Status The Bank currently has only one ongoing investment project in Botswana namely, the Pandamatenga Agriculture Infrastructure Project (UA37.27 million) approved in September 2008. The loan agreement was signed on April 28, 2009 but it is yet to enter into force. In addition, there are seven small grant operations (studies/capacity building) financed through the Middle Income Countries (MIC) Trust Fund and the African Water Facility (AWF).9 The total amount of MIC grants approved for six operations is UA1.85 million while the amount for AWF is EURO 1.17 million. The list of the operations and the status of their implementation are presented in 7. III RATIONALE, KEY DESIGN ELEMENTS AND SUSTAINABILITY 3.1 Link with the CSP, Analytical Works Underpinnings and Country Readiness Assessment
Link with the CSP 3.1.1 The Bank’s RBCSP (2009-2013) for Botswana provides justifications for provision of direct budget support to the country. The proposed EDSL program is linked to Pillar 1 of the CSP, namely, support a more competitive and dynamic private sector. It is also consistent with the strategic thrust of the NDP-10 (2009-2016) (see box 2), which aims to accelerate the diversification of the economy, the policy thrust of the 2009/10 Budget Speech, and the GoB’s Private Sector Development Strategy (2008). 9 Includes Kazungula Bridge which is a multinational project.

8
Box 2: Six Hubs to Spearhead Diversification During NDP 9, and currently in NDP 10, the Government has identified areas to focus on for enhanced economic growth and diversification. The following six ‘hubs’ were created:
• The Education Hub seeks to increase the quality and relevance of education at all levels and, thereby, make Botswana more competitive by attracting leading tertiary institutions, scholars, researchers and students into the country.
• The Innovation Hub is aimed at creating a platform for local and foreign businesses engaged in R&D and knowledge intensive activities (i.e. ICT). It will also establish an incubator for start-up companies and facilitate networking amongst businesses.
• The Agricultural Hub will encourage participation in farming, mentor farmers on agribusiness skills, and endeavour to commercialize the agricultural sector in an effort to make the industry more sustainable.
• The Diamond Hub intends to establish a diamond trade centre for rough/polished diamonds and to promote sustainable downstream diamond activities such as polishing and jewellery making.
• The Medical Hub hopes to identify projects and programmes that will make Botswana a centre of excellence in the provision of healthcare services. It will also outsource certain hospitals in an effort to attract specialists and optimize the quality of the health facilities.
• The Transport Hub seeks to re-position the country as a regional hub for rail, road and air transport, and to support a competitive transport and logistics industry in Botswana.
Analytical Underpinnings
3.1.2 The design of the EDSL program has been guided by a number of official documents and publications including the 2009 Budget Speech which have laid out the GoB’s response to the global financial and economic crisis; the Background Notes on the Global Economy (2009) prepared by the MFDP; the Privatization Master Plan (2005); the CGP for Botswana (2008), the Diversification Study (2008), and Country Economic Review (2008) prepared by the AfDB; the 2007 Financial Sector Assessment Program (FSAP) Draft Aide-memoire; the 2009 PEFA Final Report; and the IMF 2008 Article-IV Staff Report. Indications from these upstream diagnostic work are that: (i) Botswana has an impressive track record of sound financial and economic management and good governance; (ii) there is need to diversify the economy away from diamonds to ensure sustainable long-term growth and poverty reduction; and (iii) structural reforms are needed to raise productivity, address skills mismatch, privatize large parastatals with appropriate regulation, promote competitiveness and strengthen supervision of NBFIs. The design of this program greatly benefited from these findings and from broader consultations with country stakeholders and the donor community in Botswana.
Country Readiness Assessment
3.1.3 Botswana adequately meets the general and technical prerequisites for general budget support as specified in the 2004 Guidelines on Development Budget Support Loan (DBSL). The summary assessment of the program is presented in Table 3.

9
Table 3: A summary assessment of the prerequisite conditions of the program Prerequisite conditions
Focus Comments on current situation
Political stability • Overall political environment is stable and there is sound governance architecture. GoB is committed to the rule of law, upholding of human rights and political freedom.
• There is no fear of political tension in the run up to the October 2009 general elections as Botswana has a good track record of peaceful and free and fair elections.
General prerequisites
Economic stability and GoB’s commitment
• Botswana has enjoyed a sustained economic stability for over a decade and it is generally acknowledged as one of the best managed economies in Africa. However, like in all countries, the current global economic crisis threatens economic stability in the medium term.
• GoB is committed to reforms and has been undertaking reforms on its own without any donor-supported program.
Existence of well designed PRSP or NDP and effective implementation mechanisms
• NDP-10 (2009-2016), was prepared through a broad participatory approach involving national stakeholders. The Plan adopts a multi-sectoral long-term approach, which re-emphasizes the importance of results and value for money.
• The GoB has designed innovative hubs as an implementation mechanism for the Plan.
Viable macro-economic and financial medium term framework
• The NDP is based on Macroeconomic Outline and Policy Framework which is the map for expenditure that is approved by the Economic Committee of Cabinet, setting priorities over the medium term and providing the framework for budgetary planning year-on-year.
• Botswana has implemented a number of important reforms recently including the GoB accounting and budgeting system (GABS), improved revenue administration, strengthened external audit system and a new public procurement and regulatory framework.
• The 2009 PEFA concludes that when viewed from the perspective of three main objectives of sound PFM: aggregate fiscal discipline, strategic allocation of resources and efficient delivery of services, Botswana scores well.
Strong partnership between RMC and donors
• As a middle income country, most of Botswana’s traditional donors have reduced the level of their assistance to the country. Development grants account for only a small part of total revenue representing about 0.7% of the GDP while external loan is only 4% of the GDP. Consequently, aid related partnership with donors has been limited. However in 2007, the GoB established an Aid Coordination Forum which has become operational and meets once a month, thus improving partnership.
Strong partnership among donors
The recently instituted Aid Coordination Forum has also Improved partnership among donors.
Technical prerequisites
Satisfactory fiduciary review of the public financial management system (use of country system)
• There is a satisfactory fiduciary review of the PFM as indicated in the 2009 PEFA assessment as Botswana scores highly in several indicators.
• PEFA however scored donor’s use of country systems poorly.
3.2 Collaboration and coordination with other donors10 The EDSL appraisal mission consulted extensively with Development Partners resident in Botswana (UNDP, UNICEF, EC and USAID) on recent socio-economic developments especially their perspectives on the impact of the global financial and economic crisis on the economy, their
10 Following pre-mission consultation, it was envisaged that an IMF staff would be part of the mission. But, due to conflicting mission schedules it did not happen. Since the last Article IV consultation is over 6 months, the Bank will follow up to obtain an assessment letter. Both the IMF and World Bank do not have country offices in Botswana.

10
cooperation programs with Botswana and implementation constraints. The EC has a sector budget support operation for the Ministry of Education under its Education and Training Support Program amounting to Euro 51.4 million, which is being successfully implemented. It also led the PEFA assessment. Through these upstream consultations, the design of this program benefited from donors’ perspectives on areas needing policy reforms. 3.3 Outcomes of past and on-going similar operations and lessons The Bank had a strong presence in Botswana in the 1980s until the country graduated to a MIC status in 1992 and stopped borrowing from the Bank. Lending activities resumed in 2005 with a Line of Credit amounting to UA33.4 million approved for the National Development Bank (NDB). The project was closed after 55% of the loan was disbursed and the remaining 45% was cancelled due to the improved financial performance of the NDB. There are also seven ongoing small grant operations (MIC and AWF), but implementation progress has been slow and only one of them has started disbursing. This slow implementation progress is also common with MIC grants in other countries. Therefore, there is the need to have another look at the Guidelines to see how implementation arrangements could be better simplified and aligned with Paris and Accra commitments. The fact that this is the first budget support operation for Botswana and the absence of lending to the country for a long time means that there is no direct lesson to be learnt from recent operations. However, program design benefits from lessons derived from the EC budget support for the education sector, namely the need for selectivity in key reform areas, which has driven the GoB-EC dialogue. The operation also incorporates experience gained from Bank’s budget support operations in other countries, particularly in the MICs such as Egypt, Tunisia, Morocco and Mauritius. The key lesson is that such programs should meet the specific needs of these countries, including a high degree of flexibility, and be based on a home grown reform agenda. Thus, the EDSL program is based on ongoing reforms being implemented by the GoB. 3.4 Bank’s comparative advantage After 12 years of non-lending activities, the Bank has re-established its presence in Botswana. In the interim, the Bank has undertaken several analytical and diagnostic works, including the joint AfDB and World Bank Report on the Observance of Standards and Codes (ROSC), the Diversification Study, the CGP and the Country Economic Review, which gave it a unique knowledge advantage about the progress made and challenges faced by the country. This confidence building measure has strengthened the partnership with the GoB and positions the Bank as the lender of first choice.
3.5 Application of good practice principles on conditionality The program applies good practice principles on conditionality as indicated in the Bank’s Development Budget Support Lending annotated format (2008) for budget support operations. The relevant principles applicable to Botswana are:
(i) Reinforce ownership: The NDP-10 was prepared by the GoB through broad-based
consultations with stakeholders. Thus, it is a fully country-owned program and the GoB is committed to its successful implementation. Basing the EDSL on the NDP-10, the 2009 Budget Speech and GoB’s ongoing reforms reinforces ownership.

11
(ii) Customize the accountability framework and modalities of Bank’s support to country circumstances: The EDSL program focuses on GoB immediate reform concerns aimed at confronting the impact of the global financial and economic crisis on the economy. The modalities and timing of the assistance also meet country needs given the fiscal deficit in the 2009/10 budget. The program will also use country systems and monitoring mechanisms built around the national budget, focused on results.
(iii) Select only actions that are critical for achieving results as conditions of disbursement:
The policy actions chosen by the Bank as triggers for disbursement are the ones critical for achieving results and they are derived from the 2009/10 Budget Statement and consultations with the country stakeholders. They also focus mainly on actions to promote diversification and competitiveness.
IV – THE PROPOSED PROGRAM
4.1 Program Goal and Purpose The program’s sector goal is to create competitive conditions for accelerated private sector growth, economic diversification and poverty reduction. This will facilitate, in the long-term, reduction of dependence on mineral revenue and help to alleviate the negative impact of the global financial and economic crisis on Botswana’s economy, in particular fiscal sustainability. It will reinforce GoB’s efforts to sustain growth, employment and poverty reduction in the long run. 4.2 Program’s operational policy objectives, components and expected results 4.2.1 Operational Objectives: The operational policy objectives of the program are: (a) promoting the private sector as the mainstay of economic growth, and (b) deepening the financial sector and strengthening the regulation of NBFIs. 4.2.2 Overall, GoB reform agenda: The GoB is intensifying reforms in a number of areas including privatisation/restructuring of public enterprises, public sector reforms and improvement in the business environment and competitiveness. The GoB is also promoting regional integration and undertaking trade policy reforms, financial sector reforms and decentralization for improved service delivery. The matrix of ongoing policy reforms is presented in Appendix 5 and the Letter of Development Policy (in Technical Appendix I) 4.2.3 Components: For the sake of selectivity and to respond quickly to the GoB’s request to mitigate the impact of the global crisis, the EDSL focuses realistically on implementable policy measures in the 2009/10 financial year, concentrates on key reform measures articulated in the 2009 Budget, and are grouped in two components. Component 1: Promoting the private sector as the mainstay of economic growth: The reforms in this component aim to promote competitiveness and diversification of the economy away from diamond revenue through the development of a vibrant private sector including privatization and PPP as well as competitiveness and trade. The identified policy measures are the following: 4.2.4 Development of PPP Framework: Infrastructural bottlenecks affect the competitiveness of the economy. As a land-locked country, Botswana’s physical infrastructure is integral to its regional and international competitiveness. The country faces the challenge of devising appropriate strategies to

12
improve the provision and maintenance of infrastructure and infrastructural services in an efficient and cost-effective manner. PPP is part of GoB agenda intended to create an enabling environment to attract private investment in public infrastructure development, and enhance the quality and efficiency of service delivery. Some PPP projects, concentrating on the construction sector, are already ongoing. The required policy action for the EDSL is the preparation of a Draft PPP Framework and submission to Cabinet for approval. The draft PPP framework has been prepared and discussed with stakeholders and is expected to be submitted to Cabinet by May 2009. The expected outcome is an enhanced quality and efficiency in the delivery of infrastructure. The submission of the PPP framework to Cabinet is a prior action which is expected to be fulfilled before Board presentation. 4.2.5 Enactment of a Competition Law to curb unfair and restrictive practices: Private sector growth is constrained by restrictive business practices or arrangements among enterprises and abuse of dominant positions of market power which limit access to market or unduly restrain competition. Competition is fundamental if firms are to court the market for profits and not the GoB for favours. Competition provides incentives for wealth creation and greater opportunity for efficiency gains. GoB has already developed a Competition Policy which established the required provisions for competition and regulation. The ultimate required policy action envisaged by the EDSL is enactment of a Competition Law, which will delineate clearly the powers, rights and responsibilities of competitive entities as well as the regulator. As a first step, the Competition Bill was approved by Cabinet in April 2009 and will be submitted to Parliament in July 2009. The expected outcomes are: greater market efficiency, increased FDI inflows, and improved regional and international competitiveness. The approval of the Competition bill by Cabinet is a prior action to be fulfilled before Board presentation. 4.2.6 Development of the Privatization Strategy of the NDB: The NDB was established by an Act of Parliament in 1963 as a development finance institution, with special emphasis on agriculture sector financing. Following its restructuring in 1994, NDB expanded its portfolio beyond agricultural sector and has since significantly improved its operational efficiency both in terms of profitability and in terms of increasing its loan book. However, since GoB withdrew its financial support to parastatals, NDB has had to source funds from commercial banks at high cost. This has exerted a pressure on NDB to look for alternative and cheaper sources of Funds to meet its capital requirements and sustain its lending business. Funds could be raised by taking deposits from clients and equity which could be best carried out under private sector ownership and management. To prepare the NDB for privatization, a draft privatization strategy has been prepared and discussed with stakeholders and the final report is expected to be submitted to Cabinet by July 2009. Subject to the divestment strategy, the privatization of NDB will contribute to the development of the stock market; provide opportunity for citizen’s economic empowerment through participation, as well as opportunity for FDI inflows. Cabinet approval of the NDB Privatization Strategy will be a trigger for second tranche disbursement.
4.2.7 Development of a Trade Policy: The doing Business ranking for trading across borders deteriorated from 149 to 150 between 2008 and 2009. Compared to the regional average, the cost of importing and exporting standardized shipment of goods in Botswana are higher by USD800 and USD700, respectively. Botswana also currently lacks an explicit trade in services policy or a detailed, holistic plan to develop trade in services. If the country is to derive maximum gains from international trade, it must maintain regional and international competitiveness. The GoB is in the process of undertaking a comprehensive review and development of new policies, legislations and regulations with a view to enhancing competitiveness. The required policy action for the EDSL is preparation of a Trade Policy. The draft Trade Policy has already been prepared and discussed with the stakeholders and is expected to be submitted to Cabinet by July 2009. The Policy aims to
13
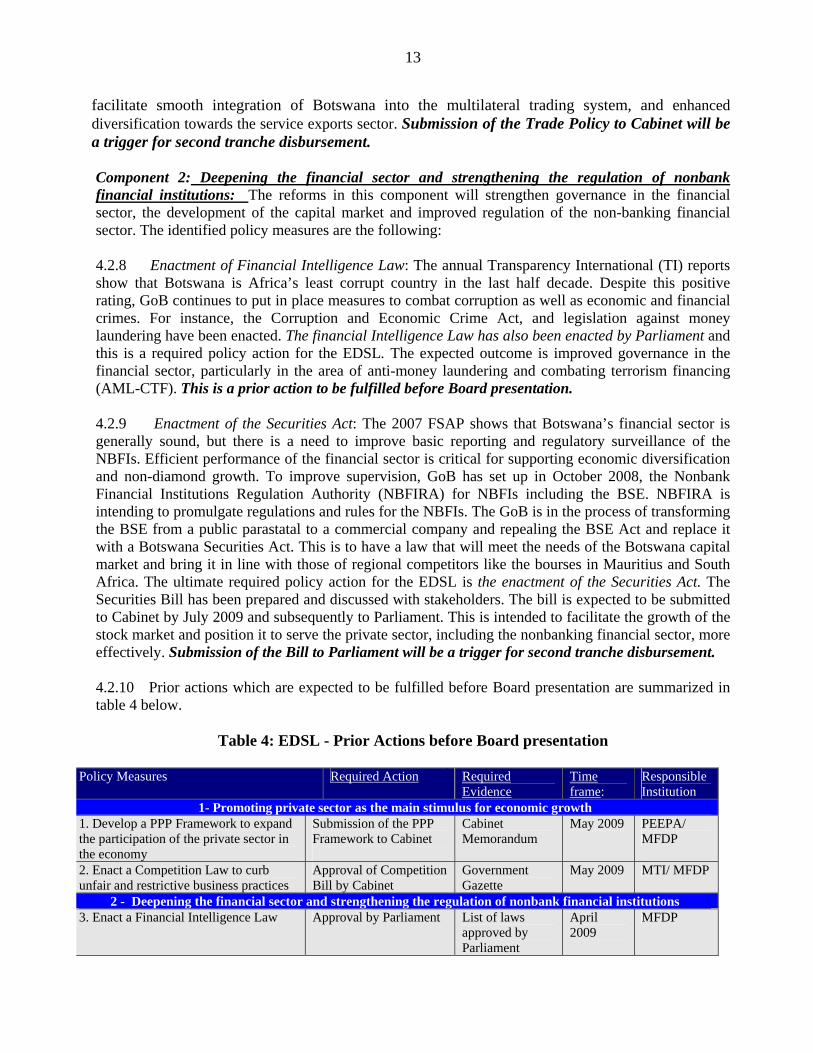
facilitate smooth integration of Botswana into the multilateral trading system, and enhanced diversification towards the service exports sector. Submission of the Trade Policy to Cabinet will be a trigger for second tranche disbursement. Component 2: Deepening the financial sector and strengthening the regulation of nonbank financial institutions: The reforms in this component will strengthen governance in the financial sector, the development of the capital market and improved regulation of the non-banking financial sector. The identified policy measures are the following: 4.2.8 Enactment of Financial Intelligence Law: The annual Transparency International (TI) reports show that Botswana is Africa’s least corrupt country in the last half decade. Despite this positive rating, GoB continues to put in place measures to combat corruption as well as economic and financial crimes. For instance, the Corruption and Economic Crime Act, and legislation against money laundering have been enacted. The financial Intelligence Law has also been enacted by Parliament and this is a required policy action for the EDSL. The expected outcome is improved governance in the financial sector, particularly in the area of anti-money laundering and combating terrorism financing (AML-CTF). This is a prior action to be fulfilled before Board presentation. 4.2.9 Enactment of the Securities Act: The 2007 FSAP shows that Botswana’s financial sector is generally sound, but there is a need to improve basic reporting and regulatory surveillance of the NBFIs. Efficient performance of the financial sector is critical for supporting economic diversification and non-diamond growth. To improve supervision, GoB has set up in October 2008, the Nonbank Financial Institutions Regulation Authority (NBFIRA) for NBFIs including the BSE. NBFIRA is intending to promulgate regulations and rules for the NBFIs. The GoB is in the process of transforming the BSE from a public parastatal to a commercial company and repealing the BSE Act and replace it with a Botswana Securities Act. This is to have a law that will meet the needs of the Botswana capital market and bring it in line with those of regional competitors like the bourses in Mauritius and South Africa. The ultimate required policy action for the EDSL is the enactment of the Securities Act. The Securities Bill has been prepared and discussed with stakeholders. The bill is expected to be submitted to Cabinet by July 2009 and subsequently to Parliament. This is intended to facilitate the growth of the stock market and position it to serve the private sector, including the nonbanking financial sector, more effectively. Submission of the Bill to Parliament will be a trigger for second tranche disbursement. 4.2.10 Prior actions which are expected to be fulfilled before Board presentation are summarized in table 4 below.
Table 4: EDSL - Prior Actions before Board presentation
Policy Measures Required Action Required Evidence
Time frame:
Responsible Institution
1- Promoting private sector as the main stimulus for economic growth 1. Develop a PPP Framework to expand the participation of the private sector in the economy
Submission of the PPP Framework to Cabinet
Cabinet Memorandum
May 2009 PEEPA/ MFDP
2. Enact a Competition Law to curb unfair and restrictive business practices
Approval of Competition Bill by Cabinet
Government Gazette
May 2009 MTI/ MFDP
2 - Deepening the financial sector and strengthening the regulation of nonbank financial institutions 3. Enact a Financial Intelligence Law Approval by Parliament List of laws
approved by Parliament
April 2009
MFDP

14
4.3 Financing needs and arrangements 4.3.1 The 2009/10 budget speech indicates that total expenditure including net lending has increased significantly (2008/09 revised estimates of P35.88 billion to P37.79 billion in 2009/10, see table 5). This corresponds to a little less than 40% of the GDP, in keeping with the fiscal rule. GoB revenue is anticipated to shrink due to reduction in mineral and Botswana share of SACU revenue which is expected to decline as a result of reduced imports into the SACU area. If GoB permits total expenditure of the estimated magnitude, this would lead to a projected budget deficit amounting to P13.4 billion which is equivalent to 13.5% of GDP for 2009/10. The spending on infrastructural development programs under various sectors (power, roads, telecommunications and dams) accounts for about 16% of total expenditure in 2009/10, while social (education, health and agriculture) and other welfare programs11 to protect the poor and vulnerable groups account for 48% (see table 5). As earlier indicated, the GoB plans to use a combination of sources to finance the fiscal deficit namely domestic bond issue, draw down on reserves and borrowing from international financial institutions. The proposed program, as part of the latter option, will contribute towards the required financing and reduce the deficit.
Table 5: Financing Requirements (in Pula Million) 2002/03 2003/04 2004/05 2005/06 2006/07 2007/08 2008/09 2009/2010 Revenue and Grants 14318.29 16197.29 17956.57 22266.63 27397.71 28629.47 29681.32 24393.13 Revenue 14,233.89 16135.93 17608.98 22153.60 26949.32 28052.10 29276.23 24079.79 Of which Mineral tax 2715.72 2378.71 2508.72 2895.16 3802.78 3769.37 2972.00 1983.00
Non mineral Income tax 1839.45 2078.71 2082.23 3003.21 3072.31 2572.75 4228.20 3739.17
Customs Pool 1568.87 2245.54 3226.46 3929.85 6610.48 7834.81 8298.54 7064.87
Sales tax/VAT 1254.58 1573.16 2116.23 1978.89 2247.50 2852.04 2940.00 3254.82
Mineral Royalties and Dividends 4786.93 5784.82 6173.06 8149.91 9311.56 8564.29 7888.00 4852.00 BOB revenue 1028.90 755.00 388.10 741.17 569.05 906.00 1302.00 1000.00
Grant 84.40 61.36 347.59 113.03 448.39 577.37 405.09 313.34 Expenditures and Net Lending 15710.07 16275.61 17382.60 17631.87 19737.44 24821.86 35876.52 37787.22 Of which General Public services 2815.87 3480.46 3219.18 3821.99 4112.54 5080.46 7113.19 7957.81
Defence 1447.20 1502.65 1464.11 1446.00 1641.50 1961.36 2305.51 2513.17
Education 3548.81 3931.76 4092.35 4197.39 4842.15 6224.17 7908.42 898445
Health 1104.15 1634.38 1975.98 2056.42 2226.62 2639.14 3203.52 3574.43
Agriculture, Forestry, Fishing 646.70 637.65 590.91 791.84 721.20 843.40 1417.94 1159.54
Mining 88.69 92.17 116.05 -134.71 -73.10 105.03 198.24 257.18
Electricity and water Supply 905.41 795.17 823.72 931.67 836.21 872.25 2983.43 1406.99
Roads 615.42 510.89 523.79 324.54 644.53 765.66 1129.81 1074.06
Transport (Air, Rail & other) 104.99 226.32 63.54 62.82 154.77 503.84 1019.75 703.94
Post and telecommunication 361.34 156.92 104.23 143.08 275.09 101.74 282.14 454.95
Promotion of Trade and Industry 250.50 -86.86 385.38 146.94 180.10 348.02 568.55 800.49
Food and Social Welfare Programs 400.88 383.89 107.05 189.52 387.65 586.74 527.61 552.68
Housing, Urban and regional Dev 1144.42 498.37 886.58 1082.76 1301.85 1880.83 3029.33 3003.74
Other community and social service 548.65 560.79 607.90 600.89 362.82 567.99 1119.89 1257.91 Repayment of Loans -121.23 -915.56 -298.88 -306.10 -271.59 -304.62 -116.51 -127.84
Overall surplus/deficit(-) -1391.78 -78.32 573.97 4634.76 7660.27 3807.61 -6195.20 -13394.09 Recurrent budget surplus/deficit -7456.85 -3375.67 -280.16 -9748.52 5331.25 3076.92 -3411.52 -13322.25 Financing Needs 1391.78 78.32 -573.97 -4634.76 -7660.27 -3807.61 6195.20 13394.09 Source: 2009/10 Government Financial Statements, Tables and estimates of the Consolidated Development Fund revenues
11 These include programs for destitute persons, orphans, home based care patients, vulnerable children, school feeding and old age pensions.
15
4.4. Program’s beneficiaries The EDSL is designed to assist the GoB to implement the 2009/10 budget which represents a stimulus package in response to the global financial and economic crisis. Therefore, the GoB will be the direct beneficiary, while the private sector actors and the entire population of Botswana who will benefit from an improved private sector environment and pro-poor budget allocation for better quality social services delivery, are the indirect beneficiaries. 4.5. Impacts on gender Botswana has signed and ratified key regional and international conventions relating to gender equality. The most important legislation concerning women is the 2004 Abolition of Marital Power Act. This Act removed the restrictions previously placed on the legal rights of a wife. Botswana also has a national gender program framework, which has been in operation since 1999. The GoB is also mainstreaming gender into national planning and budgeting. Therefore, the budget support program would impact positively on women through budgetary allocation to pro-poor sectors (education, health, agriculture and social welfare programs) which account for 48% of total expenditure. Also, as indicated in the log frame, the program will support women empowerment by increasing the contribution of the services sector to women employment from 75% in 2007 to 78% in 2009/10. Implementation of this program will closely monitor progress towards this goal 4.6 Environmental Impacts The environmental categorisation of the program is 3. The program therefore has no potential direct negative impact on the environment and entails budget support for the effective implementation of the NDP-10 and the national budget, both of which put emphasis on environmental sustainability. Environmental policy in Botswana focuses on community participation in environmental and natural resource management. V. – IMPLEMENTATION, MONITORING AND EVALUATION
5.1 Implementation Arrangements 5.1.1 Implementing Agency: The Ministry of Finance and Development Planning (MFDP) will be the Implementation Agency of the EDSL. The Division of Development and Budget (DDB) in the MFDP will be the focal point for the program for day-to-day operation and reporting. This division is responsible for the coordination of the overall GoB budget and donor-funded projects/ programs (loans and grants). The mandate of the division includes provision of support and advice on financial management issues to GoB Ministries/Departments, provision of inputs to all aspects of policy formulation and review, and the preparation, supervision, monitoring and evaluation of projects/programs. The Secretary of Development and Budget, the Head of the Division who is also the chair of the meetings of the Project Review Committee (PRC), will be the responsible officer for the implementation of the EDSL. The PRC is in charge of the review of project’s implementation progress and assessment of financial requirements of each project/program on a yearly basis. Donor funds in the form of loans and grants and Domestic Development Funds already approved are specified, during the project’s review exercise, so that means of financing short fall from either of these sources could be initiated during the course of the year. The PCR will therefore play a major role in the policy matrix coverage discussions and joint-assessments with the Bank.
16
5.1.2 The disbursement of the first tranche of US$1.0 billion will be based on the presentation to the Bank of satisfactory evidence for the prior actions, indicated in table 4, which are expected to be met before Board presentation. The disbursement triggers for the second tranche of US$ 0.5 billion are presented in paragraph 6.2.3. The joint (GoB-Bank) assessment of program performance on the agreed policy measures (triggers) for the second tranche disbursement will take place in November/December 2009. This is adopted to comply with the budget cycle of the country and to ensure disbursement of the funds relatively early in the fourth quarter of the financial year so that GoB can have enough time to spend the resources within the 2009/10 fiscal year. The GoB would be required to provide to the Bank, at the end of the financial year an audit report of the transfers and uses of funds from the loan. This report should be prepared by the Auditor General in collaboration with the internal audit department of the Bank of Botswana. The country system through the Auditor General’s report will be used for purposes of auditing the proposed EDSL program. The budget support does not raise any direct issues of procurement.
5.2 Monitoring and Evaluation Arrangements 5.2.1 The Bank will monitor the program in conjunction with MFDP and in accordance with the GoB’s policy reform agenda (Appendix 5) and the EDSL result based logical framework. The matrix has outputs and targets as well as means of verification which will be used to monitor progress. The DDB will collect and provide information for verification of targets, including PRC reports as well as any other information relevant to the EDSL program including IMF staff reports on the macroeconomic framework, any budget process review and national development plan progress reports. The MFDP has a sound base of skills, expertise, systems and tools to monitor and evaluate budget and program execution, including donor interventions. A joint-supervision mission will be undertaken in November/December 2009 to monitor and review progress and trigger disbursement for the second tranche. 5.2.2 On the GoB side, the DDB will monitor progress using the agreed policy measures matrix. The concerned line Ministries will provide information for verification of targets to the DDB which will verify data to determine whether targets are being met. The program’s progress will be discussed and evaluated during the PRC meetings, including relevant stakeholders, under the chairpersonship of the Secretary Development Budget Division. The DDB shall ensure that all documents supporting disbursements on the EDSL are well kept and that these documents, including details of the account kept for the proceeds of the loan, will be made available to Bank’s supervision teams and the auditors. Also, the GoB would be responsible for the submission of all reports and supplementary materials required for any review, under the proposed EDSL, not later than two weeks before the review meeting. VI – LEGAL DOCUMENTATION AND AUTHORITY
6.1 Legal documentation
Loan Agreement between the African Development Bank and the Government of Botswana.

17
6.2 Conditions associated with Bank Group intervention 6.2.1 Conditions precedent to Entry into force of the Loan Agreement: The loan agreement shall enter into force following the fulfillment of the conditions for entry into force provided in Section 12.01 of the General Conditions Applicable to Loan and guarantee Agreements of the Bank.12 6.2.2 Conditions Precedent to First Tranche Disbursement: The obligations of the Bank to make the first disbursement shall be conditional upon providing evidence, in form and substance satisfactory to the Bank:
(i) Of a foreign currency account at the Bank of Botswana dedicated to receive the proceeds of the EDSL. (paragraph 5.1.2) [Evidence required: Letter from the Bank of Botswana confirming the account, label, and account number].
6.2.3 Conditions Precedent to Second Tranche Disbursement: The obligations of the Bank to disburse the second tranche shall be conditional upon the fulfilment of the specific conditions listed below. The beneficiary would have provided evidence, in form and substance satisfactory to the Bank:
(i) Approval of the Privatization Strategy of the NDB by Cabinet (paragraph 4.2.4) [Evidence
required: Cabinet Decision].
(ii) Submission of the Trade Policy to Cabinet (paragraph 4.2.6); [Cabinet Memorandum].
(iii) Submission of the Revised Securities Act to Parliament (paragraph 4.2.8) [Evidence required: Government Gazette]
6.2.4 The good practice policies on conditionality as indicated in the Bank’s DBSL guidelines annotated format (2008) have been applied in the formulation of these conditions (see section 3.6).
6.3 Compliance with Bank Group policies This program complies with all applicable Bank Group policies and guidelines. These include: (i) the 2004 Guidelines for DBSL operations, (ii) the 2009-2013 RBCSP for Botswana, and (iii) the Environmental and Social Assessment Procedures (ESAP) and requirements on crosscutting issues. VII. Risk Management 7.1 Continued global financial and economic crisis represent a risk for the program. The consequences could be further decline in GDP growth, high unemployment, a burgeoning fiscal deficit and rapidly worsening balance of payments. This risk will be mitigated by the fiscal stimulus package being implemented by GoB and supported by the EDSL, aimed at boosting growth and employment through an investment program focused on infrastructure, public works and social protection for the poor. This will be combined with belt tightening through fiscal consolidation. Besides, this exogenous shock might exacerbate the liquidity constraints experienced by BSE. In order to mitigate such risk, BSE has been seeking for joint ventures with South African managers to inject liquidity in the market. In addition, new instruments and marketing initiatives including the creation of national credit rating and drafting of listing rules for securitization are being developed. 12 This includes the signature of the loan agreement and submission of legal opinion to the Bank.

18
7.2 Inadequate human capacity, which is partly due to the impact of HIV/AIDS, affects service delivery and constitutes a serious constraint to implementation capacity in both the public and private sector. The situation is compounded by skills mismatch in the labour market in terms of supply of and demand for labour. This might affect the implementation of the infrastructural projects envisaged in the stimulus package. This is being mitigated by GoB’s increasing emphasis on capacity building and skills development. GoB has prepared a national Human Resource Development Strategy and Plan which will guide training and match skills development with labour market needs. To this effect, a vocational training fund aimed at encouraging training at the workplace was established in 2008. A Labour market observatory unit is also being set up to ensure the availability of labour market information to guide planning and skills development. In addition, GoB is undertaking the computerization of the issuance of residence permits, visas, and citizenship to improve service delivery to businesses. To further enhance skills development, students are being sent to study abroad as needed and there is a plan to transform the Botswana Institute of Administration and Commerce into a modern Civil Service College. The falling prevalence of HIV/AIDS would also mitigate this risk. 7.3 GoB efforts geared towards promoting private sector development and citizen-owned business empowerment and participation in the stock market may not pay off, if there are still significant barriers to access to credit, knowledge, skilled labour and capacities for those citizen owned businesses. To mitigate this risk, the GoB has established several support institutions (BEDIA, IFSC, CEDA, BDC, and LEA) and has been building up their capacity to provide sufficient advisory services to help entrepreneurs in developing their business plan, dealing with trade-related procedures, documentation, payments and financing facilities. A P200 million Venture Capital Fund managed by CEDA is targeted at providing risk capital by way of equity and/or quasi-equity and other investment instruments to private citizen owned or joint-venture companies.
7.4 There is a concern that possible sanctions for money laundering offence are not dissuasive and there is a lack of an appropriate framework to enforce corporate governance. To mitigate this risk Botswana has signed and ratified the SADC Protocol against Corruption, and is actively participating in international anti-money laundering activities. Also, the Bank is assisting Botswana to prepare a corporate governance code. VIII – RECOMMENDATION 8.1 It is recommended that the Board of Directors approve an ADB loan not exceeding UA1.00 billion (US$1.5 billion) to the Republic of Botswana for the purposes and subject to the conditions stipulated in this report.

APPENDIX 1
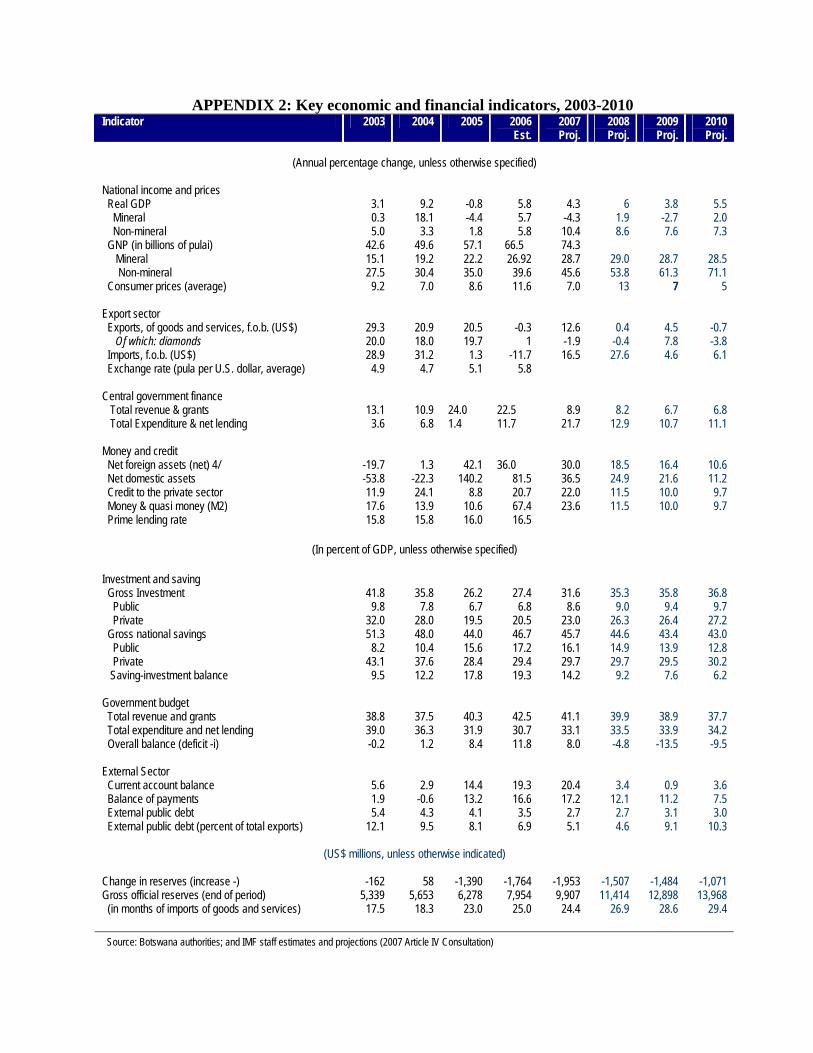
APPENDIX 2: Key economic and financial indicators, 2003-2010 Indicator 2003 2004 2005 2006
Est. 2007 Proj.
2008 Proj.
2009 Proj.
2010 Proj.
(Annual percentage change, unless otherwise specified)
National income and prices Real GDP 3.1 9.2 -0.8 5.8 4.3 6 3.8 5.5 Mineral 0.3 18.1 -4.4 5.7 -4.3 1.9 -2.7 2.0 Non-mineral 5.0 3.3 1.8 5.8 10.4 8.6 7.6 7.3 GNP (in billions of pulai) 42.6 49.6 57.1 66.5 74.3 Mineral 15.1 19.2 22.2 26.92 28.7 29.0 28.7 28.5 Non-mineral 27.5 30.4 35.0 39.6 45.6 53.8 61.3 71.1 Consumer prices (average) 9.2 7.0 8.6 11.6 7.0 13 7 5 Export sector Exports, of goods and services, f.o.b. (US$) 29.3 20.9 20.5 -0.3 12.6 0.4 4.5 -0.7 Of which: diamonds 20.0 18.0 19.7 1 -1.9 -0.4 7.8 -3.8 Imports, f.o.b. (US$) 28.9 31.2 1.3 -11.7 16.5 27.6 4.6 6.1 Exchange rate (pula per U.S. dollar, average) 4.9 4.7 5.1 5.8 Central government finance Total revenue & grants 13.1 10.9 24.0 22.5 8.9 8.2 6.7 6.8 Total Expenditure & net lending 3.6 6.8 1.4 11.7 21.7 12.9 10.7 11.1 Money and credit Net foreign assets (net) 4/ -19.7 1.3 42.1 36.0 30.0 18.5 16.4 10.6 Net domestic assets -53.8 -22.3 140.2 81.5 36.5 24.9 21.6 11.2 Credit to the private sector 11.9 24.1 8.8 20.7 22.0 11.5 10.0 9.7 Money & quasi money (M2) 17.6 13.9 10.6 67.4 23.6 11.5 10.0 9.7 Prime lending rate 15.8 15.8 16.0 16.5
(In percent of GDP, unless otherwise specified)
Investment and saving Gross Investment 41.8 35.8 26.2 27.4 31.6 35.3 35.8 36.8 Public 9.8 7.8 6.7 6.8 8.6 9.0 9.4 9.7 Private 32.0 28.0 19.5 20.5 23.0 26.3 26.4 27.2 Gross national savings 51.3 48.0 44.0 46.7 45.7 44.6 43.4 43.0 Public 8.2 10.4 15.6 17.2 16.1 14.9 13.9 12.8 Private 43.1 37.6 28.4 29.4 29.7 29.7 29.5 30.2 Saving-investment balance 9.5 12.2 17.8 19.3 14.2 9.2 7.6 6.2 Government budget Total revenue and grants 38.8 37.5 40.3 42.5 41.1 39.9 38.9 37.7 Total expenditure and net lending 39.0 36.3 31.9 30.7 33.1 33.5 33.9 34.2 Overall balance (deficit -i) -0.2 1.2 8.4 11.8 8.0 -4.8 -13.5 -9.5 External Sector Current account balance 5.6 2.9 14.4 19.3 20.4 3.4 0.9 3.6 Balance of payments 1.9 -0.6 13.2 16.6 17.2 12.1 11.2 7.5 External public debt 5.4 4.3 4.1 3.5 2.7 2.7 3.1 3.0 External public debt (percent of total exports) 12.1 9.5 8.1 6.9 5.1 4.6 9.1 10.3
(US$ millions, unless otherwise indicated) Change in reserves (increase -) -162 58 -1,390 -1,764 -1,953 -1,507 -1,484 -1,071 Gross official reserves (end of period) 5,339 5,653 6,278 7,954 9,907 11,414 12,898 13,968 (in months of imports of goods and services) 17.5 18.3 23.0 25.0 24.4 26.9 28.6 29.4 Source: Botswana authorities; and IMF staff estimates and projections (2007 Article IV Consultation)

APPENDIX 3: Social Economic Indicators
Botswana - Development Indicators Botswana
Social Indicators 1990 2008 *
Africa Developing countries
Area ( '000 Km²) 582 30 323 80 976Total Population (millions) 1,4 1,9 985,7 5 523,4Population growth (annual %) 3,0 1,3 2,3 1,4Life expectancy at birth, total (years) 63 51 55 66Mortality rate, infant (per 1,000 live births) 52,8 44,7 83,9 53,1Physicians per 100,000 People … 28,0 39,6 78,0Births attended by skilled health staff (% of total) 79,0 94,0 51,2 59,0Immunization, measles (% of children ages 12-23 months) 55,0 79,0 83,1 81,0School enrollment, primary (% gross) 113,2 112,2 99,6 106,0Ratio of girls to boys in primary education (%) 107 99 92 100,0Illiteracy rate, adult total (% of people ages 15 and above) … 17,1 33,2 26,6Access to Safe Water (% of Population) 93,0 96,0 64,3 84,0Access to Sanitation (% of Population) 38,0 47,0 37,6 53,0Human Develop. (HDI) Rank (Over 179 Countries) … 126 … …Human Poverty Index (% of Population) … 31,2 38,7 …
Botswana Economy 2000 2007 2008 2009**
GNI per capita, Atlas method (current US$) 3 270 5 840 … …GDP (current Million US$) 5 633 11 868 11 522 11 092GDP growth (annual %) 5,9 4,4 3,9 2,6Per capita GDP growth (annual %) 4,2 3,1 2,6 1,3Gross Domestic Investment (% of GDP) 31,8 26,9 29,1 31,0Inflation (annual %) 8,5 7,1 12,6 9,2Budget surplus/deficit (% of GDP) 9,1 6,5 -0,3 -0,5
Trade, External Debt & Financial Flows 2000 2007 2008 2009**
Export Growth, volume (%) 2,3 7,4 3,4 2,3Import Growth, volume (%) -8,1 25,5 17,9 7,2Terms of Trade (% change from previous year) -4,4 -0,1 4,6 -0,8Trade Balance ( mn US$) 902 1 622 1 289 1 048Trade balance (% of GDP) 16,0 13,7 11,2 9,5Current Account ( mn US$) 545 1 973 1 557 1 280Current Account (% of GDP) 9,7 16,6 13,5 11,5Debt Service (% of Exports) 17,9 16,1 16,1 16,8External Debt (% of GDP) 44,1 10,9 11,9 13,8Net Total Inflows ( mn US$) 83,3 34,1 … …Net Total Official Development Assistance (mn US$) 30,6 104,4 … …Foreign Direct Investment Inflows (mn US$) 57,3 494,9 … …

External reserves (in month of imports of goods & services) 32,7 26,8 23,5 … Private Sector Development & Infrastructure 2000 2006 2007 2008
Time required to start a business (days) … 108 108 78Investor Protection Index (0-10) … 4,3 4 6Main Telephone Lines (per 1000 people) 79 71 73 …Mobile Cellular Subscribers (per 1000 people) 129 443 612 …Internet users (000) 50.0 80.0 100.0 …Roads, paved (% of total roads) … … … …Railways, goods transported (million ton-km) … … … …
Source: ADB Statistics Department, based on various national and international sources
* Most recent year Last Update: March
2009
** Forecast

APPENDIX 4: Botswana Status of Millennium Development Goals
Source: NDP 10 and UNDP MDGs Status Report, 2004
Goals Targets Will goal be met by 2015?
Supportive environment for achieving goal
1. Eradicate Poverty and Hunger
1. No person living below the Income Poverty Datum Line by 2016 2. Reduce by 50% the proportion of people who suffer from hunger and malnutrition by 2016
Unlikely Likely
Good Strong
2. Achieve Universal Primary Education
3. To achieve universal access to 10 years of basic education by 2016 4. To improve the relevance and quality of basic education by 2016
Achieved Likely
Strong Strong
3. Gender Equality and Empowerment
5. To reduce gender disparity in all education by 2015 6. To reduce gender disparity in access to and control productive resources by 2015 7. To reduce violence and discrimination against women, and the incidence of rape by 50% by 20118. To increase the participation of women in leadership, governance and decision-making by at least 60% by 2016
Achieved Likely Potentially Likely
Strong Strong Strong Strong
4. Child Mortality
9. To reduce the Infant Mortality Rate (IMR) from 48/1000 live births in 1991 to 27/1000 in 2011 10. To reduce by 2/3, the under 5 mortality rate (U5MR) from 63/1000 live births in 1991 by 201111. To reduce the PEM rate amongst children from 18% in 1990 to 8% by 2011 12. To increase the proportion of I year old children who are fully immunized from 67% in 1990 to at least 80% by 2009
Potentially Potentially Potentially Likely
Strong Strong Strong Strong
5. Maternal Health 13. To reduce maternal mortality rate from 326/100 000 live births in 1991 to 150/100 000 by 2011
Potentially Strong
6. Combat HIV/AIDS and Other Diseases
14. To halt and reverse the incidence of HIV, particularly amongst the youth by 2016 15. To reduce the number of infants born to HIV infected mother who are HIV positive by their 18th month by half by 2006 and to zero by 2009 16. To reduce the morbidity and mortality caused by TB 17. To reduce the incidence of confirmed cases of malaria to below 20 per 1000 people
Likely Potentially Likely Potentially
Strong Strong Strong Strong
7. The Environment
18. To reduce by 50% the proportion of people without sustainable access to safe drinking water by 2016 19. Reduce conflict between population growth , land usage and environmental and natural resources degradation 20. Promote environmental education and awareness necessary to reduce contamination and achieve sustainable development
Likely Potentially Potentially
Strong Good Good
8. Global Partnerships
21. Develop further, an environment conducive for beneficial trade and foreign direct investment 22. In cooperation with the private sector, make available the benefits of new technologies
Likely Likely
Strong Strong

APPENDIX 5: Matrix of Policy Measures
Matrix of Policy Measures
Specific Policy Objectives
Strategic Reform Measures
Time-frame Responsible Agency
Bank CSP Pillar
Vision 2016 and NDP 10: Creating the conditions for accelerated private sector growth, diversification and poverty reduction
1- Promoting private sector as the main stimulus for economic growth 1. Develop a PPP Framework to expand the participation of the private sector in the
economy. May 2009 PEEPA/
MFDP
2. Implement Management Contract for the Air Botswana April 2009 MFDP/ MWT
3. Finalize Privatization Transaction of Botswana Telecommunications Corporation (BTC).
2009/10 MFDP
4. Complete the restructuring and capitalization of the Botswana Railways (BR) and increase freight tariff towards cost recovery
2009/10 MFDP/ MWT
cPro
mot
ing
priv
atiz
atio
n an
d Pu
blic
Pr
ivat
e Pa
rtner
ship
(PPP
) ini
tiativ
es
5. Develop a Privatization Strategy for the National Development Bank to enhance private sector participation in the Bank.
July 2009 MFDP
6. Finalize study on the establishment of an appropriate law reform structure for Botswana which will enhance the legal framework for the business environment.
March 2009 MFDP
7. Enact a Competition Law to curb unfair and restrictive business practices. MTI 8. Develop a Trade Policy to facilitate the integration of Botswana into the multilateral
trading system July 2009 MTI
9. Undertake the review of the Industrial Development Policy to identify achievements, challenges and opportunities posed by globalization
2009/10 MTI
Impr
ovin
g co
mpe
titiv
enes
s and
Tra
de
10. Complete the computerization of the issuance of residence permits, visas, citizenship as well as investigations and repatriation processes to improve service delivery and accessibility.
2009/10 MFDP
Pillar 1: Support a more com
petitive and Dynam
ic private sector

Matrix of Policy Measures
Specific Policy Objectives
Strategic Reform Measures
Time-frame Responsible Agency
Bank CSP Pillar
2 - Deepening the financial sector and strengthening the regulation of nonbank financial institutions 11. Revise the legislations for non-financial institutions namely, the Insurance Industry
Act, the Business and Provident Fund Act and to align them with current market conditions.
2009/10 NBFIRA/ IFSC/ MFDP
12. Submit to Parliament a legislative framework to position Botswana as the medium to long term preferred offshore financial services centre for sub-Saharan Africa.
2009/10 MFDP
13. Enact a Financial Intelligence Law February 2009
MFDP
Gov
erna
nce
and
capi
tal
mar
ket d
evel
opm
ent
14. Revise the Securities Act to transform the Botswana Stock Exchange (BSE) from a parastatal to a commercial organisation.
November 2009
NBFIRA/ MFDP
3- Improving pro-poor service delivery
15. Transform the Central Statistics Office (CSO) into an autonomous institution and develop poverty data base and information systems which will provide information for monitoring.
2009/10 MFDP
Stre
ngth
enin
g pu
blic
ad
min
istr
atio
nca
paci
ties
16. Transform the Botswana Institute of Administration and commerce into a modern Civil Service College.
2009/10 MFDP
17. Develop a comprehensive Decentralization Policy to guide decisions on overall service delivery and promotion of local level participation through further devolution of local functions to the sub-district level.
June 2009 MLG
Impr
ovin
g so
cial
safe
ty
nets
and
serv
ice
deliv
ery
18. Improve the social safety nets with a view to graduating able-bodied beneficiaries from the programs and shift focus towards psycho-social support and empowerment to prevent people falling into poverty trap.
2009/10 MFDP
Pillar 1: Support a more com
petitive and Dynam
ic private sector

APPENDIX 6
BOTSWANA: SUMMARY OF PFM PERFORMANCE SCORES, FEBRUARY 2009
PFM Performance Indicator Score Method
A. Credibility of the Budget
1. Aggregate expenditure out-turn compared to original approved budget C M1 2. Composition of expenditure out-turn compared to original approved budget C M1 3. Aggregate revenue out-turn compared to original approved budget A M1 4. Stock and monitoring of expenditure payment arrears <NS> M1
B. Comprehensiveness and Transparency
5. Classification of the budget C M1 6. Comprehensiveness of information included in budget documentation A M1 7. Extent of unreported government operations A M1 8. Transparency of Inter-Governmental Fiscal Relations C+ M2 9. Oversight of aggregate fiscal risk from other public sector entities. D+ M1 10. Public Access to key fiscal information B M1
C (i) Policy-Based Budgeting
11. Orderliness and participation in the annual budget process B M2 12. Multi-year perspective in fiscal planning, expenditure policy and budgeting C+ M2
C (ii) Predictability and Control in Budget Execution
13. Transparency of taxpayer obligations and liabilities B M2 14. Effectiveness of measures for taxpayer registration and tax assessment B M2 15. Effectiveness in collection of tax payments D+ M1 16. Predictability in the availability of funds for commitment of expenditures D+ M1 17. Recording and management of cash balances, debt and guarantees C M2 18. Effectiveness of payroll controls B+ M1 19. Competition, value for money and controls in procurement D+ M2 20. Effectiveness of internal controls for non-salary expenditure C+ M1 21. Effectiveness of internal audit C+ M1
C (iii) Accounting, Recording and Reporting
22. Timeliness and regularity of accounts reconciliation B M2 23. Availability of information on resources received by service delivery units A M1 24. Quality and timeliness of in-year budget reports C+ M1 25. Quality and timeliness of annual financial statements C+ M1
C (iv) External Scrutiny and Audit
26. Scope, nature and follow-up of external audit D+ M1 27. Legislative scrutiny of the annual budget law B+ M1 28. Legislative scrutiny of external audit reports C+ M1
D. Donor Practices
D-1 Predictability of Direct Budget Support D+ M1 D-2 Financial information provided by donors for budgeting and reporting on project and program aid
D+ M1
D-3 Proportion of aid that is managed by use of national procedures D M1 M1 scorings are based upon the lowest scored dimension making up that indicator M2 scorings represent an aggregate scoring of the dimensions making up that indicator. <NS> indicator could not be scored due to unavailability of data or the lack of reliable data.

APPENDIX 7: ONGOING BANK GROUP OPERATIONS as at 31 March 2009
Project Title Window Approved Signature Effectiveness Completion Approved Cancelled Disbursed Net Disbursement Date Date Date Date Amount Amount Amount Commitment Ratio (%) Agriculture Pandamatenga ADB Loan 7-Sep-2008 Unsigned Not yet effective 25,860,000.00 0.00 0.00 25,860,000.00 0.00 Capacity Building for MOA MIC 27-Feb-2007 17-May-2007 17-May-2007 31-Dec-09 293,300.00 0.00 208,306.64 293,300.00 71.02 Improved Water Management System for Pandamatenga AWF 18-Jun-2007 12-Jul-2007 12-Jul-2007 31-Dec-09 1,052,186.28 0.00 783,064.21 1,052,186.28 74.42 Agricultural Sector Review MIC 16-Feb-2007 14-May-2007 17-May-2007 30-Apr-09 476,795.00 0.00 92,352.04 476,795.00 19.37 Sub-Total: Agriculture 27,682,281.28 0.00 1,083,722.89 27,682,281.28 3.91 Multi-Sector Institutional strengthening of local authorities MIC 31-Jan-2008 11-Sep-2008 Not yet effective 31-Dec-09 283,594.67 0.00 0.00 283,594.67 0.00 Vision 2016 MIC 1-Nov-2008 1-Jun-2008 Not yet effective 1-Dec-10 245,653.32 0.00 0.00 245,653.32 0.00 Corporate Governance Code MIC 1-Mar-2007 1-Mar-2007 2-Jul-2007 31-Dec-08 151,565.00 0.00 0.00 151,565.00 0.00 Sub-Total: Multi-Sector 680,812.99 0.00 0.00 680,812.99 0.00 Transport Kanzangula Bridge MIC 5-Feb-2007 4-Dec-2007 4-Dec-2007 31-Dec-09 600,000.00 0.00 519,579.49 600,000.00 86.60 Kanzangula Bridge IPPF 1-Dec-2006 17-May-2007 17-May-2007 31-Dec-10 1,450,000.00 0.00 402,321.74 1,450,000.00 27.75 Sub-Total: Transport 2,050,000.00 0.00 921,901.23 2,050,000.00 44.97
Grand Total 30,413,094.27 0.00 2,005,624.12 30,413,094.27 6.59 MIC Total 2,050,907.99 ADB Total 25,860,000.00 AWF Total 1,052,186.28 IPPF Total 1,450,000.00
TECHNICAL APPENDIX: Appendix I- LETTER OF DEVELOPMENT POLICY

Appendix II- IMF COUNTRY RELATIONS NOTE

African Development Bank Group
[Type]
ADB/BADADB/BAD
Special Country Risk Note
BUDGET SUPPORT LOAN BOTSWANA
May 2009
Financial Management Department -FFMA

Page | 2
AFRICAN DEVELOPMENT BANK
SPECIAL COUNTRY RISK NOTE1
BOTSWANA
1 Recommendations and views expressed in this report are those of FFMA and do not constitute an official position statement of
Botswana Government.
The purpose of this report is to present a summary of the assessment of the country’s
long term economic growth prospects and the outlook for its credit risk profile given
the magnitude of the proposed budget support loan of USD 1.5 billion. The assessment
takes into consideration the impact of recent developments in the economy as a result
of the financial and economic crises, and how these developments would shape the
medium term prospects and future outlook of the country. The assessment focuses on
three key elements: (i) the strengths and weaknesses of the economy; (ii) the threats or
risks inherent in the economy in view of the global economic downturn; and (iii) the
opportunities for the Bank’s intervention.
The main conclusion of the assessment is that the country continues to enjoy one of
the best country risk rating on the continent and is not expected to be downgraded in
the near future. However, the risk outlook hovers on the edges of stable to negative
but tilting more towards the negative as the global financial and economic crisis
deepens.
The UA 1.5 billion loan is sustainable and beneficial to the country.

Page | 3
I. COUNTRY PERFORMANCE AND MEDIUM TERM OUTLOOK
1.1 The country’s macro-economic fundamentals remain strong due to the consistent
implementation of comprehensive program of policy reforms over the past 10 years. Over
the last two decades, Botswana has been one of the fastest growing economies in the
continent. The economy recorded an average growth rate of 4.4% over the Ninth National
Development Plan 2003-2008 (NDP 9) and 7% over the period 1993-2002. This is quite a
good achievement, although real growth rate under NDP 9 was lower than the target
average growth rate of 5.5% set out in the plan. The main economic driver is the mining
industry, particularly diamonds which dominate the economy and accounts for 39% of GDP,
more than 70% of exports and almost 50% of government revenues on the average. Sound
macro-economic policies, good governance, and high investment were the drivers of
Botswana’s strong position among the MIC countries and its performance.
1.2 The impact of the global financial crisis and economic downturn has been felt differently in
the various segments of the economy. The financial sector has been so far shielded while
the impact on the real sector has been quite significant. The mining sector has been hit the
hardest. From the last quarter of 2008 and onward, the low global demand and falling prices
of minerals led to lower exports receipts and lower revenues for the Government. It also
resulted in temporary mine closures and retrenchments. The spill-over effects on the
economy are: (i) wider current account deficit and financing constraints; (ii) larger fiscal
balance deficits ; (iii) reprioritisation, curtailment and postponement of capital expenditure
programmes; (iv) lack of longer term credit and investment funds (iii) slowdown in consumer
spending (iv) reduced employment and incomes, etc. On the positive side, the financial
sector has been resilient because of low levels of integration in the global financial system
and less exposure to complex financial instruments and foreign funding
1.3 Despite the impact of lower demand and low commodity prices as a result of the financial
crisis, Botswana has adequate liquidity (liquidity ratio over 200%). The country has the
strongest international reserves among the other mineral producing economies in the
continent, with nearly 30 months of import cover. Foreign exchange reserves stood at USD
9.12 billion at the end of December 2008. However, since the financial crisis, the country’s
high level of international reserves has decreased to around 22 months import cover. At the
end of January 2009, the foreign exchange reserves fell by 12% in USD terms as a result of fall
in equity market price, a slowdown in diamond export receipts and payments for government
and other transactions.
1.4 The country has a very strong external position. The country’s total debt (internal and
external) is projected to be at USD 520 million in 2009, representing 4.9 % of GDP (of which
2.2% for international debt and 2.7% for domestic debt). This level is far below the critical
universal benchmark of 50%. Debt service burden is forecast at 6.5% of exports of goods and
services, far lower than the benchmark of 30%. This gives the government sufficient leeway to
borrow internationally. This impressive performance is largely attributed to the conservative
borrowing policy of the Government (focusing on concessionary borrowing). The tenor
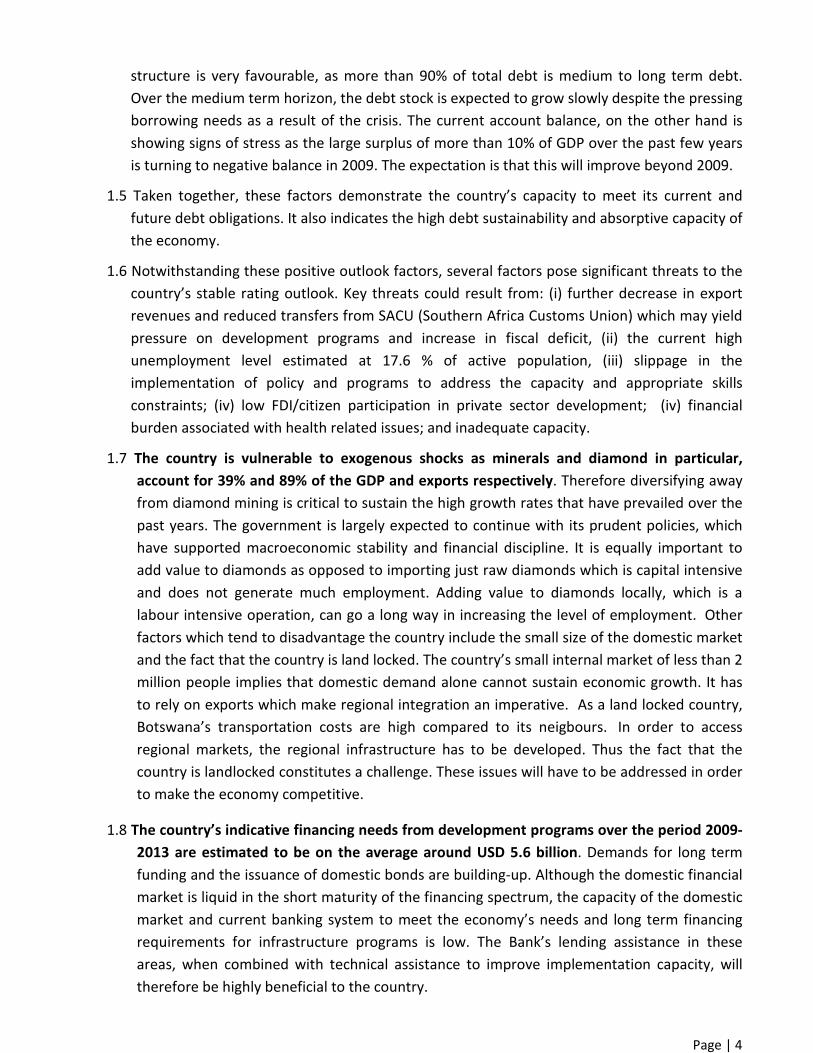
Page | 4
structure is very favourable, as more than 90% of total debt is medium to long term debt.
Over the medium term horizon, the debt stock is expected to grow slowly despite the pressing
borrowing needs as a result of the crisis. The current account balance, on the other hand is
showing signs of stress as the large surplus of more than 10% of GDP over the past few years
is turning to negative balance in 2009. The expectation is that this will improve beyond 2009.
1.5 Taken together, these factors demonstrate the country’s capacity to meet its current and
future debt obligations. It also indicates the high debt sustainability and absorptive capacity of
the economy.
1.6 Notwithstanding these positive outlook factors, several factors pose significant threats to the
country’s stable rating outlook. Key threats could result from: (i) further decrease in export
revenues and reduced transfers from SACU (Southern Africa Customs Union) which may yield
pressure on development programs and increase in fiscal deficit, (ii) the current high
unemployment level estimated at 17.6 % of active population, (iii) slippage in the
implementation of policy and programs to address the capacity and appropriate skills
constraints; (iv) low FDI/citizen participation in private sector development; (iv) financial
burden associated with health related issues; and inadequate capacity.
1.7 The country is vulnerable to exogenous shocks as minerals and diamond in particular,
account for 39% and 89% of the GDP and exports respectively. Therefore diversifying away
from diamond mining is critical to sustain the high growth rates that have prevailed over the
past years. The government is largely expected to continue with its prudent policies, which
have supported macroeconomic stability and financial discipline. It is equally important to
add value to diamonds as opposed to importing just raw diamonds which is capital intensive
and does not generate much employment. Adding value to diamonds locally, which is a
labour intensive operation, can go a long way in increasing the level of employment. Other
factors which tend to disadvantage the country include the small size of the domestic market
and the fact that the country is land locked. The country’s small internal market of less than 2
million people implies that domestic demand alone cannot sustain economic growth. It has
to rely on exports which make regional integration an imperative. As a land locked country,
Botswana’s transportation costs are high compared to its neigbours. In order to access
regional markets, the regional infrastructure has to be developed. Thus the fact that the
country is landlocked constitutes a challenge. These issues will have to be addressed in order
to make the economy competitive.
1.8 The country’s indicative financing needs from development programs over the period 2009-
2013 are estimated to be on the average around USD 5.6 billion. Demands for long term
funding and the issuance of domestic bonds are building-up. Although the domestic financial
market is liquid in the short maturity of the financing spectrum, the capacity of the domestic
market and current banking system to meet the economy’s needs and long term financing
requirements for infrastructure programs is low. The Bank’s lending assistance in these
areas, when combined with technical assistance to improve implementation capacity, will
therefore be highly beneficial to the country.

Page | 5
II. OVERALL RISK PROFILE
2.1 During 2009, Botswana has its position as one of the best rated African countries with an
average rating of 1 (very low risk class2). The country’s rating score is significantly better than
the African average on all the five risk indices as illustrated in Annex 1 which provides the risk
profile of the country. This very good rating is confirmed by Fitch, Moody’s and other risk
intelligence services as indicated in Table 1.
Table 1 – Botswana Country Risk Profile 2009
Country ADB Internal Rating External Rating Outlook
S&P Fitch Moody’s
Botswana 1 Very Low Risk A+/- A+ A1 Stable to negative
Source: S&P, Fitch and Moody’s country Reports and ADB 2008-2009 rating surveys.
2.2 The strong 2009 internal and external ratings reflect the sound macro-economic
fundamentals, stable socio-political environment and the government’s commitment and
responsiveness to the global financial crisis. However, there are several risk factors that
could impact on the long-term country rating outlook.
2.3 The country risk outlook depends on growth prospects and recovery on key external
markets. If the current crisis deepens, demand and price of minerals decrease further and
result in a decline in export revenues, the rating may edge towards negative outlook. Key
areas to be monitored include: (i) fiscal stimulus program, (ii) implementation of the ongoing
reform programs and the privatization program, (iii) further diversification of the economy
(iv) reduction of unemployment rate and (v) improvement of the implementation capacity of
government agencies.
III. ADB EXPOSURE3
3.1 The Bank’s exposure to Botswana is currently very low. At the end of March 2009, the
disbursed and outstanding loan balance to Botswana stood at UA 19.7 million
corresponding to 1% of the total ADB disbursed and outstanding portfolio. Disbursement of
the first tranche (around UA 668.9 million) and second tranche (around UA 334.4 million)
will increase the Bank exposure to Botswana to 8% in 2009 and 9% in 2010.
3.2 As a very low risk country with large economic potential, the country limit for Botswana in
terms of the share of the total risk capital is 12%. The current portfolio has used 1% of the
country limit yielding an available risk capital of 99%. The gap between the net exposure of
2 ADB Internal Rating Scale
3 Figures are indicative and are subjected to changes depending on the underlying assumptions on ADB overall portfolio growth.

Page | 6
the country and what could be borrowed provides a window of opportunity for more
exposure to the country especially in the sovereign lending as indicated in Table 2.
3.3 The incremental exposure resulting from the budget support loan is sustainable and will
increase the risk capital utilisation by around 3% at the final disbursement of the budget
support loan. The risk capital headroom after the second disbursement will be around 72.4%
of the country limit. Therefore this budget support loan will not threaten to the Bank’s
financial strength and risk bearing capacity.
Table 2: ADB Exposure to Botswana and Risk Capital Utilisation
Item Current
( March 2009)
After 1st
Disbursement
Tranche
After 2nd
Disbursement
Tranche
Exposure
Disbursed & Outstanding 19.7 688.6 1023.0
Indicative Share of ADB projected portfolio 1% 8% 9%
Risk Capital Utilisation
Country Limit 12%
Used Limit (Share of country) limit) 1% 18.6% 27.6%
Unused Limit (Share of country) limit) 99% 81.4% 72.4%
IV. CONCLUSIONS AND RECOMMENDATIONS
4.1 Over the past decades, Botswana has demonstrated its capacity to address development
needs through prudent allocation of available resources for socio-economic development
and management of country reserves. The deteriorating outlook as a result of pressures from
the international financial and economic crisis call for significant interventions to support
those development programs which are critical for sustaining growth.
4.2 Future plans are articulated around infrastructure, private sector development, and support
for the implementation reforms and the development hubs. The authorities have engaged
in huge infrastructure program centred on energy and PPP. This includes several mega
development projects (USD 5.6 billion) to sustain growth.
4.3 In the light of the above, the absorptive capacity of Botswana is high. It is also supported by a
good risk profile. Based on these factors, country sustainable lending limit is around UA 0.9
billion per year over the period 2009-2010 depending on the portfolio risk profile.
4.4 The proposed budget support loan is expected to be disbursed in two tranches and complies
with exposure limits and guidelines.

Page | 7
Annex 1
Country Risk At a Glance - BOTSWANA

Botswana - Assessment Letter for the African Development Bank May 20, 2009
Sound macroeconomic management, including good governance of large diamond revenues, has moved Botswana well into the ranks of middle-income countries over the past decade. The global economic crisis has reduced demand for Botswana’s diamonds, however, and the economy is expected to contract by 10 percent in 2009. Significant downside risks remain as the recovery in demand for diamonds remains uncertain. Government spending has increased sharply over the past two years, raising concerns about its quality, although proposed spending cuts in 2009/10 should stabilize the non-mining primary deficit. The external current account is set to deteriorate in 2009, but capital inflows should facilitate a modest build-up of reserves. Thus far, the banking sector remains stable and profitable.
Recent Economic Developments and Outlook
1. Sound macroeconomic policies and good governance have contributed to strong economic performance in recent years. Real GDP growth averaged 4½ percent during 2003–2008, supported in part by stronger growth in the non-mining economy. Sound management of diamond revenues together with high minerals’ prices also resulted in large fiscal and external surpluses over this period, boosting reserves to 22 months’ imports of goods and services by end–2008 and resulting in the accumulation of sizable fiscal savings. 2. The global economic crisis has reduced demand for diamonds and contributed to a significant deterioration in Botswana’s near-term economic outlook. Real GDP is projected to contract by about 10 percent in 2009, as diamond output is expected to fall by close to 40 percent. The downturn in the diamond sector is also likely to contribute to slower growth in the non-mining sector, although large public expenditures associated with several ongoing infrastructure projects, including domestic electricity generation, should help sustain non-mining growth of 5 percent in 2009. Significant downside risks remain as the outlook for diamond production in 2009 is still uncertain. 3. The non-mining primary deficit (NMPD)1 amounted to 29 percent of non-mining GDP in 2008/09, much smaller than budgeted, but still a sizable increase from 17 percent in 2007/08. The increased deficit mostly reflected a sharp increase in expenditure to 63 percent of non-mining GDP (NMGDP) compared with 53 percent of NMGDP in 2007/08. Development spending rose markedly, increasing by 54 percent in real terms, as the government accelerated the construction of the airport, roads, dams, schools and the Morupule electricity generation project. 1
The NMPD is calculated as the difference between non-mineral revenue and expenditure (excluding interest receipts and interest payments), divided by non-mineral GDP.
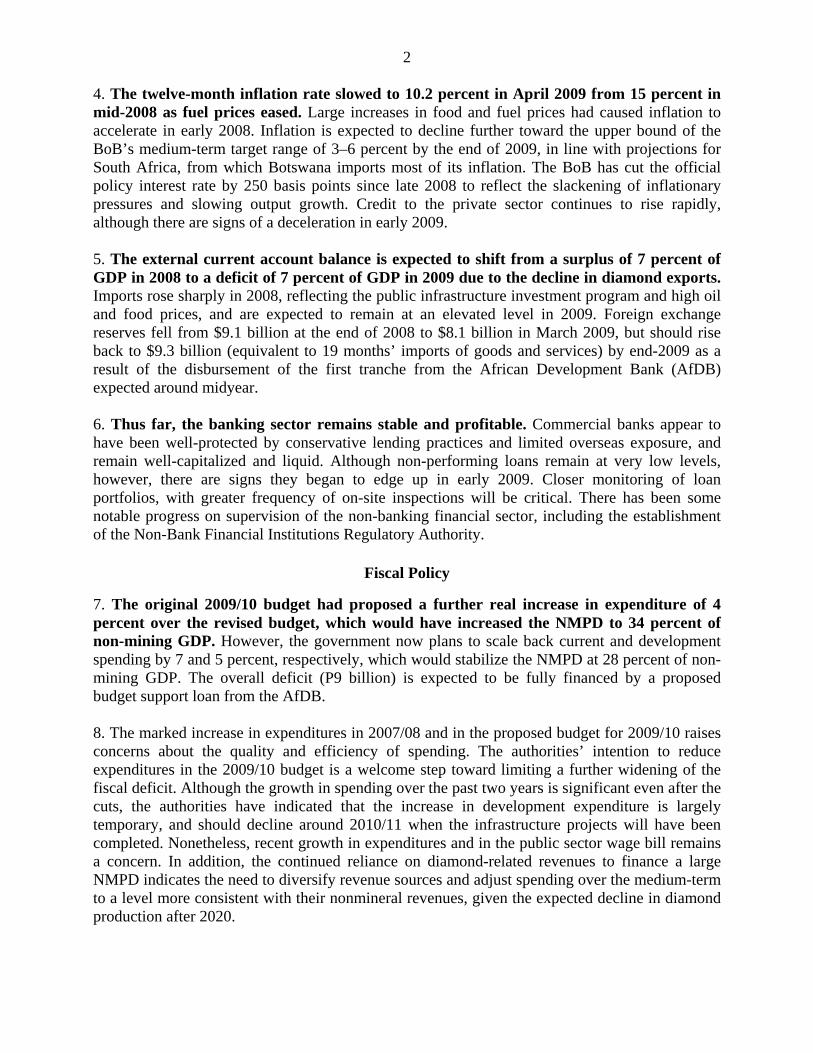
2
4. The twelve-month inflation rate slowed to 10.2 percent in April 2009 from 15 percent in mid-2008 as fuel prices eased. Large increases in food and fuel prices had caused inflation to accelerate in early 2008. Inflation is expected to decline further toward the upper bound of the BoB’s medium-term target range of 3–6 percent by the end of 2009, in line with projections for South Africa, from which Botswana imports most of its inflation. The BoB has cut the official policy interest rate by 250 basis points since late 2008 to reflect the slackening of inflationary pressures and slowing output growth. Credit to the private sector continues to rise rapidly, although there are signs of a deceleration in early 2009. 5. The external current account balance is expected to shift from a surplus of 7 percent of GDP in 2008 to a deficit of 7 percent of GDP in 2009 due to the decline in diamond exports. Imports rose sharply in 2008, reflecting the public infrastructure investment program and high oil and food prices, and are expected to remain at an elevated level in 2009. Foreign exchange reserves fell from $9.1 billion at the end of 2008 to $8.1 billion in March 2009, but should rise back to $9.3 billion (equivalent to 19 months’ imports of goods and services) by end-2009 as a result of the disbursement of the first tranche from the African Development Bank (AfDB) expected around midyear. 6. Thus far, the banking sector remains stable and profitable. Commercial banks appear to have been well-protected by conservative lending practices and limited overseas exposure, and remain well-capitalized and liquid. Although non-performing loans remain at very low levels, however, there are signs they began to edge up in early 2009. Closer monitoring of loan portfolios, with greater frequency of on-site inspections will be critical. There has been some notable progress on supervision of the non-banking financial sector, including the establishment of the Non-Bank Financial Institutions Regulatory Authority.
Fiscal Policy
7. The original 2009/10 budget had proposed a further real increase in expenditure of 4 percent over the revised budget, which would have increased the NMPD to 34 percent of non-mining GDP. However, the government now plans to scale back current and development spending by 7 and 5 percent, respectively, which would stabilize the NMPD at 28 percent of non-mining GDP. The overall deficit (P9 billion) is expected to be fully financed by a proposed budget support loan from the AfDB. 8. The marked increase in expenditures in 2007/08 and in the proposed budget for 2009/10 raises concerns about the quality and efficiency of spending. The authorities’ intention to reduce expenditures in the 2009/10 budget is a welcome step toward limiting a further widening of the fiscal deficit. Although the growth in spending over the past two years is significant even after the cuts, the authorities have indicated that the increase in development expenditure is largely temporary, and should decline around 2010/11 when the infrastructure projects will have been completed. Nonetheless, recent growth in expenditures and in the public sector wage bill remains a concern. In addition, the continued reliance on diamond-related revenues to finance a large NMPD indicates the need to diversify revenue sources and adjust spending over the medium-term to a level more consistent with their nonmineral revenues, given the expected decline in diamond production after 2020.

3
Monetary Policy and Exchange Rate Policy
9. In light of the weak outlook for growth and slowing inflation, there appears to be room for further monetary policy easing provided that government spending in 2009/10 is scaled back as planned. Too rapid an expansion in government spending after the large increase in 2008/09, however, could add to inflationary pressure and limit the space for further easing of monetary policy in the event of a prolonged downturn. 10. There appears to be limited scope for real exchange rate adjustment to improve prospects for non-mining exports, given that most of Botswana’s inflation is imported. While ensuring stability of the REER is important for maintaining Botswana’s non-mining sector competitiveness, other factors such as fiscal consolidation, raising productivity by deepening structural reforms, and improving the business climate are equally as important and should be pursued with the same vigor as REER stability.
Medium-Term Diversification
11. The sharp diamond-related contraction in real GDP highlights the need to enhance productivity growth and promote greater economic diversification. The current downturn provides a window of opportunity for implementing the structural reforms needed to achieve these objectives. The authorities’ strategy for diversification focuses on infrastructure investment to facilitate the creation of hubs in several sectors that have been identified as possessing potential for further development, as well as investment in education to build up human capital and boost productivity. It will be important to monitor that outcomes are commensurate with the considerable public investment in these areas. 12. Strengthening the investment climate also remains a key priority. Although structural measures of competitiveness indicate that Botswana ranks favorably in terms of the overall ease of doing business, it lags behind in ease of cross-border trade, enforcing contracts and starting a business. The authorities have indicated they are committed to addressing issues related to access to land and the provision of work permits for expatriates.
Fund Relations
13. Botswana is on the standard 12-month Article IV consultation cycle; the last Article IV consultation was concluded by the Executive Board on December 7, 2007. The 2009 Article IV consultation mission was held from May 6–15, and the consultation is scheduled to be completed by the Board in July 2009.

2007 2008 2009 2010 2011 2012 2013 2014
National income and prices Real GDP 1 4,4 2,9 -10,3 4,1 8,6 13,8 8,9 2,0
Mineral -2,0 -3,7 -36,7 0,3 24,0 29,1 1,8 0,1Non-mineral 9,0 7,2 4,9 5,5 3,5 7,7 12,3 2,8
Consumer prices (average) 7,1 12,6 8,4 5,8 5,2 5,0 5,0 5,0 Consumer prices (end of period) 8,1 13,7 6,3 5,4 5,0 5,0 5,0 5,0 Nominal GDP (billions of pula) 1 75,7 91,2 80,9 88,2 98,8 117,5 134,9 143,3
Mineral 30,6 37,6 20,1 22,3 30,9 42,5 45,9 48,7Non-mineral 2 45,2 53,6 60,8 65,9 67,9 75,0 88,9 94,6
Diamond production (millions of carats) 33,6 32,6 20,0 20,0 25,0 32,6 33,0 33,0
External sector Exports of goods and services, f.o.b. (US$) 10,6 -0,4 -36,9 6,4 17,6 20,0 22,5 4,0 Of which:
Diamonds -2,3 -6,1 -44,5 1,9 30,1 32,2 2,9 1,6Other raw materials 59,4 -21,3 -51,2 22,7 12,8 12,0 14,2 3,5Other 29,2 56,5 -21,8 9,1 6,6 6,9 101,4 7,9
Imports of goods and services, f.o.b. (US$) 29,2 26,2 -11,1 18,3 2,3 3,1 -5,4 3,8 Terms of trade 1,0 7,9 -13,7 2,3 -2,0 0,2 0,1 0,1 Central government finance 3
Total revenue and grants 4,5 5,7 -13,0 13,1 17,1 17,5 10,7 6,5 Total expenditure and net lending 25,8 40,6 1,4 5,4 -0,6 2,8 6,4 6,0
Money and bankingNet foreign assets 24,1 19,7 4,0 10,8 11,3 9,5 13,5 12,7Net domestic assets 17,0 18,0 -10,8 6,5 12,1 8,0 18,7 12,2Money and quasi money (M2) 31,2 21,1 16,7 13,6 10,8 10,4 10,3 13,0Velocity (non-mineral GDP relative to M2) 1,4 1,4 1,3 1,3 1,2 1,2 1,3 1,2Credit to the private sector 25,7 26,6 15,9 8,9 7,2 7,4 8,5 7,3
Investment and savings 1
Gross investment 25,9 32,4 34,5 41,2 39,0 37,9 29,3 28,9Public 7,8 11,2 12,8 11,9 9,5 7,4 7,0 7,2Private 18,1 21,3 21,7 29,3 29,5 30,5 22,3 21,7
Gross savings 40,9 42,1 27,5 27,7 30,4 34,8 36,7 36,6Public 20,1 15,0 11,5 11,2 13,7 15,6 16,5 17,0Private 20,8 27,1 16,0 16,5 16,7 19,2 20,2 19,6
Saving–investment balance 15,0 9,6 -7,0 -13,5 -8,6 -3,2 7,4 7,7
Central government finance 3
Total revenue and grants 36,0 34,1 31,8 32,8 33,7 33,6 33,1 33,2Total expenditure and net lending 31,2 39,4 42,7 41,0 35,8 31,3 29,6 29,5Overall balance (deficit –) 4,8 -5,2 -10,9 -8,2 -2,1 2,4 3,5 3,7Non-mineral primary balance (percent of non-mineral GDP) 4 -16,8 -28,5 -27,9 -25,3 -21,3 -16,7 -13,7 -13,0
External sectorCurrent account balance 14,3 7,0 -7,0 -13,5 -8,6 -3,2 7,4 7,7Balance of payments 14,1 8,2 2,1 1,2 5,4 3,7 6,6 6,8External public debt 5 2,5 2,3 11,9 16,4 15,4 13,5 12,3 11,6External public debt in percent of total exports 5,3 5,3 34,3 45,6 38,1 31,8 26,0 24,1
Change in reserves (increase –) -1 742 -1 100 -218 -135 -619 -485 -957 -1 001Gross official reserves (end of period) 9 743 9 125 9 343 9 478 10 097 10 582 11 540 12 541
In months of imports of goods and services 6 20,7 21,8 18,9 18,7 19,3 21,4 22,5 23,6In percent of GDP 79,0 67,8 88,0 86,8 88,2 81,0 80,1 85,2
Pula Fund (US$ millions) 6 614 6 866 ... ... ... ... ... ...In months of imports of goods and services 6 14,1 16,4 ... ... ... ... ... ...
Liquidity portfolio/ other reserves (US$ millions) 3 130 2 259 ... ... ... ... ... ...In months of imports of goods and services 6 6,6 5,4 ... ... ... ... ... ...
... ... ... ... ... ...Gross official reserves, net of BoBC (US$ millions) 6 977 6 790 ... ... ... ... ... ...
In months of imports of goods and services 6 14,8 16,2 ... ... ... ... ... ... Sources: Botswana authorities; and IMF staff estimates and projections.
1 Calendar year.
5 Medium- and long-term public and publicly guaranteed debt outstanding.6 Based on imports of goods and services for the following year.
Table 1. Medium-Term Economic and Financial Indicators, 2007–2014
(Annual percentage change, unless otherwise indicated)
(Percent of GDP, unless otherwise indicated)
(US$ millions, unless otherwise indicated)
2 Stronger growth in non-mineral real GDP over the medium-term partly reflects significant investment in electricity generation, including the Morupule Power Station and the Mmamabula Energy Project. 3 Year beginning April 1. 4 The non-mineral primary balance is computed as the difference between non-mineral revenue and expenditure (excluding interest receipts and interest payments), divided by non-