african development report 2014 - ecdpm.org
TRANSCRIPT

African Development Report 2014Regional Integration for Inclusive Growth
AfricAn Development BAnk
immeuble du centre de commerce international d’Abidjan cciA
Avenue Jean-paul ii
01 Bp 1387
Abidjan 01, côte d’ivoire
tel: (225) 20 26 10 20
email: [email protected] / [email protected]
the African Development report for 2014 is devoted to Africa’s key economic and political aspiration—the integration of the
continent. fifty years after it became a pillar of Africa’s apex organizations, including that of the African Development Bank,
the building blocks for regional integration as well as policies and strategies are now well in place, what remains is institutional
building and committed implementation at the national and regional levels. this will require political resolve and heightened
institutional capacities. the report’s main conclusion is that regional integration is still a relevant pillar for Africa’s development,
although the global context has changed greatly since the continental goal was first introduced in the 1960s.
in 2013, the African Development Bank adopted its new ten-Year Strategy, “At the center of Africa’s transformation” which
once again reinforces the importance of regional integration for its work. As Africa looks ahead with confidence, the Bank will
continue to be a keen supporter of all possible efforts to bring Africans and their economies together. this will be reflected in its
support to infrastructure development, cross-border and international trade, governance and related policies, as well as capacity
building. the Bank’s decentralization program will ensure that it has a presence in all regions of the continent and will continue
to actively support the regional integration agenda, including through partnerships with regional member countries, and the
private sector in and outside the continent.
African D
evelopment R
eport 2014 R
egional Integration for Inclusive Grow
th

ii

African Development Report 2014Regional Integration for Inclusive Growth

iv
African Development Report 2014
Regional Integration for Inclusive Growth
Copyright © 2014 African Development Bank
Immeuble du Centre de commerce International d’Abidjan CCIA
Avenue Jean-Paul II
01 BP 1387
Abidjan 01, Côte d’Ivoire
Tel: (225) 20 26 10 20
Email: [email protected] / [email protected]
Rights and permissions
All rights reserved.
The text and data in this publication may be reproduced as long as the
source is cited. Reproduction for commercial purposes is forbidden.
The African Development Report 2014 is a production of the Development
Research Department.
The findings, interpretations, and conclusions expressed in the Bank’s
publications are entirely those of the author(s) and do not necessarily
represent the view of the African Development Bank, its Board of
Directors, or the countries they represent.
Designations employed in this Report do not imply the expression of any
opinion, on the part of the African Development Bank, concerning the
legal status of any country or territory, or the delineation of its frontiers.
Working papers are available online at www.afdb.org
Printed by Phoenix Design Aid A/S, a CO2 neutral company accredited in the fields of quality (ISO 9001), environment (ISO 14001) and CSR (DS 49001) and ap-proved provider of FSC™ certified products. Printed on environmentally friendly paper without chlorine and with vegetable-based inks. The printed matter is recyclable.

vAfrican Development Report 2014 Regional integration for inclusive growth
Foreword
The theme of the African Development Report 2014, “Regional Integration for Inclusive Growth,” recognizes that regional integration is not an end in itself, but rather a tool for enhancing economic growth and fostering inclusion – within and between countries. After decades of relative stagnation, Africa has shown a steady upward improvement in performance in the past decade and a half. Average growth has been about 5 %, while the value of intra-African trade has increased fourfold over the last decade to reach USD 130 billion. This Report discusses the regional opportunities that have come with this growth momentum, including the development of regional supply networks and trade in intermediate goods within Africa’s regional and global value chains. The Report also looks at the hard and ‘soft’ infrastructure required to connect markets, enhance competitiveness, strengthen and deepen financial systems, and position Africa as a home for global business.
The Report therefore undertakes a careful examination of the opportunities available to countries and regional economic communities in bringing about sustained growth and shared prosperity. It is, however, not obliv-ious to the challenges facing the continent. The Report notes that growth based on resource extraction, with little value added, will not generate the momentum, nor the inclusive space, required to ensure sustainability. Future growth demands a model that creates more em-ployment opportunities, enhances productivity, fosters technology transfer and reduces inequality. On its part, the Bank believes that Africa must pursue economic integration as part of its broader development strategy in a rapidly globalizing world. Integration will provide Africa the scale economies it needs to benefit fully from the expanding global value chains.
The Report also looks at the institutional challenges facing Regional Economic Communities and how they could be overcome. Much effort will be needed to ensure that strategies and forward planning do not remain on the drawing board. It is thus notable that Regional Eco-nomic Communities are already adopting rules-based mechanisms to improve implementation through better monitoring and evaluation, dispute settlement, and ca-pacity building.
I would like to recommend this Report to all individuals and groups interested in the challenges and opportunities of Africa’s regional economic integration. The Report takes a much broader view than previous analyses, look-ing especially at how regional integration can ensure that Africa’s recent growth is sustained, that it is inclusive, and that ultimately it leads to structural transformation. The Bank will continue to play a leading role in fostering Africa’s economic integration while assisting Regional Economic Communities in their quest to create vibrant and attractive regional markets, and to ensure that all countries in the region, including landlocked countries and fragile states, benefit from links to global markets and intra-African trade.
Donald KaberukaPresidentAfrican Development Bank Group

The African Development Report 2014 (ADR) was prepared by staff
of the African Development Bank Group under the overall guidance
of Professor Mthuli Ncube (then Chief Economist and Vice President
and currently on leave), Gilbert Mbesherubusa (former Vice President,
Complex of Infrastructure, Private Sector and Regional Integration),
Steve Kayizzi-Mugerwa (Director, Research Department and Acting
Chief Economist and Vice President), Alex Rugamba (Director,
ONEC, previously Director NEPAD, Regional Integration and Trade
Department), Issa Faye (Manager, Research Division) and Moono
Mupotola (Manager, Regional Integration and Trade). The Report is
the result of collaboration between the Research Department and
the NEPAD, Regional Integration and Trade Department.
The Report’s core team comprised of Issa Faye (Manager, Research
Division), Ralf Krüger (Task Manager), Audrey Verdier-Chouchane
(Task Manager), Christian Kingombe, Gabriel Mougani, Emelly
Mutambatsere, Thierry Kangoye, Ilan Strauss, Rebecca Dadzie,
Brennan Hodkinson, Mark Pearson and Anne Sofie Westh Olsen.
The Report benefited from inputs and comments from across the
Bank and from consultations with Regional Economic Communities
in Abidjan and Lusaka in March, 2014. Ines Hajri and Nadia Lamari
provided valuable administrative and logistical support, while
Charlotte Karagueuzian, Andrew Lawday and David Short provided
editorial assistance. The French version of the Report was prepared
for publication by Architexte, Paris.
Background papers were drafted by Bruce Byiers, Jan van Heukelom,
and Quentin de Roquefeuil from the European Centre for Development
Policy Management (ECDPM); Jane Kennan and Christopher Stevens
from the Overseas Development Institute (ODI); Gerhard Erasmus
and Trudi Hartzenberg from the Trade Law Centre (TRALAC); and
Sophie van Hullen from SOAS (University of London).
During consultations and preparation of the Report, a number of
useful suggestions were received from the following: Ibrahima
Amadou Dia (University of Geneva), Jason Gagnon (OECD); Jodie
Keane and Sheila Page (ODI); Issouf Soumaré (University of Laval);
Kathleen van Hove (ECDPM); Fliss Liwaeddine, Treasure Maphanga,
and Bonkoungou Zouli (African Union Commission); Imed Ben Hadj
Hamouda (Arab Maghreb Union); Abu Sufian Dafalla (Common Market
for Eastern and Southern Africa); Joseph Birungi and Philip Wambugu
(East African Community); Augustin Ndabihore (Economic Community
of Central African States); Sédiko Douka (Economic Community of
West African States); Mwathi Kungu (Intergovernmental Authority on
Development); Lovemore Bingandadi and Cassius Chuma (Southern
African Development Community); Adama Deen (New Partnership
for Africa’s Development Planning and Coordinating Agency); Lynette
Chen Jules (NEPAD Business Foundation); Andrew Sinyangwe (Walvis
Bay Corridor Group); Anthony Moungameli Mehlwana (United Nations
Economic Commission for Africa); Joseph Amihere and Cyril Okoye
(Association of African Development Finance Institutions); Kara Diallo
(Borderless Alliance); and Dotun Ajayi (African Business Roundtable).
Acknowledgements
vi

viiAfrican Development Report 2014 Regional integration for inclusive growth
Foreword .................................................................................................................................................................................................................... v
Acknowledgements……………… ................................................................................................................................................................................ vi
List of Boxes .............................................................................................................................................................................................................. x
List of Figures .......................................................................................................................................................................................................... xi
List of Tables ............................................................................................................................................................................................................ xi
List of Acronyms ..................................................................................................................................................................................................... xii
Executive Summary ........................................................................................................................................................................ xv
Chapter 1: Introduction: Regional Integration as an Imperative for Inclusive Growth ...........................................................................1
References .................................................................................................................................................................................................................5
Chapter 2: Strengthening Regional Institutions ................................................................................................................................. 7
2.1 Introduction ..........................................................................................................................................................................................................8
2.2 Integration through trade policy ........................................................................................................................................................................9
2.2.1TheAfricanintegrationagenda.............................................................................................................................................................9
2.2.2Regionaltradepolicyliberalization..................................................................................................................................................... 11
2.3 Institutionalizing regional integration ............................................................................................................................................................. 14
2.3.1Decision-makingstructures................................................................................................................................................................. 14
2.3.2Theissueofoverlappingmemberships...............................................................................................................................................15
2.4 Enforcing compliance and implementation ......................................................................................................................................................19
2.4.1Rules-basedsystems........................................................................................................................................................................... 19
2.4.2Additionalfinancialandtechnicalresources.....................................................................................................................................22
2.4.3Monitoringandevaluationsystems...................................................................................................................................................24
References ...............................................................................................................................................................................................................25
Table of contents

viii
Chapter 3: Developing Regional Infrastructure .................................................................................................................................27
3.1 Introduction ........................................................................................................................................................................................................28
3.2 Leveraging regional infrastructure ...................................................................................................................................................................30
3.2.1Infrastructureforgrowth.....................................................................................................................................................................30
3.2.2Contributionstoinclusivegrowth........................................................................................................................................................31
3.3 Project preparation and financing ....................................................................................................................................................................38
3.3.1Limitedprojectpreparation.................................................................................................................................................................39
3.3.2Financingontherise.......................................................................................................................................................................... 40
3.4 Changes needed ................................................................................................................................................................................................44
3.4.1Moreregionalcooperation.................................................................................................................................................................. 44
3.4.2Moreinclusiveness..............................................................................................................................................................................45
References ...............................................................................................................................................................................................................46
Chapter 4: Managing Regional Migration ......................................................................................................................................... 47
4.1 Introduction ........................................................................................................................................................................................................48
4.2 Migration restricted ..........................................................................................................................................................................................50
4.2.1Migrationasalivelihoodstrategy.......................................................................................................................................................50
4.2.2Regionalpolicies..................................................................................................................................................................................52
4.3 Migration unmanaged ......................................................................................................................................................................................56
4.3.1Limitedskillspooling........................................................................................................................................................................... 57
4.3.2Structuralimpacts..............................................................................................................................................................................58
4.4 From control to management ..........................................................................................................................................................................60
4.4.1Developmentbenefits.......................................................................................................................................................................... 61
References ...............................................................................................................................................................................................................62
Chapter 5: Harnessing Regional Financial Integration .......................................................................................................................67
5.1 Introduction .......................................................................................................................................................................................................68
5.2 Recent trends and developments in regional financial integration and inclusive growth ........................................................................... 70
5.2.1Cross-borderbanking...........................................................................................................................................................................70
5.2.2Capitalmarketsdevelopment............................................................................................................................................................. 74
5.2.3Financialinfrastructure....................................................................................................................................................................... 77
5.3 Inclusive growth challenges ............................................................................................................................................................................ 80
5.3.1Moreeffortneeded.............................................................................................................................................................................. 80
5.3.2Insufficientadvance........................................................................................................................................................................... 86
5.3.3Principlesundermined.........................................................................................................................................................................87
5.3.4Weakentryconditions.........................................................................................................................................................................89
5.4 Confronting the challenges ..............................................................................................................................................................................90
5.4.1Inclusionprinciples.............................................................................................................................................................................. 90
5.4.2Cross-borderbanking......................................................................................................................................................................... 90
5.4.3Capitalmarkets................................................................................................................................................................................... 91
5.4.4Paymentandinformationsystems…................................................................................................................................................. 91
References ................................................................................................................................................................................................................91

ixAfrican Development Report 2014 Regional integration for inclusive growth
Chapter 6: Leveraging Africa’s Value Chains .................................................................................................................................... 95
6.1 Introduction ........................................................................................................................................................................................................96
6.2 Opportunities for Local Firms ........................................................................................................................................................................... 97
6.2.1Competingtoindustrialize.................................................................................................................................................................. 97
6.2.2Supplychains.......................................................................................................................................................................................99
6.2.3Longervaluechains...........................................................................................................................................................................100
6.2.4Growthpoles...................................................................................................................................................................................... 102
6.2.5Newend-markets.............................................................................................................................................................................. 103
6.3. Leveraging value chains ................................................................................................................................................................................. 104
6.3.1Socialandeconomicstandards......................................................................................................................................................... 105
6.3.2Rulesoforiginandtransportcosts.................................................................................................................................................. 105
6.3.3Accesstoforeigncapital................................................................................................................................................................... 106
6.4 Regional policies ............................................................................................................................................................................................. 108
6.4.1Deeperintegration.............................................................................................................................................................................. 108
6.4.2Laborstandards................................................................................................................................................................................ 109
6.4.3Tradefacilitation................................................................................................................................................................................110
6.4.4Investmentcooperation..................................................................................................................................................................... 112
References .............................................................................................................................................................................................................. 113
Index .......................................................................................................................................................................................... 115

x
List of boxes
Box 2.1 Timetable for implementation of the Abuja Treaty
Box 2.2 Tripartite FTA negotiations
Box 2.3 Political economy considerations weigh heavily in regional integration
Box 2.4 Peace and security: a focus for African RECs
Box 2.5 The case of the SADC Tribunal
Box 2.6 The importance of COMESA’s Court of Justice
Box 2.7 Adjustment mechanisms
Box 2.8 The EU’s programmatic approach
Box 3.1 What is regional infrastructure?
Box 3.2 Mining infrastructure for development
Box 3.3 Power trade under the SAPP
Box 3.4 Transnet’s local procurement and knowledge transfer
Box 3.5 Kenya-Uganda Railway
Box 3.6 China’s ‘resources-for-infrastructure’ strategy in Angola
Box 4.1 Immigration policy tensions in South Africa and Sierra Leone
Box 4.2 Learning from Rwanda’s liberal migration policy
Box 5.1 Mauritius Commercial Bank’s Bank of Banks initiative
Box 5.2 Gaps in collaborative arrangements
Box 5.3 AfricInvest: a pan-African private equity firm
Box 5.4 Infrastructure bonds in South Africa
Box 5.5 FNB’s eWallet service
Box 6.1 Nampak and intermediate goods trade
Box 6.2 Ghana’s cocoa industry
Box 6.3 SADC’s labor standards
Box 6.4 The AfDB is integrating trade facilitation into its project activities
xiAfrican Development Report 2014 Regional integration for inclusive growth
List of tablesList of figures
Table 2.1 Three spheres of political economy
Table 2.2 REC implementation status and ambition of agreements varies
Table 3.1 Enhancing the inclusion effects of regional infrastructure
Table 4.1 Top ten sending and receiving countries in Africa, per rate of migration (%), 2010
Table 4.2 Primary legal provisions on free movement of persons in RECs
Table 4.3 Factors influencing the developmental impact of migration
Table 5.1 Major cross-border banks in Africa
Table 5.2 Overview of selected capital markets in Africa (2014 Q1)
Table 5.3 African stock exchanges with a secondary board for SMEs
Table 5.4 Commercial currency flows from Africa’s regions
Table 6.1 Traditional vs. value chain approach to regional integration and growth
Table 6.2 Destinations of Greenfield FDI
Table 6.3 Intra-African Greenfield FDI projects
Table 6.4 Intermediate goods traded within Africa, top 10 intermediate in USD and % of total (2012)
Figure 2.1 REC and AU decision-making structures
Figure 2.2 Membership of African regional integration arrangements
Figure 3.1 How developing infrastructure affects growth
Figure 3.2 Lifeline tariffs below generation costs in African countries
Figure 3.3 External infrastructure financing in Africa
Figure 4.1 Population mobility strategies associated with food insecurity and famine
Figure 4.2 Most African regions have visa requirements above world average
Figure 4.3 Key industries in Sierra Leone face shortages of skilled labor
Figure 5.1 Expanding African banking groups
Figure 5.2 Selected banks and asset shares in host countries, 2011 (%)
Figure 5.3 Cross-border banks and intra-regional remittances
Figure 5.4 Total market capitalization and listed companies
Figure 5.5 Total amounts of medium and long term treasury bonds
Figure 5.6 Outgoing payments from African regions, financial versus commercial counterparties
Figure 5.7 Governance index for selected regions
Figure 6.1 Export costs in Africa

xii
List of acronyms
AACB Association of African Central Banks
AEC African Economic Community
AfDB African Development Bank
AfT Aid for Trade
AGOA African Growth and Opportunity Act
AML/CFT Anti-Money Laundering and Combatting the Financing of Terrorism
AMU Arab Maghreb Union
APEI Accelerated Economic Integration Program
ASEAN Association of Southeast Asian Nations
AU African Union
AU-PS AU Peace and Security Council
BRVM Regional Securities Exchange
BVMAC Securities Exchange of Central Africa
CAR Central African Republic
CEMAC Central African Economic and Monetary Community
CEN-SAD Community of Sahara-Sahel States
CET Common External Tariff
CFA African Financial Community
CMA Common Monetary Area
CMT Cut Make and Trim
COMESA Common Market for Eastern and Southern Africa
COPAX Council for Peace and Security in Central Africa
CoS College of Supervisors
CoSSE Committee of SADC Stock Exchange
CSDP Competitive Supplier Development Program
CSR Corporate Social Responsibility
DAM Day Ahead Market
EAC East African Community
ECCAS Economic Community of Central African States
ECDPM European Centre for Development Policy Management
ECGL Economic Community of the Great Lakes Countries
ECOMOG ECOWAS Monitoring Group
ECOWAS Economic Community of West African States
ECSC European Coal and Steel Community
EPA Economic Partnership Agreement
ETLS ECOWAS Trade Liberalization Scheme
FDI Foreign Direct Investment
FESARTA Federation of Eastern and Southern Africa Road Transport Association
FIP Finance and Investment Protocol
FOB Free on Board
FOCAC Forum on China-Africa Cooperation
GATS General Agreement on Trade in Services
GATT Global Agreement on Trade in Services
GDP Gross Domestic Product
GVC Global Value Chain
GVM Gross Vehicle Mass
ICP International Cooperating Partner
IGAD Intergovernmental Authority on Development
IGADD Intergovernmental Authority on Drought and Development
ICT Information and Communication Technology
ILO International Labour Organization
IOC Indian Ocean Commission
IPPF Infrastructure Project Preparation Facility
KRC Kenya Railway Company
LDC Least Developed Country
M&E Monitoring and Evaluation
MERCOSUR Southern Common Market
MFI Microfinance Institution
MFN Most-Favored Nation
MNE Multinational Enterprise
MoU Memorandum of Understanding
MSME Micro, Small and Medium Enterprise
NAFTA North American Free Trade Agreement
NBFI Non-Bank Financial Institution
NEM Non-Equity Mode of Production
NEPAD New Partnership for Africa’s Development

xiiiAfrican Development Report 2014 Regional integration for inclusive growth
NTB Non-Tariff Barrier
NTFC National Trade Facilitation Committee
NTM Non-Tariff Measure
OAU Organization of African Unity
ODI Overseas Development Institute
OECD Organization for Economic Cooperation and Development
OSBP One-Stop Border Post
PAP Priority Action Plan
PIDA Programme for Infrastructure Development in Africa
PPIAF Public-Private Infrastructure Advisory Facility
REC Regional Economic Community
RoO Rule of Origin
RTA Regional Trade Agreement
SACU Southern African Customs Union
SADC Southern African Development Community
SADCC Southern African Development Coordination Conference
SAP Structural Adjustment Program
SAPP Southern African Power Pool
SMEs Small and Medium Enterprises
SPS Sanitary and Phytosanitary Standards
SPV Special Purpose Vehicle
SSA Sub-Saharan Africa
STR Simplified Trade Regime
TBT Technical Barriers to Trade
TIWG Tax Incentives Working Group
TRALAC Trade Law Southern Africa
TTNF Tripartite Trade Negotiating Forum
TWG Technical Working Groups
UNCTAD United Nations Conference on Trade and Development
UNDESA United Nations Department of Economic and Social Affairs
UNDP United Nations Development Program
UNECA United Nations Economic Commission for Africa
URC Uganda Railway Commission
USD United States Dollar
VAT Value Added Tax
WACMIC West African Capital Markets Integration Council
WAEMU West African Economic and Monetary Union
WAMZ West African Monetary Zone
WB World Bank
WEF World Economic Forum
WTO World Trade Organization
ZIZABONA Zimbabwe Zambia Botswana Namibia Power Interconnector

xiv

Executive Summary

xvi Executive Summary
Africa’s regional integration has been a key economic and political aspiration since the independence decade of the 1960s—some fifty years ago. It is also an important pillar for the work of the African Development Bank, which is celebrating its 50th Anniversary as Africa’s premier development finance institution during 2014. It is thus opportune for the African Development Re-port 2014 to once again reexamine the imperative of regional integration for Africa’s development: looking at what has changed in terms of argument and facts on the ground in the past half century, and to what extent the pursuit of closer economic and political integration is still relevant for the continent. The Report comprises six chapters that discuss the relevance of regional integration in a changed global context; the importance and role of regional economic communities; the impact of regional infrastructure; the implications of the interregional mi-gration of factors of production, notably labor; regional financial integration and the platforms required to raise its impact on regional commerce and economic growth; and how best to link Africa to global production and trade through value chains.
The Report’s main conclusion is that regional integra-tion is still a relevant pillar for Africa’s development, although the global context has changed greatly since the continental goal was first introduced in the 1960s. The challenge going forward is not so much the formu-lation of new policies but rather the implementation of those formulated in the recent past. This will require political resolve and heightened institutional capacities. The policy arguments and main messages of the Report are summarized below.
Executive Summary
Regional Integration and Inclusive Growth Regional integration can be a key means for African countries to foster broad and inclusive growth. Many countries on the continent have small and fragment-ed domestic markets, often landlocked and sometimes conflict-affected—in fact the latter often implies that some are doubly landlocked. Regional integration not only provides scale economies that allow greater access to capital markets, including foreign direct investment, but can also enable countries to pool resources for large, “game-changing” projects in transport and energy. Be-sides, regional integration also promotes intra-regional trade which in many regions can be a major growth motor, and the basis for the emergence of a manufactur-ing sector and for economic diversification. It also has implications for regional employment and the building of technical capacities, and generally for how migration and the pooling of skills could enhance Africa’s com-petitiveness.
At the sub-regional level, regional economic communi-ties (RECs) can play an important role in ensuring that inclusive regional integration policies and measures are pursued by member countries. RECs can be important advocates for the development of infrastructure, har-nessing of regional financial integration, as well as for leveraging trade, investment and value chains. Some RECs are actively pursuing programs aimed at reducing the cost of cross-border trade, trade facilitation and the removal of non-tariff barriers. These are done through the harmonization of policies and standards using well-tar-geted policy dialogue and advisory services. Further-more, RECs also emphasize the important role of the private sector and non-state actors, including entities representing special interest groups – such as small and medium-sized enterprises, women in business and young
xvi

African Development Report 2014 Regional integration for inclusive growth xvii
the imperative of national interests, and lack of resourc-es. There are, however, significant benefits from better coordination and planning of integration projects. For example, the Tripartite Free Trade Agreement involv-ing COMESA, EAC and SADC (Common Market for Eastern and Southern Africa, East African Community and Southern African Development Community) is proving to be an important building block for Africa’s integration agenda. The sequential approach has the potential to resolve misconceptions at a lower level of integration and to narrow down policy differences on issues of trade in goods and services and the movement of business persons.
For RECs to undertake inclusive regional integration policies, it requires greater commitment from member states in implementing them at the national level. There is some irony in that regional integration is discussed and
entrepreneurs. In the past, regional-integration policies were adopted at the national level with much fanfare but there were persistent implementation deficits, which must be eradicated if the integration agenda is to be achieved.
Regional Institutions Africa’s slow pace of integration has not been due to ab-sence of major initiatives, which have included the Lagos Plan of Action of 1980, the Abuja Treaty of 1990, and the New Partnership for Africa’s Development of 2000. Generally the major impediment has been inadequate guidance on what needed to be done at the country and regional levels. Notably, many of the regional initiatives required the ceding of some sovereignty to agencies at regional and continental levels but this proved too dif-ficult to implement, owing to coordination challenges,

xviii Executive Summary
memberships can be costly for member states at the technical and financial levels, there might be benefits to the pursuit of multiple memberships, as there is potential to gain from the programs offered within each REC. What is most crucial, however, is the presence of func-tioning formal structures that ensure that the regional relationships have real meaning and are not pursued on an ad hoc basis.
Regional InfrastructureAfrica’s infrastructure is improving but from a low base. Still, the continent has yet to find an effective model for infrastructure development based on multimodal private public partnerships, prevalent elsewhere. The continent’s underdeveloped infrastructure is largely to blame for its low level of competitiveness and productivity, low share of exports in world exports, and low levels of intra-re-gional trade. To address these constraints, there is need for a regional approach to infrastructure development, particularly in the sectors of energy, water, transport, and information and communication technology. Af-rican countries must be better linked through roads, railways, ICT, power infrastructure networks, and ports and harbors.
But not all infrastructure development is inclusive. It facilitates inclusive growth only when it supports produc-tive employment, poverty alleviation and the reduction of inequality. A good number of African countries, close to 25 %, are landlocked, with relatively high costs for doing business. Well-conceived regional infrastructure can, therefore, help integrate marginalized populations and broaden the scope for their economic participation. In this regard, regional infrastructure could be deliberately designed to target rural areas or countries with large infrastructure deficits.
An inclusive perspective to regional infrastructure provision must also meet affordability and financial sustainability objectives through pricing and subsidi-zation policies so that poor households are not unduly penalized. Additionally, during infrastructure construc-tion, African countries should actively pursue “local
planned at the regional level but implementation takes place at the national level—for example, getting parlia-ments to cede some sovereignty over trade issues. There is, therefore, the need for consistency and harmonization between national and regional policies. Hastening the pace of regional integration requires a credible, rules-based governance system and institutional architecture that can sanction non-enforcement at the national level. But the system need not be merely coercive, and could also assist member states to build capacities in planning and financing programs, and in mainstreaming issues of inclusive growth in institution building.
Although, Africa’s overlapping membership in regional economic communities is often seen as a critical con-straint to advancing the integration agenda, this need not be the case in practice. While overlapping and multiple

African Development Report 2014 Regional integration for inclusive growth xix
are likely to be greater in Africa than elsewhere, given that financial markets on the continent are still small and shallow. However, this Report reveals that there are many obstacles preventing countries from reaping such benefits. They include the fact that key financial inclusion principles, such as commitment and compliance to a sin-gle and acceptable set of rules, equal access to financial instruments and/or services as well as equal treatment in the use of financial services or instruments were seriously undermined in the process of regional financial integra-tion. Moreover, there seems to be a tendency to mimic existing behavior and intermediation techniques, which in the past led to the concentration of bank lending to a few clients, while excluding the underserved at both micro (e.g. small firms, households and underserved sectors) and macro (fragile or post-conflict and poor African countries) levels. The Report identifies as important chal-lenges weak entry conditions (e.g. inadequate institutions, poor governance in both public and private sectors and underdeveloped financial markets) and the general lack of national financial inclusion policies that are consistent with an inclusive financial integration agenda.
The Report also argues that it is important for African countries to upgrade their regulatory and supervision frameworks for cross-border banking, harmonize them at the regional level and adopt international standards for financial sector stability and confidence building. This would entail a reduction in transaction costs and raise efficiency benefits for all market players. Most im-portantly, the strengthening of regulations should not undermine financial institutions’ capacity to innovate and serve the low end markets and underserved sec-tors. Besides, the Report argues that making available long-term funding at regional level is a precondition for inclusive regional financial integration. This could be achieved through a variety of ways, including efforts to enhance the dynamism and liquidity of stock exchanges, encouraging regional rather than national platforms; helping regional economic communities set up harmo-nized regional payment and information systems as well as credit registries, developing regional bond markets, and building capacity in local currency funding and infrastructure bond issuance.
content” initiatives, combined with legislation that sets a level of local participation including enhancing local employment.
Regional MigrationOn average, Africa experiences more migration of pop-ulations per year than many other parts of the world. In sub-Saharan Africa people usually migrate within their immediate sub-region. But while conflict and related issues were key push factors in the past, climate change issues and the youth “bulge” have become important factors as well. A considerable share of this migration is unrecorded or informal, and some of it has taken place in traditionally economically disadvantaged parts of the countries, causing further distress.
A “coalition of the willing” approach should be encour-aged in advancing the management of regional migration, instead of merely relying on immigration control. RECs would do well to recognize regional qualifications, en-courage regional pooling of skills and coordinate annual immigration quotas according to skills gaps in national labor markets. These measures would allow Africans to seek employment all over the continent, thereby allevi-ating labor and skills shortages among countries. Addi-tionally, regional policies should include equitable access to quality public health care and education for migrants as a key provision. The flow of remittances to and from within Africa has greatly increased in recent years, but there are concerns about the costs of their repatriation. Reducing these costs would improve the prospects for recipient economies and the people left behind—often women, children and older members of the households.
Financial IntegrationRegional financial integration has potential to foster fi-nancial sector development and inclusive growth. The development of cross-border banking, capital markets as well as regional financial infrastructure could expand the economies of scale, and lead to a larger pool of resourc-es and better risk-sharing mechanisms. The potential for reaping the benefits of regional financial integration

xx Executive Summary
inputs into regional retail supply chains and commercial food activities have arisen. Regional firms have the ad-vantage of proximity to regional consumers and produc-ers, which helps in meeting time specifications, especially when transport and logistics are weak. Cross-border investment is an important factor in developing supply capacity, and stimulating cross-border trade by providing access to markets for goods and inputs. The growth of trade generates in turn domestic employment.
Also important, regional value chains can be a key avenue for inclusive growth in Africa. Economic innovations in one country could have positive regional spillovers by raising the demand for regional goods and services, creating self-reinforcing trading regimes with overseas blocs that are important sources of capital and creating markets for emerging regional firms.
Regional Value ChainsThe nature of global production has changed and firms and countries are no longer seeking their comparative advantages in whole product lines but in niches that supply only portions of the global demand for goods and services. Africa is, however, not yet at the stage to fully benefit from global value chains, indeed given its dependence on raw material production, issues of value addition still loom large. The challenges include the small size of national and regional markets, limited pool of capital and management skills, and inadequate infra-structure for telecommunication, transportation, storage, and energy supply. However, linking to Africa’s regional value chains is becoming a more realistic proposition.
In light of Africa’s recent high growth, a number of opportunities for local firms to increase their supply of

Chapter 1
Introduction: Regional Integration as an Imperative for Inclusive Growth

2 Chapter 1 Introduction: regional Integration as an Imperative for Inclusive Growth
African economies face an unprecedented opportunity to leverage regional integration for inclusive growth. New opportunities for regional cooperation and integration arise from greater access to capital markets and interna-tional finance, strong demand for Africa’s commodities, increased access to foreign direct investment (FDI) in manufacturing, a growing middle class, and improved governance. Regional integration, though an important goal in itself, must also promote economic growth, create growth opportunities, and make growth more inclusive.
Regional integration is particularly relevant in Africa. A ma-jority of Africans live in countries where domestic markets are too small and fragmented to achieve the economies of scale necessary to compete internationally. Infrastructure remains a major obstacle to growth in the continent. Many countries are fragile and conflict-affected, with potential to disrupt social, economic and political stability in their wider region. Sixteen African countries are landlocked, more than in any continent, making regional integration a greater necessity than elsewhere to advance growth, devel-opment, and political stability. Overcoming such challenges is central to ensuring that Africa can take advantage of its increasing economic attractiveness to the rest of the world. Progress made over the past decade by regional economic communities (RECs) is encouraging, and reflects increasing recognition by member states that the regional integration agenda is important to inclusive growth.
At the level of the firm, Africa’s trade relations involve increasingly sophisticated value chains, governed by large multinationals and their supply chain management strat-egies and standards.1 Regional trade agreements should
1 See: Krüger, r. and Strauss, I. ‘New Opportunities for intra-african trade? a value chain perspective.’ African Development Bank Working Paper Series (Forthcoming).
a review of the Debate
consider this when formulating policy, as the complexity of items traded and produced in Africa will increase over time. Intra-regional trade could offer a source of growth for more manufactured goods: the composition of goods traded regionally is less concentrated in petroleum and more in processed goods, indicating that much African demand for these goods exists and African suppliers are able to satisfy it.2 At the same time, Africa’s trade partners have changed and this has facilitated a diversification in the continent’s end markets. China was Africa’s single most important trading partner in 2012, and emerging markets in general now account for a substantial portion of Africa’s trade. Conversely, traditional markets such as Japan and the USA have declined.
While external markets are the main drivers of Africa’s economic rise, regional markets are also beginning to boost trade on the continent. After decades of relative stagnation, the value of formal intra-African trade has increased almost fivefold in absolute terms between 2001 and 2012; though its relative share has remained constant at around 12%3 and sits below other regions. In particu-lar, intra-African greenfield FDI projects as a percentage of greenfield inflows into Africa almost tripled between 2003-2013, from 7% in 2003 to over 21% in 2013. This trend is driven by a continuous rise in South African FDI into the continent, and supported by a dramatic increase in intra-regional FDI from Kenya and Nigeria since 2008. Firms in these three countries accounted for nearly 60% of project outflows into Africa, between 2003 and 2013.4 Very often these projects look to serve regional markets, functioning as ‘platform investments’,
2 afDB based on UNCtaDStat data (accessed in January 2014).3 afDB calculated from data obtained from UNCtaDStat (accessed February 2014).4 afDB based on Financial times FDI database available at http://www.fdiintelligence.com/
2

African Development Report 2014 Regional integration for inclusive growth 3
for over 1,000 country/product combinations. There are 3,287 country/product combinations (excluding SACU countries) in which South Africa accounts for over half of imports. The only region on the continent in which South Africa is not a major supplier is North Africa (Stevens and Kennan, 2013).
Looking at financial integration, African cross-border banking has surged in the past decade. A host of factors may explain this, such as financial liberalization and regulatory reforms in home and host countries, and in-creasing opportunities in African markets more broadly (Beck, 2014). Cross-border banking plays an important role in expanding access to financial services for a broad swathe of national and regional populations. The size and ability of banks to undertake large scale operations is key to increasing financial access to the underserved market segments. Notably, banks that expand internationally are often able to leverage the expertise of the parent com-pany, helping to lower transaction costs and to assuage skill shortages. To benefit fully from these innovations, however, requires good cooperation between financial regulators in all the countries involved (Alade, 2011).
Banks with a regional footprint are often best placed to support value chain financing, which link the various parties (buyers, suppliers and sellers) in a transaction to lower financing costs. Their broader exposure gives a
which are simplified administrative services aimed at consolidating and managing investment portfolios and financial plans. Between 2003 and 2013, over a third of intra-African FDI projects showed that regional markets were served by greenfield projects.
In the past decade, intra-African FDI has also acceler-ated at the REC level. Comparing the 2003-2005 period with 2009-2011, the relative share of intra-regional FDI (greenfield plus mergers and acquisitions) in the total val-ue of foreign investment projects more than doubled for the Southern African Development Community (SADC) (from 4% to 10%); grew sevenfold for the East African Community (EAC) (2% to 14%); and increased eight times for the Common Market for Eastern and Southern Africa (COMESA) (1% to 8%); albeit from extremely low bases (UNCTAD, 2012). At the same time, Financial Times greenfield data (op. cit.) indicates that firms from regional economic powerhouses do not necessarily focus on investing in their immediate neighborhood. Nigeri-an and South African firms now tend to invest further afield in Africa. For such competitive firms, expanding beyond their immediate region is both inevitable and necessary to enhance their scale and competitiveness. This highlights the importance of the ongoing Tripartite Free Trade Area (FTA) negotiations in unlocking the benefits of regional markets for African firms.
South African firms play a pivotal role in Africa’s expand-ing regional trade and investment. In many respects their role is highly unbalanced: South Africa accounted for about a quarter of all intra-African exports in 2010, but only 10% of imports (AfDB, 2012). As Africa’s largest and most sophisticated end-market, access to it for producers is vital, yet heavily guarded. South Africa’s influence is both regional and continental. SADC is South Africa’s second largest trading partner after the EU, accounting for 22.3% of its manufactured exports (National Treasury South Africa, 2013).5 South Africa’s trade also extends throughout sub-Saharan Africa. South Africa accounts for more than 90% of imports in sub-Saharan countries
5 the 22.3% of manufactured exports to South africa from SaDC likely ignore that there are re-exports of manufactured goods from South africa to the region, which may account for a fair portion of these exports.

4 Chapter 1 Introduction: regional Integration as an Imperative for Inclusive Growth
financial inclusion through their mobile services when mobile banking competes with other uses.
In the regional context, inclusive growth requires em-phasizing policy areas where RECs play a unique and necessary role in advancing growth and inclusion. Such policy areas generally imply important regional spillo-vers that require regional coordination, such as peace and security, migration, economic incentives, or setting standards such as labor standards to prevent a ‘race to the bottom’. Increasing the capacity of REC members to advance implementation may include policies that improve governance and transparency in member states. Direct growth-enhancing policies, such as expanding the size of the market through reducing trade barriers, may involve considerations of variable speed and geometry in the integration process to account for weaker states.
Despite these opportunities, regional integration cannot be leveraged for inclusive growth unless it is imple-mented effectively, in such a way that allows economic and social benefits to accrue. At present, the African regional integration agenda is ambitious, but not fully implemented. An abundance of protocols, treaties and agreements signal political will and commitment by African countries to regional integration. However, com-pliance varies between member countries, and different RECs are at different stages of the integration process. Progress is complicated by policies that are difficult to implement properly or which may not lead to effective utilization by the private sector. A lack of regional mi-gration management reduces Africa’s competitiveness, and has a broad negative impact on labor markets and socio-economic costs.
REC member countries face multiple challenges to im-plementing their formal regional integration obliga-tions. Regional integration agreements can be costly. Establishing a free trade area will lead to a loss of trade revenue through tariff reductions in the short-term, which could significantly reduce government revenue for many African countries with low tax bases. Overlap-ping memberships and overlapping mandates can also impose multiple financial obligations, diverse policies,
comparative advantage in handling the risks associated with agri-business and manufacturing value chains, nota-bly in lending to small-scale farmers and manufacturers. The integration of Africa’s capital markets has boosted value chain financing via private equity funds. These invest in a range of sectors: agribusiness, transportation, mining, and manufacturing companies.
Financial innovation and competition are important factors for growth. Financial innovations enable deliv-ery of new financial products through ATMs, internet or mobile banking. They may also introduce entirely new approaches to service delivery. Following the suc-cess of M-Pesa in Kenya, mobile banking has become the mainstay of the region’s banking services for the low-income earners and rural dwellers. The platform has demonstrated that developing mobile financial services can help enlarge financial systems and increase their potential for inclusive growth. However, mobile banking usually depends on the size and profitability of telecom operators, who might not always wish to fully promote

African Development Report 2014 Regional integration for inclusive growth 5
References
AfDB (2012), Intra-African Trade and Investment, Statistics Department, AfDB.
Alade, S. (2011), Cross-border expansion of Nigerian banks: has it improved the continent’s regulatory and supervisory frameworks?, Paper no 76, Bank for International Settlements (BIS).
Beck, T. (2014), Cross-border banking and financial deepening: The African experience, Case Business School, London.
National Treasury South Africa (2013), Medium Term Budget Policy Statement. Available from: http://www.treasury.gov.za/documents/mtbps/2013/mtbps/MTBPS%202013%20Full%20Document.pdf
Stevens, C. and J. Kennan (2013), Inputs for Chapter 7 of the African Development Report 2013, London: Overseas Develop-ment Institute (ODI).
Trade Law Centre for Southern Africa (Tralac) and Swedish International Development Cooperation Agency (Sida) (2012), The Tripartite Free Trade Area: Towards a New African Integration Paradigm?, Stellenbosch, Tralac and SIDA.
UNCTAD (2012), Regional integration and foreign direct in-vestment in developing and transition economies, Note prepared by the UNCTAD secretariat in Geneva, December 3, 2012 for First Session of the Trade and Development Board, January 28-30, 2013.
duplication and waste of resources on national govern-ments. They can also create complications and raise the cost of doing business for (Tralac and Sida, 2012). Yet multiple concurrent and overlapping REC memberships can also provide benefits to traders and countries, and help the push towards a continental FTA.
In particular, institutional weaknesses impede imple-mentation of regional integration measures. Low levels of technical capacity to monitor and implement formal initiatives, and the absence of adequate rules-based in-stitutions, mean REC agreements may not be properly advanced in practice. Instead, political economy consid-erations and interests may shape regional agreements, and result in some formal agreements not being fully implemented at national level. A political economy per-spective offers insights into how exemptions occur, how sensitive products lists develop, and why rules of origin may hamper FTAs.
Responding to these challenges, the African Develop-ment Report 2014 proposes a package of rules-based mechanisms for use by RECs, aimed at improving im-plementation of regional integration measures through monitoring and evaluation, dispute settlement, capacity building, and implementation programs, as outlined in Chapter 2 (Supporting Regional Institutions). Chapters 3 to 6 cover the principal ‘modern’ integration issues facing RECs as they seek to create functionally integrat-ed regional markets, capable of supporting competitive regional and global value chains. Such issues include: developing infrastructure (Chapter 3); managing regional migration and the movement of people (Chapter 4); har-nessing regional financial integration (Chapter 5); and leveraging trade, investment and value chains (Chapter 6). Within each chapter, opportunities are highlighted to expand regional integration to support growth and development, as well as the blockages and bottlenecks that inhibit progress. Chapters conclude by detailing how regional efforts can address these constraints, proposing key policy options to advance regional integration and enhance the inclusiveness of growth.

6 Chapter 1 Introduction: regional Integration as an Imperative for Inclusive Growth

Chapter 2
Strengthening Regional Institutions

8 Chapter 2 Strengthening regional Institutions
This chapter posits that strong and transparent regional institutions are required in Africa if regional integration is to foster inclusive growth. It discusses why the inte-gration process has been much slower than the ambitious intentions of the continent’s policymakers, while also not-ing areas where significant progress has been made. The inclusion of the private sector and underserved groups – such as small and medium-sized enterprises, women in business and young entrepreneurs—has been underlined by many RECs. However, for regional integration to be inclusive also requires the streamlining of institutional arrangements to allow for effective implementation. In this regard, the issue of overlapping membership is often considered a critical barrier to regional integration and inclusive regional development. However, it could con-stitute an opportunity in some cases, allowing member states to benefit from a range of approaches—which
2.1 Introduction
are in any case bound to converge in the medium term. The chapter also discusses the importance of effective enforcement mechanisms for regional integration trea-ties, protocols and agreements. An overarching insti-tutional architecture is needed to promote rules-based governance and to ensure that non-enforcement at the national level has implications. The level of compliance and implementation by member states of the decisions taken at the regional level will ultimately determine the success of Africa’s integration project.

African Development Report 2014 Regional integration for inclusive growth 9
2.2.1 The African integration agendaAfrica’s colonial legacy made regional integration a neces-sity: a fragmented continent, geographically large nation states, relatively small populations, and long distances between population centers. The continent’s land area is larger than the combined areas of China, the United States, India, Europe, and Japan, but its population is only about a quarter of their total (Economist, 2010).
Facing limited economies of scale and economic devel-opment at independence, strong emphasis was placed on pan-African economic and political unification. Unifica-tion was to be achieved by creating Regional Economic Communities (RECs), which would serve as building blocks for continental integration. Thus the Organization of African Unity (OAU) opted for a gradualist approach to continental union, eventually leading to the creation of these eight RECs now recognized by the African Union:
2.2 Integration through trade policy
• The Arab Maghreb Union (AMU) • The Common Market for Eastern and Southern Afri-
ca (COMESA)• The Community of Sahara-Sahel States (CEN-SAD)• The East African Community (EAC)• The Economic Community of Central African States
(ECCAS) • The Intergovernmental Authority on Development
(IGAD)• The Economic Community of West African States
(ECOWAS)• The Southern African Development Community
(SADC)
The direction and coordination of the eight RECs, includ-ing the necessary instruments to accomplish it, were to be provided by the ‘center’ the OAU and later the AU. These provisions were outlined in the Lagos Plan of Action
the implementation of the abuja treaty is a process planned in six stages over 34 years, to be completed by 2028 through the following
stages:
StaGe 1: Strengthening existing reCs and creating new ones where needed (five years).
StaGe 2: Stabilization of tariff and other barriers to regional trade and strengthening of sectoral integration, particularly in trade, agriculture,
finance, transport and communication, industry and energy, as well as coordination and harmonization of reCs’ activities (eight
years).
StaGe 3: establishment of a free trade area and a customs union at the level of each reC (ten years).
StaGe 4: Coordination and harmonization of tariff and non-tariff systems among reCs, with a view to establishing a Continental Customs
Union (two years).
StaGe 5: establishment of an african Common Market and the adoption of common policies (four years).
StaGe 6: Integration of all sectors, establishment of an african Central Bank and a single african currency, setting up of an african economic
and Monetary Union and creating and electing the first pan-african parliament (five years).
Box 2.1 timetable for implementation of the abuja treaty
Source: OaU (1991).

10 Chapter 2 Strengthening regional Institutions10
programs to ensure an efficient integration of the RECs into an African Common Market; the promotion of closer cooperation between the RECs; and an institu-tional structure for the coordination of these relations (see Box 2.1).
Yet despite the eight RECs, the Abuja Treaty, and the Pro-tocol on Relations between the AEC and RECs, achieving deeper continental integration has been remarkably slow. The slow progress can be attributed to a lack of direction from the center, as the treaties and protocols outline what should be done but not how to do it. It can also be attributed to an unwillingness of African states to cede sovereignty to the regional and continental levels; low levels of coordination between the AU and the RECs,
for the Economic Development of Africa 1980–2000, which was adopted by African heads of state in April 1980. The commitments were translated into concrete form in the Abuja Treaty, in June 1991 when the OAU Heads of State and Government established the African Economic Community (AEC) (OAU, 1991). Under Article 88 of the Abuja Treaty, the AU is expected to assist in the coordination and harmonization of inte-gration activities by the RECs, as the building blocks of continental integration, with a view to eventually establishing the AEC.
The Protocol on Relations between the AEC and the RECs, which entered into force in 1998, provided for the coordination and harmonization of policies and
By February 2014, negotiating structures for the tripartite Free trade agreement between COMeSa, eaC and SaDC became fully operational. the tripartite trade Negotiating Forum (ttNF) has made progress in implementing the tripartite Fta, meeting regularly and holding nine formal negotiation sessions since its launch in 2011. the ttNF created four technical Working Groups (tWGs) aimed at discussing rules of Origin, which inform on the national source of a product and thereby determine specific duties and restrictions; technical Barriers to trade/Sanitary and phytosanitary measures/Nontariff barriers, which are all nontariff barriers whose goal is to regulate and protect national markets; Customs Cooperation, Documentation, procedures and transit Instruments which are trade facilitation measures through the pooling of resources and cooperation at the border; and trade remedies and Dispute Settlement knowing that policy instruments used to restrict international trade are frequent object of dispute settlements. a separate technical Committee was established to negotiate the Movement of Business persons to facilitate the mobility of workers and business visitors.
a roadmap for establishing the Fta provides a timeframe of 24-36 months from the launch of negotiations on 12 June 2011 until their completion and agreement on trade in goods and movement of business persons. to this end, significant progress has been achieved:
- Following an initial review the sixth tWG meeting on rules of Origin validated and adopted rules for all reCs, providing a good basis for dealing with the difficult technical aspects of determining origin. rules of Origin are central to ensuring any Fta can be effectively utilized.
- Work on non-tariff barriers is almost complete.
- Work on standardization, metrology, conformity assessment and accreditation, all of which being technical regulations related to products’ measurement, performance and conformity, used as barriers to trade (tBt), and sanitary and phytosanitary measures (SpS) is complete.
- Work on the tripartite agreement’s annexes related to Customs Cooperation; Simplification and harmonization of trade Documentation and procedures; and transit trade and transit Facilitation which has been completed and adopted by the ttNF.
- Discussions continue on the possibility of introducing flexibility on trade remedies.
- Considerable differences remain among Fta member states on how to address dispute settlement.
- tariff offers are being prepared and exchanged among 20 of the 26 Fta member states.
Discussions in the technical committee on the movement of business persons has so far focused on design matters, legal implications and practical operational aspects of negotiating a viable and relevant agreement’s annex that would effectively facilitate the movement of business persons in the tripartite region. reasonable progress has been achieved, with some misconceptions clarified and areas of divergence narrowed.
In recent months, negotiations have accelerated, resulting in notable progress in negotiating the tripartite Fta. Negotiations are not fully on track compared to the original roadmap, but the ttNF has made up for lost time and negotiations could now feasibly be completed on time. however, issues related to rules of origin, including how they should measure and how stringent they should be, could remain a sticking point
Box 2.2 tripartite Fta negotiations
Source: authors.

African Development Report 2014 Regional integration for inclusive growth 11
remaining 15% phase-down on sensitive products was completed by January 2012. Mozambique is scheduled to complete its tariff phase-down by 2015. But Angola, the Democratic Republic of the Congo and the Seychelles do not offer any tariff reductions under the SADC pref-erential trade agreements.
In February 2012, Zimbabwe imposed a 25% surtax on goods imported from other SADC member states, an action which may contravene its SADC obligations. The SADC Trade Protocol only provides for derogations from scheduled obligations subject to specific conditions, which do not appear to have been met in this case.
The EAC has made the most linear progress toward economic union and the highest ambition of the eight RECs. It has developed a fully functioning FTA, first by implementing a customs union more comprehensively since July 2009, when both Rwanda and Burundi joined. It established a common market in July 2010, but a le-nient attitude toward exemptions, bans, and non-tariff equivalent measures has complicated its development (World Bank, IFC and EAC, 2014). Their most recent achievement towards economic union is their adoption of a protocol in 2013 outlining their plan to launch a monetary union within ten years.
Driven by its trade liberalization scheme, ECOWAS’s FTA includes the free movement of transport, goods and persons as well as the removal of all tariff and non-tariff barriers to trade. According to a gap analysis conduct-ed in 2010 (ECOWAS Commission and USAID West Africa Trade Hub, n.d.), member states face challenges in implementing protocols on both the free movement of goods and transport. When moving across borders, traders still encounter significant tariff and non-tariff barriers such as quantity, quota and seasonal restrictions that increase their costs or obstruct their business.
Of the remaining RECs, CEN-SAD, AMU and ECCAS have plans to implement FTAs but have not begun to do so, and IGAD has no plans to implement an FTA. In addition, very few RECs have fully implemented a customs union. Member states of RECs may also seek
the RECs themselves, and member states within RECs; and a lack of resources.
Efforts to advance harmonization and coordination between RECs have been boosted by negotiations on a Tripartite Free Trade Agreement (FTA), involving COMESA, EAC and SADC (see Box 2.2).
2.2.2 Regional trade policy liberalization Although RECs have made significant progress in ad-vancing regional integration, each REC has followed its own course, coordination has been minimal, and progress has been uneven. FTAs, which require agreed rules of origin to ensure zero tariffs are imposed on goods originating in the FTA, are generally effective but they re-main underutilized. Private sector actors may encounter administrative and technical difficulties in showing they meet the rules of origin. Member states may not have adopted relevant protocols in domestic law domesticated or may use non-tariff equivalents to stop regional trade in specific items. This chapter explores how institutional mechanisms can be used to overcome such problems, recognizing that technical solutions must be feasible in the political economy (see Box 2.3).
In 2000, COMESA launched its FTA. Now 14 of its 19 member states trade at zero tariffs, four have substan-tially reduced tariffs, and only Swaziland has obtained a derogation as it needs to comply with the common external tariff regime of SACU, of which it is a member (UNECA, 2013). COMESA’s FTA operates on the prin-ciple that substantive transformation takes place on the basis of a value addition rule unless otherwise specified, so that agricultural and mineral products that are wholly produced do not require substantial transformation to be considered as originating from the region. Thus, value-addition is the default rule which applies unless a specific rule is renegotiated. This helped to ensure the launch of the COMESA FTA was not delayed by negotiations on rules of origin. In 2001, SADC began moving toward an FTA with the introduction of a tariff phase-down program. The program was 85% complete in August 2008 when SADC’s FTA was launched, and the

12 Chapter 2 Strengthening regional Institutions
published common tariff nomenclature and a common external tariff.
The EAC Customs Union collects tariff revenues at des-tination but struggles to maximize efficiency gains. Cus-toms union partly derive benefit from free movement of goods within the single customs territory once goods enter it. But the EAC has opted to collect trade taxes at the destination rather than the point of entry, and without a revenue-sharing formula. Checking goods on entering and exiting countries imposes an additional cost, which would normally be removed in a customs union. EAC member states may therefore relinquish sovereignty over fiscal measures without benefiting from reduced costs of trade.
In October 2013, ECOWAS reached an agreement on a common external tariff after ten years of negotiations; it is due to come into effect in January 2015. The subset of ECOWAS countries that comprise WAEMU already operate a common external tariff with four bands of 0% for essential social goods, 5% for goods of primary neces-sity and raw materials, 10% for inputs and intermediary goods, and 20% for consumption goods. ECOWAS has
to reduce the pace of trade policy liberalization or delay a customs union while continuing to comply with the directives of the heads of state and government.
RECs with limited capacity and readiness could be tempt-ed to abandon programs to attain a customs union, focusing instead on promoting trade facilitation and removing non-tariff barriers. However, programs that move member states toward customs unions do not divert attention and resources from the removal of non-tariff barriers and trade facilitation measures. Indeed, the process of moving towards a customs union can itself be useful as it both promotes the improvement of customs administration and harmonization of common external tariffs and tariff nomenclature, so that a common external tariff and a common tariff nomenclature can be achieved.
Dealing with the complexities of tariff revenue collection and a common external tariff imply multiple obligations which may not suit all countries. Thus SADC and COME-SA have agreed to continue work toward implementing customs unions but not to the schedules previously agreed upon. EAC’s customs union has been in full operation since January 2010 and member states have
political economy is both a complicating factor to advancing regional integration in africa, as well as an analytical tool which can help advance implementation. a political economy approach can help identify institutional, structural, and external impediments (see table 2.1) to the implementation of regional negotiations and agreements, recognize which national interests are threatened by regional processes and why, identify important sources of power and influence, and inform a broader dialogue and policy actions to resolve these issues.
regional powers or ‘hegemons’ often drive regional integration. In the regional integration context, a hegemon is a strong state, both economically and institutionally, that is central to other countries adhering to a regional economic arrangement. a regional hegemon may ‘underwrite the costs of maintaining the regime’ (Draper, 2010), and enforce adherence to certain conceptions of integration through non-violent means. In africa, it is unlikely that any perceived hegemon will be able to underwrite the costs of regional integration. Its larger economies, South africa, Nigeria, egypt, angola, Sudan, and Kenya, have high incidences of poverty within their borders and cannot finance the development of less well-off neighbors in their regional economic groupings. however, these larger economies may play a hegemonic role within their groupings in the process of deepening integration.
another political economy challenge is to address strong and deeply entrenched vested interests that oppose change, reform, and liberalization. although the benefits of a liberalized trade regime will benefit the national and regional economy overall, there will be winners and losers in the process. the losers may attract the most attention.
In the process of regional integration and economic growth, ten times more jobs may be created in the economy than are lost, but the loss of the smaller number of jobs due to liberalization will often be politically unacceptable. Countries often want access to neighboring markets but remain reluctant to open their markets in return. a government with a strong majority and a period of strong economic growth may be needed to allow trade and economic reforms to be introduced and established in law.
Box 2.3 political economy considerations weigh heavily in regional integration
Source: authors drawing on eCDpM (2013).

African Development Report 2014 Regional integration for inclusive growth 13
all RECs and their member states. With the reduction of tariffs that has already taken place, trade facilitation and removal of non-tariff barriers will have a greater effect on the promotion of inclusive growth than further reductions in tariffs (see Chapter 6). For the RECs to suc-cessfully pursue inclusive regional integration policies, member states should be committed and eager to imple-ment inclusive growth type of policies at national level.
in effect adopted this regime with a fifth band of 35% for goods that contribute to economic development. This provision was added at the insistence of Nigeria, with support from agricultural producers in the region, and reduced from 50% through negotiations. ECOWAS members will be allowed a five-year transition period from the effective date.
Further programs promote inclusive growth through re-gional integration. These include programs to reduce the costs of cross-border trade, trade facilitation programs and programs aimed at the removal of non-tariff barriers. These are considered to be of primary importance by
Structural factors
Structural factors are hard to transform in the medium and even long term. these factors influence regional processes of integration, whether at the level of broad regional negotiation or at the level of functional cooperation between stakeholders from neighboring countries.
Sub-factors
- history of state formation
- Geography
- economic endowments
- Size and income level of economy
- Concentration of economic activity
- Sources of income
Institutions
Institutions shape and govern individual behavior. Formal institutions need to be understood in relation to informal ones. the influence of the latter and the channels of power are likely to be even higher in developing countries, hence potentially (and more strongly) supporting or undermining formal institutions and rules.
Actors and sub-factors
- Formal institutions: laws, regulations, treaties, and written agreements
- Informal institutions: culture, traditions, and norms
External factors
Global and regional drivers shape domestic institutions, incentives, and development options and outcomes.
Actors and sub-factors
- Global powers and alliances
- Sources of rent
- reputational pressures on elites
- aid
- Foreign investments
- Global and regional security threats and responses
- International legal measures and sanctions
Table 2.1 three spheres of political economy
Source: authors drawing on eCDpM (2013).

14 Chapter 2 Strengthening regional Institutions
REC structures and decision-making processes and those of the African Union share much in common. The highest authority usually lies with the Summit, which comprises all the heads of state and government from member states and the organization (see Figure 2.1). Below the Summit is a council of ministers of member states. The ministers that constitute the council depend on the organization itself but are usually those responsible for trade or for-eign or regional affairs. Below the council of ministers is a committee of senior government officials, with rep-resentatives usually at the level of permanent secretary or equivalent. Each member state is represented by one senior government official.
The policy organs1 usually meet once or twice a year, with the committee of senior government officials meet-ing first. The committee makes recommendations on decisions to the council of ministers, and the council then requests endorsement by the heads of state and government. Decisions are made on the basis of con-sensus at all levels.
RECs and the AU also have similar structures at the sectoral level, with technical committees like those dealing with trade and customs issues, infrastructure, industrialization, gender, peace and security. These meet on a regular basis perhaps two to three times a year and agree on technical matters. For example, the committee dealing with trade and customs may revise specific rules of origin that relate to an REC’s FTA. Once a decision is reached at a technical level, the decision either goes to a committee of ministers in that sector
1 the term policy Organs refers to all the meetings, starting with the administration and finance budget sub-committee, moving upwards to the inter-government committee of senior officials, then the Council and the Summit
2.3.1 Decision-making structuresIn general, RECs already have most of the structures needed to advance regional implementation of the FTA. Such structures ensure that decision-making takes place in a streamlined manner, with the participation of mem-ber states and the guidance of the REC secretariat, (which serves as an administrative rather than an executive body. Ensuring these institutions generate more effec-tive outcomes at the regional level requires additional and better-functioning mechanisms, instruments and processes.
2.3 Institutionalizing regional integration
Figure 2.1 reC and aU decision-making structures
Source: authors.
Sectoral Committee of Ministers
Council of Ministers
SUMMIT OF HEADS OF STATE AND GOVERNMENT
Inter-governmental Committee of Senior
Officials
Sectoral Technical Committees

African Development Report 2014 Regional integration for inclusive growth 15
Business councils have been established at the regional level, as well as bodies that take account of special inter-est groups such as small and medium-sized enterprises (SMEs), women in business, and young entrepreneurs. Yet without a common interest and common objective (as is the case of the East African Business Council), these groups are seldom influential in shaping and im-proving policy. It remains that more efforts are needed at institutions level, to promote women in businesses and young entrepreneurs’ voices.
Private sector actors and special interest groups have also made attempts to engage in trade negotiations, by requesting seats at the negotiating table. Private sec-tor lobby groups are more influential in shaping policy outcomes in the areas of trade facilitation and removal of non-tariff barriers. The Federation of Eastern and Southern Africa Road Transport Associations (FESAR-TA), for example, plays a role in identifying barriers in the COMESA-EAC-SADC Tripartite non-tariff barrier monitoring, reporting and removal system.
2.3.2 The issue of overlapping membershipsWith very few exceptions, African countries belong to more than one regional integration organization, in a continent where 17 regional integration agreements are in place (see Figure 2.2). Only Algeria, Cape Verde and Mozambique are party to just one agreement. By contrast, 14 countries have signed up to two RECs/RIOs, 19 to three RECs/RIOs, and 16 to four RECs/RIOs. Côte d’Ivoire is a member of five regional organizations (UNCTAD, 2012).
Overlapping membership is applicable to FTAs but not to customs unions. A customs territory that is a country or a group of countries in a customs union can belong to more than one FTA as each member State retains its own external tariff, but a customs territory cannot belong to more than one customs union since all members should align to a common external tariff. The EAC Customs Union, for example, can be members of many FTAs as a customs union; but neither it nor its members can be-long to another customs union. Therefore, if COMESA
such as a decision on peace and security that may be made by ministers of justice and from there is submitted to the council of ministers for approval and processing up to the heads of state and government level, or it goes to the committee of senior government officials for processing upwards.
In all integration structures in Africa, both at the regional and continental levels, the member states of the institu-tion determine policy and the pace and direction of the integration agenda. Although the secretariats of the AU and the RECs can influence the decisions of the policy organs, they have no role to play in making the final and binding decisions. The functions of the secretariats are confined to providing policy, technical and strategic advice to the member states and working with them to implement the decisions of the Summit. Each govern-ment has a seat at the table and no government cedes sovereignty to another body in contrast to the member states of the European Union, which cede their national sovereignty on all trade matters to the Commission of the European Union, so that all EU member states are represented at the World Trade Organization by the EU Commission.
The COMESA-EAC-SADC Tripartite has such a struc-ture. Initial decisions go through each individual REC (COMESA, EAC and SADC) for endorsement and ratification. The Tripartite Summit held in 2011 estab-lished the three pillars of the Tripartite market access, infrastructure, and industrialization and launched FTA negotiations under the market access pillar, with a time-line for completion of the first phase within three years.
Once a decision is endorsed at the Summit level, it be-comes binding on each member state. Respective treaties and protocols require action to ensure implementation of these decisions at the national level. Each member state is obliged, where necessary, to publish a decision of summit and, where appropriate, translate this decision into national law.
Within the institutional framework, arrangements en-sure inclusion of the private sector and non-state actors.
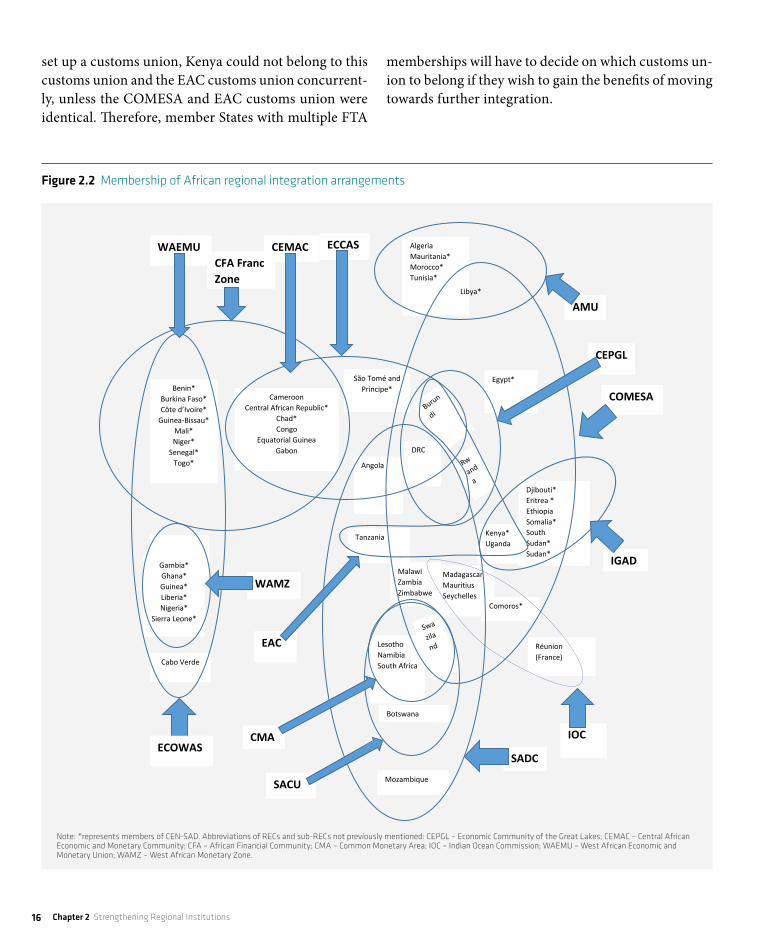
16 Chapter 2 Strengthening regional Institutions
memberships will have to decide on which customs un-ion to belong if they wish to gain the benefits of moving towards further integration.
set up a customs union, Kenya could not belong to this customs union and the EAC customs union concurrent-ly, unless the COMESA and EAC customs union were identical. Therefore, member States with multiple FTA
Figure 2.2 Membership of african regional integration arrangements
Note: *represents members of CeN-SaD. abbreviations of reCs and sub-reCs not previously mentioned: CepGL – economic Community of the Great Lakes; CeMaC – Central african economic and Monetary Community; CFa – african Financial Community; CMa – Common Monetary area; IOC – Indian Ocean Commission; WaeMU – West african economic and Monetary Union; WaMZ – West african Monetary Zone.
Algeria Mauritania* Morocco* Tunisia*
CFA Franc Zone
ECCAS CEMAC WAEMU
Cameroon Central African Republic*
Chad* Congo
Equatorial Guinea Gabon
Benin* Burkina Faso* Côte d’Ivoire*
Guinea-Bissau* Mali* Niger*
Senegal* Togo*
Egypt*
AMU
COMESA
IGAD
IOC
SADC
SACU
CMA
EAC
WAMZ
Kenya* Uganda
Djibouti* Eritrea * Ethiopia Somalia* South Sudan* Sudan*
Madagascar Mauritius Seychelles Comoros*
Réunion (France)
Tanzania
Mozambique
Lesotho Namibia South Africa
Malawi Zambia Zimbabwe
Angola
DRC
São Tomé and Principe*
Cabo Verde
CEPGL
Gambia* Ghana* Guinea* Liberia* Nigeria*
Sierra Leone*
Libya*
ECOWAS
Botswana

African Development Report 2014 Regional integration for inclusive growth 17
Source: authors, adapted from UNCtaD (2012).
Belonging to more than one REC does require additional resources. Member countries need to participate in dif-ferent activities, workshops, meetings and conferences at the REC level, which can lead to duplication and overlap. The resources needed for adequate participation in the programs of two RECs include both technical and finan-cial resources. A country may need to allocate roughly double the amount of administrative and other resources needed for membership of a single regional organization.
Yet this resource allocation may represent good value for money, and the benefits of belonging to two region-al organizations may outweigh the costs. For example, Kenya can receive the benefits of deeper integration into economic union from its membership of the EAC, while receiving the benefits of a larger market offered by its membership of COMESA. Benefits may also accrue at the organizational level with one institution benefiting from the experiences of another REC that has completed a particular process through having access to its mem-bers. This may be the case for tariffs, such as the design and implementation of a common tariff nomenclature or a tariff phase-down process; a plan, such as a regional infrastructure master plan; or an instrument, such as the design and implementation of overload controls and axle-load limits. For example, the EAC’s rules of
While overlapping membership can be costly, belonging to more than one REC offers multiple benefits. Most RECs were established for specific purposes other than as a building block toward the AEC. The Southern Af-rican Development Coordination Conference (SADCC) was formed in 1980 by ‘front line states’ to coordinate development projects that would reduce their economic dependence on apartheid South Africa. The Preferential Trade Area (PTA) of Eastern and Southern Africa was created primarily as a building block of the AEC. As the SADCC became SADC and the PTA became COMESA, their activities2 expanded and led to greater overlap of memberships mandates. Similarly, as the Intergovern-mental Authority on Drought and Development (IG-ADD) evolved into the Intergovernmental Authority on Development (IGAD) it expanded its membership and mandate to cover issues of economic integration. The eight RECs are building blocks for AEC, but perform other duties and functions for their member states, which may still be necessary when the AEC is in place.
2 the actual mandates of both organisations are covered in their treaties and protocols and cover a large number of issues but at the beginning of their existences each regional organisation covered a very small part of their mandates as described in their treaties, meaning that there was no functional overlap of their mandates.
RECs Date of Establishment
FTA Customs Union
CommonMarket
MonetaryUnion
Political Federation
aMU 1989
CeN-SaD 1998
COMeSa 1994
eaC 2000a
eCCaS 1983
eCOWaS 1975
IGaD 1998
SaDC 1992
Table 2.2 reC implementation status and ambition of agreements varies
Source: authors.
Notes: achieved (green), in progress (orange), planned (blue), and not planned (white).aeaC was first established in 1967, disbanded in 1977 due to internal conflicts among the member countries and reformed in 2000.

18 Chapter 2 Strengthening regional Institutions
Where RECs do not have overlapping mandates, multiple membership can assist in working towards a continen-tal free trade agreement. For example, IGAD has no ambition to move to an FTA, but all its member states except Somalia are members of other regional organi-zations that already have an FTA in place, so overlap-ping membership will ensure that progress is made in achieving a continental FTA. Overlapping membership means that IGAD does not need a program leading to a regional FTA. Further, overlapping membership assists members of RECs that have been slow in the regional and continental integration process.
origin and FTA is based on COMESA’s and its regional overload control legislation is based on work done in SADC and COMESA, while the ECOWAS Community Levy is based on the UMEOA levy. At the same time, dual membership presents member states with multiple and different pathways to deepening regional integration. Concurrent integration through multiple RECs requires both variable geometry and variable speeds (see Table 2.2). A country that is a member of two different FTAs will have the same commitment to implement both, but different rules of origin and different tariff phase-down schedules. The challenge is to put in place an administra-tion system that allows the private sector to utilize both systems, and allows traders and producers to choose the trading regime that is most beneficial to them.

African Development Report 2014 Regional integration for inclusive growth 19
2.4 enforcing compliance and implementation
must be implemented at the national level, and there is a wide gap between what is formally decided at the regional level and what is actually implemented at the national level. Political ambition for the integration agenda is high but the pace of implementation lags far behind.
A rules-based governance system and institutional archi-tecture is needed to legally sanction non-enforcement or derogation of rules. To hasten the pace of integration, im-plementation needs to be grounded in a legal architecture that requires states to accept the legitimacy and necessity of judicial remedies as part of rules-based governance. Regional courts and arbitration, in some cases, have met challenges, but these could be overcome through adjustments in their design and increased recognition
Rules-based systems work to ensure that the law can be given practical expression through compliance, dispute set-tlement, and transparent and democratic processes. Several components of such a system are discussed below, including monitoring and evaluation; dispute settlement mechanisms; and capacity building. The importance of financial independ-ence and processes which can prioritize the implementation of treaty provisions of the RECs and the AU is also noted.
2.4.1 Rules-based systems A major challenge to deepening regional integration is to improve the level of compliance by member states to decisions they take at continental and regional levels. Regional integration is planned at the regional level but
peace and security is the foundation for a stable institutional environment. the development of capable institutions rests on the foundation of social and political stability. Without peace and security, the rule of law through a centralized government cannot be exerted. Without peace and security the conditions for increasing investment are extremely limited. Foreign capital will be less forthcoming and resources will be wasted on the destruction of people and property. essential service industries such as tourism may be restricted for many years to come.
regional organizations have a role to play in attaining a peaceful and secure environment at three levels: prevention of conflict; military peacekeeping interventions when conflict does break out; and post-conflict activities to reduce the likelihood of further conflict. the reCs’ initial mandate focused on creating an environment conducive to peace and security by ensuring prosperity through inclusive economic growth. Over time, however, the predominance of fragile and conflict-affected states have drawn african countries into conflict prevention and peacekeeping under the umbrella of reCs and the african Union. SaDC, eCOWaS, and the central african reCs all have active regional security mechanisms. the introduction of these mechanisms precedes the formal creation of the aU peace and Security Council (aU-pSC) in 2004. eCOWaS’s mechanisms for regional security interventions were first used to intervene in Liberia’s conflict in the late 1990s through the eCOWaS Monitoring Group (eCOMOG) mission (haysom, 2014).
CeMaC and eCCaS have made peace and security an increasingly important plank of their integration agenda. CeMaC established a regional peace-keeping force so that they could be proactive in addressing conflicts affecting their members, especially the Central african republic (Car), the management of which has subsequently been taken over by eCCaS (Meyer, 2011). Several institutions were created for such a purpose, including the Council for peace and Security in Central africa (COpaX), established in February 1999, along with three technical organs which includes a non-permanent peacekeeping force, an early warning system for conflict, and a body which brings together key security personnel from each reC member.
reliance on external funding for operations, from France and the eU in the case of the ‘Force Multinationale en Centrafrique’ (FOMUC), places limitations on how and when these bodies function. Other problems exist around the inadequate size, discipline and training of regional forces, their overlapping mandates, and a lack of cooperation among reC bodies and aU bodies in certain conflict situations.
Box 2.4 peace and security: a focus for african reCs
Source: authors.

20 Chapter 2 Strengthening regional Institutions
regional agendas. Removing the private sector and individuals from standing in the SADC tribunal was one way in which the tribunal was effectively disbanded in order to protect the interests of individual member states (see Box 2.5). Disputes about the protection of rights of the private sector4 and individuals depends on the willingness of their national governments to litigate on their behalf, and this has never happened before in Africa. As a result, other protocols which provide for dispute settlement are either less likely to be utilized or recourse is made to an international body owing to the lack of a regional mechanism. 5 678
The standing of the private sector in COMESA is one reason why its Court of Justice continues to present opportunities to challenge the non-implementation of agreements (see Box 2.6).
ECOWAS’s Court of Justice is tasked with resolving disputes related to the community’s treaty, protocols and conventions. In addition to providing advisory opinions
4 Such private party disputes can arise in the context of discriminatory treatment, unjustified national restrictions or NtBs.5 article 33(1), SaDC treaty.6 Summit decisions are taken by consensus.7 SaDC/SM/1/2013/1a.8 article 10(9), SaDC treaty.
by member states of their importance. A rules-based compliance mechanism may take other forms too, but it provides certainty to the integration agenda. It can ensure that states agree only to protocols and treaties that they can implement within an agreed timeline. It could also press REC secretariats to ensure that mechanisms are in place to assist states in meeting the implementation challenges, and could help mainstream inclusion growth considerations in institutional processes.
A key feature of an effective rules-based system in the Af-rican context, where regional courts and dispute panels are used, is that the private sector and individuals have access to these mechanisms. African governments are not known to litigate against each other, so restricting the courts to governments reduces their effectiveness and usefulness. It is unclear why many African governments perceive lit-igation as an affront to sovereignty when governments themselves often litigate on more sensitive matters, such as border disputes. Elsewhere, developing countries settle their disputes over trade issues through adjudication (Chase et al., 2013)3 which allows them to move ahead with their
3 the decision of the WtO appellate Body in Colombia – Indicative Prices and Restrictions on Ports of Entry, Wt/DS366/r, 27 april 2009, involved a trade dispute among Latin american states.
the SaDC treaty foresees sanctions against members that ‘persistently fail, without good reason, to fulfil obligations assumed under this treaty’, or when they ‘implement policies which undermine the principles and objectives of SaDC’.5 the Summit should enforce these provisions as formal disputes have so far never followed. the SaDC Secretariat cannot file complaints against member states. So the SaDC tribunal is potentially a vital mechanism for holding member states to account.
the suspension in 2010 of the SaDC tribunal provides an example of the difficulties encountered with regard to ensuring rules-based governance via regional institutions. the SaDC Summit suspended the tribunal after a ruling that noted that Zimbabwe had infringed its treaty obligations, after applications brought by Zimbabwean nationals. Zimbabwe participated in the subsequent Summit decision to suspend the tribunal, highlighting the limitations of a tribunal model when institutional independence from member states in disciplinary decisions is impossible.6 as a result, no new disputes about the application or interpretation of any SaDC legal instrument can be adjudicated.
In 2013, the SaDC Summit decided to adopt a new protocol that greatly reduced the efficacy of the tribunal. It stated that future disputes ‘should be confined to the interpretation of the SaDC treaty and protocols relating to disputes between Member States.’7 hence it will only decide on inter-governmental disputes that are brought before it. all existing SaDC legal instruments will now be reviewed to effect consequential amendments. this will involve an examination of essential institutional and legal aspects of the Organization, and offer an opportunity to clarify some of the underlying governance issues.
however, a systemic problem is that tribunal rulings ultimately depend on Summit decisions for their enforcement. these decisions are taken on the basis of consensus,8 which is interpreted to entail a veto right for each member. this constitutes a major design flaw and undermines the rule of law in practice.
Box 2.5 the Case of the SaDC tribunal
Source: authors.

African Development Report 2014 Regional integration for inclusive growth 21
Court concerning the alleged breach of any obligation under this Treaty in relation to the Common Market or as to any action or omission affecting the Common Market’. This would appear to allow the secretary-gen-eral to take a member state to the COMESA Court of Justice if, for example, it had not domesticated a deci-sion taken by the COMESA Authority of heads of state and government. But in practice, exercising this right in a non-discriminatory way would mean taking every single member of COMESA to the court of justice, as no member state is currently in full compliance with all of the provisions of the COMESA Treaty.10 Clearly, this would be impractical.
Before a rules-based system and dispute settlement mechanism is put in place, a mechanism is needed that allows RECs and the AU to revisit the decisions made by heads of state and government. This would need to put decisions requiring implementation in order of priority, and build capacity in the member states so that they can implement the decisions upon which they have agreed.
The immediate way forward may lie in the adoption of ad hoc forums with jurisdiction over technical matters and a panel system included in regional trade protocols.11
10 See: http://www.comesa.int/attachments/article/28/COMeSa_treaty.pdf11 SaDC has adopted such a panel procedure but it remains inactive.
on the meaning of community law, the court has juris-diction to examine cases involving: an alleged failure by a member state to comply with community law; a dispute relating to the interpretation and application of community acts; disputes between community insti-tutions and their officials; community liability; human rights violations; and the legality of community laws and policies. There is no requirement to first exhaust domestic remedies, meaning individuals do not need to pursue national judicial remedies before bringing a claim to the ECOWAS Court of Justice. Rather, the principal requirements are that the application not be anonymous and that the matter is not pending before another international court. 9
If some RECs already have rules-based enforcement mechanisms in place, such mechanisms may benefit from the ability to revisit and prioritize decisions made by heads of state and government. Litigation by a secre-tary-general against a member state for non-implemen-tation is unlikely in practice to occur if most member states have failed to implement a protocol or treaty. For example, Article 17.8(h) of the COMESA Treaty specifies that the ‘Secretary General shall, subject to the provisions of this Treaty, submit references to the
9 polytol paints & adhesives Manufacturers Co. Ltd v. the republic of Mauritius, COMeSa Case ref No 1 of 2012, Judgment of Court of First Instance, august 31, 2013.
COMeSa offers a good example of how a rules-based institution can be used to place pressure on reC members to implement protocols, while also protecting private parties, and creating transparency, accountability and legal certainty (erasmus, 2013).
articles 28(1) of the eaC treaty and 24(1) of the COMeSa treaty provide that:
‘a partner State which considers that another partner State or an organ or institution of the Community has failed to fulfil an obligation under this treaty or has infringed a provision of this treaty, may refer the matter to the Court for adjudication.’
Firms of any size are permitted to sue member states in COMeSa through the Court of Justice. this follows a decision by the Court to hear a case against the Government of Mauritius by a private company incorporated in Mauritius over payment of import taxes on products made in COMeSa.9 the case permitted businesses to have recourse to the law to settle business disputes, and will encourage member states to adopt obligations under COMeSa with greater conviction, given that they would need to ensure that all reC protocols have been properly domesticated into the laws and institutional architecture or potentially face litigation.
this judgement was seminal in clarifying the nature of international obligations which underpin the reCs. It addressed issues related to the implementation of protocols by member states, and noted that legal regimes at the reC level are more than agreements, merely creating obligations between the member states, but also provide rights to citizens residing in these states which are enforceable. the judgement may serve as benchmark for the other reCs.
Box 2.6 the importance of COMeSa’s Court of Justice
Source: authors based on erasmus (2013).

22 Chapter 2 Strengthening regional Institutions
technical capacity in RECs to undertake these above tasks, as well as assist member states in complying with rulings and protocols.
Financial ResourcesImplementing the Abuja Treaty in the time envisioned is ambitious, and will require significant financial and technical resources. But RECs’ access to finance is lim-ited as member states pay for core personnel to staff secretariats, usually by annual subscription. More costly projects and programs implemented by the RECs to deepen integration are, in the main, paid for from grants from International Cooperating Partners (ICPs). It is often difficult for the REC secretariats to keep to an im-plementation timetable that prioritizes the agenda set by the REC member states, when an integration program is financed by an ICP that must serve the interests of its taxpayers and demonstrate value for money. Over the last few years, reflecting economic downturn in Africa’s traditional European donors, more controls have been placed on how the grant funds provided to RECs can be used and how they cannot be used, how value for money should be calculated, and how results are to be measured. Showing value for money to the donor’s taxpayers may be necessary but it is not necessarily in the interests of the integration agenda of the RECs and the AU.
A longer-term solution is for REC member states and REC secretariats to gain full control of their program-ming and implementation processes by paying for their own program implementation without relying on donor funds or outside financing. Various proposals on how to raise funds to finance regional and continental inte-gration programs have been considered, ranging from levies on imports, insurance policies, international travel, exports, hydrocarbon exports, financial transactions, and tourism; but the only levy that is in operation is on imports, implemented by ECCAS, ECOWAS, and UMEOA. Levy systems are difficult to implement, and disputes have arisen as to what is covered and not covered by the levies. Despite this, most other RECs including EAC, SADC and COMESA as well as the AU, are con-sidering how to apply levies to raise finances to pay for integration programs.
The latter could be similar to the WTO Dispute settle-ment mechanism, which is a government-to-government mechanism, as is currently being discussed within the Tripartite (Jere, 2013). Unlike a court system, the em-phasis here is to settle disputes through consultations, rather than judgements, and before penalties need to be applied. As a rules-based system, the Dispute Settlement Mechanism is central to the WTO and the multilateral trading system and makes the trading system more secure and predictable. The system is based on a set of clear-ly-defined rules and procedures that involve rulings made first by a panel which are then endorsed or rejected by the WTO’s full membership, with appeals also possible. The REC courts of justice have a much wider remit than just addressing disputes in the regional trading regimes, as they are usually set up to interpret and enforce the treaty of the relevant REC. By the time the case reaches the regional courts a legal decision is required, so settle-ment of the dispute by consultation has failed.
2.4.2 Additional financial and technical resources Simply having an enforcement mechanism is not enough. Enforcement cannot take place unless it can be proven that a member state is in breach of a treaty provision; that a dispute has been declared; that this dispute can only be resolved by a court of justice, and that, if a rul-ing is made against a country, the necessary assistance is available for the member state to comply with the ruling. It is therefore important to build financial and

African Development Report 2014 Regional integration for inclusive growth 23
mostly to assist with booking venues and logistics for meetings of experts from the member states that pro-vide their own technical inputs. The expected level of support may also vary by sector. Some REC secretariats face difficulties in recruiting the right caliber of staff because of quota systems, and less attractive conditions of service, as well as the need for endorsement by na-tional governments and requirements for 10-15 years of experience. The last stipulation excludes more energetic ‘hungry’, young professionals becoming involved in the integration agenda early in their careers.
An REC secretariat’s effectiveness also depends on the ability of its senior staff to ensure regional hegemons do not dominate proceedings. As the formal business of RECs is conducted mainly through policy organs, the senior staff of REC secretariats need to assist the chairs of meetings to ensure the more powerful members of the RECs do not derail the democratic decision-making process.
Building the capacity of RECs is also important to sup-port member states in meeting their regional obligations. Member states could be assisted in receiving greater levels of support and assistance from the REC secretariats and the AU Secretariat for implementation. It is notable that member states of the European Union receive substantial assistance in planning and financing the implementation
In addition to RECs financing their own integration programs, member states need to meet the short-term financial costs of integration. For example, if a country implements an FTA at the beginning of its annual budget cycle, it will most likely experience an initial reduction in revenue as a result of a reduction in trade taxes. This may well be temporary as the loss of revenue could be made up through increased compliance levels and through higher returns from other taxes such as value added tax. However, governments will need to address the immediate shortfall, assuming they will not be able to enter into deficit financing of the budget. Donor-fi-nanced schemes exist to assist countries to implement trade liberalization policy, such as the European Devel-opment Fund-financed Regional Integration Support Mechanisms (see Box 2.7). Nonetheless, addressing such short-term budget shortfalls remains a challenge.
Human resources and capacity buildingOther constraints to deepening regional integration relate to the technical and professional competencies of the REC secretariats. These depend on the services provided by the secretariats, the terms and conditions of employment offered by RECs, and recruitment poli-cy. The services provided by the REC secretariats vary, with some expected to provide a reasonably high level of technical support including technical papers to guide the discussions of the member states, and others expected
adjustment mechanisms are a useful means to deal with barriers to the full implementation of tariff liberalization in african Ftas, and could consist of a fund to assist countries in dealing with some of the immediate negative effects of liberalization such as loss of tariff revenue from integration (Walkenhorst, 2006). african economies are, to a large extent, fiscally dependent on revenues from trade taxes for the majority of their annual budget (McCarthy, 2013b).
Liberalization should have the long-term effect of increasing government revenues, all else being equal, as liberalization should lead to a more-than-proportional increase in trade flows. this is less likely to occur in the short to medium term, highlighting the importance of interim measures to smooth consumption and fiscal balances. payout criteria of any adjustment fund and how the resources are mobilized requires careful consideration. In order for adjustment funds to be sustainable they require countries to pay fees to the relevant funds. revenue loss arising from liberalization also highlights the needs of countries preparing for liberalization to receive advanced technical assistance to improve revenue collection capabilities at the domestic level.
COMeSa established a fund with an adjustment facility to support general economic reforms toward integration, and an infrastructure fund to facilitate trade related regional infrastructure projects. rwanda and Burundi were the first beneficiaries of the facility and received euro 10.3 Million and euro 4.4 respectively, ‘equivalent to 65% of the anticipated loss of revenue for June 2009–July 2010 as a result of the alignment of their tariff structures to those of the east african Community Common external tariff within the Customs Union’ (UNeCa, 2012).
Box 2.7 adjustment mechanisms
Source: authors based on various sources.

24 Chapter 2 Strengthening regional Institutions
to its neighbors. To address such weaknesses, RECs are moving toward ‘active’ M&E systems that do not rely on information relayed solely through communications from the member states. This also means they do not have to wait for the information to be volunteered.
M&E systems are essential to advancing the regional integration agenda. The African integration agenda is strong on prescribing linear progress in succes-sive steps toward deeper integration, but weak on assessing how to do this and what resources might be needed. An effective M&E system should conduct gap analyses, through a baseline survey of each member country, to assess what is actually in place in terms of institutions, structures, legislation and other related instruments and mechanisms. A plan of action and a budget could then be provided to each country to facilitate their movement to the next level. The M&E process would monitor progress and allow for con-tinuous feedback so that adjustments could be made and programs evaluated upon completion. COMESA’s new online M&E system, which facilitates basic data capture and reporting on de facto implementation of all its programs, is a good starting point for RECs to develop their M&E capacities.
of programs aimed at deepening regional integration (see Box 2.8). This further illustrates how Africa’s myriad of treaties, protocols, and directives on regional integration lack the resources needed to support efforts toward achieving their goal.
2.4.3 Monitoring and evaluation systemsREC monitoring and evaluation (M&E) systems should ideally perform two functions: measuring the level of compliance to decisions, and measuring the effec-tiveness of programs in achieving their objectives. Traditionally, RECs have lacked internal M&E sys-tems. Levels of compliance are usually measured by asking member states to indicate whether a particular decision has been domesticated and to deposit a copy of the instrument such as a Statutory Instrument or an act of parliament with the secretariat. However, an instrument can be deposited with the secretariat without being enforced at the national level or in a way that ensures compliance.
In theory, a country could belong to an FTA that allows free movement of goods that originate within the FTA but then apply export restrictions on agricultural produce
europe has made great strides toward regional integration since the launch of the Schuman Declaration in May 1950 and the creation of the european Coal and Steel Community (eCSC), with the signing of the treaty of paris one year later in 1951. France’s foreign minister, robert Schuman, declared his aim was to ‘make war not only unthinkable but materially impossible,’ and this was to be achieved through regional integration with the eCSC as the first step.
the european Union did not evolve naturally out of the Schuman Declaration and the eCSC. It took immense amounts of time, planning, and rigorous implementation to create first a customs union, followed by a common market and the european Union. the process involved sacrificing national sovereignty to a higher authority, which became the Commission of the european Union.
Implementation by member states was meticulously planned and financed. every member state had a clear plan of action to successfully implement the necessary measures. In January 1985, Jacques Delors, then president of the Commission, declared that in order to achieve the main objective of the eeC treaty, the creation of a single market with all internal european borders eliminated, should be achieved by the end of 1992. In line with this timetable, the Delors Commission forwarded to the european Council a white paper on completing the internal market in June 1985. It proposed a ‘single framework’ to amend the eeC treaty and for political cooperation. these were finalized in the form of a Single european act that not only succeeded in removing the technical barriers to trade, thus creating the Single Market, but also affected many common policies, such as transport, taxation, and environmental protection.
the lesson for african integration is that the Delors white paper analyzed the contemporaneous set of market rules and regulations, and prepared a costed proposal. It defined what measures needed to be implemented, what agencies needed to be established, and what rules and regulations needed to be changed or introduced in each member state so that each country could move from its current position to full participatory membership of the internal market. the european Commission also made sure there was a budget to pay for this transformation.
Box 2.8 the eU’s programmatic approach
Source: authors.

African Development Report 2014 Regional integration for inclusive growth 25
OAU (1991) Treaty Establishing the African Economic Com-munity, OAU, available at: http://www.au.int/en/sites/default/files/TREATY_ESTABLISHING_THE_AFRICAN_ECONOM-IC_COMMUNITY.pdf, accessed on April, 2014.
The Economist (2010) ‘The True True Size of Africa,’ The Econ-omist, November 10, 2010, available at: http://www.economist.com/blogs/dailychart/2010/11/cartography, accessed on April, 2014.
UN Economic Commission for Africa (UNECA) (2013) Do-mestication and Mainstreaming of Regional Integration Process, Instruments and Decisions into National Policies, Legal and Regulatory Frameworks: Issues, Challenges and Opportunities, Kigali: UNECA.
United Nations Conference on Trade and Development (UNC-TAD) (2012). ‘Regional integration and foreign direct invest-ment in developing and transition economies’. Note prepared by the UNCTAD Secretariat, Geneva, December 3, 2012, for First Session of the Trade and Development Board, January 28–30, 2013.
Walkenhorst, Peter (2006) ‘Compensating Lost Revenue in Regional Trade Agreements,’ Trade Note 28, International Trade Department, World Bank.
World Bank, International Finance Corporation (IFC) and the East African Community (EAC) (2014) East African Common Market Scorecard 2014: Tracking EAC compliance in the move-ment of capital, services, and goods, Arusha: The World Bank, IFC and EAC.
References
Chase, Claude, Alan Yanovich, Jo-Ann Crawford, and Pamela Ugaz (2013) ‘Mapping of Dispute Settlement Mechanisms in Regional Trade Agreements – Innovative or Variations on a Theme?,’ Working Paper, ERSD-2013-07, World Trade Organ-ization.
Draper, Peter (2010) ‘Rethinking the Foundations of Sub-Saha-ran African Regional Economic Integration: A Political Econo-my Essay,’ Working Paper, No. 293, Paris: OECD Development Centre.
ECOWAS Commission and USAID West Africa Trade Hub (no date) Gap Analysis of the ECOWAS Trade Liberalization Scheme (ETLS), ECOWAS Commission and USAID West Africa Trade Hub, available at: ECOWAS Commission and USAID West Africa Trade Hub, accessed on April, 2014.
ECDPM (2013) ‘Arguing a Political Economy Approach to Regional Integration’. Background paper written for African Development Report 2013/14.
Erasmus, Gerhard (2013) ‘The COMESA Court of Justice: Re-gional Agreements Do Protect Private Parties,’ Trade Law Centre (Tralac) Trade Brief, No. S13TB09/2013, Stellenbosch: Tralac.
Haysom, Simon (2014) ‘Security and Humanitarian Crisis in Mail: the role of regional organisations. ODI. Online: http://www.odi.org.uk/sites/odi.org.uk/files/odi-assets/publica-tions-opinion-files/8829.pdf
Jere, Kahaki (2013) ‘The Tripartite Free Trade Area Dispute Settlement Mechanism - A Need for Further Analysis,’ Tralac, delivered on July 3, 2013, available at: http://www.tralac.org/2013/07/03/the-tripartite-free-trade-area-dispute-settle-ment-mechanism-a-need-for-further-analysis/, accessed on April, 2014.
Meyer, Angela (2011) ‘Peace and Security Cooperation in Cen-tral Africa: Developments, Challenges and Prospects,’ Discussion Paper 56, Uppsala: Nordiska Africainstitutet.
Organization of Africa Unity (OAU) (1981) Lagos Plan of Action for the Economic Development of Africa 1980-2000, Geneva: the International Institute of for Labour Studies.

26 Chapter 2 Strengthening regional Institutions

Chapter 3
Developing Regional Infrastructure

28 Chapter 3 Developing regional Infrastructure
African countries will need to accelerate infrastructure development to achieve real progress in economic de-velopment and poverty alleviation. Such progress must include the core economic sectors, energy, water, trans-port, and information and communication technology (ICT). Accelerated development demands a collective action plan to ensure the infrastructure is developed efficiently.
A regional approach to infrastructure development is required to achieve ambitious economic development objectives. Regional infrastructure involving costs and/or benefits in at least two participating countries requires the involvement of all participating countries, and clearly contributes to regional economic integration and regional public good (AfDB 2014). Integrating infrastructure can deliver economies of scale in production and support spatial integration, enabling market efficiency and trade, and supports the mobility of production factors, such as capital and skills. Augmenting the production base also facilitates the participation of African economies in global value chains, promoting the development of regional ones (see Chapter 6). In addition, it integrates marginalized populations and broadens scope for par-ticipation in the development process.
Regional cooperation in infrastructure development directly supports the establishment of institutions for cooperation. Regional institutions economic, social or political make it possible to harness an agglomeration of economies through regional integration. They generally support the propagation of more inclusive development models, within and across member countries.
Although Africa’s infrastructure is improving, the con-tinent struggles to find the correct business model for
3.1 Introduction
infrastructure development. African economies remain poorly integrated; links in regional roads, rail, ICT, and power infrastructure networks are missing; capacity at ports is constrained; and access to airways is restricted. Even where ‘backbone’ infrastructure is available, ben-efits are not always maximized by designs that exclude marginalized populations. Sub-optimal use of existing assets also results from ‘soft infrastructure’ constraints. Poor regulation on monopolies together with the col-lusive behavior of authorities make pricing in the ICT sector uncompetitive, thereby affecting the affordability of services and lowering trade volumes (Raballand et al., 2012; AfDB, 2011a).
28

African Development Report 2014 Regional integration for inclusive growth 29
This chapter explores how far regional infrastructure efforts support both the growth and welfare aspirations of African countries. It covers both hard and soft infra-structure across four sectors: transportation, energy, ICT and water. The next section examines the relationships between infrastructure, growth and poverty, and best practices to maximize inclusiveness effects. The following section explores key issues in regional infrastructure de-velopment, focusing on two binding constraints: project preparation and project financing. It concludes with a section outlining some key changes needed.
Inadequate infrastructure in African countries partly explains their low competitiveness rankings relative to other developing economies. It contributes to low levels of productivity, low share of African exports in world exports, and low levels of intra-regional trade in Africa (World Economic Forum et al., 2013).
But African countries are increasing investments in in-frastructure, driven by improved access to finance and a common infrastructure framework developed through the Programme for Infrastructure Development in Africa (PIDA). PIDA is a continental initiative spearheaded by the African Union Commission (AUC), in partnership with the United Nations Economic Commission for Africa (UNECA), African Development Bank (AfDB) and the New Partnership for Africa’s Development (NE-PAD) Planning and Coordinating Agency (NPCA). It provides a strategic framework for prioritizing regional projects by sector.
Following an era of neglect, during fiscal consolidation policies and sector reforms implemented under structural adjustment programs (SAPs), African governments are recognizing the need to intensify efforts to address the infrastructure gap. They have increased budget commit-ments to infrastructure sectors, supported by growing commitments from traditional donors and emerging players (see section 2.2). In 2012, African governments adopted PIDA, based on regional integration outcomes, feasibility and development impacts. PIDA is being estab-lished as the reference list for public and public-private sector investments in infrastructure on the continent contributing to more focused investments in upstream activities such as project preparation. Using gross capital formation as a proxy measure, Africa increased invest-ments as a percentage of GDP from 2003 to 2012 to about 22%.1 70% of African countries showed growth in fixed asset formation over the past decade compared to the previous one.
1 Gross capital formation captures net change in fixed assets of the economy. Fixed assets include land improvements; plant, machinery, and equipment purchases; and the construction of economic and social infrastructure including real estate, and commercial and industrial buildings (World Bank, 2013).
• Regional surface transportation networks include road and railway, corridors that link hinterlands to ports and inter-city highways.
• Ports have strong regional integration effects, though they are generally considered national assets. they include ‘dry ports’, which are inland terminals developed by landlocked countries, directly connected to seaports in neighboring coastal states and which operate as centers for sea cargo transshipment to inland destinations.
• International airports handle regional traffic, though like ports, they are normally developed as national assets.
• Logistics systems and regulatory frameworks that govern access are the ‘soft’ regional infrastructure that supports physical transportation networks.
• Electricity interconnectors and national power plants with export capacity are regional assets that support energy access programs.
• ICT broadband networks are interconnected and regional due to international submarine cables and satellites. Inland extensions of networks interconnect neighboring countries.
• Dams and tunnels harness water resources in one country for the benefit of users in a neighboring deficit country.
• Multinational distribution infrastructure involves tapping a regional water resource for improved water and serving people of more than one country.
• Institutions for collective management of shared water resources for the mutual benefit of stakeholder countries form part of the soft regional infrastructure that supports the water sector.
Box 3.1 What is regional infrastructure?
Source: authors.

30 Chapter 3 Developing regional Infrastructure
required for the investment phase and the source and type of funding. In the operation phase, longer-term outcomes and stronger spillover effects are generated. These include the effects on private investments and firm productivity enabled by improved access to production inputs; and effects on private consumption by greater access to cheaper goods and services. The operation, routine maintenance, repairs and rehabilitation of infra-structure assets extend into the operation phase some of the growth effects observed in the construction phase (see Figure 3.1).
Although GDP growth is not entirely attributed to infra-structure investments, the direct effects of infrastructural construction activities sustained growth rates over the past decade in high investment countries, such as Algeria, Cape Verde, Djibouti, Equatorial Guinea and Ethiopia.Indeed, infrastructure was a significant contributor to
3.2.1 Infrastructure for growth Infrastructure affects growth through multiple chan-nels, including private consumption and investment, government expenditure, and net exports. To effectively illustrate these effects it is useful to think of two phases in the life of an infrastructure asset: the construction phase, and the operation phase.
In the construction phase, infrastructure investment increases government expenditure in a fixed produc-tive asset with immediate direct effects on GDP. Pos-itive private consumption effects may arise from the increased disposable income of people employed, to the extent that construction is labor-intensive local labor is used. Similarly, construction contracting increases private sector value added to the extent that it utilizes local content. Balance of payment effects are normally negative, depending on the amount of foreign currency
3.2 Leveraging regional Infrastructure
Figure 3.1 how developing infrastructure affects growth
Source: authors.
Infrastructure Construction (Direct effects)
Infrastructure Operation(Direct effects)
Infrastructure Construction and Operation (Indirect and induced effects)
Investment
Employment and disposable income
Linkages with local industry
Balance of payments effects
Operation and maintenance of infrastructure assets
Private investment
Private consumption
Balance of payments effects
Productivity
Innovation
Quality of human capital
Fiscal effects
Growth-related effects on jobs, private consumption, etc.

African Development Report 2014 Regional integration for inclusive growth 31
previously underserved users. These effects depend on how access is constructed, on pricing terms, and on local content usage, as discussed below.
Physical barriersLimited access to infrastructure in Africa means limited inclusiveness benefits. Besides infrastructure servic-es provided through ubiquitous technologies such as satellite-based ICT, access to infrastructure services is extremely unbalanced geographically, both within countries and between countries. Urban consumers are generally better served than rural consumers, given challenging geographic terrain and dispersed settlements (United Nations, 2011). Nearly 80% of urban Africans are connected to the electricity grid, compared to only 10% of the rural population. Citizens of countries with high income per capita or countries endowed with spe-cific natural resources such as coastal access and energy resources tend to have access to more infrastructure. Thus infrastructure projects that specifically target rural areas (such as rural electrification projects) or countries facing large deficits (such as post-conflict infrastructure reconstruction) have unambiguously strong effects on inclusive growth. Physical exclusion may also result from a failure to use infrastructure assets within reach, as when the infrastructure is not designed to cater to the needs of all potential users. In a classic example, truck roads are developed without feeder roads to link communities inside the infrastructure’s catchment area. In another case, regional railway infrastructure is constructed for the sole purpose of heavy haulage without commuter infrastructure railway stations or rolling stock commuter carriage. The development of ‘captive’2 infrastructure is common in mining which has traditionally adopted the integrated infrastructure model, developing off-take in-frastructure as an integral part of the mining operation, funded and exclusively operated by the mining firm. However, policy shifts are evident in a number of min-eral-rich African countries where mineral exploration is now being strategically linked to wider infrastructure
2 Captive infrastructure is infrastructure developed and operated by a firm or project for its exclusive use.
GDP growth in 23 countries in 2012 (AfDB et al., 2013). During Africa’s period of high infrastructure expendi-ture, during 2003 to 2012 when gross capital formation for the continent as a whole increased to about 22% of GDP, a 1% increase in gross capital formation as a fraction of GDP was associated with a 0.05% increase in GDP growth rates.
The indirect effects of infrastructure development extend into encouraging innovation and the general wellbeing of citizens who benefit from access. But several factors mediate second round growth and inclusion effects: whether the infrastructure is a public good or private; and, if private, how balanced the concession is between the government and provider; if proper oversight is provided; how the infrastructure is financed; the price charged for the service provided; and the economic viability of the investment.
3.2.2 Contributions to inclusive growthIncreasingly, the broader societal impact of regional infrastructure investment is recognized beyond its ef-fects on growth. For one reason, regional infrastructure investments are still mostly public so governments and development partners must justify a fair allocation of resources. Second, there is often a need to ensure an equitable distribution of growth and growth-related benefits among participating countries. For regional in-frastructure, the sharing of benefits among participating countries is less predictable, and may not always neatly correlate with the sharing of costs. Moreover, the extent to which benefits accrue to the poor and marginalized in each participating country is less certain, so deliberate
While infrastructure facilitates inclusive growth when it supports growth in productive employment and pov-erty alleviation and reduces inequality, the link between infrastructure and employment is the most direct. Pov-erty alleviation is expected to result from the economic and social benefits of infrastructure reaching previously unserved users, especially the poor. The link to income inequality is not apparent, but positive effects may be expected from infrastructure that specifically targets

32 Chapter 3 Developing regional Infrastructure
Affordability questions Restrictive pricing of infrastructure services may also limit access. African countries have followed a distinct trend in pricing infrastructure services, designating services as a ‘basic right’ with strong public good char-acteristics and provision below their cost. Such services include water, roads, commuter rail services and, to varying degrees, electricity.
Road infrastructure services have traditionally been provided as a heavily subsidized public good, with us-ers paying only vehicle licensing fees and fuel levies and, for operators of vehicles with foreign licenses, a road user fee. Besides the public good characteristics of road infrastructure, tolling to recover construction and maintenance costs has been limited as traffic volumes are rarely large enough to recover all construction and operation costs at affordable rates. Where tolling is used for cost recovery, the government normally provides a viability gap subsidy5 to support the concessioning of road infrastructure. This means users often extract large welfare gains from accessing road infrastructure. From a sustainability perspective, however, governments bear a large share of the burden of road infrastructure mainte-nance and cannot always cope with these obligations.6 In addition to cost-sharing mechanisms between users and governments such as road user charges and fuel levies, the use of ‘affordable’ tolls, which take into account costs incurred by users in the ‘no project’ scenario, could be enhanced. New affordable tolling operations may be observed in Senegal’s new Dakar toll road, Côte d’Ivoire’s Henri Konan Bédié toll road, and on Zimbabwe and Zambia’s major highways.
Affordability is also an issue in passenger rail, which tends to be subsidized by governments. When the Kenyan and Ugandan governments jointly commissioned their
5 a viability gap subsidy is when the government and a private provider of infrastructure services agree on fees charged to users and in order to make such a project viable and interesting for the private investor, a government subsidy is provided. 6 the challenge for road maintenance in africa is multifaceted and includes governments’ failure to allocate the necessary priority to road maintenance vis-à-vis other activities, such as construction and reconstruction, which may receive more donor support.
development, although it remains unclear what the op-timal model should be (see Box 3.2).
Physical exclusion may also arise from an absence of service providers to facilitate use of existing infrastructure. Where the basic infrastructure is free or subsidized, other forms of exclusion are more worrying. For example, while feeder roads linking trunk roads to catchment areas may exist, the absence of frequent public transportation on these roads limits benefits accruing to non-motorized users. 3 4
3 ‘Open access’ refers to a model of operating infrastructure whereby ownership or control of the asset is independent of access, so that infrastructure is available to users other than the (private) owner, often for a fee. this model removes the high fixed costs associated with the need for each user or operator to deploy its own infrastructure (World Bank 2006).4 a take-or-pay contract is one in which the buyer agrees to either (1) take up and pay the contract price for a minimum agreed quantity of the service provided by the seller, or (2) pay the applicable contract price for such a minimum quantity if unable or unwilling to take up the service.
africa will continue to attract natural resource investments given its volume of unexploited reserves. to harness the growth and development benefits from these natural resources, major investments are needed in infrastructure. according to Deutsche Bank estimates, africa needs to invest USD 50 billion to construct 4,000km of greenfield railway lines to fully exploit its iron reserves (IFC and ppIaF 2013). Some of this infrastructure crosses borders and must traverse remote areas. therefore mining developments are increasingly being viewed as strategic to addressing the infrastructure deficits of the continent. But there is still no consensus on how to revise the ‘captive infrastructure’ model typically used in resource extraction without compromising asset availability for the mining operation, or introducing inefficiencies and risks by imposing public service provision on private mine operators. Methods proposed include ‘open access’3 requirements regarding infrastructure in mining concessions although this model raises conflict of interest issues if the infrastructure is under the control of the mine operator. a model could be considered whereby the mining infrastructure is developed by an independent developer under a take-or-pay4 arrangement with the mining company, giving the mining company first-mover rights; this arrangement could be structured so the independent operator can raise capital cost-effectively on the back of the take-or-pay agreement. another model that has worked involves the government negotiating access rights to the mineral line as part of the concession agreement.
Box 3.2 Mining infrastructure for development
Sources: Ireland (2013); IFC and ppIaF (2013).

African Development Report 2014 Regional integration for inclusive growth 33
subsidies provided by governments. For some countries, the cost recovery tariff is too high to be affordable to the low-income user bracket. Thus a ‘lifeline’ tariff10 is fre-quently used to lower the unit cost covered by low volume consumers (see Figure 3.2). The energy sector tends to experience significant affordability challenges particular-ly in countries running small or isolated electricity grids, and in countries that are net fuel importers. Bringing these tariffs down to affordable rates is extremely costly for governments, and limits the extent to which private investment can be mobilized. User tariffs remain high even with some level of subsidy.
An inclusion perspective requires understanding how tariff considerations and connection fees determine access. Over 60% of Africans, largely the rural population with low access to grid electricity, live on less than USD 2 a day. Charging cost recovery tariffs on infrastructure services
10 a lifeline tariff is a special subsidized fee applicable to consumers receiving a predetermined low volume of electricity which differs from country to country. It is intended to safeguard access to a basic supply of electricity.
regional network in 2006, they were prepared to pay a private operator a subsidy to run commuter services rather than seek royalties, as they did on freight opera-tions.7 South Africa subsidizes both its state-owned com-muter railway company, Metrorail, and its privately-run fast train which operates urban commuter services in Gauteng, the Gautrain. The latter, for instance, received a capital subsidy amounting to 75% of total capital costs amounting to around USD 1.9 billion,8 and was scheduled to benefit from annual operating subsidies to guarantee patronage revenues9 above an agreed threshold for the contractor.
The affordability of energy infrastructure services de-pends on energy resource endowments, market size (i.e. whether it permits economies of scale), and power sector
7 In the end, the winning bidder made a generous offer to pay the two governments a fixed sum of USD 1million annually for five years, but failed to meet this financial obligation (Mutambatsere et al., 2013).8 Zar 20 billion amounts to roughly USD 2.25 billion.9 patronage revenue is revenue in excess of operation and maintenance costs associated with an infrastructure asset paid out to initial investors on an annual basis.
Cost of generation per unit(Cost in USD per kilowatt hour (kWh))
90
80
70
60
50
40
30
20
10
0
Life-line tariff, <100kWh/month
Sout
h A
fric
a
cong
o, d
em. R
ep.
Zam
bia
Nig
eria
Ethi
opia
Moz
ambi
que
Mal
awi
Gha
na
Beni
n
Keny
a
Cam
eroo
n
Tanz
ania
Mad
agas
car
Nam
ibia
Burk
ina
Faso
Sene
gal
Rw
anda
Nig
er
Chad
Figure 3.2 Lifeline tariffs below generation costs in african countries
Source: afDB Infrastructure Database (2013).

34 Chapter 3 Developing regional Infrastructure
including a bid on the feed-in tariff.13 Since the launch of this program in 2011, the feed-in tariff for renewable energy has decreased by as much as 40% for photovoltaic solar projects.
Power pooling has generated regional inclusive growth ef-fects by enabling electricity trade from surplus countries to deficit countries. In Southern Africa, historically-low tariffs are partly explained by the high extent of intercon-nection of power systems and comparatively high levels of electricity trade through the Southern African Power Pool (SAPP). Likewise, electricity tariffs in Southern African countries with small-scale electricity systems are those observed in countries operating small isolated national grids elsewhere on the continent (see Box 3.3).
In sectors that operate as monopolies or oligopolies, effective regulation is needed to prevent profiteering by service providers. In ICT international connectivity is nearly complete, but overpricing is a key factor affect-ing the adoption of ICT services.14 In addition, limit-ed development of traffic exchange points means that most regional traffic is exchanged overseas, leading to high transit fees. Regional traffic in Africa costs roughly 30% more than international traffic for mobile telepho-ny. SADC estimates the average spend on ICT services amounts to 27% of per capita income, much higher than the 1% average reported in developed countries. Uncom-petitive pricing policies by mobile telephone operators, such as subjecting calls to competitor networks to higher tariffs, are another long-standing challenge that could be addressed through regulation.
13 a feed-in tariff is the tariff paid to independent power producers per unit of electricity sold to the entity or entities in charge of transmission and distribution of power to end-users. the term generally applies to power produced from renewable energy sources.14 It should be highlighted that in a number of markets in east africa in particular, increasing competition among ICt operators has kept prices unsustainably low for some operators, resulting in market consolidation (Blycroft 2012).
in high-cost African countries is estimated to result in a monthly subsistence bill of at least USD 8 per household,11 and may not be affordable for some un-served popula-tion. Meeting both affordability and financial sustaina-bility objectives requires optimizing pricing policies so consumers who can afford to pay cost-reflective tariffs do pay them.12 Cross-subsidization policies have been used to achieve this in addition to improving revenue collection from all consumers, ensuring cost recovery from industrial bulk consumers who have sometimes paid low tariffs (in line with governments’ investments promotion policies), and managing technical losses.
Adopting procurement models that allow bidders to compete on cost and affordability is a useful way to reduce tariff costs through improved project efficiency. Competitive procurement is well illustrated in the South African Renewable Energy Independent Power Producer Program, which adopts a two-stage bidding process,
11 USD 8 per household is based on a typical household consumption of 50 kilowatt-hours of electricity and a high-cost country tariff of USD 0.16 per kilowatt-hour, or a typical modest household consumption of 10 cubic meters of improved water and a full cost recovery tariff of USD 0.80 per cubic meter.12 Under-pricing of infrastructure services currently costs the continent USD 4.7 billion annually.
the Southern african power pool (Sapp) comprises nine operating members with power systems interconnected to at least one other member. Its members are Botswana, the Democratic republic of the Congo (DrC), Lesotho, Mozambique, Namibia, South africa, Swaziland, Zambia, and Zimbabwe. all operating members are involved in power trade. South africa is a consistent net exporter, and the largest in terms of volumes and coverage. Other significant sellers are Zimbabwe, DrC, Mozambique and Namibia; however they have been net importers in recent years.
Since the end of 2009, Sapp started operating the live trading platform, Day ahead Market (DaM). this model of power trade is gaining in prominence, but still accounts for a very small proportion of traded electricity (eskom traded only 1 GWh on DaM in 2010, or 0.02% of its total exports). the main challenges facing the DaM platform are a mismatch between short-term supply and demand, persistent peak capacity deficits in the power pool, and a mismatch on bid prices.
Box 3.3 power trade under the Sapp
Source: Sapp (2010, 2011, 2012, 2013).

African Development Report 2014 Regional integration for inclusive growth 35
investments in the transportation sector in South Africa which, like other infrastructure sectors, is subject to a legislative 35% local content requirement (see Box 3.4). A challenge for local procurement strategy is to ensure that local suppliers eventually become as cost-efficient and able to produce to as high quality specifications as international suppliers.
In the past decade and half, the use of African suppli-ers and contractors has grown and African investors have come to the table in infrastructure development. Investments by African firms are driven by portfolio diversification objectives and expected financial returns as well as policy incentives. In the wind energy industry, African firms such as Nareva in Morocco and El Sewedy in Egypt are emerging as sponsors, developers, and op-eration and maintenance contractors. But production of turbine components on the continent is still limited to small-scale system producers mainly in South Africa such as Kestrel Renewable Energy, African Wind Power, Palmtree Power, I-WEC; and in Egypt such as El Sewedy for Wind Energy Generation, SET SIAG El Sewedy Tow-ers (Mukasa et al., 2013). Both South Africa and Egypt owe their progress in the manufacturing industry to the existence of adequate regulatory and policy frameworks, well-established research and development institutions, and the relatively low costs of doing business. However, progress in developing local infrastructure industries in Africa remains marginal and most evident in large middle income countries with the requisite manufac-turing capacities.
Jobs and local contentAchieving employment benefits from infrastructure in-vestments is mostly a function of the scale of local content used and the technology adopted. Jobs are generated at three levels: direct jobs at infrastructure development firms; indirect jobs created in the infrastructure value chain; and induced jobs created at the level of beneficiary firms. An analysis of the IFC’s infrastructure invest-ments shows that for every USD 1 billion invested in infrastructure, between 26,000 and 110,000 direct and indirect jobs can be created, excluding induced jobs through multiplier effects. The number of direct and indirect jobs created is highest in the roads sector, given the greater labor intensity of road construction technol-ogies adopted in developing countries; and is lowest in the capital-intensive power sector. According to IFC and PPIAF (2013), there is an employment multiplier of at least 2 from infrastructure projects and it is highest in ICT, where growth-related job creation is often strong.
The inclusive growth debate casts a spotlight on the po-tential of infrastructure to create local jobs and support private sector development. African countries are actively pursuing these benefits through ‘local content’ initiatives, often combined with legislation that defines a floor in terms of local content share, and local employment dur-ing infrastructure construction. In Egypt, a ‘localization’ program aimed at maximizing local procurement of inputs is imbedded in the power sector development strategy; results after implementation of the first phase show local procurement in power sector projects of between 20-45%. Similar outcomes are evident from
Under the Department of public enterprise’s Competitive Supplier Development program (CSDp), transnet aims to localize a reasonable part of the value chain of imported manufactured goods or services, and promote South africa as an off-shore site of choice for original equipment manufacturers’ and multi-nationals’ procurement personnel. this is done through: (i) ensuring knowledge transfer from key suppliers to transnet engineers who will handle all maintenance of acquired assets; and (ii) leveraging transnet’s spending capacity to negotiate capacity building for local suppliers who could meet its future manufactured equipment requirements. Specifically, transnet tenders awarded to overseas suppliers include requirements to source basic components or acquire assembly services from South african firms. By 2011, two CSDp transactions valued at about USD 1.5 billion had been secured. One involves the transfer of skills and relevant intellectual property to transnet to produce and market electro-Motive Diesel spare parts on the african continent. the other involves a technology partnership between transnet and General electric for locomotive overhauls and modernizations. Both initiatives have potential demonstration effects for other rail companies on the continent.
Box 3.4 transnet’s local procurement and knowledge transfer
Source: transnet (2012); afDB (2011a).

36 Chapter 3 Developing regional Infrastructure
from integrated transport systems. Infrastructure pro-jects may produce significant negative environmental impacts in and around project areas, and these should be adequately mitigated. For services provided at a fee, it is important to ensure that fees do not act as a barrier to accessing or fully utilizing the available infrastructure stock.
Soft infrastructure Inclusion also requires adequate attention to the ‘soft side’ of infrastructure development, such as the legal and regulatory frameworks that govern subsidy regimes in electricity markets. It includes paying attention to safety where major highways or power transmission lines trav-erse densely populated areas. It also means addressing soft bottlenecks which prevent the full delivery of benefits

African Development Report 2014 Regional integration for inclusive growth 37
Transport Energy ICT Water
Physical
access
• add access-enhancing components to project design, e.g. feeder roads on highways, commuter infrastructure in railways, liberalization of air transport industry
• add socio-economic infrastructure along transport corridors, i.e. adopt ‘development corridor’ model
• Choose access-enhancing routes for potentially ‘captive’ infrastructure e.g. dedicated mineral railway lines
• effective integration of different modes of transport, e.g. complement port development with improvement of transit road and rail
• transport facilitation e.g. develop one-stop border posts, implement ‘open skies’ agreement
• add power distribution component to project design, e.g. tapping transmission lines to electrify the t-line’s catchment area
• targeted electrification of underserved areas
• power trade e.g. partnerships between utilities that allow direct service provision to border towns in neighboring countries
• Use cost-effective methods to reach remote areas e.g. global satellites (O3B)
• Improve electricity access to support infrastructure and operation of devices
• effective use of ICt applications to increase reach of other services e.g. finance, health, government, education
• ‘Open-access’ policies for backbone infrastructure (supported by government incentive if necessary)
• targeted distribution of improved water to underserved areas
• add water distribution/irrigation component to bulk infrastructure projects
•• Improve electricity access to support water infrastructure
Affordability and Sustainability
• effective regulation of tolls and tariffs
• targeted price discrimination
• Increase competition
• targeted life-line tariffs
• Use of pre-paid meters
• electricity trade
• effective regulation of operators
• regional cooperation in ICt infrastructure development
• effective regulation of tariffs
• Feeder roads
Jobs and Skills transfer
• Labor intensive construction where cost-effective
• Local content policies on labor
• Skills transfer requirements in procurement contracts
• Capital intensive industry with low direct jobs; but jobs can be created upstream e.g. mining and green technology industries
• Skills transfer requirements in procurement contracts
• Job creation is mostly downstream; substantial in ICt retail sector
• Job creation is mostly downstream in water intensive industries e.g. large agribusiness, manufacturing
Local content
• Local contents policies
• SOe-led centers of excellence for manufacture and maintenance of rolling stock, air and maritime fleets.
• Local content policies cognizant of capital intensive nature of industry
• Sector liberalization to allow Ipps and independent distributors
• Local network operators
• Local ICt service retailers
• Local content policies e.g. for participation in civil works
Reliability
• eliminate ad hoc and rent-seeking transit controls
• adequate maintenance
• adequate reserve capacity
• effective maintenance
• adequate capacity and coverage
• enhance storage capacity
Environment and Safety
• effective regulation and monitoring of environmental and safety standards
• project designs with adequate safety features e.g. walkways and footbridges, way-leaves
• effective monitoring of environmental and safety standards during O&M
• project designs with adequate safety features e.g. way-leaves
• Not applicable • Flood control
Table 3.1 enhancing the inclusion effects of regional infrastructure
Source: authors.

38 Chapter 3 Developing regional Infrastructure
3.3 project preparation and Financing
of most regional infrastructure, the preparation and financing of projects is mostly done at a national level. Each cooperating country sources debt on its own terms and contributes its share of the counterpart funds. A supranational entity or special purpose vehicle (SPV) is rarely used as a project management vehicle. In one such case, the Zimbabwe Zambia Botswana Namibia power interconnector (ZIZABONA) is being prepared by SAPP with grant financing extended by the AfDB. One project preparation task is to set up a supranational SPV, jointly owned by the four cooperating countries, to market the project to potential financers and select a developer. The project will be structured as a cash-flow backed project finance operation, where the developed infrastructure will be used to guarantee debt. This form of structuring should ameliorate some of the challenges associated with the current fragmented approach.
Regional infrastructure may drive inclusive growth, but its development has been slow in Africa and it remains hampered. Multiple challenges include differing imple-mentation capacities of cooperating countries, poor coor-dination of national projects with a regional dimension, and failure to prioritize regional operations in national development plans and budgets. A tension often exists between national priorities and regional ones, especially in budgeting, and political considerations complicate the sharing of costs and benefits. For instance, the cost of expanding port infrastructure is often fully borne by a coastal country, but the collective benefits accruing to landlocked countries could be higher. Countries located on regional transit routes may bear most of the cost of construction and maintenance of regional highways, but fail to maximize access benefits to local communities or fully recover expenditure through transit fees. Large regional infrastructure projects often involve multiple financiers, who need to be carefully coordinated to en-sure cost-efficient transactions. Project finance structur-ing also entails markedly higher transaction costs and complex risk factors for potential financiers compared to single country investments. Effective cooperation is necessary among countries at both bilateral and regional levels, and in some cases, harmonization of policies, rules and regulations, as well as procurement processes. Challenges in collaboration on hard and soft infrastruc-ture development have made key elements necessary for maximizing inclusive growth effects of infrastructure missing, for example, ‘open skies’ reforms in the air transport sector, border post efficiency, and freedom of movement of people.
Two of the most binding constraints to implementing regional infrastructure projects are project preparation and project financing. Despite the cross-border nature

African Development Report 2014 Regional integration for inclusive growth 39
Project preparation responsibilities often fall to gov-ernments. Uncertainty in the market, the risk profile of infrastructure projects at preparation, and the absence of early risk capital all affect the ability or willingness of private actors to participate. In infrastructure projects, risk increases from the launch of project identification, peaks during construction, and only drops to bankable levels when construction is underway. Uncertainties dur-ing preparation may arise from the lack of transparency and predictability of government actions, and multiply in projects involving more than one country. However, the capacity of governments to fund preparation of all priority projects from budgetary resources is constrained due to competing obligations.
Project preparation costs on PIDA, for example, have been estimated at approximately 7% of project cost (AfDB, AUC, and ECA, 2012). For large-ticket regional operations, the challenge is not just how to mobilize these resources, but also how to share the burden among ben-eficiary countries with varying capacities to contribute their share. The absence of regional resource pools capi-talized by African governments has also led to the current fragmented approach to regional project preparation. The challenges relating to project preparation have led to the paradox that despite large infrastructure deficits, there is a shortage of bankable projects on African markets.
3.3.1 Limited project preparation Regional infrastructure project preparation involves complex, costly and time-consuming processes. Among them are identification, feasibility studies, detailed en-gineering designs, structuring, and marketing to get the project to a bankable stage. Political buy-in and strong governance is needed to overcome bottlenecks at planning, licensing and financing stages. Regulatory or policy reforms and restructuring of state-owned entities may be required for procurement. The Infrastructure Consortium for Africa (ICA) identifies this step as one of the most challenging where it is necessary (ICA, 2012). For regional infrastructure development, such reforms are often necessary because of existing differences in the regulatory regimes of cooperating countries. In addition, most African countries operate ‘“hybrid’ infrastructure markets where the state is an actor alongside private sector operators. However, the role of government is not always well-defined, understood and capacitated. Such gaps may become evident only when a project finance transaction is tried, leading to delays in project prepa-ration. The Kenya-Uganda railway project illustrates the multifaceted nature of project preparation activities (see Box 3.5.).
prior to the decision to jointly concession their railway assets, Uganda and Kenya had public monopolies managing their assets: the Uganda railway Commission (UrC) and the Kenya railway Company (KrC). the KrC in particular was in a poor financial position and overstaffed. as a first step towards joint concessioning, the two countries conducted studies to understand the procurement options. this stage was funded by the public-private Infrastructure advisory Facility (ppIaF), which recommended joint concessioning of the assets to a private operator for a period of 25 years. having adopted this model, both countries revised their domestic legislation to remove the governments’ monopoly powers in railways. IFC advisory Services supported these activities in Kenya, while Uganda contracted CaNaraIL as its advisor.
the third step involved reforms at KrC and UrC to avoid transfer of unsustainable financial obligation to the new operators, which included large retrenchments in the case of KrC and revisions of the roles of KrC and UrC from operators to regulators. this costly process was funded by the World Bank through concessional loans to the two governments. Because of the poor state of operations at the time of concessioning, encroachment of informal settlements into the railway lines’ way-leaves had occurred on both sides of the border. a major resettlement program was therefore implemented. Finally, the two governments needed to have in place political risk guarantees, to reassure the new private operator that it would be compensated for the residual value of its capital investments at the time of transferring back assets to the governments. these guarantees were purchased by the two governments from the Multilateral Investment Guarantee agency (MIGa). all these activities were in addition to preparatory activities that should be undertaken for brownfield project finance operations, such as undertaking technical feasibility studies and detailed engineering designs on rehabilitations and extensions.
Box 3.5 Kenya-Uganda railway
Source: Mutambatsere et al. (2013).

40 Chapter 3 Developing regional Infrastructure
An advantage of such resource pooling is that it helps to neutralize the heterogeneity of project preparation ca-pacities across cooperating countries, generating positive inclusion effects. However, most of these initiatives are in their infancy. RECs are also taking on new roles aimed at facilitating implementation of PIDA and regional infrastructure development plans, such as maintaining up-to-date databases of preparation status and project costs, and marketing projects to private investors. This is in addition to their traditional roles of facilitating the harmonization of policies and regulations, as well as the coordination of regional cooperation on projects. Nonetheless, most RECs are not adequately capacitated to undertake these roles, which limits results. The project preparation landscape suggests missed opportunities to maximize integration and inclusive growth effects.
3.3.2 Financing on the riseRegional infrastructure poses special challenges for fi-nancing, because of markedly higher funding needs, and higher transaction costs arising from the scale of investments, multiplicity of players and complex risk factors. The regional infrastructure financing need has been estimated at USD 360 billion, the amount required to develop the priority regional infrastructure in order to sustain an average economic growth rate of 6% between 2012 and 2040 (the estimated capital cost of PIDA’s long-term implementation through 2040). The PIDA
Regional project preparation clearly continues to face funding constraints. Some donor-funded resource pools have emerged, including the NEPAD Infrastructure Project Preparation Facility (IPPF) and the EU-Africa In-frastructure Trust Fund, and support channeled through regional development finance institutions and regional economic communities. Other initiatives that provide capacity support include the Africa Water Facility, which is supported by African governments and administered by the AfDB, the Public-Private Infrastructure Advisory Facility (PPIAF) hosted by the World Bank, the Engineer-ing Multiplier Program which is an initiative run by the United States Exim Bank, and the United States Trade and Development Agency (TDA). Yet these initiatives also remain underfunded relative to needs.
One innovation in preparing regional projects is the AfDB’s Africa50 Fund project preparation facility. This facility will be capitalized by development finance and long term institutional investments, with the appropri-ate matching of risk appetite. The facility will be among the few run on a commercial basis, whereby the Fund prepares priority PIDA projects for sale to the market once bankability is established. The preparation facility has a targeted initial capitalization of USD 500 million of paid-in capital which would make it one of the largest facilities on the market for regional projects preparation. A similar model has been tried successfully in Africa by the donor-funded private equity fund InfraCo. This fund identifies potentially bankable and transformational projects, prepares them to a bankable stage, and sells to developers. Such initiatives tend to be better funded, and because they operate on a commercial basis, offer a longer term solution to the challenge.
A number of RECs are making efforts to address the regional project preparation funding gap by creating project preparation funds. For example, SADC’s Project Preparation Development Facility targeted at supporting the PIDA Priority Action Plan (PAP), and the COMESA-EAC-SADC Tripartite Project Preparation and Imple-mentation Unit which will, among other things, prepare Tripartite infrastructure projects in the Southern and Eastern Africa region to a bankable stage.

African Development Report 2014 Regional integration for inclusive growth 41
obtain necessary approvals and to resolve all political issues surrounding the project has at times been the main obstacle to a well-structured and bankable project coming to market.
Financing cross-border projects often requires strong governance and capacity for contract enforcement in cooperating countries than national projects. Multiple currencies also complicate regional infrastructure oper-ations, particularly on the revenue side, and related cur-rency risk. Untested or poorly-understood governance structures may also impede finance from capital markets.
Current statistics suggest that despite these challenges, the volume of financial commitments into Africa’s infra-structure development is increasing. Unfortunately, there is no publicly-available data source that shows trends in regional-level infrastructure financing. Still, it is estimat-ed that commitments for infrastructure development in general reached USD 89 billion in 2012.15 The largest
15 the USD 89 billion should not be confused with actual disbursements which will be staggered over a number of years.
Priority Action Plan alone, counts 51 regional programs unbundled into 433 projects with a total cost of USD 68 billion to be mobilized from 2012 to 2020. Since current spending on Africa’s infrastructure already falls short of the amount required to develop a critical mass of infra-structure to meet current needs, these financing needs will not be easily met.
Mobilizing resources for regional infrastructure implies important challenges besides the large gaps in project preparation. Resource mobilization is also constrained by weak political commitment to regional infrastructure projects by cooperating countries. This can been seen in the lack of coherence between the regional integra-tion aspirations of countries expressed at REC level and subsequently articulated in regional infrastructure development plans, and budget allocations at country level. It is also observed in the slow pace at which regional protocols and agreements are implemented nationally; and the persistent lack of harmony in policy, legal and regulatory environments that has hindered timely fi-nancial close following project preparation. Failure to
Figure 3.3 external infrastructure financing in africa
Source: ICa Data (2013).
China
Multilateral Development Banks
private sector
arab Funds
europe
Japan
regional Development Banks
USa
S. Korea
India
Brazil
28%
19%11%
11%
5%
3%
17%

42 Chapter 3 Developing regional Infrastructure
power plants (for example, Gibe III in Ethiopia) and airports (for example, the new international airport in Luanda, Angola).
Chinese investments in African infrastructure are led by state-owned entities: the China Exim Bank, the China Development Bank through its China-Africa Develop-ment Fund, and the Ministry of Commerce. A much smaller share are foreign direct investments. China’s engagement in Africa is often supported by strategic partnerships negotiated between African governments and the Chinese government, offering concessions to develop infrastructure in exchange for natural resources. Resource-backed concessional lending in particular has received special attention given its unconventional char-acter and sensitivities surrounding resource extraction on the continent (see Box 3.6).
The private sector has also played an evolving role in African infrastructure projects. According to the PPIAF, total commitments in infrastructure projects reaching financial close declined by 43% between 2008 and 2011, but picked up in 2012 thanks to large commitments in the energy sectors of South Africa and Morocco. The sectorial focus of the private sector has also changed from several years of ICT dominance to growing interest in the energy sector, which may be attributable to rising unit energy tariffs during this period. The trend broadly mirrors the evolution of the continent’s financing needs. As the private sector’s presence wanes in the transport sector, which currently attracts the bulk of financing resources, China’s presence grows in that sector.
share (47%) was committed by African governments, followed by Chinese investors who surpassed traditional partners and now account for 15% of total commitments (ICA, 2013). The profile of financiers, excluding African governments, is presented in Figure 3.3.
In recent years, African governments have increased their investments to address the huge gaps in infrastruc-ture, which arise from investment backlogs and growing demand. These investments have also been aimed at as-sisting with commodity extraction, unlocking structural bottlenecks to growth, and sustaining economic activity during the global economic crisis. For example, the South African government is currently financing a ZAR 827 billion (roughly USD 8 billion) infrastructure program for the period 2013 to 2016, funded from fiscal funds and from the balance sheets of its state-owned enterprises. The governments of Cape Verde, Kenya, Ethiopia, Na-mibia and Uganda are also investing substantial shares of national budgets into infrastructure. Overall, Afri-can governments are making pro-growth investments, with transport and energy collectively accounting for two-thirds of their national budget allocations. Chi-nese investment in African infrastructure grew more than five-fold between 2006 and 2012. A large share of Chinese investments were in Africa’s transport sector, but the portfolio is increasingly diverse. The Chinese share of investments in transport sector decreased from 80% in 2010 to 45% in 2012, while the energy portfolio grew from 13% of total commitments in 2010 to nearly 39% in 2012 (ICA, 2013). Infrastructure developed with Chinese financing includes national projects with strong regional integration effects such as export generating
Oil-rich angola has attracted large infrastructure investments from China, comparable to those destined for Nigeria. the infrastructure partnership between angola and China dates back to 2004 when China extended a USD 2 billion oil-backed concessional loan to angola to fund its post-conflict infrastructure reconstruction program. this loan, and subsequent loans, disbursed between 2004 and 2008, were repaid through oil shipments for the duration of the construction phase. In the loan agreement, projects identified by the government of angola were put to restricted tender, with Chinese firms allocated at least 70% of the project cost and the remainder as local content. Following the contract award, the loan amount was disbursed directly to the approved contractor; while angolan oil revenues were automatically directed into an escrow account as debt service guarantee. Deductions of scheduled debt service payments were then made by China at loan maturity. this arrangement worked in part because of the appointment of a neutral third party to provide oversight, complemented by a multi-sector technical group made up of Chinese and angolan officials to monitor implementation.
Box 3.6 China’s ‘resources-for-infrastructure’ strategy in angola
Source: haroz (2011).

African Development Report 2014 Regional integration for inclusive growth 43
The private sector’s involvement as equity investors and developers in regional infrastructure projects is strong in the ICT sector but tentative elsewhere. In railways, for example, the joint commissioning of the Kenya Uganda railways in 2006 was the first full contracting of the pri-vate sector in regional railway development observed. The recent contracting of Vale to develop the cross-border network from the coal-producing region of Tete in Mo-zambique, through Malawi, to Nacala port is another. In the power sector, private sector involvement is increasing in generation projects which export capacity, but these projects are often public-private-partnerships given the central role of public utilities as solely mandated off-tak-ers in many countries. Because public utilities are usually capacity-constrained with weak balance sheets and high leverage ratios, the need to directly engage them creates a bottleneck to private sector involvement in regional energy sector projects.
In the ICT industry, private sector-led regional oper-ations generally have succeeded in generating strong inclusive growth effects. This is evident in the strong positive firm and household level effects reported on projects such as the East African Submarine System (EASSy), the submarine cable project serving eight Af-rican countries. EASSy was developed under an open access arrangement in which 14 leading telecommu-nications operators from Eastern and Southern Africa controlled 30% of the submarine cable’s capacity (World Economic Forum et al., 2013; Ndungu, 2013; InfoDev, 2005).16 However, because implementation of open access regulation often clashes with the need to secure returns for investors, the market is prone to profiteering and high charges for connection to landing points. Effec-tive regulation is, therefore, key to maximizing inclusive growth benefits when private investors are involved in regional infrastructure investments.
16 eaSSy involves laying of approximately 9,900km of submarine communication cable from South africa to Sudan, with connecting cables from trunk route to landing points in Mozambique, Madagascar, tanzania, Kenya, Somalia and Djibouti.
The private sector financing landscape has changed over the past decade. Since the instruments used to attract private financing into infrastructure are diversifying, many long-term investors are contributing indirectly to infrastructure development. Emerging instruments include:
• Diaspora bonds used to fund large-scale infrastructure in Ethiopia and Kenya;
• Local and foreign currency infrastructure bonds both corporate and sovereign guaranteed used to redirect private savings to productive use in Ghana, Kenya, South Africa and Zambia;
• Infrastructure private equity funds that specifical-ly target regional infrastructure projects, including funds managed by African Infrastructure Investment Managers;
• Syndicated loans extended by regional banks, often in partnership with DFIs; and
• Regional foreign direct investments, such as Ethiopian Airlines’ investment into the regional ASKY Airlines.
New private investors are emerging in sectors where infrastructure-related revenue streams are not the main source of revenues for the project, for example, infra-structure investments funded by mining firms.

44 Chapter 3 Developing regional Infrastructure
mainstreaming of regional integration priorities and coherence of plans across countries. Such a mechanism should be established. There is also a need to harmonize sector policies, laws and regulations to facilitate coop-eration in infrastructure development; and to ensure that activities are appropriately sequenced so that policy harmonization precedes major financial investments in project preparation activities. This is particularly im-portant in the energy sector where an enabling policy environment is a necessary condition to strengthening trade.
In project preparation, a paradigm shift of funding mo-dalities is required so that preparation activities are viewed as an integral part of the project and funded as such. To harmonize the pace and quality and regional projects preparation, there is merit in adopting mecha-nisms to incentivize contributions from national budgets into regional resource pools such the Fund for Develop-ment and Financing of ECOWAS Transport and Energy sectors (ECOWAS FODETE). Procurement rules should also accommodate unsolicited bids in order to encourage project preparation by private developers.
As further discussed in Chapter 5, developing African capital markets is crucial to mobilizing excess savings from domestic, regional and international markets to-wards infrastructure development. Efforts by multilat-eral development banks to achieve the same through vehicles such as Africa50 are laudable, but governments should also enhance efforts to improve local investment conditions and mobilize private finance. Doing so will enable governments and development partners to direct limited resources into providing viability gap subsidies and guarantees to complement private sector financing. A key element in mobilizing private finance is establishing
3.4.1 More regional cooperation To address the challenges of regional cooperation in infrastructure development, the role of regional bod-ies needs to be reviewed to ensure their relevance in the changing context of regional project finance. With the adoption of PIDA and REC level infrastructure de-velopment plans, RECs are playing new roles, such as managing project databases in forms usable by private investors, project preparation, and project promotion. The capacity of RECs should be enhanced to effectively perform this role in addition to their planning role.
However, there is a need to ensure the role of RECs re-mains primarily that of coordination and facilitation of regional infrastructure projects, including supervision of ongoing projects and monitoring and evaluation. Sub-regional entities such as power pools and river ba-sins often lack the mandate required to hold members accountable for the timely implementation of projects according to the agreed schedule; and like RECs, they lack project implementation capacity.
Sub-regional institutions must also be empowered to play a more deterministic role as regional planners for the sectors, and in specific sectors (such as energy) as drivers of project preparation processes. At the national level, efforts to build the capacity of national public enti-ties involved in the implementation of regional projects should be increased.
Investment priorities at country level should be driven by regional plans, and harmony should be strengthened between regional integration plans and countries’ medi-um-term budgets. In SADC, for example, no mechanism currently exists for peer evaluation of national develop-ment plans and medium-term budgets to ensure both
3.4 Changes Needed

African Development Report 2014 Regional integration for inclusive growth 45
This includes contracting local providers who have a reasonable chance of becoming competitive suppliers, maximizing local employment benefits and skills transfer. The International Labour Organization for example has developed labor-based methods of infrastructure devel-opment that have proven to be viable and cost-effective through its Local Development through Infrastructure Investments and Jobs program (ASIST-AP). In some countries, stringent bidding requirements exclude the participation of small-scale local enterprises, or the appli-cation of techniques that optimize use of locally available resources. Institutional reforms to incentivize contractors to develop and use local resources is necessary to improve inclusive growth benefits from infrastructure.
Regional infrastructure concessions between government and the private sector should be ‘fair’. Taxes and fees should reflect the sharing of risks and rewards between the government and the private sector. For instance, in the development of regional infrastructure assets that require transfer or lease of land to private operators, compensation to the state or community should be ad-equately reflected in the concession fee structure. To maximize inclusive growth effects, it is also important that benefits of government subsidies trickle down to end-users.
Regulators should adopt the ‘open access’ model whenev-er feasible. Such policies will facilitate end-user access to infrastructure services, and enable regional infrastructure providers to serve local markets cost-effectively. In the air transport industry, for example, where traffic volume is a big determinant of viability, reducing restrictions on access to the local market by regional carriers would improve affordability of air transport services. Such policies may also need to be coupled with appropriate political and financial risk-sharing arrangements when implemented in sectors where the private sector is active. This would create additional incentives for the private sector to enter the market and put pressure on African governments to increase the number of eligible operators. For now, markets in Africa are still heavily controlled by monopolies and governments and, as a result, char-acterized by high-margin and low-volume businesses.
a regulatory environment with effective and predictable legal, regulatory and fiscal features. These should include commitment to a stable regulatory regime in key infra-structure sectors, with a clear mechanism for awarding tenders and setting tariffs; well-governed, independently managed state-owned utilities with effective procure-ment, billing and revenue collection, and healthy balance sheets; and a legal basis for operations and maintenance contracts, leases, concessions and public-private part-nership structures (Mbeng et al., 2013).
The use of risk mitigation instruments to enhance the credit-worthiness of regional infrastructure projects should be enhanced. The use of these available instru-ments to catalyze private sector financing has been limit-ed, and should be promoted. These instruments include both concessional ones(such as partial risk guarantees offered by International Development Agency and Af-rican Development Fund), and commercial ones (such as political risk insurance offered by the Multilateral In-vestment Guarantee Agency, and different kinds of credit guarantee offered by multilateral and commercial banks).
3.4.2 More inclusiveness To effectively support inclusive growth, regional infra-structure designs should focus on maximizing end-user access benefits. This means that infrastructure sector pol-icies should have access as a primary objective, supported by mechanisms, regulatory or otherwise, to minimize the development of captive infrastructure and enhance integration of access components in project designs. It also entails attention to the soft side of infrastructure development such as addressing soft bottlenecks which prevent the full delivery of benefits from integrated transport systems, and ensuring sustainability of subsidy regimes in electricity markets.
Infrastructure investment codes should enable countries to maximize local content where opportunities exist to do so cost-effectively. Reforms of procurement models are required to engage local factors of production in coun-tries where the model does not already exist and where efficient opportunities for such synergies are plausible.

46 Chapter 3 Developing regional Infrastructure
Mbeng Mezui, Cedric A. and Bim Hundal (2013) Structured Finance - Conditions for Infrastructure Bonds in African Markets, Regional Integration and trade Department of AfDB, Tunis: AfDB.
Mukasa, Alli, Emelly Mutambatsere, Yannis Arvanitis, and Thouraya Triki (2013) ‘Development of Wind Energy in Africa,’ Working Paper, No. 170, AfDB.
Mutambatsere, Emelly, Angela Nalikka, M. Paal, and Désiré Vencatachellum (2013) ‘What Role for MDBs in Project Finance? Some thoughts from the Rift Valley Railways in Kenya and Uganda,’ Journal of Infrastructure Development, 5(1), Gurgaon: Sage, pp. 1–20.
Ndungu, Samuel (2013) ‘Financing submarine system infra-structure – the EASSy / WIOCC model,’ Western Indian Ocean Cable Company (WIOCC) Corporate Presentation for CFO Summit 2013 in London, May 22, 2013.
Raballand, Gael, Salim Refas, Monica Beuran, and Gozde Isik. (2012) Why Does Cargo Spend Weeks in Sub-Saharan African Ports? : Lessons from Six Countries, Washington, DC: World Bank.
Southern African Power Pool (SAPP) (2010) SAPP Annual Report 2010. SAPP.
Southern African Power Pool (SAPP) (2011) SAPP Annual Report 2010. SAPP.
Southern African Power Pool (SAPP) (2012) SAPP Annual Report 2010. SAPP.
World Bank (2013), Global Financial Development Report: Rethinking the Role of the State in Finance, World Bank, Wash-ington, DC.
World Bank (2006), Study On Local Open Access Networks for Communities and Municipalities. Available from: http://www.infodev.org/infodev-files/resource/InfodevDocuments_130.pdf
World Economic Forum, AfDB, the International Bank for Re-construction and Development / the World Bank, the Ministry of Foreign Affairs of Denmark (2013), Africa Competitiveness Report, World Economic Forum, Geneva.
References
AfDB (2011a) African Development Report 2011: Private Sector Development as an Engine of Africa’s Economic Development, Tunis: AfDB.
AfDB (2014) Regional Operations Selection and Prioritization Framework (Revised Framework) http://www.afdb.org/file-admin/uploads/afdb/Documents/Policy-Documents/Region-al_Operations_Selection_and_Prioritization_Framework__Re-vised_Framework_.pdf
African Development Bank, OECD Development Centre, Unit-ed Nations Development Program, United Nations Economic Commission for Africa. African Economic Outlook 2013.
African Union Commission (AUC), and Economic Commission for Africa (ECA) (2012) Interconnecting, integrating and trans-forming a continent, Program for Infrastructure Development in Africa (PIDA).
Blycroft 2012 African Mobile Yearbook http://blog.bearing-con-sulting.com/wp-content/uploads/2012/10/Africa.Mobile.Fact_.Book_.2012.pdf
Haroz, David (2011) ‘China in Africa: Symbiosis or Exploita-tion?’, The Fletcher Forum of World Affairs, May 15, 2011, available at: http://www.fletcherforum.org/2011/05/15/haroz/?
Information for Development Program (InfoDev) (2005) ‘Open Access Models: Options for Improving Backbone Access in De-veloping Countries,’ Technical Report, Stockholm: Spintrack AB.
International Finance Corporation (IFC) and Public-Private Infrastructure Advisory Facility (PPIAF) (2013) Fostering the Development of Greenfield Mining-related Transport Infrastruc-ture through Project Finance, Washington, DC: PPIAF.
Infrastructure Consortium for Africa (ICA) (2012). ICA An-nual Report 2012: Infrastructure Financing Trends in Africa. Tunis: ICA.
Ireland, Glen (2013) ‘Mining Infra – Case for a New Approach,’ Middle East and Africa Special Report, Project Finance Inter-national.

Chapter 4
Managing Regional Migration

48 Chapter 4 Managing regional Migration
Migration is a livelihood strategy for many Africans. Mobility and migration have always been an intrinsic part of human capital development, and migration may be a capability-enhancing act in the search for better or more secure livelihoods (De Haan, 1999; Ellis, 2000). Yet today, rising migratory flows run into increasing restrictions to mobility. In Africa, closing ‘doors’ to free movement of people has sent massive flows of undocumented people or irregular migrants through the ‘windows’. Porous borders and informal processes facilitate the act of migrating within Africa, but intra-African migrants face the disad-vantages of high formal restrictions and costly barriers to mobility. Such constraints marginalize migrants and reduce their potential contributions to development and
4.1 Introduction
inclusive growth. If an African’s country of birth strongly influences his or her opportunities for developing their human capital, the degree of regional integration affects their chances of improving it elsewhere.
The widely-recognized link between migration and devel-opment is ignored in regional policies across Africa. The free movement of persons remains a poorly elaborated policy area in the context of regional integration, and regional integration agreements contrast with de facto integration for labor mobility in Africa where informal processes govern migration. In treaties on regional in-tegration, with the implied goal of common or single markets, migration constitutes one of four freedoms:
48
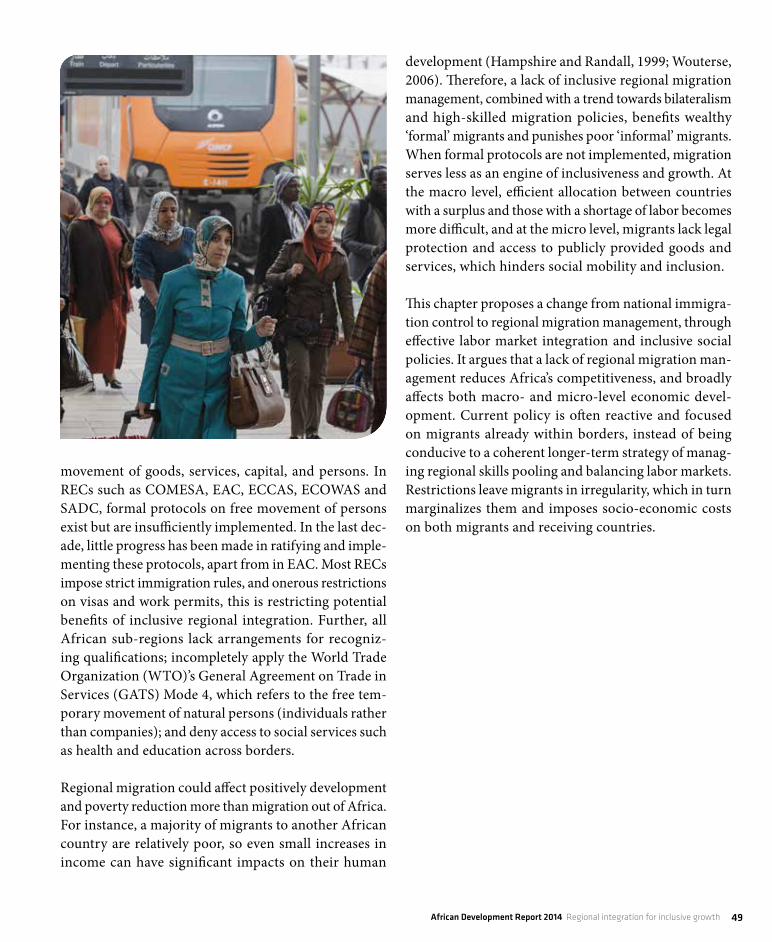
African Development Report 2014 Regional integration for inclusive growth 49
development (Hampshire and Randall, 1999; Wouterse, 2006). Therefore, a lack of inclusive regional migration management, combined with a trend towards bilateralism and high-skilled migration policies, benefits wealthy ‘formal’ migrants and punishes poor ‘informal’ migrants. When formal protocols are not implemented, migration serves less as an engine of inclusiveness and growth. At the macro level, efficient allocation between countries with a surplus and those with a shortage of labor becomes more difficult, and at the micro level, migrants lack legal protection and access to publicly provided goods and services, which hinders social mobility and inclusion.
This chapter proposes a change from national immigra-tion control to regional migration management, through effective labor market integration and inclusive social policies. It argues that a lack of regional migration man-agement reduces Africa’s competitiveness, and broadly affects both macro- and micro-level economic devel-opment. Current policy is often reactive and focused on migrants already within borders, instead of being conducive to a coherent longer-term strategy of manag-ing regional skills pooling and balancing labor markets. Restrictions leave migrants in irregularity, which in turn marginalizes them and imposes socio-economic costs on both migrants and receiving countries.
movement of goods, services, capital, and persons. In RECs such as COMESA, EAC, ECCAS, ECOWAS and SADC, formal protocols on free movement of persons exist but are insufficiently implemented. In the last dec-ade, little progress has been made in ratifying and imple-menting these protocols, apart from in EAC. Most RECs impose strict immigration rules, and onerous restrictions on visas and work permits, this is restricting potential benefits of inclusive regional integration. Further, all African sub-regions lack arrangements for recogniz-ing qualifications; incompletely apply the World Trade Organization (WTO)’s General Agreement on Trade in Services (GATS) Mode 4, which refers to the free tem-porary movement of natural persons (individuals rather than companies); and deny access to social services such as health and education across borders.
Regional migration could affect positively development and poverty reduction more than migration out of Africa. For instance, a majority of migrants to another African country are relatively poor, so even small increases in income can have significant impacts on their human

50 Chapter 4 Managing regional Migration
other developing countries are mainly aged 18 to 29, searching for job opportunities (Dodson et al., 2008); and growing numbers are women, who now make up nearly half (45.9%) of African migrant workers (Adepoju, 2006; Ally and MRI, 2006; Klein, 2006; UNDESA, 2013). In 2010, 15 to 34-year olds accounted for 42.6% of all international migrants in the least developed countries, compared to 29.1% in developed countries (UNDESA, 2011), and Africa generally has the world’s lowest median age of migrants (29.9 years) (UNDESA, 2013).
Migration may also be a resilience strategy against pov-erty, food shortage, climate change, natural disasters, and war.1 While this chapter does not cover refugees recognized by international conventions, it is clear that natural resource scarcity, environmental degradation, and climate change are increasingly determining migration flows (Hatton and Williamson, 2001; Stern, 2006). In the preliminary stages of famine, households may relocate some family members or undertake temporary migra-tion to rural areas to enable income diversification (see Figure 4.1). In the Sahel region, environmental drivers of population displacements consist of land degradation, desertification, and drought (Myers, 2002; Grote and
1 this chapter does not cover refugees, which are governed by different legislation to that governing labor migrants. the violence of inter-ethnic conflicts, civil wars and humanitarian crises in countries such as Sudan, Sierra Leone, the Great Lakes regions, Côte d’Ivoire, Nigeria, Sudanese Darfur and elsewhere are considered to be key “push” factor for migration, but to a lesser extent than economic and environmental factors (Naudé, 2010). Over 50% of the Internally Displaced persons (IDp) worldwide are in africa, due to the escalation of civil war and conflicts between 1990 and 2011. even though South africa has since 2008 been the recipient of the highest number of asylum applications worldwide, there has been a continuous decline in the number of refugees and asylum seekers in africa (ratha and Shaw, 2007).
4.2.1 Migration as a livelihood strategy With rising youth unemployment and high demographic growth in Africa, migration is a key livelihood strategy for many Africans. In this ‘age of migration’, population movements of men and women are increasing in and out of almost every country in the world (Castles and Miller, 2009; UNDP, 2009). An estimated 31 million Africans are documented international migrants, that is between 2.5-3% of the continent’s population; and these figures do not include Africans without visas or work permits (Ratha et al., 2011). Legal migration to South Africa has more than quadrupled since 1990, and irregular migration has simultaneously increased. An estimated 4.3 million irregular sub-Saharan African migrants live in North Africa, many of them wishing to transit to Europe; more than 1 million live in Côte d’Ivoire; and up to 7 million reportedly live in South Africa.
By diversifying income, migration can serve as an insur-ance policy or a risk reduction strategy for the African household (Stark and Taylor, 1991; Taylor, 1999; Bensaad, 2005; Quinn, 2006; Khachani, 2008). Recent research has assessed the relative weight of different drivers of migra-tion, finding that push-factors, mainly economic, are pre-dominant (King and Skeldon, 2010; Government Office for Science, 2011). Demographics and labor market gaps, or youth unemployment, are among the most important factors leading to migration (Hatton and Williamson, 2001; Shimeles, 2010). 62% of Africans more than 600 million people are below the age of 25, and constitute a growth opportunity as they enter their productive years. A rising number of African youth are educated and mobile; but unemployed or underemployed, a phe-nomenon exacerbated by a mismatch between needs of the labor market and skills produced by the education sector. Migrants from developing countries moving to
4.2 Migration restricted

African Development Report 2014 Regional integration for inclusive growth 51
from the world, but rather from regions and nation that undergo rapid change as a result of their incorporation into global trade, as well as information and production networks (Massey, 2009).
Migration within sub-Saharan Africa represents the world’s largest South-South movement of people, and they usually migrate within their immediate sub-region (Ratha et al., 2011). Such South-South migration, that is migration between developing countries, slightly exceeds South-North migration, since the migration stock in the global South has increased more rapidly during the last decade. Africans represent only 10% of immigrants to OECD countries, fewer than any other region of the world; and a large majority of these are North Africans, and unusual as almost 90% of them migrate out of Africa (UNDESA, 2013). The general trend in Africa is towards regionalization, since 65% of sub-Saharan Africans stay within the continent (UNDESA, 2013). In West Africa, around 7.5 million migrants move within the sub-region, accounting for up to 86% of total emigration (Gnisci, 2008). With migration being a main household strategy in Africa, all countries are affected and some molded by it. Smaller countries, island states and conflict or post-conflict countries have an emigration rate above 10% of their populations; this is the case for Cape Verde,
Warner 2010). In Niger, for example, two-thirds of the respondents to a World Bank study (2000) indicated that, as a way to cope with the lack of food, clothing or income, they left their homes and looked for livelihoods elsewhere. Still, environmental drivers may be associated more with short-term rather than long-term migration (Henry, Schoumaker and Beauchemin, 2004; Lassail-ly-Jacob et al., 2006). 80% of the male labor force from landlocked countries located in South Sahara (Chad, Mali and Niger) migrate seasonally to coastal areas during periods of drought (Grote and Warner, 2010).
Migrants from poorer regions remain within neighboring countries. Per capita GDP has a large effect on the capac-ity to migrate, especially to more distant destinations, which introduces a threshold effect (UNDP, 2009; Shaw, 2007; De Haas, 2010; Shimeles, 2010). African migrants from middle-income countries tend to migrate to desti-nations outside Africa. Wealthier people and societies are also generally more mobile than relatively poor people and societies. Emigration rates as a share of population are around 2.1% in low-income countries and 3.6% in high-income countries (Bakewell, 2009). The ‘poorest of the poor’ cannot afford migration because of their lim-ited resources (UNDP, 2009). So international migrants do not come from poor, isolated places disconnected
Figure 4.1 population mobility strategies associated with food insecurity and famine
Source: hugo (1991).
Stage of famine Mobility strategy
Perception of impending food insecurity
Reduce food availability
Acute food shortage
Malnutrition
Starvation
Excess mortality
Temporary labor migration and spatial reallocation of family labor resources
Mass distress migration
TIME

52 Chapter 4 Managing regional Migration
itself, migration is unlikely to decrease. As Africa and Africa’s per capita GDP both rise, so does the ability to migrate (Massey, 2009); at the same time, globalization increases awareness of differences in living standards, which may then enhance the wish to migrate. But in the broader context of societal change, it is important to consider that globalization has led to the inclusion of some populations and the marginalization of others, amid increasing inequalities within African countries. With more closed borders in the global North, a majority of African immigrants will only have the capital to migrate within their immediate sub-region.
4.2.2 Regional policies Migration has been on the agenda of the African Union (AU) and RECs for many years. Article 71 of the Abuja Treaty, which created the African Economic Commu-nity, urges member states to adopt policies that allow free movement of persons within the community. This would involve facilitating employment for skilled human resources from one member state in other member states where there are shortages, as an essential component for promoting regional cooperation and integration.
Equatorial Guinea, São Tomé and Principe as well as Mali (see Table 4.1).
Regional hubs such as South Africa, Côte d’Ivoire, Ken-ya, Gabon and Libya attract a high number of migrant workers, most of whom come from neighboring coun-tries. An estimated 80% of South-South migration takes place between countries that share a common border, compared to 20% for South-North migration (Ratha and Shaw, 2007). 67% of migrants in South Africa are from SADC countries (Crush, 2011), and Africa’s main bilateral corridors are Burkina Faso-Cote d’Ivoire (1.6 million), Zimbabwe-South Africa (1.3 million), and Mozambique-South Africa (1.2 million) (Ratha et al., 2011). Increasing border controls and financial crises in Europe and North America have also increased migration to African countries such as Botswana, Morocco, and Namibia (Crush and McDonald, 2002).
Without regional migration management, destinations are determined by a lack of capital and social networks rather than the requirements of labor market. Given that international migration does not stem from a lack of economic development, but rather from development
Top 10 Sending Countries in Africa Top 10 Receiving Countries in Africa (of African emigrants)
Cape Verde (>10%) Côte d'Ivoire (9%)
equatorial Guinea (>10%) South africa (5%)
São tomé & principe (>10%) Nigeria (>2.5%)
Mali (>10%) tanzania (>2.5%)
Morocco (>5%) Sudan (<2.5%)
Burkina Faso (>5%) Burkina Faso (<2.5%)
Benin (>5%) Uganda (<2.5%)
tunisia (>5%) ethiopia (<2.5%)
republic of Congo (>5%) Libya (<2.5%)
algeria (>5%) Chad (<2.5%)
Table 4.1 top ten sending and receiving countries in africa, per rate of migration (%), 2010
Source: Shimeles (2010) based on Migration matrix data.

African Development Report 2014 Regional integration for inclusive growth 53
the last point in a linear process toward complete regional integration. Thus RECs have established formal conven-tions and protocols on migration, based on international conventions and resolutions (see Table 4.2). But they are not fully implemented, so regional free movement of people is de facto, informal, and contested. The trans-position of treaty provisions and protocols into national legislation and regulations is in most cases not fully achieved, and a majority of immigration laws have not been amended to reflect national commitments made at the regional level. In periods of rapid growth, some African governments have welcomed labor migrants but during economic crises, they have also expelled them en masse, which happened 23 times between 1958 and 1996
Free movement is a clear vision articulated in all the founding treaties of African RECs. Migration means freedom of movement for people, but also enables ef-ficient movement of goods, services, and other capital between countries. 2
Yet regional migration protocols often remain a low pri-ority across Africa. Migration is sometimes perceived as
2 arab Maghreb Union (aMU), Communauté des États sahélo-sahariens (CeN-SaD), Common Market for eastern and Southern africa (COMeSa), east african Community (eaC), economic Community of Central african States (eCCaS), economic Community of West african States (eCOWaS), Inter- governmental authority on Development (IGaD) and Southern african Development Community (SaDC)
RECs2 Primary law provisions on Free Movement of Persons
(founding treaties, protocols etc.)
Implementation of Protocols of Free Movement
aMU “work towards the progressive realization for the free movement of persons, services, goods and capital” (aMU treaty 1989, art. 2)
No policy
CeN-SaD “the removal of all restrictions hampering the integration of the member countries through the adoption of necessary measures to ensure (a) free movement of persons, capitals and interests of nationals of member States (…)”(CeN-SaD treaty)
No policy
COMeSa “removal of obstacles to the free movement of persons, labor and services, right of establishment for investors and right of residence within the Common Market”(COMeSa treaty art. 4(6e) and art. 164)
Not yet in force
(Protocol on gradual visa-relaxation in force)
eaC “measures to achieve the free movement of persons, labor and services and to ensure the enjoyment of the right of establishment and residence of their citizens within the Community” (art. 104 eaC treaty) (eaC, 2006)
6 months visa-free entry (renewable)
eCCaS “progressive abolition between Member States of obstacles to the free movement of people, goods, services, capital and to the right of establishment” (eCCaS treaty, art. 4(e))
Not yet in force
eCOWaS “establishment of a common market through the removal of obstacles to the free movement of persons, goods, services and capital and the right of residence and establishment (revised eCOWaS treaty of 1993, art. 3)
90 days
visa-free entry
IGaD “promote free movement of goods, services, and people and the establishment of residence” (agreement establishing IGaD, art. 7(b))
No policy
SaDC “the progressive elimination of obstacles to the free movement of capital and labor, goods and services, and of the people of the Region generally, among Member States” (SaDC Founding treaty of 1992, art. 5 (2) (d))
Not yet in force
Table 4.2 primary legal provisions on free movement of persons in reCs
Source: authors.

54 Chapter 4 Managing regional Migration
The SADC Draft Protocol on Free Movement of Persons from 1995 was opposed by migrant-receiving countries in the sub-region. In spite of the low ratification and implementation of the initial protocols, several new regional protocols have been devised with the same low levels of success. This includes the SADC Draft Protocol on the Free Movement of Persons in 2005, which has only been signed by six member states.
The absence of migration regimes that support regional integration has left Africa with some of the world’s most onerous visa restrictions, especially for people wishing to enter another African country. All regions except East Africa have visa-requirements above the world average (see Figure 4.2); indeed, North Americans and Europeans face fewer visa requirements to enter African countries than Africans do. On average, Africans need visas to visit 60% of African countries, from a low of 41% for The Gambia and a high of 84% for Somalia. Only Comoros, Madagascar, Mozambique, Rwanda, and the Seychelles offer visa-free access or visa-on-arrival to citizens of all African countries. By contrast, the DRC, Equatorial Guinea, São Tomé & Principe and Sudan require all Afri-can entrants to apply for a visa before arrival. Reciprocal
(Bredeloup, 1995). Migration streams between Tunisia and Libya, for example, have experienced three periods of open access and eight of expulsion since 1969.
The Economic Community of West African States (ECOWAS) and the East African Community (EAC) have made the most notable progress toward the free movement of persons. In 1979, ECOWAS introduced the Protocol on Free Movement of Persons and the Right of Residence and Establishment, which member states ratified in 1980, agreeing to free entry for community citizens without a visa for 90 days until the right of residence and establishment came into force. In 1983, ECCAS introduced provisions on free movement of per-sons, but have yet to implement visa-free travel. COME-SA has two protocols on free movement: the Protocol on the gradual Relaxation and Eventual Elimination of Visa Requirements adopted in 1984, and the Protocol on Free Movement of Persons, Labor Services and the Right of Establishment and Residence adopted in 2001. It also adopted a model law aimed at harmonizing mem-ber states’ immigration policy, but implementation has been very poor. Only four member states have signed the Free Movement protocol and only one has ratified it.
(Share of countries with visas required prior to arrival in African sub-regions)
100
90
80
70
60
50
40
30
20
10
0
Central Africa North Africa West Africa Southern Africa East Africa
World Average
Figure 4.2 Most african regions have visa requirements above world average
Source: WeF (2013)

African Development Report 2014 Regional integration for inclusive growth 55
Shortfalls in implementing policies on free movement of people at the REC level have resulted in the continuation of the restrictive skilled-migration policies and bilateral arrangements governing labor mobility on the continent. Indeed, the trend towards bilateralism and skilled-migration policies only protects the rights of high-skilled workers and do not facilitate the free movement of other workers. In South Africa, for instance, migration is governed by the Refugee Act (1997) and the Immigration Act (2002), which is mainly aimed at facilitating the entry of high-skilled workers for industries in short supply. Current Tripartite negotiations covering COMESA-EAC-SADC also only include the movement of business persons. Meanwhile, sixteen African countries are currently developing restric-tive migration policies: Benin, Burkina Faso, Côte d’Ivoire, Ghana, Guinea, Kenya, Lesotho, Liberia, Libya, Mali, Niger, Nigeria, South Africa, Tanzania, Uganda and Zimbabwe. Both ECOWAS and SADC are also developing migration policies. These trends partly reflect the widespread notion that migration is a national security issue, that there are diverging interests between sending and receiving countries, and a lack of consensus in Africa on the costs and benefits of migration for both sets of countries.
agreements are limited, since citizens of countries with relaxed visa policies still require visas to visit 50-80% of other African countries, and most ECOWAS countries impose stricter visa requirements on external visitors than other countries impose on them.
An approach based on a coalition of willing countries has had success in Africa, and could be promoted further to advance regional migration management. Beyond the eight RECs recognized by the Abuja Treaty, several regional economic groupings in Africa include wide membership overlaps (chapter 2). The West African Economic and Monetary Union (WAEMU) has the most liberal migration policies, with visa-free travel and right to establishment as well as standardized work and travel documents. Only a national identity card is needed to travel from one member state to another. Freedom of establishment is guaranteed for all citizens and the right to work in another member state is effective for most categories of profession. An-other encouraging initiative is the Accelerated Economic Integration Program (APEI) between Malawi, Mauritius, Mozambique, the Seychelles and Zambia, who intend to facilitate mobility of business persons as a first stage.

56 Chapter 4 Managing regional Migration
including Benin, Burkina Faso, Niger and Togo, enabling export-led growth. Landlocked sending countries have also benefited from reducing unemployment and poverty, and increasing human development investments made with incoming remittances (World Bank, 2008).
Yet Africa’s immigration policies remain generally re-strictive. The ‘failure’ of restrictive immigration policies to control migration flows has been measured through spatial, categorical, inter-temporal and reverse substi-tution effects. Instead of reducing migration, these pol-icies cause migrants to change destination, channels or limit returns (De Haas, 2011). Immigration policies introduced in Ghana in the 1960s led to some people passing the porous borders without papers, and others changing destinations and migrating towards Nigeria during the petrol boom. Nigeria subsequently attempted to reduce immigration and conducted expulsions during economic crises in the early 1980s. This redirected one part of the migration flow towards cocoa plantations in Côte d’Ivoire, which then undertook expulsions in the 1990s in an attempt to reduce immigration. In South Africa, there were five times more deportations in 2008 than in 1990, with more than 3 million migrants de-ported in 2008. The main measure of enforcement of such national strategies is expulsion, which is costly for both the receiving countries and for the migrants, and not necessarily a useful strategy for development or for balancing regional labor markets.
Restrictive immigration policies offer little scope for the inclusion of low-skilled migrants, who face structural constraints when left in irregular situations. African RECs could draw lessons from South America’s MERCO-SUR (Southern Common Market) and Andean Commu-nity (CAN), which have moved from narrow schemes to
Recent literature shows that most migration leads mi-grants to higher incomes, better access to education and health, and improved prospects for their children (UNDP, 2009). Gains to the global economy are in the order of 50-100% of world GDP, depending on the migrants’ skill sets (Iregui, 2005; Clemens, 2011). Economists generally favor reducing restrictions to mobility, as free movement of workers would increase world GDP and lead to a more equitable distribution of wealth (Clemens, 2011; Rodrick, 2002; Pritchett, 2006; Tabarrok, 2006) through increased income for migrants and increased remittances. Studies have proven the positive labor market effects of migration, especially of international migration. Migration surveys conducted in Burkina Faso, Nigeria, and Senegal in 2009 show that migration facilitated social mobility from self-em-ployment (often in farming) to wage employment. In Senegal, a shift in labor market status was significant for students migrating (Shimeles, 2010). Further, both for those migrating and those left behind, migration provides opportunities for demographic transition and increased labor market participation. When men mi-grate, women have new decision-making responsibilities. This has opened opportunities for women in countries such as Lesotho, and increased female representation in the workforce.
Labor mobility has also benefited receiving and sending countries, by facilitating labor market integration and closing skills gaps in national labor markets. South Africa benefits from the inflow of mainly male workers from neighboring Zimbabwe and Mozambique for its mines, as well as all other categories of migrants to its numerous growing industries. Côte d’Ivoire’s labor gaps in industry and agriculture, such as the coffee and cocoa indus-try, were filled by migrants from neighboring countries
4.3 Migration Unmanaged

African Development Report 2014 Regional integration for inclusive growth 57
facilitate labor mobility for high-skilled workers toward improved human mobility across their regions. This shows an increased awareness at the regional level of the development opportunities offered by mobility. Mean-while, Africa’s current structural constraints to labor mobility have led to increasing economic, social and spatial disparities, offering migrants few opportunities to break low career ceilings or reduce intergenerational poverty.
4.3.1 Limited skills pooling At the macro-level, African economies face skills short-ages even amid entrenched unemployment and under-employment. To profit from emerging industries such as banking, extractive industries and ICT, African countries need highly skilled and innovative entrepreneurs. But one in every nine Africans who holds a university qual-ification resides in an OECD country (UNDESA, 2013).
Source: afDB (2013).
the South african economy grew rapidly after 2002, exposing skills shortages at the same time as rising unemployment (Bhorat et al., 2002; ellis, 2008). Structural changes along with new products, technology and workplace arrangements led a requirement for new skills (richardson, 2007). the international mining industry faces critical labor shortages at all levels, but some 300 qualified engineers leave South africa every year, and about one-third of South africa’s engineers have already left (Macartney, 2008). South african industry faces the combined challenges of retaining skilled mining staff, producing sufficient new graduates, and replenishing an ageing workforce (Sward, 2009).
In Sierra Leone, skills gaps in the key sectors of agriculture, mining, tourism and banking also affect the country’s economic transformation and private sector growth (afDB, 2013). the education system lacks the capacity to meet growing demands in the private sector. No local institution, for example, offers specialized banking training.
In South africa, the skills crisis led to a new immigration policy. the Immigration act (2002) requires government to publish an annual list of skills in short supply. But at the same time, other initiatives aimed at reducing the inflow of immigrants to counter high levels of general unemployment have affected access to temporary work permits (Crush, 2011).
Sierra Leone’s constitution authorizes discrimination against ‘non-native’ citizens, when regularizing migration could represent a short-term solution to the skills gaps (Chua, 2003). Neighboring Côte d’Ivoire also passed a law in 2004 that effectively gave Ivoirians priority over foreigners in all types of jobs, from qualified to manual labor (Gagnon and Khoudour-Castéras, 2012). Further, the eCOWaS treaty also includes a national treatment obligation, which means that nationals and foreigners should be accorded the same treatment, while there is no mutual recognition of qualifications in eCOWaS.
Box 4.1 Immigration policy tensions in South africa and Sierra Leone
Figure 4.3 Key industries in Sierra Leone face shortages of skilled labor
15000
10000
5000
0
Agriculture Mining Tourism
Gap Available

58 Chapter 4 Managing regional Migration
exacerbate household inequalities (Wouterse and Taylor, 2008; De Haas, 2009). Households receiving remit-tances from outside Africa are in the top consumption quintiles (Hampshire, 2002; Black et al., 2005; Ratha et al., 2011). On the other hand, poorer households who migrate within Africa may benefit greatly in terms of social mobility and inclusion from even small increases in income.
A lack of migration management has a direct and sub-stantial impact on the inclusion of migrants on the con-tinent. Regional economic migration is on the rise, but policies dealing with the integration and inclusion of migrants are considered secondary (Gagnon and Khou-dour-Castéras, 2012). With restrictions on immigration, high costs of travel documents and porous borders, much of intra-African migration is undocumented, so large numbers of migrants remain marginalized3 in ir-regular situations. Regional policies are instead needed to support micro-level resilience measures through mi-gration, in order to reduce the vulnerability of migrants. This would mean encouraging skills development, labor market integration, regional skills pooling and transna-tionalism.4
Reducing systemic disadvantages for migrants would improve their chances of becoming ‘agents of change’ rather than threats to social cohesion. Migrants generally face civil and human rights violations, and are subject to a wide range of abuse. Female migrants are especially vulnerable, and more exposed to risks during migration and in the destination country. Migrants also risk family breakdown, financial loss, fragmentation of networks, discrimination, insecurity, and stress. While they may gain access to jobs abroad, migrants often pay the same taxes as local residents without being able to access
3 “Marginalization occurs when immigrants fail to integrate into the host society at the same time as they break links with fellow countrymen. this is precisely the situation that leads to increased vulnerability and generates high costs for society” (Gagnon and Khoudour-Castéras, 2012:22).4 transnationalism “refers to immigrants [being] perfectly incorporated into host society, while also maintaining strong links with their community of origin, both in sending and receiving countries.” (Gagnon and Khoudour-Castéras, 2012:22)
This skills exodus is among the largest in the world, and is most acute amongst Africa’s least developed countries. Skills shortages are major obstacles to economic growth and job creation, and the most important labor market obstacle for investors (Bhorat et al., 2002; Kraak, 2008; World Bank, 2008).
Africans are widely hindered from practicing their pro-fession in another African country, even in crucial sectors such as health and education, because qualifications are not mutually recognized. Heavily regulated professions, such as engineering, medicine and pharmacology, de-mand standard examinations and accreditation before practice. But policies to address skills shortages are often countered by other policy measures (see Box 4.1).
The informal processes governing migration in Afri-ca reduce the development potential of intra-African migration. Even within RECs, private sector growth is impeded by limited legal and administrative rights for migrants. The private sector’s productivity and competitiveness is hampered by long procedures for visas and work permits, lack of mutual recognition of qualifications, and restrictions on transfer of services. Structural constraints facing migrants include limited rights for land ownership and limited opportunities for dual citizenship. Structural legal changes are needed to attract entrepreneurs and investments to African hubs. Poor migration management in Africa has broad consequences on growth and social inclusion; without effective management, negative links are forming be-tween migration and development.
4.3.2 Structural impacts At the micro-level, regional migration may have a greater impact on poverty reduction than migration out of Af-rica (Wouterse, 2006). Africans who can migrate outside the continent are generally wealthier and better educated than others; migration to the global North requires more social and economic resources than migration to other African countries. Intercontinental migration also yields greater increases in income and livelihood security than intra-African migration, and tends to

African Development Report 2014 Regional integration for inclusive growth 59
Marginalization of migrants can lead to segregation, resulting in the creation of ghettos, urban slums, crime, and the spread of diseases. A recent OECD study found that non-integration of immigrants in the global South has higher socio-economic costs than in the North (Gag-non and Khoudour-Castéras, 2012).
basic services, and face the constant risk of deportation particularly if they are seasonal or irregular workers. The lack of access to basic services generates health risks and low human capital development. Unequal rights for migrants exacerbate social exclusion, and such protract-ed vulnerability can have broad socio-economic costs.

60 Chapter 4 Managing regional Migration
ICT solutions such as mobile education or health care services in regions with poor access to health and edu-cation services could have an important inclusive effect. Additionally, reducing the costs of sending remittances, for example through mobile banking services, would also improve the livelihoods and human development pros-pects of people left behind. Substantial benefits may be gained from improved regional migration management, both in the short and long-term, and at the macro- and micro-levels (see Table 4.3).
Capitalizing on intra-African labor mobility requires moving from immigration control to migration manage-ment. Such a move would require shifts towards mutual recognition of qualifications (for example to facilitate the integration of health professionals, and teachers), transfer of services (such as engineering, accounting, and legal professions) and coordination of annual immigration quotas according to skills gaps. The current trend towards bilateralism and selective skilled-migration policies offer little scope for the inclusion of low-skilled migrants, but instead the risk of generating negative socio-economic costs. Reducing spatial inequalities through innovative
4.4 From Control to Management
Short term Long term
Macro • population size, composition
• Labor market participation
• Geographic distribution of human resources (urbanization)
• Cost of travel documents (visas, work permits)
• health and education expenditures
• Unemployment/wage levels/income distribution
• Level of banking costs and level of remittances
• harmonization of qualifications
• transfer of services (GatS Mode 4)
• Labor market demand and supply
• Fertility and population aging
• Sectoral composition of the economy
• public and private infrastructure
• technological change
• International trade/migration patterns
• Social inclusion
• Cohesion, cross-border relations and crime
• environmental challenges
• Migration management, skills pooling
Short term Long term
Micro • Wages and (un)employment
• Job search
• Skills development
• effects on consumption
• Migrants’ human capital investments, savings
• access to services and housing
• Social security
• Labor market flexibility
• Business practices, right to establishment
• Innovation and entrepreneurship
• Migrant geographical & social clustering
• Networks
• Social mobility across generations
• remittances
Table 4.3 Factors influencing the developmental impact of migration
Source: authors.

African Development Report 2014 Regional integration for inclusive growth 61
Source: authors.
education, medical schools and dental schools. Efforts are also underway in the EAC for the mutual recognition of qualifications, while the African and Malagasy Council for Higher Education which includes 19 member states aims at certifying university programs for recognition in member states. To facilitate regional skills pooling, fast-tracking of curricula standardization is needed, or at least a mutual recognition of qualifications within RECs.
African countries would benefit from liberalizing the transfer of services through the World Trade Organiza-tion’s (WTO’s) General Agreement on Trade in Services (GATS) Mode 4. Skills gaps are among the key reasons for inadequate private sector growth in the continent, yet African countries have generally not been involved in negotiated market opening and rules related to services trade (Sauvé and Ward, 2012). GATS Mode 4 is currently the only internationally-agreed legal instrument with the potential to become a functioning multilateral labor migration regime (Broude, 2007). It is an international mechanism aimed at facilitating labor mobility on the basis of qualified negotiated commitments by states to accept non-permanent foreign labor migrants. At the Eighth WTO Ministerial Conference in 2011, trade ministers adopted a waiver, enabling WTO members to provide preferential treatment to services and service suppliers for least developed countries (LDCs), most of which are in Africa. But so far no WTO member has made a request for preferences or come forward with pledges. Countries with more liberal regimes may provide good examples (see Box 4.2).
4.4.1 Development benefitsAt a macro-level, immigration quotas, regional skills pooling, and educational reform should be implemented to address skills shortages in national labor markets. Skilled labor is more important to development and global value chains than ever before, so the lack of effec-tive regional migration management will increase skills gaps. The mismatch of demand and supply of skills in national labor markets across Africa, resulting from the brain drain, deepen these gaps. A skill shortage occurs whenever a particular occupation lacks enough work-ers, when labor demand exceeds availability of skills, or when workers lack appropriate qualifications (Barnow et al., 1998; Shah and Burke, 2003; Trendle, 2008). The skills shortages problem is often perceived only from the perspective of a weak education and training system. However, the high levels of brain drain in key sectors across Africa suggest that educational reform should not be the only resilience measure to address skills shortages. Further, evidence confirms the importance of regional integration in the efforts needed to diversify African economies and absorb 10 million new entrants to the labor force annually (World Economic Forum et al., 2013). African countries and regions stand to gain from harmonizing annual immigration quotas with skills gaps.
The harmonization of professional accreditation and mutual recognition could help narrow the large skills gap, as well as regulations concerning the right to estab-lishment for doctors, engineers and skilled labor from other heavily regulated professions in other African countries. Since 2011, the EAC has been moving towards standardization of curricula at university level in health
rwanda’s migration policy stands out in africa. the country has introduced visas-upon-arrival for all africans at rwandan borders, combined with biometric border management and e-visas. rwanda requires no work permits for eaC citizens, and takes a liberal approach to the GatS Mode 4 cross-border services aspect, imposing no restrictions on the practice of foreign law and only a few on domestic law. Both rwanda and Uganda automatically recognize academic and professional qualifications as well as licenses obtained in other jurisdictions, such as for engineering. But Uganda imposes entry restrictions on engineering and legal services, while Kenya and tanzania impose de jure or de facto nationality requirements to practice domestic law thereby excluding foreign professionals⎯even though Kenya lacks mid-level technicians on the national labour market (World Bank, 2010). rwanda, through its liberal approach to recognizing qualifications and transfers of services, has filled positions for which local professionals were not locally available, such as english teachers, and thereby contributed to regional trade.
Box 4.2 Learning from rwanda’s liberal migration policy

62 Chapter 4 Managing regional Migration
senders of remittances in Africa lose an estimated USD 15 billion a year because of the high fees, burdensome documentary requirements, and lack of competition in the money transfer market (World Bank, 2011). An underdeveloped financial infrastructure and weak reg-ulatory environment exacerbate these problems (see Chapter 5).
Poverty is a strong constraint to geographic and social mobility for people who have the capital to migrate to neighboring countries, as they are often left in a situ-ation of irregularity. The social costs of marginalizing migrants include risks to health, human capital and social cohesion. Access to basic services, such as health and education, is therefore vital to make migration a win-win situation (De Haas, 2012). Finally, addressing the gender dimension at all stages of migration can help empower women socially and financially, both for women migrants and for women left behind. In conclusion, cur-rent constraints to intra-African mobility hinder social mobility and inclusive growth, which depends greatly on the capability of the most disadvantaged social groups to participate in building national and regional wealth and to receive, in return, a rewarding share of that growth.
References
Adams, Richard H. (2004) ‘Remittances and Poverty in Gua-temala’, World Bank Policy Research Working Paper, 3418, Washington, DC: World Bank.
Adepoju, Aderanti (2006) ‘Policy-driven research on interna-tional migration in sub-Saharan Africa,’ in Kristof Tamas and Palme Joakim (eds) How Migration Can Benefit Development: Bridging the Research and Policy Gap, Stockholm: Institute for Futures Studies, pp. 69-84.
AfDB (2013) Sierra Leone Skills Gap Analysis, Tunis: African Development Bank Group.
Ally, Sajida and MRI (2006) ‘Migration from the Human Rights Perspective,’ Migrants’ Rights International (MRI) Workshop held in the United Nations on the September 15, 2006.
At the micro-level, regional policies should build incen-tives to ensure equitable access to quality public health care and to prevent migration from negatively affecting human development in regions and countries with high out-migration of skilled workers. Regional migration management has the potential to reduce negative social effects for migrants but also for people left behind. The highest levels of brain drain occur in least developed countries, and insufficient ‘pull’ mechanisms in un-derserved areas are negatively affecting human capital development. With regard to both health services and education, the mobility of skilled workers affect the quality of service delivery in origin countries. Those who can afford to migrate in order to acquire educational and medical services abroad do so. But for those left behind, migration can entrench traditional roles and inequalities in the origin countries and produce negative social effects arising from a lack of basic services. Innovative solutions to counter brain drain and reduce spatial inequalities, for example through ICT, could provide access to mobile education and health care services.
Reducing the cost of sending remittances, for exam-ple, through innovative mobile solutions, remains an important element in making growth more inclusive for sending countries. When poor households receive remittances, it can have a strong positive effect on social inclusion (Adams, 2004). Remittances from the African diaspora amounted to nearly USD 40 billion in 2010 or 2.6% of the continent’s GDP, providing vital funds for investment and household consumption (Ratha et al., 2011). In several fragile states, remittances may exceed 50% of GDP. Nonetheless, high costs of sending remit-tances within Africa hamper their positive impact on financial inclusion and poverty alleviation as well as possible benefits to the health and schooling of children in low-income households. Sub-Saharan Africa has the highest transfer costs of remittances in the world, and the costs of intra-African remittances are especially high. The cost of sending USD 200 between Burkina Faso and Ghana is, for example, USD 32 (16%), and between Burkina Faso and Côte d’Ivoire it reaches USD 18 (9%) (Ratha et al., 2011). A large share of remittances are, therefore, sent through informal channels. Recipients and

African Development Report 2014 Regional integration for inclusive growth 63
Crush, Jonathan (2011) ‘Complex Movements, Confused Re-sponses: Labour Migration in South Africa,’ Southern African Migration Programme (SAMP) Migration Policy Series), No. 25.
De Haan, Arjan (1999) ‘Livelihoods and Poverty: The Role of Migration,’ Journal of Development Studies 36, No. 2, pp. 1-47.
De Haas, Hein (2009) ‘Mobility and Human Development,’ UNDP Human Development Research Paper Series, Vol. 1, No. 2009, United Nations Development Programme (UNDP).
De Haas, Hein (2010) ‘Migration Transitions: a Theoretical and Empirical Inquiry into the Developmental Drivers of Interna-tional Migration,’ Working Paper, No. 24, Oxford: International Migration Institute.
De Haas, Hein (2011) ‘The Effects of Integration and Trans-national Ties on International Return Migration Intention,’ Demographic Research 25, pp. 755-82.
De Haas, Hein (2012) ‘The Migration and Development Pen-dulum: A Critical View on Research and Policy,’ International Migration, No. 50, pp. 8–25.
Dodson, Belinda, Hamilton Simelane, Daniel Tevera, Thuso Green, Abel Chikanda, and Fion de Vletter (2008) ‘Gender, Migration and Remittances in Southern Africa,’ Migration Policy Series, Vol. 49, Cape Town: Southern African Research Centre.
Economic Community of West African States (ECOWAS) (2007) ‘Meeting of Ministers on ECOWAS Common Approach on Mi-gration,’ Draft of ECOWAS Commission on June 14, 2007, in Abuja, Nigeria.
Ellis, Frank (2000) Rural Livelihoods and Diversity in Developing Countries, Oxford: Oxford University Press.
Ellis, Stephen (2008) ‘South Africa and International Migration: The Role of Skilled Labour,’ in Aurelia Wa Kabwe-Segatti and Loren Landau (eds) Migration in post-Apartheid South Africa: Challenges and Questions to Policymakers, Agence Française de Dévelopment, pp. 115-134.
Bakewell, Oliver (2009) ‘South-South Migration and Human Development: Reflections on African Experiences,’ Human De-velopment Research Paper Series (HDRP) 1, No. 2009, Inter-national Migration Institute.
Barnow, Burt S, John Trutko, and Robert Lerman (1998) ‘Skill Mismatches and Worker Shortages: The problem and appropriate responses,’. Urban Institute Policy Memorandum prepared for the US Department of Labor, Washington DC.
Bensaad, Ali (2005) ‘Les Migrations Transsahariennes, Une mon-dialisation par la Marge,’ Maghreb-Machrek, No. 185, pp. 13-36.
Bhorat, Haroon, Jean-Baptiste Meyer, and Cecil Mlatsheni (2002) ‘Skilled Labour Migration from Developing Countries: Study on South and Southern Africa,’ International Migration Papers, No. 52, Geneva: International Labour Office.
Black, Richard, Natali Claudia, and Jessica Skinner (2005) ‘Mi-gration and Inequality,’ Background paper for World Bank’s World Development Report 2006, Washington DC: World Bank.
Bredeloup, Sylvie (1995) ‘Expulsion des ressortissants ouest africains au sein du continent africain (1954-1995)’, Mondes en développement 23, No. 91, pp. 117-129.
Broude, Tomer (2007). The WTO/GATS Mode 4, International Labour Migration Regimes and Global Justice, Hebrew University of Jerusalem. Available from: http://www.worldtradelaw.net/articles/broudemode4.pdf
Castles, Stephen and Mark Miller (2009). The Age of Migra-tion: International Population Movements in the Modern World, Basingstoke and New York: Palgrave-Macmillan and Guilford.
Chua, Amy (2003) World On Fire: How Exporting Free-market Democracy Breeds Ethnic Hatred and Global Stability, New York: Knopf Doubleday Publishing.
Clemens, Michael (2011) ‘Economics and Emigration: Tril-lion-Dollar Bills on the Sidewalk?,’ Journal of Economic Per-spective 25, No. 3, pp. 83-106.
Crush, Jonathan and David McDonald (2002) Transnationalism and New African Immigration to South Africa, Toronto: Canadian Association of African Studies.

64 Chapter 4 Managing regional Migration
Jeff Crisp (eds) Poverty, International Migration and Asylum, New York: Palgrave Macmillan.
King, Russel and Ronald Skeldon (2010) ‘‘Mind the Gap’ Inte-grating Approaches to Internal and International Migration,’ Journal of Ethnic and Migration Studies 36, No. 10, pp. 1619-1646.
Khachani, Mohamed (2008) ‘La Migration Circulaire: Cas du Maroc,’ CARIM Analytic and Synthetic Notes 2008/7, Florence: European University Institute.
Klein, S. (2006), Speech delivered on the Berne Initiative, launched by the Swiss Federal Office for Refugees at the Inter-national Symposium on Migration and Development, in United Nations, International Organization for Migration and United Nations Population Fund, Towards the 2013 High-Level Dialogue on International Migration and Development, Final Report of the High-Level Dialogue Series, IOM, Geneva. Available from: http://publications.iom.int/bookstore/free/HLD_Series_Final-Report_IOM_UNDESA_UNFPA_English.pdf
Kraak, Andre (ed.), (2008) Human Resources Development Review: The Education-Economy Relationship in South Africa 2001–2005, Cape Town: Human Sciences Research Council (HSRC) Press.
Lassailly-Jacob, Veronique, Florence Boyer, Julien Brachet (2006) South-South Migration: Example of Sub-Saharan Africa, Study of Policy Department, European Parliament, Brussels: European Parliament.
Macartney, Adrian (2008) Skills Shortages in the International Mining Industry now at Critical Levels, Johannesburg: Ernst & Young.
McCord, Anna and Haroon Bhorat (2003) Employment and Labour Market Trends in Human Resources Development Review 2003, Education, Employment and Skills in South Africa, Cape Town: HSRC Press.
Massey, Douglas (2009) ‘The Political Economy of Migration in an Era of Globalization,’ in Samuel Martinez (eds) International Migration and Human Rights: The Global Repercussions of US Policy, California: University of California Press, pp. 25-43.
Gagnon, Jason and David Khoudour-Castéras (2012) ‘South-South Migration in West Africa: Addressing the Challenge of Immigrant Integration,’ Working Paper, No. 312, Paris: OECD Development Centre.
Gnisci, Donata (2008) West African Mobility and Migration Policy of OECD Countries, Paris: OECD Publishing.
Grote, Ulrike and Koko Warner (2010) ‘Environmental change and migration in Sub-Saharan Africa,’ International Journal of Global Warming 2, No. 1, pp. 17-47.
Hampshire, Kate (2002) ‘Fulani on the Move: Seasonal Eco-nomic Migration in the Sahel as a Social Process,’ Journal of Development Studies 38, No. 5, pp. 15 – 36.
Hampshire, Kate and Sarah Randall (1999) ‘Seasonal Labour Migration Strategies in the Sahel: Coping with Poverty or Opti-mising Security?,’ International Journal of Population Geography 5, pp. 367 – 385.
Hatton, Timothy and Jonathan Williamson (2001) ‘Demographic and Economic Pressure on Emigration out of Africa,’ IZA Dis-cussion Paper, No. 250, Bonn: Institute for the Study of Labour.
Henry, Sabine, Bruno Schoumaker, and Cris Beauchemin (2004) ‘The impact of rainfall on the first out-migration: a multi-level event-history analysis in Burkina Faso,’ Population and Envi-ronment 25, No.5, pp. 423-460.
Hugo, Graeme (1991) ‘Changing Famine Coping Strategies Under the Impact of Population Pressure and Urbanization: The Case of Population Mobility,’ in Hans Bohle et al. (eds) Famine and Food Security in Africa and Asia: Indigenous Response and External Intervention to Avoid Hunger, Bayreuth: Bayreuther, pp. 127-148.
Hugo, Graeme (2013) ‘Famine and Migration,’ The Encyclopedia of Global Human Migration Oxford: Wiley Blackwell.
International Labour Organization (ILO) (2012) World of Work Report: Better Jobs for a Better Economy, Geneva: ILO.
Iregui, Ana Maria (2005) ‘Efficiency Gains from the Elimination of Global Restrictions on Labour Mobility,’ in George Borjas and

African Development Report 2014 Regional integration for inclusive growth 65
Shaw, W. (2007), Migration in Africa: A Review of the Economic Literature on International Migration in 10 Countries, World Bank, Washington D.C.
Shimeles, A. (2010), ‘Migration Patterns, Trends and Policy Issues in Africa,’ Working Paper Series no. 119, African Devel-opment Bank Group, Tunis.
Sward, J. (2009), ‘Migration and the Financial Crisis: How Will the Economic Downturn Affect Migrants?,’ Briefing no. 17 of the Development Research Centre on Migration, Globalisation & Poverty, Brighton: Sussex Centre for Migration Research.
Stark, O. and E. Taylor (1991), Relative Deprivation and Migra-tion: Theory, Evidence and Policy Implications, Policy Research Working Paper no. 656, World Bank, Washington D.C.
Stern, N. (2006), The Stern Report on the Economics of Climate Change, Cambridge University Press, Cambridge.
Tabarrok, A. (2006), ‘Why Ruin the World´s Best Anti-Poverty Program?,’ Commentary for The Independent Institute delivered on May 25, 2006.
Taylor, J. E. (1999), ‘The New Economics of Labour Migration and the Role of Remittances in the Migration Process,’ Inter-national Migration, vol. 37, No. 1, pp. 63-86.
Trendle, B. (2008), Skill and Labour Shortages — Definition, Causes and Implications, Working Paper 54, Labour Market Research Unit, Queensland Government Press, Queensland.
United Nations Department of Economic and Social Affairs (UNDESA) (2011), International Migration in a Globalizing World: The Role of Youth, Technical Paper no. 2011/1, United Nations, New York.
UNDESA (2013), Trends in International Migrant Stock: The 2013 Revision- Monitoring Global Population Trends, UNDESA.
UNDP (2009), Overcoming Barriers: Human Mobility and Devel-opment, Human Development Report 2009, UNDP, New York.
World Economic Forum (2013), ‘Reducing Barriers to Economic Growth and Job Creation,’ in WEF, The Travel and Tourism Competitiveness Report 2013, World Economic Forum, Geneva.
Myers, Norman (2002) ‘Environmental Refugees: a Growing Phenomenon of the 21st century,’ Philosophical Transactions Biological Sciences 357, No. 1420, pp. 609-613.
Naudé, Wim (2010) ‘The Determinants of Migration from Sub-Saharan African Countries,’ Journal of African Economies 19, No. 3, pp. 330-356.
Pritchett, L. (2006), Let Their People Come: Breaking The Gridlock on International Labour Mobility, Center for Global Develop-ment, Washington DC.
Quinn, M. (2006), ‘Relative Deprivation, Wage Differentials and Mexican Migration,’ Review of Development Economics, vol. 10, no. 1, pp. 135-153.
Ratha, D. and W. Shaw (2007), South-South Migration and Remittances, World Bank Development Economics Prospects Group, Washington, D.C.
Ratha, D., S. Mohapatra, C. Ozden, S. Plaza, W. Shaw and A. Shimeles (2011), Leveraging Migration for Africa: Remittances, Skills and Investments, World Bank, Washington D.C.
Richardson, S. (2007), What is a Skill Shortage? National Institute of Labour Studies, Flinders University, Adelaide.
Rodrick, D. (2002), Comments at the conference on ‘Immigra-tion Policy and the Welfare State.’ In T. H. Boeri, H. Gordon and B. McCormick (eds.), Immigration Policy and the Welfare System, Oxford University Press, Oxford.
Sauvé, P. and N. Ward (2012), The Preferential liberalization of Trade in Services: African Perspectives and Challenges, Swiss National Centre of Competence in Research – NRCC Trade Working Paper number 2012/01, January 2012. Available from: http://www.wti.org/fileadmin/user_upload/nccr-trade.ch/wp2/publications/African_PTAs_Services_Sauve_Ward_Up-load_5%20January%202012.pdf
Shah, C. and G. Burke (2003), ‘Skill shortages: Concepts, Meas-urement and Implications,’ in P. Penelope, E. Baker, and B. McGaw (eds), International Encyclopedia of Education, Elsevier, Oxford, pp. 320-327.

66 Chapter 4 Managing regional Migration
World Bank (2011), Migration and Remittances Factbook 2011, World Bank Publications no. 2522, World Bank, Washington DC.
Wouterse, F. (2006), Survival or Accumulation: Migration and Rural Households in Burkina Faso, Wageningen University and Research Centre, Wageningen.
Wouterse, F. and E. Taylor (2008), ‘Migration and Income Di-versification: Evidence from Burkina Faso,’ World Development, vol. 36, no. 4, pp. 625-640.
World Economic Forum, the International Bank for Recon-struction and Development/the World Bank, AfDB, and the Ministry of Foreign Affairs of Denmark (2013), The Africa Competitiveness Report 2013, World Economic Forum, Geneva.
World Bank (2000), ‘Voices of the Poor,’ World Bank Report, vol. 1, Oxford University Press, Oxford [Published for the World Bank, New York].
World Bank (2008), Working out of Poverty: Job Creation and the Quality of Growth in Africa, World Bank Publications no. 6434, World Bank, Washington D.C.
World Bank (2010), Reform and Regional Integration of Pro-fessional Services in East Africa: Time for Action, World Bank Report no. 57672-AFR, World Bank, Washington, D.C.

Chapter 5
Harnessing Regional Financial Integration

68 Chapter 5 harnessing regional Financial Integration
Finance is important for growth. Financial deepening has contributed to growth in Africa, and could contribute further to GDP growth if financial development matched that in East Asia’s low-middle income countries (Beck et al, 2011). African financial systems are limited in size and capacity, which undermines their potential to contribute to growth. Harnessing opportunities offered by regional financial integration could foster financial sector devel-opment and economic growth. It is well accepted that regional financial integration contributes substantially to economic growth by setting the conditions and providing opportunities that enable better risk sharing and phase-out
5.1 Introduction
of constraints, such as low competition and high trans-action costs. Regional financial integration may also en-large domestic market size, broaden and deepen financial systems, achieve economies of scale, and contributes to the availability and more efficient allocation of resources.
Financial integration in Africa is progressing with cross-border banking, developing capital markets and financial infrastructure. Cross-border banking is eco-nomically significant, as some African banks carry a systemic importance in jurisdictions beyond their home countries. These dynamics clearly respond to the need
68

African Development Report 2014 Regional integration for inclusive growth 69
may undermine core financial inclusion principles which should be the basis for any integration process. Unfavora-ble or weak entry conditions in the integration processes may also obstruct inclusive growth.
This chapter explores how regional financial integration could maximize its contribution to inclusive growth. The next section discusses the recent trends and develop-ments in regional financial integration and its potential to foster inclusive growth. The following section investigates the barriers that may prevent it contributing to inclusive growth. The final section offers policy recommendations to address the challenges.
to enlarge domestic market size, better pool resources, share risks and allocate them efficiently. Capital markets in the continent are increasingly making progress within the processes of regional integration to respond to the need to lengthen maturities and ensure a more efficient pooling and intermediation of long term financing. Re-gional capital markets may well bring about economies of scale and efficiently collect, process information and offer opportunities for investors to share risks. Several initiatives are being put in place at the regional level to better reap the benefits of financial markets integration in Africa.
Regional financial integration could contribute further to African economic growth through the development of regional financial infrastructure. Regional financial infrastructure includes payment systems, credit registries, and the regulatory and supervisory framework. National payments systems have lagged, but the regionalization of payment systems could help take advantage of the economies of scale related to financial integration while phasing out the frictions and barriers to financial flows. Several initiatives are being put in place to that effect. In the context of a rapidly changing environment, reg-ulation and supervision of the financial systems is key to reaping the benefits of regional financial integration, including inclusive economic growth. Regional financial integration could generate additional sources of risks and a conduit for contagion that calls for a need to safeguard the financial systems by putting in place appropriate mitigation measures. African authorities have already made some progress in upgrading their regulatory and supervision systems and attempts at convergence to the international standards.
While regional financial integration efforts have con-tributed to Africa’s favorable economic growth perfor-mance, its potential has not been sufficiently harnessed for inclusive economic growth. Indeed, the way regional financial integration processes are implemented in Africa may not be conducive to guaranteeing inclusive economic growth. More efforts are needed to foster cross-border banking, capital markets and payment and information systems. The processes of regional financial integration

70 Chapter 5 harnessing regional Financial Integration
greenfield FDI projects between 2003 and 2014, and four large African banking groups are present in at least 18 countries, with Ecobank in 32 countries. By contrast, only 18% of incoming FDI projects originating outside Africa were in financial services, and the largest foreign banking group, Société Générale, is present only in 17 countries (see Table 5.1).
Cross-border banking has been a visible form of region-al financial integration in Africa. Large South African banks (Standard Bank Group, Barclays Africa Group)
5.2.1 Cross-border bankingCross-border banking activities led by African banks are on the rise on the continent. Cross-border banking is a main feature of African financial systems, due partly to progress in regulatory reforms and the appetite of large banking groups to do business beyond borders. In recent decades, some large African banking groups have widened their regional footprint compared to foreign banks, making financial services the dominant sector for intra-African Foreign Direct Investment (FDI). Finan-cial services accounted for around 50% of intra-African
5.2 recent trends and developments in regional financial integration and inclusive growth
Name Location of headquarters
Majority ownership/ largest minority shareholder
Number of African countries
International Société Générale France France 17
Citigroup USa USa 15
Standard Chartered UK UK 14
BNp paribas France France 13
african ecobank togo South africa 32
United Bank for africa (UBa) Nigeria Nigeria 19
Standard Bank Group (Stanbic) South africa South africa 18
Banque Marocaine du Commerce extérieur (BMCe)
Morocco Morocco 18
Banque Sahélo-Saharienne pour l’Investissement et le Commerce (BSIC)
Libya Libya 14
attijariwafa Bank Morocco Morocco 12
Banque Centrale populaire du Maroc (BCp)
Morocco Morocco 11
Barclays africa Group South africa UK 10
Table 5.1 Major cross-border banks in africa
Source: adapted from Beck et al. (2014).

African Development Report 2014 Regional integration for inclusive growth 71
Figure 5.1 expanding african banking groups
Source: authors, adapted from bank sources.
a. BMCe B. attijariwafa Bank
C. UBa D. access Bank
e. ecobank F. Standard Bank Group

72 Chapter 5 harnessing regional Financial Integration
- Attijariwafa bank group - holds about 22% of bank assets, Standard bank group holds 47% of bank assets in Lesotho, and Ecobank possesses about 40% of bank assets in Liberia and Central Africa Republic (see Figure 5.2). The banks also play a significant role in financial markets and payment systems (Lukonga and Chung, 2010). These dynamics clearly respond to the need to enlarge domestic market size, broaden and deepen financial system and achieve economies of scale. The need to diversify risks is also a determinant.
Cross-border banks may be better equipped to target under-served segments of markets, due to their capacities to diversify risk, tap into parent companies’ expertise, and manage risks effectively. Some cross-border banks have displayed abilities to foster financial inclusion-led strategies while targeting unbanked people at the low end market. Equity Bank of Kenya intends to expand its agent and mobile banking model to serve unbanked people in the EAC region, while Ecobank of Gambia is promoting micro-savings for unbanked people in rural and urban
are increasingly widening their presence outside of South Africa and are represented through subsidiaries in the western, eastern, southern and central parts of the continent, Moroccan Banks (Banque Marocaine du Commerce Extérieur - BMCE and Attijariwafa Bank) are increasing their footprint in western, northern and central parts while large Nigerian Banks (United Bank for Africa, Access Bank, Guaranty Trust Bank Plc) are going east and central and the pan-African Bank, Ecobank is serving roughly two-third of African countries (see Figure 5.1). These trends have been largely influenced by financial liberalization, favorable regulation changes in both home and host countries (Beck, 2014), limited business opportunities in domestic markets, and positive demonstration effects from outside Africa (Lukonga and Chung, 2010).
Notwithstanding geography, economics matter in cross-border banking. Some of these banks hold signif-icant asset shares in the banking systems of their host countries (Beck et al, 2014). The first bank in Senegal
Ecobank Standard Bank Attijariwafa Bank50
45
40
35
30
25
20
15
10
5
0
25
20
15
10
5
0
Liberia
Central A
frica
n Republic
Guinea
Guinea-Biss
auTo
goChad
Burkina FasoBenin
Niger
Lesoth
o
Namibia
Uganda
Botswana
Malawi
Swaziland
Mozam
bique
Zambia
Zimbabwa
SenegalMali
Camero
onMali
Cote d’Iv
oire
Senegal
Rwanda
Figure 5.2 Selected banks and asset shares in host countries, 2011 (%)
Source: adapted from Beck et al. (2014).

African Development Report 2014 Regional integration for inclusive growth 73
areas of Gambia. Cross-border banking groups with a diversification strategy among different subsidiaries allow for more risk-taking in some jurisdictions. While they can tap into expertise made available by parent com-panies (Alade, 2011), they also have risk management capacities that enable proper assessment of underlying risks, particularly in lending to underserved segments of markets. The Mauritius Commercial Bank’s ‘Bank of Banks’ initiative (see Box 5.1) shows how cross-border banks leverage their footprint, expertise and capacities to offer trade finance-related services to a wide range of financial institutions on the continent.
In several countries, cross-border banks lead financial innovation, supplying tailored financial services. With the entry of large banking groups, cross-border banking offers opportunities to foster financial innovation and competition in the banking sector, leading to a better delivery of new financial products (such as use of Au-tomated Teller Machines (ATMs), internet or mobile banking), reduced service costs, and improved efficiency
Source: authors, adapted from MCB.
Mauritius Commercial Bank (MCB) is the leading bank in Mauritius, holding a 40% market share of both domestic loans and deposits. Based in Mauritius, it has a regional presence across three more african countries: Madagascar, Mozambique and Seychelles. It is now expanding into other african countries, including Ghana and Kenya.
In its regional expansion strategy aimed at developing a network of strategic partner banks in africa, MCB launched its ‘Bank of Banks’ initiative in 2008. Under this program, MCB seeks to leverage its regional growth prospects, market expertise and technology to position itself as a regional financial platform that offers a range of trade finance and other services to african banks and financial institutions.
By this initiative, MCB has been able to finance major projects with high socio-economic and inclusive development impacts across sub-Saharan africa and provide tailored financial services (including trade finance, payments, cards operations, internal audit and project management assignments) to more than 70 financial institutions in more than 30 african countries. In its pipeline, MCB works with 14 banks in eight countries across West africa (Nigeria and Ghana) and east africa (Democratic republic of Congo, Kenya, rwanda, Uganda, tanzania and Zambia), providing letter of credit, business support and technical assistance.
Box 5.1 Mauritius Commercial Bank’s Bank of Banks initiative
A. Within west Africa B. Within east Africa
Average total cost (%)
for sending USD 200
Average total cost (%)
for sending USD 500
C. Within southern Africa20
18
16
14
12
10
8
6
4
2
0
25
20
15
10
5
0
25
20
15
10
5
0Average total
cost (%) for sending
USD 200
Average total cost (%)
for sending USD 500
Average total cost (%)
for sending USD 200
Cross-border banks Others
16,71
Average total cost (%)
for sending USD 500
11,81
8,29
6,94
19,7618,90
9,52 9,60
20,47
17,24
10,6 11,67
Figure 5.3 Cross-border banks and intra-regional remittances
Source: authors, from the World Bank’s database on remittances prices (www.remittanceprices.worldbank.org).
Notes: the sample of financial institutions used above may not be fully representative

74 Chapter 5 harnessing regional Financial Integration
increasingly active in providing mobile banking servic-es for unbanked people. Since 2012, the Pan-African EcoBank and mobile operator Airtel (both with wide regional coverage) have teamed up to provide mobile banking services to their common customers, illustrat-ing the comparative advantage of cross-border banks in enlarging a regional clients base for these services. EcoBank is present in over 80% of the countries where Airtel is based. Under this initiative, both entities can launch mobile financial services that will allow customers to send and receive money, pay their utility bills, and access their bank accounts using their mobile phones.
5.2.2 Capital markets developmentCapital markets in Africa remain under developed. Some countries have tried to establish national capital markets and move away from a bank-concentrated financial system (Beck et al, 2011), and the stock mar-kets in Africa whose number has risen from 5 in 1990 to 29 now represent 38 nations (Gatebi, 2014). Yet, in spite of the rapid economic growth in recent years, the development of domestic capital markets in many
which may promote access to credit at affordable costs (Detragiache et al., 2008). Cross-border banks offer more affordable remittance services (see Figure 5.3), and can reduce transaction costs for larger amount transfers, as they already have the necessary financial and IT plat-forms in place. Indeed, cross-border banks in Africa may have a comparative advantage in the provision of new financial services and products, supplying them in ways that ease and enlarge access to financial services for households and firms. Standard Chartered Bank’s ‘border-less banking’ program, for example, supports the regional expansion of SMEs trading across East Africa by offering them competitive SME-dedicated banking services regardless of their location.
Cross-border banking may also bring financial innova-tions such as branchless banking and technology-based service delivery. Following the success of M-Pesa in Kenya, mobile phone-based financial transactions have widely gained popularity in Africa, with Kenya and South Africa at the forefront. Mobile banking services have helped to improve access to finance for unbanked economic actors. Cross-border banking groups are
Total Market Capitalization (Billion USD) Total Number of Listed Companies
2.000
1.500
1.000
500
-
2.000
1.500
1.000
500
02005 20122006 2007 2008 2009 2010 2011
EAC North AfricaECOWAS SADC
2005 20122006 2007 2008 2009 2010 2011
Figure 5.4 total market capitalization and listed companies
Source: authors’ calculation using data from the african Securities exchanges association.

African Development Report 2014 Regional integration for inclusive growth 75
process would promote deeper capital markets, a single pool of liquidity, and a greater range of financial services and products, while offering investors the opportunity to share risks across countries. Several initiatives are emerg-ing at the regional level to tap the benefits of financial market integration in Africa, including the establishment of regional stock exchanges, allowing cross-listing in the regions (Beck et al, 2011), and the creation of platforms and technologies to facilitate development of the capital markets. African RECs play an important role in sup-porting regional capital market integration through the establishment of supra-national markets; the cooperation of their existing markets; and the establishment of inte-grated regional capital markets and regulatory bodies. Moreover, government initiatives at both national and regional levels have been launched to create an enabling environment for cross-border transaction and trading of bonds.
Africa’s RECs have been active in promoting capital markets integration initiatives, recognizing their im-portance in savings mobilization, resource allocation, capital formation and fostering more efficient and re-silient capital markets in the region. The West African Economic and Monetary Union (WAEMU) and the
African countries has been disappointing in terms of market capitalization and number of listed securities. The total market capitalization of stock exchanges in Africa has remained low, representing less than 2% of the world total (see Figure 5.4). The Johannesburg Stock Exchange (JSE) accounts for about 65% of the total Af-rican market capitalization, while most of Africa’s stock exchanges are very small and highly fragmented. Levels of liquidity in African capital markets are extremely low, except in the JSE and the Egyptian Exchange. The thinness and illiquidity in Africa’s domestic capital mar-kets have seriously undermined their ability to attract portfolio investments and mobilize financial resources. Integrating stock exchanges at a regional level would better harness capital markets’ potential for supporting sustainable and inclusive growth.
Capital markets could contribute more to inclusive growth. With Africa’s conducive economic environment and high returns and improvements in capital market ac-cess, foreign investors are moving away from low-return developed countries to explore African markets. Leading stock markets are emerging, to play a critical role in the financial integration process, while facilitating allocation of resources and investments within sub-regions and across the continent. Equity markets in South Africa and Nigeria are among the largest in the world relative to their economies. As reported by Gatebi (2014), the JSE has evolved into a modern securities exchange with fully electronic trading, clearing and settlement in equities, financial, interest rate and commodity derivatives and bonds as well as FX products. Leading capital markets are also innovating through the development of new financial services to meet the investors’ demand. A recent Eurobond issuance by Kenya secured bids amounting to USD 8 billion and was oversubscribed by USD 6 billion. While these developments provide some hope for capital markets, more is needed at the regional level to reap the benefits of financial integration.
Regional capital markets may be more efficient than national ones in collecting and processing information from different sources, and reflecting this information in prices for the benefit of a larger set of investors. The

76 Chapter 5 harnessing regional Financial Integration
and ensuring clearing and settlement systems align with global standards.
The regional integration of African capital markets is also illustrated by the emergence of cross-border list-ing of securities. Economic zones like ECOWAS have been increasingly active in listing securities, with the regulatory rules on some individual and supranational stock exchanges (notably the BRVM, the Nigeria Stock Exchange and the Ghana Stock exchange) allowing for-eign companies to have multiple and cross-border listing. Within ECOWAS, the Nigerian Stock Exchange, Ghana Stock Exchange, Sierra Leone Stock Exchange and the BRVM are working on integrating their markets, includ-ing cross-listing of stocks on the exchanges, and allowing traders to trade directly across exchanges. The Common Market for Eastern and Southern Africa (COMESA) also intends over time to create a single financial services market in support of regional integration. In addition, capital markets regional integration in Africa is actively occurring through cross-border trading of financial assets on individual national stock exchanges in East African
Central African Economic and Monetary Community (CEMAC) have established regional stock exchanges: the Bourse Régionale des Valeurs Mobilières (BRVM) and the Bourse des Valeurs Mobilières d’Afrique Centrale (BVMAC). The ECOWAS capital market integration process took off with the inauguration of the West Af-rican Capital Markets Integration Council (WACMIC) in January 2013, and the establishment of a Technical Committee to review the Central Securities Depositories’ (CSD) rules, and help harmonize listing, trading and settlement rules as well as legal frameworks. The East Africa Community (EAC) has launched an integration process of domestic markets within its Financial System Development and Regionalization Project (FSDRP), with a view to broadening and deepening the financial markets through the establishment of a single financial market and the development of a broad range of financial products and services. The ten stock exchanges of the SADC are working together to increase the effectiveness of their markets, and the Committee of SADC Stock Ex-changes (CoSSE) has agreed to support regional moves toward more efficient capital markets, by exploring the use technology to link their trading and order systems
Total Amount Treasury Bonds Issued (Billion USD) Total Amount Treasury Bonds Outstanding (Billion USD)
300
250
200
150
100
50
0
Central Africa North AfricaEast Africa Southern Africa West Africa
2005 20122006 2007 2008 2009 2010 2011
80
70
60
50
40
30
20
10
02005 20122006 2007 2008 2009 2010 2011
Figure 5.5 total amounts of medium and long term treasury bonds
Source: authors’ calculation based on data obtained from african Financial Markets Initiative.

African Development Report 2014 Regional integration for inclusive growth 77
(Kenya, Uganda and Tanzania), Anglophone West Afri-can (Gambia, Ghana and Nigeria), the Southern African Development Community (SADC) and North African countries. Capital markets integration is also happening through the establishment of platform for collaboration and exchanges between national exchanges.
Efforts are underway to enable cross-border transactions and bond trading. The bond market is an integral part of a capital market, providing long-term debt financing to both public and private sectors for growth-enhancing invest-ments, but Africa’s bond markets mirror its stock markets in terms of market size and liquidity (see Figure 5.5). A number of government initiatives have been launched at both the national and regional levels, notably the initia-tives and reforms undertaken in WAEMU to support the development of its regional bond market. Governments in west Africa have raised local currency debt from the BRVM in the WAEMU Zone, at costs unrelated to their credit ratings, due to rapid development of government bonds, excess liquidity in banks and a dearth of private sec-tor investment opportunities (Wakeman-Lim and Wagh, 2008). Besides government and corporate bonds, regional and Kola bonds are issued by regional development insti-tutions (such as the West African Development Bank and the ECOWAS Bank for Investment and Development) and non-WAEMU resident development institutions (such as the International Finance Corporation and the French Development Agency), respectively.
5.2.3 Financial infrastructureRegional financial integration could contribute further to inclusive economic growth through the development of regional financial infrastructure. The economies of scale for regional integration could be reaped at the level of financial infrastructure, including payment systems, credit registries, and the regulatory and supervisory framework (Beck et al 2011). But which key elements of financial infrastructure could benefit from regional integration and have a significant impact on financial inclusion and inclusive growth?
Regulation and supervision are key to reaping the ben-efits of regional financial integration. For bank account holders and users of financial services and products, uncertainty about the quality of regulation and supervi-sion can deeply damage trust in financial institutions and discourage individuals and businesses from participating in the financial system, thereby reducing its ability to mo-bilize financial resources that could be intermediated to benefit ‘financially excluded’ and ‘underserved’ segments of the population. Further, confidence in the financial sector relies on the financial system to prove its stability, commitment and compliance to international stand-ards and sound practices in regulation and supervision (Beck et al, 2014). Several African countries have made tremendous efforts to strengthen their regulation and su-pervision frameworks, explaining why African financial systems are more stable today. Upgrading regulation and supervision frameworks and harmonizing reporting and prudential requirements and procedures for enforcing rules reduces has been critical for cross-border banking activities to thrive. In regions where countries can adopt a single licensing regime for banks, transaction costs in-volved in cross-border financial transactions could have been considerably reduced (Wagh et al., 2011). Regulated cross-border banks are more efficient than unregulated cross-border banks (Triki et al. 2013).
Regional approaches to regulation, supervision and financial reporting standards have been adopted. A number of African authorities have made progress in upgrading their regulation and supervision systems with the aim of moving to an integrated approach at regional level. Most African RECs have conducted in parallel the process of regionalizing financial infrastructure while member countries have been developing sound domes-tic financial infrastructure. For instance, EAC member countries are undertaking systematic efforts to harmonize prudential supervisory rules and practices in the region (Beck et al, 2014).
The SADC’s Protocol on Finance and Investment (FIP) seeks to enhance cooperation and coordination of regula-tory and supervisory policies among central banks in the region, and encourage countries to develop harmonized

78 Chapter 5 harnessing regional Financial Integration
accessibility of these systems have a major impact on the activities of business and individuals (Lovegrove et al., 2007). The regionalization of such an infrastructure could benefit from the economies of scale related to financial integration while phasing out the frictions and barriers to exchange. Most members of RECs have been involved simultaneously in processes of regional-ization of payment systems and development of sound domestic financial infrastructure. Several RECs have made progress in harmonizing their payment systems, including SADC, COMESA, WAEMU, and CEMAC. Such regional payment systems will facilitate access to a larger number of financial institutions, and therefore support inclusive growth.
Retail payment systems address the problems of cost and accessibility for individuals and small businesses. Various RECs recognize that the establishment of a re-gional wholesale payment system will not be sufficient to address the problems of cost and accessibility to payment services for individuals and small businesses that either cannot access formal financial institutions or are deterred by cost and inconvenience. To cater for small sized in-stitutions, and unbanked individuals and businesses, including the poorest segments of the population and Micro, Small and Medium Enterprises (MSMEs), RECs are also supporting the development of retail payment systems at the national and regional level, in conjunction with the further development of the mobile banking industry. Technological innovations are also paving the way for Microfinance Institutions (MFIs) to gain greater access to domestic and regional payment and settlement systems, to cater for the needs of the most vulnerable, including women and disabled groups. When properly designed, MFI access to payment and settlement systems can improve women’s access to financing and contribute significantly to their financial independence.
In some African countries, like Malawi and South Africa, central bank-driven initiatives are aimed at providing MFIs with access to national payment and settlement systems. The South African Reserve Bank has set up SAMOS, a payment system platform within the na-tional system for MFIs and other Non-Bank Financial
standards of practice and regulations so that all cen-tral banks follow common procedures and operational frameworks. African authorities have also increasingly used Memoranda of Understanding (MoUs) between host countries and home countries and Colleges of Su-pervisors (CoS), whose function is to enhance coopera-tion between the supervisory authorities. Furthermore efforts have been made to put in place sub-regional or continental platforms or organizations geared towards enhancing cooperation and exchange of information among regulators and supervisors. The Community of African Banks Supervisors (CABS) a subsidiary of the Association of African Central Banks (AACB) is intend-ed to animate and deepen the dialogue among heads of banking supervision.
Most RECs have embarked on projects geared toward the regionalization of payment systems. Well-functioning payment systems are key elements of financial infrastruc-ture, and they play a critical role in the functioning of the financial system. The costs, speed, reliability, and

African Development Report 2014 Regional integration for inclusive growth 79
irresponsible lending, and over-indebtedness of clients. Positive credit information sharing allows good quality credit applicants to get financing at lower rates, while negative credit information sharing prevents poor quality credit applicants from accumulating debt (OECD, 2010). Several African countries are establishing public credit registries and private credit bureaux in order to expand financial access. The credit industry in Africa appears to be dominated by public credit registries; among the 42 African countries surveyed, only 5 reported private credit bureaux and 10 reported an absence of both public credit registries and private credit bureaux (Triki and Gajigo, 2012). The presence of public credit registries together with private credit bureaux in some African countries helps reach higher levels of credit information sharing (OECD, 2010).
Pan-African credit bureaux and registries are most val-uable to maximizing the potential benefits of regional financial integration. The credit information market is growing, but it does not reach the critical mass needed to trigger a regionally integrated approach. Among the very few credit bureaux with a regional footprint are CompuScan, incorporated in South Africa, which offers a variety of credit information-related services in Southern and Eastern Africa. The existence of such regional credit bureaux and registries will help banks to design appro-priate banking instruments in these markets. In trade finance, sharing commercial credit data across regions is relevant for banks that are approached to confirm letters of credit issued abroad. The presence of credit bureaux at the regional level, like CompuScan, has helped foster transparency in cross-border markets and higher levels of efficiency in southern and eastern Africa.
Institutions (NBFIs). Malawi’s national payments sys-tem, MALSWITC, is directly accessible to all eligible financial institutions. Besides, an increasing number of inter-linked Real Time Gross Settlement (RTGS) systems can be found across the continent, the most recent one being the integrated East African Cross Border Payment System (EAPS), which aims at facilitating cross-border payments within Uganda, Kenya and Tanzania. More re-cently, the central banks of Nigeria and Ghana discussed the possibility of establishing an efficient, secure and reliable regional payment system between the WAEMU, Nigeria and Ghana.
Cross-border payment systems are being used to facilitate remittances and promote inclusive growth while cutting transaction costs. The central banks in Kenya, Tanzania and Uganda are linking up their payment systems within a broader plan to integrate their financial markets. The initiative is believed to facilitate money transfers within the region through a reduction in costs, and is expected to reduce entry barriers and open up the supply market for money transfers, which has so far been exclusive-ly dominated by a few money transfer companies and cross-border banks that offer similar services within their subsidiaries. Such a process will drive down the cost of cross-border payments and remittances, and foster com-petition. As a consequence, commercial banks from a given region (regardless of their regional footprint) will be allowed to transfer money directly and in a cost-ef-fective way to other banks. The share of intra-regional trade to total trade among EAC countries is expected to reach 12% in 2016 (up from 9% in 2014), and the proportion of the regional population’s access to formal banking services will increase from 27% in 2014 to 35% in 2016 (AfDB, 2012).
Local credit registries and bureaux are developing across Africa to facilitate access to finance and financial inter-mediation. The availability of reliable credit information reduces information asymmetry between borrowers and lenders in financial markets and may therefore increase access to finance (Triki and Gajigo, 2012). Besides reduc-ing adverse selection and moral hazard problems, credit information sharing helps avoid information monopolies,

80 Chapter 5 harnessing regional Financial Integration
board and risk-management systems (Beck et al, 2014). Some of these costs will be passed on to the clients, increas-ing interest rate spreads on the continent, and defeating the purpose of using cross-border banking to reduce transaction costs and expand access to financial services.
Regulatory and supervisory authorities lack capacities to oversee cross-border banking. The volume and so-phistication of cross-border banking are a challenge to host countries regulatory authorities, which may lack the resources to regulate and supervise it. Supervisory resources are limited, including qualified staff, analytical tools and skills, and quality data and reporting processes to monitor risk at the institutional and systemic level (Beck et al 2011). Instead of identifying and managing the changing risks in banking systems, supervisory processes should focus on compliance with regulatory standards.
Regionally integrated regulatory and supervisory frame-works are needed for cross-border banking. Notwith-standing the efforts described above, more work is still needed to establish regulatory and supervisory frame-works at the regional level that could facilitate cross-bor-der banking. In fact, cross-border banking is hampered by a lack of harmonized regulatory frameworks within RECs. In the two CFA currency zones, as well as in SADC and EAC, harmonizing the implementation of regula-tions remains a challenge due to lack of a coordinated bank resolution process (Beck et al, 2014). With ever more countries involved in cross-border banking, the lack of adequate regulatory frameworks for consolidated supervision is a challenge. In the WAEMU zone, super-visory responsibilities are divided between the banking commission and national governments, complicating supervision. In the SADC area, MoUs do not cater for
5.3.1 More effort needed Current risk mitigation measures to safeguard the finan-cial system are inadequate or insufficient to deal with potential risks from cross-border banking. Cross-border banking activities expose African financial systems to spillover, financial distress and contagion risks from across borders. For example, the WAEMU zone’s ill-suit-ed regulations requiring preapproval of loan applications are often ignored, which undermines supervisory dis-cipline. Supervisory discipline requires shifting to the consistent enforcement of meaningful regulations (Beck et al, 2011). African financial systems, by and large, lack appropriate regulation framework to deal with failing banks, and tested crisis resolution mechanisms. This prevents them from taking risks and innovating, and obstructs them from adopting financial inclusion-type strategies. Adopting international standards and up-grading regulatory and supervisory frameworks are key to enabling effective cross-border banking, ensuring confidence in the financial systems, and fostering in-clusive growth.
Some regulatory requirements in Africa entail costs that could slow regional financial integration and hamper its potential benefits. Banking supervisors prefer subsidi-ary-driven cross-border banking (Beck et al, 2014), even in the WAEMU zone and CEMAC. This translates into severe regulatory requirements for branches, which are required to have the same capital levels as a subsidiary, making cross-border branching rare in those regions. Au-thorities may have good reasons for their preference, such as for better protection of domestic markets, but it implies substantial costs for cross-border banking. The higher costs stem from restrictions on flexibility in the management of group commitments, difficulties in moving funds around, and the need to establish separate capitalized entities with
5.3 Inclusive Growth Challenges

African Development Report 2014 Regional integration for inclusive growth 81
Some regional stock exchanges struggle amid the absence of large listed companies or active institutional investors. Despite attempts to establish regional and national stock exchanges, markets such as the BRVM and BVMAC in the CFA franc Zone lack dynamism. Though the BVMAC was created recently in 2003, the BRVM has operated since the late 1990s. Its market capitalization in March 2014 was USD 39 million and it included 73 listed com-panies and 54 traded companies; as compared with the JSE’s market capitalization of about USD 3 billion, 385 listed and 360 traded companies. The limited develop-ment of these regional stock exchanges is mostly due to a scarcity of large listed companies providing opportunities for investment and the absence of institutional investors intervening in the market with long-term resources to invest in profitable deals. This prevents the market from efficiently playing an intermediation role at the regional level and undermines potential benefits from regional financial integration.
resolution of cross-border banks in case of insolvency (Beck et al, 2014) (see box 5.2).
Political interference in regulation could generate del-eterious effects. In many African countries, regulators are not totally independent from political spheres, and government is involved in regulation through licensing and closure decisions made by ministries of finance rather than bank regulators. In South Africa, supervi-sors need authorization from the minister of finance to intervene in a bank. Large cross-border banks in Africa may yet become ‘too big to fail’ through mergers and acquisitions that overshadow the host country’s econo-my, or even ‘too political to fail’ through accumulation of political capital. Monetary authorities would need to put in place official bailout plans to avoid the financial distress and social disruption generated by such a bank’s bankruptcy. This could create a moral hazard problem that encouraged such a bank to engage in irresponsible lending because of the government’s potential safety net (Agénor, 2003, Sy 2014).
there is a shortfall in the coverage of memoranda of understanding (MoUs) between regulatory and supervisory bodies in africa. For example, the WaeMU Banking Commission has signed five MoUs with other supervisors although cross-border WaeMU banks operate in 30 countries. Bilateral cooperation agreements have been concluded with supervisory authorities of France, Morocco, Nigeria, Guinea and the CeMaC. however, there are still 19 relevant countries with which WBC has neither a formal nor informal form of collaboration. Still, supervisory authorities in africa have made significant progress in closing gaps in MoU coverage in recent years. In the SaDC region, bilateral MoUs are the primary mechanism for facilitating information sharing. there are nine MoUs in which both countries are SaDC members. In addition, South africa has signed MoUs with three other african countries and 11 countries outside of africa; Mauritius with seven non-african regulatory authorities. Importantly, the large majority of SaDC MoUs fails to address resolution of cross-border institutions in the event of insolvency. authorities in SaDC appear unwilling to contemplate handing over part of their powers to a regional institution, arguing that such a step should be preceded by further legal and regulatory harmonization.
there has also been an increasing use of Colleges of Supervisors (CoS) for african cross-border banks, often supported by MoUs, but much more can be done. the only supervisory colleges in SaDC, for example, are the two for Mauritius Commercial Bank and the State Bank of Mauritius and the college for Standard Bank of South africa. In eCOWaS, central bankers and regulators regularly discuss harmonization and exchange experiences. progress has been made in establishing supervisory colleges in the West african Monetary Zone (WaMZ) region, and a general ‘college of supervisors’ meets regularly, but participation is by country representation rather than at a bank-by-bank level. as yet there are no specific colleges of supervisors for Nigerian banks with foreign subsidiaries, nor is there a supervisory college for ecobank, which is headquartered in togo and has subsidiaries across africa. as a result, supervisors have limited capacity to verify information regarding intra-group liquidity and capital flows across borders.
In general, actual implementation lags far behind formal agreements, which offer an insufficient basis for effective supervision of cross-border banks in africa. Cultural and historic factors can make cooperation between certain countries or within sub-regions more difficult, as may be the case for cooperation with South africa following the apartheid regime. asymmetric size and economic importance is another issue, as with Kenya or Nigeria and their neighbors.
Box 5.2 Gaps in collaborative arrangements
Source: Beck et al. (2014).

82 Chapter 5 harnessing regional Financial Integration
Cross-border venture capital and private equity funds may play an important role where stock exchanges are slow, regional and national stock exchanges stand in competition, and outreach to the underserved is needed. In such a situation, the coexistence of regional stock exchanges with national ones undermines chances to reap regional financial integration, such as in the case of BVMAC and the Douala Stock Exchange. Where neither of the two entities may be viable, and conflicts could arise between regional and national rules, this induces unnecessary costs (Wakeman-Lim and Wagh, 2008). Given the limited capacity for African capital markets to cater for low end markets, it may be inappropriate to develop a capital market in some jurisdictions. Box 5.3 illustrates the case of a cross-border private equity firm with a pan-African approach to source transactions, leading to significant inclusive developmental outcomes in countries where it does business.
Capital markets at the regional level need to find alterna-tive ways to meet the huge demand among SMEs for long term financing linked to Africa’s rapid economic growth. SMEs account for nearly 90% of African economies, and provide jobs to over three-quarters of workers, especial-ly women. Yet their capacity and productivity remain much lower than elsewhere in the world, partly due to
BRVM Casablanca Stock Exchange
Egyptian
Exchange
Johannesburg Stock Exchange
Market Capitalization
(USD million)
39,246 169,443 605,269 3,016,770
Number of Listed Companies 73 75 237 385
average Number of traded Companies per
Month
54 72 218 360
total Valued traded
(USD million)
100 998 11,245 610,218
total Volume traded (million) 32 28 18,562 15,244
total Number of transactions 9,231 41,658 2,327,625 11,404,419
Table 5.2 Overview of selected capital markets in africa (2014 Q1)
Source: authors’ calculations using information from african exchanges (Issue2, July 2014).
africInvest-tunInvest Group was founded in 1994 to offer private equity, brokerage, asset management and corporate finance services in africa. the group has assets under management today worth over USD750 million across 13 private equity (pe) funds and operates through six main offices in tunis, abidjan, algiers, Casablanca, Lagos, and Nairobi. the group has made over 100 investments spanning a wide array of sectors and realized more than 50 exits.
africInvest-tunInvest employs a pan-regional approach to sourcing transactions and building businesses. the group leverages its unique regional presence, and its continent-wide perspective and experience, to source deals that have regional development prospects. It focuses on leading local SMes that aspire to develop into local or regional companies. It has successfully contributed to the development of its portfolio companies, leading to the creation of more than 12,000 jobs over the holding period.
africInvest-tunInvest track record of supporting cross-regional companies includes the acquisition in 2006 of alios, an independent group of non-banking finance companies operating in many sub-Saharan countries. It leveraged its experience with previous leasing companies and took steps to restructure the company into an independent pan-african leasing group, launching new products in areas such as consumer credit, real estate leasing and factoring. It also worked on widening the group’s regional scope by expanding into additional countries. Between 2006 and 2013, alios significantly increased its number of clients from 15,000 to 25,000, value of disbursed loans from USD 101 million to USD 200 million, and its regional footprint from 6 to 10 countries of operations.
Box 5.3 africInvest: a pan-african private equity firm
Source: authors, adapted from africInvest-tunInvest sources.

African Development Report 2014 Regional integration for inclusive growth 83
less stringent, more flexible, and more integrated within a guarantee fund. African exchange authorities could do more to educate, raise awareness, and promote the secondary boards. Further, they should move towards creating integrated second-tier markets at the regional level, learning from the BRVM which aims to open an alternative market dedicated to SMEs in December 2014.
More efforts are also needed to foster bond markets in Africa. Despite steady growth in recent years, bond market capitalization remains much lower than in the rest of the world. Primary market issuance in most Af-rican counties is dominated by the public sector, and
inadequate access to long-term capital. Capital markets are needed that cater for SMEs, with more sophisticated and innovative institutional arrangements that respond to their real demand (Shinozaki, 2014). African stock exchanges such as Nilex (Egypt Stock exchange) and AltX (Johannesburg Stock Exchange) are making at-tempts to address this issue, inspiring others across the continent (see Table 5.4). These secondary trading boards help SMEs to raise equity for growth and expansion, by lowering the demands on issuers for listing fees, track record, size, reporting and shareholder numbers. The Douala Stock Exchange now envisions the creation of an SME compartment for which listing criteria would be
Country SME Bourse Target
Botswana BSe Venture Capital Market Dedicated to startup ventures
egypt Nile Stock exchange (NILeX) Growing SMes in the Middle east and North africa
Ghana Ghana alternative Market (GaX) Start-ups and existing enterprises
Kenya Growth enterprise Market Segment (GeMS) Divided into the main and alternative investment segments
Malawi MSe altX Smaller, younger limited liability companies
Mauritius Development & enterprise Market (SeMDeM)
SMes and newly set-up companies with a sound business plan and demonstrated good growth potential
Morocco Casablanca Stock exchange (BVC) Local and West african SMes can list on the main bourse, BVC
Nigeria alternative Securities Market (aSeM) Specifically designed for emerging businesses
rwanda rwanda Stock exchange (rSe) Waives capital requirements for SMes wishing to list on the main bourse. rSe. SMes simply required to make disclosures in a prospectus
South africa altX africa’s first alternative stock exchange for SMes
tanzania enterprise Growth Market (eGM) a nine-month public awareness campaign has been launched to entice SMes to the eGM. Few companies, mainly in telecoms and banking, have shown interest to date
tunisia tunis Stock exchange alternative Market efforts are under way to address obstacles preventing SMes from listing on the alternative Market
Uganda Growth enterprise Market Segment (GeMS) More suitable for SMes than the unsuccessful alternative Investment Market Segment (aIMS)
Zambia Lusaka Stock exchange (LuSe) an SMe tier exists on the main bourse
Zimbabwe Zimbabwe Stock exchange (ZSe) is working on operating rules for a secondary SMe bourse
Table 5.3 african stock exchanges with a secondary board for SMes
Source: africa Strictly Business.

84 Chapter 5 harnessing regional Financial Integration
made to develop the bond market in West Africa (see section 2.b), but more is needed in other regional cap-ital markets. Further, authorities need to develop local currency debt in order to cater for increasing funding requirements by governments and firms.
The bond market should be strengthened by African governments with the help of multilateral development banks like the African Development Bank to bridge in-frastructure funding gaps at both national and regional levels. An annual investment of up to USD 93 billion until 2020 is needed for infrastructure development and maintenance across the continent (WEF et al., 2013), so bond markets will need to play a full role. Infrastructure bond markets need to be developed to allow govern-ments and private companies to raise long-term funds for projects, under attractive terms such as lower cost, denomination in local currency, credit enhancement facilities for entities with institutional and credit weak-nesses, and the possibility to back interest and principal payments of bonds with cash flow revenue generated by the underlying project (Mbeng Mezui, 2013). Further, efforts will be needed at the regional level to push through institutional and regulatory reforms that enable devel-opment of this instrument. African governments and RECs will need to ensure fiscal and monetary policies are consistent, domestic and regional securities markets are strengthened, bond listing rules and procedures are upgraded accordingly, long-term yield curves are estab-lished, and private sector participation is incentivized. Otherwise, issuing infrastructure bonds will do little to address the huge infrastructure gap and unlock this structural bottleneck to inclusive growth.
few corporate bonds have been issued. Corporate bond markets are constrained by complex approval procedures, high credit guarantee requirements and costly issuance fees (Beck et al., 2011). Some African countries have listed bonds on their stock exchange, but there is little secondary market trading. A buy-and-hold strategy adopted by domestic commercial banks and a narrow investor base exacerbate the problem of bond market illiquidity, and damage the ability of bond markets’ to mobilize financial resources. Notable efforts have been
eskom is an integrated power utility wholly owned by the government of South africa, with a track record of issuing bonds locally in rand (Zar) and internationally in euros and USD. It currently has Zar 105bn outstanding in the market, with 2033 as the current longest maturity. In addition, the South african National roads agency (SaNraL) has a domestic capital markets program totaling Zar 44bn. In 2008 it issued four bonds totaling Zar 2bn to fund new tolled highways in Gauteng and other road upgrades. this included inflation-linked floating-rate bonds and three fixed rate bonds with maturities up to 20 years. It was the first time SaNraL issued without a guarantee from the National treasury. Further, the airport Company of South africa (aSCa) rolled out a Zar 1bn three-month commercial paper program in 2008-09, which it subsequently refinanced using long-term bonds. It issued bonds totaling Zar 2.96bn, including a Zar 0.75bn inflation-linked private placement; and a Zar 1.3bn issue. this latter was divided into a fixed rate bond, an inflation linked note and a tap issue of their existing bond issue program.
Box 5.4 Infrastructure bonds in South africa
Source: Mbeng Mezui (2013).

African Development Report 2014 Regional integration for inclusive growth 85
CEMAC, respectively, are in Euros, 80% of transactions in the WAMZ are in USD (see table 5.4) and more than 50% of transactions in SADC and COMESA are in USD.
As trade and investment grows between Africa, China and emerging economies, African financial intuitions will become more reliant on USD clearing banks. Inefficient payment systems hamper financial transactions from the continent (see Figure 5.6), increasing transaction costs for processing clearing and settlement services within the continent; these may be even higher given additional costs for regulation, anti-money laundering, and combatting the financing of terrorism (AML/CFT). By setting barriers to accessing opportunities, this un-dermines inclusive growth.
African financial systems lack reliable information for credit screening, quality accounting practices and systems to prevent tax evasion, and these undermine the potential benefits of regional financial inclusion (Baer et al, 2009). Many African countries lack efficient national credit bu-reaux, due to inadequate regulation, unreliability of data, lack of appropriate information technology and human resources, and lack of funding to design and implement efficient ones. With very few credit reporting systems, African countries lack their potential to contribute to inclusive growth through financial inclusion, responsible lending behavior, banking supervision, and curtailed
Inefficient payment systems with high transactions costs hinder the ability of financial institutions to foster inclu-sive growth. National payment systems have lagged, beset by low capacity, outdated technologies, high transaction costs (finance and speed), as well as accessibility and reliability issues. Ineffective payment and settlement systems complicate the development of financial systems, especially securities markets, by increasing payment and settlement costs, raising the costs of domestic and cross-border trade and investment, and creating high barriers to developing financial services and products for the poorest segments of the population and MSMEs. They also hamper intra-regional trade, exchanges of funds, and remittances. These weaknesses and a lack of politi-cal will to advance reform of regional payment systems since 2003, explain operational inefficiencies and the shallowness of the interbank market in the CEMAC area (Wakeman-Lim and Wagh, 2008). This lack of efficient payment system prevents the move of funds from excess liquidity banks towards where it is most needed. Low income countries and small sized economies also incur high cost to access better payment systems, because they have a low volume of financial transactions and modern payments systems are based on sophisticated technol-ogy with a high fixed cost. Thus Sy (2014) finds a huge amount of transactions by African financial institutions are cleared and settled in foreign currency: 75% and 80% of transactions in the Arab Maghreb Union and the
USD EUR ZAR Others
arab Maghreb Union (aMU) 18% 75% 0% 7%
east african Community (eaC) 69% 9% 4% 18%
economic and Monetary Community of Central africa
(eMCCa)
12% 70% 0% 18%
West african economic and Monetary Union (WaeMU) 10% 32% 0% 58%
West african Monetary Zone (WaMZ) 80% 8% 0% 12%
Southern african Development Community (SaDC) 53% 19% 14% 14%
Common Market for east and South africa (COMeSa) 57% 17% 13% 13%
Table 5.4 Commercial currency flows from africa’s regions
Source: authors, based on Chilosi et al. (2013).

86 Chapter 5 harnessing regional Financial Integration
improved over this period. In 2008-09, about 20% of adults in Sub-Saharan Africa did not use financial ser-vices, but detailed data for 2012 showed only 18.5% using financial services. Moreover, the situation is not homogenous; in southern and eastern Africa, around 75% of adults are excluded from the financial system, and in western and central Africa the percentages exceed 80% and 90% respectively. These findings defy efforts by RECs to advance regional integration agenda; for instance, the WEAMU Zone achieved a high degree of financial integration (Sy, 2006, 2014) but this was not translated into financial inclusion progress. In southern and east-ern Africa, where economic and financial integration has been slower, progress has been greater in financial inclusion. Advancing regional financial integration per se appears not to guarantee more financial inclusion.
credit loss. Establishing credit bureaux at national level is extremely demanding in financial, technology, data and human resources, and these may be greater at regional level. However, integrating national credit bureaux and registries at regional level, and allowing for exchange of information and data between them, would be of great value, and should be considered a longer-term vision.
5.3.2 Insufficient advanceRegional financial integration does not guarantee finan-cial inclusion. Financial inclusion in sub-Saharan Africa, as measured by the percentage of adults who use formal and semi-formal financial services, shows no substantial improvement over the last five years (Honohan, 2008; Chaia et al, 2009; Demirgüç-Kunt and Klapper, 2013; Triki and Faye, 2013). The situation has not significantly
REC Financial versus Commercial Counterparties
AMU
EAC
EMCCA
WAEMU
WAMZ
SADC
COMESA
Commercial
Financial
AfricaEurope-euro Zone
Asia-PacificEurope-Non euro Zone
Central and Latin AmericaMiddle East
North America
Commercial
Financial
Commercial
Financial
Commercial
Financial
Commercial
Financial
Commercial
Financial
Commercial
Financial
Figure 5.6 Outgoing payments from african regions, financial versus commercial counterparties
Source: authors, based on Chilosi et al. (2013).

African Development Report 2014 Regional integration for inclusive growth 87
Regional financial integration could undermine finan-cial inclusion by generating ‘cherry picking’ among cross-border lenders. Regional financial integration may not change financial systems, institutions and markets, or how they interact to allocate resources among house-holds, governments and firms (Baele et al, 2004). Re-gional financial integration may instead magnify existing habits and intermediation techniques, including banking models and lending patterns (Wakeman-Lim and Wagh, 2008) so that inefficiencies are increased at regional level and interest rates spreads remain high (Beck et al, 2014). Concentrated bank lending to a few clients could increase competition for creditworthy customers already served and attractive sectors, while excluding small firms, house-holds, and underserved sectors. Such cherry picking may explain why financial exclusion has slightly worsened in recent times. Moreover, such concentration strategy may also cause damage at macroeconomic level if it denies financial resources to fragile or post-conflict and poor African countries.
5.3.3 Principles underminedRegional financial integration processes can be com-plete and inclusive when three fundamental rules apply to market participants with similar characteristics: (i) commitment and compliance to a single set of rules; (ii) equal access to the set of financial instruments and/or services; and (iii) equal treatment when using financial
National financial sector strategies that promote finan-cial inclusion are needed to reap the potential benefits of regional financial integration. Advancing regional financial integration alone may not achieve financial inclusion objectives. Regions where countries pursue financial inclusion strategies at national level in addition to engaging in regional financial integration processes perform better at financial inclusion (Triki and Faye, 2013). In East Africa, the mobile banking revolution has been instrumental in extending access to finance and reducing the number of people excluded from financial services. Innovative mobile phones-based financial ser-vices, inspired by M-Pesa in Kenya, have made finan-cial services less costly and improved their outreach at national and regional levels while facilitating payments and remittances across borders (see box 5.2). In East Africa, 38% of adults use mobile money compared to less than 10% in Africa’s other sub-regions. This is because countries such as Kenya and Tanzania have followed financial inclusion policies that created an enabling en-vironment for mobile and branchless banking to thrive. In west and central Africa until recently, the policy and regulatory frameworks have not been conducive for a mobile banking revolution. So while regional economic and financial integration processes are important, they may not be sufficient to foster financial inclusion, unless accompanied at national levels by policies that promote financial inclusion.
First National Bank (FNB) is a wholly owned subsidiary of the First rand group, a financial services provider in South africa. FNB was incorporated in 1838 and is considered the oldest bank in South africa, providing a full range of banking products and services for both individuals and businesses. FNB is present in Botswana, Mozambique, Namibia, South africa, Swaziland, tanzania and Zambia through its network of subsidiaries, and plans to expand into angola, Ghana and Nigeria, Kenya, rwanda and Uganda.
In 2009, First National Bank (FNB) launched eWallet, a mobile phone-based cross-border service allowing an FNB customer to send money, using a mobile phone, to a recipient located in Botswana, Swaziland, Lesotho, Zambia or Namibia. the service was recently redesigned to enable non-FNB customers including those that do not have a bank account to access the service through cash deposits into eWallet using the FNB atMs with automated deposits.
eWallet’s pricing structure for transactions across borders proved very cost-effective, especially on the South africa-Zimbabwe corridor. While the total average charge for migrant transfers (including transfers trough cash-to-cash, account-to-account, cash-to-accounts etc.) represented 17% of the total value of the remittance sent to Zimbabwe from South africa in the first quarter of 2013 (World bank statistics), eWallet’s had tiered costs of less than 5% of the total value of the transfer for transfers less than an equivalent of USD 143.
Box 5.5 FNB’s eWallet service
Source: authors, adapted from FNB’ website and various other sources.

88 Chapter 5 harnessing regional Financial Integration
market participants with similar characteristics should be treated equally, without discrimination, for ex-ample, against foreign participants compared to na-tionals. The EAC scorecard mentions several other discriminating factors beyond access: different fees for transactions and government services, ceilings on the value of transactions, limits on the type and length of projects for service providers, and higher taxes for foreign firms (Sy, 2014). The EAC is not the only region that breaches basic inclusive financial in-tegration principles related to equal access to markets and equal treatment for active market participants. In the WAEMU zone, activity in the regional interbank market is largely restricted to in-group subsidiaries. In the SADC area, equal access and treatment of market participants is constrained by institutional differences, limited opportunities outside South Africa and over-lapping membership with SACU.
Despite their efforts to harmonize rules within regions, RECs also fall short in applying a single and common set of rules. In the WAEMU zone, regardless of the banking commission (Commission Bancaire de l’UMOA) and the central Bank (BCEAO-Banque Centrale des Etats de l’Af-rique de l’Ouest), the principle of a common set of rules to which everybody should abide is not respected. Re-serve requirements differ by country, ranging from 3% in Guinea-Bissau and Togo to 15% in Benin (Wakeman-Lim and Wagh, 2008), thus distorting cross-border compe-tition. National authorities continue to use discretion in licensing and de-licensing of banks, despite a single permit rule (agrément unique). Bankruptcy proceedings and rules on the realization of collateral also vary across countries. Similarly, the CEMAC zone provides for har-monization of banking laws on paper, but the potential for financial integration is undermined at national level by differences in operational efficiencies, reserve require-ments and taxation regimes for banks (Saab and Vacher, 2007; Wakeman-Lim and Wagh, 2008). In the SADC area, differences in listing rules and standards applied by stock exchanges prompted the Committee of SADC Stock Exchanges (COSSE) to promote harmonization of listing standards with those of the JSE (Wakeman-Lim and Wagh, 2008).
services/instruments (Baele et al, 2004; Kose et al, 2009, Sy, 2014).
Regional financial integration is occurring without phas-ing out access barriers for potential market participants. An inclusive and fully integrated financial system in Af-rica would require that investors, firms and households enjoy the same access conditions to financial services and instruments, irrespective of their region of origin. Barriers to access should not favor national market par-ticipants over foreign ones. Despite efforts made within the EAC common market processes, progress to phase out access barriers has been slow (Sy 2014). The 2014 EAC common market scorecard indicates that barriers remain to the free movement of goods and services among AEC member countries, stemming from laws and regulations, capital controls, and membership in different RECs. Due to capital controls, for example, investors from Burundi and Tanzania cannot invest in EAC markets despite the existence of the East African Exchange (EAX), while Tanzania’s regulatory framework restricts access to its stock exchange to investors from the region.
Active market participants still face discrimination. For full and inclusive financial integration, active
Source: authors’ calculation based on information from World Governance Index (2012).

African Development Report 2014 Regional integration for inclusive growth 89
standards in corporate and public governance. Sub-Sa-haran Africa and South Asia perform poorly in terms of governance compared to other regions of the world (see Figure 5.7), and several African financial systems still lack adequate legal and enforcement frameworks, including to enforce property rights, protect investors and consumers, and enforce bankruptcy laws.
Regional financial integration may not fulfil its promise, including inclusive growth, if it pools countries with similar characteristics and similar challenges. In such a case, it is more likely to aggravate the situation and pool problems. Where characteristics are common, all members of a financial system will be characterized by excess liquidity and high interest rate spreads, indicating a lack of viable investment projects in the region as well as longstanding structural issues that need to be fixed at national levels (Wakeman-Lim and Wagh, 2008). Even if regional financial integration is progressing, some groups of countries will not attain the minimum threshold to reap potential benefits of financial integration (Honohan and Beck, 2007).
5.3.4 Weak entry conditionsWeak entry conditions, such as lack of macroeconomic stability, inadequate institutions, poor governance and underdeveloped financial markets, could undermine regional financial integration and inclusive growth. Some literature on financial integration (i.e. Baele et al, 2004; Kose et al, 2009, 2011; Sy, 2014) argues that countries need to achieve certain threshold levels of financial, eco-nomic and institutional development to reap the potential benefits of regional financial integration. Any regional integration process will only be as strong as the national institutional, financial and economic foundations upon which it rests. Developed countries which typically have better institutions, more stable macroeconomic frame-work and deeper financial markets, tend to benefit more from financial integration than developing countries (Kose et al, 2009). While African countries have made substantial efforts to improve the stability of their macro-economic frameworks, they perform less well in financial openness (i.e. several have not initiated or completed their capital account liberalization processes). Generally speaking, African countries institutions are beset by capacities and skills gaps, corruption, red tape, and low
0 10 20 30 40 50 60 70 80 90 100
East Asia &Pacific
Europe &Central Asia
Latin America &Caribbean
Middel East &North Africa
North America
South Africa
Sub-SaharanAfrica
Figure 5.7 Governance index for selected regions
Source: authors’ calculation based on information from World Governance Index (2012).

90 Chapter 5 harnessing regional Financial Integration
5.4.2 Cross-border banking • Regulatory and supervisory frameworks should be up-
graded to cope with potential cross-border contagion of financial shocks and risks involved cross-border financial activities, in line with international standards and best practices. These include adopting appropriate risk management tools and measures at bank level; devising adequate systemic risk surveillance mecha-nisms such as mapping of financial linkages of large cross-border banks; monitoring intra-group exposure data; establishing institutions to analyze systemic risk; introducing an appropriate bank resolution framework to cope with idiosyncratic and systemic financial dis-tress; and minimizing political inference.
• The upgrading of regulatory and supervision frame-works and adoption of international standards should be done cautiously, balancing the needs for stability and confidence in the financial sector and the inno-vation required to serve the low end markets and underserved sectors.
• Stronger capacities are required, including skills and qualified staff, as well as analytical tools, reliable data and reporting processes for regulators and supervisors.
• Regionally integrated regulatory and supervisory frameworks for cross-border financial activities are needed. This requires more harmonized regulato-ry and supervisory frameworks within RECs, and strengthening and consolidating relationships between regulators and supervisors across regions by setting up platforms for regular exchange of information and fora for cooperation. More CoS and MoUs should be effectively implemented.
While considerable efforts in regional financial integra-tion processes are generating confidence that benefits are being reaped, more efforts are needed to ensure regional financial integration fulfils its promise and contributes to inclusive growth in the face of many challenges ahead. Policy makers and financial sector authorities at both national and regional level should consider these rec-ommendations:
5.4.1 Inclusion principles • An adequate legal and regulatory frameworks is in
place to ensure that access barriers for potential market participants are eliminated, active markets participants are protected from discrimination, and a level playing field exists in terms of commitment and compliance to rules.
• National financial sector strategies promoting financial inclusion are devised and pursued at national level re-gardless of progress made in financial integration. This should include financial innovation such as branchless banking and technology-based solutions to cater for the underserved.
• Countries or country groupings meet minimum entry conditions that enable them to fully reap the benefits of financial integration and contribute to inclusive growth. African countries need to initiate or continue reform processes to consolidate efforts made in terms of stabilizing their macroeconomic frameworks and strengthen and accelerate reforms geared towards building institutions and financial depth, as well as mainstreaming good governance in both public and private sectors.
5.4 Confronting the Challenges

African Development Report 2014 Regional integration for inclusive growth 91
remittances. Regional integration attempts should be accompanied by policies to support the development of strong domestic financial infrastructure. Efforts are needed to develop an integrated approach for clearing and settlement systems in foreign currencies. Regional payment systems need to be operationalized, along with a common regulatory framework, common tech-nologies and platforms, and common standards for managing risks related to anti-money laundering and combatting the financing of terrorism (AML/ CFT). Efforts should be made as well to develop the credit registries/bureaux industry.
• Efforts should be made to leverage sufficient funding from multilateral development banks, including the AfDB. Given the costs of setting up a regional financial infrastructure and how this has slowed progress by some RECs, the AfDB could be called upon to play a similar role to the European Investment Bank in Eu-rope by providing long-term financing on favorable terms for bankable projects. The African Development Fund could be utilized as European Structural Funds have to foster regional financial integration through the provision of funding for the development of regional financial infrastructure and other telecommunication and transport infrastructure.
References
African Development Bank (2012), Project Appraisal Report of the East African Community (EAC) Payment and Settlement Systems Integration Project, AfDB, Tunis.
Alade, S. (2011), Cross-border Expansion of Nigerian Banks: Has It Improved the Continent’s Regulatory and Superviso-ry Frameworks?, Bank for International Settlements Papers no 76, Basel: BIS.
Baele, L., A. Ferrando, P. Hordahl, E. Krylova and C. Monnet (2004), Measuring Financial Integration in the Euro Area, Europe-an Central Bank Occasional Paper Series no.14, ECB, Frankfurt.
Baer, T., M. Carassinu, A. Del Miglio, C. Fabiani and E. Ginevra (2009), The National Credit Bureau: A key enabler of financial
5.4.3 Capital markets • Adequate policies and measures should be taken to
enhance the dynamism and liquidity of stock exchang-es. This means establishing an enabling environment for business, including good governance practices, a favorable legal and regulatory framework, enforceable property rights, and strong institutions. Some efforts are needed to allow institutional investors, including pension funds, insurance companies, and sovereign wealth funds to be more active in capital markets. Fiscal incentives could attract institutional investors in capital markets and foster their liquidity.
• Competition between regional and national stock ex-changes should be avoided, and preference given to re-gional stock exchanges to benefit from economies of scale, maximize the possibility of pooling resources and intermediating the flows of funds. Illiquid and tiny na-tional stock exchanges should be restricted, and wherever necessary replaced with alternative options including facilitating the development of cross-border venture capital or private equity funds, and the establishment of secondary board in stock exchanges devoted to SMEs.
• Policies geared towards developing the bond market should be put in place. Appropriate measures should be taken to attract investors and enhance trading, including adequate monetary and fiscal policies as well as substan-tial resources to reinforce local currency funding through bond issuance. Policies should help governments tap into the infrastructure bond market to fill the infrastructure funding gap, including innovative financing instruments and credit enhancement facilities. Multilateral devel-opment banks such as the African Development Bank (AfDB) could be called to help develop a regional bond market and build capacity in local currency funding and infrastructure bond issuance.
5.4.4 Payment and information systems• Policies should facilitate the integration of financial
infrastructure, including payment systems and credit bureaux at the regional level, to reduce costs dras-tically and increase access to financial services and

92 Chapter 5 harnessing regional Financial Integration
Lovegrove, A., M. Fuchs, M. Long, J. Schwartz, J. Weaver, R. Didenko, D. Issa, R. Hands and J. Denton-Clark (2007), Financial Sector Integration in Two Regions of Sub-Saharan Africa: How Creating Scale in Financial Markets Can Support Growth and Development, AfDB, Tunis.
Lukonga, I., and K. Chung (2010), The Cross-border Expansion of African LCFIs: Implications for Regional Financial Stability and Regulatory Reform, IMF, Washington, D.C.
Mbeng Mezui, C. A. (2013), ‘Unlocking Infrastructure Develop-ment in Africa through Infrastructure Bonds,’ GREAT Insights, vol. 2, no. 4, May-June.
OECD (2010) Facilitating Access to Finance, Discussion Paper on Credit Guarantee Schemes, Paris: OECD.
Rousseau, P. (2002), Historical Perspectives on Financial De-velopment and Economic Growth, Working Paper no. 9333, Cambridge, MA.
Saab, S.Y. and J. Vacher (2007), Banking Sector Integration and Competition in CEMAC, IMF Working Paper no. WP/07/3, IMF, Washington, D.C.
Shinozaki, S. (2014), Capital Market Financing for SMEs: A Growing Need in Emerging Asia, Regional Economic Integration Working papers, AsDB, Manila.
Sy, A. (2006), Financial Integration in the West African Economic and Monetary Union, IMF Working Paper WP/06/214, IMF, Washington D.C.
Sy, A. (2014), Four Instruments to Strengthen Financial Integra-tion in Sub-Saharan Africa, Promoting Financial Integration in Africa Conference, 27 May 2014.
Triki, T., and I. Faye (2013), Financial Inclusion in Africa, AfDB, Tunis.
Triki, T., and O. Gajigo (2012), Credit Bureaus and Registries and Access to Finance: New Evidence from 42 African Countries, Working Paper Series no. 154, AfDB, Tunis.
Triki, T., I. Kouki and P. Calice (2013), Bank Efficiency and Reg-ulation: What Works for Africa?, Working Paper, AfDB, Tunis.
infrastructure and lending in developing countries, McKinsey Working papers on Risk, Mckinsey & Company, Washington, D.C.
Beck, T. (2014), Cross-border banking and financial deepening: The African experience, Case Business School, London.
Beck, T., M. Fuchs, D. Singer and M. Witte (2014), Making Cross-Border Banking Work for Africa, GIZ, Bonn and Eschborn.
Beck, T., M. Samuel, I. Faye and T. Triki (2011), Financing Africa: Through the Crisis and Beyond, World Bank, Washington, D.C.
Chaia, A., A. Dalal, T. Goland, M. J. Gonzalez, J. Morduch and R. Schiff (2009), Half the World is Unbanked, Financial Access Initiative Research Brief, FAI, New York.
Chilosi, T., D. Dugauquier, G. Lambe and M. Onizuka (2013), Africa Payments: Insights into African transaction flows, SWIFT White Paper, SWIFT, Belgium.
Demirguc-Kunt, A., and L. Klapper (2013), Measuring Financial Inclusion: The Global Findex Database, Policy Research Working Paper no. 6025, World Bank, Washington, D.C.
Detragiache, E., T. Tressel and P. Gupta (2008), ‘Foreign Banks in Poor Countries: Theory and Evidence,’ Journal of Finance, vol. 63, no. 5, pp. 2123-60.
Gatebi, M. (2014), ‘Unraveling the African Financial Markets,’ African Exchanges, vol. 2, pp. 9-10.
Honohan, P. (2008), ‘Cross-country Variation in Household Access to Financial Services,’ Journal of Banking and Finance, vol. 32, pp. 2493-2500.
Honohan, P., and T. Beck (2007), Making Finance Work for Africa, World Bank, Washington, D.C.
Jayaratne, J. and P. Strahan (1996), The Finance-Growth Nexus: Evidence from Bank Branch Deregulation, Quarterly Journal of Economics, vol. 111, no. 4, pp. 639-670.
Kose, A., E. Prasad and A. Taylor (2009), Thresholds in the Process of International Financial Integration, IZA Discussion Papers no.4133, IZA, Bonn.

African Development Report 2014 Regional integration for inclusive growth 93
Wagh, S, A. Lovegrove and J. Kashangaki (2011), Scaling-up Regional Financial Integration in the EAC, World Bank, Wash-ington, D.C.
Wakeman-Linn, J. and S. Wagh (2008), Regional Financial In-tegration: Its Potential Contribution to Financial Sector Growth and Development in Sub-Saharan Africa, African Financial for the 21st Century High-level Seminar, 4-5 March 2008, Tunis.
World Economic Forum, World Bank and AfDB (2013), Africa Competitiveness Report 2013, WEF, Geneva.

94 Chapter 5 harnessing regional Financial Integration

Chapter 6
Leveraging Africa’s Value Chains

96 Chapter 6 Leveraging africa’s Value Chains
In an increasingly integrated world, African firms urgently seek to access global markets on more competitive and beneficial terms. Insights into how and why cross-border trade and investment occurs in Africa may be gained by applying a ‘value chain’ perspective, which focuses on
6.1 Introduction
the division of tasks used to produce a product under the control of a lead firm.
Regional integration is known to facilitate value chain development, by making firms more competitive suppliers of inputs for global and regional consumption. Produc-tion networks are increasingly cross-border in nature, so regional integration has an important role to play in reducing the transaction costs for moving goods, servic-es, and capital across borders. Value chain development is supported by infrastructure and financial integration, and freer movement of persons, but the liberalization of investment and the development of trade capacity are crucial for unlocking competitive value chains in Africa. Cross-border investment is a central driving force in developing supply capacity and stimulating cross-border trade; while domestic job creation traditionally follows the advance of export capabilities.
This chapter focuses on trade and investment by using value chain analysis. The inclusiveness dimension of trade and investment occurs through job creation and develop-ing local supply capacity. A number of policies may assist in maximizing these inclusion effects. The next section discusses opportunities for local firms to improve their supply capacity, arising from growing investment and out-put in Africa. The following section notes that important challenges exist to advancing value chain opportunities, such as non-tariff barriers (NTBs), which require support from regional economic communities (RECs). The last section describes regional mechanisms that may be used by RECs and their member states to advance growth and inclusiveness, through coordination on investment poli-cies, improving trade facilitation measures, and working towards the implementation of regional labor standards.
96

African Development Report 2014 Regional integration for inclusive growth 97
6.2 Opportunities for Local Firms
exercises do not consider the role of Africa in the networks (e.g. Baldwin and Lopez-Gonzalez, 2012). In addition, the current value chain literature focuses on a limited number of goods, neglecting those of which Africa is a significant exporter of (such as petroleum), or the value chains into which it wishes to enter (such as capital goods).
Under conditions of global competition and the ability to have an internationally integrated division of labor, firms that supply regional and local markets competitively are often foreign non-regional MNEs. They supply such markets through FDI or trade. Developing capacity to supply regional markets competitively, therefore, requires developing supply capabilities, which occurs when a firm produces under greater scale for a larger (very often glob-al) market. If a local firm tries to supply only a regional market, it could never compete initially with a global firm that already supplies a large portion of global demand.
African countries such as Nigeria have larger domestic markets and therefore greater potential to incubate firms by providing them with beneficial access to supply domes-tic demand; but this strategy cannot be replicated across African countries and has several inherent disadvantages for goods and services involving more than a single stage of production or input. Regional and global markets are often complementary as global markets provide access to better and cheaper inputs needed for local producers to supply the local market competitively. Regional markets can serve as the basis for providing competitive inputs into a regional production process, which are then exported for global markets, for consumption or further processing. In this way regional chains have important links with global chains. As a result, export promotion is often central to a value chain approach, emphasizing the acquisition and upgraded technology and skills by accessing firms from more advanced markets.
6.2.1 Competing to industrializeRECs and their member states will find the value chain approach relevant when considering how to structure regional agreements for regional and global trade and development. As a detailed analytical and diagnostics tool, value chain analysis can help maximize efficiency at the firm level; ascertain which supporting institu-tions are most necessary to overcome barriers to value chain development; highlight asymmetries in trading relations; and identify leverage points with the greatest potential to improve the developmental impact of trade and investment.
MNEs in Africa may ‘govern’ a significant share of cross-border flows of goods and services by serving as conduits for a large proportion of market demand on the output side (e.g. retailers) and on the production side (e.g. car manufacturers). MNEs and their suppliers control the traffic of these flows, and decide which tasks to distribute in the value chain, to whom, and under what instructions. Between January 2003 and February 2014, over 6,200 greenfield FDI projects in Africa have involved almost 5,000 investing companies representing more than 3,000 parent companies (AfDB based on Financial Times database). The estimated cumulative capital expenditure of these investments into Africa was over USD 800 billion in nominal terms (AfDB based on Financial Times database). The parent firms contributed their networks of suppliers, financing, skills, technology and other proprietary assets in the initial investment and subsequent business activities.
Africa’s current integration within global value chains (GVCs) is known to be limited, despite a dearth of infor-mation. Recent initiatives to measure and map trade in value added contains no data on Africa, except South Af-rica (WTO-OECD TiVA database); while other empirical

98 Chapter 6 Leveraging africa’s Value Chains
South Africa and Tunisia, manufacturing activities take place en masse (AfDB et al., 2014) and firms are involved in adding value often much higher up the value chain. In Ethiopia, Kenya, and West Africa increasing value addition also takes place.
African countries working towards the advancement of inclusive growth will benefit from value chain upgrading
To achieve inclusive growth, Africa needs to enter into new value chains and upgrade existing ones. This necessitates involvement in both downstream and upstream pro-duction processes. Africa provides inputs into a number of GVCs, but usually only at the very beginning of the chain as a producer of the raw material. Africa shows a low foreign value added in its exports (UNCTAD, 2013), but the situation is not homogenous. In Egypt, Morocco,
Traditional Approach Value Chain Approach
REGIONAL INTEGRATION
Liberalization direction Internal liberalization external and internal liberalization (North-South agreements complement South-South agreements)
role of regional market access
Market access for regional firms to sell final goods to consumers
Market access develops supply chains
regional market is a source of inputs
- extra-reC and intra-reC firms matter
activities taking place through regional market
regional trade and FDI Global and regional trade, FDI, and non-equity modes of production (e.g. licensing, contract farming)
Governance of cross-border transactions
arms-length market and the state
Firm to firm
Non-market modes of governance and the state
Intra-firm
relationship between local and global markets
Substitutes Complements
type of value chain Import for final consumption Import to process for local consumption
Import to process and then export for final consumption, or further value added abroad
regional trade agreement (rta) issues
tariff barriers
race to the finish line
Non-tariff barriers: deeper integration through services, r&D and Ip, and movement of capital
each stage of the Fta has flexibility on what issues could be included
GROWTH
Specialize in Final goods tasks
aim Ownership of final goods production
Ownership of key technologies
Value addition – through local linkages and increased regional value added.
Ownership of key technologies
Source of profits and competitive advantage
Manufacturing
Finished goods
Value added: modern services sector and manufacturing
Market power of lead firm in input or output markets
proprietary inputs, especially intangibles (marketing, design, Ip)
Industrial policy Import substitution export promotion and FDI attraction
trade facilitation
Cluster strategy
Table 6.1 traditional vs. value chain approach to regional integration and growth
Source: authors.

African Development Report 2014 Regional integration for inclusive growth 99
which often creates more productive jobs in less precarious tasks or industries. Economic upgrading in one country may have positive regional spillovers by increasing de-mand for regional goods and services as well as the stock of productive know-how.
A value chain approach looks beyond traditional approach-es to focus on the governance of production by firms, the cross-border nature of production processes, and the inter-connectedness of markets (see Table 6.1). A cross-border value chain approach is best advanced through non-tariff measures and maximizing benefits from more competitive regional and global markets. Value chain benefits arise from access to different production networks through expanding regional market access, changing the type of access provided to firms, and offering exposure to international capital and best practices. At the same time, fostering inclusive growth through value chains may lead to broader integration, by creating preferential trading regimes with overseas blocs who are important sources of efficiency-seeking capital and consumer markets for regional firms. Most importantly, ac-cessing value chains requires deeper regional integration to ensure that non-tariff issues are addressed, as they become
Intra-African FDI
(January 2003 to January 2014)
Extra-African FDI
(January 2003 to January 2014)
top 10 recipients Greenfield inflows from africa (% of total)
top 10 recipients Greenfield inflows from rest of World (% of total)
Ghana 74 (28%) South africa 1055 (98%)
Uganda 66 (45%) Morocco 576 (99%)
tanzania 60 (34%) egypt 573 (99%)
Nigeria 54 (14%) tunisia 342 (98%)
Kenya 53 (17%) Nigeria 327 (86%)
rwanda 53 (62%) algeria 295 (89%)
Zambia 52 (34%) angola 275 (92%)
Namibia 38 (42%) Kenya 261 (83%)
algeria 37 (11%) Ghana 186 (72%)
South Sudan 37 (64%) tanzania 114 (66%)
Total 882 (14%) Total 5341 (86%)
Table 6.2 Destinations of Greenfield FDI
Source: Ft FDI database.
increasingly important for efficiency when integrating pro-duction across borders.
In this context, African firms need to provide inputs into the supply chains of retailers; produce intermediate goods, such as steel tubes and cement; develop regional production link-ages through beneficiating minerals; and diversify into new end-markets through meeting regional sources of demand.
6.2.2 Supply chains Regional suppliers can benefit from intra-African FDI to enter into new value chains. Growth in FDI, especially intra-African, has expanded a variety of mostly consumer facing service industries across the continent. Although in-tra-African FDI in financial services has expanded greatly (see Chapter 5), retailers have the most extensive supplier networks, with around 38% of intra-African greenfield FDI projects in retail banking between 2003-2013. Generally, intra-African FDI is more diversified in its destinations than FDI to the continent from the rest of the world FDI inflows from outside the continent mainly target the ma-jor African economies and oil producers (see Table 6.2).

100 Chapter 6 Leveraging africa’s Value Chains
such as South Africa (2%), Angola (8%), Algeria (11%), and Nigeria (14%) are not reliant on intra-Africa FDI flows as a source of foreign capital.
From a supply chain perspective, the rapid expansion of African retailers across the continent, using a combination of FDI and acquisitions, offers important opportunities for regional firms to provide inputs. South African retailers Shoprite, Pick n Pay, Massmart (recently purchased by Walmart) and Woolworths have between them rough-ly 340 retail outlets outside of South Africa, mainly in southern and east Africa and expanding now into West Africa. These supermarkets all need to source the items on their shelves.
6.2.3 Longer value chains Value chains offer Africa a chance to specialize in interme-diate goods and services. Global trade today is dominated by trade in intermediate goods those required to produce other goods and services; and this trade accounted for roughly two-thirds of the global total in 2012 (Saito et al., 2013). Unless REC member states are involved in inter-mediate goods and services, they will struggle to capture a greater market share of global trade. They will need to adopt a more global perspective, because intermediate inputs must be integrated within a larger division of labor across countries and continents (i.e. ‘longer’ value chains). Therefore, as focusing on assembly or low value-added activities has increased, the proportion of foreign content in exports has grown, almost doubling between 1970-2005, and the ratio of exports to output has also risen (Saito et al., 2013).
Considering its current endowments, Africa could provide several basic intermediate inputs to regional and global production networks. Intermediate goods account for roughly 29% of intra-African trade, showing considerable diversity and concentration; the top 10 goods account for a third of all intermediate goods traded (see Table 6.4). But most are unsophisticated items, whereas Africa could develop supply chains by processing its abundant com-modities refining steel, aluminum, and iron, and much more besides this.
Meanwhile, intra-African FDI projects are a significant source of FDI for African countries that are less developed (table 6.3 below) – many of which are not major commod-ity exporters. Intra-African FDI projects are particularly present in East African countries. West African countries feature much less prominently in the top 20 recipients of intra-African Greenfield FDI projects, showing the importance of the orientation of the regional power as well as the general business environment in attracting non-regional power projects. Larger African countries
(Share of intra-African Greenfield FDI project by number in total inward FDI projects, January 2003 to January 2014)
Destination Country african Greenfield FDI (% of total)
Burundi 79
South Sudan 64
rwanda 62
Uganda 45
Namibia 42
Zimbabwe 39
tanzania 34
Zambia 34
Sierra Leone 33
Ghana 28
Botswana 28
Cote d'Ivoire 24
Congo (DrC) 24
Mozambique 23
Kenya 17
Libya 14
Nigeria 14
algeria 11
angola 8
South africa 2
Table 6.3 Intra-african Greenfield FDI projects
Source: Ft FDI database.

African Development Report 2014 Regional integration for inclusive growth 101
By accessing lead firms and larger consumer markets, Africa can expand its input trade. The case of Nampak (see Box 6.1), Africa’s largest packer, shows that effective utilization of Africa’s potential as a supplier of intermedi-ates is more likely to occur with access to global markets, complementary capital, and neighbors with sophisticated firms that govern supply chains either as lead firm or first tier supplier. It also suggests that growing consumer markets in Africa have made regional value chains more viable, as African countries now have sufficient demand capacity to consume a relevant portion of any intermediate good themselves as well as assist in its production.
African firms are also becoming competitive in providing intermediate input into modern services.1 Much of Africa’s growth over the last decade is due to the rising contribution of services to GDP. Africa’s world export share of travel and transport services has grown rapidly since 1998, and its exports of communications and travel accounted for almost 4% of the world share in 2011. Though its global
1 See the World Bank 2013 conference on raising the profile of trade in Services in africa: http://www.worldbank.org/en/news/feature/2013/06/26/raising-the-profile-of-trade-in-services-in-africa
Source: authors.
Nampak, a major South african corporation, is africa’s largest and most diversified packager. It maintains production operations in 12 african countries besides South africa, accounting for 36% of the group’s total gross profit. Nampak began producing cardboard boxes in South africa, and after various mergers and acquisitions, is today a major supplier of plastic bottles for the dairy industry in the UK.
a smaller aspect of Nampak’s production has seen the creation of an elaborate value chain in Southern africa, centered in Luanda, angola, utilizing regional and global demand, products and inputs. In april 2011, Nampak built an initial USD 160 million facility in angola to meet demand from SaBMiller, who have bottling facilities and licensing agreements in angola.
the facility uses tin plate imported from europe and aluminum ends produced in angola by Nampak, with the aluminum itself sourced from a company in South africa, hulamin. previously, Nampak exported about 500 million cans each year to angola; but with a growing end market in angola and tax incentives, Nampak has expanded to angola and now Nigeria.
to make production viable in angola, Nampak is self-sufficient and generates its own electricity; treats and uses all wastewater for irrigation, including sewage; designs and upgrades many pieces of equipment and processes internally; and maintains all services equipment in-house.
Box 6.1 Nampak and intermediate goods trade
USD millions %
Ships, boats & floating structures 1095 5.4
Civil engineering & contractors' plant & equipment 908 4.4
electric current 759 3.7
Fish (fresh, chilled or frozen) 736 3.6
Iron & steel bars and related items 680 3.3
paper & paperboard, cut to shape or size, articles 680 3.3
residual petroleum products (n.e.s.), related mater. 671 3.3
Sugar, molasses and honey 664 3.2
Structures & parts (n.e.s.), of iron, steel, aluminum 557 2.7
Flat-rolled prod., iron, non-alloy steel, not coated 555 2.7
% of total intra-African intermediate trade 35.7
Table 6.4 Intermediate goods traded within africa, top 10 intermediate in USD and % of total (2012)
Source: Strauss and Charaf-eddine (2014).
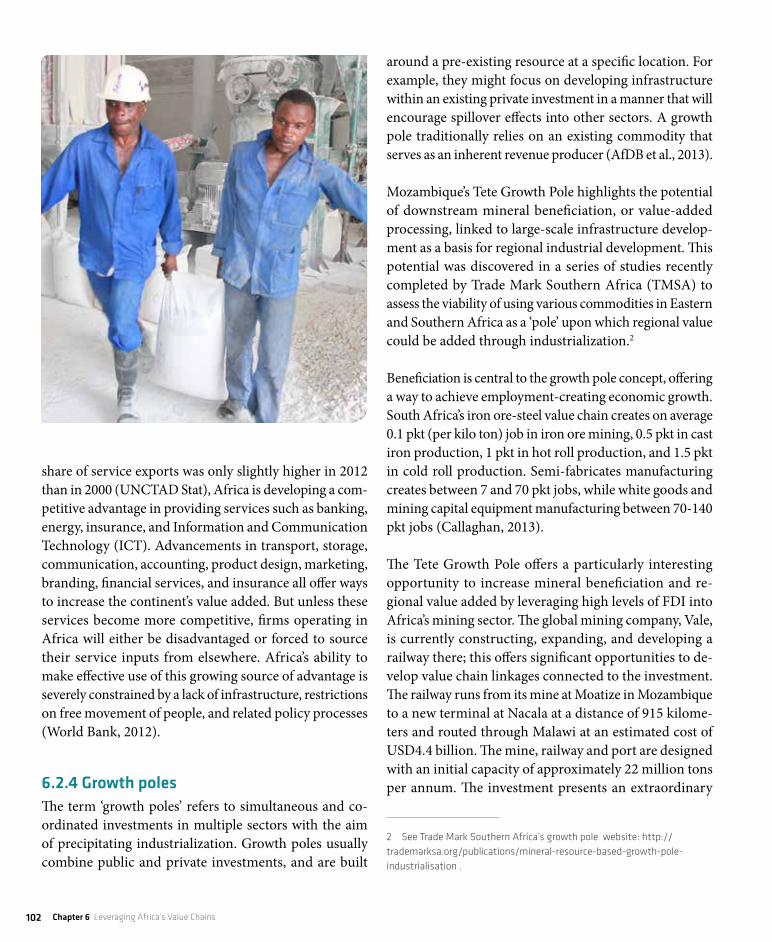
102 Chapter 6 Leveraging africa’s Value Chains
around a pre-existing resource at a specific location. For example, they might focus on developing infrastructure within an existing private investment in a manner that will encourage spillover effects into other sectors. A growth pole traditionally relies on an existing commodity that serves as an inherent revenue producer (AfDB et al., 2013).
Mozambique’s Tete Growth Pole highlights the potential of downstream mineral beneficiation, or value-added processing, linked to large-scale infrastructure develop-ment as a basis for regional industrial development. This potential was discovered in a series of studies recently completed by Trade Mark Southern Africa (TMSA) to assess the viability of using various commodities in Eastern and Southern Africa as a ‘pole’ upon which regional value could be added through industrialization.2
Beneficiation is central to the growth pole concept, offering a way to achieve employment-creating economic growth. South Africa’s iron ore-steel value chain creates on average 0.1 pkt (per kilo ton) job in iron ore mining, 0.5 pkt in cast iron production, 1 pkt in hot roll production, and 1.5 pkt in cold roll production. Semi-fabricates manufacturing creates between 7 and 70 pkt jobs, while white goods and mining capital equipment manufacturing between 70-140 pkt jobs (Callaghan, 2013).
The Tete Growth Pole offers a particularly interesting opportunity to increase mineral beneficiation and re-gional value added by leveraging high levels of FDI into Africa’s mining sector. The global mining company, Vale, is currently constructing, expanding, and developing a railway there; this offers significant opportunities to de-velop value chain linkages connected to the investment. The railway runs from its mine at Moatize in Mozambique to a new terminal at Nacala at a distance of 915 kilome-ters and routed through Malawi at an estimated cost of USD4.4 billion. The mine, railway and port are designed with an initial capacity of approximately 22 million tons per annum. The investment presents an extraordinary
2 See trade Mark Southern africa’s growth pole website: http://trademarksa.org/publications/mineral-resource-based-growth-pole-industrialisation .
share of service exports was only slightly higher in 2012 than in 2000 (UNCTAD Stat), Africa is developing a com-petitive advantage in providing services such as banking, energy, insurance, and Information and Communication Technology (ICT). Advancements in transport, storage, communication, accounting, product design, marketing, branding, financial services, and insurance all offer ways to increase the continent’s value added. But unless these services become more competitive, firms operating in Africa will either be disadvantaged or forced to source their service inputs from elsewhere. Africa’s ability to make effective use of this growing source of advantage is severely constrained by a lack of infrastructure, restrictions on free movement of people, and related policy processes (World Bank, 2012).
6.2.4 Growth polesThe term ‘growth poles’ refers to simultaneous and co-ordinated investments in multiple sectors with the aim of precipitating industrialization. Growth poles usually combine public and private investments, and are built

African Development Report 2014 Regional integration for inclusive growth 103
to hubs. Foreign capital from outside the continent could also play this role.
Regional integration aims to increase opportunities for regional value added. Regional value chains may offer important benefits in this respect, providing an outlet for local firms to diversify their exports, gain new capa-bilities, and diversify into different end-markets which is especially important in reducing over-reliance on specific countries and regions. Such benefits have been evident for Swaziland and Lesotho-based firms engaged in regional clothing production in Southern Africa, and otherwise reliant on trade preferences such as through the African Growth and Opportunity Act (AGOA) to secure their end-markets. Regional chains offer limited benefits when they are the basis for a stand-alone development strategy.
Despite Africa’s poor infrastructure and related high costs, its regional suppliers have obvious advantages. Regional firms have the advantage of proximity to regional con-sumers and producers. African consumers are growing in number and per capita income, and may become a more important source of advantage; but for now the benefits of proximity to specific competitive regional producers is likely to be more important than proximity to consumers. Poor infrastructure may undermine the benefits of proximity, while the global trend is towards stricter requirements on lead and lag times. In the cloth-ing industry, just-in-time production or ‘fast fashion’ is important, so proximity helps in meeting strict time specifications, especially when transport and logistics are relatively weak. However, proximity cannot be the sole basis for a sustainable competitive strategy, as discussed along with other challenges below.
opportunity to pursue a cluster of previously impossible large-scale industrial projects, which hold the potential to transform the region’s economy. One option currently being explored would be to use excess coal at the existing colliery in Moatize, nearby iron ore (in Mozambique) and heavy minerals sands (in Malawi) as feedstock for two proposed industrial clusters, one at Moatize and the other at Liwonde in Malawi. These industrial clusters would focus on the production of energy, liquid fuels and fertilizer as well as improving the performance of the transport and logistics systems that service these land-locked regions.
6.2.5 New end-marketsGlobalized production has been accompanied by a growth in regional trade relative to inter-regional trade (Saito et al., 2013). Many production networks are regional today, although most are connected to global markets to ensure competitiveness. Africa’s intra-regional flow as a share of its total GVC participation appears to be low (UNCTAD, 2013). In value chain terms, this may be explained by an excess of inefficient ‘spoke’ firms and a shortage of advanced ‘hubs’ to integrate them.
The creation of more complex regional value chains re-lies on the existence of a lead firm to organize the chain, either as the buyer or a producer. This applies to all value chains, but in regional chains the lead firm or their first tier supplier needs to be located in the region in order to generate ‘spoke’ operations there. Good neighbors may be especially important in developing regional value chains, as is South Africa in Southern Africa. Intra-regional FDI, offers a vital base upon which spokes can be connected

104 Chapter 6 Leveraging africa’s Value Chains
a result of just-in-time (lean) production requirements; the growing use of standards for products and processes (traceability); and the increasing concentration of power in lead firms.
Global markets have become more competitive, as produc-tion has become more technology- and skills- intensive and controlled by relatively fewer firms. In particular, the GVCs for some of Africa’s most important markets have tended towards consolidation and centralization in recent decades. This has heralded a shift in authority, from the public to the private sector, and from the domestic to the foreign (ODI, 2013). The domestic organization of production, marketing, and exporting in Africa has become more diffused in many states, with the removal of parastatal organizers (such as marketing boards). Many of these processes and standards have become stronger, but established by the foreign private sector firms that drive GVCs. Lastly, Africa’s capabilities are low and prevent it from benefiting from many important value chains.
Africa’s entrance at the bottom of value chains, through labor-intensive and small-holder production, offers the largest opportunities for expanding formal employment. Nonetheless, this frequently means the lowest remunera-tion and poorest working conditions (Capturing the Gains, 2012). As a result of such low value-added chains, African countries face difficulty with upgrading economically. Their low barriers to entry make functional upgrading and local linkage development at best a gradual process, and make im-proving wages and working conditions a constant struggle.
Yet the economic effects of spreading value chains are sub-stantial for countries previously marginal to global pro-duction. Upon entering a value chain, process and product learning and upgrading commonly results from having to produce to more exacting specifications. But these same structures also create barriers to suppliers acquiring more advanced capabilities in marketing, design and intellectual property (Schmitz and Knorringa, 2000).
Several trends make it more difficult to benefit from value chains. Value chains are becoming more competitive as
6.3 Leveraging Value Chains

African Development Report 2014 Regional integration for inclusive growth 105
6.3.1 Social and economic standardsAfrican countries define specific standards for firms, which heavily determine firms’ competitiveness and ability to sus-tain social and economic upgrading. Economic and social standards are of growing importance as global integration advances rapidly. Under conditions of global integration, economic benefits are often harder to sustain for several reasons. First, certain types of capital are fairly footloose. Second, the transfer of capabilities domestically can be fairly limited and stunted by the use of more competitive imported inputs. Third, there is growing difficulty in extracting tax revenues from profits owing to the growing use of incentives to compete for capital and transfer pricing.
Private and publicly mandated standards and their enforce-ment are important in shaping the boundaries of competi-tion. If companies seek competitiveness through reducing wages, and social and regulatory payments (the ‘low road’), rather than through investment and advancements in tech-niques, skills, technology, machinery, and sourcing pro-cesses (the ‘high road’), improvements in economic returns will come at the expense of social upgrading, which refers to the improvements of workers’ rights, entitlements and working conditions. In practice, both types of competition may co-exist within the same chain. Social upgrading re-quires policies of a national, regional, and ultimately global, nature that look to secure minimum standards for wages and workplace rights, and environmental protection. Private standards such as Global GAP3 can be as demanding as public standards, and may impede the ability of domestic producers to enter regional food supply chains. Entering as a preferred supplier, in a retail or fast food enterprise, for example, requires meeting onerous requirements con-cerning quality, time, and other areas.
The fast food company KFC (Kentucky Fried Chicken), for example, has exacting standards, which reduces the regional sourcing of its inputs in Africa. It conducts a roughly six-month audit of potential suppliers, covering food safety; pest control; the ability to receive, distribute,
3 Voluntary’ standards, made mandatory by the private sector for their suppliers, for the certification of agricultural products around the globe. See: http://www.globalgap.org/uk_en/ .
and store products; appropriate constant temperature control from ‘farm to fork’; staff training; equipment spec-ifications; documentation and record keeping. Suitable suppliers have to be identified and, at times, convinced to become a supplier, given the potentially substantial cost of upgrading their processes and facilities to meet the stringent standards. For example, KFC worked with a Kenyan poultry supplier for more than a year to ensure it met its standards, because it had to be capable of supplying four tones of high quality chicken (almost 4,000 chickens) every week to KFC’s three outlets. KFC in Ghana currently sources its chickens from South Africa and Egypt and its potatoes from Belgium and Holland because of an appar-ent inability of local suppliers to produce to global safety standards and specifications. Inadequate sourcing options also mean that some KFC sandwiches on the continent do not contain lettuce.
6.3.2 Rules of origin and transport costs Preferential rules of origin (RoO) are the cornerstone of any free-trade agreement (FTA), and intended to minimize trade deflection. Trade deflection is the phenomenon by which goods are shipped from a third country via the customs territory of a country with more favorable market access to the destination country. Because some FTAs use RoO are used primarily as a means of trade protection, they are often stricter than needed to deter trade deflection and promote inter-FTA trade.
Rules of origin are also sometimes viewed as a way to pro-mote industrialization. It is argued that if the RoO are too liberal this will promote ‘screwdriver operations,’ or minimum processing which does not confer substantial transformation. However, there is little evidence to support the notion that stricter RoO stimulate integrated production structures in developing countries (Brenton and Imagawa, 2004). Unless the RoO take into consideration the com-plexity of global value chains, FTAs will be underutilized.
Rules of origin that govern African regional FTAs tend to be more stringent than liberal, due to multiple reasons mainly related to the political economy of integration. FTA members generally perceive that liberal RoO and

106 Chapter 6 Leveraging africa’s Value Chains
1,800 to ship the same container from Japan to Durban.4 Figure 6.1 shows the costs and time required to export a full container by ocean transport across regions and the Eastern and Southern Africa (ESA) region encompassed by the Tripartite is close to being the worst-performing region across costs and days to export.
In the case of Shoprite, its lead-time to supply one of its stores in Nigeria from its base in Cape Town is 117 days and has resulted in the company considering building a distribution center in Nigeria.
6.3.3 Access to foreign capitalImproving Africa’s value addition is complicated by inade-quate supply capacity, which is constrained by the small size of national and regional markets and a limited pool of workable capital, meaning machinery and related management and production know-how.
4 See trade Mark Southern africa (n.d), ‘tMSa Supports trade and transport Facilitation programme for COMeSa-eaC-SaDC region’. Online: http://trademarksa.org/about_us/programme_news/tmsa-supports-trade-and-transport-facilitation-programme-comesa-eac-sadc-reg. Costs are obviously variable and are dependent on whether there is a back-load available for the transporter to bring back; on whether the cargo is pre-cleared, whether the cargo is containerised or break bulk, etc.
increased production based on regional value chains are not beneficial to all. Thus the political consequences of potential job losses in a particular sector, albeit minimal, may not be adequately addressed at the national level. Re-gional RoO will continue to restrict rather than encourage the development of regional value chains.
Rules of origin remain an important non-tariff barrier to developing regional supply chains (World Bank, 2012; Charalambides, 2013). While Shoprite expanded its pres-ence throughout Africa using regional instruments, it struggled to administrate compliance with RoO to qual-ify for SADC preferences on consignments sent outside of South Africa. Shoprite spends an estimated ZAR 40 million to secure ZAR 93 million worth of SADC tariff reductions through compliance with RoO and import documentation. Other retailers do not even begin to com-plete the documentation due to the expenses incurred (Charalambides, 2013).
Despite the formal commitment of RECs and their mem-ber states to trade facilitation measures, sub-Saharan Africa performs poorly on the cost of trading. This im-pedes the development of regional trade and in turn in-tra-African FDI. It costs about USD 8,000 to ship a 20ft container from Durban to Lusaka, while it costs USD
Cost of exporting in USD Days to export
35
30
25
20
15
10
5
0EU EAP ECOWAS ESA South
AsiaTriparite
2.000
1.800
1.600
1.400
1.200
1.000
800
600
400
200
0EAP EU ECOWAS South
AsiaESA Triparite
Figure 6.1 export costs in africa
Source: trade Mark Southern africa (2013) based on World Bank Doing Business.
Note: eap = east asia and pacific; eCa = europe and Central asia; tripartite = eaC, COMeSa and SaDC. Cost excludes tariffs are by ocean transport for a 20 foot container.

African Development Report 2014 Regional integration for inclusive growth 107
as technology and skills transfers need to be actively fostered. Moreover, it cannot be certain that regional value added will increase dramatically from value chain upgrading. Even if output increases, inputs can be sourced from elsewhere. The cocoa industry in Ghana illustrates that even when it is possible to attract foreign capital to higher value added tasks, regional value added might not appear to increase much (Box 6.2). Weak local input markets constrain the attractive-ness of local suppliers and additional functional upgrading. 5
5 eleven firms contribute to Ghana’s 250,000 tons of processed cocoa. While only three are fully owned by multinationals, they contribute 67% to the total processed cocoa.
Accessing foreign capital is a vital way in which a country can tap into global value chains and gain access to global end-markets and input markets. In the instance of the Southern African clothing value chain, domestically-based firms had the capacity to supply the bourgeoning regional market because they were entities established through FDI by foreign firms from Asia and Europe with pre-existing buyers and suppliers.
However, it remains difficult to benefit from foreign capital and increase regional value. Costly investment incentives are often used without coordination across countries, leading to a ‘race to the bottom’ (VCC et al., 2013). The benefits which may come with accessing foreign capital are not guaranteed
Upgrading into cocoa processing has taken place in the West african cocoa value chain. africa’s world share of grinding in cocoa beans increased from 12.4% in 2000 to 18.6% in 2013, owing in particular to Ghana and Côte d’Ivoire (the world’s number one and two producers of cocoa) moving up the value chain.
Upgrading in Ghana was driven by generous incentives and partial liberalization of the sector. partial liberalization meant that from 1993 licensed buyers and processors were allowed entry into the market. In 1995 economic free zones were established to attract foreign firms, including cocoa processors, through tax emptions. post-2000, additional incentives to attract processors were used including subsidizing beans. Ghana established multiple economic free zones at port areas that were designed to attract foreign investors and create industry hubs through various tax exemptions. With the increase in commodity prices, further processing capacity shifted to Ghana in late 2000, and at the same time integration into processing also assisted in ensuring security of supply. While such incentives had a noticeable impact in attracting capital, they came at a significant financial cost to the state.
In West african cocoa-exporting countries, economic capabilities, skills and domestic value added have improved to an extent from the functional upgrading, but regional value added does not seem to have increased dramatically. Social benefits from cocoa are notable since harvesting work is usually done by male family labor on small-holder farms. the sector employs 1 million people in Côte d’Ivoire while in Ghana it employs 800,000, and its cocoa board employs 7,500. Inclusion benefits are great since local farmers get paid a guaranteed 70% of the Free on Board (FOB) price of a bag of cocoa in Ghana, and this can increase in relative terms if the cocoa price falls as it is set in advance. For the processing, most of it is done by foreign firms abroad, though some domestic firms provide supply into this chain.5 processing companies employ around 1,600 individuals, a combination of low-skilled and quite highly-skilled workers.
Limited availability of inputs constrains further increases in regional value added. For lower value-added cocoa products (cocoa beans and powder) the region is important as an import partner; but for higher value addition products (chocolate) the region is important only as an export partner. the regional market also facilitates the combining of different beans for blending and flavoring and much of this trade is intra-firm. the chocolate related products traded regionally come from foreign subsidiaries. For example, Cadbury and Nestlé produce beverages like Bournvita and Milo in Nigeria for the domestic consumer market (UNeCa, 2013). Both companies also export between 35% and 55% of their output regionally. a lack of domestic supply capacity in key inputs, such as milk, sugar, packaging and business services and more, means that any increases in regional supply will not necessarily be met by increases in regional value added.
a lack of domestic inputs also severely constrains the ability of local firms to integrate into chocolate production. a fundamental stumbling block with respect to this is access to large end-markets, without which local firms will not be able to compete against more cost-effective products that are produced in a much larger quantity. Foreign-owned producers are better placed to take advantage of regional demand for chocolate owing to their superior productive capabilities and their pre-existing economies of scale and buyer networks. Scale matters for a number of reasons. Chocolate production is more machine-intensive and efficient logistics require bulk. For example, high-volume shipping is available only to those firms which source large quantities of cocoa; while complete functional integration ensures by-products of production can be sold (i.e. cocoa powder from cocoa butter). this highlights the importance of cluster strategies for value chain upgrading.
Box 6.2 Ghana’s cocoa industry
Source: authors based on Van hüllen (2013).

108 Chapter 6 Leveraging africa’s Value Chains
equal trade advantages based on reciprocity) tariff rates decline, other aspects become relatively more important in enhancing the quality of market access. For example, in the SADC, even though a full FTA has been in operation since January 2012, NTBs impede one-fifth of all recorded regional trade (World Bank, 2012). Second, production costs are a function of all the processes needed to bring a good or service to market efficiently; these NTBs include unnec-essary processes and interruptions in customs, delays and costs of transport and logistics systems, customs processes at the border instead of behind it, and difficulties in making cross-border payments. The total cost of delivering a prod-uct to the final consumer increases almost exponentially as the number of production stages increases. Doubling the number of stages in the supply chain more than doubles the total delivery costs (Ferrantino, 2013).
Deeper integration through common standards and spec-ifications facilitates value chain operation. Baldwin (2012) argues that deep trade agreements are necessary because entering supply chains requires integrating a developing country’s economy more fundamentally with the ‘head-quarter’ economy from where the supply chain is governed. Standards and product specifications may be more detailed and require closer coordination than in a pure market transaction; and the company’s property, some of which will be proprietary, will need protection especially when licensed out through a non-equity mode (NEM).
Competitive modern services may also become an im-portant part of a deepening agenda, since MNE supply networks require access to reliable and efficient service infrastructure for telecommunications, transportation, storage, energy, and finance to coordinate the production process. Still, services have received insufficient attention in formal African integration agreements (Hartzenberg, 2011).
6.4.1 Deeper integration Multinational enterprises (MNEs) chose the most efficient supplier of goods and services in a value chain, determined by a costs, quality, and process indicators. These factors are determined in part by trade taxes, including tariff rates, Value Added Tax and taxes of equivalent effect.
African states have been progressively reducing their overall tariff rates (see Chapter 2) and the number of tariff bands. Most RECs are currently in the process of refining existing FTAs through tariff reductions and improving rules of origin. Where tariff peaks and escalation do exist, they are an exception. Some RECs have delayed sched-ules to achieve customs unions, concentrating instead on improving the performance of existing FTAs. They have also paid more attention to the removal of NTBs to trade, and improving trade facilitation measures.
In a globalized world, the additional costs of trade intro-duced through non-tariff measures are greater constraints to value chain systems than tariffs themselves. First, as most favored nations’ (MFN, which refer to countries enjoying
6.4 regional policies

African Development Report 2014 Regional integration for inclusive growth 109
regionally or outside the continent. As these competitive pressures intensify, incentives may arise for employers to compete regionally by reducing labor standards. This has important global dimensions as wage competition is driven by dynamics in the global labor market.
Developing regional social standards or a ‘social floor’ can prevent countries from competing by lowering benefits and workplace conditions. Minimum standards, differ-entiated for varying country conditions, are required on issues relating to wages and basic working conditions. This provides support to governments that may struggle to secure decent work standards on their own.6
Such a policy could include these steps:
(1) Ratification and incorporation of core ILO labor con-ventions in national legislation, enacting minimum wages and other labor rights in national legislation (some countries might require ILO technical assistance to develop national legislation);
(2) Harmonization of labor-related legislation regionally, with agreement on what to phase in and what should remain differentiated;
(3) Establishment of a regional body to monitor compli-ance, with assistance from international organizations and donors; and
(4) Integration of these processes and mechanisms into continent-wide trade relations, with derogation from core labor standards listed as an actionable violation.
Many RECs have already undertaken a number of these steps (see Box 6.3), although implementation and monitor-ing remain a challenge, and issues of a regionally differenti-ated and enforced minimum wage are not yet on the agenda.
ECOWAS shows a greater sense of urgency in its regional labor policy, as it looks to advance industrial coordination
6 Zambian Shoprite workers were given a pay rise only after authorities in the country threatened to revoke its trading license.
Several areas of policy cooperation may be productive. RECs add value by addressing issues which cannot and should not be addressed at the national level, and which RECs have the capacity to address. Trade facilitation is an instrument which makes additional industrial development measures at the national level more effective. RECs could further en-hance their on regional tax cooperation and harmonization, given the limited fiscal capacity of many member states and the potential destructiveness of certain types of incentives competition. Regional coordination on the use of special tax regimes to attract much needed foreign capital offers potentially large social and economic gains. However, rec-ommendations in this report (see Chapter 7) do not cover full-blown industrial policy at the regional level.
6.4.2 Labor standards Policies to advance minimum standards cannot result solely from MNE corporate social responsibility (CSR) ventures. CSR-led standard setting has had mixed success (UNCTAD, 2013), does not imply all types of firm, and their voluntary nature undermines their ability to suffi-ciently change the incentives facing economic actors as compared to mandatory standards. National social and economic standards are vital, but may be insufficient to prevent a ‘race to the bottom’ in wages and tax competition if the race is a global one. Yet regional policies can play a vital role in supporting efforts to scale up efforts towards globally consistent minimum standards.
Most RECs are formally committed to the harmonization of regional labor legislation, although implementation and monitoring lag far behind intentions. Most member states have ratified the key ILO labor conventions, although the legal protection of workers’ rights may be limited when it comes to the right to strike, minimum of basic working conditions, and remuneration. As regional industry grows, mechanisms are needed to ensure the gains from production can be evenly distributed. Ensuring that all RECs protect minimum labor rights is vital to regional industry fostering inclusiveness. A 2012 ILO study (von Uexkull, 2012) found that regional exporters in ECOWAS had very similar characteristics to regional firms who export globally, indicating they are under enormous competitive pressure regardless of if they export

110 Chapter 6 Leveraging africa’s Value Chains
through the West African Common Industrial Policy. The ECOWAS Treaty already works towards the harmoniza-tion of labor law and social security legislations between member states, building upon its Labor and Employment Policy of June 2009. In consultation with the ILO, ECOW-AS has now drafted a regional Labor Code that will serve as the basis for integrating national labor institutions and harmonizing labor and employment policies in the region.
EAC and its member states have worked closely with the ILO to promote and develop decent work programs nationally and regionally, focusing on youth employment creation, extension of social protection, and enhancement of capacity for social dialogue. An EAC model social protection floor implementation strategy was to make a minimum of social protection available across the region, but labor law har-monization and implementation has been slow.
The AU is supporting a regional social floor through the Social Protection Plan for the Informal Economy and Rural Workers (SPIREWORK), which focuses on informal sector and agricultural workers. Further advanc-ing such an agenda at the regional level requires greater participation of civil society. In the current Tripartite negotiations, more extensive public engagement could be precipitated by ensuring greater transparency in the text under negotiation. South Africa has raised the issue of core labor standards, but other states prefer to address it under Movement of Business Persons and thus outside the Tripartite Negotiating Forums.
SaDC has adopted treaties and protocols which are relevant to the content of national labor laws based mostly on ILO core conventions, which it requires member states to ratify. all member states are required to submit regular progress reports on their compliance with the SaDC social Charter to the annual SaDC tripartite sectoral meeting. Labor laws are also supposed to be harmonized, as is the case in eCOWaS and eaC, but the relevant SaDC cluster has so far not managed to advance this. SaDC Ministers and Social partners responsible for employment and labor have recommended a new SaDC draft protocol on employment and Labor to SaDC Council of Ministers for approval through the SaDC Committee of Ministers of Justice/attorneys General, before signing by SaDC Summit of heads of State and Government intended for 2014.
this is an important step in having common labor standards and a common regulatory framework but will not demand regionally agreed and enforced minimum wages, which could remain regionally differentiated. advancing such an agenda requires a greater use of regional machinery that represents workers and employers (such as SeG and SatUCC – regional umbrella employers and workers organizations) and serves to highlight the role of civil society and trade unions in advancing towards these objectives.
Ongoing efforts by SaDC will likely focus on implementation issues and ratification of an expanded number of ILO protocols, including recognition of collective bargaining in the public sector.
Box 6.3 SaDC’s labor standards
Source: authors.
6.4.3 Trade facilitation Trade facilitation can make market access and infrastructures more efficient for traders. It looks to reduce the costs asso-ciated with the movement of goods across national borders while maintaining and streamlining necessary regulatory procedures. Costs can be incurred directly (collecting and submitting information) or indirect (timely border checks).
Trade facilitation measures have received a boost with the approval of the WTO Trade Facilitation Agreement (TFA). After nine years of multilateral trade negotiations, the TFA was approved at the WTO Ministerial Meeting in Bali in December 2013. Most African countries are members of the WTO, or in the process of accession, so will be required to take measures to implement its provisions. The final trade facilitation agreement contains provisions for faster and more efficient customs procedures through effective cooperation between customs and appropriate authorities on trade facil-itation and customs compliance. It also contains provisions for technical assistance and capacity building.
Most RECs and their member states must build capacity to implement trade facilitation provisions rather than convince governments to sign up to trade facilitation measures. Most RECs have provisions that go beyond the WTO TFA provisions, and most African countries are committed to the implementation of the Revised Kyoto Convention, so they should have few difficulties in com-plying with the WTO agreement. In practice, additional capacity may be needed to fast-track implementation.

African Development Report 2014 Regional integration for inclusive growth 111
only stop once for inspection and clearance. Establishing an OSBP requires substantial planning to put in a place a new legal framework, border procedures, a data sharing system, and the actual physical premises.
Aid for Trade (AfT) is a mechanism used to build trade-re-lated infrastructure and capacity. AfT has begun to focus specifically on trade facilitation, and has taken a strong regional and sub-regional approach rather than a bilateral one (UNECA, 2013a). At Chirundu, a border post be-tween Zambia and Zimbabwe, the first operational OSBP in Sub-Saharan Africa was opened in 2011 as part of the larger North-South Corridor Aid for Trade Programme with TradeMark in Southern Africa. The border crossing time for trucks was reduced from two-to-three days to two hours, while the fast-track preclearance process now takes 15 minutes. The AfDB finances a number of projects under-way which involve similar support activities (see Box 6.4).
Such trade facilitation programs need to facilitate private sector engagement. National Trade Facilitation Com-mittees (NTFCs) play a crucial role, enabling all relevant governmental bodies and representatives of the private sector to share information and best practice on relevant
The EAC has focused on developing capacity in trade facilitation institutions, export promotion and other pub-lic sector agencies. A lack of technical personnel is a key inhibitor, and specialized training institutions in export promotion and trade policy are rare. This lack of capacity extends into the additional skills required to enter trade negotiations (Amos, 2011).
Many advances in trade facilitation are enabled by new technologies. Customs automation, for example, has helped eliminate cumbersome manual procedures, while tailored software and modern equipment have improved risk management and post clearance audits.
Establishing joint border posts such as the one stop border post (OSBP) can help to reduce clearance times at borders.7 At Malaba between Uganda and Kenya, border-crossing times dropped from around 24 hours at the end of 2011 to less than four hours in 2012. Joint border points are where countries agree to perform joint checks so that traders
7 Integrated border management currently enjoys strong focus on the trade facilitation agenda, with a range of modalities for the management of border procedures being adopted. these include one-stop-border posts (OSBps) and single window border management modalities.
recent multinational transport projects financed by afDB have a growing facilitation component to them. Some examples include:
- the Ndende-Dolisie road and Libreville-Brazzaville Corridor transport Facilitation project.
- trans-Saharian highway project: alger – Chad – Niger.
- Multinational (Malawi-Zambia): Nacala road Corridor Development project - phase IV.
- Namibia: the New port of Walvis Bay Container terminal project.
- Mozambique: Nacala road Corridor project - phase III.
- Central african republic: transport Facilitation program on the Douala-Bangui and Douala-N’Djamena Corridors.
- Burundi/rwanda: project to Develop roads and Facilitate transport on the North-South Corridor - phase III.
- togo/ Burkina Faso: road rehabilitation and transport Facilitation on the Lome-Cinkanse-Ouagadougou CU9 Corridor.
- Gambia/Senegal: trans-Gambia Corridor Construction of the trans-Gambia Bridge and Cross Border Improvement.
- Zambia/Botswana: Kazungula Bridge project (SaDC North - South transport Corridor Improvement).
- Mali/Senegal: road Development and transport Facilitation project: the Southern Bamako-Dakar Corridor.
- Burkina Faso/Niger: transport Facilitation in the Ouagadougou – Dori-tera-Niamey Corridor.
In addition, through the africa trade Fund the afDB is supporting a number of trade Facilitation projects, such as the Namanga OSBp Soft Infrastructure project. this involves the provision of technical and capacity support to Kenya and tanzania to reform and modernize trade facilitation along the Kenya/tanzania frontier at the Namanga Border post. this includes the provision of computers, ICt networking equipment, and other operational facilities to the OSBps at the Namanga Border posts; inter-agency training for border officials; and support to the east african Community Secretariat to develop OSBp regulations to facilitate the operationalization of the OSBps.
Box 6.4 the afDB is integrating trade facilitation into its project activities
Source: authors.

112 Chapter 6 Leveraging africa’s Value Chains
investment incentives, and when used in excess, they can have negative spillover effects on their neighbors (James, 2013). In East Africa, intra-REC competition for capital has undermined some potential gains from integration (Tax Justice Network-Africa and Action Aid International, 2012). East African governments individually provide an array of costly tax incentives and others to attract FDI, leading to large national revenue transfers to private com-panies. The ‘incentive effect’ in attracting FDI is heavily watered down as almost every member states within the EAC offers similar incentives on their own accord. Incen-tives may often be provided when they are not necessary in attracting investment.
Ensuring that incentives are used responsibly requires national and regional policies. As a first step, transparency is necessary in the provision of investment incentives, drawing on the IMF Code of Good Practices on Fiscal Transparency. The EAC has made progress towards a system of harmonizing its tax incentive regime, by using a Code of Conduct which has yet to be adopted. Efforts to harmonize incentives are also underway. The SADC’s Tax Incentives Working Group (TIWG) commissioned a Study to Develop Guidelines for the Application and Treat-ment of Tax Incentives, leading to a recommendations that all new tax holidays should be phased out and old ones terminated; that incentives should shift from profit to investment based; and that a 10% minimum corporate tax rate should apply. SADC has also promoted a model bilateral investment treaty in an effort to harmonize the region’s approach to attracting FDI, and to avoid compe-tition in investment incentives.
WAEMU’s tax coordination and harmonization frame-work has achieved some limited success. Tax competition has remained a problem within the REC, according to the IMF (Mansour and Graziozi, 2013), due to special tax regimes in place to attract investments. Income tax laws in member states differ mainly on the length of income tax holiday at the operation phase of the investment. A lack of resources, monitoring and enforcement mechanisms have impeded regional coordination on tax issues in WAEMU. Non-compliance has not led to any states being taken to the regional Court of Justice.
projects, as recommended by UNCTAD. Mechanisms like the Authorized Economic Operator currently imple-mented in EAC, or the Trusted Trader programs place the private sector at the center of Trade facilitation.
In addition, since trade facilitation falls under several government ministries, one of the most important factors of success is a country’s ability to organize effective policy coordination across its ministries.
6.4.4 Investment cooperationREC member states struggle to access foreign capital and leverage it to benefit local producers. Member states tend to focus on attracting foreign capital, but may not consider in strategic terms what type of capital to attract and how it can adequately correct for market failure and encourage industrial diversification without wasting resources.
REC cooperation can help ensure that member states do not waste resources to attract investment through coordi-nation and regulation of investment incentives. This can improve the cost-efficiency and the potential benefits of FDI attraction strategies, and increase FDI attraction for regional integration by shifting investment promotion away from incentive competition.
Investment incentives are an important mechanism for correcting market failure and developing undeveloped regions. But without cooperation on the provision of

African Development Report 2014 Regional integration for inclusive growth 113
Brenton, P. and H. Imagawa, (2004), “Rules of Origin, Trade and Customs”, in L. de Wulf and J. Sokol (eds.), Customs Mod-ernization: A Handbook, World Bank.
Callaghan, C. (2013), Minerals and mineral processing value chain. Global dynamics and opportunities in the Tripartite re-gion: Regional workshop on the Tripartite roadmap, Letlapa Consulting. 21 slides.
Capturing the Gains (2012) Global Summit – Overview Report, http://www.capturingthegains.org/pdf/CtG_summit_report_March_2013.pdf
Charalambides, N. (2013), What Shoprite and Woolworths can tell us about Non-tariff Barriers, SAIIA occasional paper no.148.
Ferrantino, M.J. (2013), ‘Policies to improve the supply chain: what needs to be done’ In Fung Global Institute (FGI), Nanyang Technological University (NTU), and World Trade Organiza-tion (WTO) (2013), ‘Global Value Chains in a Changing World’, WTO, Geneva http://www.wto.org/english/res_e/booksp_e/aid4tradeglobalvalue13_e.pdf
Flatters, F. (2012), SADC Trade Audit: Rules of Origin, Technical Report, Southern African Global Competitiveness Hub.
Gereffi, G. (2002), Outsourcing and Changing Patterns of Inter-national Competition in the Apparel Commodity Chain, Paper presented at the conference on ‘Responding to globalization: societies, groups and individuals’, Hotel Boulderado, Boulder, Colorado, April 4-7. Available from: http://www.colorado.edu/ibs/pec/gadconf/papers/gereffi.html.
Hartzenberg, T. (2011), Regional Integration in Africa, Staff Working Paper ERSD-2011-14, World Trade Organization Economic Research and Statistics Division. Available from: http://www.wto.org/english/res_e/reser_e/ersd201114_e.pdf
James, S. (2013), Tax and Non-Tax Incentives and Investments: Evidence and Policy Implications, Revised Draft, World Bank, International Finance Corporation.
Kaplinsky, R., and M. Morris (2002). A Handbook of Value Chain Research. Prepared for the IDRC. Available from: http://www.sds.ukzn.ac.za/files/handbook_valuechainresearch.pdf
Any successful attempt to mitigate harmful tax competi-tion requires rules-based institutions to ensure that mech-anisms are in place to enforce and monitor compliance with relevant agreements.
African RECs may look to the European Union’s useful framework for limiting state aid or ‘selective subsidies’. Subsidies which meet this definition are not permitted unless they support a common objective of the EU, or cost-effectively correct market failures. Caps on certain types of state aid, such as regional aid, are also in place, ensuring that aid is proportionately limited to the level of disadvantage of the receiving region. These laws work to ensure that aid is provided strictly in proportion to what is needed to correct for the relevant market failure. They also require transparency in provision, limited negative spillovers, and a sufficient ‘incentive effect’ to warrant its use.
References
African Development Bank (AfDB), Organisation for Economic Cooperation and Development (OECD), United Nations Develop-ment Programme (UNDP), and United Nations Economic Com-mission for Africa (UNECA) (2014), African Economic Outlook.
AfDB, World Economic Forum (WEF), and World Bank (WB) (2013), The Africa Competitiveness Report 2013, World Economic Forum, Geneva.
African Union Commission (AUC) (2013), The Status of Inte-gration in Africa 2013, 13 November.
Amos, T. (2011), Capacity Building for International Negotiations and Trade Facilitation in the East African Community, ATPC Work in Progress no.84, Africa Trade Policy Centre UNECA. Available from: http://www.uneca.org/sites/default/files/pub-lications/atpcworkinprogress84.pdf
Baldwin, R. (2012), “WTO 2.0: Global governance of sup-ply-chain trade”, CEPR Policy Insight, no.64, December.
Baldwin, R. and J. Lopez-Gonzalez (2013), “Supply-chain trade: A portrait of global patterns and several testable hypotheses”, Working Paper no. 18957.

114 Chapter 6 Leveraging africa’s Value Chains
UNCTAD (2013a), Transport Newsletter No.58 Second Quarter 2013. Available from: http://unctad.org/en/PublicationsLibrary/webdtltlb2013d4_en.pdf
UNECA, Economic Commission for Africa (2013), Making The Most of Africa’s Commodities: Industrializing for Growth, Jobs and Economic Transformation, Economic Report on Africa, Addis Ababa, Ethiopia.
UNECA (2013a), Building Trade Capacities for Africa Trans-formation: A critical review of aid for trade. Available from: http://www.wto.org/english/tratop_e/devel_e/a4t_e/global_re-view13prog_e/gr4_rep2013_e.pdf
Vale Columbia Institute of Sustainable International Investment (VCC), World Bank, and Investment Climate Assessment (ICA) (2013), Investment incentives: scoping paper, cost-benefits, and regulatory mechanism, Draft. Available from: http://www.vcc.columbia.edu/files/vale/content/VCC_conference_paper_-_Draft_Nov_12.pdf
Van Hüllen, S. (2013), West Africa’s Cocoa Sector: The need for regional integration and value addition at origin, Background paper for African Development Report 2013/14.
Von Uexkull, E. (2012), Regional Trade and Employment in ECOWAS, Employment Working Paper no. 114, International Labour Organization.
Wolf, M. (2013), ‘Why China Won’t Buy the World’. Finan-cial Times. July 9. Available from: http://www.ft.com/intl/cms/s/0/28d1a4a8-e7ba-11e2-babb-00144feabdc0.html#ax-zz2dNN8uOX0
World Bank (2012), De-Fragmenting Africa: Deepening Re-gional Trade Integration in Goods and Services. Available from: http://siteresources.worldbank.org/INTAFRICA/Resources/Defrag_Afr_English_web_version.pdf
Mansour, M. and Graziozi, G. R. (2013), Tax Coordination, Tax Competition, and Revenue Mobilization in the West African Eco-nomic and Monetary Union, IMF Working Paper 13/163, June.
McKinsey (2013), Urban world: The shifting global business landscape, McKinsey Global Institute.
Saito, M., M. Ruta and J. Turunen (2013), ‘Trade Interconnect-edness: The World with Global Value Chains’, International Monetary Fund. Available from: http://www.imf.org/external/np/pp/eng/2013/082613.pdf
Schmitz, H. and P. Knorringa (2000), ‘Learning from Global Buyers’, Journal of Development Studies, vol. 37, no.2, pp. 177–205
Shoprite (2013), Shoprite Holding Ltd South Africa, Company Website: http://www.shoprite.co.za/Pages/home.aspx
Staritz, C. (2011), Making the Cut? Low-income countries and the global clothing value chain in a post-quota and post-crisis world, World Bank. Available from: https://openknowledge.worldbank.org/bitstream/handle/10986/2547/588510PUB0Maki101pub-lic10BOX353816B.pdf?sequence=1
Strauss, I. and N. Charaf-Eddine (forthcoming), ‘The 10 Com-mandment of Regional Integration’, African Development Review, Special Edition.
Tax Justice Network-Africa & ActionAid International (2012), Tax competition in East Africa: A race to the bottom? Available from: http://www.actionaid.org/sites/files/actionaid/eac_report.pdf
Trade Mark Southern Africa (2013), “Enhancing EIF Partner-ships”, presentation, April, Lusaka, Zambia.
UNCTAD (2011), World Investment Report 2011: Non-Equity Modes of Production and Development, Geneva. Available from: http://www.unctad-docs.org/files/UNCTAD-WIR2011-Full-en.pdf
UNCTAD (2012), Towards a New Generation of Investment Policies, World Investment Report 2012, Geneva.
UNCTAD (2013), World Investment Report 2013: Global value chains: investment and trade for development, Geneva. Available from: http://unctad.org/en/PublicationsLibrary/wir2013_en.pdf

115
Index
Capital market: pp. 2, 4, 41, 44, 68, 69, 74, 75, 76, 77, 82, 83, 84, 91.
Competitiveness: pp. 3, 4, 29, 49, 58, 103, 105.
Customs union: pp. 9, 11, 12, 15, 16, 17, 23, 24, 108.
Dispute settlement: pp. 5, 10, 19, 20, 21, 22.
Diversification: pp. 2, 35, 50, 73, 112.
Economies of scale: pp. 2, 9, 28, 33, 68, 69, 72, 73, 77, 78, 91, 107.
Employment: pp. 23, 30, 31, 35, 45, 50, 52, 56, 60, 102, 104, 110.
Export: pp. 3, 22, 24, 29, 30, 34, 42, 43, 56, 96, 97, 98, 100, 101, 102, 103, 106, 107, 109, 111.
Foreign Direct Investment (FDI): pp. 2, 3, 70, 97, 98, 99, 100, 103, 106, 107, 112.
Free movement of people: pp. 48, 49, 52, 53, 54, 55.
General Agreement on Trade in Services (GATS) Mode 4: pp. 49, 61.
Governance: pp. 2, 4, 8, 19, 20, 39, 41, 89, 90, 91, 98, 99.
Growth: pp. 2, 4, 5, 8, 12, 13, 19, 20, 29, 30, 31, 32, 34, 35, 38, 40, 42, 43, 45, 49, 50, 53, 56, 57, 58, 61, 62, 68, 69, 70, 73, 74, 75, 77, 78, 79, 80, 82, 83, 84, 85, 89, 90, 96, 98, 99, 101, 102, 103.
Implementation: pp. 4, 5, 8, 9, 12, 14, 15, 17, 18, 19, 20, 21, 22, 23, 24, 35, 38, 40, 42, 43, 44, 53, 54, 80, 81, 96, 109, 110.
Inclusive Growth: pp. 2, 4, 8, 13, 31, 34, 35, 38, 40, 43, 45, 48, 62, 69, 70, 75, 77, 78, 79, 80, 84, 85, 89, 90, 98, 99.
Industrialization: pp. 14, 15, 102, 105.
Infrastructure: pp. 2, 4, 14, 15, 18, 23, 28, 29, 30, 31, 32, 33, 34, 35, 36, 37, 38, 39, 40, 42, 43, 44, 45, 60, 62, 68, 69, 77, 78, 84, 91, 96, 102, 103, 108, 110, 111.
Information and Communication Technology (ICT): pp. 28, 29, 31, 34, 35, 37, 42, 43, 57, 60, 62.
Innovation: pp. 3, 4, 30, 31, 40, 60, 73, 74, 78, 90.
Institution: pp. 5, 8, 13, 14, 15, 17, 19, 20, 21, 24, 28, 29, 35, 40, 44, 57, 73, 77, 78, 80, 81, 85, 87, 89, 90, 91, 97, 110, 111, 113.
Labor mobility: pp. 48, 55, 56, 57, 60, 61.
Liberalization: pp. 11, 12, 23, 37, 72, 89, 96, 98, 107.
Local content: pp. 30, 31, 35, 37, 42, 45.
Market: pp. 2, 3, 4, 9, 10, 11, 12, 15, 17, 21, 24, 28, 33, 34, 35, 36, 38, 39, 40, 41, 43, 44, 45, 48, 49, 50, 52, 53, 56, 58, 60, 61, 62, 68, 69, 72, 73, 74, 75, 76, 77, 79, 80, 81, 82, 83, 84, 85, 87, 88, 89, 90, 91, 96, 97, 98, 99, 100, 101, 103, 104, 105, 106, 107, 108, 109, 110, 112.
Migration: pp. 4, 5, 48, 49, 50, 51, 52, 53, 54, 55, 56, 57, 58, 60, 61, 62.
Monitoring and Evaluation: pp. 5, 19, 24, 44.
Policy: pp. 2, 4, 9, 10, 11, 12, 14, 15, 31, 35, 39, 40, 41, 44, 48, 49, 50, 53, 54, 57, 58, 61, 69, 87, 90, 98, 102, 109, 110, 111, 112.
Private sector: pp. 4, 8, 11, 15, 18, 20, 30, 35, 39, 41, 42, 43, 44, 45, 57, 58, 61, 77, 84, 90, 104, 105, 111, 112.
Programme for Infrastructure Development in Africa (PIDA): pp. 29, 39, 40, 44.
Regional Economic Community (REC): pp. 2, 3, 4, 5, 8, 9, 10, 11, 12, 13, 14, 15, 16, 17, 18, 19, 20, 21, 22, 23, 24, 40, 41, 44, 49, 52, 53, 55, 56, 58, 61, 75, 77, 78, 80, 84, 86, 88, 90, 91, 96, 97, 98, 100, 106, 108, 109, 110, 112, 113.
Remittances: pp. 56, 58, 60, 62.
Regional integration: pp. 2, 4, 5, 8, 9, 11, 12, 13, 14, 15, 16, 17, 18, 19, 23, 24, 28, 29, 41, 42, 44, 48, 49, 53, 54, 61, 69, 75, 76, 77, 86, 89, 91, 96, 98, 99, 103, 112.
Rules of Origin (RoO): pp. 5, 10, 11, 14, 18, 105, 106.
Subsidies: pp. 33, 44, 45, 113.
Skill: pp. 3, 28, 35, 37, 45, 49, 50, 56, 57, 58, 60, 61, 80, 89, 90, 97, 104, 105, 107, 111.
Tariff: pp. 4, 9, 11, 12, 13, 15, 17, 18, 33, 34, 37, 42, 45, 98, 106, 108.
Trade: pp. 2, 3, 4, 9, 10, 11, 12, 13, 14, 15, 17, 18, 20, 21, 23, 24, 28, 29, 34, 37, 40, 44, 49, 51, 60, 61, 73, 76, 79, 85, 96, 97, 98, 100, 101, 102, 103, 105, 106, 107, 108, 109, 110, 111, 112.
Value chain: pp. 2, 3, 4, 5, 28, 35, 61, 96, 97, 98, 99, 100, 101, 102, 103, 104, 105, 106, 107, 108.
African Development Report 2014 Regional integration for inclusive growth

116

African Development Report 2013/14 Leveraging regional integration for inclusive growth 117

African Development Report 2014Regional Integration for Inclusive Growth
AfricAn Development BAnk
immeuble du centre de commerce international d’Abidjan cciA
Avenue Jean-paul ii
01 Bp 1387
Abidjan 01, côte d’ivoire
tel: (225) 20 26 10 20
email: [email protected] / [email protected]
the African Development report for 2014 is devoted to Africa’s key economic and political aspiration—the integration of the
continent. fifty years after it became a pillar of Africa’s apex organizations, including that of the African Development Bank,
the building blocks for regional integration as well as policies and strategies are now well in place, what remains is institutional
building and committed implementation at the national and regional levels. this will require political resolve and heightened
institutional capacities. the report’s main conclusion is that regional integration is still a relevant pillar for Africa’s development,
although the global context has changed greatly since the continental goal was first introduced in the 1960s.
in 2013, the African Development Bank adopted its new ten-Year Strategy, “At the center of Africa’s transformation” which
once again reinforces the importance of regional integration for its work. As Africa looks ahead with confidence, the Bank will
continue to be a keen supporter of all possible efforts to bring Africans and their economies together. this will be reflected in its
support to infrastructure development, cross-border and international trade, governance and related policies, as well as capacity
building. the Bank’s decentralization program will ensure that it has a presence in all regions of the continent and will continue
to actively support the regional integration agenda, including through partnerships with regional member countries, and the
private sector in and outside the continent.
African D
evelopment R
eport 2014 R
egional Integration for Inclusive Grow
th