afrl-rx-wp-tp-2010-4150 functionally graded materials by laser metal deposition (preprint) syamala...
TRANSCRIPT
AFRL-RX-WP-TP-2010-4150
FUNCTIONALLY GRADED MATERIALS BY LASER METAL DEPOSITION (PREPRINT) Syamala R. Pulugurtha, Joseph Newkirk, and Frank Liou University of Missouri-Rolla Hsin-Nan Chou Boeing Research & Technology
MARCH 2010
Approved for public release; distribution unlimited. See additional restrictions described on inside pages
STINFO COPY
AIR FORCE RESEARCH LABORATORY MATERIALS AND MANUFACTURING DIRECTORATE
WRIGHT-PATTERSON AIR FORCE BASE, OH 45433-7750 AIR FORCE MATERIEL COMMAND
UNITED STATES AIR FORCE

i
REPORT DOCUMENTATION PAGE Form Approved
OMB No. 0704-0188
The public reporting burden for this collection of information is estimated to average 1 hour per response, including the time for reviewing instructions, searching existing data sources, gathering and maintaining the data needed, and completing and reviewing the collection of information. Send comments regarding this burden estimate or any other aspect of this collection of information, including suggestions for reducing this burden, to Department of Defense, Washington Headquarters Services, Directorate for Information Operations and Reports (0704-0188), 1215 Jefferson Davis Highway, Suite 1204, Arlington, VA 22202-4302. Respondents should be aware that notwithstanding any other provision of law, no person shall be subject to any penalty for failing to comply with a collection of information if it does not display a currently valid OMB control number. PLEASE DO NOT RETURN YOUR FORM TO THE ABOVE ADDRESS.
1. REPORT DATE (DD-MM-YY) 2. REPORT TYPE 3. DATES COVERED (From - To)
March 2010 Technical Paper Preprint 01 March 2010 – 01 March 2010 4. TITLE AND SUBTITLE
FUNCTIONALLY GRADED MATERIALS BY LASER METAL DEPOSITION (PREPRINT)
5a. CONTRACT NUMBER
FA8650-04-C-5704 5b. GRANT NUMBER
5c. PROGRAM ELEMENT NUMBER
78011F 6. AUTHOR(S)
Syamala R. Pulugurtha, Joseph Newkirk, and Frank Liou (Missouri University-Rolla) Hsin-Nan Chou (Boeing Research & Technology)
5d. PROJECT NUMBER
2865 5e. TASK NUMBER
25 5f. WORK UNIT NUMBER
25100000 7. PERFORMING ORGANIZATION NAME(S) AND ADDRESS(ES) 8. PERFORMING ORGANIZATION
University of Missouri-Rolla Missouri University of Science & Technology 1870 Miner Circle Rolla, MO 65409-0970
Boeing Research & Technology REPORT NUMBER
9. SPONSORING/MONITORING AGENCY NAME(S) AND ADDRESS(ES)
Air Force Research Laboratory
10. SPONSORING/MONITORING AGENCY ACRONYM(S)
Materials and Manufacturing Directorate Wright-Patterson Air Force Base, OH 45433-7750 Air Force Materiel Command United States Air Force
AFRL/RXLMP 11. SPONSORING/MONITORING AGENCY REPORT NUMBER(S)
AFRL-RX-WP-TP-2010-4150
12. DISTRIBUTION/AVAILABILITY STATEMENT
Approved for public release; distribution unlimited.
13. SUPPLEMENTARY NOTES
Technical paper for general release. PAO Case Number: 88ABW-2009-3786; Clearance Date: 28 Aug 2009. Paper contains color.
This work was funded in whole or in part by Department of the Air Force Contract FA8650-04-C-5704. The U.S. Government has for itself and others acting on its behalf a paid-up, nonexclusive, irrevocable worldwide license to use, modify, reproduce, release, perform, display, or disclose the work by or on behalf of the U.S. Government.
14. ABSTRACT
Fabrication of functionally graded materials (FGMs) by laser metal deposition (LMD) has the potential to offer solutions to key engineering problems over the traditional metalworking techniques. But the issues that need to be addressed while building FGMs are intermixing in the layers and cracking due to the residual stresses. This paper is to present the study of the effect of process parameters (laser power and travel speed) on the degree of dilution between the substrate (or, previous layer) and powder material for few metallurgical systems.
15. SUBJECT TERMS
LMD, FGMs, intermixing, cracking, dilution
16. SECURITY CLASSIFICATION OF: 17. LIMITATION OF ABSTRACT:
SAR
18. NUMBER OF PAGES
38
19a. NAME OF RESPONSIBLE PERSON (Monitor)
a. REPORT Unclassified
b. ABSTRACT Unclassified
c. THIS PAGE Unclassified
Todd J. Turner 19b. TELEPHONE NUMBER (Include Area Code)
N/A
Standard Form 298 (Rev. 8-98) Prescribed by ANSI Std. Z39-18
Functionally Graded Materials by Laser Metal Deposition
1Syamala R Pulugurtha, 1Joseph Newkirk, 2Frank Liou, and Hsin-Nan Chou3
1Department of Materials Science & Engineering, Missouri University of Science & Technology
2Department of Mechanical Engineering, Missouri University of Science & Technology
3Boeing Research & Technology
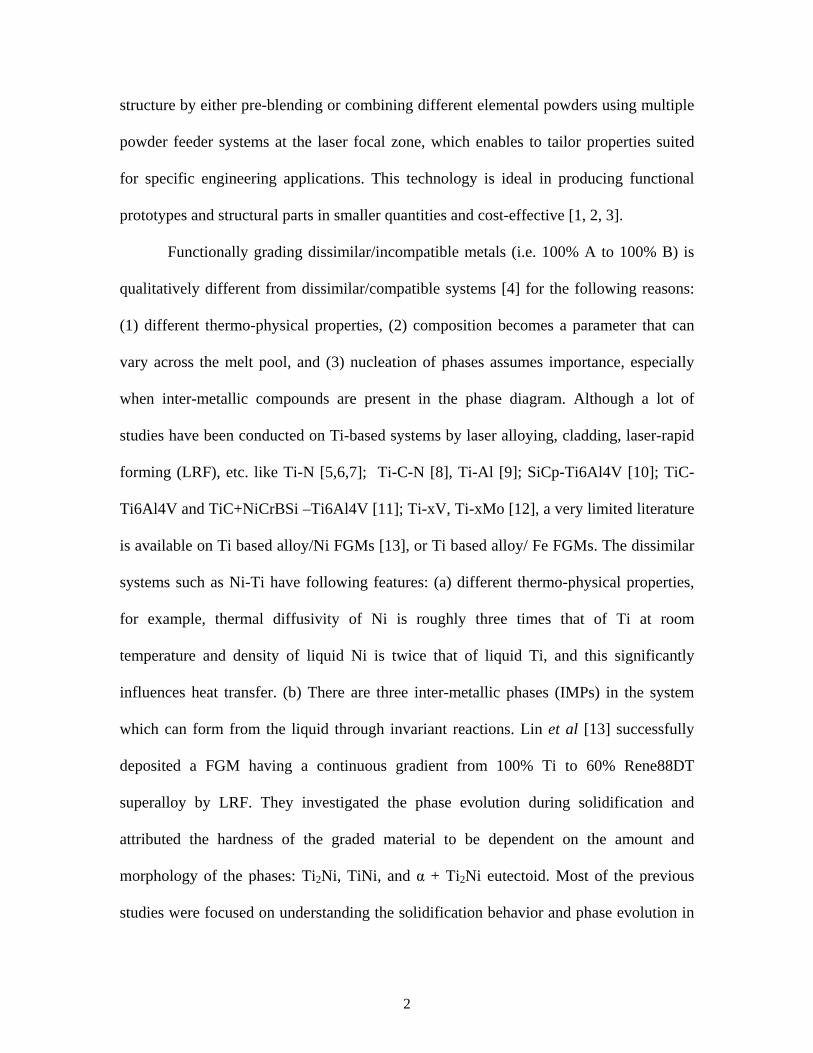
Abstract Fabrication of functionally graded materials (FGMs) by laser metal deposition (LMD)
has the potential to offer solutions to key engineering problems over the traditional metal-
working techniques. But the issues that need to be addressed while building FGMs are
intermixing in the layers and cracking due to the residual stresses. This paper is to present
the study of the effect of process parameters (laser power and travel speed) on the degree
of dilution between the substrate (or, previous layer) and powder material for few
metallurgical systems.
Keywords: LMD, FGMs, intermixing, cracking, dilution
Introduction FGMs for industrial-related applications have been a subject of research for quite some
time now, because of their ability to offer unique solution to the engineering problems
over conventional materials and traditional composites. Among the various processing
methods that are available, FGMs by LMD using solid free form fabrication route for
obtaining bulk near net shape metallic components has been a promising technology. Its
main advantage is the capability to control composition and properties within a fabricated
1
structure by either pre-blending or combining different elemental powders using multiple
powder feeder systems at the laser focal zone, which enables to tailor properties suited
for specific engineering applications. This technology is ideal in producing functional
prototypes and structural parts in smaller quantities and cost-effective [1, 2, 3].
Functionally grading dissimilar/incompatible metals (i.e. 100% A to 100% B) is
qualitatively different from dissimilar/compatible systems [4] for the following reasons:
(1) different thermo-physical properties, (2) composition becomes a parameter that can
vary across the melt pool, and (3) nucleation of phases assumes importance, especially
when inter-metallic compounds are present in the phase diagram. Although a lot of
studies have been conducted on Ti-based systems by laser alloying, cladding, laser-rapid
forming (LRF), etc. like Ti-N [5,6,7]; Ti-C-N [8], Ti-Al [9]; SiCp-Ti6Al4V [10]; TiC-
Ti6Al4V and TiC+NiCrBSi –Ti6Al4V [11]; Ti-xV, Ti-xMo [12], a very limited literature
is available on Ti based alloy/Ni FGMs [13], or Ti based alloy/ Fe FGMs. The dissimilar
systems such as Ni-Ti have following features: (a) different thermo-physical properties,
for example, thermal diffusivity of Ni is roughly three times that of Ti at room
temperature and density of liquid Ni is twice that of liquid Ti, and this significantly
influences heat transfer. (b) There are three inter-metallic phases (IMPs) in the system
which can form from the liquid through invariant reactions. Lin et al [13] successfully
deposited a FGM having a continuous gradient from 100% Ti to 60% Rene88DT
superalloy by LRF. They investigated the phase evolution during solidification and
attributed the hardness of the graded material to be dependent on the amount and
morphology of the phases: Ti2Ni, TiNi, and α + Ti2Ni eutectoid. Most of the previous
studies were focused on understanding the solidification behavior and phase evolution in
2

multi-component systems, but the issues like intermixing in the layers, cracking due to
thermal and residual stresses have not been dealt with. With this in mind, the present
work focuses on the effect of process parameters like laser power and travel speed on
intermixing in the layers, and the pre-treatment (i.e. substrate heating) of the substrate to
try counter cracking issues.
Experimental Our LAMP system (Fig. 1(a)) consists of a 1 kW diode laser (Nuvonyx ISL-1000M, 808
nm, spot size 2.5 mm), a five-axis numerical control working table, and a powder feeder
with co-axial nozzle was used to fabricate the graded materials. The experiments were
conducted in an argon-gas environment to prevent the melt pool from oxidizing and
oxide contamination from occurring during processing. The powder stream from the
hopper was directly injected using argon gas into the molten pool through the laser
nozzle. The metal powder was melted and subsequently re-solidified to form the clad
layer (Fig. 1(b)). The typical size of the powders was in the range of 100-45 microns. The
nominal composition of Fe-82 wt% V (powder-1) and Inconel-625 (powder-2) powders
are listed in Table 1. The substrate materials used for the experiment were cold rolled 1
in. thick Ti6Al4V and SS316L. The substrates were cleaned prior to deposition using
ethyl alcohol to remove any dirt or grease on the surface.
The as-deposited material was sectioned parallel to the compositional gradient for
microscopy studies; for X-ray diffraction (XRD) analysis, the perpendicular section was
utilized. The composition along the gradient direction was characterized using scanning
electron microscopy (SEM): Hitachi S570 equipped with a Si-drift energy dispersive X-
3

ray (EDS) analysis facility. The identification of phases was achieved using X-Ray
Diffraction (XRD) (Philips Xpert X-ray diffractometer), and micro-hardness of the
deposits was measured using Struers (model: Duramin) .
Results and Discussion
Composition and Phase Analysis
In order to understand the effect of residual heat on inter-mixing/cracking with
change of laser power on each deposited layer, a simpler experiment was designed by
changing the power (Ramp up & Down) every 0.9th inch on a single layer track;
parameters listed in Table 2. In case of powder-1, cracks were observed on both the
substrates for all the processing parameters. The Fe-V equilibrium phase diagram (Fig.
2(a)) shows σ-phase is more likely to form in austenitic steels when there is ferrite
retained from high temperature operation. Also, V is a ferrite stabilizer and forms brittle
σ-phase (needle like structure) under processing conditions. XRD phase analysis results
further corroborates the presence of only BCC-Fe 2θ peaks in powder-1 deposit on
SS316L, as shown in Fig. 3. The combination of brittle phases and residual stresses
probably may have caused cracking in the powder-1 deposit on SS316L for all the
processing parameters.
Figure 2b shows the equilibrium phase diagram of Ni-Ti alloy. The three most
important IMPs in the phase diagram are Ti2Ni, TiNi3, and TiNi, which can contribute to
cracking, while Ti-Cr and Ti-Mo form solid solutions over the entire composition range
4
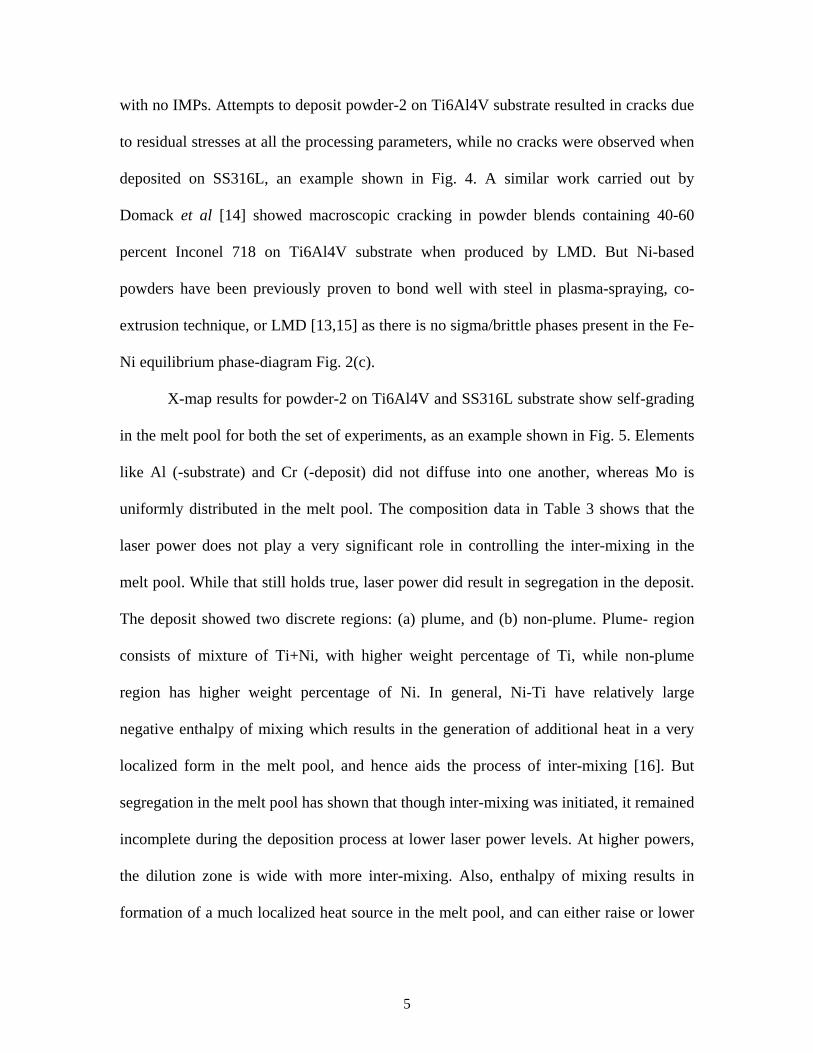
with no IMPs. Attempts to deposit powder-2 on Ti6Al4V substrate resulted in cracks due
to residual stresses at all the processing parameters, while no cracks were observed when
deposited on SS316L, an example shown in Fig. 4. A similar work carried out by
Domack et al [14] showed macroscopic cracking in powder blends containing 40-60
percent Inconel 718 on Ti6Al4V substrate when produced by LMD. But Ni-based
powders have been previously proven to bond well with steel in plasma-spraying, co-
extrusion technique, or LMD [13,15] as there is no sigma/brittle phases present in the Fe-
Ni equilibrium phase-diagram Fig. 2(c).
X-map results for powder-2 on Ti6Al4V and SS316L substrate show self-grading
in the melt pool for both the set of experiments, as an example shown in Fig. 5. Elements
like Al (-substrate) and Cr (-deposit) did not diffuse into one another, whereas Mo is
uniformly distributed in the melt pool. The composition data in Table 3 shows that the
laser power does not play a very significant role in controlling the inter-mixing in the
melt pool. While that still holds true, laser power did result in segregation in the deposit.
The deposit showed two discrete regions: (a) plume, and (b) non-plume. Plume- region
consists of mixture of Ti+Ni, with higher weight percentage of Ti, while non-plume
region has higher weight percentage of Ni. In general, Ni-Ti have relatively large
negative enthalpy of mixing which results in the generation of additional heat in a very
localized form in the melt pool, and hence aids the process of inter-mixing [16]. But
segregation in the melt pool has shown that though inter-mixing was initiated, it remained
incomplete during the deposition process at lower laser power levels. At higher powers,
the dilution zone is wide with more inter-mixing. Also, enthalpy of mixing results in
formation of a much localized heat source in the melt pool, and can either raise or lower
5

its temperature. If rate of solidification is considered to be the temperature difference
between melt pool and the surrounding substrate material. A higher temperature of the
melt pool from exothermic mixing will result in higher solidification rate. Figure 6 shows
composition data from EDS analysis plotted on the Ni-Ti equilibrium phase diagram: the
plume –zone with higher wt% Ti falls in the lower melting point regions (obviously will
solidify the last) compared to the non-plume zones. Also, the density of liquid Ti is very
low compared to that of liquid Ni (twice that of liq. Ti) and therefore, the plume zone
tries to move to the top along the solidification direction (Fig. 5). Because of the steeper
slope of the liquidus NiTi line compared to that of Ti2Ni, the driving force for NiTi
formation will exceed that of Ti2Ni. Therefore, NiTi will nucleate first (non-plume zone)
from the liquid and Ti2Ni will most likely form heterogeneously on it through peritectic
reaction (plume zone) [17]. Since the composition data lies close to the TiNi and Ti2Ni
line compounds, it is safe enough to say that the possible cracking in the deposits is due
to IMPs. In case of powder-2 on SS316L, we see only a small amount of Fe present in the
deposit and no signs of cracks (Fig. 7 & Table 3). Because Fe-Ni are simple liquids with
no interaction between them (Refer Phase Diagrams).
A multi-layered deposition of powder-1 on Ti6Al4V substrate was performed to
study the effect of laser power on intermixing/cracking. Table 4 lists the process
parameters. The X- maps in Fig. 8 at 455 and 677 W show some amount of un-melted
powder-1 particles at surface of the deposit. The composition analysis (Table 5) shows
self-grading in the melt pool, although the four layers are not distinct. But all the deposits
showed cracks either due to residual stresses or formation of IMPs. Ti-V forms good
6

solid solution with no brittle phases, but Fe-xTi has two stable IMPs (FeTi and Fe2Ti),
and can contribute to brittle failure (Fig. 2(d)).
Inter-mixing and cracking in the layers for dissimilar materials are both inter-
dependant problems. In order to obtain a defect free structure (cracks, pores, or bonding
defects) the substrates were pre-heated to 540 oC on a hot plate and maintained at that
temperature during the entire deposition process. Table 6 shows the process parameters
of powder-2 deposit on (with/without pre-heat) Ti6Al4V substrates. The results show that
a pre-heat temperature of 540oC is not sufficient enough to eliminate the cracks formed in
the deposits, an example shown in Fig. 9. Kelbassa et al [18] showed that a pre-heating
temperature between 650-700 oC was required to obtain a defect free single LMD tracks
for γ-TiAl deposit on Ti6Al4V and γ-TiAl substrates. A suitable pre-heating guaranteeing
a defect free LMD result is still under investigation. Also, the X-maps (Fig. 12) show that
at 300 W for with/without substrate pre-heating there is significant amount of un-melted
powder particles observed at the surface, and this was also true at 600 W without pre-
heating for all the parameters. Though exothermic enthalpy of mixing does contribute
additional heat to the melt pool, the melting efficiency is strongly affected by processing
parameters and material thermo-physical properties [19]. A dimensionless-parameter
model was previously used to estimate the melting efficiency for the LENS deposits.
Equation [1] defines melting efficiency as ratio of energy required for melting (AΔHm,
per unit length) to actual absorbed energy (haP/S, per unit length).
hm = Ch/Ry = SAΔHm/haP [1]
Ch = S2A/α2
Ry = haPS/ α2ΔHm
7

Where S is the heat-source travel speed, A is the total deposit cross-section, ΔHm
is the melting enthalpy, ha is the laser energy efficiency (which is assumed to be 40 pct
[du pont], α is the thermal diffusivity of the substrate [20], and P is the laser power. For
materials with dissimilar thermo-physical properties [powder-2 (2.67 J/mm3) onto
Ti6Al4V (13 J/mm3) substrate], an average value of melting enthalpy between the two
was used, 7.8 J/mm3 [19]. From the plot between Ch and Ry (Fig. 11(a)), melting
efficiency can be determined solely from the dimensionless parameter Ry, for the
material used in this study given by the following Equation [2]:
hm = 0.1629 – (0.853/Ry) [2]
At constant speed, the measured melting efficiency is slightly higher than that of the
calculated value, Fig. 11(b). This discrepancy in the data can be attributed to the
additional heat generated in the melt pool for dissimilar metals with exothermic enthalpy
of mixing. The figure also shows how melting efficiency increases with the increase in
the laser input power. It is previously reported that the calculated maximum melting
efficiency for a moving point heat source in a 3D case is about 0.37 [20]. Also, Du pont
et al [19] reported that increase in travel speed increases the melting efficiency as
conduction can be neglected. In this case (Fig. 11(c)), the data contradicts the previously
reported studies, which still need to be explained. Pre-heating the substrates to 540oC
before and during the deposition enhanced the inter-mixing in the melt pool for all the
process parameters, as shown in Fig. 10. A significant amount of self-grading can be
seen in the melt pool, as shown in Table 7. Geometric dilution ‘D’ which is measured
between the melted substrate and deposited powder is given by
D = As/(As+Ap) [3]
8
Where As is the cross-sectional area of melted substrate and Ap is the cross-
sectional area of deposited powder. The dilution increased with the increase in travel
speed (Fig. 11(d)) as less power is delivered to the melt pool, resulting in decrease in
deposit cross-sectional area. Also, dilution is affected by the melting efficiency. As the
laser power is increased, more energy is available for melting the underlying substrate
and incoming powder. Dilution was also observed to increase with substrate heating.
Microhardness
Hardness was measured along the samples (Fig. 12(a,b)) and through the samples
(Fig. 12(c)). An average hardness value of 890±10 HV100 for powder-2 on Ti6Al4V
substrate and 236±10 HV100 on SS316L substrate was obtained. A high hardness value in
the former case may be due to the presence of brittle IMPs. The deposits were also tested
at higher loads to study their performance. A small crack initiated in powder-2 on
Ti6Al4V substrate at a load of 9.81 N (@ 5 s), while multiple cracks originated at 19.6N
(@ 5 s). In case of powder-2 on SS316L, higher loads produced bigger indents indicating
that the deposit is ductile/soft. Hardness as a function of depth for powder-1 on Ti6Al4V
substrate at 1 N load, for 5 secs is shown in Fig. 12(c). The profile can be divided into
three distinct regions: clad, dilution and heat affected zones (HAZ). The hardness of the
dilution zone initially shown to increase and after which dropped to value equal to HAZ.
Such a sharp transition in hardness values can be potential reasons for cracks either due
to residual stresses or IMPs.
Summary
9

Inter-mixing and cracking are inter-related problems which need to be addressed while
building FGMs with dissimilar materials. An optimized window of processing parameters
like laser power, travel speed and powder feed rate is yet to be determined to obtain a
successful FGM. Inconel-625 deposits showed macro-cracks due to combined effect of
IMPs and residual stresses on Ti6Al4V substrates, while no cracks were observed on
SS316L substrates. The possible IMPs present in the deposits were NiTi and NiTi2.
Intermixing and cracking was also observed on multi-layered (MLs) deposits of Fe-
82wt%V on Ti6Al4V substrates. An attempt to counter the cracking issue in dissimilar
materials by substrate treatment to 540oC did not solve the problem either. Substrate
heating prior and during the deposition enhanced inter-mixing in the melt-pool. The
geometric dilution (D) increased with increase in laser power, travel speed and substrate
heating. Future work would involve optimization of parameters for these systems to
reduce inter-mixing and cracking in the deposits, building MLs thin –walls and develop a
simulation-model to study the melt-pool dynamics.
Acknowledgement
This research was supported by a grant from the U.S. Air Force Research Laboratory
contract # FA8650-04-C-5704. Support from Missouri S&T Intelligent Systems Center
is also greatly appreciated.
References
10

1. G. K. Lewis,U , E. Schlienger, Materials and Design, 21 (2000), p417. 2. S. M. Kelly, S. L. Kampe, Metallurgical and Materials Transaction A, 35A
(2004), p1861. 3. P.A. Kobryn, E.H. Moore, S.L. Semiatin, Scripta Materialia, 43 (2000) p299. 4. G.P. Dinda , A.K. Dasgupta , J. Mazumder, Materials Science and Engineering A
509 (2009), p98. 5. M. Grenier, D. Dube, A. Adnot, M. Fiset, Wear, 210 (1997), p127. 6. V.M. Weerasinghe, D.R.F. West, J. de Damborenea, J. Material.
Process.Technol., 58 (1996), p79. 7. X. Chen, G. Wu, R. Wang, W. Guo, J. Yang, S. Cao, Y. Wang, W. Han, Surf.
Coat. Technol., 201 (2007), p4843. 8. L. Covelli, F. Pierdominici, I. Smurov, S. Tosto, Surf. Coat. Technol., 78 (1996),
p196. 9. J.H. Abboud, R.D. Rawlings, D.R.F. West, Mater. Sci. Technol., 10 (1994), p414. 10. Y.T. Pei, V. Ocelik, J.Th.M. De Hosson, Acta Materialia, 50 (2002), p2035. 11. R.L. SunU, D.Z. Yang, L.X. Guo, S.L. Dong, Surf. Coat. Technol., 132 (2000),
p251. 12. P.C. Collins, R. Banerjee, H.L. Fraser, Scripta Materialia, 48 (2003), p1445. 13. X. Lin, T.M. Yue, H.O. Yang, W.D. Huang, Acta Materialia, 54 (2006), p1901. 14. M S Domack, J M Baughman, Rapid Prototyping Journal, 11 (2005), p41. 15. F. J. Kahleen, A. V. Klitzing, A. Kar, J. of Laser Applications, 12 (2000), p205 16. K. I. Schwendner, R. Banerjee, P. C. Collins, C. A. Brice, H. L. Fraser, Scripta
Materialia, 45 (2001), p1123. 17. S. Chatterjee, T.A. Abinandanan, K. Chattopadhyay, J. of Materials Science, 41
(2006), p643. 18. I. Kelbassa, A. Welsheit, K. Wissenbach, V. Hermes, Proc. of the 2nd Pacific
International Conference on Applications of Lasers and Optics, 2006, p208. 19. R. R. Unocic, J. N. Du. Pont, Metallurgical and Materials Transactions B, 34B
(2003), p439. 20. M. Van Elsen, M. Baelmans, P. Mercelis, J. P. Kruth, International Journal of
Heat and Mass Transfer, 50 (2007), p 4872.
11

List of Tables
1. The chemical composition (wt%) of the powders 2. Laser processing parameters for different power profiles 3. Composition analysis of powder-2 on Ti6Al4V and SS316L substrates for Ramp-
up power profile 4. Parameters for laser deposition of powder-1 on Ti6Al4V substrate 5. Shows the composition data of powder-1 deposits at different laser power levels 6. Experimental parameters for deposition of powder-2 on Ti6Al4V substrate 7. Shows the composition data of powder-2 on Ti6Al4V substrate at different laser
power levels
12

List of Figures
1. (a) LAMP system (fig. shows repair welding); (b) Schematic of the deposition process
2. Equilibrium phase diagrams: (a) Fe-V; (b) Ni-Ti; (c) Fe-Ni; (d) Fe-Ti 3. XRD phase analysis of powder-1 deposit on SS316L 4. Macrostructure of powder-2 deposit at 1000 W on (a) Ti6Al4V (shows macro-
cracks); (b) SS316L substrate 5. Shows X-mapping images of RAMP UP power profile of powder-2 on Ti6Al4V
substrate at (a) 1000 W, (b) 600W, (c) 300 W 6. Ni-Ti equilibrium phase diagram 7. Shows X-mapping images of RAMP UP power profile of powder-2 on SS316L at
(a) 1000 W, and (b) 300 W 8. Shows X-images of powder-1 on Ti6Al4V substrate at (a) 455 W, (b) 535 W, (c)
677 W 9. Macro-cracks in powder-2 on Ti6Al4V substrate, 600 W, 10 ipm, substrate heating
@ 540oC 10. X-maps of powder-2 deposit on Ti6Al4V substrate under different process
parameters: SH = substrate heating, NSH = no substrate heating 11. (a) Plot between Ch Vs Ry; (b) melting efficiency at constant speed; (c) melting
efficiency at constant power; (d) dilution 12. Microhardness indents using different loads indicated for powder-2 on (a) Ti6Al4V,
(b) SS316L substrates; (c) hardness as a function of depth for powder-1 on Ti6Al4V
13

Table 1: The chemical composition (wt%) of the powders
Type of Powder Composition (wt%) Powder-1: Fe-82 wt% V V (82), Al (0.68), Si (0.9), C (0.07), S
(0.01), P (0.02), Fe (18) Powder-2: Inconel-625 Ni (58), Cr (20-23), Mo (8-10), Nb+Ta
(3.15-4.15), Fe (5)
14

Table 2: Processing parameters for different power profiles, * Ti6Al4V and SS316L substrates, powder-1 & 2
Exp. Type Power, W Trvl.
Spd., ipm Pwd. Feed Rt., g/min
Ramp-Up 300, 387.5, 475,
562.5, 650, 737.5, 825, 912.5, 1000
10 5 Ramp-Down
1000, 912.5, 825, 737.5,650,
562.5,475,387.5,300
Table 3: Composition analysis of powder-2 on Ti6Al4V and SS316L substrates for Ramp-up power profile *(wt % of V, Cr, Al, & Mo has not been reported in this table)
Exp. Type
Substrate Power,
W Region
Reg. Type
Composition (wt%) Ti Ni Fe
Ramp-up
Ti64
300 1 Substrate 93.41 0.1 2 Dilution 54.63 32.5 1.01 3 Deposit 16.36 60.2
650
1 Substrate 92.37 0.26 2
Dilution 59.2 29.6 0.92
3 42.62 40 1.09 4 Deposit 27.25 48 2.5
1000
1 Substrate 93.47 0.26 2
Dilution 58.59 27 0.77
3 40.83 1.77 38.9 4 Deposit 20.27 55.8 0.99
SS316L
300 1 Substrate
7.38 73.9 2 Dilution 39.4 36.1 3 Deposit 67.5 3.48
1000 1 Substrate 6.99 74.2 2 Dilution 23.2 66.5 3 Deposit 65.9 5.54
15

Table 4: Parameters for laser deposition of powder-1 on Ti6Al4V substrate
Laser Power, W Travel Speed, ipm Powder Feed Rate, g/min
455
20
3
535
677
Table 5: Shows the composition data of powder-1 on Ti6Al4V substrate at different laser power levels
Laser Power Composition wt%
Ti Fe Al V 677 W
Substrate 89.45 0.18 6.82 3.55 Deposit-Bottom 36.51 12.83 3.72 46.95 Deposit-Middle 28.57 8.53 5.14 57.76
Deposit-Top 25.67 10.52 4.58 59.23
535 W Substrate 86.28 0.08 10.13 3.51
Deposit-Bottom 35.23 5.86 6.51 52.39 Deposit-Middle 20.24 8.49 5.07 66.2
Deposit-Top 13.67 9.3 4.4 72.63
455 W Substrate 88.66 0.35 7.32 3.66
Deposit-Bottom 27.63 11.07 3.62 57.66 Deposit-Middle 11.47 14.31 3.59 70.62
Deposit-Top 6.21 15.04 1.97 76.78
16

Table 6: Experimental parameters for deposition of powder-2 on Ti6Al4V substrate
Exp.
No
Power, W Travel Speed, ipm Powder Feed
Rate, g/min
Pre-heating, oC
1 300
10,20,30,40
5
540
2 600
3 1000
Table 7: Shows the composition data of powder-2 on Ti6Al4V substrate at different laser power levels *(wt % of V, Cr, Al, & Mo has not been reported in this table; shows composition for selected travel speeds; Composition of the substrate is Ti (92.57), V (3.95), Al (2.98); Sub Reg. 1 Reg. 2, etc.)
Power, W
Trvl. Speed, ipm
Substrate heat, oC
Region Ni Ti
300
10
nil 1 52.41 29.88 2 48.85 37.35 3 70.3 6.19
540
1 20.65 70.49 2 35.64 55.44 3 44.94 42.53 4 67.71 9.03
20
1 23.65 68.29 2 45.65 44.08 3 52.82 29.85 4 77.33 0.06
600
10
nil
1 24.35 66.85 2 49.22 34.52 3 48.85 35.38 4 61.15 17.03 5 63.04 14.98 6 62.93 14.95
20
1 26.85 60.08 2 32.21 52.32 3 32.16 52.18 4 30.38 54.55 5 30.48 54.32
10
540
1 20.65 70.49 2 35.64 55.44 3 44.94 42.53 4 67.71 9.03
20
1 33.94 52.54 2 40.45 41.84 3 45.35 35.76 4 46 35.15 5 47.19 33.26 6 47.68 32.58
1000 10 nil 1 24.67 64.75
17

2 40.54 43.81 3 46.82 36.01 4 34.66 47.69
20
1 26.85 60.03 2 32.21 52.32 3 32.16 52.18 4 30.38 54.55 5 30.48 54.32
10 575
1 24.64 63.34 2 40.87 42.53 3 44.07 38.72 4 43.4 39.39 5 43.04 39.97 6 43.04 39.71
18

Fig. 1: (a) LAMP system (fig. shows repair welding); (b) Schematic of the deposition process. (Source: http://www.emeraldinsight.com/fig/1560130405005.png)
(a) (b)
19

Fig. 2: Equilibrium phase diagrams: (a) Fe-V; (b) Ni-Ti; (c) Fe-Ni; (d) Fe-Ti (Source: www.calphad.com/graphs)
(a)
(c)
(b)
(d)
20

0
20
40
60
80
100
120
140
160
20 40 60 80 100 120
Inte
ns
ity
, C
/s
(110)
(200) (211)(220)
BCC-Fe
Fig. 3: XRD phase analysis of powder-1 deposit on SS316L. The image shows BCC-Fe peaks in the powder-1 deposit on SS316L substrate.
21

(a) (b)
Fig. 4: Macrostructure of powder-2 deposit at 1000 W on (a) Ti6Al4V (shows macro-cracks); (b) SS316L (no macro-cracks)
substrate.
22

Al
Ti V Cr
Ni Mo
Ti Ni Ni Ti
Solidification Front
120 X
(a)
120 X 60 X
(b) (c)
Fig.5: Shows X-mapping images of RAMP UP power profile of powder-2 on Ti6Al4V substrate at (a) 1000 W, (b) 600W, (c) 300 W. Due to
incomplete inter-mixing, the melt pool is divided into plume and non-plume regions.
Non-Plume →
←Plume
23

Fig. 6: Ni-Ti equilibrium phase diagram.
24

(a)
120X
(b)
60X
Fig. 7: Shows X-mapping images of RAMP UP power profile of powder-2 on SS316L at (a) 1000 W, and (b) 300 W. There is no inter-mixing in the melt pool.
Cr
Fe Ni Mo
Cr
Fe Ni Mo
25

(a)
Fig. 8: Shows X-images of powder-1 on Ti6Al4V substrate at (a) 455 W, (b) 535 W, (c) 677 W. The four-layers are not distinguishable and cracks penetrated through the entire
deposit.
(b)
(c)
120 X 250 X
120 X
Al
Ti V Fe
Al
Ti V Fe
Ti V Fe
Al
26
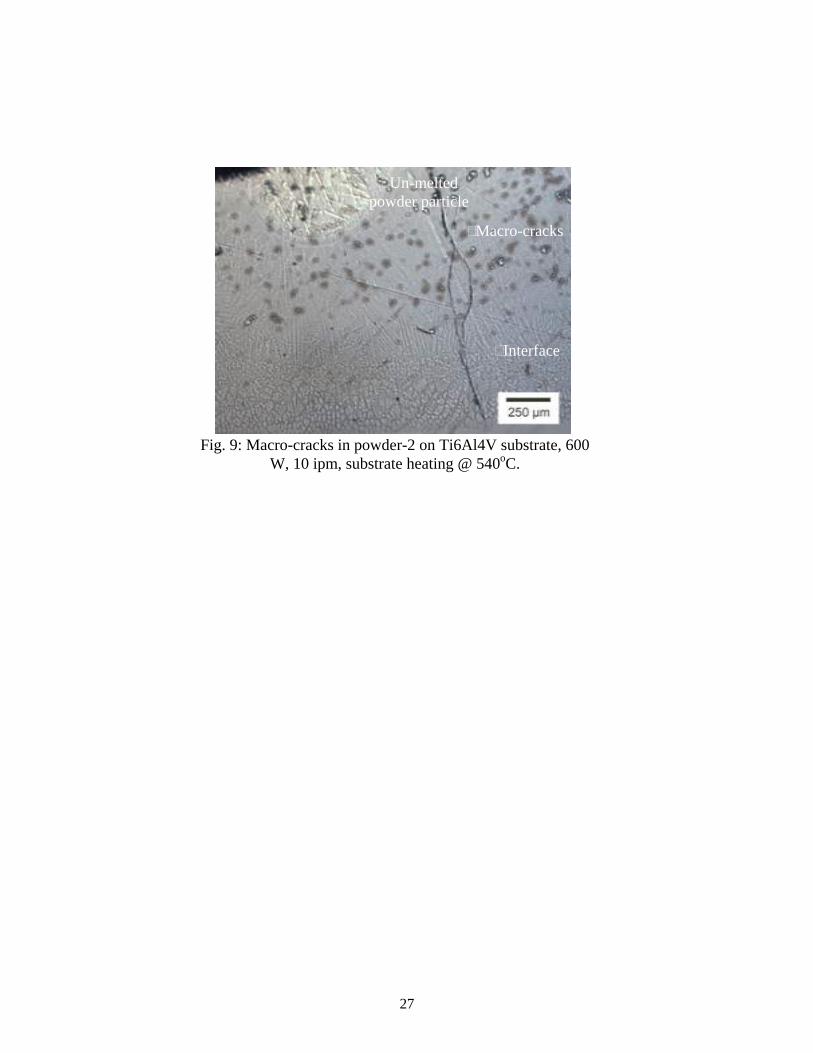
Fig. 9: Macro-cracks in powder-2 on Ti6Al4V substrate, 600 W, 10 ipm, substrate heating @ 540oC.
Un-melted powder particle
Macro-cracks
Interface
27

Ni
300 W, 10 ipm NSH
Ti Ni (a)
250 X
(b)
300 W, 10 ipm SH
250 X
Ti Ni
300 W, 20 ipm SH
(c)
250 X
Ti Ni
600 W, 10 ipm NSH
(d)
250 X
Ti Ni
600 W, 10 ipm SH
(e)
250 X
Ti Ni
1000 W, 30 ipm NSH
(f)
250 X
Ti
28

1000 W, 30 ipm SH
(g)
250 X
Ti Ni
Fig. 10: X-maps of powder-2 deposit on Ti6Al4V substrate under different process parameters: SH = substrate heating, NSH = no substrate heating. Substrate heating increased
the dilution zone size.
29

y = 0.1629x - 0.8524
R2 = 0.9185
0
5
10
15
20
25
30
0 20 40 60 80 100 120 140 160
Ry
Ch
0
0.02
0.04
0.06
0.08
0.1
0.12
0.14
0.16
0.18
10 20 30 40Travel Speed, ipm
Pe
rce
nta
ge
Measured Melting Efficiency
Calculated Melting Efficiency
At constant Power, 600 W
0
0.02
0.04
0.06
0.08
0.1
0.12
0.14
0.16
0.18
0.2
120 240 400
h aP, W
Per
cen
tag
e
Measured Melting Efficiency
Calculated Melting Efficiency
At constant speed, 10 ipm
0
0.1
0.2
0.3
0.4
0.5
0.6
0.7
0 20 40 60
Travel Speed, ipm
Dilu
tio
n %
600 W
1000 W
(a) (b)
(c) (d)
Fig. 11: (a) Plot between Ch Vs Ry; (b) melting efficiency at constant speed; (c) melting efficiency at constant power; (d) dilution.
(b)
30

(a)
981.2
mN 1.96
N
2.94
N
4.91
N
9.81
N
19.6 N
Cracks
Deposit
Fig. 12: Microhardness indents using different loads indicated for powder-2 on (a) Ti6Al4V, (b) SS316L substrates; (c) hardness as a function of depth for powder-1 on
Ti6Al4V.
981.2
mN
1.96
N 2.94
N
4.91
N 9.81
N 19.6
N
Deposit
0
1
2
3
4
5
6
-0.6 -0.4 -0.2 0 0.2 0.4 0.6
Depth, mm
Har
dn
ess,
GP
a
(c)
Clad→ Dilution→HAZ
31