afterschool & stem - oregonask · 22/05/2017 · afterschool & stem system-building...
TRANSCRIPT
State Report: Oregon 0
Afterschool & STEM System-Building Evaluation 2016
State Afterschool Network Report - Oregon
The PEAR Institute: Partnerships in Education and Resilience
McLean Hospital and Harvard Medical School
IMMAP: Institute for Measurement, Methodology, Analysis & Policy
Texas Tech University

State Report: Oregon 1
Table of Contents
Introduction .......................................................................................................................... 2
Methods ............................................................................................................................... 2
Participants ........................................................................................................................... 3
Student Survey Ratings .......................................................................................................... 5 Overall Changes in Ratings .............................................................................................................6
Overall Student Results. ....................................................................................................................... 6 STEM Interest and Identity. .................................................................................................................. 6 Career Orientation and Intrinsic Motivation. ....................................................................................... 6 21st-Century Skills. ............................................................................................................................... 6
Group Comparisons .......................................................................................................................8 Gender. ................................................................................................................................................. 8 Grade. ................................................................................................................................................... 9
Facilitator Survey Ratings .................................................................................................... 10 Facilitator Perceptions ................................................................................................................. 10 Program Characteristics ............................................................................................................... 11
Program Quality Ratings ...................................................................................................... 11
Summary of Evaluation Results ............................................................................................ 12
Acknowledgments ............................................................................................................... 13
For more background on this national evaluation and aggregate-level results, please refer to:
Allen, P. J., Noam, G. G., Little, T. D., Fukuda, E., Chang, R., Gorrall, B. K., & Waggenspack,
B. A. (2017). Afterschool & STEM System-Building Evaluation 2016. Belmont, MA: The PEAR
Institute: Partnerships in Education and Resilience.
State Report: Oregon 2
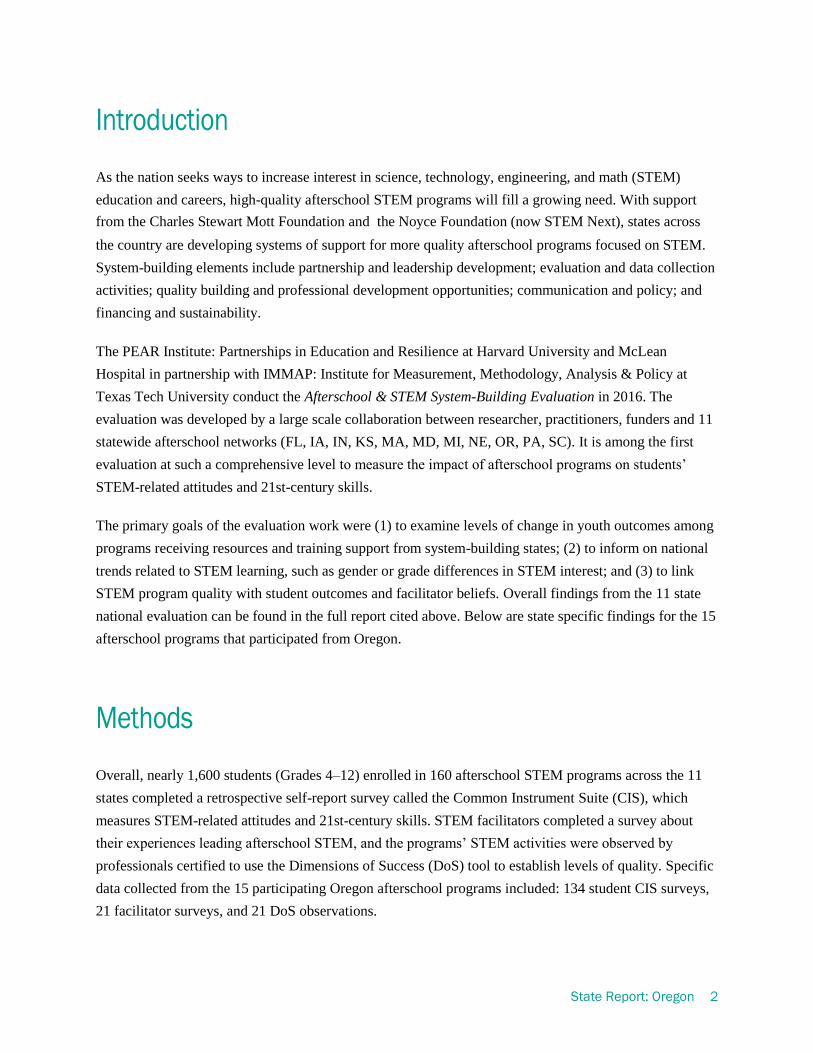
Introduction
As the nation seeks ways to increase interest in science, technology, engineering, and math (STEM)
education and careers, high-quality afterschool STEM programs will fill a growing need. With support
from the Charles Stewart Mott Foundation andthe Noyce Foundation (now STEM Next), states across
the country are developing systems of support for more quality afterschool programs focused on STEM.
System-building elements include partnership and leadership development; evaluation and data collection
activities; quality building and professional development opportunities; communication and policy; and
financing and sustainability.
The PEAR Institute: Partnerships in Education and Resilience at Harvard University and McLean
Hospital in partnership with IMMAP: Institute for Measurement, Methodology, Analysis & Policy at
Texas Tech University conduct the Afterschool & STEM System-Building Evaluation in 2016. The
evaluation was developed by a large scale collaboration between researcher, practitioners, funders and 11
statewide afterschool networks (FL, IA, IN, KS, MA, MD, MI, NE, OR, PA, SC). It is among the first
evaluation at such a comprehensive level to measure the impact of afterschool programs on students’
STEM-related attitudes and 21st-century skills.
The primary goals of the evaluation work were (1) to examine levels of change in youth outcomes among
programs receiving resources and training support from system-building states; (2) to inform on national
trends related to STEM learning, such as gender or grade differences in STEM interest; and (3) to link
STEM program quality with student outcomes and facilitator beliefs. Overall findings from the 11 state
national evaluation can be found in the full report cited above. Below are state specific findings for the 15
afterschool programs that participated from Oregon.
Methods
Overall, nearly 1,600 students (Grades 4–12) enrolled in 160 afterschool STEM programs across the 11
states completed a retrospective self-report survey called the Common Instrument Suite (CIS), which
measures STEM-related attitudes and 21st-century skills. STEM facilitators completed a survey about
their experiences leading afterschool STEM, and the programs’ STEM activities were observed by
professionals certified to use the Dimensions of Success (DoS) tool to establish levels of quality. Specific
data collected from the 15 participating Oregon afterschool programs included: 134 student CIS surveys,
21 facilitator surveys, and 21 DoS observations.
State Report: Oregon 3
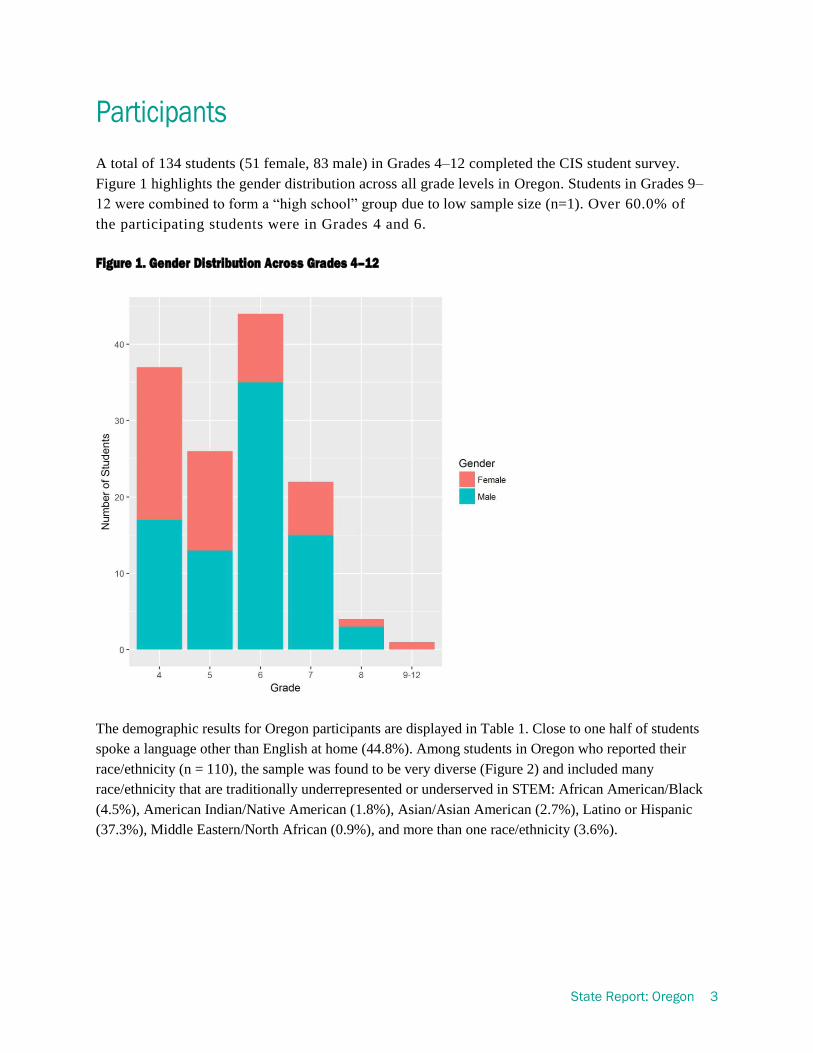
Participants
A total of 134 students (51 female, 83 male) in Grades 4–12 completed the CIS student survey.
Figure 1 highlights the gender distribution across all grade levels in Oregon. Students in Grades 9–
12 were combined to form a “high school” group due to low sample size (n=1). Over 60.0% of
the participating students were in Grades 4 and 6.
Figure 1. Gender Distribution Across Grades 4–12
The demographic results for Oregon participants are displayed in Table 1. Close to one half of students
spoke a language other than English at home (44.8%). Among students in Oregon who reported their
race/ethnicity (n = 110), the sample was found to be very diverse (Figure 2) and included many
race/ethnicity that are traditionally underrepresented or underserved in STEM: African American/Black
(4.5%), American Indian/Native American (1.8%), Asian/Asian American (2.7%), Latino or Hispanic
(37.3%), Middle Eastern/North African (0.9%), and more than one race/ethnicity (3.6%).

State Report: Oregon 4
Table 1. Student Self-Reported Demographic Information for Oregon
Demographic N = 134
Gender
Female 51
Male 83
Primary Language
English 74
Other language 60
Grade
4 37
5 26
6 44
7 22
8 4
9 - 12 1
Program Duration
< 1 week 41
1 - 3 weeks 14
4 - 8 weeks 23
> 8 weeks 56
Program Type
School-based 123
Center-based 11
Other 0
Figure 2. Student Self-Identified Race Demographics
4.5%
1.8%
2.7%
21.8%
37.3%
0.9%
19.1%
3.6% 8.2%
Values in alphabetical order
African American
American Indian/Native American
Asian American/Asian
Caucasian/White
Latino/Hispanic
Middle Eastern/North African
Other
> 1 Race
Not reported
State Report: Oregon 5
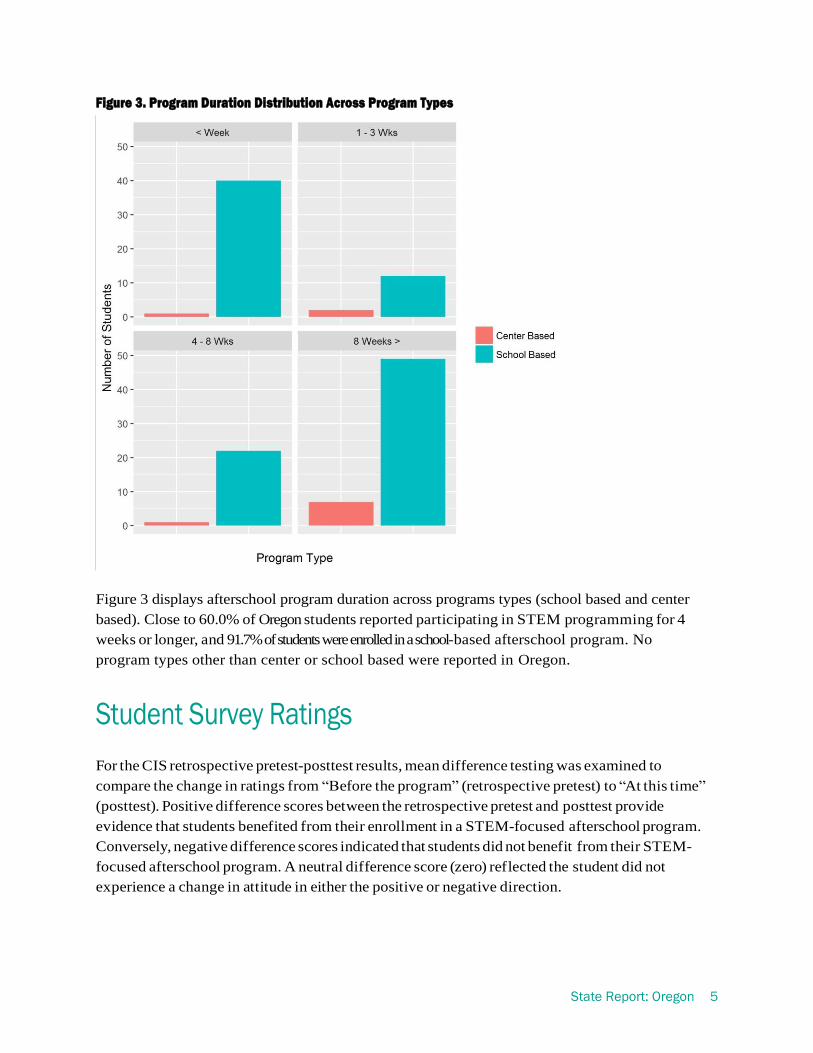
Figure 3. Program Duration Distribution Across Program Types
Figure 3 displays afterschool program duration across programs types (school based and center
based). Close to 60.0% of Oregon students reported participating in STEM programming for 4
weeks or longer, and 91.7% of students were enrolled in a school-based afterschool program. No
program types other than center or school based were reported in Oregon.
Student Survey Ratings
For the CIS retrospective pretest-posttest results, mean difference testing was examined to
compare the change in ratings from “Before the program” (retrospective pretest) to “At this time”
(posttest). Positive difference scores between the retrospective pretest and posttest provide
evidence that students benefited from their enrollment in a STEM-focused afterschool program.
Conversely, negative difference scores indicated that students did not benefit from their STEM-
focused afterschool program. A neutral difference score (zero) reflected the student did not
experience a change in attitude in either the positive or negative direction.

State Report: Oregon 6
Oregon (n = 134)
Overall Changes in Ratings
In the following section, we selectively highlight the findings across the nine core CIS outcomes,
which represent STEM-related attitudes and 21st-century skills. To quantify the effect afterschool
program enrollment made on students' attitudes, t test and effect size testing was conducted.
Cohen’s d effect size statistic measures the difference between the retrospective pretest score and
posttest score in standard deviation units (Hattie, 2009). In addition, proportions of difference
scores were calculated to show the percentage of students in each state that experienced negative
change, no change or positive change after participation in their STEM-afterschool program.
Table 2. Descriptive Statistics, t-Test, Effect Size and Proportion of Changes for Nine CIS Outcomes.
ǂ Note: Retrospective pretest refers to ratings “Before the program” and posttest refers to ratings “At this Time.” Students completed the
retrospective pretest and posttest during one sitting using a retrospective survey design.
Overall student results. Overall, significant positive change was observed across all outcomes
measured using the CIS student survey. The two outcomes with the most gains in Oregon were:
STEM career knowledge and STEM interest.
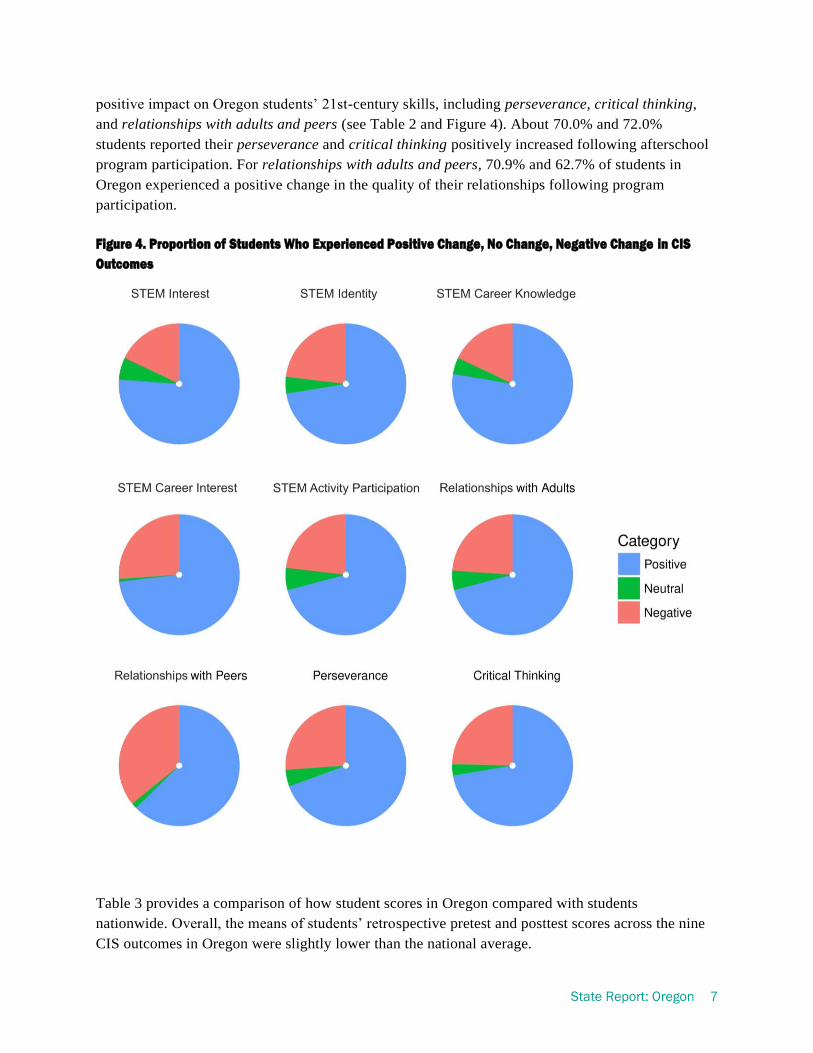
STEM interest and identity. The overall results from students in Oregon indicated that
participation in a STEM- focused afterschool program made a positive impact on students’ reported
attitudes toward STEM interest and STEM identity (see Table 2 and Figure 4). For STEM interest
and identity, the proportion of positive change (positive difference score) was 76.1% and 72.4%.
Career orientation and intrinsic motivation. The overall results indicated there were significant
increases in STEM career interest, STEM career knowledge, and STEM activity participation (see
Table 2 and Figure 4). Among the three constructs, STEM career knowledge had the highest
proportion of positive change (~ 78.0%). About 73.1% and 70.9% of students reported their STEM
career interest and STEM activity participation positively increased following afterschool program
participation.
21st-century skills. Results showed participation in a STEM-focused afterschool program made a
Variable Retro Pre Post t-test
Effect size
Proportion of Changes
M SD M SD t p d Positive Neutral Negative
STEM Interest 58.07 19.18 66.99 20.23 7.945 p < 0.001 0.453 76.1% 6.0% 17.9%
STEM Identity 45.51 20.99 51.43 22.58 5.912 p < 0.001 0.271 72.4% 4.5% 23.1%
STEM Career Knowledge 40.14 20.17 48.85 21.85 7.201 p < 0.001 0.414 77.6% 4.5% 17.9%
STEM Career Interest 46.77 20.52 53.86 22.75 6.507 p < 0.001 0.328 73.1% 0.7% 26.1%
STEM Activity Participation 33.52 19.27 41.71 21.84 8.035 p < 0.001 0.398 70.9% 6.0% 23.1%
Relationships with Adults 62.06 17.37 69.23 17.23 6.573 p < 0.001 0.414 70.9% 5.2% 23.9%
Relationships with Peers 71.24 15.33 75.24 14.92 4.014 p < 0.001 0.265 62.7% 1.5% 35.8%
Perseverance 64.57 17.98 72.89 17.48 6.783 p < 0.001 0.469 69.4% 4.5% 26.1%
Critical Thinking 65.22 18.57 72.32 18.20 6.096 p < 0.001 0.387 72.4% 3.0% 24.6%
State Report: Oregon 7
positive impact on Oregon students’ 21st-century skills, including perseverance, critical thinking,
and relationships with adults and peers (see Table 2 and Figure 4). About 70.0% and 72.0%
students reported their perseverance and critical thinking positively increased following afterschool
program participation. For relationships with adults and peers, 70.9% and 62.7% of students in
Oregon experienced a positive change in the quality of their relationships following program
participation.
Figure 4. Proportion of Students Who Experienced Positive Change, No Change, Negative Change in CIS
Outcomes
Table 3 provides a comparison of how student scores in Oregon compared with students
nationwide. Overall, the means of students’ retrospective pretest and posttest scores across the nine
CIS outcomes in Oregon were slightly lower than the national average.

State Report: Oregon 8
Table 3. Descriptive Statistics and Proportion of Changes for Nine CIS Outcomes in Both Oregon and
Nationwide.
Retro Pre Post Proportion of Changes
M SD M SD Positive Neutral Negative
STEM Interest
Oregon 58.07 19.18 66.99 20.23 76.1% 6.0% 17.9%
Nationwide 60.17 19.86 70.02 19.25 77.5% 3.5% 18.9%
STEM Identity
Oregon 45.51 20.99 51.43 22.58 72.4% 4.5% 23.1%
Nationwide 50.16 22.77 58.07 22.28 73.1% 4.0% 22.9%
STEM Career Knowledge
Oregon 40.14 20.17 48.85 21.85 77.6% 4.5% 17.9%
Nationwide 44.99 22.32 55.68 21.50 79.7% 3.1% 17.1%
STEM Career Interest
Oregon 46.77 20.52 53.86 22.75 73.1% 0.7% 26.1%
Nationwide 51.01 22.01 59.88 21.87 75.7% 3.7% 20.6%
STEM Activity Participation
Oregon 33.52 19.27 41.71 21.84 70.9% 6.0% 23.1%
Nationwide 36.52 21.16 45.31 22.43 76.7% 3.5% 19.8%
Relationships with Adults
Oregon 62.06 17.37 69.23 17.23 70.9% 5.2% 23.9%
Nationwide 64.24 19.74 71.74 18.44 71.0% 4.9% 24.1%
Relationships with Peers
Oregon 71.24 15.33 75.24 14.92 62.7% 1.5% 35.8%
Nationwide 72.92 18.19 78.43 16.19 64.5% 5.3% 30.2%
Perseverance
Oregon 64.57 17.98 72.89 17.48 69.4% 4.5% 26.1%
Nationwide 67.30 20.11 76.16 17.27 72.4% 4.8% 22.8%
Critical Thinking
Oregon 65.22 18.57 72.32 18.20 72.4% 3.0% 24.6%
Nationwide 68.34 19.66 77.14 17.00 72.9% 4.2% 23.0%
Group Comparisons
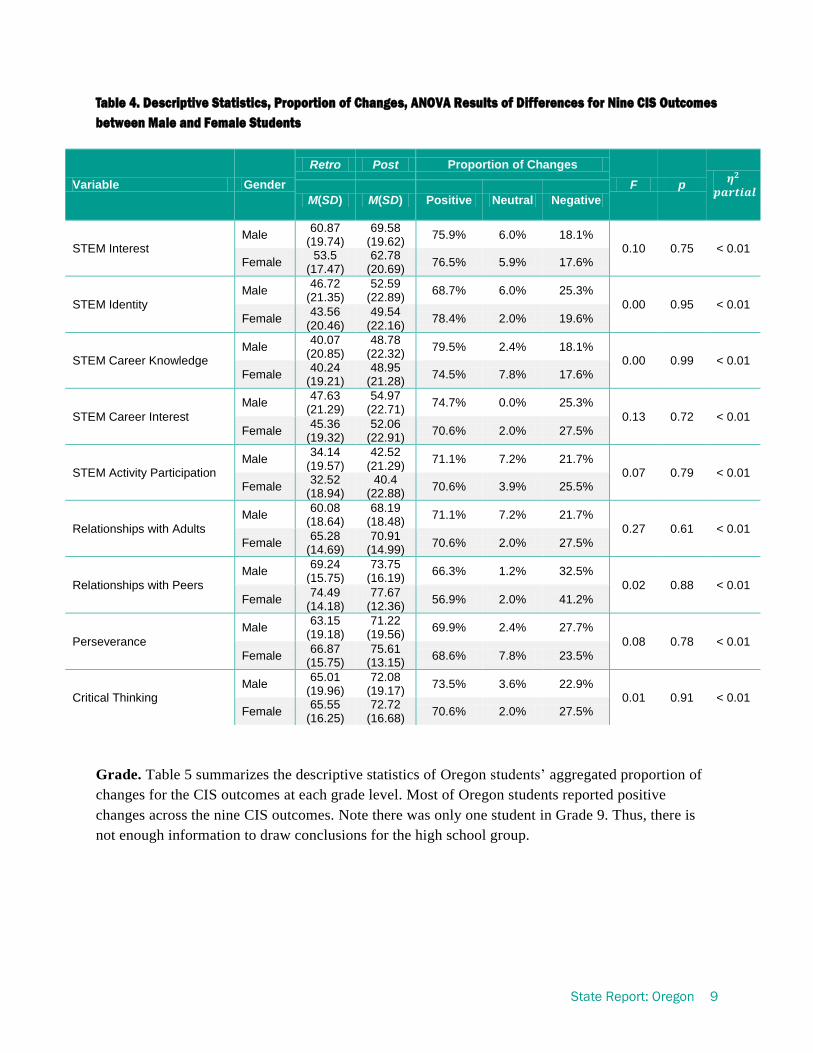
Gender. To determine if significant differences existed between male and female students on self-
reported posttest scores, analysis of variance (ANOVA) was conducted. Table 4 displays the
descriptive statistics of male and female students’ changes for nine CIS outcomes. No statistically
significant differences were found between male and female students in Oregon on posttest scores
following program enrollment. Overall, changes in STEM-related attitudes and 21st-century skills
following afterschool program enrollment were not influenced by gender.
State Report: Oregon 9
Table 4. Descriptive Statistics, Proportion of Changes, ANOVA Results of Differences for Nine CIS Outcomes
between Male and Female Students
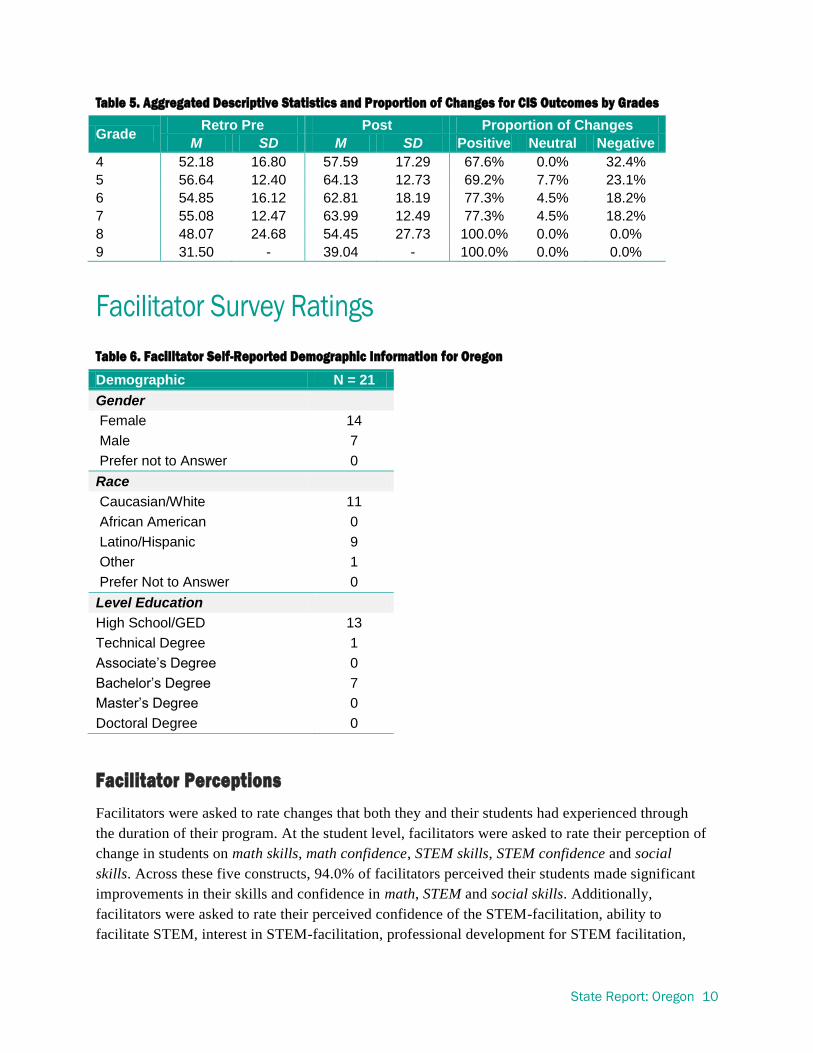
Grade. Table 5 summarizes the descriptive statistics of Oregon students’ aggregated proportion of
changes for the CIS outcomes at each grade level. Most of Oregon students reported positive
changes across the nine CIS outcomes. Note there was only one student in Grade 9. Thus, there is
not enough information to draw conclusions for the high school group.
Variable Gender
Retro Post Proportion of Changes
F p
M(SD) M(SD) Positive Neutral Negative
STEM Interest Male
60.87 (19.74)
69.58 (19.62)
75.9% 6.0% 18.1% 0.10 0.75 < 0.01
Female 53.5
(17.47) 62.78
(20.69) 76.5% 5.9% 17.6%
STEM Identity
Male 46.72
(21.35) 52.59
(22.89) 68.7% 6.0% 25.3%
0.00 0.95 < 0.01
Female 43.56
(20.46) 49.54
(22.16) 78.4% 2.0% 19.6%
STEM Career Knowledge Male
40.07 (20.85)
48.78 (22.32)
79.5% 2.4% 18.1% 0.00 0.99 < 0.01
Female 40.24
(19.21) 48.95
(21.28) 74.5% 7.8% 17.6%
STEM Career Interest
Male 47.63
(21.29) 54.97
(22.71) 74.7% 0.0% 25.3%
0.13 0.72 < 0.01
Female 45.36
(19.32) 52.06
(22.91) 70.6% 2.0% 27.5%
STEM Activity Participation Male
34.14 (19.57)
42.52 (21.29)
71.1% 7.2% 21.7% 0.07 0.79 < 0.01
Female 32.52
(18.94) 40.4
(22.88) 70.6% 3.9% 25.5%
Relationships with Adults
Male 60.08
(18.64) 68.19
(18.48) 71.1% 7.2% 21.7%
0.27 0.61 < 0.01
Female 65.28
(14.69) 70.91
(14.99) 70.6% 2.0% 27.5%
Relationships with Peers
Male 69.24
(15.75) 73.75
(16.19) 66.3% 1.2% 32.5%
0.02 0.88 < 0.01
Female 74.49
(14.18) 77.67
(12.36) 56.9% 2.0% 41.2%
Perseverance
Male 63.15
(19.18) 71.22
(19.56) 69.9% 2.4% 27.7%
0.08 0.78 < 0.01
Female 66.87
(15.75) 75.61
(13.15) 68.6% 7.8% 23.5%
Critical Thinking Male
65.01 (19.96)
72.08 (19.17)
73.5% 3.6% 22.9% 0.01 0.91 < 0.01
Female 65.55
(16.25) 72.72
(16.68) 70.6% 2.0% 27.5%
State Report: Oregon 10
Table 5. Aggregated Descriptive Statistics and Proportion of Changes for CIS Outcomes by Grades
Grade Retro Pre Post Proportion of Changes
M SD M SD Positive Neutral Negative
4 52.18 16.80 57.59 17.29 67.6% 0.0% 32.4%
5 56.64 12.40 64.13 12.73 69.2% 7.7% 23.1%
6 54.85 16.12 62.81 18.19 77.3% 4.5% 18.2%
7 55.08 12.47 63.99 12.49 77.3% 4.5% 18.2%
8 48.07 24.68 54.45 27.73 100.0% 0.0% 0.0%
9 31.50 - 39.04 - 100.0% 0.0% 0.0%
Facilitator Survey Ratings
Table 6. Facilitator Self-Reported Demographic Information for Oregon
Demographic N = 21
Gender
Female 14
Male 7
Prefer not to Answer 0
Race
Caucasian/White 11
African American 0
Latino/Hispanic 9
Other 1
Prefer Not to Answer 0
Level Education
High School/GED 13
Technical Degree 1
Associate’s Degree 0
Bachelor’s Degree 7
Master’s Degree 0
Doctoral Degree 0
Facilitator Perceptions
Facilitators were asked to rate changes that both they and their students had experienced through
the duration of their program. At the student level, facilitators were asked to rate their perception of
change in students on math skills, math confidence, STEM skills, STEM confidence and social
skills. Across these five constructs, 94.0% of facilitators perceived their students made significant
improvements in their skills and confidence in math, STEM and social skills. Additionally,
facilitators were asked to rate their perceived confidence of the STEM-facilitation, ability to
facilitate STEM, interest in STEM-facilitation, professional development for STEM facilitation,
State Report: Oregon 11
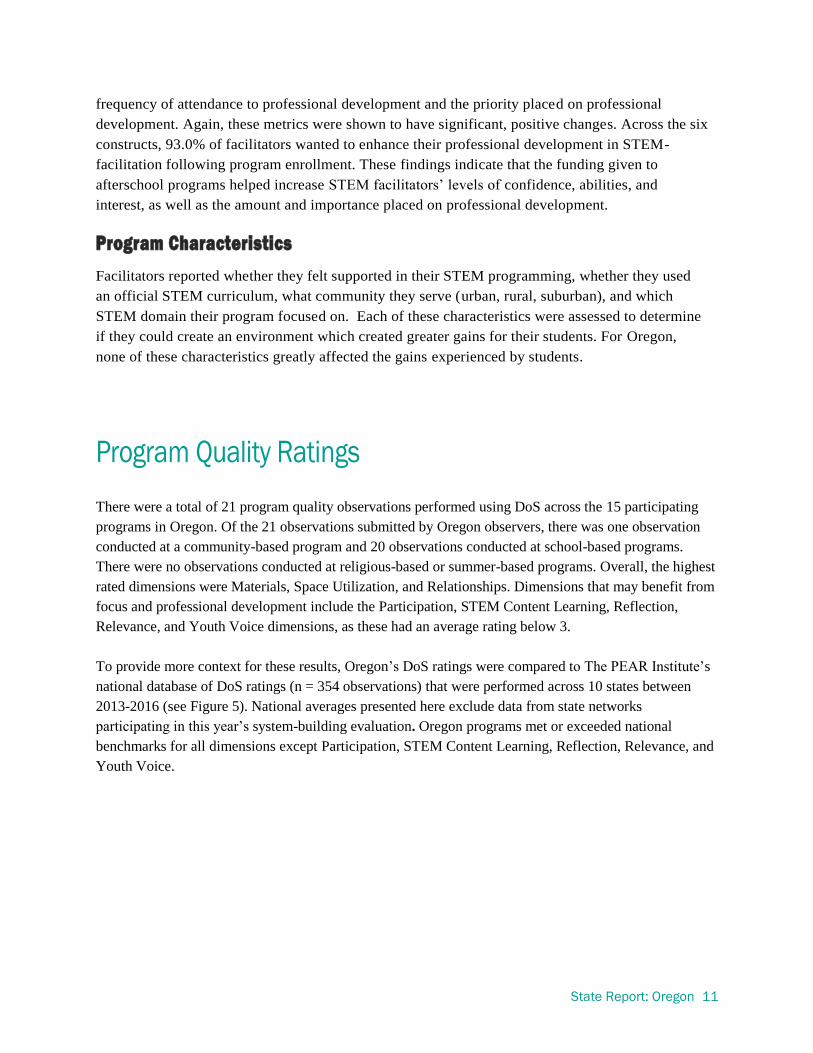
frequency of attendance to professional development and the priority placed on professional
development. Again, these metrics were shown to have significant, positive changes. Across the six
constructs, 93.0% of facilitators wanted to enhance their professional development in STEM-
facilitation following program enrollment. These findings indicate that the funding given to
afterschool programs helped increase STEM facilitators’ levels of confidence, abilities, and
interest, as well as the amount and importance placed on professional development.
Program Characteristics
Facilitators reported whether they felt supported in their STEM programming, whether they used
an official STEM curriculum, what community they serve (urban, rural, suburban), and which
STEM domain their program focused on. Each of these characteristics were assessed to determine
if they could create an environment which created greater gains for their students. For Oregon,
none of these characteristics greatly affected the gains experienced by students.
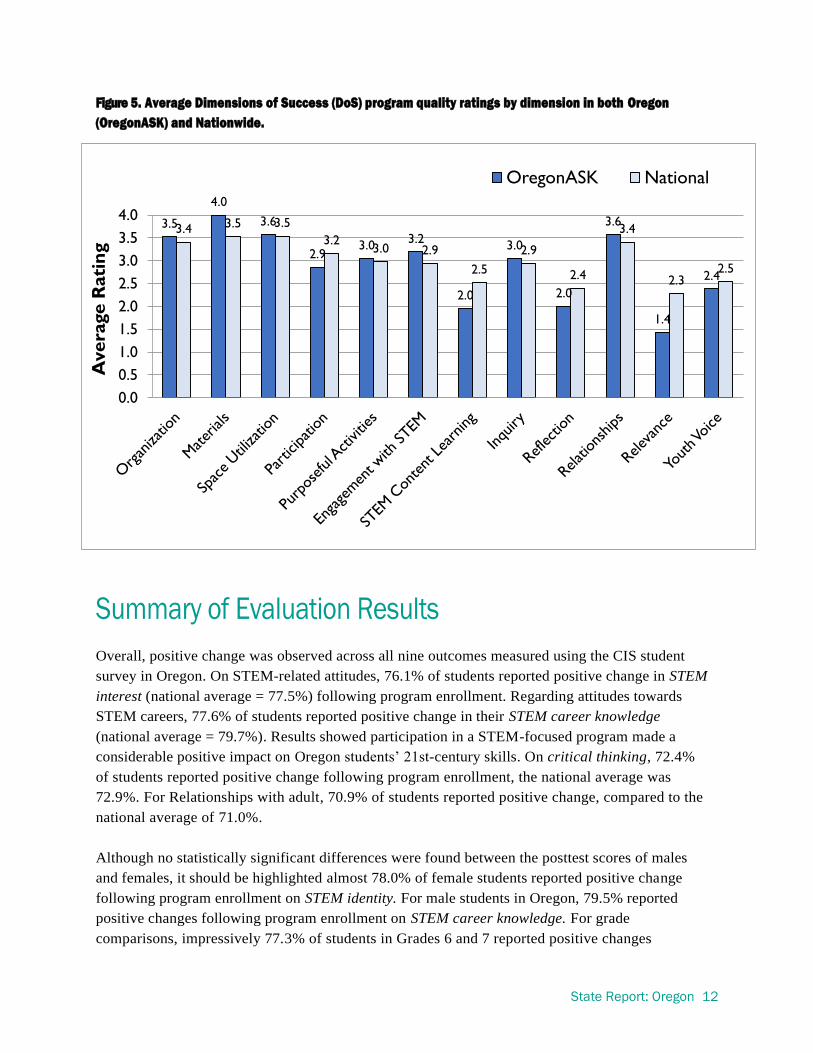
Program Quality Ratings
There were a total of 21 program quality observations performed using DoS across the 15 participating
programs in Oregon. Of the 21 observations submitted by Oregon observers, there was one observation
conducted at a community-based program and 20 observations conducted at school-based programs.
There were no observations conducted at religious-based or summer-based programs. Overall, the highest
rated dimensions were Materials, Space Utilization, and Relationships. Dimensions that may benefit from
focus and professional development include the Participation, STEM Content Learning, Reflection,
Relevance, and Youth Voice dimensions, as these had an average rating below 3.
To provide more context for these results, Oregon’s DoS ratings were compared to The PEAR Institute’s
national database of DoS ratings (n = 354 observations) that were performed across 10 states between
2013-2016 (see Figure 5). National averages presented here exclude data from state networks
participating in this year’s system-building evaluation. Oregon programs met or exceeded national
benchmarks for all dimensions except Participation, STEM Content Learning, Reflection, Relevance, and
Youth Voice.
State Report: Oregon 12
Figure 5. Average Dimensions of Success (DoS) program quality ratings by dimension in both Oregon
(OregonASK) and Nationwide.
Summary of Evaluation Results
Overall, positive change was observed across all nine outcomes measured using the CIS student
survey in Oregon. On STEM-related attitudes, 76.1% of students reported positive change in STEM
interest (national average = 77.5%) following program enrollment. Regarding attitudes towards
STEM careers, 77.6% of students reported positive change in their STEM career knowledge
(national average = 79.7%). Results showed participation in a STEM-focused program made a
considerable positive impact on Oregon students’ 21st-century skills. On critical thinking, 72.4%
of students reported positive change following program enrollment, the national average was
72.9%. For Relationships with adult, 70.9% of students reported positive change, compared to the
national average of 71.0%.
Although no statistically significant differences were found between the posttest scores of males
and females, it should be highlighted almost 78.0% of female students reported positive change
following program enrollment on STEM identity. For male students in Oregon, 79.5% reported
positive changes following program enrollment on STEM career knowledge. For grade
comparisons, impressively 77.3% of students in Grades 6 and 7 reported positive changes
3.5
4.0
3.6
2.9 3.0
3.2
2.0
3.0
2.0
3.6
1.4
2.4
3.4 3.5 3.5
3.2 3.0 2.9
2.5
2.9
2.4
3.4
2.3 2.5
0.0
0.5
1.0
1.5
2.0
2.5
3.0
3.5
4.0
Avera
ge R
ati
ng
OregonASK National

State Report: Oregon 13
following afterschool program enrollment.
Facilitators rating of students’ math skills, math confidence, STEM skills, STEM confidence and
social skills also revealed positive change with 94.0% of individuals perceiving their students made
significant improvements in their skills and confidence in math, STEM and social skills.
Additionally, facilitators rated their own perceived confidence of the STEM-facilitation, ability to
facilitate STEM, interest in STEM-facilitation, professional development for STEM facilitation,
frequency of attendance to professional development and the priority placed on professional
development as positive. These metrics were shown to have significant, changes across the six
constructs, with 93.0% of facilitators wanting to enhance their professional development in STEM-
facilitation following program enrollment.
A total of 21 program quality observations were performed using the DoS instrument across the 15
participating programs in Oregon. . Overall, the highest rated dimensions were Materials, Space
Utilization, and Relationships. Dimensions that may benefit from focus and professional development
include the Participation, STEM Content Learning, Reflection, Relevance, and Youth Voice dimensions,
as these had an average rating below 3. Oregon programs met or exceeded national benchmarks for all
dimensions except Participation, STEM Content Learning, Reflection, Relevance, and Youth Voice.
In summary, results showed that youth participating in a STEM-focused afterschool program in
Oregon reported significant positive changes in STEM-related attitudes and 21st-century skills. By
engaging youth early in quality programs and getting them excited about STEM, Oregon is helping
build the skills youth will need for the future.
Acknowledgments
Thank you to Oregon ASK and all participating Oregon afterschool programs, especially their
facilitators and youth! We could not do this work without everyone’s active participation. We hope
you find these evaluation results interesting and helpful as you strive to provide youth with the best
STEM learning experiences possible in your state!
Special thanks to the Charles Stewart Mott Foundation for leadership in the afterschool field and
support for this research.