ag biology - communities.naae.org
TRANSCRIPT

Ag Biology 1
Ag Biology Lab Manual
2015-2016
Cassia High School
Name ____________________ Instructor: Mrs. Jaysa Fillmore

Ag Biology 2
Unit 1: Scientific Method and Experimental Design

Ag Biology 3
Scientific Method Notes What is the purpose of the scientific method?
Draw a pictogram for each step of the scientific method.
1. Ask a question
2. Do your research
3. Form a hypothesis
4. Test your hypothesis
5. Analyze your data
6. Draw conclusions
What are some key points or reminders for each step?
1. Ask a question
2. Do your research
3. Form a hypothesis
4. Test your hypothesis
5. Analyze your data
6. Draw conclusions

Ag Biology 4
The Scientific Method Lab
Question
Hypothesis
If ______________________________________________________________,
then ___________________________________________________________.
Materials
Procedures
1.
2.
3.
4.
5.
6.
Data Conclusion
Ag Biology 5
Research Outline
Source name
Source location
New vocabulary
Important facts
New questions from this source
Source name
Source location
New vocabulary
Important facts
New questions from this source

Ag Biology 6
The Metric System Notes
Measurement Basic Metric Unit
Length =
Mass =
Volume =
Write the correct abbreviation for each metric unit. 1) Kilogram _____
4) Milliliter _____
7) Kilometer _____
2) Meter _____
5) Millimeter _____
8) Centimeter _____
3) Gram _____
6) Liter _____
9) Milligram _____
http://heimscience.weebly.com/uploads/9/5/6/3/9563610/__6863235_orig.png

Ag Biology 7
Metric Conversion Practice
1. 1000 mg = _______ g
2. 1 L = _______ mL
3. 160 cm = _______ mm
4. 14 km = _______ m
5. 109 g = _______ kg
6. 250 m = _______ km
Compare using <, >, or =.
1. 16) 63 cm 6 m
2. 17) 5 g 508 mg
3. 18) 1,500 mL 1.5 L
4. 19) 536 cm 53.6 dm
5. 20) 43 mg 5 g
6. 21) 3.6 m 36 cm
The Metric System Game

Ag Biology 8
Lab Equipment Notes

Ag Biology 9
Lab Safety Notes
Identify all the different ways this Minion is being safe in the science lab.

Ag Biology 10
Lab Safety Scenarios A
Scenario Description What went wrong? How do you respond?
1. A student is working hard on a lab experiment that uses a strong acid. Halfway through the lab, the student gets hungry and starts eating a bag of chips. When the student licks their fingers, they start to have a severe reaction.
2. During an experiment, a student carefully pours an unknown solution from a test tube into a beaker. Another student sneaks up behind them and surprises their friend. The student accidentally drops the beaker on the floor, and pieces of glass land on their sandaled feet.
3. A student with long hair is heating a solution over a burner. As the student leans over the burner to reach for something, their hair catches fire.
4. A student is excitedly telling their friend their plans for the weekend, and is not listening to the teacher’s lab instructions. During the lab, the student mixes two of the wrong chemicals together and an uncontrolled chemical reaction occurs.
5. A student is in the middle of a science experiment where they have to boil a solution for a long time. When the student gets bored and wanders over to talk with their friends, a sweatshirt they left on the desk near the hot plate catches fire.

Ag Biology 11
Lab Safety Scenarios B
Scenario Description What went wrong? How do you respond?
1. A student is working on a lab where they are trying to identify an unknown substance. The student decides to smell the solution by taking a big breath over the test tube. They immediately start to cough and their lungs are burning.
2. A student is rushing to finish their lab. They accidentally spill some acid on the desk, and decide to clean it up with a paper towel before leaving. In the next class. A student sits down at the desk and starts to have a reaction to the acid.
3. A student is adding small drops of acid to a solution. They are leaning in closely to count how many drops of acid they are adding. The acid splashes and gets in their eyes.
4. A student is dissecting an animal. During the dissection, the sharp scalpel slips and seriously cuts the student’s finger. Blood is spurting everywhere.
5. A student is heating a test tube over a burner. The test tube explodes, sending shards of glass and chemicals towards a nearby student, who is finished their lab and is not wearing their safety goggles.

Ag Biology 12
Lab Safety Violations
Identify all 36 safety violations in this lab.

Ag Biology 13
Measure Me Lab
Purpose
Working in a science-related field requires the ability to make precise and accurate measurements. The success of many laboratory experiments and your safety rely on your ability to read procedures carefully and follow them accurately. Following procedures often includes measuring a variety of compounds.
Measurements that are commonly used in the laboratory include distance, mass, temperature, and volume. Any of these can be measured using the metric system or the English system. See Figure 1 below to see comparable units of measurement.
Unit Metric English
Distance Centimeters Inches
Mass Grams Ounces
Temperature Degrees Celsius Degrees Fahrenheit
Volume Milliliters Ounces
Figure 1. Units of Measurement
An additional measurement used in the laboratory is density. Density is the mass or weight of an object in comparison to its volume. Consider a brick compared to a like-sized piece of Styrofoam, the brick is much heavier even if they are the same size. While the volume of the brick is similar to the volume of the Styrofoam, the density of the brick is much greater.
Measuring accurately is like putting a puzzle together. Once you put all the pieces in the right place, you end up with a rewarding end product. Can you measure length, mass, temperature, volume, and density accurately in order to put the pieces of this lab together correctly?
Materials
Per student:
Paper
Ruler
Scissors
30 cm masking tape
Safety glasses
Disposable gloves
100 ml beaker
100 ml graduated cylinder
34 g chemical powder
Plastic spoon
Weighing dish
Stirring rod
Pencil
Lab apron

Ag Biology 14
Procedure
You will be using a variety of measurement methods to mix chemicals. Take care to measure correctly and follow procedures in order to produce the correct mixture.
Part One – Linear Measurement
1. Obtain a piece of paper from your teacher.
2. Draw a fifteen centimeter square in the center of the paper.
3. Divide the paper into nine 5 cm2 squares as shown in Figure 1. Use caution to be very accurate with your measurement.
Figure 1. Nine Square Box
4. Label the lines within your square as shown in Figure 2.
Figure 2. Labels
5. Write your name on the base and top center square.
6. Cut out the 15 cm2 square.
7. Cut the appropriate lines within the square.
8. Make the appropriate folds as indicated by your markings. Be sure the marking side is to the outside of the box.
9. Place a staple at the very top of each side of the container.
Ag Biology 15
10. Tape the outside corners to seal the edges. Your container will hold liquid, so make sure all edges are sealed tight!
Part Two – Determining Mass
As you will be working with chemical compounds, personal protective equipment is required for the remainder of this lab.
1. Put on your safety glasses, gloves, and lab apron.
2. Collect a spoon and weighing dish.
3. Use the electronic balance to determine the mass of the empty dish and record in the table. Include the correct units of measurement.
4. Use the spoon to add 34 grams of the dry powder to the dish.
5. Carefully pour the powder into the beaker.
Part Three – Taking Temperature
1. Use one of the larger beakers to heat water to boiling on a hot plate.
2. Once the water is boiling, use the thermometer to determine the temperature of the water. Record the temperature in the table.
Part Four – Adding Volume
1. Using a hot pad or oven mitt, measure 60 ml of boiling water into the graduated cylinder.
2. Quickly pour the water into the 100 ml beaker with the chemical powder. Take care not to spill the water.
3. Use the stirring rod to mix the compounds until the powder is completely dissolved.
4. Allow the mixture to cool for ten minutes by monitoring the clock or your watch.
5. While waiting, clean up your workstation.
6. After ten minutes have passed, pour the mixture into the paper container you made in Part One.
7. Place the container on the tray which will go in the refrigerator.
Day 2- Part Five – Determining Density
1. Put on personal protective equipment including safety glasses and gloves.
2. Obtain your container and a piece of wax paper from your teacher.
3. Place the wax paper on the electronic balance and then zero the balance.
4. Peel the paper container away from the now solid mixture in the container and place it on the wax paper.
5. Use the electronic balance to determine the total mass of the solid and record in Table 1.

Ag Biology 16
6. Use the ruler to determine the length, width, and height of the solid and record in Table 1.
7. Calculate the volume of your cube by multiplying the length times the width times the height and record in Table 1.
Volume (cm3) = length(l) x width(w) x height(h) 8. Calculate the density of the solid by dividing the mass of the solid by the volume of the
solid. Record in Table 1.
Density (g/cm3) = Mass (g) Example: Water
Volume (cm3) Density = 1 g/cm3
1 g (Mass) 1 cm3(Volume)
9. Dispose of all materials as instructed by your teacher.
Table 1 Results (include units for all data)
Mass
Measurement Length: Width: Height:
Volume Density
(L x W x H): (Mass/Volume):
Conclusion Questions
1. List three measurements that were essential to the success of this experiment.
2. What problems could inaccurate measurements have caused when building your cube?
3. Describe one everyday application for each type of measurement.
Distance
Mass
Temperature
Volume
Density
4. What is the density of an item that has a mass of 10 grams and a volume of 10 milliliters?

Ag Biology 17
Microscope Notes
Label the parts of the microscope.

Ag Biology 18
Using a Microscope
Explain how to focus a microscope using detailed steps.
Explain how to make a wet mount slide using detailed steps. Include a
labeled diagram with your explanation.

Ag Biology 19
Using a Microscope to Compare Cells Purpose
Do plant and animal cells look the same? In this activity, you get a chance to see cells under the microscope and identify a few of those visible differences.
So much of discovery involves using tools commonly found in science laboratories. You must be able to use a microscope for examining structures smaller than the human eye can see. This activity allows you to demonstrate your ability to prepare slides for viewing under a microscope.
Procedure
Part 1 – Making a Wet Mount Slide with Onions
The first step is to refresh your microscope skills. One of the most critical steps in microscope examination is to have a clear view of what you are examining. Your objective is to create a clear slide free of air bubbles that can distort the image under magnification. To start with, you will examine one type of plant cell.
Create an onion slide
1. Obtain a glass slide, coverslip, water dropper, forceps, and paper towel.
2. Clean the slide with the paper towel. Prevent fingerprints by holding the edge or corners of the slide.
3. Use a razor blade or scalpel to make a paper thin slice of the onion (the slice has to be thin enough in order for light to go through the sample).
4. Using the clean slide, place a drop of water in the center of the slide.
5. Using forceps carefully place a small slice of onion on the water drop. Remember to avoid air bubbles.
6. Hold a coverslip at a 45-degree angle on top of the slide next to the onion. Gently lower the coverslip onto the water drop so you do not trap air bubbles underneath.
7. Place the slide on the paper towel and fold part of the towel over top of the slide. Gently press on the coverslip allowing excess moisture to be absorbed by the paper towel.
8. Examine your slide under a microscope. Follow the directions you created to focus the microscope.
9. Once structure appears in the view, look for any air bubbles. The air bubbles will be round shapes with dark edges.

Ag Biology 20
10. Carefully rotate the revolving nosepiece to the next magnification level. Watch the objective as you turn and stop if it appears that you will touch the objective to the coverslip. If necessary, raise the nosepiece slightly to allow the objective to slide into place. Again, try to focus on the potato.
11. Examine the sample under both low power and high power. Illustrate what you see under the clearest magnification using Figure 1.
Figure 1.
Circle which power was used:
Low-power High-power
Did you have any air bubbles under your coverslip?
How can you prevent air bubbles when you prepare a slide?
Which lens power provided the clearest view and most detail of your onion slice?

Ag Biology 21
Part 2 – Animal Cells- Create a cheek cell slide
1. Use a toothpick and scrape the inside of your mouth in the cheek area.
2. Smear the toothpick on the center of a clean slide.
3. Add one drop of methylene blue dye.
4. Place the coverslip over the liquid as you have done before. Remember to avoid air bubbles. Absorb excess moisture with a paper towel.
5. Examine the sample under both low power and high power. Illustrate what you see under the clearest magnification in Figure 3.
Figure 3.
Circle which power was used:
Low-power
High-power
Conclusion
1. In what ways were the plant cells and animal cells the same?
2. What were the major differences in appearance between the plant cells and the animal cells?
3. A cell wall is a rigid structure that surrounds the cell and gives it support. Describe evidence from your investigation to support the fact that animal cells have no cell wall.

Ag Biology 22
Graphing Data
Define the following terms:
1. Independent variable:
2. Dependent variable:
3. Control variable:
Types of Graphs
Pie Graph Bar Graph Histogram Line Graph Scatter Plot
Presents data as
parts of a whole or percentage
Divides the categories into “slices of pie”
Works well with few segments- too many segments will be small and hard to see
Has bars that show different categories and the amounts in each category.
No order to categories x and y axis
Bars do not touch
Type of bar graph
Dependent variable has a natural order
Bars touch
Y axis is usually a percentage or count
Data is shown as numbers in order
Points are plotted using x and y components
Points are connected because the observations are dependent- the next value depends on the one before
Useful for showing movement or trend of numbers over time
Points are plotted using x and y components
Points are NOT connected because the observations are independent- the next value does not depend on the one before
Uses a best fit curve to show relationship
Used to compare “this versus that”

Ag Biology 23
Determining the Best Graph
Based on the graph descriptions, put an X in the box for the type of graph
that is most appropriate for the description.
Description Pie Bar Histo. Line Scatter
A graph showing the number of 9th graders who prefer Coke or Pepsi
A graph showing how a new born baby’s weight changes over time
A graph showing the percentage of students earning As, Bs, and Cs
A graph showing the distribution of trees in different size groups (0-10 cm) (10-20 cm) etc.
A graph showing height versus weight of third graders
Labeling the Axis
What are three things to keep in mind when labeling the axis of graphs?
1.
2.
3.
A farmer wants to know if there is a relationship between the amount of
fertilizer (in kilograms) she uses and how tall her corn grows (in
centimeters). Label the axis of the graph below.

Ag Biology 24
Unit 2: Cell Structure and Function

Ag Biology 25
Prokaryote vs. Eukaryote
Complete the Venn diagram comparing and contrasting prokaryotic cells and
eukaryotic cells.
Ag Biology 26
Cell Theory
View the video on the “Wacky History of the Cell Theory.”
http://ed.ted.com/lessons/the-wacky-history-of-cell-theory#watch and answer the
following questions.
1. List the three parts of the cell theory:
1. _____________________________________________________________
2. _____________________________________________________________
3. _____________________________________________________________
2. Name of the spectacle maker from Netherlands – lived in the early 1600’s:
3. What was this scientist famous for?
4. Name of the Dutch scientist who made his own microscope:
5. What famous discovery did this scientist make with his home-made microscope?
How did he make this discovery?
6. What did he call his discovery?
7. Name of the English scientist who is credited for coming up with the term “cell”
8. What was this scientist looking at when he came up with the name “cell?”
9. Why did he call them cells?

Ag Biology 27
10. What did Robert Hooke do to make Sir Isaac Newton Mad?
11. Why does no one know what Robert Hook looked like?
12. Name of the German botanist (one who studies plants) from the 1800’s
13. What discovery was this German botanist famous for?
14. Name of another German scientist from the 1800’s that studied animals:
15. What was this German scientist famous for?
16. What part of the cell theory did Shleiden and Schwann disagree on?
17. What did Schleiden believe?
18. What did Schwann believe?
19. Who was right?
20. Name of the scientist that proved all cells come from other cells:

Ag Biology 28
Cells Alive
Use the Interactive Cell Models on www.CellsAlive.com to color and label
the plant and animal cells below. Use the same color for the same organelle
in both cells. For example, if you color the nucleus in the plant cell red, use
red for the nucleus in the animal cell.

Ag Biology 29
Cell Analogy Collage Purpose
What does a nucleus look like or function like? Being able to relate newly discovered information with things already known will help you understand the purpose of new objects and remember their features. An analogy is a comparison between two things, which are similar in some respects, but otherwise different. In this project, you will make analogies between cell organelles and everyday objects to highlight the similarities.
For example, an analogy for the human kidney could be a pool filter. The kidneys filter out wastes from the human body just as a pool filter removes particles from the swimming pool. More specifically for cells, you can say the nucleus of a cell is like the brain of a human because the nucleus controls and coordinates the activities of the whole cell just as the human brain controls and coordinates the activities of the human body.
Since cells are hard to see without the help of a microscope and their functions are even harder to visualize, you will use analogies to help you remember the various aspects and functions of cells.
Materials
Per student:
Computer with Internet access and word processing software
Poster paper
Glue sticks
Permanent markers
Colored pencils
Printer
Scissors
Pencil
Procedure
For this project, you will design and create a collage for an assigned organelle using analogies describing how the organelle functions. When you have completed your collage, you will share your interpretation of the organelle. During your classmates’ presentations, you will need to take good notes of all presentations so that you will have a complete record of all the organelles on your worksheet. 1. Your teacher will assign you one of the following organelles:
Cell Membrane Cell Wall Peroxisome
Centrosome Chloroplast Secretory Vesicle
Cytoskeleton Cytosol (Cytoplasm) Ribosomes
Endoplasmic Reticulum Golgi Apparatus Vacuole
Lysosome Mitochondria
Nucleolus Nucleus

Ag Biology 30
2. Your teacher will assess your display using Cell Analogy Scoring Guide. Review the criteria that your grade will be based on prior to starting the project.
3. Either draw or glue a quality picture of your organelle in the center of your poster. Make sure the image is large enough to see detail, leaving enough room to add smaller images around the edges of the illustration. Use Figure 1 as a guide for placement.
4. Use the Internet and a textbook to write a complete description of the function for the organelle. Use this description as a caption for the illustration you added in Step 3. Type this description using at least a 20-point font size. Use information from at least two sources.
5. Answer the questions on the student worksheet and glue the sheet to the lower right hand corner of the poster.
6. Draw or glue to the poster pictures of two everyday items that answer the question – “My organelle looks like…” Use Figure 1 as a guide for placement.
7. Type the name of each everyday item to attach to the collage above the picture and write a brief analogy beginning with “My organelle looks like…” that explains the similarities between the everyday item and the organelle. Be sure to explain your reasoning behind your selection of each everyday item.
8. Draw or glue to the poster pictures of three everyday items that answer the question – “My organelle functions similar to (everyday item) because a (everyday item) does…” Use Figure 1 as a guide for placement.
9. Type the name of each everyday item to place above the corresponding pictures and write a brief statement beginning with “My organelle functions similar to (everyday item) because a (everyday item does….” that explains the similarities between each everyday item and the organelle. Be sure to explain your reasoning behind your selection of each everyday item.
10. Print the function description and analogy descriptions and cut apart as appropriate.
11. Glue the statements you typed with their respective illustrations on the poster.
Figure 1. Poster Layout Sample

Ag Biology 31
12. Display your completed collage in the area identified by your teacher.
13. Review the collages around the room and record information about each organelle in Table1.
Table 1. Organelle Functions and Analogies
Organelle Function in a Cell “Looks Like” Analogy “Functions Like”
Analogy
Cell Membrane
Cell Wall
Centrosome
Chloroplast
Cytoskeleton
Cytosol (Cytoplasm)
Endoplasmic Reticulum
Golgi
Lysosome
Mitochondria
Nucleolus
Nucleus
Peroxisome
Ribosomes
Secretory Vesicle
Vacuole

Ag Biology 32
Conclusion
1. How does the use of analogies help you to remember the function and anatomical features of a cell organelle?
2. Which was the most creative cell analogy collage you observed? Why do you think it made an impression on you?

Ag Biology 33
Cell Analogy Collage Rubric
Topics 4 points 3 points 2 points 1 point
Teacher
Comments
Cell Part
Analogies
The collage includes two “look like” analogies and three “function like” analogies with everyday pictures that answer those statements.
The collage includes two “look like” analogies and three “function like” analogies. The collage is missing everyday pictures that answer those statements.
The collage is missing one “look like” or “function like” analogies. The remaining analogies include everyday pictures that answer those statements.
The collage is missing two or more “look like” or “function like” analogies and/or everyday pictures that answer those statements.
Science
Content
All five questions are correctly answered with detail making it obvious the student clearly understands the location, structure, and function of their cell part.
All five questions are correctly answered, but lacks detail and it is not obvious the student clearly understands the cell part.
One question is incorrectly answered, and details are lacking in the other answers.
Two or more questions are incorrectly answered. Remaining answers lack detail and demonstration of comprehension.
Appearance
and
Effectiveness
The collage includes a quality picture of the cell part and detail is easy to see. All analogies are typed and are clearly written with detailed “look like” and “function like” statements.
The collage includes a picture of the cell part. All analogies are typed with “look like” and “function like” statements.
The collage includes a picture of the cell part. Analogies are not typed but are written with “look like” and “function like” statements.
A quality detailed picture of the cell part is missing. Analogies are not typed nor clearly written with “look like” and “function like” statements.
Teacher
Comments
Ag Biology 34
Bound Together
Purpose
Cell organelles, microscopic in size, must all function together in order for the cell to function. In turn, the entire organism benefits from every organelle carrying out a specific function.
In your school, you have many different people working to provide food, secretarial, record keeping, custodial, nursing, transportation, and other support-type services. Your teachers are further divided into departments such as language, fine arts, history, physical education, mathematics, career and technical, and science. Imagine what would happen if just one of those groups of staff members did not do their job every day. The entire student body would be affected.
Just as the people who work in your school all have very different responsibilities; cell organelles have very different jobs. If an organelle were missing, would the effect be noticeable? Which organelle affects the most other organelles?
Materials
Per pair of students:
Textbook
Computer with Internet access and graphic organizer software
Per student:
Pencil
Procedure
Using the information from your Cell Analogy Collage, you and your partner will diagram the relationships between organelles of a cell.
Part One – Identify and Label Relationships
1. Use information from the resources listed below to help you identify which organelles work with or provide for other organelles:
Cells Alive Interactive Cell http://www.cellsalive.com/cells/cell_model.htm (click on individual organelles for information about structure and function)
Textbook chapter on cell organelle function
Recorded information from Cell Analogy Collage
2. Fill in Table 1 with your findings. A sample entry discussing the relationship between leucoplasts and the endoplasmic reticulum is included in the first row. Some organelles may be repeated several times with different organelle relationships. Additional space may be required for relationships not suggested by the table. Relationships will vary, but focus on the material or message moving between the two organelles to help you define the relationships in the space provided.

Ag Biology 35
Table 1. Organelle Relationships Organelle Description of the Relationship Dependent
Organelle(s)
Leucoplast Protein synthesized by the ER is stored in leucoplasts
Endoplasmic reticulum
Ribosomes Nucleus
Ribosomes Endoplasmic reticulum
Cytosol (cytoplasm) Mitochondria
Nucleolus Ribosomes
Mitochondria Chloroplasts
Vacuole Chloroplasts Peroxisomes
Vacoule Cell wall
Peroxisomes Chloroplast
Golgi Lysosomes
Golgi Peroxisomes
Golgi Secretory vesicles
Cytosol (cytoplasm) Golgi Cell wall
Endoplasmic reticulum Secretory vesicles
Nucleus Cytosol (cytoplasm)

Ag Biology 36
Part Two – Show the Relationships
1. Your teacher will review how to make text boxes, connectors, and labels on a graphic organizer program.
2. Choose an area of cell function- energy production and metabolism, protein synthesis, waste production and management, or communication pathways. Decide which relationships are involved in that function. Your graphic organizer will focus on those relationships you selected. A sample relationship has been illustrated in Figure 1.
3. In the graphic organizer program, create a title box that contains the focus of relationships (Energy, Protein, etc) and the names of both partners.
4. Next, add text boxes or import graphics to represent each organelle involved in the relationships chosen in Step 2.
5. Clearly label each organelle.
6. Use arrows or other connectors to show the relationships between organelles. Arrows may signify the direction of the flow of energy, materials, or messages.
7. Label the arrows or connectors with specific information regarding the relationship.
Figure 1. Sample Relationship Diagram
8. When directed by your teacher, share your organizer with your classmates and discuss how organelles work together to perform cellular processes.
Conclusion
1. Where does the flow of energy seem to begin in a plant cell? How would this be different in animal cells?
2. How quickly would the impact of a non-functioning organelle be noticed?
3. Are the functions of a cell from one tissue different than the functions of a cell from another tissue? Why or why not?
Ag Biology 37
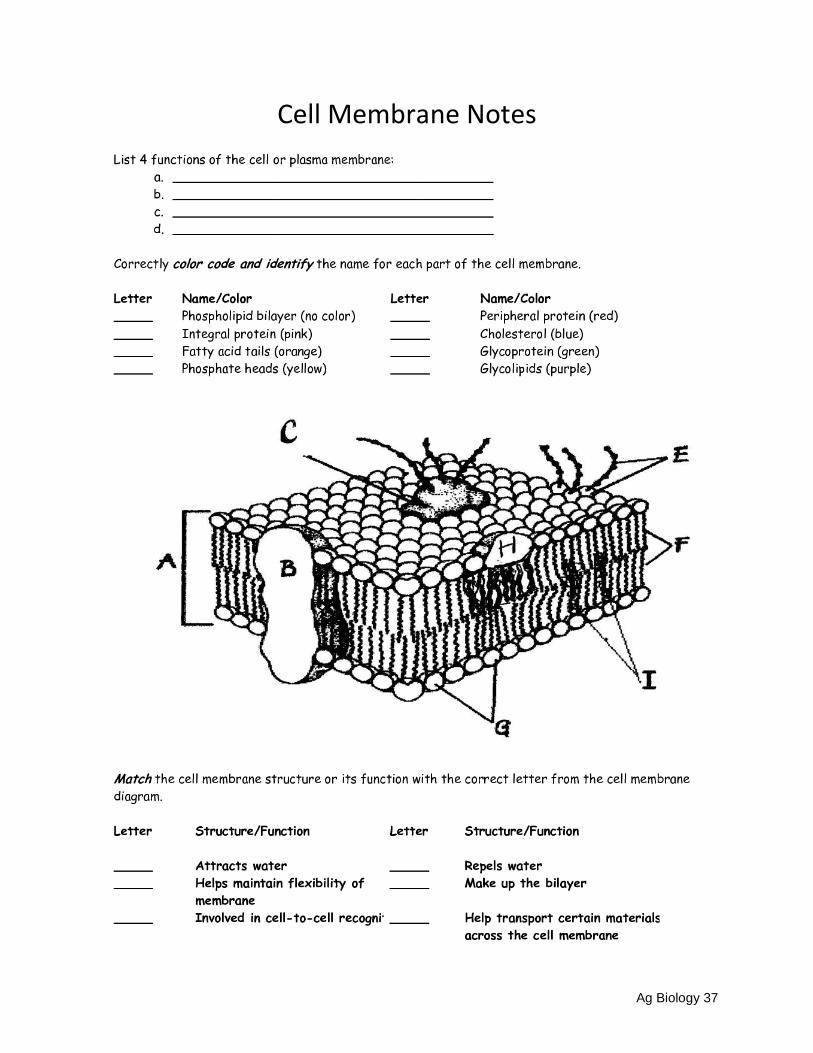
Cell Membrane Notes

Ag Biology 38
Cell Membrane Bubble Lab
Background Bubbles make a great stand in for cell membranes. They’re fluid, flexible, and can self-repair. Bubbles and cell membranes are alike because their parts are so similar. If you could zoom down on a cell membrane, you’d see that much of the membrane is a double layer of little molecules called phospholipids. Phospholipids have a love-hate relationship with water. One end, the “head,” is attracted to water, and the other end, the “tail,” is repelled by water. Place phospholipids in water and they quickly form a double layer with the heads facing out on both sides. A soap molecule has the same split personality. The “head” of a soap molecule is charged (ionic) and attracts to water molecules, which have regions of positive and negative charge (polar). The hydrocarbon tail of the soap molecule is not charged and is repelled by water’s polarity. This explains why we use soap to clean. The hydrocarbon tail of soap mixes with and dissolves in other hydrocarbons, like oils and fats, while the head region grabs a hold of passing water molecules and follows them down the drain. The surface of a bubble has three layers. The middle layer is a thin film of water. On both sides of this film is a layer of soap molecules with hydrophilic heads oriented toward the water film and hydrophobic tails pointing away.
Materials 1000ml beaker
900ml water
100ml dish soap
25ml corn syrup or glycerol
4 bendable straws
30 inches of string (optional)
Spool of thread
1 clean straw
Shallow tray (cafeteria tray)

Ag Biology 39
Set Up
1. Create the bubble solution by mixing 900 ml water, 100 ml soap, and 25 ml corn syrup in the 1000ml beaker.
2. Create a bubble frame by using the following instructions. Method One a. Bend 4 straws at elbows. b. Flatten the shorter ends of straws and fold flatted surface in the middle (See Fig. 2). c. Connect straws together by inserting short ends into long ends to create a square (See Fig. 3). Method Two a. Cut straws in 5 ½ inch lengths. b. Run a 30 inch string through all four straws. c. Tightly tie ends of string together to create a frame. d. Cut off loose ends of string.
3. Create a ring of thread by tying a loop about two fingers wide. 4. Cut off the loose ends. 5. Place bubble frame into shallow tray 6. Add bubble solution to slightly cover bubble frame.
Procedure Cell Concept 1 – Membranes are Fluid and Flexible Cell membranes are not static, they bend and flex in order to adapt to changing conditions. 1. Lift bubble frame out of solution so that a thin film spans across frame. 2. Tilt the frame back and forth and observe the surface of the film. 3. Notice the swirl of color as the light reflects off the film. Molecules in the cell membrane
move about in a similar fashion. 4. Hold the frame by the edges and rotate the sides in opposite directions. (See Fig. 4) Notice
the elasticity of the film.

Ag Biology 40
5. Hold the bubble film parallel to the floor and gently move the frame up and down until the surface begins to bounce up and down.
6. Like the bubble film, membranes can flex without breaking.
Cell Concept 2 – Membranes Can Self-Repair Attraction between phospholipids allows cell membranes to repair small breaks in the bilayer. 1. Lift bubble frame out of solution so that a thin film spans across frame. 2. Cover the surface of your finger or extra straw in bubble solution. 3. Slowly push finger or straw through film. Film should allow finger to pass without breaking. 4. Remove finger from film. Film should repair itself. 5. Try the same procedure with your entire hand. 6. Like the bubble layer, cell membranes can spontaneously repair small tears in the lipid
bilayer. Cell Concept 3 – Eukaryotic Cells Feature Membrane Bound Organelles The membranes surrounding organelles in Eukaryotic cells feature a phospholipid bilayer like the one found in the outer “plasma” membrane.
1. Place the tip of a clean straw into the bubble solution in the tray. 2. Gently blow on the other end of the straw to create a bubble. 3. Slowly lift the tip of the straw out of the liquid while continuing to fill the bubble with air. 4. Allow the bubble to grow to a size of about 6” wide. 5. Return the tip of the straw back into the bubble solution and try to create a smaller bubble
inside the larger bubble. 6. Notice how the smaller bubble creates a compartment of air that is contained within but
separated from the air of the larger bubble. 7. In a similar fashion, Eukaryotic cells feature membrane bound organelles that create
specialized compartments within a single cell. The primary structure of the outer cell membrane as well as the membranes that enclose organelles is a double layer of phospholipids known as a phospholipid bilayer.
Cell Concept 4 – Membrane Proteins Perform Special Functions Some specialized proteins embed within the lipid bilayer, giving the membrane unique properties. Channel proteins are one example. They form a passageway for large or electrically charged molecules to pass through the membrane. 1. Lift bubble frame out of solution so that a thin film spans across frame. 2. Hold the frame parallel to the tray.

Ag Biology 41
3. Gently lay loop of thread onto film surface. 4. Use a pencil or pen to break the bubble film that is inside the loop of thread. 5. Loop of thread should rapidly expand into the shape of a circle. 6. Insert pencil or finger into middle of thread loop. 7. Rock frame back and forth to see thread loop drift across film. 8. Membrane proteins can also drift across the lipid bilayer. Cell Concept 5 – Gap Junctions Aid Transport Between Animal Cells Gap junctions form between neighboring animal cells, allowing their cytoplasms to connect directly. This provides a quick way to move material between two cells. 1. Place the tip of a clean straw into the bubble solution in the tray. 2. Gently blow on the other end of the straw to create a bubble. 3. Lift the straw out of the liquid and continue to blow air into the bubble. 4. Continue to gently blow air into the bubble as you slowly pull out the straw. 5. As the tip of the straw leaves the bubble, you should be able to briefly observe a small
tunnel existing between the bubble and straw tip. 6. This tunnel is allowing air to freely move between the straw and the bubble without
breaking the bubble film. 7. In the same manner, gap junctions allow for the rapid transit of ions and small molecules
between adjacent animal cell membranes. Cell Concept 6 – Many Bacteria Cells Reproduce Through Binary Fission Some Single-celled bacteria reproduce by splitting into two. This is known as binary fission. 1. Place the tip of a clean straw into the bubble solution in the tray. 2. Gently blow on the other end of the straw to create a bubble. 3. Lift the straw out of the liquid and continue to blow air into the bubble. 4. Increase the size of the bubble until it is about 6” wide. 5. Hold a piece of thread that is twice as long as the bubble and slide it underneath the
bubble. 6. Lift the thread up through the bubble and the bubble should split into two. 7. In binary fission, bacterial cells divide when a thin ring of proteins located at the cells
midpoint contracts, effectively cleaving the cell in two.

Ag Biology 42
Conclusion 1. Explain each of the concepts in your own words:
Cell Concept 1- Membranes are fluid and flexible
Cell Concept 2- Membranes can self repair
Cell Concept 3- Membrane bound organelles
Cell Concept 4- Membrane proteins
Cell Concept 5- Gap junctions
Cell Concept 6- Binary fission

Ag Biology 43
Active and Passive Transport Demonstration

Ag Biology 44
Osmosis with Grapes
Question: What happens when grapes are put in isotonic, hypertonic, and hypotonic
solutions?
Hypothesis: If grapes are put in an isotonic solution, then… __________________________ If grapes are put in a hypertonic solution, then… __________________________ If grapes are put in a hypotonic solution, then… __________________________
Background: Grapes are made of cells, and in addition to each of their cell membranes, the skin of the grape is also a semi-permeable membrane. Water moves from high to low concentration.
Materials: 3 Grapes Water Sugar
Grape Juice Beaker Stirring Rod
Paper Towel Digital Scale Permanent Marker
Data:
Procedure: 1. Use a permanent marker to label three beakers “Sugar Water”, “Grape Juice”, and “Water”. 2. Mix sugar and water at a 1:1 ratio in the “Sugar Water” beaker and stir with a stirring rod.
For example, if you add 100 grams of sugar, add 100 grams of water. 3. Measure the mass of a grape using the digital scale, record in data table, and place in the
“Sugar Water” beaker. 4. Pour grape juice into the “Grape Juice” beaker. 5. Measure the mass of a grape using the digital scale, record in data table, and place in the
“Grape Juice” beaker. 6. Pour water into the “Water” beaker. 7. Measure the mass of a grape using the digital scale, record in data table, and place in the
“Water” beaker. 8. Let beakers sit overnight. 9. Take out the grape from the sugar water, and dry carefully using a paper towel. 10. Measure the mass of the grape and record in data table. 11. Take out the grape from the grape juice, and dry carefully using a paper towel.
Sugar Water Grape Juice Water
Mass Before (grams)
Mass After (grams)

Ag Biology 45
12. Measure the mass of the grape and record in data table. 13. Take out the grape from water, and dry carefully using a paper towel. 14. Measure the mass of the grape and record in data table. 15. Answer the conclusion questions.
Conclusion Questions 1. What happened to the mass of the grape in each of the three solutions? Why?
Sugar water- Grape juice- Water-
2. Which solution was the most isotonic compared to the grape?
3. Which solution was the most hypertonic compared to the grape?
4. Which solution was the most hypotonic compared to the grape?
5. A grape cell is a plant cell. Why did the grape not shrivel up until it collapsed in the hypertonic solution? Hint: which cell part keeps it from collapsing?
6. Using the key provided, make a diagram of the grapes at the beginning of the experiment. Show water movement in or out of the grape cells. ▲= sugar ●= water movement of water
Isotonic Hypertonic Hypotonic

Ag Biology 46
Just Passing Through- Diffusion and Osmosis
Background
The movement of molecules through a cell membrane happens through diffusion. Osmosis is
the diffusion of water. Such movement is possible because some molecules are smaller than
membrane pores or holes. If the molecules are too large, no molecular transfer, or diffusion
occur.
Some membranes may transmit selectively and are termed semi-permeable membranes. In the
following experiment, cellophane dialysis tubing serves as an excellent representation of the
cell membrane.
Materials Glucose Solution
Starch Solution
Iodine Solution
Glucose Test Strips
Dialysis Tubing, String
400 ml Beaker
Graduated Cylinder or Pipette
Procedure
1. Remove the dialysis tubing from the water and rub one of the ends between your thumb and pointer finger to open. Once open, submerge it in water again for about thirty seconds.
2. Tie one end of the tubing in an overhand knot 3. Measure 5 ml of starch solution using a graduated cylinder or pipette and pour it
into the tube. 4. Thoroughly rinse the graduated cylinder or pipette, shake dry, and measure 5 ml of
glucose solution. Pour this into the tubing as well. 5. Find the mass of your “cell” and record in the data table. 6. Tie the second end of the tubing in an overhand knot and rinse it under the faucet.
Set your “cell” on a clean surface. 7. Fill the 400 ml beaker ¾ full with tap water. Add 10 drops of Iodine solution and stir
well. (Iodine will turn blue-black in the presence of starch). 8. Test the solution in the beaker for the presence of glucose by dipping a glucose test
strip into it. After 30 seconds, compare the color on the strip to the color chart on the side of the bottle.
9. Complete the “Initial Status” information on your data table. 10. Place the artificial cell (the sealed tubing with solutions) into the beaker of solution
and allow it to remain undisturbed for 15-20 minutes. 11. Remove the tubing from the beaker and record your observations in the data table
for “Final Status” of the solution and the bag. 12. Retest the solution in the beaker and in the bag with a new glucose test strip and
record this data in your table.

Ag Biology 47
Data
Contents
Initial
Solution
Color
Mass of
“cell” Final
Solution
Color
Initial
Presence
of
Glucose
Final
Presence
of
Glucose
Bag
Glucose &
Starch
(C6H12O6 +
C6H10O5)
Beaker
water + iodine
(H20 + KI)
Conclusion
1. Which substance(s) are entering the bag and which are leaving the bag?
2. What evidence supports your answer?
3. Based on your observations, rank the following by relative size, beginning with the smallest: glucose molecules, water molecules, KI molecules, membrane pores, and starch molecules.
4. What results would you expect if the experiment started with glucose and iodine solution inside the bag and only starch and water outside? Why?

Ag Biology 48
Cell Energy Notes

Ag Biology 49
Seed Viability- Respiration
Purpose
Are seeds really alive? Seeds are in a dormant state of life. Some seeds can be dormant for several years until the environmental conditions are optimal for germination. Therefore, technically, seeds are living organisms.
This activity will provide scientific evidence that seeds are alive. Like all living organisms, as seeds grow they consume food. Germinating seed embryos consume food reserves stored as starch. Cellular respiration converts these food resources in to energy as shown in the following chemical equation:
C6H12O6 + 6 O2(g) ↔ 6 H2O + 6 CO2(g) + energy
You will use a LabQuest to detect CO2 produced by the seed.
Materials
Per pair of students:
LabQuest® interface
Vernier CO2 gas sensor
Vernier temperature sensor
(50) pea seeds
250ml respiration chamber
Paper towel
Ice cubes
(2) 100ml beakers
Procedure
You and your partner will conduct experiments to collect scientific evidence and support the claim that seeds are alive. Follow instructions provided and record your data in Table 1.
Part One – Setting up the Experiment
1. Write your name on two 100ml beakers using a dry erase marker pen.
2. Count out 50 pea seeds from the container your teacher provides.
3. Place 25 seeds in each 100ml beaker.
4. Place one of the beakers in the area designated by your teacher.
5. Fill the second beaker containing seeds half-full of tap water and set this beaker aside next to the dry beaker.
6. The following day, remove the seeds from the water and roll them in a wet paper towel to continue germination.
7. Pour out all but quarter inch of water in the bottom of the beaker. Gently curl the paper towel into the beaker ensuring that some of the paper towel is touching the water (like a wick).

Ag Biology 50
8. Leave the seeds for one or two days, as directed by your teacher, before moving on to Part Two.
Part Two – Carbon Dioxide Evidence
According to the chemical equation for respiration, as the seed germinates it will produce carbon dioxide. Use the LabQuest® and CO2 gas sensor to collect evidence of this reaction.
1. If the CO2 gas sensor you are using has a switch, set it to the “Low” setting (0-10,000 ppm).
2. Turn on your LabQuest® and connect the temperature sensor to CH1.
3. Connect the CO2 gas sensor to CH2. Set up data collection as follows:
Choose “New” from the LabQuest® “File” menu.
On the Meter screen, tap Rate.
Change the data-collection rate to 0.1 samples/second and the data-collection length to 600 seconds.
Tap “OK.”
4. Obtain 25 germinated peas and blot them dry between two pieces of paper towel.
5. Place the germinated peas into the respiration chamber.
6. Gently push the sensor into the bottle until it fits snugly. Remember that carbon dioxide is heavier than oxygen; therefore place the chamber horizontally when measuring gas concentration.
7. Wait two minutes, and then start data collection.
8. While waiting, measure the room temperature using the temperature sensor and record the temperature in Table 1.
9. A graph of CO2 gas vs. time will display when data collection has finished.
10. Remove the CO2 gas sensor from the respiration chamber. Place the peas in a 100ml beaker, fill half full with water, and add ice cubes.
11. Fill the respiration chamber with water and then empty it. Thoroughly dry the inside of the respiration chamber with a paper towel.
12. Once data is collected, you will perform a linear regression to calculate the rate of respiration.
From the “Analyze” menu across the top of the LabQuest® screen, select “Curve Fit” and “CO2”.
Select “Linear” for the “Fit Equation”. The linear-regression statistics for these two data columns are displayed for the equation in the form y = mx + b, where x is time, y is CO2 gas concentration, m is the slope, and b is the y-intercept.
Ag Biology 51
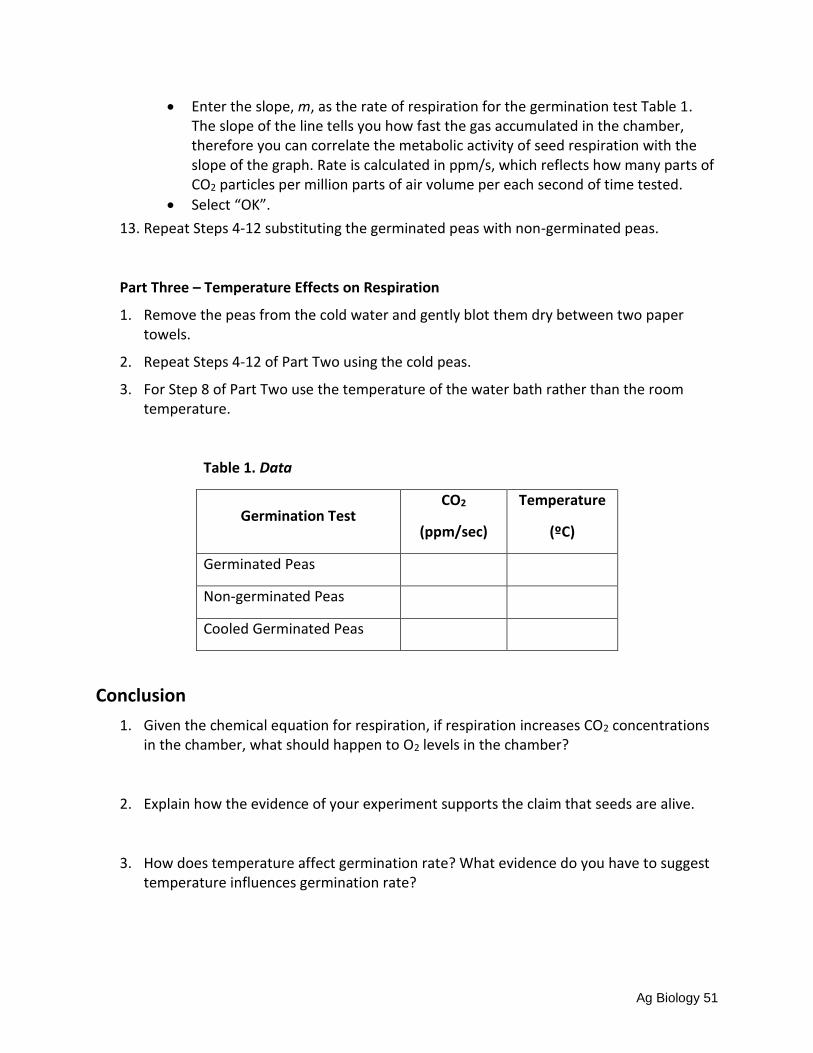
Enter the slope, m, as the rate of respiration for the germination test Table 1. The slope of the line tells you how fast the gas accumulated in the chamber, therefore you can correlate the metabolic activity of seed respiration with the slope of the graph. Rate is calculated in ppm/s, which reflects how many parts of CO2 particles per million parts of air volume per each second of time tested.
Select “OK”.
13. Repeat Steps 4-12 substituting the germinated peas with non-germinated peas.
Part Three – Temperature Effects on Respiration
1. Remove the peas from the cold water and gently blot them dry between two paper towels.
2. Repeat Steps 4-12 of Part Two using the cold peas.
3. For Step 8 of Part Two use the temperature of the water bath rather than the room temperature.
Table 1. Data
Germination Test CO2
(ppm/sec)
Temperature
(ºC)
Germinated Peas
Non-germinated Peas
Cooled Germinated Peas
Conclusion
1. Given the chemical equation for respiration, if respiration increases CO2 concentrations in the chamber, what should happen to O2 levels in the chamber?
2. Explain how the evidence of your experiment supports the claim that seeds are alive.
3. How does temperature affect germination rate? What evidence do you have to suggest temperature influences germination rate?

Ag Biology 52
Gassy Yeast- Fermentation
Question:
Which sugar does yeast like best?
Materials:
4 test tubes
4 balloons
Yeast
Permanent marker
Ruler
Procedure:
1. Label four test tubes A, B, C, D
2. Fill each of the test tubes ¾ of the way full with corresponding solution. (Solution A goes
in test tube A)
3. Use a test tube to add 5 ml of yeast to each test tube and quickly stretch a balloon over
the top of the test tube.
4. Wait ten minutes.
5. Write down what happened in the data table. Record the balloon height.
6. Find out what each solution contained and describe the chemical composition in the
“description of carbohydrate” boxes.
Data:
A B C D
What happened
Balloon height
Description of carbohydrate

Ag Biology 53
Conclusion Questions:
1. Which of the test tubes produced the tallest balloon height?
2. What was happening inside the test tube?
3. What type of gas filled the balloon?
4. Why didn’t all the balloons fill to the same level?

Ag Biology 54
Fermentation in a Bag
Question:
How can fermentation be used in the food industry?
Background:
Fermentation Equation:
C6H12O6 (sugar) ---> CO2 (carbon dioxide) + 2CH3CH2OH (alcohol)
Materials:
Ziploc baggie
Cooking spray
High gluten flour (bread flour)
Yeast
Sugar
Salt
40 degree C water
Electronic balance
Procedure:
1. Lightly spray the inside of the Ziploc bag with cooking spray 2. Place a paper plate or cup on the electronic balance and zero the balance 3. Mass 150 grams of bread flour and add to Ziploc bag 4. Mass 10 grams of yeast and add to Ziploc bag 5. Mass 10 grams of sugar and add to Ziploc bag 6. Mass 1 gram of salt and add to Ziploc bag 7. Zip the bag closed and shake thoroughly to disperse the yeast evenly 8. Using a thermometer adjust the temperature of the tap water until it is about 40° C. 9. Using a graduated cylinder, measure out 50 ml of 40 degree C water. 10. Add 50 mL of 40°C water. 11. Mix by shaking and kneading the bag. The consistency should be in between pancake
batter and cookie dough not too runny and not too thick. Add more water if necessary. 12. Close the bag and mix/knead thoroughly by hand for at least two minutes. 13. Make sure the bag is closed tightly. Set the bag on the table and leave it alone for 10
minutes. 14. At each minute, write down what is happening inside the bag. Is it filling up with gas?
Are bubbles forming? It the dough shrinking or rising? Etc. 15. Keeping the bag closed, knead the dough once more. 16. Allow to sit for 5 more minutes keeping track of observations in your data table. (You
would start with minute 11) 17. Open the bag and set it upright in the microwave. Cook the bread on high for
approximately 2 minutes (turn once during baking- if microwave has a rotating plate, this is not necessary).

Ag Biology 55
Data
Minutes Observations
1
2
3
4
5
6
7
8
9
10
11
12
13
14
15
Conclusion Questions:
1. In the process of fermentation, what is the reactant?
2. In the process of fermentation, what are the products?
3. What is the purpose of the carbohydrates (sugar and flour) in this lab?
4. How do you know that CO2 is being produced?
5. What happens to the alcohol that is produced in the fermentation reaction?

Ag Biology 56
The Chemistry of Life- Biomolecules
Question: Why do some foods give us more energy than others?
Materials: Blended potato(1)
Egg white (2)
Fruit juice (3)
Milk (4)
Oil (5)
Water (6)
Droppers & spoons
Biuret solution
Iodine
Benedicts solution
Hot water bath
6 test tubes
Piece of brown paper bag
Permanent marker
Ruler
Procedure: 1. Read through the entire lab and answer the pre-lab questions.
a. How do you know if a food contains protein?
b. How do you know if a food contains starch?
c. What is the difference between starch and sugar?
d. Why should you be careful of biuret solution?
e. What should you do if you spill some biuret solution on yourself? 2. On 6 test tubes, measure up 1” from the bottom and draw a line with a permanent marker. 3. Label the six test tubes with numbers corresponding to each food item (numbers in
materials list) Part 1: Testing for Carbohydrates (Polysaccharides- Starch) 1. Use a dropper or spoon to fill your test tube to the line with the food item that corresponds
to that test tube number. 2. Add 10 drops of iodine to the test tube. 3. Swirl the test tube to mix the iodine into the food product. 4. Observe the test tube, if the food contains starch it will turn a blue- black color. If the color
remains brown, no starch is present. Record results in your data table. 5. Empty the test tube into the waste container and wash with soap.

Ag Biology 57
Part 2 Testing for Carbohydrates (monosaccharides= sugar) 1. Use a dropper or spoon to fill your test tube to the line with the food item that corresponds
to that test tube number. 2. Add 10 drops of benedicts solution to the test tube 3. Carefully place the test tube into the hot water bath. Heat the tube for 2 minutes. (Test test
tube may be HOT- be careful!) 4. Observe the test tube; look at the following table to determine the quantity of sugar in the
food. Record results in your data table.
Amount of sugar None Trace Little Some A lot
Color Blue Blue/green Green Yellow Orange/red
5. Empty the test tube into the waste container and wash with soap. Part 3 Testing for Protein 1. Use a dropper or spoon to fill your test tube to the line with the food item that corresponds
to that test tube number. 2. Add 5 drops of biuret reagent to your tube (Biuret can burn your skin, wash off spills with
lots of water and soap.) 3. Observe the test tube, if the food contains protein it will turn a pinkish purple. Record
results in your data table. 4. Empty the test tube into the waste container and wash with soap. Part 4 Testing for Lipids 1. Cut 6 squares from your paper bag about 3” x 3” in size. Label the pieces with the numbers
that correspond to the food items. 2. Use a dropper or spoon place a small amount of the food item into a piece of paper bag.
Spread it out with your finger to make a small circle- about 2” across. Remove any large chunks of food.
3. Wait for the circle to dry. Use fan if necessary. 4. Look at the paper against a light source. There are lipids present if a lot of light can pass
through the paper. If little or no light can pass through then there is little or no lipids present. Record results in your data table.
5. Throw the paper bag pieces away.
Data Food Carbohydrates
starch Carbohydrate
sugar Protein Lipids
Potato (1)
Egg White (2)
Fruit juice (3)
Milk (4)
Oil (5)
Water (6)
Mark the
boxes with
a + if you
had a
positive
result or a –
if you had a
negative
result.

Ag Biology 58
Conclusion Questions 1. Which foods come from plants?
2. What biomolecule is most common in the foods that come from plants?
3. Which foods come from animals?
4. What biomolecule is most common in the foods that come from animals?
5. Does water contain any of the macromolecules that you tested for?
6. Explain why water was tested.
7. Which foods are high in proteins?
8. Which foods are high in lipids?
9. Which foods are high in carbohydrates?
10. What is a macromolecule?
11. Give examples of macromolecules from this lab.
12. Most macromolecules are made from chains of much simpler molecules (subunits). Name the subunits that link up to form the following macromolecules:
Carbohydrate
Nucleic Acids
Proteins
Lipids

Ag Biology 59
Floaters vs. Sinkers- Observing Photosynthesis Purpose To observe photosynthesis in action.
Problem What happens in the photosynthetic process when the light is changed?
Materials • Sodium bicarbonate NaHCO3 (Baking
soda) • Liquid Soap • Plastic syringe (10 cc or larger) • Leaf material
• Hole punch • Plastic cups or extra beakers • Timer • Light source • Ruler
Procedure 1. Prepare 300 ml of bicarbonate solution by mixing 2 grams of
baking soda into 300 ml of water. (The bicarbonate adds the CO2 for photosynthesis)
2. Add 1 drop of liquid soap to this solution. (The soap wets the hydrophobic (water proof) surface of the leaf allowing the bicarbonate solution to be drawn into the leaf.)
3. Stir to mix. 4. Cut 10 or more uniform leaf disks with a hole punch. Avoid
cutting major veins of the plant leaf. 5. Remove the piston of the syringe. 6. Place leaf discs in barrel. (Figure 1) 7. Replace piston being careful not to crush the leaf disks.
(Figure 2) 8. Push on the plunger until only a small volume of air remains
in the barrel. (<10%) 9. Pull a small volume of sodium bicarbonate solution into
the syringe. 10. Tap the syringe to suspend the leaf discs in
the solution. Hold finger over the syringe-opening, draw back on the plunger to create a vacuum. (Figure 3)
11. Swirl the disks in the solution. 12. Let off the vacuum. 13. Repeat 2-3 times until all the discs sink when
you hold the syringe upright.
Figure 1
Figure 2
Figure 3

Ag Biology 60
14. Pour the disks and solution into an empty plastic cup or beaker. Add bicarbonate solution from your beaker to a depth of 3 cm.
15. Place under a light source and start the timer. (sunlight works best) 16. At the end of each minute, record the number of floating disks on the data table. 17. Swirl the disks to dislodge any that are stuck against the side of the cop. 18. Continue timing until all disks are floating. 19. Repeat procedure placing the cup in the dark. 20. Answer your Conclusion Questions.
Results
Light or Dark
Number of Disks
Floating
Time Elapsed
Light or Dark
Number of Disks Floating
Time Elapsed

Ag Biology 61
Conclusion Questions 1. Why was the soap necessary?
2. What did the baking soda provide to the plant?
3. Why do leaves float normally?
4. Why did the leaves sink after infiltrating them with sodium bicarbonate solution?
5. Why did the leaves float after being exposed to the light?
6. What happened when you put the leaves in the dark?

Ag Biology 62
Unit 3: Classification of Living Things

Ag Biology 63
Classification Notes

Ag Biology 64
Levels of Classification Pneumonic
Create a pneumonic to remember the levels of classification:
kingdom, phylum, class, order, family, genus, and species.

Ag Biology 65
5 Kingdoms Dichotomous Key
Create a dichotomous key that could be used to determine to which
kingdom a living thing belongs. See this site for an example:
http://www.ruf.rice.edu/~bioslabs/studies/invertebrates/kingdoms.html

Ag Biology 66
Name that Tree Purpose
When using classification, there needs to be a system of organization. One organizational system commonly used in the scientific community is the dichotomous key. A dichotomous key gives you a series of steps with a set of choices that are opposite or contrasting in nature. The choices are initially very general and become more specific as you proceed through the steps. By analyzing the physical characteristics or purposes of the object or organism in question and using the steps and choices given in the key, you can identify an object or organism based upon established traits.
Many plants have similar characteristics that make memorizing all species difficult. Dichotomous keys are an easy way to identify plant species that may be similar to another species. Let’s see if you can name trees you find outside in this activity using a dichotomous key.
Materials
Per pair of students:
What Tree is That online
5 tree specimens
5 small Ziploc bags
Procedure
You and your partner will use the link provided to identify five tree specimens you find outside. 1. Label your plastic bags with numbers 1-5.
2. Go outside and find a tree.
3. Use a digital camera to take a few pictures of that tree. Take a picture of the entire tree and then take a close up of the leaves, bark, and cones (if present).
4. Carefully observe the characteristics of the first specimen and take notes in Table 1.
5. Carefully take a sample of the leaves or needles and put them in the bag labeled with the correct specimen number. Make sure you get a sample that shows the leaf arrangement on the branch/ stem. Be careful not to do too much damage to the tree.
6. Use the dichotomous key in What Tree is That to identify the specimen.
7. Choose three identifying features, record them and the type of tree in Table 2.
8. Repeat Step 2 through Step 7 for each specimen.

Ag Biology 67
Table 1 Tree Identification Notes
Specimen #
Observations
1
2
3
4
5
Table 2 Tree Identification
Specimen #
Feature 1 Feature 2 Feature 3 Common and Scientific Tree
Name 1
2
3
4
5
Conclusion
1. Based on what you have learned, what other applications could you use a dichotomous key for?
2. Why is observing the characteristics of an object an important first step to determine the identity of the object?

Ag Biology 68
Classification Poster- Animal Kingdom Step 1– Choose a specific organism in the Animal Kingdom: ____________________________ (ex: “Common Squirrel Monkey” instead of just “Monkey”) Step 2– Research the taxonomy of this organism. Use the internet to find the following groupings to which this organism belongs:
Kingdom
Phylum
Class
Order
Family
Genus
Species
Step 3 –Create a poster for your species.
Poster requirements
Title must be highly visible and include common and scientific name
Must include at least 2 pictures
Must include each of the organism’s levels of classification (from above chart)
Must be neat and attractive
Include three unique/interesting fact about the species that you chose.
See rubric for grading criteria.
Put your name on the bottom right corner.

Ag Biology 69
Classification Poster Rubric Element
Good Okay Poor
Mechanics
None to one spelling and/or grammatical errors.
Two to three spelling and/or grammatical errors.
More than three spelling and/or grammatical errors.
Title
Common name and scientific name of organism are highly visible on poster.
Common name and scientific name of organism are present, but not highly visible on poster.
Common name is present in the title, but not the scientific name.
Pictures Two or more pictures of the organism are included on poster.
Poster includes one picture of the organism on the poster.
No pictures of organism are included on poster.
Presentation Pictures and text have been attractively laid out on the poster.
Pictures and text have been cut and pasted onto the poster in a less than attractive way. Poster is unorganized.
Pictures and text have been cut out and pasted onto the poster very messily without any proper care.
Scientific Name
Scientific name is printed in the indicated manner: all in italics with first letter of Genus capitalized and species completely lowercase.
Scientific name is in italics or meets proper capitalization/lowercase specifications (not both)
Scientific name does not meet any of the italics/capitalization guidelines.
Organism taxonomy
All seven levels of classification are represented in the poster.
Poster is missing 1-2 levels of the organism’s classification.
Poster is missing more than 2 levels of the organism’s classification.
Student name
Student name is printed clearly in the bottom right corner of project.
Student name is missing from project.
Interesting Facts
Three interesting facts were included on the poster.
Two interesting facts were included on the poster.
One or no interesting fact was included on the poster.

Ag Biology 70
Unit 4: Animal Kingdom

Ag Biology 71
Animal Tissue Notes

Ag Biology 72
Just Winging It
Purpose
Animal tissues are comprised of specialized cells to provide structure and function for each type of tissue. Common animal tissues are connective, epithelial, fluid, muscle, and nervous. Each type of tissue has a specific purpose for the physical movement and physiological functioning of animals.
These tissues are found throughout the body of animals. In areas of joints between bones, several of these tissues are commonly found. An example of this is a chicken wing. The edible portions of a cooked chicken wing are the skin (epithelial layer) and muscle. The tough, annoying parts found are the ligaments, cartilage, tendons, and bone. Can you tell the differences in tissue by dissecting a chicken wing?
Materials
Per pair of students:
Dissection instrument kit
Dissection tray
Raw chicken wing
Beef heart sample
Compound microscope
Dissecting microscope
2 microscope slides
2 cover slips
Dropper
Paper towel
Methylene blue stain
Per student:
Dispoable gloves
Lab apron
Pencil
Agriscience Notebook
Procedure
You and a partner will dissect a chicken wing and examine different tissues that make up the internal structure of the wing. Once the various tissues have been identified, you will prepare slides of muscle tissue from the wing and a sample of beef heart to compare differences between the types of muscle tissue.
Part One – Remove the Skin
1. Use the scissors from the dissection kit to cut the skin and remove it from the entire chicken wing. Once the skin is removed, set it aside.

Ag Biology 73
2. Pin the thick end of the wing down with your hand and move the tip of the wing flexing the wing joints. Observe the motion of the tissues as they function.
3. Examine the surface of the skinless muscle (i.e., the pale pink tissue) under the dissecting microscope and answer the questions in Table 1.
Leave the chicken wing in the dissection tray, simply slide the wing to the edge of the tray and place the tray in the viewing area of the microscope.
Table 1 Observations
Poke the muscle tissue with your scalpel. How easy does it cut compared to the skin?
From your observation in the previous question, what can you conclude about the function of
the skin?
What type of tissue comprises the skin of chicken wings?
List the colors of the different tissues observed in the skinless wing:
What types of connective tissue can you see when you flex the wing joints?
Part Two – Remove the Muscle
1. Cut away only the muscle tissue from the bone being careful to leave the white, rubbery tissue in place where possible, and try to prevent the joints from separating.

Ag Biology 74
2. Set the muscle tissue aside for Part Three.
3. Examine the connective tissue, which includes tendons, ligaments, bones, and cartilage under the dissecting microscope and record your observations in Table 2.
Table 2 Subcutaneous Observations
Connective Tissue
Location of Tissue Description of Tissue Function of Tissue
Bone
Cartilage
Ligament
Tendon
Part Three – Compare Muscle Tissue
In Part Three, you will prepare microscope slides to observe characteristics of skeletal and cardiac muscle tissue.
1. Using the muscle tissue that you removed from the chicken wing, slice a very thin sample of tissue using the scalpel, and transfer it to a glass slide. Make sure the tissue is not clumped on the slide.
2. Use a dropper to add a drop of water to the tissue.
3. Add a coverslip and blot excess water touching a paper towel to the underside of the slide.
4. If the fibers are difficult to see, remove the coverslip and add a drop of methylene blue stain. Replace the coverslip and blot excess dye with a paper towel.
5. Record observations in Figure 1.

Ag Biology 75
Figure 1.
6. Repeat Steps 1-3 of Part Three using the heart tissue provided by your teacher. Record observations for cardiac tissue in Figure 2.
Figure 2.
7. Clean up the laboratory and equipment according to your teacher’s instructions. Make sure that all tissue is placed in the designated waste container.
Ag Biology 76
Conclusion
1. What are the similarities among tendon, cartilage, and ligament tissue?
2. Explain how muscles and connective tissues interact to provide movement to animal limbs.
3. Describe the differences in structure between cardiac and skeletal muscle tissues.
4. Cardiac, striated (skeletal), and smooth muscles are the basic types of muscle tissue found in animals. Provide one example of where each muscle type is found in an animal and list its specific function.

Ag Biology 77
Heart Dissection
Conclusion Questions
1. What are the largest chambers of the heart?
2. What chambers are at the top of the heart?
3. Which have thicker walls, atria or ventricles?
4. Which ventricle, left or right, has thicker walls?
5. Which ventricle pumps blood to the body?
6. Which ventricle pumps blood to the lungs?
7. Identify the parts labeled A through D on the diagrams below.
A. ___________________________ C. _______________________________
B. ___________________________ D. _______________________________
8. Which side of the heart has blood high in oxygen?
9. Which side of the heart has blood low in oxygen?
10. From what body organ does the blood get oxygen?
11. Blood is kept moving in only one direction by:
12. The largest artery in the body is called the:
Ag Biology 78
Livestock Anatomy
Purpose
While you were taking care of a friend’s horse, you noticed that the animal came up limping. The local veterinarian is called to the scene and tells you it is only a cut on the hock of an animal, and you need to keep the cut clean and give the horse a shot of antibiotics in the croup. Great news, but do you have any idea as to where the hock and the croup are?
Knowing the proper terminology for external animal anatomy is important for communication. Most parts on animals have similar names among species; however, there are names of some parts that are specific for a species of animal. Being able to identify and communicate using proper terminology is important for health care, management, and selection.
Materials
Per student:
Modern Livestock and Poultry Production textbook
Computer station with Internet access
Pencil
Procedure
Review the diagrams from the textbook related to external animal parts. Complete the tables in Part One and Part Two identifying common parts among animal species and distinguishing parts that are species specific, such as the comb of a chicken.
Obtain diagrams from your teacher or review the following pages from Modern Livestock and Poultry Production textbook to help you complete the tables:
Beef Cattle Anatomy – Page 269
Swine Anatomy – Page 401
Sheep Anatomy – Page 508
Horse Anatomy – Page 590
Chicken Anatomy – Page 668
Dairy Cattle Anatomy – Page 746

Ag Biology 79
Part One – Common Parts Shared Among Animal Species
In Table 1, a list of external parts that are commonly found among most animal species is provided. For each external part, identify the part on the diagram of the animal species found on the textbook pages listed above. Provide a brief description of where the part is located on the animal and what purpose it serves the animal. To determine the purpose of the external part, you will need to research the part using the Internet or classroom animal reference textbooks.
Table 1 Common Parts Found on Animals
External Part Location Purpose
Dew Claw
Fetlock
Flank
Hock
Hoof
Loin
Muzzle
Pastern
Poll
Sheath
Tail
Part Two – Species-Specific Animal Parts
Complete Table 2 by comparing animal diagrams found in the textbook and determine two parts that are unique to each species of animal listed in Table 2. Provide information about the location of the part and the purpose it serves the animal.

Ag Biology 80
Table 2 Species Specific Parts
Species Unique Part Location Purpose
Beef/Sheep
Chicken
Dairy Cow
Horse
Swine
Conclusion
1. Explain how the hock and the knee of quadruped animals are similar.
2. Explain how knowledge of external anatomy is helpful for animal production.
3. In some dairy cattle operations, the the tail of a cow is partially removed to prevent contamination of milk during the milking process. What is the purpose of the tail and how may removing the tail of a cow be detrimental?
4. List five external parts found on animals that are also found on humans.

Ag Biology 81
Unit 5: Plant Kingdom

Ag Biology 82
Plant Tissues Notes

Ag Biology 83
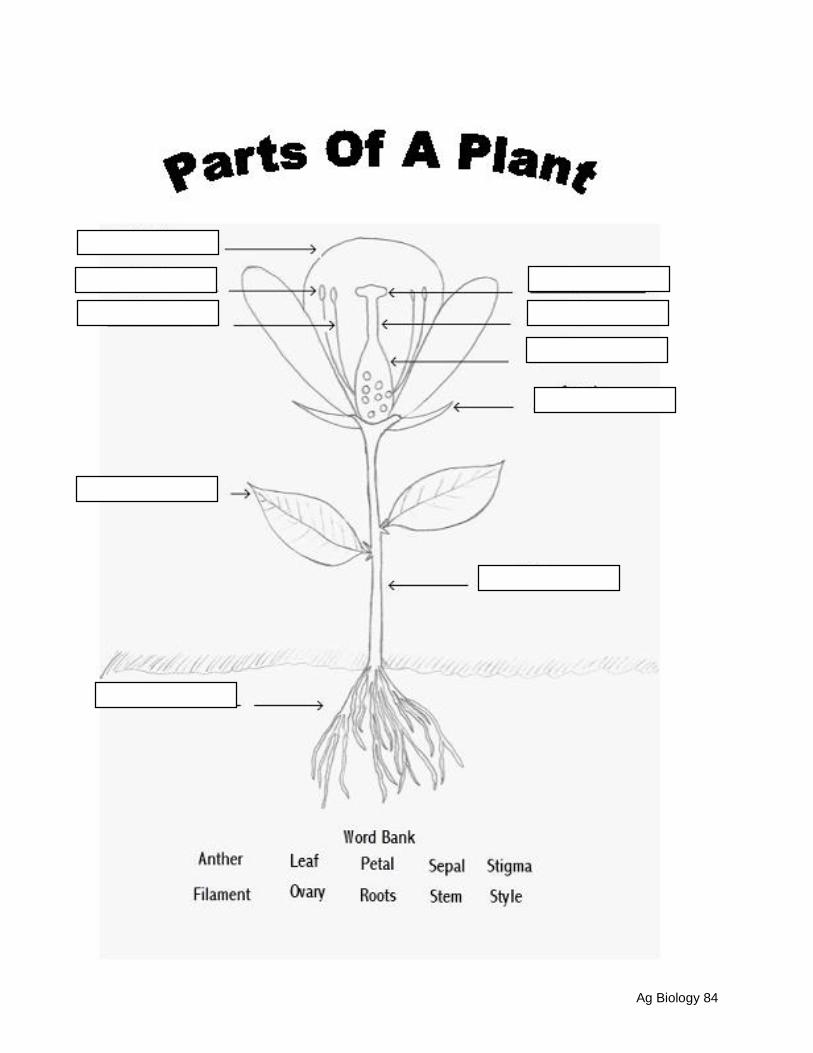
Plant Anatomy Storybook
Purpose:
What was your favorite story as a child? Did it teach you something that you still use today?
Maybe it was about how to be a good friend or just made you laugh. Chances are you still
remember your favorite childhood story because stories make sense to children and help them
remember.
You have been learning about the four main parts of a plant- roots, stem, leaves, and flower. In
this assignment, you’ll learn some more specific parts of the plant and their functions. In order
to help you understand the parts of the plant better, you will create a children’s story book.
Procedure:
1. Research the purpose of the parts of the plant listed below.
2. Fill in the diagram with the proper names for the parts of a plant.
3. Use your research and diagram to create an outline for a children’s story.
4. Use markers, colored pencils, and paper to create your children’s book. Use the stapler
to bind one edge of the book. Be creative!
Research:
Plant Part Function
Petal
Anther
Filament
Stigma
Style
Ovary
Sepal
Leaf
Stem
Roots
Ag Biology 84

Ag Biology 85
Story Book Rubric:
Element Good Okay Poor
Parts of the plant
All parts of the plant are included in the story
Story is missing one or more plant part.
More than half the plant parts are missing from the story.
Accuracy Plant parts are accurately used or identified in the story.
More than two plant parts are used or identified inaccurately in the story.
More than half of the plant parts are used or identified inaccurately in the story.
Creativity Story is engaging and interesting. Lots of creativity is used.
Story is moderately interesting and some evidence of creativity is present.
Story is boring and loses readers attention quickly. Little evidence of creative though is present.
Design Text and pictures neat, easy to read, and not drawn in pencil. No spelling or grammar errors are present.
Most of the text and pictures are neat and easy to read. Some drawing or writing is done in pencil. Some spelling and grammar errors are present.
Text and pictures are sloppy and most of the writing is in pencil. Many spelling or grammar errors are present.

Ag Biology 86
Plant Processes
Photosynthesis:
Respiration:
Cell division:
Transpiration:
Translocation:
Osmosis in roots:

Ag Biology 87
Flower Eggs
Purpose
Do flowers produce eggs? This activity will allow you to dissect and identify the parts of a flower to help you understand how a plant carries out the sexual reproduction process. Some parts of the flower are too small to see detail regarding their anatomical characteristics with the naked eye. Therefore, in cases of small parts you will use a dissecting microscope to examine and record observations.
Materials
Per student:
Dissection kit
Colored pencils
White construction paper
Dissecting microscope
Petri dishes
Complete flower specimen
Glue stick
Adhesive tape
Permanent marker
Pencil
Procedure
After sketching the external parts of the flower, you will dissect the flower to examine internal parts.
Part One – External Flower Parts
1. Use colored pencils and sketch the external parts of a complete flower. Label the sketch to ensure that all parts are represented.
Anther
Filament
Flower Cup
Ovary
Ovule
Petal
Pistil
Sepal
Stamen
Stigma
Style
Part Two – Dissecting the Flower
1. Use a fresh flower provided by your teacher to locate and remove each of the parts listed below. Be careful not to destroy any parts, as you will need all of the parts in order to complete the requirements for this activity.
Sepal
Petal
Flower cup
Stamen
Pistil
2. Carefully slice the pistil in half-lengthwise to expose the style, ovary, and ovules.

Ag Biology 88
3. In Table 1, record the quantity of each part as you remove it from the flower.
4. Examine the parts listed in Table 2 under the dissecting microscope and record observations for the appropriate part. Place flower parts in the bottom of a Petri dish for examination under the dissection microscope.
5. Glue or tape each flower part to a piece of white construction paper. Group like parts together (stigma or pistil) and place the parts in a logical sequence as they were before the dissection.
6. Label each part or groups of parts using the following list of names:
Anther
Filament
Flower Cup
Ovary
Ovule
Petal
Pistil
Sepal
Stamen
Stigma
Style
7. Clean up the laboratory and equipment according to your teacher’s instructions.
External Flower Parts Illustrated
Table 1. Flower Parts
Flower Part Number Located Sepal
Petal
Flower cup
Stamen
Filament
Anther
Stigma
Style
Ovary
Ovule

Ag Biology 89
Table 2. Observation of Internal Structure
Flower Part Description of Observation
Stamen
Pollen
Stigma
Ovary
Ovule

Ag Biology 90
Conclusion
1. Explain how anthers are arranged on the flower. Why do you suspect this arrangement is beneficial to flower function?
2. From your observations of the arrangement of the internal structures of the pistil, explain how the pistil functions during plant reproduction.
3. How do sepals and petals differ in terms of anatomical features and function?

Ag Biology 91
Unit 6: Genetics and Heredity

Ag Biology 92
DNA Notes

Ag Biology 93
Strawberry Smoothies DNA Extraction Experiment Introduction
DNA (Deoxyribonucleic acid) is found in the cells from Animals and Plants. DNA is a double
stranded macromolecule composed of nucleotide bases pairing Adenine with Thymine and
Guanine with Cytosine. DNA can be extracted from cells by a simple technique with household
chemicals, enabling you to see strands of DNA with the naked eye. Cold alcohol is used because
alcohol causes the DNA to precipitate or come together so it can be seen.
Safety Precautions
Wear safety goggles. Do not eat your strawberry smoothie, denatured ethanol is poisonous.
Materials (per student group):
1 Zip-lock baggie
1 strawberry
Coffee filter
2 beakers
Glass stir rod
Rubber band
Salt
Dish detergent
Distilled water
Rubbing alcohol
Procedure:
1. Combine with three other groups and create DNA extraction buffer solution by mixing
10 ml dish detergent, 12 grams of salt, and 120 ml distilled water with a glass rod in a
beaker. (there should be 6 students sharing one beaker of extraction buffer solution)
2. Obtain one strawberry.
3. Pull off any green leaves from the strawberry.
4. Place the strawberry in a zip-lock baggie.
5. Smash strawberry for two minutes. This breaks open the cells and releases the DNA.
6. Add 10 ml of extraction buffer to the bag. This further breaks open the cells so they fully
release the DNA.
7. Gently mush again for one minute. Try not to make too many soap bubbles.
8. Place coffee filter inside second beaker.
9. Filter strawberry mush through coffee filter into beaker. Twist the filter and squeeze as
much liquid as possible into the beaker.
10. Dispose of excess strawberry mush and coffee filter.
11. SLOWLY pour ice-cold alcohol into the beaker to double the amount of liquid.
12. You will see the DNA precipitate out of solution and float to the top. Spool the DNA on
your glass rod by gently swirling the glass rod near the surface of the liquid.

Ag Biology 94
Conclusion Questions
1. Describe and draw a picture of your final product in the space below
2. Where is DNA found in the cell?
3. Discuss the action of the soap on the cell. What was the purpose of the soap in the
buffer?
4. Why was cold alcohol added to the strawberry buffer mixture?
5. Draw a diagram of DNA containing 5 sets of nucleotide bases labeling the hydrogen
bonds between the bases.

Ag Biology 95
DNA Structure and Replication Lab
Materials:
4 different colors of mini-marshmallows
2 Twizzlers
16 Toothpicks
Colored Pencils to match marshmallows
Procedure:
Part 1- Structure 1. Select your 4 colored Marshmallows. Choose which marshmallow will represent each
nitrogen base. Draw a Key below:
2. Assemble your DNA strand. Your strand should have 8 pairs of nitrogen bases (16 marshmallows total).
3. Write out your strand of DNA’s genetic code below:
4. Draw a picture of your strand of DNA labeling the nitrogen bases.
Part 2- Replication:
1. “Unzip” part of your DNA (leave it partially zipped!)
2. Add extra marshmallows to show the beginnings of replication.

Ag Biology 96
3. Draw a picture of your partially replicated DNA strand.
4. Answer the questions below while enjoying a sweet genetic snack!
Conclusion:
1. What is DNA made out of?
2. What are the pairs of nitrogen bases that always go together?
3. How does DNA replicate?
4. Why is DNA important to living things?

Ag Biology 97
Protein Synthesis Notes

Ag Biology 98
Protein Synthesis Background 1. Define the following terms:
a. Replication-
b. Transcription-
c. Translation-
2. Break the following DNA sequence into triplets. (Draw a line to separate triplets)
C C G A T A C G C G G T A T C C C A G G G C T A A T T T A A
3. If the above code showed the bases on one strand of DNA, what would the complementary
strand read after it was translated?
4. What would the code in problem #2 be transcribed into (What would the mRNA sequence
be?)
5. How many codons are there in the above problem?
6. What is the three letter sequence on a tRNA molecule called?
7. How many different amino acids are there that make up all of the proteins in our body?
8. How many different codons are there?

Ag Biology 99
9. Complete the table below. Use the following DNA sequence.
C G G C T A T T C G A C C C T T A C G G T A T T G G G
DNA Triplets mRNA codon tRNA anticodon
CGG GCC CGG
10. What would the amino acid sequence be translated from
the mRNA sequence in problem #4? (Use the Genetic Code
table to the right to translate)
Ag Biology 100
Protein Synthesis Practice
DNA strand # ______
1. Transcription occurs in the nucleus. Three nucleotides make up a
codon. Separate your DNA strand into codons using a dry-erase
marker.
2. Transcribe the DNA strand into an mRNA strand using base pairing
rules:
T→A A→T C→G G→C
mRNA codons
______________________________________________________________
3. mRNA leaves the nucleus and enters the cytoplasm
4. In translation, the starting end of the mRNA strand attaches to a
ribosome. tRNA anticodon molecules each carry an amino acid. The
tRNA anti-codon pairs with the mRNA codon placing an amino acid in a
strategic order.
5. Translate the mRNA codons using the base pairing rules:
T→A A→U C→G G→C
tRNA anti-codons
6. Amino Acids stack together to make a protein.
7. Find the tRNA anti-codon card and flip it over to reveal a protein
(word). Write the word in order to form a sentence. Your tRNA strand
should start with a Start codon and end with a Stop codon.

Ag Biology 101
DNA Electrophoresis
Objective:
In this virtual lab, you will identify the resources and process of Gel Electrophoresis.
Introduction:
1. What is Gel Electrophoresis used for?
2. Using the picture to the left,
describe how DNA moves through a
gel.
Procedure:
Step One: Make the Gel & Step Two: Step up the Gel Apparatus
3. What is buffer and what is it used for?
4. What is the purpose of the “comb?”
Step Three: Load the DNA sample into the Gel
5. Label the following on your bench. Your Pipette tips (F) has already been done for you.
A ______________________________ C ______________________________
B ______________________________ D ______________________________
E ____________________________________________________

Ag Biology 102
6. What are the two major functions of “Loading Buffer?”
1. ________________________________________________________________________
2. _________________________________________________________________________
7. What is the function of the DNA Standard (also called the “Ladder”?)
Step Four: Hook up the Electrical Current and Run the Gel
8. Since DNA has a negative charge, in which direction will it go in the gel?
9. If there are bubbles, what does this mean?
Step Five: Stain the Gel and Analyze the Results
10. What is ethidium bromide? Why can it be dangerous?
11. Read the following gel to the left. Put in the
estimated base pair lengths to the left in the boxes.
12. Which fragments went the farthest through
the gel, large pieces of DNA (6000 bp) or smaller
pieces of DNA (1000 bp)?

Ag Biology 103
Conclusion Questions
1. Gel Electrophoresis is used often in forensics. Look
at the following gel to the left. From the evidence DNA,
which individual matches the DNA evidence left at the
crime scene?
2. When running a gel, you need to have a positive control and a negative control. What do
these mean and what are they each used for?
3. Name and discuss a source of error in performing and evaluating gel electrophoresis.

Ag Biology 104
Cloning Notes

Ag Biology 105
Cloning Simulation
Go to http://learn.genetics.utah.edu/content/cloning/
Click “What is Cloning”
1. What is a clone?
Read about and play the animations for natural twinning and artificial
embryo twinning.
2. How are the two types of twinning different?
Read about and play the videos for somatic cell nuclear transfer.
3. What was the name of the animal that was the first mammal to be cloned from a
somatic cell?
Read about and play the animations for natural fertilization and SCNT
(somatic cell nuclear transfer).
4. How are the two processes similar?
5. Is cloning an organism the same as cloning a gene? Why or why not?
Go back to the main cloning page by clicking the cloning link at the top of
the page.

Ag Biology 106
Complete the Click and Clone activity.
6. What does the Nucleus contain? What role do its contents play in the cell?
7. What is the purpose of the Somatic Cell Donor?
8. What is a Somatic Cell?
9. What is the purpose of the Egg Cell Donor?
10. What is the major difference between a somatic cell and an egg cell?
11. What is the purpose of the Surrogate Mother?
12. What color was the Mouse Pup? Why?
13. What gender (male or female) will the Mouse Pup be? Why?
14. How is this method of cloning different from artificial embryo twinning?
Go back to the main cloning page by clicking the cloning link at the top of
the page.
Click on History of Cloning.
15. How long has cloning been around?
16. What was the first vertebrate animal that was cloned?

Ag Biology 107
17. What animal underwent the first successful nuclear transfer?
18. What mammal was first used in experiments on embryo transfer but was never actually
cloned?
19. What mammal underwent the first successful embryo transfer?
20. In what year was a cow first cloned?
21. Review 1996-2013- what are the two most important discoveries that occurred in this
time frame?
Go back to the main cloning page by clicking the cloning link at the top of
the page.
Click Is it Cloning or Not?
22. Play the game and record how many you got correct. _______________
Go back to the main cloning page by clicking the cloning link at the top of
the page.

Ag Biology 108
Click “Why Clone”
23. Choose one of the reasons given for cloning. Write five sentences supporting (arguing
for) or refuting (arguing against) the claim.
Go back to the main cloning page by clicking the cloning link at the top of
the page.
Click Cloning Myths
24. Read through the myths. Which ones did you believe before this lesson?

Ag Biology 109
Cell Division Notes
Mitosis:
Meiosis:
Mitosis Meiosis

Ag Biology 110
Genetics Notes

Ag Biology 111
Mouse Genetics Gizmo Vocabulary: allele, DNA, dominant allele, gene, genotype, heredity, heterozygous, homozygous,
hybrid, inheritance, phenotype, Punnett square, recessive allele, trait
Prior Knowledge Questions (Do these BEFORE using the Gizmo.)
1. The image shows a single litter of kittens. How are they
similar to one another? _________________________
____________________________________________
2. How do they differ from one another? ___________________________________________
3. What do you think their parents looked like? ______________________________________
_________________________________________________________________________
Gizmo Warm-up
Heredity is the passage of genetic information from parents to
offspring. The rules of inheritance were discovered in the 19th
century by Gregor Mendel. With the Mouse Genetics (One Trait)
Gizmo™, you will study how one trait, or feature, is inherited.
1. Drag two black mice into the Parent 1 and Parent 2 boxes. Click Breed several times. What do the offspring look like?
_________________________________________________
The appearance of each mouse is also called its phenotype.
2. Click Clear, and drag two white mice into the parent boxes. Click Breed several times. What
is the phenotype of the offspring now? __________________________________________
3. Do you think mouse offspring will always look like their parents? ______________________
Explain: __________________________________________________________________
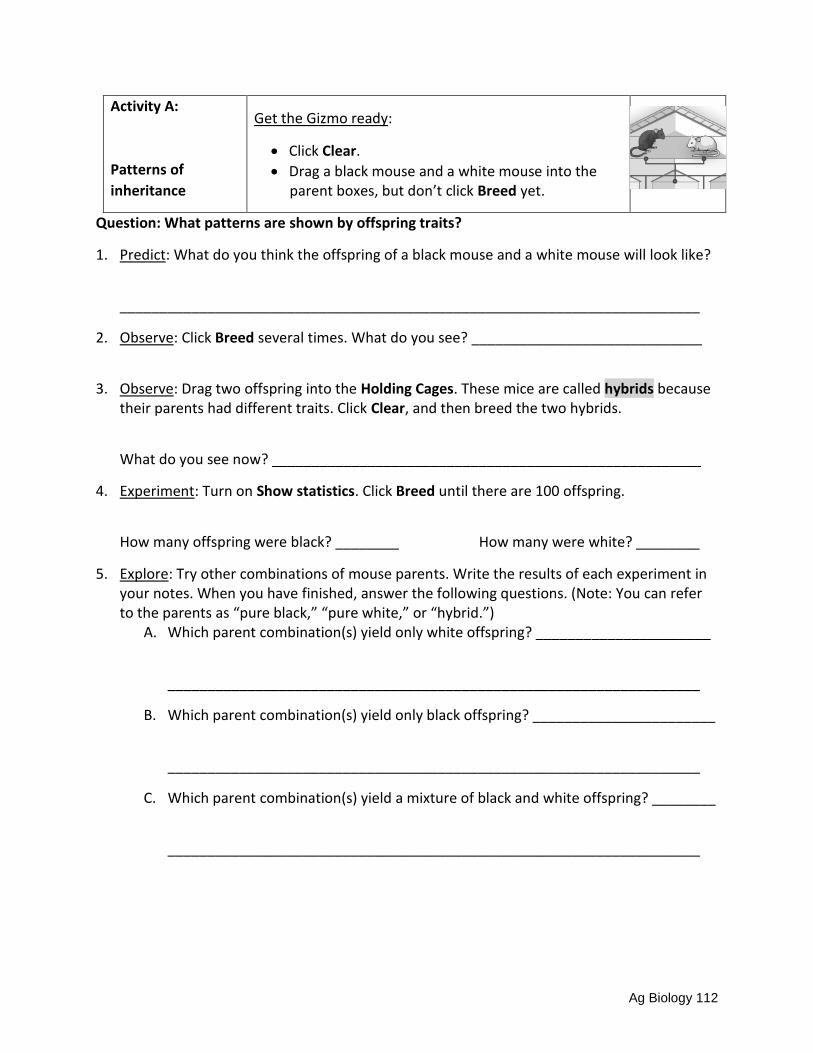
Ag Biology 112
Activity A:
Patterns of
inheritance
Get the Gizmo ready:
Click Clear.
Drag a black mouse and a white mouse into the parent boxes, but don’t click Breed yet.
Question: What patterns are shown by offspring traits?
1. Predict: What do you think the offspring of a black mouse and a white mouse will look like?
_________________________________________________________________________
2. Observe: Click Breed several times. What do you see? _____________________________
3. Observe: Drag two offspring into the Holding Cages. These mice are called hybrids because their parents had different traits. Click Clear, and then breed the two hybrids.
What do you see now? ______________________________________________________
4. Experiment: Turn on Show statistics. Click Breed until there are 100 offspring.
How many offspring were black? ________ How many were white? ________
5. Explore: Try other combinations of mouse parents. Write the results of each experiment in your notes. When you have finished, answer the following questions. (Note: You can refer to the parents as “pure black,” “pure white,” or “hybrid.”)
A. Which parent combination(s) yield only white offspring? ______________________
___________________________________________________________________
B. Which parent combination(s) yield only black offspring? _______________________
___________________________________________________________________
C. Which parent combination(s) yield a mixture of black and white offspring? ________
___________________________________________________________________

Ag Biology 113
Activity B:
Genetics basics
Get the Gizmo ready:
Click Clear.
Drag a black mouse and a white mouse into the parent boxes.
Introduction: Inherited traits are encoded on a molecule called DNA (deoxyribonucleic acid).
Genes are segments of DNA that control a particular trait. Most genes have several different
versions, or alleles. The genotype is the allele combination an organism has.
Question: How do alleles determine fur color?
1. Observe: Turn on Show genotype. Move your cursor over a mouse to see its genotype.
A. What is the genotype of the black parent? _______ White parent? _______ These mice are homozygous for fur color, meaning both alleles are the same.
B. Click Breed. What is the genotype of the offspring mice? _______ These mice are heterozygous for fur color, meaning the alleles are different.
2. Analyze: Dominant alleles are always expressed when present. Recessive alleles are not expressed when the dominant allele is also present. Look at the two alleles for fur color.
A. Which allele is dominant, and which fur color does it produce? _________________
B. Which allele is recessive, and which fur color does it produce? _________________
3. Predict: Place two of the Ff offspring into the Holding Cages. Click Clear, and then place them into the parent boxes.
A. Which allele(s) could the offspring inherit from parent 1? ______________________ B. Which allele(s) could the offspring inherit from parent 2? ______________________ C. What are the possible genotypes of the offspring? ___________________________
___________________________________________________________________
4. Experiment: Click Breed several times, and look at the genotypes of the offspring. Did you find all the predicted genotypes? Explain. _________________________________________________________________________
_________________________________________________________________________
_________________________________________________________________________

Ag Biology 114
Activity C:
Modeling
inheritance
Get the Gizmo ready:
Click Clear.
Drag a black mouse and a white mouse into the parent boxes.
Question: How do scientists predict the genotypes of offspring?
1. Model: Scientists use a Punnett square to model the different possible offspring genotypes from a parent pair. The parent genotypes are written across the top and side of the square, as shown. The four possible offspring genotypes are then filled in.
The first square is filled in for you. Fill in the remaining squares.
What are the genotypes of the offspring? __________________________________
A. What percentage of the offspring will have black fur? _________________________ B. What percentage of the offspring will have white fur? _________________________
2. Experiment: Click Breed several times. Were your predictions correct? ________________ 3. Model: Use the Punnett squares below to model each parent combination. After filling in
each Punnett square, predict the percentages of black and white offspring.
Parent 1: Heterozygous black (Ff)
Parent 2: Heterozygous black (Ff)
Predicted % black offspring: ______
Predicted % white offspring: ______
Parent 1: Heterozygous black (Ff)
Parent 2: Homozygous white (ff)
Predicted % black offspring: ______
Predicted % white offspring: ______

Ag Biology 115
4. Experiment: Turn on Show statistics and Show as approximate percentage. For each combination, breed approximately 500 offspring. Record the results in the table below.
(Hint: To obtain an Ff mouse, breed an FF mouse to an ff mouse. Place two Ff offspring into
the holding cages, click Clear, and then drag the Ff mice into the parent boxes.)
Parent 1 Genotype Parent 2 Genotype % Black offspring % White offspring
Ff Ff
Ff ff
5. Draw conclusions: How well did the Punnett squares predict the offspring percentages for
each parent pair? ___________________________________________________________
_________________________________________________________________________
6. Summarize: In your own words, describe what heredity is and how it works in mice. ________________________________________________________________________
_________________________________________________________________________
_________________________________________________________________________
_________________________________________________________________________
_________________________________________________________________________
_________________________________________________________________________
_________________________________________________________________________
7. Think and discuss: Do you think most traits are inherited the way mouse fur color is? _____
Why do you think this is? _____________________________________________________
_________________________________________________________________________
_________________________________________________________________________
_________________________________________________________________________
_________________________________________________________________________

Ag Biology 116
Odd Couples
Purpose
The principles of dominant and recessive genes sound pretty straightforward. However, because of genetic variations among species there are exceptions to the law of dominance.
In some animals, both characteristics of a heterozygous genotype are expressed. This results in each trait being partially expressed in the phenotype. In a trait such as color, an even mixture of two hair colors produces a color pattern referred to as roan. The expression of both traits for a gene is called codominance.
A second variation within dominance is incomplete dominance. Incomplete dominance occurs when the phenotype of offspring is in between that of the parents. The best example is in plants where red flowers crossed with white flowers produce pink flowers. The phenotype is a blend as neither allele is completely dominant.
In other animals, sex-linked traits are common. For example in felines, the calico pattern of orange, black, and white patches of the hair coat is found only in female cats. In chickens, the feather characteristic known as barred will be expressed in male offspring and present, but not expressed in female offspring.
This activity will examine crossbreeding situations involving codominance, incomplete dominance, and sex-linked pairings.
Materials
20 dry red beans
20 dry white beans
16-ounce plastic cup
Procedure
Part One – Codominance in Shorthorns
Shorthorn cattle come in three colors, red, white, or roan. This is because they express codominance in heterogeneous crosses. In Part One, you and your partner will be testing predictions for two heterogeneous crosses to determine the percentage of offspring that will be red, white, or roan.

Ag Biology 117
1. Use a Punnett Square and make a prediction for a cross between two roan parents. Because neither color is dominant or recessive, the gametes are represented by “RW”.
2. Place 20 red beans and 20 white beans in the plastic cup. These will represent gametes for twenty crosses of the pairing made in Step 1.
3. Shake up the beans and pull out two beans at a time. Your partner will record the pairings in Table 2. For a pairing of two red beans you will place a mark in the red column, for a white pairing mark in the white column, and one red and one white bean pairing will be marked in the roan column.
4. Continue pulling pairs of beans out of the cup until you have removed all of the beans.
5. Because statistical predictions are more accurate with several repetitions of an experiment, repeat Steps 2-4 four more times so you have completed 100 pairings.
Table 2 Shorthorn Cross Trial Data
Trial Red Pairings White Pairings Roan Pairings
1
2
3
4
5
Total of All
Trials
Percentage
6. Compare your results for Table 2 with your prediction in Table 1.
7. Report your trial results to you teacher. Your teacher will assist the class with determining a classroom average. By including everyone’s data points, statistical error may be further eliminated.
Table 1 Prediction
Hair Coat Color Prediction (Percentage)
Red
White
Roan
R W
R
W

Ag Biology 118
Conclusion
8. How can you improve your prediction using the Punnett Square method?
9. Did your results in Table 2 match the prediction in Table 1? Why or why not?
10. Determine your prediction for a shorthorn cross between a red male and a roan female.
Prediction
Hair Coat Color Prediction (Percentage) Red
White
Roan

Ag Biology 119
Di-hybrid Crosses
Directions: Complete this lab in your assigned groups of 2. Use two pennies (or Rock, Paper,
Scissors) to determine the genotype and phenotype of your goat.
In this lab, you will be determining traits that are affected by epistasis. Epistasis is the condition
in which one gene affects the expression of another gene.
In the first, example, you will be examining the impact of epistasis on the horns of goats.
Determine your goat’s genotype for two sets of genes. Then record the phenotype created by
the genotype. Lastly, pair your goat with another from a different group and indicate what
possible phenotypes could exist for your offspring.
1. Horns: no horns (polled) is dominant to horns
Coin 1: Heads Tails Coin 2: Heads Tails
Genotype: PP Pp pp Phenotype:
2. Straight/Curled Horns: straight horns are dominant to curled horns.
Coin 1: Heads Tails Coin 2: Heads Tails
Genotype: HH Hh hh Phenotype:
3. What is the overall phenotype of your goat?
Keep in mind that if your goat is polled, it won’t have either curly or straight horns!
4. Draw your goat below.
5. Find another goat to mate yours with.
What is the mate’s genotype?
6. What is the mate’s phenotype?
7. Draw the mate

Ag Biology 120
8. Using the genotype of your goat and its mate, complete the dihybrid Punnett square.
Remember to split up your genes so that only one allele for each set is above each row.
For example, the genotype AaBb would be written as AB Ab aB ab
9. Complete the blanks below:
How many goats have no horns? /16
How many goats have straight horns? /16
How many goats have curled horns? /16
10. What genotypes would code for no horns? There are six. Record them all below:
11. What genotypes would code for straight horns? There are 2 possible combinations:
12. What genotypes would code for curly horns? There is only one possible combination:

Ag Biology 121
In the second example you will focus on color. Determine your goat’s genotype for two sets of
genes related to color. Then record the phenotype created by the genotype. Lastly, pair your
goat with another from a different group and indicate what possible phenotypes could exist for
your offspring. Keep in mind, this trait is affected by incomplete dominance (where the
dominant and the recessive trait blend). The second partner should complete this example.
1. Color: color is dominant to no color (albino)
Coin 1: Heads Tails Coin 2: Heads Tails
Genotype: DD Dd dd Phenotype:
2. Shade: dark shades are incompletely dominant to light shades. BB would be black; Bb
would be dark gray; bb would be light gray.
Coin 1: Heads Tails Coin 2: Heads Tails
Genotype: BB Bb bb Phenotype:
3. What is the overall phenotype of your goat?
Keep in mind that if your goat is albino, it won’t have any color!
4. Draw your goat below.
5. Find another goat to mate yours with.
What is the mate’s genotype?
6. What is the mate’s phenotype?
7. Draw the mate

Ag Biology 122
Using the genotype of your goat and its mate, complete the dihybrid Punnett square below.
Remember to split up your genes so that only one allele for each set is above each row.
For example, the genotype AaBb would be written as AB Ab aB ab
8. Complete the blanks below:
How many goats are albino? /16
How many goats have black hair? /16
How many goats have dark gray hair? /16
How many goats have light gray hair? /16
9. Could two albino goats have a baby with colored hair? Explain:
_ _

Ag Biology 123
In the final example you will focus on a co-dominant trait (traits in which two different alleles
are both equally dominant). Both bleating and grunting are dominant traits in these goats.
Mute goats are recessive.
1. Sound: noisy genes are dominant to no noise (mute)
Coin 1: Heads Tails Coin 2: Heads Tails
Genotype: NN Nn nn Phenotype:
2. Noise: bleats and grunts are codominant. .
Coin 1: Heads Tails Coin 2: Heads Tails
Genotype: BB BG GG Phenotype:
3. What is the overall phenotype of your goat?
Keep in mind that if your goat is mute, it won’t bleat or grunt! If it is heterozygous, it
could do both!
4. Find another goat to mate yours with.
What is the mate’s genotype?
5. What is the mate’s phenotype?
6. Describe your goat for all three traits (horns, coat, and noises) below:
_
_

Ag Biology 124
7. Using the genotype of your goat and its mate, complete the dihybrid Punnett square
below.
Remember to split up your genes so that only one allele for each set is above each row.
For example, the genotype AaBb would be written as AB Ab aB ab
Complete the blanks below:
8. How many goats are mute? /16
How many goats bleat? /16
How many goats grunt? /16
How many goats bleat and grunt? /16
9. Could two co-dominant grunting and bleating goats have a baby that is mute? Explain:
_
_

Ag Biology 125
Unit 7: Evolution and Natural Selection

Ag Biology 126
Evolution and Natural Selection Notes

Ag Biology 127
Natural Selection Gizmo Vocabulary: biological evolution, camouflage, Industrial Revolution, lichen, morph, natural
selection, peppered moth
Prior Knowledge Questions (Do these BEFORE using the Gizmo.)
The peppered moth (Biston betularia) is a common moth
found in Europe, Asia, and North America. It is commonly
found in two forms, or morphs: a dark morph and a light,
speckled morph. Birds are a frequent predator of the
peppered moth.
1. Which morph do you think would be easier to see on a
dark tree trunk? _______________________________
Which morph do you think would be easier to see on a
light tree trunk? _______________________________
Gizmo Warm-up
The Natural Selection Gizmo™ allows you to play the role of
a bird feeding on peppered moths. The initial population of
40 moths is scattered over 20 tree trunks. Click on moths to
capture them. Click the Next tree button to advance to the
next tree.
1. Check that LIGHT TREES is selected. Click Play ( ), and hunt moths for one year.
A. How many dark moths did you capture? _______
B. How many light moths did you capture? _______
C. Camouflage is coloring or patterns that help an organism to blend in with the
background. Which type of moth is better camouflaged on light bark? ____________
2. If a forest contained mostly light-colored trees, which type of moth would you expect to be
most common? ____________________________________________________________
How many moths can you find?

Ag Biology 128
Activity A:
Light trees
Get the Gizmo ready:
Click Reset ( ).
Check that the LIGHT TREES tab is selected.
Introduction: Before the 19th century in England, the air was very clean. The bark on trees was
usually light in color. Abundant lichens growing on tree trunks also lightened their appearance.
Question: How does the color of a peppered moth affect survival?
6. Predict: Over time, what will to happen to the populations of light and dark moths on light
trees? ____________________________________________________________________
7. Experiment: Click Play and hunt peppered moths on light tree trunks for five years. In each year, try to capture as many moths as you can.
After 5 years, select the TABLE tab and record the percentages of each moth type. (Note:
The table shows current populations of each moth, not the number of captured moths.)
Year Dark moths Light moths
0
1
2
3
4
5
8. Analyze: What do your results show? ___________________________________________
_________________________________________________________________________
9. Apply: Which type of moth do you think was more common before the 19th century, when
most trees were light in color? _________________________________________________
10. Extend your thinking: What strategies did you use to hunt for moths? __________________
_________________________________________________________________________

Ag Biology 129
Activity B:
Dark trees
Get the Gizmo ready:
Click Reset.
Select the DARK TREES tab.
Introduction: The 19th century was the time of the Industrial Revolution in England. Most of
the new industries used coal for energy, and the air was polluted with black soot. In forests
near factories, the soot coated trees and killed lichens. As a result, tree trunks became darker.
Question: How did air pollution affect moth populations?
1. Predict: Over time, what will to happen to the populations of light and dark moths on dark
trees? ____________________________________________________________________
2. Experiment: Click Play and hunt peppered moths on dark tree trunks for five years. In each year, try to capture as many moths as you can. When you are done, select the TABLE tab and record the percentages of each moth type.
Year Dark moths Light moths
0
1
2
3
4
5
3. Analyze: What do your results show? ___________________________________________
_________________________________________________________________________
4. Apply: Which type of moth do you think was more common during the 19th century? Why?
_________________________________________________________________________
_________________________________________________________________________

Ag Biology 130
5. Draw conclusions: Natural selection is the process by which favorable traits tend to increase in frequency over time. How does this experiment illustrate natural selection?
_________________________________________________________________________
_________________________________________________________________________
_________________________________________________________________________
_________________________________________________________________________
_________________________________________________________________________
6. Think and discuss: Did the changes you observed in the moth populations result from individual moths changing colors? Or did they occur because the best-hidden moths survived and reproduced, passing on their colors to their offspring? Explain your answer. _______________________________________________________________________
_________________________________________________________________________
_________________________________________________________________________
_________________________________________________________________________
_________________________________________________________________________
7. Extend your thinking: Biological evolution is the process by which populations of organisms change over time. How could natural selection lead to evolution? If possible, discuss your answer with your classmates and teacher. _________________________________________________________________________
_________________________________________________________________________
_________________________________________________________________________
_________________________________________________________________________
_________________________________________________________________________
_________________________________________________________________________
_________________________________________________________________________
_________________________________________________________________________
Ag Biology 131
The Problem with 99.99%
Purpose: If you look at the label on a container of hand sanitizer, you’ll see that it claims to
kill 99.99% of germs (bacteria). What about the .01% that’s not killed. Why are they different?
What happens to them once you kill all their “friends”? How does this relate to natural
selection and evolution?
Background: A population is a group of the same kind of organisms living together. In any
population, there is variation in traits among the organisms due to mutations or recombining
(crossing over) of genes from egg and sperm cells.
Even bacteria, which reproduce by asexual reproduction (splitting in half), can have offspring
that are not exactly the same due to mutations of the DNA or through exchanging DNA with
another bacterium. A mutation is a permanent change in the DNA sequence of a gene.
Some traits help an organism survive and some, like being left or right handed, have no effect
on survival. The environment determines which traits are favorable. Selective pressure is
something that changes the ability of an organism to survive in a particular environment. A
selective pressure can be something that is living or something that is not living.
Organisms with favorable traits survive. We call the favorable trait an adaptive advantage
because it helps the organism survive. Organisms with an adaptive advantage (favorable traits)
pass the genes for those traits on to their offspring. By this mechanism, over time, more and
more organisms in a population have the favorable traits. We say that the population has
evolved and that the organisms have adapted to the environment.
Materials:
1 paper cup containing 20 white
marshmallows (don’t eat them!)
1 paper cup containing 8 skittles of
any color (don’t eat them!)
1 toothpick
1 paper plate
1 stopwatch
Procedure:
1. Put eight marshmallows and two skittles on the plate in the middle of your group. The
marshmallows and skittles represent bacteria and the plate represents your hand. Most
of the bacteria are the same because of asexual reproduction. They have soft, white
shells and are cylindrical in shape. Two of the bacteria are not the same due to three
mutations in their DNA. They have colorful, have hard shells, and are disc shaped.
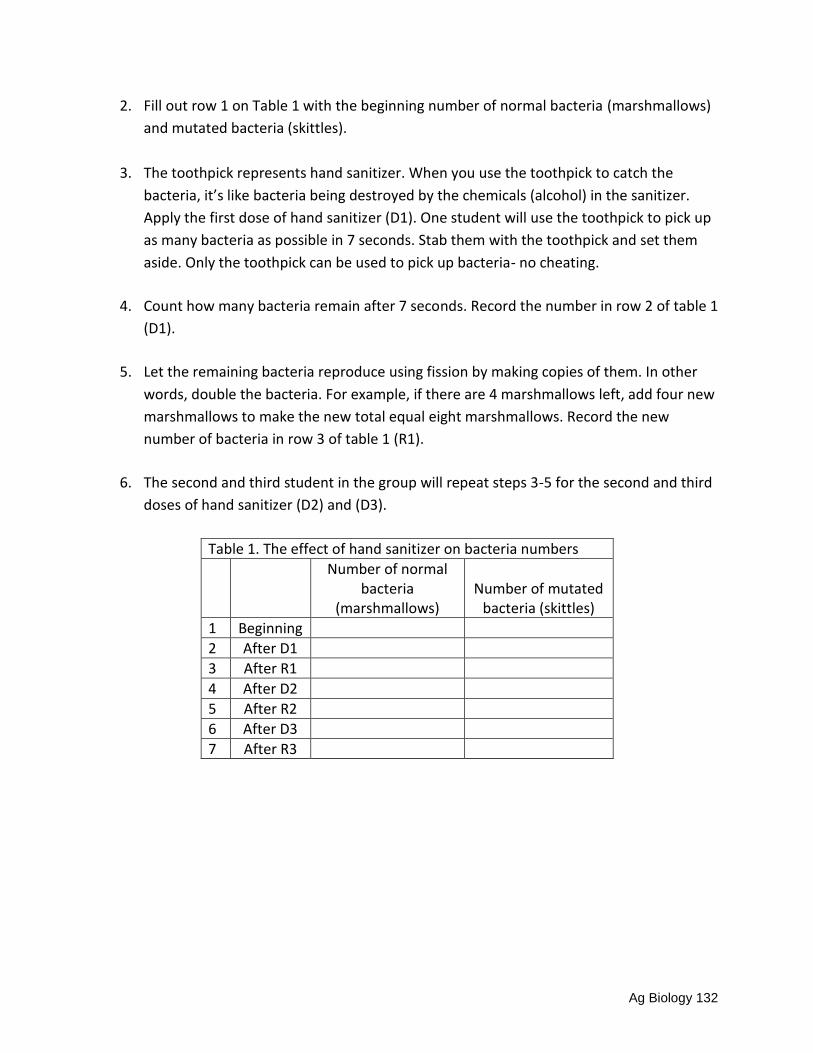
Ag Biology 132
2. Fill out row 1 on Table 1 with the beginning number of normal bacteria (marshmallows)
and mutated bacteria (skittles).
3. The toothpick represents hand sanitizer. When you use the toothpick to catch the
bacteria, it’s like bacteria being destroyed by the chemicals (alcohol) in the sanitizer.
Apply the first dose of hand sanitizer (D1). One student will use the toothpick to pick up
as many bacteria as possible in 7 seconds. Stab them with the toothpick and set them
aside. Only the toothpick can be used to pick up bacteria- no cheating.
4. Count how many bacteria remain after 7 seconds. Record the number in row 2 of table 1
(D1).
5. Let the remaining bacteria reproduce using fission by making copies of them. In other
words, double the bacteria. For example, if there are 4 marshmallows left, add four new
marshmallows to make the new total equal eight marshmallows. Record the new
number of bacteria in row 3 of table 1 (R1).
6. The second and third student in the group will repeat steps 3-5 for the second and third
doses of hand sanitizer (D2) and (D3).
Table 1. The effect of hand sanitizer on bacteria numbers
Number of normal bacteria
(marshmallows) Number of mutated
bacteria (skittles)
1 Beginning
2 After D1
3 After R1
4 After D2
5 After R2
6 After D3
7 After R3

Ag Biology 133
7. Make a graph showing the number of each type of bacteria over time.
Beg. D1 R1 D2 R2 D3 R3
8. Answer the conclusion questions and turn in.

Ag Biology 134
Conclusion Questions
1. If you were to label the “hand sanitizer” used in dose 1 (D1) for the percent of bacteria it killed, what would the label say? (What percentage of bacteria were killed? Killed ÷ total)
2. In the table below, list which traits of the bacteria belong in which category: (think about size, shape, squishyness, etc.)
3. When a doctor prescribes an antibiotic, the doctor usually says to take the medication until it is all gone. What could happen if you stop taking the medicine too early (and it stops killing bacteria)?
4. When bacteria become resistant, they usually have developed some sort of weapon that is resistant to the antibacterial chemical being used to get rid of them. This causes scientists to need to develop a new antibacterial chemical. In this lab, describe how you could have used a new antibacterial chemical to get rid of the mutated bacteria (skittles)?

Ag Biology 135
Genetic Engineering Notes

Ag Biology 136
GMO Debate Pre-survey
How do you feel about Genetically Modified Organisms? _____ I think they are safe _____ I think they are harmful _____ I have mixed feelings about them _____ I have no idea what they are How much do you know about Genetically Modified Organism? _____ A LOT _____ A little _____ I have heard of them, but don’t really know much about them _____ Never even heard of them Are there are foods that contain ingredients that have been Genetically Modified? _____ Yes _____ No _____ Maybe _____ Don’t know Are you: _____ male _____ female How old are you: _____ 13 _____ 14 _____ 15 _____ 16 _____ 17 _____ 18

Ag Biology 137
GMO Activity Notes

Ag Biology 138
GMO Debate Post-survey
How do you feel about Genetically Modified Organisms? _____ I think they are safe _____ I think they are harmful _____ I have mixed feelings about them _____ I have no idea what they are How much do you know about Genetically Modified Organism? _____ A LOT _____ A little _____ I have heard of them, but don’t really know much about them _____ Never even heard of them Are there are foods that contain ingredients that have been Genetically Modified? _____ Yes _____ No _____ Maybe _____ Don’t know Are you: _____ male _____ female How old are you: _____ 13 _____ 14 _____ 15 _____ 16 _____ 17 _____ 18

Ag Biology 139
Unit 8: Ecology

Ag Biology 140
Ecosystem Notes
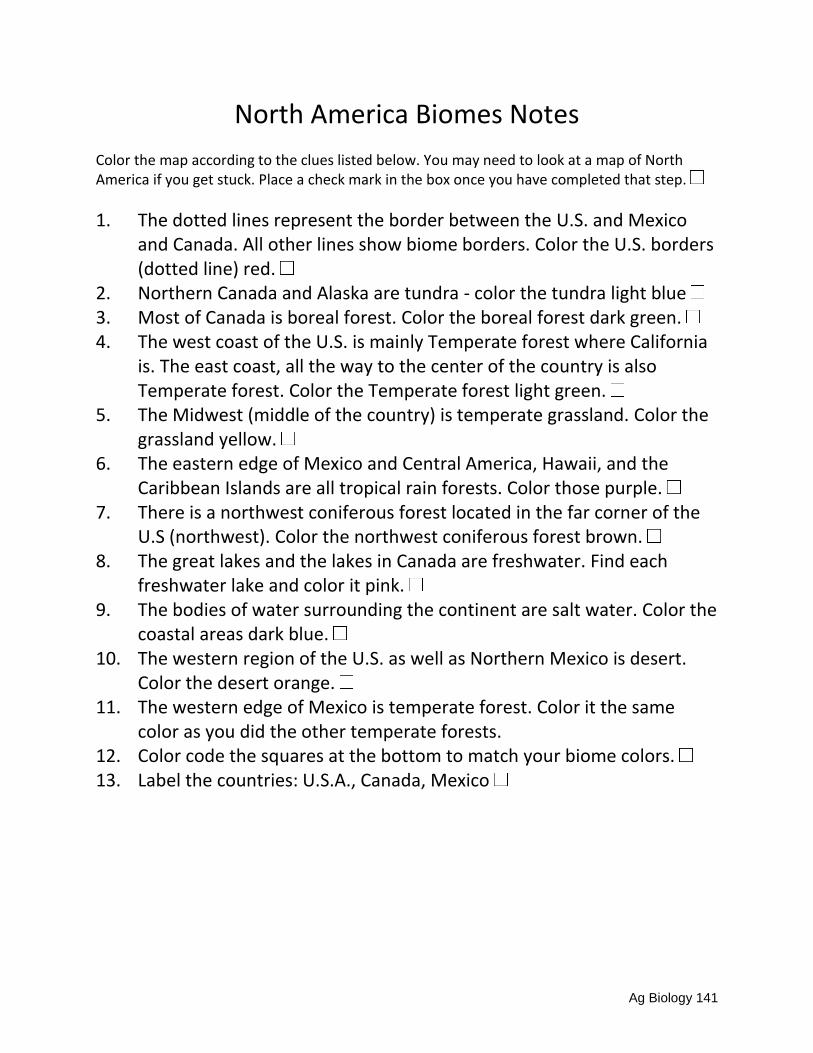
Ag Biology 141
North America Biomes Notes
Color the map according to the clues listed below. You may need to look at a map of North America if you get stuck. Place a check mark in the box once you have completed that step.
1. The dotted lines represent the border between the U.S. and Mexico and Canada. All other lines show biome borders. Color the U.S. borders (dotted line) red.
2. Northern Canada and Alaska are tundra - color the tundra light blue 3. Most of Canada is boreal forest. Color the boreal forest dark green. 4. The west coast of the U.S. is mainly Temperate forest where California
is. The east coast, all the way to the center of the country is also Temperate forest. Color the Temperate forest light green.
5. The Midwest (middle of the country) is temperate grassland. Color the grassland yellow.
6. The eastern edge of Mexico and Central America, Hawaii, and the Caribbean Islands are all tropical rain forests. Color those purple.
7. There is a northwest coniferous forest located in the far corner of the U.S (northwest). Color the northwest coniferous forest brown.
8. The great lakes and the lakes in Canada are freshwater. Find each freshwater lake and color it pink.
9. The bodies of water surrounding the continent are salt water. Color the coastal areas dark blue.
10. The western region of the U.S. as well as Northern Mexico is desert. Color the desert orange.
11. The western edge of Mexico is temperate forest. Color it the same color as you did the other temperate forests.
12. Color code the squares at the bottom to match your biome colors. 13. Label the countries: U.S.A., Canada, Mexico

Ag Biology 142
1. Name the 3 main biomes of the United States (land only).
2. What two biomes are closest to where you live? Place an X on the map to show your
approximate location.
3. What U.S. state could a person visit a tropical rain forest in? What about a temperate rain
forest?
4. Point out Alaska by drawing an arrow to it. What biome is found in Alaska?
5. If you traveled due north from your current location, what biomes would you pass through
(just going to the north pole) ]

Ag Biology 143
Agriculture in the Biomes Project
Objective:
Create and present a presentation about how farmers and ranchers grow food and raise
animals in a specific biome.
Procedure:
1. Choose or get your assigned biome from your teacher.
2. Research the various methods people use in order to grow food and raise animals in your
biome.
3. Create a visual representation of how people farm in your biome.
There is no limit to the materials you can use. You can use a variety of items, including Legos, clay, magazine photos, cut-out drawings, cotton balls, pipe cleaners, plastic plants, sugar cubes, toothpicks, plastic toy animals, stuffed animals, and anything else you can think of to use. You can also use objects found in nature, such as twigs, rocks, sand, and pinecones. Be inventive and imaginative! 4. Write a summary of how people farm in your biome and write it on a 4”x6” piece of paper
or notecard. During your presentation, you will read the card as you show your visual.
5. Present your project to the class.
Rubric
Used class time wisely 6
Diorama accurately depicts farming in assigned biome 13
High amount of effort is exerted on project 12
Descriptive paragraph is detailed and included with diorama 8
Presentation was informative, organized, and presented accurate information 5
Students showed ability to answer questions about farming in assigned biome 6
Total 50

Ag Biology 144
Agriculture in the Biomes Notes

Ag Biology 145
Ecosystem Function Notes

Ag Biology 146
Nitrogen Cycle

Ag Biology 147
Carbon Cycle

Ag Biology 148
Food Chain and Food Web Notes

Ag Biology 149
Ecosystem Management Notes
Population ecology:
Water quality:
Soil quality:
Air quality:
Succession:

Ag Biology 150