against all odds: interpreting relative risks and odds ratios
TRANSCRIPT

Against all Odds
Michael P. LaValleyBoston Universityhttp://people.bu.edu/mlava/
ACR/ARHP Annual Scientific MeetingSan Antonio Texas 10/20/2004
Outline
Measures of Risk– Relative Risk (RR)– Odds Ratio (OR)
Obtaining Adjusted RR– Logistic Regression with Transformation– Binomial Regression– Modified Poisson Regression
Summary

Measures of Risk
Measure relationship between two binary variables – Binary variables: 0/1 or No/Yes
Usually expressed as – At how much greater risk of X is one group than
another?Example – At how much greater risk of osteoarthritis (OA)
are women than men?

Measures of Risk
Often want to adjust for differences between groups in other factors– Remove the effects of the other factors from the
group differenceExample– At how much greater risk of OA are women than
men after adjusting for age and body mass index?
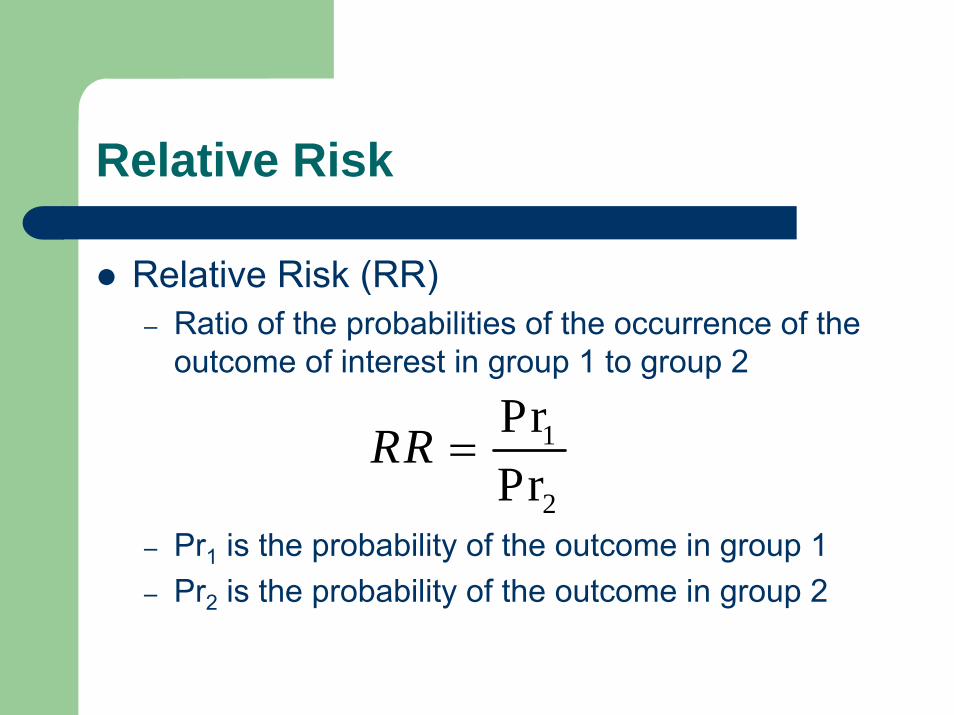
Relative Risk
Relative Risk (RR)– Ratio of the probabilities of the occurrence of the
outcome of interest in group 1 to group 2
– Pr1 is the probability of the outcome in group 1– Pr2 is the probability of the outcome in group 2
1
2
PrPr
RR =

Odds
Odds (used in odds ratio)– Odds are the probability of occurrence divided by
the probability of non-occurrence
– Odds2 defined using Pr2
11
1
Pr1 Pr
Odds =−
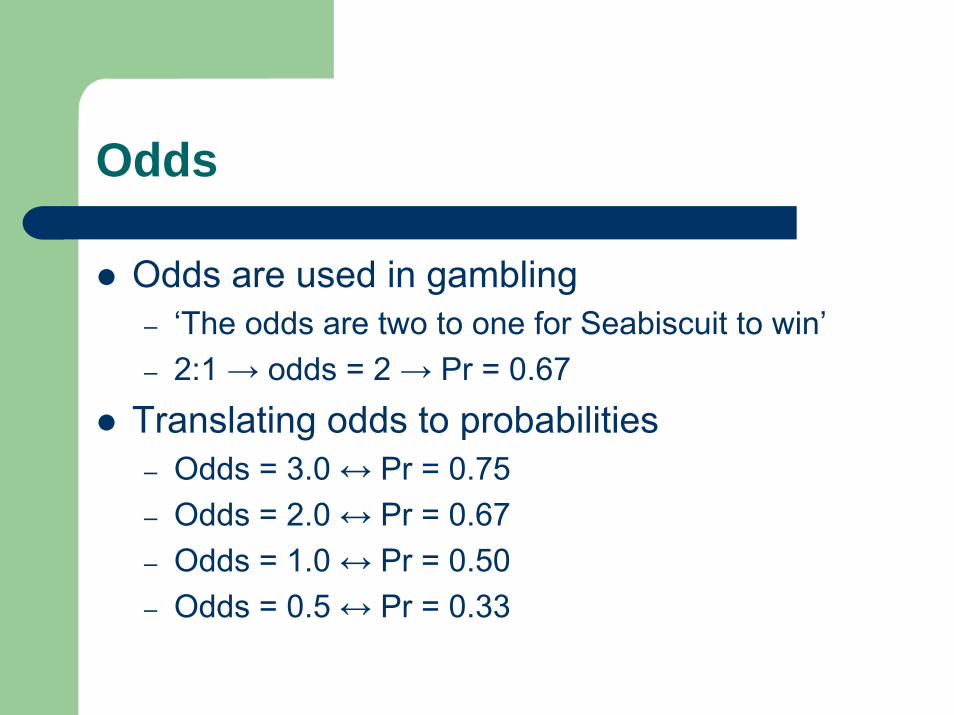
Odds
Odds are used in gambling– ‘The odds are two to one for Seabiscuit to win’– 2:1 → odds = 2 → Pr = 0.67
Translating odds to probabilities– Odds = 3.0 ↔ Pr = 0.75– Odds = 2.0 ↔ Pr = 0.67– Odds = 1.0 ↔ Pr = 0.50– Odds = 0.5 ↔ Pr = 0.33

Odds Ratio
Odds Ratio (OR)– Ratio of the odds of the occurrence of the event
of interest in group 1 to group 2
( )
( )
1
11
2 2
2
Pr1 Pr
Pr1 Pr
OddsOROdds
⎛ ⎞⎜ ⎟−⎝ ⎠= =⎛ ⎞⎜ ⎟−⎝ ⎠

RR and OR Comparison
RR and OR are ratio measures– 1.0 is the point of no difference between groups (the null
value)– Are greater than 1 if group 1 is at increased risk relative to
group 2– Are less than 1 if group 1 is at decreased risk relative to
group 2– Reciprocals are the same distance from the null value
E.g. 2 and ½ are equivalent group differences
RR and OR Comparison
The RR is more understandable – When the RR=2 then the probability of the
outcome in group 1 is twice that of group 2– This is not true for the odds ratio
Most people are more comfortable with probabilities or percentages that with odds

RR and OR Comparison
However, the OR has some advantages– In case-control studies the OR can be estimated
but not the RR– The OR is symmetric to which outcome level is
chosen as being of interest, the RR is not

RR and OR Comparison
When are the RR and OR Similar?– If the probability of the event is small, the odds
and the probability are close
– When the probability of the event is small in both the OR is a good approximation to the RR
– Rule of thumb for small: Pr < 0.1
11 1
1
Pr Pr1 Pr
Odds = ≈−

RR and OR Comparison
The OR is always more extreme (farther from 1) than the RRWhen the events of interest are common, the OR can be much larger than the RR

Probability of OA in Men
Odd
s R
atio
0.0 0.1 0.2 0.3 0.4
02
46
810
Odds Ratio when Relative Risk is 2

Which is Better?
For case-control studies need to present the ORFor cohort studies and clinical trials the RR is better to report– Reduces the chance of incorrect interpretation– Becoming preferred to report RR in medical
journals
Osteoarthritis in Framingham
In the Framingham Osteoarthritis study, prevalence of osteoarthritis (OA) was measured in 1992-93Female sex is an established risk factor for OAAt how much greater risk of osteoarthritis are women than men in this study?

Osteoarthritis in Framingham
No OA
OA Total
Women 316 222 538
Men 197 105 302
Total 513 327 840
Subset of 840 subjects to evaluate the prevalence of OA in women versus men538 women302 men513 (61%) no OA327 (39%) with OA

Osteoarthritis in Framingham
No OA
OA Total
Women 316 222 538
Men 197 105 302
Total 513 327 840
In men– 197 (65%) no OA– 105 (35%) with OA
In women– 316 (59%) no OA– 222 (41%) with OA
RR = 0.41/0.35 = 1.19OR = 1.32
Osteoarthritis in Framingham
Women have 1.19 times the risk of OA compared to menWomen have 1.30 times the odds of OA compared to menIf we interpret OR as an RR, we would mistakenly conclude women are at 1.3 times the risk of OA

Osteoarthritis in Framingham
No OA
OA Total
Women 316 222 538
Men 197 105 302
Total 513 327 840
Suppose we look at No OA as the outcome
– RR for No OA is 0.59/0.65 = 0.91
– But RR for OA is 1.19 and 1/1.19 = 0.84
The RR implies that sex plays a larger role for OA than for No OA!

Osteoarthritis in Framingham
RR is not symmetric around the null value for both outcome levels
– RR for No OA ≠ 1/RR for OA
OR is symmetric – OR for No OA = 1/OR for OA
Usually the outcome to choose is clear and this isn’t a problem. But some situations aren’t clear
– E.g. use ‘lived’ or ‘died’?
Adjusted RR
Logistic regression provides adjusted OR But, until recently it has been difficult to obtain adjusted RRThree methods for getting adjusted RR – Logistic regression with transformation– Binomial regression– Modified Poisson regression

Logistic Regression
Logistic regression is widely used regression method for binary outcomesLogistic regression coefficients are log(OR)Provides adjusted OR if adjustors are used as additional predictors

Logistic Regression
If outcome probabilities are < 0.1 for all values of the predictors then the OR are good approximations to RROtherwise Zhang and Yu proposed a formula to convert OR to RR
( ) ( )2 21 Pr PrORRR
OR=
− + ×
Logistic Regression
However the conversion formula has been criticized*– Leads to confidence intervals for RR that are too
small– Gives biased estimate if some regression
predictors are confounders– Doesn’t work if there are interactions in the
regression model*See McNutt et al.
Binomial Regression
Binomial regression is a rarely used regression method for binary outcomesBinomial regression coefficients are log(RR)Provides adjusted RR if adjustors are used as additional predictors
Binomial Regression
This model often fails due to numerical problemsEspecially failure prone if– Correlated predictors– One or more continuous predictors

Modified Poisson Regression
Poisson regression is a method for count outcomes – Count outcomes: 0, 1, 2, 3, ….
Poisson regression coefficients are log(RR)Provides adjusted RR if adjustors are used as additional predictorsPoisson regression is conservative for binary outcomes
– Less likely to be significant– Confidence intervals too wide

Modified Poisson Regression
Modification due to Zou– Adjust variability with generalized estimating
equations (GEE) – Uses variability in the data to adjust model
This has been shown to work very wellSoftware implementation– SAS in Lundquist– STATA in Barros and Hirakata

Osteoarthritis in Framingham
We found greater risk of OA in women than men– Could this be due to age differences between
women and men?– Could this be due to differences in body mass
index between women and men?Use regression models with sex, age, and body mass index

Osteoarthritis in Framingham
After adjustment for age and body mass index– Logistic OR = 1.45– Transformed Logistic RR = 1.25– Binomial RR = 1.20*– Modified Poisson RR = 1.23
*Failed to arrive at final estimate

Logistic Binomial Modified Poisson
0.80
1.00
1.25
1.50
2.00
Adjusted Effect of Sex on OA Framingham Study
Relative Risk (95%CI)Odds Ratio (95% CI)

Summary
Medical literature is moving toward reporting RR instead of OR whenever possible– Need to keep in mind that the RR changes in non-
intuitive ways when outcomes are switchedWhen reporting OR make it clear that it is not the RRModified Poisson regression will become standard method for obtaining adjusted RR
References
Simon SD. Understanding the odds ratio and the relative risk. Journal of Andrology 22:533-6, 2001Zhang J, Yu KF. What’s the relative risk? JAMA280:1690-1, 1998McNutt L-A, Wu C, Xue X, Hafner JP. Estimating the relative risk in cohort studies and clinical trials of common outcomes. American Journal of Epidemiology 157:940-3, 2003

References
Zou G. A modified poisson regression approach to prospective studies with binary data. American Journal of Epidemiology 159:702-6, 2004Lundquist K. SAS FAQ: How to estimate relative risk in SAS using PROC GENMOD for common outcomes in cohort studies. http://www.ats.ucla.edu/stat/sas/faq/relative_risk.htmBarros AJD, Hirakata VN. Alternatives for logistic regression in cross-sectional studies. BMC Medical Research Methodology 3:21, 2003