against this backdrop, the projected
TRANSCRIPT

Against this backdrop, the projected
GDP growth of India at around
7% is encouraging, despite
being temporarily impacted by
demonetisation. I believe that the
medium term prospects in India are
favourable and that the structural
reform process will continue over
the next few years, culminating
in an uptick in the investment
momentum.
The Government’s increased
emphasis on infrastructure
development through a number
of flagship programmes has been
widely welcomed. Infrastructure
spends have a multiplier effect,
enabling pan-industry growth, while
contributing to an enhanced quality
of life. Your Company is uniquely
positioned to respond to these
initiatives of the Government. Our
capabilities in turnkey execution
of large scale infrastructure are
virtually unmatched, and we look
forward to the speedy transition of
these publicly-announced proposals
into implementation mode.
We also await progress in
the Government’s Smart City
programme. Our integrated
capabilities, covering all aspects
of security, mobility, intelligent
infrastructure, etc., will help in
maximizing the benefits of this
initiative and ensure accelerated
execution. Another significant
area of interest for your Company
is ‘Make-in-India’. We aim to
leverage our proven manufacturing
capabilities at the upper end of
the technological spectrum, to
manufacture complex equipment
and systems in sectors such as
defence, aerospace and thermal
and nuclear power.
Performance Overview
The Company has performed well
in all key performance parameters
during 2016-17. Despite facing
delays in bidding and award
processes, the Company bagged
fresh orders of ` 142,995 crore
recording a growth of 5%. Group
Revenues at ` 110,011 crore
grew by 8% during 2016-17
despite impediments due to
demonetisation, tardy realisations
from customers in some projects
and delays in obtaining clearances
and work-front availability. The
Order Book of the Company stands
at a robust level of ` 261,241 crore,
providing good revenue visibility for
2017-18. The Company recorded
an impressive growth of 43% in the
Group Profit After Tax for the year
at ` 6,041 crore.
The Company successfully listed
two of its subsidiaries, L&T Infotech
Limited (LTI) and L&T Technology
Services Limited (LTTS) during
2016-17 in its pursuit of creation
and unlocking of value for the
shareholders of the Company. It
gives me immense pleasure to share
with you that the Board of Directors
of your Company has recommended
a bonus issue in the ratio of 1:2
and a pre-bonus dividend of ` 21
per share. The corresponding
dividend in the previous year was
` 18.25 per share.
Internationalisation
The Company continues to pursue
international business opportunities
in select geographies with a
view to diversify geographical
concentration risks. The Company
has an established presence in
GCC countries, predominantly in
the Infrastructure and Hydrocarbon
sectors. While capex spends in
Dear Shareholders,
The Indian economy across the last
year, has demonstrated a high order
of resilience and remains an island
of stability amidst global volatility.
Meanwhile, setting its sights on the
future, the Government has initiated
a number of structural reforms
whose positive outcomes should be
tangible in long term growth.
The global scenario is being
coloured by protectionist policies
in various hues adopted by a few
developed countries. While such
populist measures tend to impede
trade and discourage revival of
the investment cycle, it is up to
international industry to address
these challenges by reconfiguring
its offerings and recasting its
operations. In the Middle East,
relatively low oil prices and
consequent fiscal pressure has led
to contraction of developmental
spends.
A. M. Naik
Group Executive Chairman
1

2
creating a vibrant work environment
to attract and retain talent across
the organisation. The Company has
a 7-step Leadership Development
Program which aims to build a
leadership pipeline at various levels
of management. Senior executives
at different levels nurture second
lines of leadership.
As a firm believer in leading through
example, I have put in place a
succession plan at the apex level
of your Company. I have actively
mentored the Chief Executive
Officer & Managing Director (CEO
& MD) designate of L&T, which has
resulted in seamless transition.
Sustainable Development
Sustainability and Social
Responsibility are an integral
part of the Company’s business
strategy. Your Company believes
in sustainable utilisation of
natural resources and enhancing
social equity to realise its growth
objectives, while creating value
for stakeholders. Significant
initiatives have been undertaken in
reducing carbon emissions, water
management and waste water
discharge. Your Company’s CSR
programmes also focus on health,
education and skill-building to
contribute to a better quality of life
for the needy sections of society.
Total spends on CSR initiatives
in 2016-17 by your Company
amounted to ` 101 crore under
eligible items as defined in the
Companies Act which translate
to 2% of the average annual net
profits of the Company over the last
3 years.
Outlook
The Government is committed
to introducing structural
reforms to revive the investment
cycle, boosting tax revenues
through widening of the tax
base, strengthening indigenous
manufacturing and bringing about
infrastructure development in rural
and urban areas. Implementation
of GST is expected to have far
reaching effects by inducting large
parts of the informal economy
into the formal system, ultimately
leading to increased tax revenues.
Introduction of GST is considered as
progressive and a step in the right
direction. Your Company does not
see any adverse impact due to GST
implementation.
The domestic economy is
expected to steadily improve in
the current year on the back of
structural reforms and supportive
monetary policy. The Government
has reiterated its emphasis on
infrastructure build-out in the areas
of transportation, augmentation of
water resources, power, affordable
housing and smart cities. Increased
private sector participation in the
Defence business affords strong
business opportunities for your
Company. Various upcoming
projects provide the Company
with a broad perspective of the
opportunity basket opening up
in 2017-18. Segments within the
group that hold promise in the
current year include –
1) Infrastructure
a) Roads – The Government has
kick-started major road projects
and has committed significant
budgetary allocations for roads and
highways development in 2017-18.
The Company expects this impetus
the Middle East have generally
contracted, some areas in
hydrocarbon and core infrastructure
are still witnessing investments
and these provide a favourable
opportunity basket for your
Company’s growth in the region.
Apart from the GCC region, we
are looking at selective prospects
in North Africa, East Africa and
some countries to the east like
Myanmar, Malaysia and Vietnam.
The unexecuted Order Book from
international markets stood at
` 69,757 crore, which translates
to 27% of the total Order Book.
Digital Trends
Digital technologies are
fundamentally changing the way
the world lives and works. While
these trends may be less visible
in the engineering, construction
and manufacturing sectors, the
Company has decided to move
forward in this space. Digitalization
has been identified as a core
theme in our Strategic Plan, and
a major program to digitize
processes is already underway in our
Construction business. These will be
progressively extended across the
Company, with the aim of achieving
higher efficiencies with the resultant
favourable impacts on revenues and
profitability.
Our Technology companies, LTI and
LTTS are significant partners in this
Digitalization journey for the Group
and are participating in developing
solutions and implementing them.
Talent Management and
Succession Planning
Your Company views its people as
central to the success of its journey
of value creation. Accordingly, our
Human Resources policy focuses on

3
emerging business opportunities
in the areas of city surveillance,
intelligent traffic management
systems, smart governance
systems, transport & logistics and
optical fibre cabling – all of which
constitute different components
of smart city infrastructure. Your
Company has the unique advantage
of in-house domain expertise across
business verticals to provide end-to-
end offerings to customers and can
assume the role of a Master System
Integrator for the customer.
e) Water Infrastructure –
The Government is actively
pursuing plans to improve water
management systems across the
country in view of falling water
tables and widespread water
shortages. This is giving rise to
large business opportunities which
your Company is well positioned
to exploit. Areas of focus
include water storage and supply
management, effluent treatment,
sewage treatment, lift irrigation and
emerging opportunities in inland
waterways infrastructure.
2) Thermal Power Generation
The thermal power sector has been
facing multiple challenges in the
last few years, which is aggravated
by under-utilisation of capacity,
particularly in manufacturing of
turbines. Strong focus on power
from renewables has also led to
muted awards in the thermal
power space. While the Company
has state-of-the-art facilities for
equipment manufacturing and
excellent project management
capabilities, it continues to face
competition for projects bid out by
central and state utilities. Though
some of the Company’s market
share has been lost to competition
on aggressive pricing, the Company
continues to sight reasonably large
business opportunities from state
and central utilities in 2017-18.
The Company is also attempting
to increase manufacturing capacity
utilisation by engaging with our
joint venture partners for increased
international business.
3) Power Transmission
& Distribution
Domestic power distribution
sector holds significant business
opportunities with the thrust of the
Government on augmenting and
strengthening grid infrastructure
at both centre and state levels. The
Company is also well established
in transmission & distribution
projects in Middle East countries
and continues to see traction in
that region. The year 2017-18 holds
good prospects in the area of power
transmission & distribution.
4) Hydrocarbon
Despite contraction of spends
in the Middle East due to lower
oil prices, your Company is still
seeing opportunities in the areas
of gas production and downstream
petrochemical projects. Strong
customer connect with a few
selected clients in the region has
yielded some significant order wins
and the outlook for the business in
the region is positive. The domestic
market is also seeing business
potential in the areas of offshore
capex, refinery upgradation and
expansion, new fertilizer plants,
LNG re-gasification terminals and
cross country pipeline jobs. The
Hydrocarbon business has turned
around in the year 2016-17 on the
back of close-out of challenging
international legacy projects,
profitable execution of on-going
to gain strength, aided by increased
investments in specialised bridges
and tunnels.
b) Railways – Your Company
has been a major partner in the
Dedicated Freight Corridor program
currently being piloted by the
Indian Railways. The Indian Railways
has planned high levels of outlay
over the next few years on track
modernisation, new railway lines
and supporting infrastructure.
Your Company will participate in
those programs as and when the
opportunities arise.
c) Metro Rail – Your Company has
been successfully executing Metro
Rail projects in multiple cities in
India over the last few years and is
also executing two such projects in
the Middle East. The Government
looks at Metro Rail networks as the
ideal solution to decongest urban
traffic. Metro Rail projects have
been planned in a number of metro
and non-metro cities in India as part
of the urban development program
and should provide a steady stream
of growth opportunities for your
Company.
d) Urban Infrastructure – Building
robust urban infrastructure and
providing affordable housing are
major thrust areas identified by
the Government. Your Company
is well placed to capitalise on
major opportunities in the areas of
affordable housing, hospitals, office
space and facilities for educational
institutions. Building Smart Cities
and Digital India is a major theme
pursued by the Government and
your Company has been at the
forefront of nation building by
aligning its capabilities to meet
changing needs. Your Company sees

4
global over-capacity in the process
plant equipment segment. Nuclear
power sector is still grappling with
the aftermath of the Fukushima
accident, though India remains
committed to the expansion of
nuclear power installed capacity
for developing a clean source of
energy. The issues of Civil Liability
for Nuclear Damages are now being
resolved and would pave the way
for establishing new nuclear power
plants in the near future.
The Company is well placed to
harness the opportunities when
they come up.
7) Electrical & Automation (E&A)
The Electrical & Automation
business recorded stable
performance in 2016-17 despite
sluggish industrial demand,
challenges posed by liquidity crunch
and aggressive competition. The
Company presents an array of best-
in-class low-voltage and medium-
voltage products which provide a
competitive edge in the domestic
market. The Electrical business has
launched new products to cater to
the theme of Smart Cities. It focuses
on renewable and alternative energy
generation by introduction of smart/
premium meters, solar solutions, a
new range of Moulded Case and
Modular Circuit Breakers, and a
contemporary range of Bus Bar
trunking solutions. With investment
in R&D efforts, a number of
patents to its name, a country-wide
network of distributors, presence
in the Middle East region through
subsidiary companies and focus on
operational excellence, the business
expects to continue delivering
profitable growth.
8) Realty
This business, launched by your
Company a few years ago,
continues to deliver steady revenues
and profits despite the sector being
impacted by excess inventory, flat
realisations and lower absorption
rates. The Company’s Realty
portfolio comprises residential and
commercial real estate development
activity, mainly centred in Mumbai
and development of own land
parcels in Powai, Bangalore and
Chennai. Demonetisation led to
a major slowdown in retail real
estate sales during 2016-17. The
real estate segment is gradually
recovering from this downturn and
sale of apartments is nearly back
to pre-demonetisation levels. The
Company managed to close two
major transactions of divestment
from a residential project at Chennai
and a retail mall at the Company’s
Seawoods project in Navi Mumbai.
The Government has recently
introduced legislation aimed at
regulating the sector which augurs
well for the business.
9) Information Technology and
Technology Services (IT&TS)
As mentioned earlier, the Company
has successfully completed Initial
Public Offerings of Larsen & Toubro
Infotech Limited (LTI) and L&T
Technology Services Limited (LTTS)
during the year 2016-17. The
exceptional gains of ` 1,709 crore
from divestment of the Company’s
part stakes in these subsidiaries
have accrued to the shareholders’
funds. With the focus on client
mining, talent management,
enhanced utilisation of resources
and superior service offering, these
listed subsidiaries are geared to face
global headwinds and increasing
protectionist policies in developed
orders on hand and increased
operational excellence measures
undertaken by the business.
The Company has built up a good
Order Book and has capabilities in
harnessing upcoming prospects.
5) Defence Sector
Thrust on import substitution
through indigenisation of defence
equipment manufacture and
the Make-in-India initiative is
opening up the Defence sector
to significantly enhanced private
sector participation, facilitated by
conducive policy measures. Multiple
programs earmarked for domestic
private sector players are being
kick-started in all branches of the
armed forces. Your Company is
a leading player in collaborating
with the Ministry of Defence in
building up indigenous expertise
on various defence platforms for
the past many years. The Company
collaborates with technology
partners wherever required and is
currently well poised to participate
in some large programs being
launched for augmentation of
defence equipment for the Army
and the Navy. In 2016-17, the
Company also received a large order
for manufacture of tracked artillery
guns, the largest such order given
to the private sector till date. The
Company’s shipyard at Kattupalli
augments the ability of the Group
to bid for large naval orders.
Defence is a major focus area for
the Company and the business
expects large prospects in the
coming years.
6) Heavy Engineering
The Heavy Engineering business has
been facing shrinking prospects due
to muted oil prices, coupled with

5
through digitalisation, reduction in
working capital levels and unlocking
of shareholder value through
divestments of non-core businesses.
The Company completed the first
year of its Lakshya Plan in 2016-17
and is on course to achieving
various objectives of the plan.
The Company divested its General
Insurance business during 2016-17
in line with its stated objective
of exiting non-core businesses.
Apart from recording improved
profitability, the Company has
achieved higher Return on Equity
also aided by reduction of net
working capital levels.
Over the next few months,
I will be handing over my executive
charge to the CEO & MD designate
Mr. S.N.Subrahmanyan and will
continue as Chairman of the Group.
Before I conclude, I would like to
acknowledge the contributions
made by team L&T and thank our
customers, vendors and other
stakeholders who made it possible
for the Company to maintain its
growth momentum and improve
financial performance. I also take
this opportunity to thank my fellow
Board Members for their steadfast
support and the confidence they
have reposed in our pursuit of
delivering high quality, sustainable
growth.
Thank You
A.M.Naik
Group Executive Chairman
world markets while maintaining
healthy shareholder returns.
10) Financial Services
This business, which was listed in
2011, continues to grow and had
a loan book of ` 64,500 crore at
the end of FY17. The business
has adopted prudential norms for
provisioning of the non-performing
assets and is taking efforts to
reduce the cost-to-income ratio. It is
focusing on portfolio rationalisation,
right-sizing of manpower, and
improving the quality of assets in an
effort to enhance Return on Equity.
11) Development Projects
Your Company currently has a
portfolio of concession assets in the
areas of roads, power generation &
transmission, a container port and
a metro rail. While the container
port, a thermal power plant and
most of the road projects are
operational, the metro rail project
at Hyderabad is under construction.
This is the largest ‘transit-oriented-
development’ project in the country
and execution is progressing
satisfactorily. The project is likely
to be fully commissioned in FY19.
As a part of its Lakshya objectives,
the Company is evaluating
various options of divestment
and restructuring of the road
concessions business.
Strategic Plan
Your Company has embarked on
its five year strategic plan (Lakshya)
for achieving improvement in key
performance parameters leading
to enhanced Return on Equity over
the plan period. The strategic plan
lays emphasis on profitable growth,
harnessing emerging opportunities
in defence, nuclear power and smart
cities, productivity improvements

6
Contents
Company Information 7
Organisation Structure 8 - 9
Leadership Team 10
L&T Nationwide Network & Global Presence 12 - 13
Corporate Social Responsibility 14 - 18
Annual Business Responsibility Report (ABRR) 2016-17 19 - 35
Standalone Financials - 10 Year Highlights 36
Consolidated Financials - 10 Year Highlights 37
Graphs 38 - 39
Route Map to the AGM Venue 40
AGM Notice 41 - 56
Directors’ Report 57 - 135
Management Discussion & Analysis 136 - 228
Auditors’ Report 229 - 235
Balance Sheet 236 - 237
Statement of Profit and Loss 238 - 239
Statement of changes in Equity 240
Cash Flow Statement 241 - 242
Notes forming part of the Financial Statements 243 - 341
Auditors’ Report on Consolidated Financial Statements 343 - 347
Consolidated Balance Sheet 348 - 349
Consolidated Statement of Profit and Loss 350 - 351
Consolidated Statement of changes in Equity 352 - 353
Consolidated Cash Flow Statement 354 - 355
Notes forming part of the Consolidated Financial Statements 356 - 468
Information regarding Subsidiary Companies 471 - 480
Proxy Form 481 - 482
Shareholder’s Satisfaction Survey Form – 2017 483 - 484

7
MR. A.M. NAIK Group Executive Chairman
MR. S.N. SUBRAHMANYAN Deputy Managing Director & President
MR. R. SHANKAR RAMAN Whole-time Director & Chief Financial Officer
MR. SHAILENDRA NARAIN ROY Whole-time Director & Senior Executive Vice President
(Power, Heavy Engg. & Defence)
MR. D.K. SEN Whole-time Director & Sr. Executive Vice President
(Infrastructure)
MR. M.V. SATISH Whole-Time Director & Sr. Executive Vice President
(Buildings, Minerals & Metals)
MR. M.M. CHITALE Independent Director
MR. SUBODH BHARGAVA Independent Director
MR.M.DAMODARAN Independent Director
MR.VIKRAM SINGH MEHTA Independent Director
MR.SUSHOBHAN SARKER Nominee of LIC
MR. ADIL SIRAJ ZAINULBHAI Independent Director
MR. AKHILESH KRISHNA GUPTA Independent Director
MRS. SUNITA SHARMA Nominee of Life Insurance Corporation of India
MR. THOMAS MATHEW T. Independent Director
MR. AJAY SHANKAR Independent Director
MR. SUBRAMANIAN SARMA Non-Executive Director
MRS. NAINA LAL KIDWAI Independent Director
MR. SANJEEV AGA Independent Director
MR. N. KUMAR Independent Director
“72nd ANNUAL GENERAL MEETING AT ST. ANDREW’S AUDITORIUM, SAINT DOMNIC ROAD, BANDRA WEST, MUMBAI - 400 050 ON TUESDAY, AUGUST 22, 2017 AT 3.00 P.M.”
Board of Directors
Company Information
Company Secretary Mr. N. Hariharan
Registered Office L&T House, Ballard Estate, Mumbai - 400 001
Auditors M/s. Sharp & Tannan and M/s.Deloitte Haskins & Sells LLP
Registrar & Share Transfer Agents Karvy Computershare Private Limited

88

9

Leadership Team
A. M. Naik
Group Executive Chairman
S. C. Bhargava
Sr. Vice President (Electrical & Automation)
Hasit Joshipura
Head - Corporate Centre
S. N. Roy
Sr. Executive Vice President(Power, Heavy Engineering
& Nuclear)
R. Shankar Raman
Chief Financial Offi cer
S. N. Subrahmanyan
CEO & Managing Director
Subramanian Sarma
CEO & Managing Director(L&T Hydrocarbon Engineering)
D. K. Sen
Sr. Executive Vice President (Infrastructure)
M. V. Satish
Sr. Executive Vice President (Buildings, Minerals & Metals)
J. D. Patil
Sr. Executive Vice President(Defence)
As on 1st July, 201710

Technology Leadership
Smart Cities
Regd. Offi ce: Larsen & Toubro Limited, L&T House, N. M. Marg, Ballard Estate, Mumbai - 400 001, INDIA CIN: L99999MH1946PLC004768
Technology I Engineering I Projects Construction I Manufacturing
L&T partners the nation, industry and people to build a newer, brighter future. In critical sectors, such as security and
surveillance, we provide the technology as well as the engineering and construction expertise to transform vision into reality.
www.Larsentoubro.com

12
Nationwide Network

13
Global Presence

14
CORPORATE SOCIAL RESPONSIBILITY
Creating a Better Tomorrow
L&T is an engineering and
construction conglomerate with a
heart. One that resonates with the
philosophy that growth is the means
to achieve the greater good of the
greatest number.
At L&T, the imperative of balancing
financial, environmental and social
interests predates industrywide
acceptance of concepts such
as ‘CSR’ and ‘Sustainability
Reporting’. Building on over seven
decades of social responsibility
activities, the Company
contributes to inclusive growth
by empowering communities
and accelerating development
through interventions in water &
sanitation, health, education and
skill development. L&T-eering, a
structured volunteering programme,
encourages and enables employee
volunteers or L&T-eers to contribute
their spare time to community
development programmes
supported by the Company, thereby
enhancing social impact even
further.

15
Enhancing impact
The Companies Act 2013 provided
a unique opportunity for L&T
to realign its CSR initiatives
with the nation’s developmental
requirements and create more
impactful community-development
programmes. Weaving together
the company’s business vision and
its responsibility towards the social
sector, the CSR theme of ‘Building
India’s Social Infrastructure’ was
chosen.
Towards this end, L&T began
working for the development of
water-stressed rural communities.
It undertakes community-based
interventions to make water
available for drinking, sanitation
and agriculture. Using an integrated
approach, interventions in
education, health and skill building
have been planned in the same rural
Water & Sanitation
1,07,253 Beneficiaries
Education
3,32,013 Beneficiaries
Health
9,93,878 Beneficiaries
Skill Development
34,696 Beneficiaries
communities in a phased manner
for the next 5 years to improve
the overall quality of life. This is
closely linked with the UN’s Global
Sustainable Development Goals
(SDGs). These areas of activity yield
returns with cascading benefits that
have a ripple effect on dependents
and associates.
At the grassroot level, L&T’s CSR
activities are aligned to specific
Governmental welfare programmes
and projects, strengthening the
execution of projects in progress
and avoiding needless duplication
of effort. This ensures the judicious
allocation and use of resources
such as money, time and talent.
L&T executes CSR projects directly
or partners with Non-Government
Organisations (NGOs).
Water & Sanitation
- meeting the bare necessities
Launching its Integrated Community
Development Programme in FY
2014-15, L&T identified locations
as ‘water-stressed’ on the basis of
availability, quality and uncertainty
of supply to enable these locations
to become water-sufficient for
drinking, sanitation and agriculture.
L&T envisages these communities
leading better quality lives through
an integrated and holistic approach
which will provide access to
improved healthcare, education
and higher income levels. To begin
with, L&T, in consultation with
external domain experts, identified
water-stressed village clusters
that were not beneficiaries of
any previous interventions in four

16
states – Rajasthan, Tamil Nadu,
Maharashtra and Gujarat. This
covers 11006 households across an
area of 9337 hectares.
Key deliverables
• Watershed interventions such
as construction of check dams,
anicuts, contour trenches, farm
bunds, farm ponds, and well
restoration to increase ground
water levels and soil moisture
content
• Drudgery-free access to clean
drinking water ensuring improved
health and sanitation
• Availability of fodder for livestock
• Empowerment of communities
and sustaining programme
benefits through self-help groups
with women’s participation
Key highlights so far:
• Project formulation through
extensive community participation
using Participatory Rural Appraisal
• A strong feeling of ownership
and involvement instilled within
community members
• Increase in ground water level,
conversion of land from fallow
to cultivable, and checking of soil
erosion through various
watershed interventions
• Creation of community-level
organisations like Village
Development Committee (VDC),
Self Help Groups (SHGs) and User
groups for project sustainability.
VDCs have been formed in all 30
villages under our coverage
chest and TB) ophthalmology,
orthopaedics, nephrology,
psychiatry, ENT, dermatology and
dentistry. Immunisation and dialysis
services are also provided.
Emerging lifestyle diseases, such
as diabetes and cardiac problems
are also addressed at these centres.
The HIV/AIDS issue is addressed
through diagnostic and counselling
facilities, as well as distribution of
the Government’s free anti-retroviral
therapy at L&T’s Mumbai Health
Centre. Counselling services are
offered in the areas of mother-and-
child care, as well as problems faced
by teenagers.
Mobile Clinics: The mobile clinics
operated by L&T penetrate deep
into rural and tribal areas, bringing
the benefits of basic health facilities
and modern health technology to
these marginalised communities.
Health Camps: L&T organises
diagnostic, clinical and awareness
health camps. Diagnostic and
clinical camps are held pertaining
to general medicine as well as
specialties such as ophthalmology,
• 30-50% of participants in all VDC
and watershed interventions are
women, ensuring their
participation in project planning
and execution.
• Sanitation awareness drives
among the community members
and community-based monitoring
committees will ensure that these
villages are well on their way to
becoming free of open defecation.
Health
– the wellspring of joy
Good health is the cornerstone of
social well-being. L&T is helping
create healthier communities by
providing the underprivileged with
affordable healthcare services in
various areas – with a focus on
mother-and-child care.
Health Centres: L&T has set up
multi-specialty health centres which
provide diagnostic, curative and
preventive services in the areas of
general medicine, gynaecology,
paediatrics, pulmonology (including
L&T’s healthcare initiatives focus on mother and child care among the disadvantaged sections of society.

17
opportunities to perform hands-on
science experiments and fire their
imagination.
A toy van for children – ‘Nanha
Munna Express’ – makes learning
fun for children, and helps develop
motor, cognitive and social skills.
After-school support is provided
to children in community learning
centres by trained community
teachers. These centres help
children to cope with their school
curriculum, thereby reducing school
drop-out rates, and enhancing
their academic performance as they
progress from one standard to the
next.
Preschools or Balwadis are run
in low-income communities to
lay a strong foundation for many
vulnerable children and facilitate
enrolment in neighbourhood
schools.
Children from underprivileged
backgrounds are also provided
with basic computer education, to
prepare them for a digitalised world.
dentistry, gynaecology and TB
detection. Diagnostic camps are
also held for specific groups, such
as women and school children.
Awareness camps disseminate
information on critical issues such
as hygienic practices and HIV/
AIDS prevention. Blood donation
camps are held, usually at L&T’s
establishments, in partnership with
hospitals or blood banks.
Dialysis Centres: L&T has set up
Artificial Kidney Dialysis Centres at
its health centres for benefit of the
underprivileged.
Education
– the mainstay of progress
L&T’s social interventions covering
educational initiatives are focused
on providing primary education,
infrastructure development and
enhancing the learning experience
for children in several schools in the
vicinity of its facilities across India.
Education infrastructure: L&T
provides infrastructure support
to Government schools. It
provides furniture, sets up and
equips laboratories, libraries and
playgrounds, refurbishes and
digitises classrooms and builds
toilet blocks for rural schools. All
these lay the foundation for good
education.
Learning enrichment
Learning enrichment programmes
are conducted in schools through
NGO partners, with a focus on
science, language and maths.
‘Science on Wheels’ vans visit
schools to provide young,
enquiring minds with exciting From community learning centres to computer labs, L&T helps spread education in rural areas and around its facilities.

18
skilled, self-reliant young men, ready
to join the workforce and support
themselves and their families.
Industry-oriented training:
L&T has collaborated with 27
Industrial Training Institutes
(ITIs) across the country to impart
industry-oriented training.
Empowering the differently-
abled: L&T’s ‘Project Neev’ initiative
enriches the lives of the differently-
abled by offering specially-designed
training programmes that enable
them to obtain gainful employment
and enhance their sense of
self-worth.
Vocational training for women:
To make underprivileged women
self-reliant, L&T has introduced
vocational training programmes
in the areas of tailoring, beautician
skills, home-nursing and food
processing.
What it all adds up to in the
year gone by:
• Over 1 million beneficiaries
• 2.5 lakh students in 250 schools
– better infrastructure, fewer
dropouts, better grades
• 7000 youth from underprivileged
backgrounds made employable
through CSTIs
• 32 water-stressed villages in 4
states benefited from ‘Integrated
Community Development’ - water,
sanitation, health education and
improved standard of living
Skill-building
– creating a world of possibilities
Construction skills: India’s
infrastructural demands call
for quality workmanship and
deployment of the latest techniques
in construction methodology.
L&T has set up and runs eight
Construction Skills Training
Institutes (CSTIs) across the country.
These Institutes provide formal, free
vocational training in construction
skills for the largely unorganised
workforce in this sector. School
dropouts and illiterate village youth
are taught skills like bar-bending,
formwork carpentry, masonry,
scaffolding and welding. A stipend,
hostel facility and Certificate of
Proficiency on completion, give
participants an added incentive to
complete the course. These short
courses – ranging from three to six
months – transform these once-
unemployable youth into certified,
Over one million people benefitted from
L&T’s social interventions in 2016-17 alone.
Vocational training in skills like tailoring help boost both confidence and independence among women in rural areas.

19
ANNUAL BUSINESS RESPONSIBILITY REPORT 2016-17
SECTION A: GENERAL INFORMATION ABOUT THE COMPANY
1. Corporate Identity Number (CIN) of the Company: L99999MH1946PLC004768
2. Name of the Company: Larsen & Toubro Limited
3. Registered address: L&T House, Ballard Estate, Mumbai 400 001, India
4. Website: www.Larsentoubro.com 5. E-mail id: [email protected] 6. Financial Year reported: 1st April 2016 - 31st March 2017
7. Sector(s) that the Company is engaged in (industrial activity code-wise):
At L&T we believe Sustainability is an important element of the way we work. We continue to be resource efficient and put efforts towards better environment management. People are our assets and their safety and well-being is of prime importance. Through our projects, products and services, we aim to build a better society, while maintaining that delicate ecosystem balance and helping communities prosper.
This report conforms to Business Responsibility Reporting (BRR) requirement of Securities & Exchange Board of India (SEBI) based on the National Voluntary Guidelines (NVG) released by the Ministry of Corporate Affairs, India. Furthermore, L&T publishes comprehensive sustainability performance in it’s Sustainability Report, which is prepared in accordance with Global Reporting Initiative (GRI) guidelines and is externally assured.
L&T’s Sustainability Reports can be accessed at www.lntsustainability.com.
Group Class Sub-Class Description
271 2710 27104 Manufacture of electric motors, generators, transformers and electricity distribution and control apparatus
282 2824 28246 Manufacture of parts and accessories for machinery / equipment used by construction and mining industries
301 3011 30111 Building of commercial vessels, passenger vessels, ferry boats, cargo ships, tankers, tugs, hovercraft (except recreation type hovercraft), etc.
30112 Building of warships and scientifi c investigation ships, etc.
30114 Construction of fl oating or submersible drilling platforms
410 4100 41001 Construction of buildings carried out on own-account basis or on a fee or contract basis
421 4210 42101 Construction and maintenance of motorways, streets, roads, other vehicular and pedestrian ways, highways, bridges, tunnels and subways.
42102 Construction and maintenance of railways and rail-bridges
422 4220 42201 Construction and maintenance of power plants
42202 Construction / erection and maintenance of power, telecommunication and transmission lines
42901 Construction and maintenance of industrial facilities such as refi neries, chemical plants, etc.
465 4659 46594 Wholesale of construction and civil engineering machinery and equipment
681 6810 68100 Real estate activities with own or leased property
711 7110 71100 Architectural and engineering activities and related technical consultancy

20
8. List three key products/services that the Company manufactures/provides (as in balance sheet)
1. Construction and project-related activity
2. Manufacturing and trading activity
3. Engineering services
9. Total number of locations where business activity is undertaken by the Company
i. Number of International Locations: 35
ii. Number of National Locations: 100
10. Markets served by the Company – Local/State/National/International/: All
SECTION B: FINANCIAL DETAILS OF THE COMPANY
1. Paid up Capital: ` 186.59 Crores
2. Total Turnover: ` 66301.35 Crores
3. Total Profit After Taxes: ` 5453.74 Crores
4. Total Spending on Corporate Social Responsibility (CSR) as percentage of profit after tax: 1.85 %. As per the Section 135 of The Companies Act 2013, the CSR spend is 2.04% of average Net Profit
of the previous three financial years
5. List of activities in which expenditure in 4 above has been incurred: Our focus areas in Corporate Social Responsibility are as follows: i. Water & Sanitation ii. Health iii. Education iv. Skill Development
SECTION C: OTHER DETAILS
1. Does the Company have any Subsidiary Company/ Companies? Yes.
2. Do the Subsidiary Company/Companies participate in the BR Initiatives of the parent company? If yes, then indicate the number of such subsidiary company(s): Yes. The Business Responsibility (BR) initiatives of the company are extended to the Subsidiary/Associate
Companies including major subsidiaries like L&T Hydrocarbon Engineering. In addition, these subsidiaries are
also encouraged to take various other initiatives. L&T Infotech made its stock market debut on July 21, 2016
at the National Stock Exchange in Mumbai and its shares have been listed on NSE and BSE. Since 2016-17 L&T
Infotech will have a separate Business Responsibility Report as part of its annual report.
3. Do any other entity/entities (e.g. suppliers, distributors, etc.) that the Company does business with participate in the BR initiatives of the Company? If yes, then indicate the percentage of such entity/entities. [Less than 30%, 30-60%, More than 60%]:Yes. The Company promotes BR initiatives in its value chain. At present, less than 30% of its suppliers/
distributors participate in BR initiatives.

21
SECTION D: BR INFORMATION
1. Details of Director/Directors responsible for BR
a) Details of the Director/Directors responsible for implementation of the BR policy/policies
• DIN Number: Not Applicable, being an EMC member
• Name: Dr. Hasit Joshipura
• Designation: Head - Corporate Centre & Member of the Executive Management Committee (EMC)
b) Details of the BR head
2a. Principle-wise (as per NVGs) BR Policy/policies (Reply in Y/N)
Name of principles:
P1 – Businesses should conduct and govern themselves with Ethics, Transparency and Accountability
P2 – Businesses should provide goods and services that are safe and contribute to sustainability throughout their
life cycle
P3 – Businesses should promote the well-being of all employees
P4 – Businesses should respect the interests of, and be responsive towards all stakeholders, especially those who
are disadvantaged, vulnerable and marginalized
P5 – Businesses should respect and promote human rights
P6 – Businesses should respect, protect, and make efforts to restore the environment
P7 – Businesses, when engaged in influencing public and regulatory policy, should do so in a responsible manner
P8 – Businesses should support inclusive growth and equitable development
P9 – Businesses should engage with and provide value to their customers and consumers in a responsible manner
S. No Particulars Details
1 DIN Number (If applicable) Not Applicable
2 Name Major General Gautam Kar (Retd.)
3 Designation Head Corporate Infrastructure & Administrative Services
4 Telephone Number +91-22-67052447
5 Email ID [email protected]
S. No (A) Details of Compliances(Reply in Yes/No)
P1 P2 P3 P4 P5 P6 P7 P8 P9
1 Do you have a policy/policies for Y Y Y Y Y Y Y Y Y
2 Has the policy been formulated in consultation with the relevant stakeholders?
Y Y Y Y Y Y Y Y Y
3 Does the policy conform to any national/international standards? If yes, specify.(50 words)
Yes. The policies are aligned with the principles of NVG guidelines and
conform to international standards of ISO 9001, ISO 14001, OHSAS 18001
and ILO principles.
4 Has the policy been approved by the Board?Yes. Has it been signed by MD/Owner/CEO/Appropriate Board Director?Signed by the Group Executive
Chairman
Y Y Y Y Y Y Y Y Y

22
2b. If answer to question at Serial No. 1 against any principle, is ‘No’, please explain why.
(Tick up to 2 options)
3. Governance related to BR
(a) Indicate the frequency with which the Board of Directors, Committee of the Board or CEO meet to assess the
BR performance of the Company: Within 3 months, 3-6 months, Annually, More than 1 year:
Annually
(b) Does the Company publish a BR or a Sustainability Report? What is the hyperlink for viewing this report? How
frequently it is published?
Yes, the Company has been publishing its Sustainability Report annually as per the Global Reporting
Initiative (GRI) framework since 2008. The sustainability reports are externally assured. We are following
GRI – G4 Standard and 2016 report is ‘In Accordance – Comprehensive’ report. The reports can be accessed
at www.lntsustainability.com and sustainabilityreport.larsentoubro.com
S. No Questions P1 P2 P3 P4 P5 P6 P7 P8 P9
5 Does the Company have a specifi ed committee of the Board/ Director/Offi cial to oversee the implementation of the policy? Yes.
Y Y Y Y Y Y Y Y Y
6 Indicate the link for the policy to be viewed online?
www.Lntsustainability.com
7 Has the policy been formally communicated to all relevant internal and external stakeholders?
Y Y Y Y Y Y Y Y Y
8 Does the Company have in-house struc-ture to implement the policy/policies?
Y Y Y Y Y Y Y Y Y
9 Does the Company have a grievance redressal mechanism related to the policy/policies to address stakeholders’ griev-ances related to the policy/policies?
Y Y Y Y Y Y Y Y Y
10 Has the Company carried out independent audit/evaluation of the working of this policy by an internal or external agency?
Y Y Y Y Y Y Y Y Y
S. No Questions P1 P2 P3 P4 P5 P6 P7 P8 P9
1 The Company has not understood the principles
Not Applicable
2. The Company is not at a stage where it fi nds itself in a position to formulate and implement the policies on specifi ed principles
Not Applicable
3. The Company does not have fi nancial or manpower resources available for the task
Not Applicable
4. It is planned to be done within next 6 months
Not Applicable
5. It is planned to be done within the next 1 year
Not Applicable
6. Any other reason (please specify) Not Applicable
23
This committee also functions as the Apex Body
to interact, inform, advice and coordinate with
the Executive Management Committee (EMC)
on all issues relating to the Code of Conduct.
The committee constitutes of a minimum of five
senior members and meets at least twice a year.
The Compliance officer acts as the Ex-Officio
Secretary of the Apex Committee. At the unit level
we have Unit Level CoC Committee consisting of
at least four members, headed by the Unit Head
with Head of Accounts, Head of HR and a senior
person from Operations. The Unit Level Committee
meets at least once in a quarter. The Role of the
Committee is creating awareness, motivating
employees to follow Code of Conduct, monitoring
compliance of Code of Conduct and investigating
instances of non-compliance.
SECTION E
PRINCIPLE 1: BUSINESSES SHOULD
CONDUCT AND GOVERN THEMSELVES
WITH ETHICS, TRANSPARENCY AND
ACCOUNTABILITY
Larsen and Toubro stands on a strong base built
by our founders and continues a rich legacy of
fair & transparent governance system, disclosure
practices and integrity. L&T is a professionally
managed Indian multinational, committed to total
customer satisfaction & enhancing stakeholders’
value. The Company’s Vision and Policies extend
to its commitment to fair practices. These are
applicable to all our operations, subsidiaries and
associate companies.
All our employees are guided by the L&T Code
of Conduct, including the Board Members
and Senior Management. The Group Executive
Chairman makes an Annual Declaration to the
shareholders on compliance with the Company’s
CoC by the senior management. L&T is committed
to the philosophy of conducting business in an
ethical manner with respect for human values,
individual dignity and professional conduct. The
Code of Conduct is featured on the Company’s
website – www.larsentoubro.com and Intranet.
New employees are introduced and trained on
the Code of Conduct through a detailed online
module of the Company’s Any Time Learning
(ATL) System. The critical areas of the Code of
Conduct are also included in the HR Orientation
Training – Swagat and Prayag for GET/PGET. In a
unique initiative, each employee of the Company is
required to confirm their acceptance of the ‘Code
of Conduct’ through a web-portal, this ‘once a
year’ mandatory requirement creates awareness on
the Code of Conduct, policies and guidelines and
imbibes a sense of responsibility in employees for
their actions.
The Code of Conduct (CoC) Apex Committee has
the responsibility to ensure implementation of the
Code of Conduct across the Company, deals with
the instances of non-compliance, and oversees the
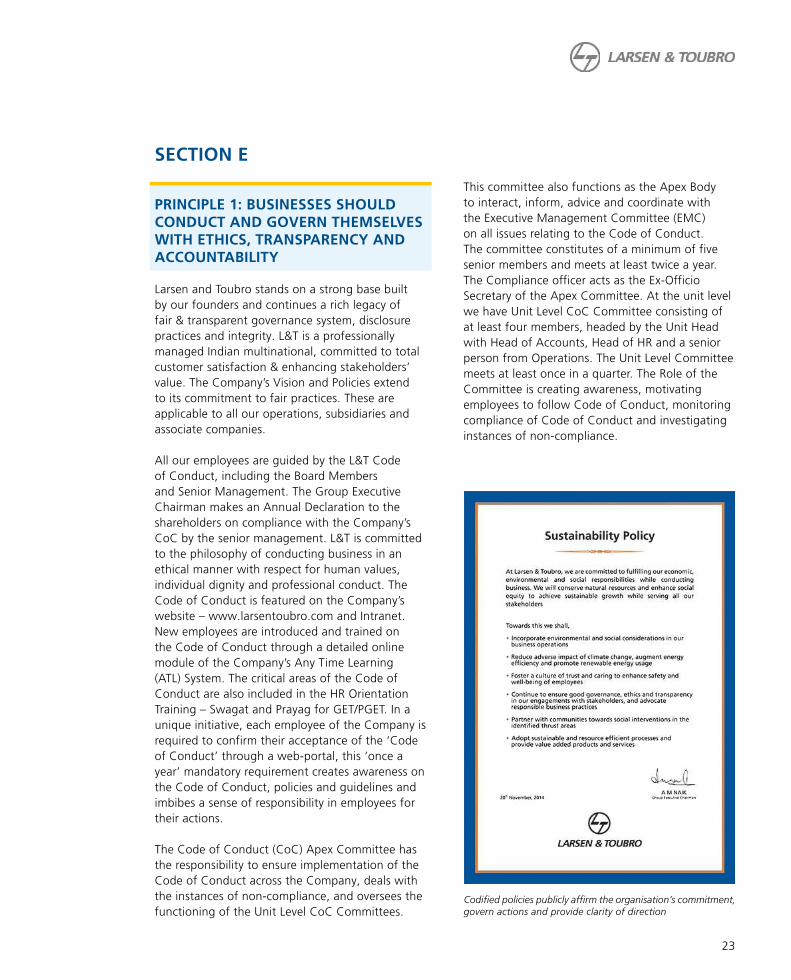
functioning of the Unit Level CoC Committees. Codified policies publicly affirm the organisation’s commitment, govern actions and provide clarity of direction

24
The Company has established a vigil mechanism
for employees and directors to report concerns
about unethical behaviour, actual or suspected
fraud or violation of the company’s code of
conduct or ethics policy. The Whistle Blower Policy
facilitates employees to report without fear, any
wrongdoings or unethical or improper practice
which may adversely impact the image and/or
the financials of the company to Whistle Blowing
Investigation Committee. The management assures
maintaining anonymity of the whistle-blower at
all times. During the year 2016-17 a total of 15
complaints were received, 100% of these were
investigated and dealt with in accordance with the
Company’s protocol and none are under review.
Details relating to stakeholder complaints are
included in the Director’s Report Section of this
Annual Report.
In line with the Company’s Green Supply Chain
Policy, we formulated an ‘Environmental &
Social Code of Conduct for Suppliers’ covering
specific clauses on environmental management
and compliance, human rights, labour practices,
prohibition of child labour, freedom of association
& collective bargaining, prohibition of forced &
compulsory labour, ethics and transparency, and
impact on society. This was applicable during the
period 2012-16, since 2016-17 the ‘Environmental
& Social Code of Conduct for Suppliers’ has been
integrated with the business code of conduct
for suppliers. All new and existing vendors/
suppliers are required to follow the same. Since
2016 the Company has initiated the environment
assessment of suppliers along with organizing
awareness sessions on sustainability for suppliers
and transporters. The Company conducts
capacity-building programmes for vendors and
sub-contractors and provides training on safety,
business efficiency and sustainability.
The brand L&T has been built by implementing
good Corporate Governance practices; which are
imbibed by our employees as a way of life and
create an elevated governance culture.
PRINCIPLE 2: BUSINESSES SHOULD
PROVIDE GOODS AND SERVICES
THAT ARE SAFE AND CONTRIBUTE TO
SUSTAINABILITY THROUGHOUT THEIR
LIFE CYCLE
At L&T, in all our businesses, it is our constant
endeavour to extend safe goods and services that
contribute to sustainability throughout their Life
cycle. Our portfolio includes projects, products and
services covering Infrastructure projects, Power
projects, Heavy Engineering products, Electrical
& Automation (E&A) products, Metallurgical &
Material Handling (MMH) products and services,
Hydrocarbon Projects, IT & Technological
Services, and Financial Services. We ensure that
sustainability aspects, risks and opportunities
are integrated into our engineering and design.
L&T also offers comprehensive training to our
customer’s personnel.
Our construction & infrastructure projects
along with our campuses ensure minimal
environmental footprint and safe operations
and enhance community value. At our campuses
we currently have 17 green buildings including
one Green Factory, all our 24 campuses are now
water positive and have achieved zero waste
water discharge status. Energy efficiency and
carbon footprint reduction are given substantial
importance during the course of production.
Artist’s impression of football stadium being built in Qatar, incorporating design and processes to minimize environmental impact

25
Terminal 2 - Mumbai Airport built by L&T has won numerous awards for user-friendliness, sustainability and innovative construction techniques.
Apart from these initiatives, the Company offers
products and services focused on sustainability
and infrastructure with low environmental impact.
These include technology solutions with lower
carbon emissions, less water consumption, lesser
air pollution, energy efficiency improvement,
clean energy and resource conservation. These
products help reduce the customers environmental
impact. The portfolio covers Green Buildings,
Mass Rapid Transit Systems like metro and mono
rails, Solar power plants built on EPC basis, fuel
switch projects, coal gasifiers, super critical thermal
power plant & equipment, power transmission
& distribution systems, energy saving electrical &
automation solutions etc. Energy efficient products
and systems from the Electrical & Automation
business cover Power Management Systems, AC
drives, smart metering systems etc.
The Company promotes recycling and use of
alternate materials. As a part of sustainability
roadmap of increasing recycling of products and
industrial waste are practiced at our campuses and
project sites. We utilize alternate materials such
as fly ash, crushed sand, blast furnace slag, steel
scrap, zinc waste etc. Our products are ‘engineered
to order’ based on specific customer requirements,
limiting the scope for material recycling.
PRINCIPLE 3: BUSINESS SHOULD
PROMOTE WELL-BEING OF
EMPLOYEES
Our people are the key to truly leveraging
the potential of the Company’s growth.
The continuous zeal and commitment of our
people powers L&T and we nurture this with
training, motivation, leadership development and
performance rewards. The Company’s Corporate
Human Resource Policy sets a robust framework
for people management. Apart from this, we
have the Corporate Environment, Health & Safety
(EHS) Policy, Whistle Blower Policy, Protection of
Women’s Rights at Workplace Policy, and code
of conduct for protection of human rights.
L&T is a merit-based organisation and
discrimination of any form based on caste,
religion, region, gender or physical disability is not
permitted. We remain committed to the United
Nations Global Compact principles and Human
Rights clauses are also included in the contracts
with vendors and partners, extending these to
our supply chain. L&T directly employs 85 persons
with disabilities. The value chain also employs 48
persons with disabilities. The Company recognizes
employee unions and associations affiliated with
different trade unions at its manufacturing facilities
and 7.82% of permanent employees are covered
under this category. No complaints were received
during the year, relating to child labour, forced
labour, involuntary labour or sexual harassment
at the workplace.
L&T
employees
Refer “Standalone fi nancials –
10-year Highlights” section of
Annual Report
Number of
permanent
women
employees
2,029
Contract
workmen
282,311

26
At L&T regular training and exposure to the
challenges of tomorrow are important elements
of an employee’s career graph. Employees are
provided with adequate continuous trainings
on functional and behavioural areas. L&T offers
its employees with opportunities to pursue
higher education through corporate tie-ups and
sponsorships with reputed colleges.
L&T’s Leadership Development Academy (LDA)
at Lonavala is recognised as a unique corporate
university in India, collaborating with the world’s
most reputed institutions to provide a global
exposure. Apart from this, a wide range of
technical, functional as well as managerial training
is imparted to the employees through Technical
training centres at Mumbai (Madh, Mahape)
& Project Management Institute (Vadodara &
Chennai).
Safety is another area of significance and we
work towards continuous improvement for
Zero Harm. With ‘Zero Harm’ we aim to build
a workplace environment which supports the
health and safety of our people and minimises
the impact our business has on the environment.
Zero harm means no harm to anyone, anytime,
anyone associated with us. Regular safety training,
tool box talks, mock drills and specific safety
interventions are undertaken to build a safe work
culture within the organization. New employees
are introduced on the aspects of safety and all
contract workmen receive mandatory safety
training before commencing work. More than 3.7
million man hours of safety training was provided
in FY 2016-17 to our workforce. The safety
performance of the Company is reviewed by the
L&T Board during the quarterly Board meetings.
Working on Wellness is our exclusive platform
through which we offer programs, counselling,
awareness sessions, diagnostic camps, workshops,
activities targeted at employee health and wellness
at office. The interventions are grouped in six
critical areas – cancer, diabetes, cardiac disease,
obesity, ergonomic issues and stress.
PRINCIPLE 4: BUSINESSES SHOULD
RESPECT THE INTERESTS OF, AND
BE RESPONSIVE TOWARDS ALL
STAKEHOLDERS, ESPECIALLY THOSE
WHO ARE DISADVANTAGED,
VULNERABLE AND MARGINALIZED
The Company has mapped its internal and external
stakeholders along with the disadvantaged,
vulnerable & marginalized stakeholders. This
mapping gives us an understanding that our
stakeholders form a vast and heterogeneous
community with wide-ranging expectations. It
is our constant endeavor to match these. Our
stakeholders are at the core of our decision-making
process and the Company engages with them
regularly through various engagement programs.
At L&T we conduct business professionally to
create value for all stakeholders ensuring that we
are a responsible partner that serves the wider
interests of society. The Company has a dedicated
Corporate Brand Management & Communications
department which facilitates an on-going dialogue
between the organization and its stakeholders.
We run specific programs under our “Corporate
Social Responsibility (CSR)” umbrella focused on
benefitting the disadvantaged, vulnerable and
marginalized communities. Our CSR projects not
only run around our operations, but are extended
much beyond that. One of our key focus areas
is the ‘Integrated Community Development’
L&T’s Learning & Development Academy is a one of its kind destination, designed to power corporate training at various levels.

27
programme in which we are working to improve
the overall quality of life of the people living in
the most water stressed regions of India. We work
on providing clean drinking water, sanitation,
education, health and skill building. L&T is a
pioneer in launching an anti-depression help-line
for its employees in India, in collaboration with
TISS.
External Stakeholders
Stakeholders Engagement Modes
Shareholders and investors
Press Releases, Info desk - an online service, dedicated Email Id for investor grievances, Quarterly Results, Annual Reports, Sustainability Reports, AGM (Shareholders interaction), Investors meet and shareholder visit to works, corporate website.
Suppliers/ Contractors
Regular supplier, dealer and stockiest meets
Media Press Releases, Quarterly Results, Annual Reports, Sustainability Reports, AGM (Shareholders interaction), Access information & respond to queries
Community Periodic feedback mechanism
Customers Regular business interactions, Client satisfaction surveys
Government Press Releases, Quarterly Results, Annual Reports, Sustainability Reports
For Internal Stakeholders
Employees Employee satisfaction surveys
Employee engagement surveys for further improvement in employees' engagement process
Circulars, Messages from Corporate and Line Management
Corporate Social initiatives
Welfare initiatives for employees and their families
Online news bulletins to convey topical developments
A large bouquet of print and on-line in-house magazines - some location-specifi c, some business-specifi c, a CSR program newsletter.
L&T Helpdesk, toll free number
PRINCIPLE 5: BUSINESSES SHOULD
RESPECT AND PROMOTE HUMAN
RIGHTS
With global activities and customers in over 30
countries around the world, L&T will inevitably
be confronted with human rights issues. The
Company is a member of the Global Compact
Network India and commits to honor human rights
within its operations. Further, the Human Rights
policies are extended and strictly adhered to within
our Subsidiary and Associate companies.
Human rights are an important part of the Code
of Conduct and Corporate Human Resource Policy
of the Company. Human Rights cover the issues
of prohibition of child labour, prohibition of forced
& compulsory labour, nondiscrimination, freedom
of association and collective bargaining. We also
have the Policy on Protection of Women’s Rights
at workplace for addressing sexual harassment at
workplace. We follow the Universal Declaration
of Human Rights, the ILO Core Conventions on
Labour Standards and the UN Global Compact. Workforce taking the Safety Pledge at one of L&T’s campuses.

28
Also, all our campuses continue to be
zero wastewater discharge units since 2014.
We are committed to the eight missions of
the National Action Plan on Climate Change
(NAPCC) instituted by the Government of India.
Progressively, we have been investing in products
and processes that promote sustainable growth -
enhancing energy security, developing low-carbon
technologies for building infrastructure, spreading
sustainability knowledge and increasing green
cover. The Company annually reports its carbon
emissions to the Carbon Disclosure Project since
2009.
The Company works in compliance with
applicable laws. Regular checks are conducted by
independent auditors to ensure compliance with
environmental regulations and compliance reports
are submitted to Central Pollution Control Board
(CPCB) / State Pollution Control Boards (SPCB) as
applicable. During the financial year, there are no
pending or unresolved show cause/legal notices
from CPCB/SPCB.
We strive to increase the share of renewable
energy in our overall energy mix. Three campuses
are sourcing wind energy from external suppliers,
while 18 campuses are generating renewable
energy on-site.
At L&T, we understand the importance of
biodiversity. Every year we plant trees at our
We ensure that employees are sensitized to
human rights clauses through training programs,
interactive sessions, Intranet, policy manuals and
posters. Apart from this, the Company complies
with the applicable local laws and regulatory
requirements such as the Factories Act 1948,
Building & Other Construction Workers (Regulation
of Employment &Conditions of Service) Act 1996,
Central Rules 1998 and Industrial Disputes Act
1947. There were no reported complaints related
to human rights violations during the year.
We propagate our human rights values across the
supply chain through our ‘Environmental & Social
Code of Conduct’ for our suppliers and extend
the same to our sub-contractors as part of their
contract documents.
PRINCIPLE 6: BUSINESS SHOULD
RESPECT, PROTECT, AND MAKE
EFFORTS TO RESTORE THE
ENVIRONMENT
L&T recognizes the importance of environment
preservation. Our Corporate Environment, Health
and Safety (EHS) Policy plays a vital role in defining
the choices we make. Since 2009, we have been
setting measurable targets and developing action
plans for successive three-year Sustainability
Roadmaps covering efforts to mitigate our impact.
The Company identifies potential environmental
risks and opportunities in its operations and its
Subsidiary and Associate Companies and acts
towards these. Key suppliers are also encouraged
to follow our practices.
With all our efforts across the years, we are able
to achieve a ‘Water Positive’ Status for all 24
campuses of L&T in India. Water Assessment was
conducted for all campuses, rain water harvesting
structures, and community based water harvesting
structures covering check dams and other water
storage structures. We were able to demonstrate
significant water conservation efforts at campuses
along with well-planned and implemented
community water harvesting, benefitting society. L&T is leading the way in renewable energy as India’s largest solar power systems integrator

29
campuses and engage with organisations to
conduct plantation at National Parks within the
Country. This year we have planted more than
1.85 lakh trees across L&T’s campuses and project
sites, taking the tally to 5 lakh trees in last five
years. Also, the Company has embarked on a
journey towards creating self-sustaining forests
through the Miyakwaki Technique and has planted
its first forest.
PRINCIPLE 7: RESPONSIBLE PUBLIC
ADVOCACY
L&T actively participates in industrial forums
and professional bodies to engage in proactive
dialogue and have an understanding of policies
and expectations of stakeholders. The senior
leadership team offers their expertise and insights
during public policy formulation. Following are
some of the Institutes and industrial forums where
L&T actively participates.
• Association of Business Communicators of India
• Associated Chambers of Commerce and Industry of India (ASSOCHAM)
• Bombay Chamber of Commerce & Industry (BCCI)
• Bureau of Indian Standards
• Construction Industry Development Council (CIDC)
• Confederation of Indian Industry (CII), Centre of Excellence for Sustainable Development (CESD)
• CII – Green Business Centre (GBC)
• Federation of Indian Chambers of Commerce and Industry (FICCI)
• Indian Electrical and Electronics Manufacturers Association
• Indian Institute of Chemical Engineers (IIChE)
• National Safety Council
• National Fire Protection Institution
The Company also interacts regularly with Indian
Institute of Corporate Affairs (IICA) for CSR related
aspects, Confederation of Indian Industry Centre of
Excellence for Sustainable Development (CII-CESD)
on Sustainability policies and regulations. We are
also part of the working teams on Environmental &
recycling council of CII, CII – Green Business Centre
(GBC), Environment, Health & Safety (EHS), energy
conservation and Corporate Social Responsibility
(CSR).
PRINCIPLE 8: SUPPORT INCLUSIVE
GROWTH
L&T has the following corporate policies
that support inclusive growth and equitable
development:
• Sustainability Policy
• Corporate Environment, Health & Safety (EHS)
Policy
• Corporate Social Responsibility (CSR) Policy
• Corporate Human Resource Policy
• Code of Conduct
It is an integral part of L&T’s business model to
plough back a portion of the wealth generated
into the society. The Company’s CSR Programs
are derived from the theme ‘Building India’s Social
Infrastructure’ with an objective to contribute to
society and make a meaningful, sustainable and
positive impact. We work in 4 thrust areas: water
& sanitation, education, health and skill-building.
Tree-planting is an ongoing activity at L&T - from VIP visitors to community and mass plantation initiatives.

30
Health
• Affordable community health centres
• Focus on reproductive health, diagnostic and
clinical camps, maternal and child health care,
immunization and health education, HIV/AIDS
management
• Artificial kidney dialysis centres
• Mobile health vans.
Skill Development
• Free training to rural and urban youth
• Construction Skills Training Institutes (CSTIs)
• Collaboration with ITIs.
• Vocational institutes programs for women:
Tailoring, beautician’s courses, home nursing
and food processing
Thrust area-wise CSR beneficiaries are
as follows,
Water & Sanitation: 1,07,253
Health: 9,93,878
Education: 3,32,013
Skill Development (Including CSTI, vocational
training and Neev): 34,696
Total 14,67,840
The Company contributed ` 100.77 crores in
2016-17 towards social development as per
The Company’s Act 2013.
Water & Sanitation
• Efforts to provide access to safe drinking water
• Working in water-stressed communities of Tamil
Nadu, Maharashtra and Rajasthan.
• Integrated Community Development
Programme
• Building check dams, field bunds, and soil and
water conservation structures.
• Enabling the community to build and utilize
sanitation facilities.
Education
• Providing primary education
• Developing infrastructure
• Enhancing learning experience & learning rates
• Innovative learning methodologies, computer
laboratories, teaching aids and build teacher
capacity.
• Science-on-Wheels van
• Summer camps, sports activities & Extra
curricular outings to widen children’s horizons.
• Employee volunteering
L&T helps build India’s Social Infrastructure through health, education and skill-building initiatives.

31
PRINCIPLE 9: ENGAGE WITH AND
PROVIDE VALUE TO CUSTOMERS
At L&T, we constantly innovate to offer the latest
engineering, technological and service solutions,
to provide value to our customers. Our offerings
diversify with the changing market trends and we
keep abreast with the way world moves through
investment in R&D, training, design facilities,
superior manufacturing and testing processes.
Health & Safety concerns are integral throughout
product /services life cycle. Our products carry
suitable labeling and are accompanied by
operation and maintenance manuals in line with
relevant codes and specifications. Similar clarity is
maintained across all our projects through signage
systems. Products are tested and benchmarked
against stringent national and international
standards such as Bureau of Indian Standards,
International Organization for Standardization
and International Electro Technical Commission.
L&T’s green products and services portfolio helps
customer to reduce their energy and water
consumption and help then to follow low carbon
approach.
We engage with customers through regular
customer meets, customer satisfaction surveys,
training programs for customer representatives
and market based research. Customer complaints,
comments and suggestions are systematically
addressed. The high percentage of our repeat
orders is a reliable indication of customer
satisfaction and confidence in L&T’s products,
projects and services.
All norms, standards and voluntary codes and
guidelines related to marketing communication
are adhered to. The brand management
guidelines institutionalized by L&T’s Corporate
Brand Management & Communications (CBMC)
department authenticate communications and help
customers identify and distinguish the Company’s
products.
Regarding unfair trade practices, irresponsible
advertising and or anti-competitive behavior, no
stakeholder has filed a case against the Company
in the last five years and there are no pending
cases as on 31st March, 2017.
From engineering design to high-tech testing facilities, L&T offers end-to-end solutions that create value for our customers.

32
QuestionReference
Section Page Number
Section A : General Information about the Company
1. Corporate Identity Number (CIN) of the Company2. Name of the Company3. Registered Address4. Website5. Email id6. Financial Year Reported7. Sector(s) that the Company is engaged in (industrial activity code-wise)
AR 19
AR 19
AR 19
AR 19
AR 19
8. List three key products/services that the Company manufactures/provides (as in balance sheet)9. Total number of locations where business activity is undertaken by the Company
AR 20
i. Number of International Locations (Provide details of major 5 AR 20
ii. Number of National Locations AR 20
Markets served by the Company – Local/State/National/International AR 20
Section B: Financial Details of the Company
1. Paid up Capital (INR) AR 20
2. Total Turnover (INR)3. Total profi t after taxes (INR)
AR 20
4. Total spending on Corporate Social Responsibility (CSR) as percentage of profi t after tax (%)
AR 20
5. List of activities in which expenditure in 4 above has been incurred: - AR 20
Section C : Other Details
1. Does the Company have any Subsidiary Company/ Companies? AR 20
2. Do the Subsidiary Company/Companies participate in the BR Initiatives of the parent company? If yes, then indicate the number of such subsidiary company(s)3. Do any other entity/entities (e.g. suppliers, distributors etc.) that the Company does business with, participate in the BR initiatives of the Company? If yes, then indicate the percentage of such entity/entities. [Less than 30%, 30-60%, More than 60%]
AR 20
Section D: BR Information
1. Details of Director/Directors responsible for BRa) Details of the Director/Director the BR policy/policies • DIN Number • Name • Designationb) Details of the BR head • DIN Number (if applicable) • Name • Designation • Telephone number • e-mail ID
AR 21
3. Governance Related to BRIndicate the frequency with which the Board of Directors, Committee of the Board or CEO to assess the BR performance of the Company. Within 3 months, 3-6 months, Annually, More than 1 year
AR 22
ANNEXURE: MAPPING TO THE SEBI FRAMEWORK

33
QuestionReference
Section Page Number
Does the Company publish a BR or a Sustainability Report? What is the Hyperlink for viewing this report? How frequently it is published?
AR 22
Section E : Principle-wise Performance
Principle1: Ethics, Transparency and Accountability
Does the policy relating to ethics, bribery and corruption cover only the company?Does it extend to the Group/Joint Ventures/ Suppliers/Contractors/NGOs /Others?
AR 23-24
How many stakeholder complaints have been received in the past fi nancial year and what percentage was satisfactorily resolved by the management?
The details related to stakeholder complaints
are included in the Director’s Report
Section of this Annual Report
Principle 2 : Sustainable Products and Services
List up to 3 of your products or services whose design has incorporated social or environmental concerns, risks and/or opportunities.
AR 24-25
For each such product, provide the following details in respect of resource use(energy, water, raw material etc.) per unit of product (optional):
AR 24-25
Does the company have procedures in place for sustainable sourcing (including transportation)?
AR 24-25
Has the company taken any steps to procure goods and services from local & small producers, including communities surrounding their place of work?
AR 24-25
If yes, what steps have been taken to improve their capacity and capability of local and small vendors?
AR 24-25
Does the company have a mechanism to recycle products and waste? If yes what is the percentage of recycling of products and waste (separately as <5%, 5-10%, >10%). Also, provide details thereof, in about 50 words or so.
Green buildings constructed by the Building & Factories
business part of Construction Business
help customers to reduce energy and
water consumption, utilize recycled material
and locally source most of construction
material. The Company is a leading EPC solution provider
for Solar Photo Voltaic (PV) based
power plants helping customers save on the energy bills and
contribute to reduction of GHG emissions
from consumption of indirect energy.
24-25

34
QuestionReference
Section Page Number
Principle 3: Employee Well Being
Total number of employees.Total number of employees hired on temporary/contractual/casual basis.Number of permanent women employees.Number of permanent employees with disabilitiesDo you have an employee association that is recognized by management?What percentage of your permanent employees is members of this recognized employee association?
AR 25-26
Please indicate the Number of complaints relating to child labour, forced labour, involuntary labour, sexual harassment in the last fi nancial year and pending, as on the end of the fi nancial year.
AR 25-26
What percentage of your undermentioned employees were given safety and skill upgradation training in the last year?
AR 25-26
Principle 4: Valuing Marginalized Stakeholders
Has the company mapped its internal and external stakeholders? AR 26-27
Out of the above, has the company identifi ed the disadvantaged, vulnerable & marginalized stakeholders?Are there any special initiatives taken by the company to engage with the disadvantaged, vulnerable and marginalized stakeholders?
AR 26-27
Principle 5: Human Rights
Does the policy of the company on human rights cover only the company or extend to the Group/Joint Ventures/Suppliers/Contractors/NGOs/Others?
AR 27-28
How many stakeholder complaints have been received in the past fi nancial year and what percent was satisfactorily resolved by the management?
AR 27-28
Principle 6: Environment
Does the policy related to Principle 6 cover only the company or extends to the Group/Joint Ventures/Suppliers/Contractors/NGOs/others?
AR 28-29
Does the company have strategies/ initiatives to address global environmental issues such as climate change, global warming, etc?
AR 28-29
Does the company identify and assess potential environmental risks? AR 28-29
Does the company have any project related to Clean DevelopmentMechanism?
No -
Has the company undertaken any other initiatives on – clean technology,energy effi ciency, renewable energy, etc.? Y/N.
AR 28-29
Are the Emissions/Waste generated by the company within the permissible limits given by CPCB/SPCB for the fi nancial year being reported?
Number of show cause/ legal notices received from CPCB/SPCB which are pending (i.e. not resolved to satisfaction) as on end of Financial Year.
AR 28-29

35
QuestionReference
Section Page Number
Principle 7: Policy Advocacy
Is your company a member of any trade and chamber or association? If Yes, Name only those major ones that your business deals with:Have you advocated/lobbied through above associations for the advancement or improvement of public good?
AR 29
Principle 8: Inclusive Growth
Does the company have specifi ed programmes/initiatives/projects inpursuit of the policy related to Principle 8?
AR 29
Are the programmes/projects undertaken through in-house team/own foundation/external NGO/government structures/any other organisation?
AR 30
Have you done any impact assessment of your initiative? AR 30
What is your company’s direct contribution to community development projects - Amount in INR and the details of the projects undertaken.
AR 30
Have you taken steps to ensure that this community development initiative is successfully adopted by the community?
AR 30
Principle 9: Customer Welfare
What percentage of customer complaints/consumer cases are pending as on the end of fi nancial year.
The details related to stakeholder complaints
are included in the Director’s Report Section of this Annual Report.
Does the company display product information on the product label, over and above what is mandated as per local laws?
AR 31
Is there any case fi led by any stakeholder against the company regarding unfair trade practices, irresponsible advertising and/or anti-competitive behavior during the last fi ve years and pending as of end of fi nancial year?
AR 31

36
STANDALONE FINANCIALS-10 YEAR HIGHLIGHTS
` crore
Ind AS IGAAP
Description 2016-17 2015-16 2014-15 2013-14 2012-13 2011-12 2010-11 2009-10 2008-09 2007-08
$$
Statement of Profit and Loss
Gross revenue from operations 66301 63813 57558 57164 52196 53738 44296 37356 34337 25342
PBDIT^^ 6425 5829 6488 6667 5473 6283 5640 4816 3922 2969
Profit after tax (excluding
extraordinary/exceptional items) 4560 4454 4699 4905 4169 4413 3676 3185 2709 2099
Profit after tax (including
extraordinary/exceptional items) 5454 5000 5056 5493 4384 4457 3958 4376 3482 2173
Balance Sheet
Net worth 46013 42135 37085 33662 29291 25223 21846 18312 12460 9555
Deferred tax liability/(asset) [net] (285) (156) 363 410 290 133 263 77 48 61
Loan funds 10581 13924 12936 11459 8478 9896 7161 6801 6556 3584
Capital employed 56309 55903 50384 45531 38059 35252 29270 25190 19064 13200
Ratios and statistics
PBDIT as % of net revenue from
operations @ 9.78 9.23 11.38 11.78 10.60 11.82 12.84 13.00 11.56 11.87
PAT as % of net revenue from
operations $ 8.30 7.91 8.87 9.71 8.50 8.38 9.01 11.82 10.26 8.69
RONW % * 12.37 12.39 14.30 17.46 16.06 18.95 19.73 28.49 31.71 29.21
Gross Debt: Equity ratio 0.23:1 0.33:1 0.35:1 0.34:1 0.29:1 0.39:1 0.33:1 0.37:1 0.53:1 0.38:1
Basic earnings per equity share (`) #^ 58.49 53.71 54.46 59.36 53.33 48.61 43.55 49.18 39.67 25.20
Book value per equity share (`) ##^ 493.19 452.35 398.78 362.95 317.09 274.35 238.96 202.46 141.54 108.63
Dividend per equity share (`) ##^ 21.00 18.25 16.25 14.25 12.33 11.00 9.67 8.33 7.00 5.67
No. of equity shareholders 923628 10,28,541 8,53,824 832,831 854,151 926,719 8,53,485 8,14,678 9,31,362 5,78,177
No. of employees 41,466 43,354 44,081 54,579 50,592 48,754 45,117 38,785 37,357 31,941
Figures for 2016-17 & 2015-16 are as per Ind AS and for earlier periods as per IGAAP and hence not directly comparable
^^ Profit before depreciation, interest and tax (PBDIT) is excluding extraordinary/exceptional items wherever applicable and other income.
@ PBDIT as % of net revenue from operations =[(PBDIT)/(gross revenue from operations less excise duty)].
$ Profit After Tax (PAT) as % of net revenue from operations =[(PAT including extraordinay /exceptional items )/(gross revenue from opertions less excise
duty)].
* RONW [(PAT including extraordinary/exceptional items)/(average net worth excluding revaluation reserve and miscellaneous expenditure)].
# Basic earnings per equity share have been calculated including extraordinary/exceptional items and adjusted for all the years for issue of bonus shares/
restructuring during the respective years.
## After considering adjustments for issue of bonus shares/restructuring during the respective years upto 2015-16.
$$ Figures for the year 2007-08 to 2011-12 include Hydrocarbon business which has been transferred w.e.f April 1, 2013 to a wholly owned subsidiary.
^ The Board of Directors has recommended for the approval of shareholders, the issue of bonus equity shares in the ratio of 1:2 (one bonus equity share
of ` 2 each for every two equity shares of ` 2 each held). Accordingly, the figures for 2016-17 are based on number of equity shares before the proposed
bonus issue.

37
CONSOLIDATED FINANCIALS-10 YEAR HIGHLIGHTS
` crore
Ind AS IGAAP
Particulars 2016-17 2015-16 2014-15 2013-14 2012-13 2011-12 2010-11 2009-10 2008-09 2007-08
Statement of Profit and Loss
Gross revenue from operations 110011 101975 92762 85889 75195 64960 52470 44310 40932 29819
PBDIT^^ 11075 10463 11258 10730 9929 8884 7677 6423 5024 3706
Profit attributable to Group shareholders (excluding
extraordinary/exceptional items)
5920 4154 4470 4547 4911 4649 4238 3796 3007 2304
Profit attributable to Group shareholders (including
extraordinary/exceptional items)
6041 4233 4765 4902 5206 4694 4456 5451 3789 2325
Balance Sheet
Net worth 50217 44180 40909 37712 33860 29387 25051 20991 13988 10831
Non-controlling interest 3564 2893 4999 3179 2653 1753 1026 1087 1059 923
Deferred tax liability/(asset) [net] (1125) (736) (185) 337 184 82 311 153 131 122
Loan funds 93976 88135 90571 80330 62672 47150 32798 22656 18400 12120
Capital employed 146632 134472 136294 121558 99369 78372 59186 44887 33578 23996
Ratios and statistics
PBDIT as % of net revenue from operations @ 10.13 10.35 12.24 12.60 13.33 13.81 14.75 14.61 12.40 12.58
PAT as % of net revenue from operations $ 5.53 4.19 5.18 5.76 6.99 7.30 8.56 12.40 9.35 7.89
RONW % ** 12.80 9.91 12.13 13.71 16.47 17.26 19.38 31.23 30.64 26.92
Gross Debt: Equity ratio 1.75:1 1.87:1 2.21:1 2.13:1 1.85:1 1.61:1 1.31:1 1.08:1 1.32:1 1.12:1
Basic earnings per equity share (`) # ^ 64.80 45.48 51.33 52.97 56.53 51.21 49.04 61.27 43.17 26.96
Book value per equity share (`) ## ^ 538.25 474.30 439.93 406.65 366.59 319.64 273.97 232.04 158.84 122.87
Dividend per equity share (`) ## ^ 21.00 18.25 16.25 14.25 12.33 11.00 9.67 8.33 7.00 5.67
Figures for 2016-17 & 2015-16 are as per Ind AS and for earlier periods as per IGAAP and hence not directly comparable
^^ Profit before depreciation, interest and tax [PBDIT] is excluding extraordinary/exceptional items wherever applicable and other income.
@ PBDIT as % of net revenue from operations =[PBDIT/gross revenue from operations less excise duty].
$ PAT as % of net revenue from operations = [PAT including extraordinary/exceptional items/gross revenue from operations less excise duty].
** RONW [(profit attributable to group shareholders including extraordinary/exceptional items)/(average net worth excluding revaluation reserve and
miscellaneous expenditure)].
# Basic earnings per equity share has been calculated including extraordinary/exceptional items and adjusted for all the years for issue of bonus shares/
restructing during the respective years.
## After considering issue of bonus shares/restructuring during the respective years upto 2015-16.
^ The Board of Directors has recommended for the approval of shareholders, the issue of bonus equity shares in the ratio of 1:2 (one bonus equity share
of ` 2 each for every two equity shares of ` 2 each held). Accordingly, the figures for 2016-17 are based on number of equity shares before the proposed
bonus issue.

38
L&T CONSOLIDATED - SEGMENT-WISE REVENUE 2016-17
Infrastructure
Power
Heavy Engineering
Electrical & Automation
Hydrocarbon
IT & Technology Services
Financial Services
Developmental Projects
Others
` crore
Total revenue: ` 110011 crore
5292348%
69396%
31493%
49694%
96029%
97319%
85458%
40284%
101259%
L&T CONSOLIDATED - ORDER INFLOW
150000 –
130000 –
110000 –
90000 –
70000 –
50000 –
30000 –
– 9.0
– 8.5
– 8.0
– 7.5
– 7.0
– 6.5
– 6.0
` c
rore
Perc
en
tag
e
2015-16 2016-17
Order Inflow India GDP growth
136035142995
7.6
7.1
– –
L&T CONSOLIDATED - GROSS REVENUE
FROM OPERATIONS AND PAT
115000 –
110000 –
105000 –
100000 –
95000 –
90000 –
85000 –
80000 –
– 7000
– 6500
– 6000
– 5500
– 5000
– 4500
– 4000
– 3500
` c
rore
` c
rore
2015-16 2016-17Gross revenue from operationsPAT including exceptional items (attributable to owners of the Company)
101975
4233
110011
6041
– –
L&T CONSOLIDATED - PBDIT AS % OF NET REVENUE
FROM OPERATIONS
12000 –
11000 –
10000 –
9000 –
8000 –
7000 –
6000 –
5000 –
4000 –
3000 –
– 16.0
– 14.0
– 12.0
– 10.0
– 8.0
– 6.0
– 4.0
` c
rore
Perc
en
tag
e
2015-16 2016-17
PBDIT PBDIT as % of net revenue from operations
Net revenue from operations and PBDIT exclude exceptional items
10463
10.3
11075
10.1
– –
L&T CONSOLIDATED - ORDER BOOK
310000 –
260000 –
210000 –
160000 –
110000 –
60000 –
` c
rore
As at 31-3-2016 As at 31-3-2017
2490175%
261341
– –
L&T CONSOLIDATED - SEGMENT-WISE ORDER INFLOW 2016-17
Infrastructure
Power
Heavy Engineering
Electrical & Automation
Hydrocarbon
IT & Technology Services
Financial Services
Developmental Projects
Others
` crore
7849255%
28662%
78615%
58184%
1852513%
97317%
85456%
40283%
71285%
Total order inflow: ` 142995 crore

39
L&T CONSOLIDATED - SEGMENT-WISE ORDER BOOK AS AT 31-3-2017
Infrastructure
Power
Heavy Engineering
Electrical & Automation
Hydrocarbon
Others
` crore
19379674%
138245%
119975%
27411%
141595%24823
10%
Total order book: ` 261341 crore
L&T CONSOLIDATED - SEGMENT-WISE EBIDTA MARGINS*
– – – – – – – – – –
Infra
stru
ctur
e
Pow
er
Heav
y En
gine
erin
g
Elec
trica
l &
Auto
mat
ion
Hydr
ocar
bon
IT &
Tech
nolo
gy
Serv
ices
Finan
cial S
ervic
es
Deve
lopm
enta
l Pr
ojec
ts
Oth
ers
25 –
20 –
15 –
10 –
5 –
0 –
Perc
en
tag
e
11.210.2
2.7 3.5
0.6
19.9
12.5
15.1
0.6
6.8
20.5 21.2
18.4
6.8
10.1
2.3
14.6
10.9
* Earnings before interest, depreciation, tax and amortisation as percentage of net segment revenue
2015-16 2016-17
L&T CONSOLIDATED - SEGMENT-WISE ORDER BOOK AS AT 31-3-2016
Infrastructure
Power
Heavy Engineering
Electrical & Automation
Hydrocarbon
Others
` crore
18735475%
184998%
74493%
30591%
171537%15503
6%
Total order book: ` 249017 crore
L&T CONSOLIDATED - SEGMENT-WISE RESULT 2016-17
– – – – – – – – – –
Infra
stru
ctur
e
Pow
er
Heav
y En
gine
erin
g
Elec
trica
l &
Auto
mat
ion
Hydr
ocar
bon
IT &
Tech
nolo
gy
Serv
ices
Finan
cial S
ervic
es
Deve
lopm
enta
l Pr
ojec
ts
Oth
ers
5000 –4500 –4000 –3500 –3000 –2500 –2000 –1500 –1000 –
500 –0 –
` c
rore
4723(50%)
499(5%)
508(5%)
1826(19%)
786(8%) 415
(4%)32(0.3%)
201(2%)
550(6%)
Total segment wise result: ` 9539 croreFigures in brackets represent percentage of segment result to total segment result
L&T CONSOLIDATED - SEGMENT-WISE TOTAL ASSETS
31.03.2016 31.03.2017
– – – – – – – – – –
Infra
stru
ctur
e
Pow
er
Heav
y En
gine
erin
g
Elec
trica
l &
Auto
mat
ion
Hydr
ocar
bon
IT &
Tech
nolo
gy
Serv
ices
Finan
cial S
ervic
es
Deve
lopm
enta
l Pr
ojec
ts
Oth
ers
80000 –
70000 –
60000 –
50000 –
40000 –
30000 –
20000 –
10000 –
0 –
` c
rore 46
688 50
021
7964
6847
5450
5112
4472
4364 61
44
6729
4307 60
86
6421
3 7184
2
2531
528
241
1936
1
1845
9
Total segment wise Assets as at 31.03.2016: ` 183914 crore and as at 31.03.2017: ` 197701 crore
L&T CONSOLIDATED - SEGMENT-WISE TOTAL LIABILITIES
31.03.2016 31.03.2017
– – – – – – – – – –
Infra
stru
ctur
e
Pow
er
Heav
y En
gine
erin
g
Elec
trica
l &
Auto
mat
ion
Hydr
ocar
bon
IT &
Tech
nolo
gy
Serv
ices
Finan
cial S
ervic
es
Deve
lopm
enta
l Pr
ojec
ts
Oth
ers
70000 –
60000 –
50000 –
40000 –
30000 –
20000 –
10000 –
0 –
` c
rore
3024
0
3391
3
7382
6362
3789
3816
1774
1936 45
68
5590
1607
1813
5695
5 6434
1
8548
8931
6880
6845
Total segment wise Liabilities as at 31.03.2016: ` 121743 crore and as at 31.03.2017: ` 133547 crore
Total liabilities for Financial Services and Developmental Projects predominantly comprises of borrowings


41
Notice
NOTICE IS HEREBY GIVEN
THAT the Seventy Second Annual
General Meeting of LARSEN &
TOUBRO LIMITED will be held
at St. Andrews Auditorium, St.
Dominic Road, Bandra (West),
Mumbai - 400050 on Tuesday,
August 22, 2017 at 3.00 P.M. to
transact the following business :-
1) To consider and adopt the
audited financial statements
of the Company for the year
ended March 31, 2017 and
the Reports of the Board of
Directors and Auditors thereon
and the audited consolidated
financial statements of the
Company and the report of the
auditors thereon for the year
ended March 31, 2017;
2) To declare a dividend on equity
shares;
3) To appoint a Director in place
of Mr. Sushobhan Sarker (DIN:
00088276), who retires by
rotation and is eligible for
re-appointment;
4) To appoint a Director in place
of Mr. Shailendra Roy (DIN:
02144836), who retires by
rotation and is eligible for
re-appointment;
5) To appoint a Director in place
of Mr. R. Shankar Raman
(DIN: 00019798), who retires
by rotation and is eligible for
re-appointment;
6) To consider and, if thought
fit, to pass with or without
modification(s) as a SPECIAL
RESOLUTION the following:
“RESOLVED THAT pursuant to
the provisions of Sections 149,
152 and any other applicable
provisions of the Companies
Act, 2013 and the rules
made thereunder read with
Schedule IV to the Companies
Act, 2013 (including any
statutory modification(s) or
re-enactment(s) thereof for
the time being in force) and
SEBI (Listing Obligations and
Disclosure Requirements)
Regulations, 2015 and based
on the recommendation of the
Nomination and Remuneration
Committee and approval
of the Board of Directors,
Mr. Subodh Bhargava (DIN:
00035672) who was appointed
as an Independent Director
of the Company for a term
upto March 29, 2017 by the
shareholders and in respect
of whom the Company has
received a notice in writing
from the Director under Section
160 of the Companies Act,
2013 proposing his candidature
for the office of a Director be
and is hereby re-appointed as
an Independent Director of the
Company for a term of five
years with effect from March
30, 2017 to March 29, 2022“
LARSEN & TOUBRO LIMITEDRegd. Office : L&T House, Ballard Estate, Mumbai 400 001.
CIN : L99999MH1946PLC004768
Email: [email protected] • Website: www.Larsentoubro.com
Tel. No.: 022-67525656 • Fax No.: 022-67525893
7) To consider and, if thought
fit, to pass with or without
modification(s) as an
ORDINARY RESOLUTION the
following:
“RESOLVED THAT pursuant
to Section 196, 197, 203 and
other applicable provisions, if
any, of the Companies Act,
2013 read with Schedule V
of the said Act and the rules
made thereunder, approval
be and is hereby granted
to the appointment of Mr.
S.N. Subrahmanyan (DIN:
02255382) as the Chief
Executive Officer and Managing
Director of the Company with
effect from July 1, 2017 to June
30, 2022.
RESOLVED FURTHER THAT
Mr. S.N. Subrahmanyan in his
capacity as Chief Executive
Officer and Managing Director,
be paid remuneration as may
be fixed by the Board, from
time to time, as prescribed
under the Companies Act, 2013
and within the limits approved
by the members as per the
details given in the explanatory
statement.”
8) To consider and, if thought
fit, to pass with or without
modification(s) as an
ORDINARY RESOLUTION the
following:
AGM Venue :
St. Andrews Auditorium,
St. Dominic Road,
Bandra (West), Mumbai - 400050

42
“RESOLVED THAT Mr. Jayant
Damodar Patil (DIN: 01252184)
who was appointed as an
Additional Director with effect
from July 1, 2017 and holds
office upto the date of this
Annual General Meeting of
the Company, and is eligible
for appointment and in respect
of whom the Company has
received a Notice in writing
from a member under the
provisions of Section 160 of
the Companies Act, 2013
proposing his candidature
for the office of Director, be
and is hereby appointed as a
Director.”
9) To consider and, if thought
fit, to pass with or without
modification(s) as an
ORDINARY RESOLUTION the
following:
“RESOLVED THAT Mr. Arvind
Gupta (DIN: 00090360) who
was appointed as an Additional
Director with effect from July
1, 2017 and holds office upto
the date of this Annual General
Meeting of the Company,and
is eligible for appointment
and in respect of whom the
Company has received a Notice
in writing from a member
under the provisions of Section
160 of the Companies Act,
2013 proposing his candidature
for the office of Director, be
and is hereby appointed as a
Director.”
10) To consider and, if thought
fit, to pass with or without
modification(s) as an
ORDINARY RESOLUTION the
following:
“RESOLVED THAT pursuant
to Sections 196,197,203 and
other applicable provisions, if
any, of the Companies Act,
2013 read with Schedule V
of the said Act and the rules
made thereunder, approval be
and is hereby granted to the
appointment of Mr. Jayant
Damodar Patil (DIN: 01252184)
as the Whole-time Director of
the Company with effect from
July 1, 2017 upto and including
June 30, 2022.
RESOLVED FURTHER THAT
Mr. Jayant Damodar Patil in
his capacity as Whole-time
Director, be paid remuneration
as may be fixed by the Board,
from time to time, as prescribed
under the Companies Act, 2013
and within the limits approved
by the members as per the
details given in the explanatory
statement.”
11) To consider and, if thought
fit, to pass with or without
modification(s) as a SPECIAL
RESOLUTION the following:
“RESOLVED THAT in
supersession of the resolution
no. 17 passed by the Members
at the 71st Annual General
Meeting of the Company held
on August 26, 2016 in this
regard and in accordance with
the provisions of Sections 41,
42, 62 and other applicable
provisions, if any of the
Companies Act, 2013 (including
any statutory modification(s)
or re-enactment(s) thereof
for the time being in force) as
amended from time to time,
Foreign Exchange Management
Act, 1999, Securities and
Exchange Board of India (Issue
of Capital and Disclosure
Requirements) Regulations,
2009 (‘SEBI Regulations’),
SEBI (Listing Obligations and
Disclosure Requirements)
Regulations, 2015, enabling
provisions in the Memorandum
and Articles of Association of
the Company as also provisions
of any other applicable laws,
rules and regulations (including
any amendments thereto or
re-enactments thereof for
the time being in force) and
subject to such approvals,
consents, permissions and
sanctions of the Securities
and Exchange Board of India
(SEBI), Government of India
(GOI), Reserve Bank of India
(RBI) and all other appropriate
and/or concerned authorities,
or bodies and subject to such
conditions and modifications,
as may be prescribed by
any of them in granting
such approvals, consents,
permissions and sanctions
which may be agreed to by
the Board of Directors of the
Company (‘Board’) (which term
shall be deemed to include
any Committee which the
Board may have constituted or
hereafter constitute for the time
being exercising the powers
conferred on the Board by this
resolution), the Board be and
is hereby authorized to offer,
issue and allot in one or more
tranches, to Investors whether
Indian or Foreign, including
Foreign Institutions, Foreign
Institutional Investors, Foreign
Portfolio Investors, Foreign
Venture Capital Fund Investors,
Venture Capital Funds, Non-
resident Indians, Corporate
Bodies, Mutual Funds, Banks,
Insurance Companies, Pension
Funds, Individuals or otherwise,
whether shareholders of the
Company or not, through an
issue of convertible bonds

43
and/or equity shares through
depository receipts, including
by way of Qualified Institutions
Placement (‘QIP’), to Qualified
Institutional Buyers (‘QIB’) in
terms of Chapter VIII of the
SEBI Regulations, through
one or more placements of
Equity Shares (hereinafter
collectively referred to as
“Securities”), whether by
way of private placement or
otherwise as the Board may
determine, where necessary
in consultation with the Lead
Managers, Underwriters,
Merchant Bankers, Guarantors,
Financial and/or Legal Advisors,
Rating Agencies/Advisors,
Depositories, Custodians,
Principal Paying/Transfer/
Conversion agents, Listing
agents, Registrars, Trustees,
Auditors, Stabilizing agents and
all other Agencies/Advisors so
that the total amount raised
through issue of the Securities
shall not exceed ` 4000 Crore
(Rupees Four Thousand Crore)
or US $600 Mn (US Dollars Six
Hundred Million), if higher.
RESOLVED FURTHER THAT
for the purpose of giving effect
to the above, the Board be
and is hereby also authorised
to determine the form, terms
and timing of the issue(s),
including the class of investors
to whom the Securities are
to be allotted, number of
Securities to be allotted in
each tranche, issue price,
face value, premium amount
in issue/conversion/exercise/
redemption, rate of interest,
redemption period, listings on
one or more stock exchanges
in India or abroad as the Board
may in its absolute discretion
deems fit and to make and
accept any modifications in the
proposals as may be required
by the authorities involved in
such issue(s) in India and/or
abroad, to do all acts, deeds,
matters and things and to settle
any questions or difficulties
that may arise in regard to the
issue(s).
RESOLVED FURTHER THAT
in case of QIP issue it shall be
completed within 12 months
from the date of passing of this
resolution.
RESOLVED FURTHER THAT in
case of QIP issue the relevant
date for determination of the
floor price of the Equity Shares
to be issued shall be -
i) in case of allotment of
equity shares, the date
of meeting in which the
Board decides to open the
proposed issue
ii) in case of allotment
of eligible convertible
securities, either the date
of the meeting in which
the Board decides to
open the issue of such
convertible securities or
the date on which the
holders of such convertible
securities become
entitled to apply for the
equity shares, as may be
determined by the Board.
RESOLVED FURTHER THAT
the Equity Shares so issued
shall rank pari passu with the
existing Equity Shares of the
Company in all respects.
RESOLVED FURTHER THAT
the Equity Shares to be
offered and allotted shall be in
dematerialized form.
RESOLVED FURTHER THAT
for the purpose of giving effect
to any offer, issue or allotment
of Securities, the Board, be
and is hereby authorised on
behalf of the Company to do all
such acts, deeds, matters and
things as it may, in absolute
discretion, deem necessary or
desirable for such purpose,
including without limitation,
the determination of the terms
thereof, for entering into
arrangements for managing,
underwriting, marketing,
listing and trading, to issue
placement documents and to
sign all deeds, documents and
writings and to pay any fees,
commissions, remuneration,
expenses relating thereto and
with power on behalf of the
Company to settle all questions,
difficulties or doubts that may
arise in regard to such offer(s)
or issue(s) or allotment(s) as it
may, in its absolute discretion,
deems fit.
RESOLVED FURTHER THAT
the Board be and is hereby
authorised to appoint Lead
Manager(s) in offerings of
Securities and to remunerate
them by way of commission,
brokerage, fees or the like
and also to enter into and
execute all such arrangements,
agreements, memoranda,
documents, etc. with Lead
Manager(s) and to seek listing
of such securities.
RESOLVED FURTHER THAT the
Company do apply for listing of
the new Equity Shares as may
be issued with the BSE Limited
and National Stock Exchange of
India Limited or any other Stock
Exchange(s).

44
RESOLVED FURTHER THAT
the Company do apply to the
National Securities Depository
Limited and/or Central
Depository Services (India)
Limited for admission of the
Securities.
RESOLVED FURTHER THAT
the Board be and is hereby
authorised to create necessary
charge on such of the assets
and properties (whether present
or future) of the Company in
respect of Securities and to
approve, accept, finalize and
execute facilities, sanctions,
undertakings, agreements,
promissory notes, credit limits
and any of the documents and
papers in connection with the
issue of Securities.
RESOLVED FURTHER THAT
the Board be and is hereby
authorised to delegate all or
any of the powers in such
manner as they may deem fit.”
12) To consider and, if thought
fit, to pass with or without
modification(s) as a SPECIAL
RESOLUTION the following:
“RESOLVED THAT pursuant
to the provisions of Sections
42, 71 and all other applicable
provisions of the Companies
Act, 2013 read with the
Companies (Prospectus and
Allotment of Securities) Rules,
2014, SEBI (Issue and Listing of
Debt Securities) Regulations,
2008, SEBI (Listing Obligations
and Disclosure Requirements)
Regulations, 2015 (including
any statutory modification(s)
or re-enactment(s) thereof,
for the time being in force),
and subject to the provisions
of the Articles of Association
of the Company, approval
of the members be and is
hereby accorded to authorize
the Board of Directors of the
Company to offer or invite
subscriptions for listed/unlisted/
secured/unsecured/ redeemable/
non-convertible debentures, in
one or more series/tranches/
currencies, aggregating up
to ` 6000 crore (Rupees Six
thousand crore), on private
placement basis, on such terms
and conditions as the Board of
Directors of the Company may,
from time to time, determine
and consider proper and most
beneficial to the Company
including as to when the said
Debentures be issued, the
consideration for the issue,
utilization of the issue proceeds
and all matters connected with
or incidental thereto;
RESOLVED FURTHER THAT
the Board of Directors of the
Company be and is hereby
authorised to do all acts
and take all such steps as
may be necessary, proper or
expedient to give effect to this
resolution.”
13) To ratify the appointment of
M/s. Deloitte Haskins & Sells
Statutory Auditors and fix
their remuneration and for
that purpose to pass with or
without modification(s) as an
ORDINARY RESOLUTION the
following:
“RESOLVED THAT pursuant
to the provisions of Section
139 and all other applicable
provisions of the Companies
Act, 2013 read with the
Companies (Audit and
Auditors) Rules, 2014 (including
any statutory modification(s)
or re-enactment(s) thereof for
the time being in force) and
pursuant to the resolution
passed by the Members of the
Company at the 70th Annual
General Meeting (AGM) held
on September 9, 2015 in
respect of the appointment of
M/s. Deloitte Haskins & Sells,
Chartered Accountants, ICAI
Registration No. 117366W/W-
100018(DHS) till the conclusion
of the 75th AGM, the Company
hereby ratifies the appointment
of DHS as the Statutory
Auditors of the Company, to
hold office from the conclusion
of the 72nd Annual General
Meeting till the conclusion
of the 73rd Annual General
Meeting.
RESOLVED FURTHER THAT
the Board of Directors or the
Audit Committee thereof, be
and are hereby authorized to
decide and finalise the terms
and conditions of appointment,
including remuneration of the
Statutory Auditors.”
14) To consider and ratify the
remuneration payable to
Cost Auditors and for that
purpose to pass with or
without modification(s) as an
ORDINARY RESOLUTION the
following:
“RESOLVED THAT pursuant
to Section 148 and other
applicable provisions, if any,
of the Companies Act, 2013
and the Companies (Audit
and Auditors) Rules, 2014,
the Company hereby ratifies
the remuneration of ` 11.75
lakhs plus applicable service
tax and out of pocket expenses
at actuals for travelling and
boarding/lodging for the
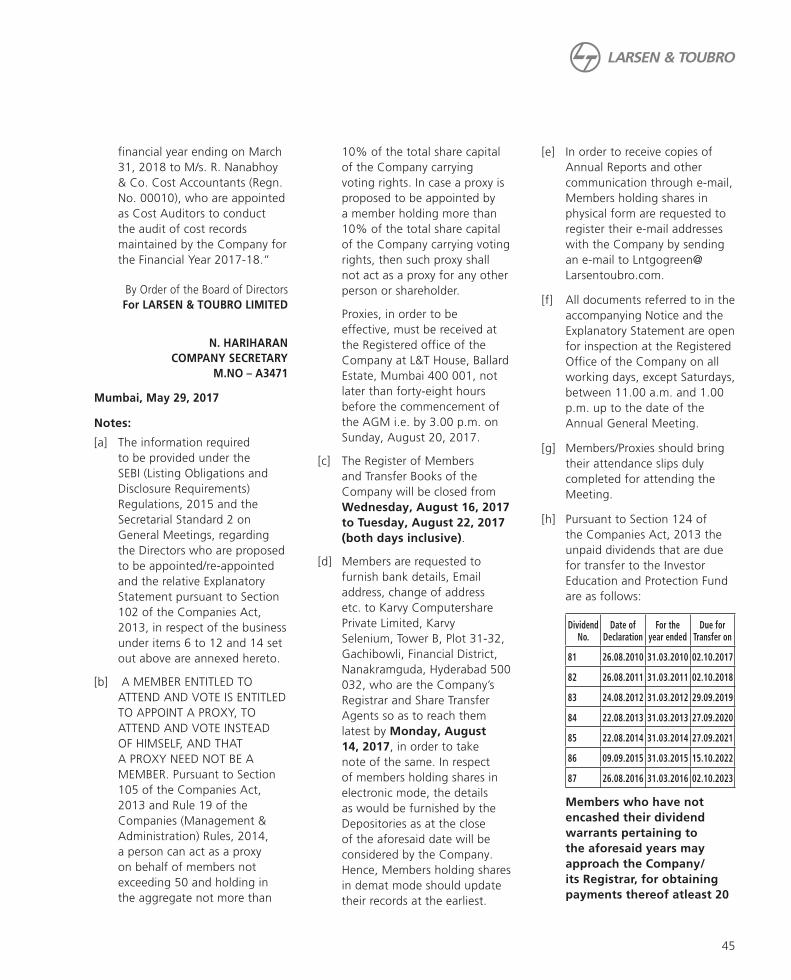
45
financial year ending on March
31, 2018 to M/s. R. Nanabhoy
& Co. Cost Accountants (Regn.
No. 00010), who are appointed
as Cost Auditors to conduct
the audit of cost records
maintained by the Company for
the Financial Year 2017-18.”
By Order of the Board of Directors
For LARSEN & TOUBRO LIMITED
N. HARIHARAN
COMPANY SECRETARY
M.NO – A3471
Mumbai, May 29, 2017
Notes:
[a] The information required
to be provided under the
SEBI (Listing Obligations and
Disclosure Requirements)
Regulations, 2015 and the
Secretarial Standard 2 on
General Meetings, regarding
the Directors who are proposed
to be appointed/re-appointed
and the relative Explanatory
Statement pursuant to Section
102 of the Companies Act,
2013, in respect of the business
under items 6 to 12 and 14 set
out above are annexed hereto.
[b] A MEMBER ENTITLED TO
ATTEND AND VOTE IS ENTITLED
TO APPOINT A PROXY, TO
ATTEND AND VOTE INSTEAD
OF HIMSELF, AND THAT
A PROXY NEED NOT BE A
MEMBER. Pursuant to Section
105 of the Companies Act,
2013 and Rule 19 of the
Companies (Management &
Administration) Rules, 2014,
a person can act as a proxy
on behalf of members not
exceeding 50 and holding in
the aggregate not more than
10% of the total share capital
of the Company carrying
voting rights. In case a proxy is
proposed to be appointed by
a member holding more than
10% of the total share capital
of the Company carrying voting
rights, then such proxy shall
not act as a proxy for any other
person or shareholder.
Proxies, in order to be
effective, must be received at
the Registered office of the
Company at L&T House, Ballard
Estate, Mumbai 400 001, not
later than forty-eight hours
before the commencement of
the AGM i.e. by 3.00 p.m. on
Sunday, August 20, 2017.
[c] The Register of Members
and Transfer Books of the
Company will be closed from
Wednesday, August 16, 2017
to Tuesday, August 22, 2017
(both days inclusive).
[d] Members are requested to
furnish bank details, Email
address, change of address
etc. to Karvy Computershare
Private Limited, Karvy
Selenium, Tower B, Plot 31-32,
Gachibowli, Financial District,
Nanakramguda, Hyderabad 500
032, who are the Company’s
Registrar and Share Transfer
Agents so as to reach them
latest by Monday, August
14, 2017, in order to take
note of the same. In respect
of members holding shares in
electronic mode, the details
as would be furnished by the
Depositories as at the close
of the aforesaid date will be
considered by the Company.
Hence, Members holding shares
in demat mode should update
their records at the earliest.
[e] In order to receive copies of
Annual Reports and other
communication through e-mail,
Members holding shares in
physical form are requested to
register their e-mail addresses
with the Company by sending
an e-mail to Lntgogreen@
Larsentoubro.com.
[f] All documents referred to in the
accompanying Notice and the
Explanatory Statement are open
for inspection at the Registered
Office of the Company on all
working days, except Saturdays,
between 11.00 a.m. and 1.00
p.m. up to the date of the
Annual General Meeting.
[g] Members/Proxies should bring
their attendance slips duly
completed for attending the
Meeting.
[h] Pursuant to Section 124 of
the Companies Act, 2013 the
unpaid dividends that are due
for transfer to the Investor
Education and Protection Fund
are as follows:
Dividend No.
Date of Declaration
For the year ended
Due for Transfer on
81 26.08.2010 31.03.2010 02.10.2017
82 26.08.2011 31.03.2011 02.10.2018
83 24.08.2012 31.03.2012 29.09.2019
84 22.08.2013 31.03.2013 27.09.2020
85 22.08.2014 31.03.2014 27.09.2021
86 09.09.2015 31.03.2015 15.10.2022
87 26.08.2016 31.03.2016 02.10.2023
Members who have not
encashed their dividend
warrants pertaining to
the aforesaid years may
approach the Company/
its Registrar, for obtaining
payments thereof atleast 20

46
days before they are due for
transfer to the said fund.
[i] Investor Grievance
Redressal:
The Company has designated
an exclusive e-mail id viz. Igrc@
Larsentoubro.com to enable
Investors to register their
complaints, if any.
[j] E-voting
The businesses as set out in
the Notice may be transacted
through electronic voting
system and the Company
will provide a facility for
voting by electronic means. In
compliance with the provisions
of Section 108 of the Act,
read with Rule 20 of the
Companies (Management and
Administration) Rules, 2014,
Secretarial Standard 2 on
General Meetings and Reg. 44
of the SEBI (Listing Obligations
and Disclosure Requirements)
Regulations, 2015, the
Company is pleased to offer
the facility of voting through
electronic means, as an
alternate, to all its Members
to enable them to cast their
votes electronically. The facility
of casting the votes by the
members using an electronic
voting system from a place
other than venue of the AGM
(remote e-voting) will be
provided by National Securities
Depository Limited(NSDL).
The facility for voting shall
be made available at the
AGM and the Members
attending the Meeting who
have not cast their vote
through remote e-voting
shall be able to exercise their
right at the meeting. Please
note that the voting through
electronic means is optional for
shareholders.
A person whose name is
recorded in the register of
members or in the register of
beneficial owners maintained
by the depositories as on the
cut-off date of Monday,
August 14, 2017 shall be
entitled to avail the facility of
remote e-voting or voting at
the AGM. Persons who are
not members as on the cut-off
date should treat this notice for
information purposes only.
The Notice will be displayed on
the website of the Company
www.Larsentoubro.com and on
the website of NSDL.
The members who have cast
their vote through remote
e-voting prior to the AGM may
also attend the AGM but shall
not be entitled to cast their
vote again.
The remote e-voting period
commences on Saturday,
August 19, 2017 at 9.00 A.M
and ends on Monday, August
21, 2017 at 5.00 P.M. During
this period members of the
Company holding shares either
in physical or dematerialised
form, as on the cut-off date of
Monday, August 14, 2017
may cast their vote by remote
e-voting. The remote e-voting
module shall be disabled by
NSDL for voting thereafter.
The Members, whose names
appear in the Register of
Members / list of Beneficial
Owners as on Monday,
August 14, 2017, i.e. the
commencement of the book
closure date are entitled to
vote on the Resolutions set
forth in this Notice. Eligible
members who have acquired
shares after the despatch of
the Annual Report and holding
shares as on the cut-off date
i.e Monday, August 14, 2017
may approach the Company
for issuance of the User ID
and Password for exercising
their right to vote by electronic
means.
Members who are already
registered with NSDL for remote
e-voting can use their existing
User ID and Password for
casting their vote. In case they
don’t remember their Password,
they can reset their Password
by using “Forgot User Details/
Password” option available on
www.evoting.nsdl.com
The Company has appointed
Mr. S. N. Ananthasubramanian,
Practicing Company Secretary,
(Membership No. 4206) or
failing him Mrs. Aparna Gadgil,
Practicing Company Secretary,
(Membership No. 14713),
to act as the Scrutinizer for
conducting the voting and
remote e-voting process in a
fair and transparent manner.
Members are requested to
follow the instructions below
to cast their vote through
e-voting:
A. In case a Member receives
an e-mail from NSDL (for
Members whose e-mail
addresses are registered
with the Company/
Depository Participants):
i. Open the e-mail and
also open PDF file
namely “L&T remote
e-voting.pdf” with
your Client ID or Folio

47
No. as Password. The
said PDF file contains
your User ID and
Password for remote
e-voting. Please note
that the Password is
an initial Password.
ii. Open the internet
browser and type the
following URL: https://
www.evoting.nsdl.
com.
iii. Click on Shareholder
— Login.
iv. If you are already
registered with NSDL
for e-voting then you
can use your existing
User ID and Password.
v. If you are logging
in for the first time,
please enter the User
ID and Password
provided in the PDF
file attached with
the e-mail as initial
Password. Click Login.
vi. The Password Change
Menu will appear on
your screen. Change
to a new Password of
your choice, making
sure that it contains a
minimum of 8 digits
or characters or a
combination of both.
Please take utmost
care to keep your
Password confidential.
vii. Once the remote
e-voting home page
opens, click on remote
e-voting> Active
Voting Cycles.
viii. Select “EVEN”
(E-Voting Event
Number) of Larsen &
Toubro Limited. Now
you are ready for
e-voting as Cast Vote
page opens.
ix. Cast your vote by
selecting appropriate
option and click on
“Submit” and also
“Confirm” when,
prompted.
x. Upon confirmation,
the message “Vote
cast successfully” will
be displayed.
xi. Once the vote on the
resolution is cast, the
Member shall not be
allowed to change it
subsequently.
xii. Institutional
shareholders (i.e.
other than individuals,
HUF, NRI, etc.) are
required to send
scanned copy (PDF/JPG
format) of the relevant
Board Resolution/
Authority letter etc.,
together with attested
specimen signature of
the duly authorized
signatory(ies) who are
authorized to vote, to
the Scrutinizer through
e-mail to scrutinizer@
snaco.net, with a copy
marked to evoting@
nsdl.co.in.
xiii. In case of any queries,
you may refer the
Frequently Asked
Questions (FAQs)
- Shareholders and
remote e-voting user
manual - Shareholders,
available at the
downloads section of
www.evoting.nsdl.
com.
B. In case a Member receives
physical copy of the Notice
of AGM (for Members
whose email addresses
are not registered with
the Company/Depository
Participants):
i. Initial Password, is
provided as below,
in the enclosed
attendance slip:
EVEN
(E-Voting
Event
Number)
User ID Password
ii. Please follow all steps
from SI. No. (ii) to SI.
No. (xiii) above, to cast
vote.
Based on the report received from
the scrutiniser the Company will
submit within 48 hours of the
conclusion of the Meeting to the
stock exchanges details of the
voting results as required under Reg.
44(3) of the SEBI (Listing Obligations
and Disclosure Requirements)
Regulations, 2015.
A Member can opt for only one
mode of voting i.e. either through
remote e-voting or at the Meeting.
If a Member casts votes by both
modes, then voting done through
e-voting shall prevail.
The Scrutinizer will submit his report
to the Chairman after completion
of the scrutiny. The result of the
voting on the Resolutions at the
Meeting shall be announced by
the Chairman or any other person
authorized by him immediately after
the results are declared.

48
The results declared alongwith the
Scrutinizer’s report, will be posted
on the website of the Company
www.Larsentoubro.com and on
the website of NSDL and will be
displayed on the Notice Board of
the Company at its Registered
Office as well as Corporate Office
immediately after the declaration of
the result by the Chairman or any
person authorised by him in writing
and will be communicated to the
Stock Exchanges.
The Company proposes to live
webcast the proceedings of the
AGM in collaboration with NSDL.
The shareholder may view the
same by logging into the link
www.evoting.nsdl.com using their
e-voting credentials. Questions may
be raised on this platform, which
will be answered appropriately.
EXPLANATORY STATEMENT
As required by Section 102 of the
Companies Act, 2013, the following
Explanatory Statement sets out
material facts relating to the
business under items 6 to 12 and 14
of the accompanying Notice dated
May 29, 2017.
Item No. 6:
Mr. Subodh Bhargava (DIN:
00035672) was appointed as
an Independent Director of the
Company with effect from April 1,
2014 to March 29, 2017. As per the
then prevailing listing agreement
and on account of his prior term
with the Company, Mr. Bhargava
was re-appointed for only one term.
However, the amendment to the
listing agreement/listing regulations
which are in line with the
Companies Act, 2013 provides two
terms for all Independent Directors.
Hence it is proposed to appoint Mr.
Subodh Bhargava for one more term
of five years.
The Board of Directors at its meeting
held on January 28, 2017 on the
recommendation of the Nomination
and Remuneration Committee,
approved the re-appointment
of Mr. Bhargava as Independent
Director of the Company for a
second and final term of five years
with effect from March 30, 2017 to
March 29, 2022 based on his skills,
experience, knowledge and report
of his performance evaluation. His
re-appointment is subject to the
approval of the shareholders at this
Annual General Meeting by way of
a Special Resolution.
Pursuant to the provisions
of the Companies Act, 2013
and SEBI(Listing Obligations
and Disclosure Requirements)
Regulations, 2015, (“LODR
Regulations”) an Independent
Director shall hold office for a term
upto five consecutive years on the
Board of the Company and shall
be eligible for re-appointment on
passing of a Special Resolution by
the Company and disclosure of such
appointment in the Board Report.
The Company has received a
notice in writing from the Director
alongwith deposit of requisite
amount under Section 160 of the
Companies Act, 2013, proposing
his candidature for the office
of Independent Director of the
Company.
In the opinion of the Board, Mr.
Bhargava fulfils the conditions
specified in the Companies Act,
2013 and rules made thereunder
and LODR Regulations for his
re-appointment as an Independent
Director of the Company and is
independent of the management.
The copy of the letter for
appointment of Mr. Bhargava as an
Independent Director setting out
the terms and conditions would
be available for inspection without
any fee by the members at the
Registered Office of the Company.
The Board considers that his
association would be of immense
benefit to the Company as it has
been beneficial in the past and
it is desirable to avail services of
Mr. Bhargava as an Independent
Director. Accordingly, the Board
recommends the resolution in
relation to appointment of Mr.
Bhargava as an Independent
Director, for the approval by the
shareholders of the Company.
Except Mr. Subodh Bhargava, being
the appointee, none of the Directors
and Key Managerial Personnel of
the Company and their relatives
are concerned or interested, in the
resolution set out at Item No. 6.
Item No. 7:
Shareholders had approved
the appointment of Mr. S.N
Subrahmanyan (DIN: 02255382)
as Deputy Managing Director and
President of the Company for a
period of five years, with effect from
October 1, 2015 upto and including
September 30, 2020.
On the recommendation of the
Nomination & Remuneration
Committee, the Board of Directors
of the Company at its Meeting held
on April 7, 2017, appointed Mr. S.
N. Subrahmanyan (DIN: 02255382),
as Chief Executive Officer and
the Managing Director of the
Company with effect from July 1,
2017 upto and including June 30,
2022, subject to the approval of
the members in the Annual General
Meeting.
Mr. S. N. Subrahmanyan, 57,
is a civil engineer with post
graduate qualifications in business

49
management. He joined L&T
in 1984 starting off as project
planning engineer, and was
soon handpicked for senior
responsibilities.
He successfully set up the Ready
Mix Concrete business for the first
time in India. Apart from completing
several challenging infrastructure
projects across verticals over the
years, he has played a crucial role
in securing and managing EPC
contracts for the construction of
four major international airports
in India at Bengaluru, Hyderabad,
Delhi and Mumbai. Among his
list of accomplishments are the
mandates to build the tallest statue
in the world – the Statue of Unity -
and the development of dedicated
freight corridors that will realign
the dynamics of freight movement
in the country. The construction
division is among the top 30 global
contractors and by far the largest
construction organisation in the
country.
Largely responsible for establishing
L&T Construction as a significant
EPC player in the Middle East, Mr.
Subrahmanyan has spearheaded
and won several large projects in
Oman, Qatar, Abu Dhabi and Saudi
Arabia like the Salalah Airport in
Oman and a big interchange and
road project in UAE. The Riyadh
Metro project is one of the largest
international orders bagged by L&T
thus far; while the Doha Metro, the
AL-Wakrah Road Project both in
Qatar and the Abu Dhabi Airport
airside works have been won
in the face of stiff international
competition. He has also led
the spread into Africa and L&T
Construction is already making its
presence felt especially in North and
East Africa.
He brought to the fore the expertise
of ‘Design and Build’ construction
solutions on an EPC (Engineer
Procure Construct) basis and is one
of the first exponents of aluminum
formwork systems and an early
adopter of precast technology for
housing projects.
Mr. Subrahmanyan is the Non-
Executive Vice Chairman of Larsen
& Toubro Infotech Limited and L&T
Technology Services Limited and
the Non-Executive Chairman of L&T
Metro Rail (Hyderabad) Limited.
Part III, of Schedule V of the
Companies Act, 2013 and
Secretarial Standard 2 on General
Meetings provide that the
appointment and remuneration of
Managing Directors and Whole-time
Directors in accordance with Part I
and Part II of the Schedule V shall
be subject to approval by resolution
of the shareholders in a General
Meeting.
At the Annual General Meeting of
the Company held on August 26,
2011, August 22, 2013 and August
26, 2016 the shareholders had fixed
the maximum limits within which
the Board was delegated authority
to decide the remuneration of
the Chief Executive Officer and
Managing Director of the Company.
Pursuant to this, the Board has fixed
the remuneration payable to Mr. S.
N. Subrahmanyan during his tenure
as Chief Executive Officer and
Managing Director.
The Company has entered into
an Agreement with Mr. S.N.
Subrahmanyan appointing him
as a Chief Executive Officer and
Managing Director for the period of
five years from July 1, 2017 to June
30, 2022. During the period of this
agreement and so long as the Chief
Executive Officer and Managing
Director performs his services as per
the terms and conditions provided
by this agreement, he shall be
entitled to the following:
Salary : ` 18,40,000 (Rupees
Eighteen Lac Forty Thousand
only) per month in the scale
of ` 12,00,000 - ` 1,60,000
- ` 21,60,000 with the annual
increment due on April 1 every year.
Commission : The commission
will be paid as per the parameters
fixed by the Nomination and
Remuneration Committee and the
Board of Directors within the overall
limits approved by the shareholders
of the Company.
Perquisites : ` 20 lakh per
annum excluding free furnished
accommodation or house rent in
lieu thereof.
The above perquisites will exclude
value of Stock Option benefits, if
any, computed as per Income Tax
Act/Rules, tax on which will be
borne by the Company.
Others : Company’s contribution to
retirement funds, official use of car
/ driver and communication facilities
for Company’s business, as per rules
of the Company.
Disclosures as required under
Secretarial Standard 2 on General
Meetings are provided as an
Annexure to this Notice.
The agreement entered into by
the Company with Mr. S. N.
Subrahmanyan, in respect of his
appointment as Chief Executive
Officer and Managing Director,
contains terms and conditions
of his appointment including
remuneration.
Accordingly, the Resolution at Item
No. 7 is proposed for approval
of the members for appointment

50
of Mr. S. N. Subrahmanyan, as
the Chief Executive Officer and
Managing Director as contemplated
by Part III of Schedule V of the
Companies Act, 2013 and other
applicable provisions, if any.
Pursuant to Article 136(C) of the
Articles of Association of the
Company, Mr. S. N. Subrahmanyan
in his capacity as Chief Executive
Officer and Managing Director will
not be liable to retire by rotation.
The Agreement entered into with
Mr. S. N. Subrahmanyan will be
open for inspection by members
at the Registered Office of the
Company on all working days
[except Saturday] between 11.00
a.m. and 1.00 p.m. up to the date
of the Annual General Meeting.
The Board recommends approval of
the appointment and remuneration
of Mr. S. N. Subrahmanyan, as Chief
Executive Officer and Managing
Director of the Company.
Except Mr. S.N. Subrahmanyan,
being the appointee, none of the
Directors and Key Managerial
Personnel of the Company and
their relatives are concerned or
interested, in the resolution set out
at Item No. 7.
Item No. 8 & 10:
On the recommendation of the
Nomination & Remuneration
Committee, the Board of Directors
appointed Mr. Jayant Damodar Patil
(DIN: 01252184) as an Additional
Director with effect from July 1,
2017. In terms of Section 161(1) of
the Companies Act, 2013, Mr. Patil
holds office as additional director
upto the date of this Annual
General Meeting. The Company
has received a notice in writing
from a member alongwith deposit
of requisite amount under Section
160 of the Companies Act, 2013,
proposing his candidature for the
office of Director of the Company.
The Board of Directors, on the
recommendation of the Nomination
& Remuneration Committee,
appointed Mr. Jayant Damodar Patil
(DIN: 01252184) as a Whole-time
Director of the Company with
effect from July 1, 2017 upto and
including June 30, 2022, subject to
the approval of the members in the
Annual General Meeting.
Mr. Patil graduated in Mechanical
Engineering from Nagpur University
in 1976 with top Honours. He
chose to pursue higher studies at
the Indian Institute of Technology
Mumbai & attained the Top rank
in M Tech Mechanical Engineering,
before joining L&T in 1978.
Mr. Patil has a nearly four decade
long career in L&T during which
he was instrumental in growing
the nascent Technology and
Product Development Group
of L&T’s corporate R&D with a
focus on Top end interdisciplinary
Product Development. Mr. Patil
actively pursued L&T’s foreys
into the Defence sector since
late 80’s. Over these years L&T,
under his leadership, built a
portfolio of indigenous products
and technologies by teaming
up with DRDO and with Indian
Navy. Currently, Mr. Patil heads
Defence and Aerospace Strategic
Business Sectors for L&T with
focus on Naval and Land Weapon
Launch & Engineering Systems,
Submarines, Guns, Missiles
& Armoured Systems, Radar
Systems, Military Communication
Systems, Avionics. He also oversees
Technology Development Centers
for the Defence & Aerospace Sector,
Prototype Development center
at Powai & Bangalore as well as
Defence Production Centers at
Talegaon (near Pune), Coimbatore
and Visakhapatnam, besides specific
work centers at L&T’s Powai, Hazira
and Vadodara manufacturing
complexes.
Part III, of Schedule V of the
Companies Act, 2013 and
Secretarial Standard 2 on General
Meetings provides that the
appointment and remuneration of
Managing Directors and Whole-time
Directors in accordance with Part I
and Part II of the Schedule V shall
be subject to approval by resolution
of the shareholders in a General
Meeting.
At the Annual General Meeting of
the Company held on August 26,
2011, August 22, 2013 and August
26, 2016 the shareholders had fixed
the maximum limits within which
the Board was delegated authority
to decide the remuneration of
the Whole-time Directors of the
Company. Pursuant to this, the
Board has fixed the remuneration
payable to Mr. Jayant Damodar Patil
during his tenure as Whole-time
Director.
The Company will enter into
an Agreement with Mr. Jayant
Damodar Patil appointing him as a
Whole-time Director for the period
from July 1, 2017 to June 30, 2022.
During the period of this agreement
and so long as the Whole-time
Director performs his services as per
the terms and conditions provided
by this agreement, he shall be
entitled to the following:
Salary : ` 8,00,000 (Rupees Eight
Lac only) per month in the scale of
` 6,50,000 - ` 75,000 - ` 10,25,000
- ` 1,00,000 - ` 15,25,000 with the

51
annual increment due on April 1
every year.
Commission : The commission
will be paid as per the parameters
fixed by the Nomination and
Remuneration Committee and the
Board of Directors within the overall
limits approved by the shareholders
of the Company.
Perquisites : ` 12 lakh per
annum excluding free furnished
accommodation.
The above perquisites will exclude
value of Stock Option benefits, if
any, computed as per Income Tax
Act/Rules, tax on which will be
borne by the Company.
Others : Company’s contribution to
retirement funds, official use of car
/ driver and communication facilities
for Company’s business, as per rules
of the Company.
Disclosures as required under
Secretarial Standard 2 on General
Meetings are provided as an
Annexure to this Notice.
The draft agreement to be entered
into by the Company with Mr.
Jayant Damodar Patil, in respect
of his appointment as Whole-time
Director, contains the terms and
conditions of his appointment
including remuneration.
The draft agreement to be entered
into with Mr. Jayant Damodar
Patil will be open for inspection by
members at the Registered Office of
the Company on all working days
[except Saturday] between 11.00
a.m. and 1.00 p.m. up to the date
of the Annual General Meeting.
The Board recommends approval of
the appointment and remuneration
of Mr. Jayant Damodar Patil,
as Whole-time Director of the
Company.
Except Mr. Patil, being the
appointee, none of the Directors
and Key Managerial Personnel of
the Company and their relatives
are concerned or interested, in the
resolution set out at Item No. 8 &
10.
Item No. 9:
On the recommendation of the
Nomination & Remuneration
Committee, Mr. Arvind Gupta
(DIN: 00090360), a nominee of
the administrator of the Specified
Undertaking of the Unit Trust of
India (SUUTI), was appointed as an
Additional Director of the Company
with effect from July 1, 2017. In
terms of Section 161(1) of the
Companies Act, 2013, Mr. Gupta
holds office as additional director
upto the date of this Annual
General Meeting. The Company
has received a notice in writing
from a member alongwith deposit
of requisite amount under Section
160 of the Companies Act, 2013,
proposing his candidature for the
office of Director of the Company.
Mr. Gupta has over 24 years of
experience in diverse sectors in
variety of leadership, policy and
entrepreneurial profiles in India
and Silicon Valley, USA. He has
been on the Global FinTech top
100 list of Influencers and also
the Member of World Economic
Forum’s Global Futures Council on
Digital Economy and Society. He is
the head and co-founder of Digital
India Foundation, a policy think
tank working in the areas of Digital
Inclusion, Smart Cities, Internet
Governance, Cyber Security,
Electronics Manufacturing and
Indian Software Products.
The Board considers that his
association would be of immense
benefit to the Company and it is
desirable to avail services of Mr.
Gupta as an Director.
Accordingly, the Board recommends
the resolution in relation to
appointment of Mr. Gupta as a
Director, for the approval by the
shareholders of the Company.
Except Mr. Arvind Gupta, being an
appointee, none of the Directors
and Key Managerial Personnel of
the Company and their relatives
are concerned or interested, in the
resolution set out at Item No. 9.
Item No. 11:
The Company requires adequate
capital to meet the needs of
growing business. While it
is expected that the internal
generation of funds would partially
finance the need for capital and
debt raising would be another
source of funds, it is thought
prudent for the Company to have
enabling approvals to raise a part
of the funding requirements for the
said purposes as well as for such
other corporate purposes as may
be permitted under applicable laws
through the issue of appropriate
securities as defined in the
resolution, in Indian or international
markets.
The fund raising may be through
a mix of equity/equity-linked
instruments, as may be appropriate.
Members’ approval is sought
for the issue of equity shares,
securities linked to or convertible
into Equity Shares or depository
receipts of the Company. The SEBI
(Listing Obligations and Disclosure
Requirements) Regulations, 2015
also provide that the Company

52
shall, in the first instance, offer all
Securities for subscription pro-rata
to the Shareholders unless the
Shareholders in a general meeting
decide otherwise. Members’
approval is sought for issuing any
such instrument as the Company
may deem appropriate to parties
other than the existing shareholders.
Whilst no specific instrument has
been identified at this stage, in
the event the Company issues any
equity linked instrument, the issue
will be structured in a manner such
that the additional share capital that
may be issued would not be more
than 5% of the paid-up capital of
the Company (as at the date when
the Board recommended passing
of the Special Resolution). The
equity shares, if any, allotted on
issue, conversion of Securities shall
rank in all respects pari passu with
the existing Equity Shares of the
Company.
The Company may also opt for
issue of securities through Qualified
Institutions Placement (QIP). A QIP
of the securities of the Company
would be less time consuming and
more economical than other modes
of raising capital.
Accordingly, the Company may
issue securities by way of a QIP
in terms of Chapter VIII of the
Securities and Exchange Board of
India (Issue of Capital and Disclosure
Requirements) Regulations, 2009
(‘SEBI Regulations’). These securities
will be allotted only to Qualified
Institutional Buyers (QIBs) as per the
SEBI Regulations and there will be
no issue to retail individual investors
and existing retail shareholders. The
resolution proposed is an enabling
resolution and the exact price,
proportion and timing of the issue
of the securities will be decided
by the Board based on an analysis
of the specific requirements after
necessary consultations. Therefore
the proposal seeks to confer upon
the Board the absolute discretion
to determine the terms of issue
in consultation with the Lead
Managers to the Issue.
As per Chapter VIII of the SEBI
Regulations, an issue of securities
on QIP basis shall be made at a
price not less than the average of
the weekly high and low of the
closing prices of the related shares
quoted on the stock exchange
during the two weeks preceding the
“relevant date.” The Board may, at
its absolute discretion, issue equity
shares at a discount of not more
than five percent or such other
discount as may be permitted under
applicable regulations to the ‘floor
price’ as determined in terms of the
SEBI Regulations, subject to Section
53 of the Companies Act, 2013.
As the pricing of the offer cannot
be decided except at a later stage, it
is not possible to state the price of
shares to be issued.
However, the same would be in
accordance with the provisions
of the SEBI Regulations, the
Companies Act, 2013, or any other
guidelines/regulations/consents as
may be applicable or required.
In case of issue of convertible
bonds and/or equity shares through
depository receipts the price will
be determined on the basis of the
current market price and other
relevant guidelines.
The “relevant date” for the above
purpose, shall be -
i) in case of allotment of equity
shares, the date of meeting
in which the Board decides to
open the proposed issue
ii) in case of allotment of eligible
convertible securities, either the
date of the meeting in which
the Board decides to open
the issue of such convertible
securities or the date on which
the holders of such convertible
securities become entitled to
apply for the equity shares,
as may be determined by the
Board.
The Stock Exchange for the same
purpose is the BSE Limited/National
Stock Exchange of India Limited.
The Shareholders through a
resolution passed at their meeting
held on August 26, 2016, had
approved issue of Securities for
an aggregate sum up to US$600
Million or ` 3600 Crore, if higher.
However, Shareholders’ resolution
for QIP issuance is valid for a
period of 12 months from the
date of passing of the resolution.
Accordingly, the Shareholders’
approval is sought for this proposal.
The Directors recommend this
Resolution for approval of the
Shareholders.
None of the Directors and Key
Managerial Personnel of the
Company and their relatives are
concerned or interested, in the
resolution set out at Item No. 11.
Item No. 12:
The Company is into the business
interalia of manufacturing of
industrial goods, heavy engineering,
infrastructure projects and other
activities which require a sizeable
investment and continuous
expenditure. The Company intends
to explore different avenues for
garnering this financing requirement
including by way of issuance of debt
instruments.

53
Section 42 of the Companies
Act, 2013 read with Rule 14 of
the Companies (Prospectus and
Allotment of Securities) Rules, 2014
deals with private placement of
securities by a company. Sub-rule
(2) of the said Rule 14 states that
in case of an offer or invitation for
subscription to non-convertible
debentures on private placement
basis, the Company shall obtain
prior approval of its shareholders
by means of a special resolution
only once in a year for all the offers
or invitations for such debentures
during the year.
In order to meet the financial needs
of business in a prudent manner
the Company may offer or invite
subscription for secured/unsecured/
redeemable/non-convertible
debentures, in one or more series/
tranches/currencies on private
placement, issuable/redeemable at
par or otherwise.
The shareholders through a
resolution passed at their meeting
held on August 26, 2016, approved
issue of debentures upto an
amount not exceeding ` 6000
crore in aggregate. However, such
resolution is valid only for a period
of 12 months from the date on
which the approval is granted by
the shareholders. Accordingly, the
Shareholders’ approval is sought for
the period of next 12 months from
the date of passing this resolution.
This resolution is an enabling
resolution and authorizes the
Board of Directors of the Company
to offer or invite subscription for
non-convertible debentures, as may
be required by the Company, from
time to time for a year from the
date of passing this resolution.
The Directors recommend this
Resolution for approval of the
Shareholders.
None of the Directors and Key
Managerial Personnel of the
Company and their relatives are
concerned or interested, in the
resolution set out at Item No. 12.
Item No. 14:
In accordance with the provisions
of Section 148 of the Companies
Act, 2013 (“the Act”) and the
Companies (Audit and Auditors)
Rules, 2014 (“the Rules”) the
Company is required to appoint
a cost auditor to audit the cost
records of the Company, for
products and services, as specified
under the Companies (Cost Record
and Audit) Rules, 2014. On the
recommendation of the Audit
Committee, the Board of Directors
had approved the appointment
of M/s. R. Nanabhoy & Co, Cost
Accountants (Regn. No. 00010), as
the Cost Auditors of the Company
to conduct audit of cost records
maintained by the Company for
the Financial Year 2017-18, at a
remuneration of ` 11.75 lakhs
plus applicable service tax and out
of pocket expenses at actuals for
travelling and boarding/lodging for
both the years.
M/s. R. Nanabhoy & Co., Cost
Accountants, have furnished
certificates regarding their eligibility
for appointment as Cost Auditors
of the Company. In accordance
with the provisions of Section 148
of the Act read with the Rules, the
remuneration payable to the cost
auditor has to be ratified by the
shareholders of the Company.
Accordingly, consent of the
members is sought for the aforesaid
proposal.
The Directors recommend this
resolution for approval of the
shareholders.
None of the Directors and Key
Managerial Personnel of the
Company and their relatives are
concerned or interested, in the
resolution set out at Item No. 14.
By Order of the Board of Directors
For LARSEN & TOUBRO LIMITED
N. HARIHARAN
COMPANY SECRETARY
M.NO – A3471
Mumbai, May 29, 2017
The route map for the venue of the Annual General Meeting of the Company is given on page 40 of this Annual Report 2016-17

54
(ANNEXURE TO NOTICE DATED MAY 29, 2017)
DETAILS OF DIRECTORS SEEKING APPOINTMENT/RE-APPOINTMENT AT THE
FORTHCOMING ANNUAL GENERAL MEETING
[Pursuant to Regulation 36(3) of the SEBI(Listing Obligations and Disclosure Requirements) Regulations, 2015
and Secretarial Standard 2 on General Meetings]
Name of the Director Mr. Sushobhan Sarker Mr. Shailendra Roy Mr. R. Shankar Raman Mr. Subodh Bhargava
Date of Birth March 29, 1954 September 18, 1952 December 20, 1958 March 30, 1942
Date of Appointment on the Board
December 15, 2012 March 9, 2012 October 1, 2011 July 3, 2007
Qualifications B.Sc Diploma in Management
Studies, Masters in Financial
Management
B. Tech B.Com, ACA and Grad. CWA Mechanical Engineering
[University of Roorkee]
Expertise Vast Experience in Insurance and
Housing Finance
Vast experience in Thermal Power,
Heavy Engineering, Defence &
Aerospace Industry
Vast experience in Finance,
Taxation, Risk Management, Legal
and Investor Relations
He has held and continues to hold
many important positions with
various government committees
and in the field of education with
close association in technical and
management education in India.
Directorships held in other public companies including private companies which are subsidiaries of public companies (excluding foreign companies)
1. L&T Infrastructure
Development Projects Limited
2. Corporation Bank
1. L&T Power Development
Limited
2. L&T-Sargent & Lundy Limited
3. Nabha Power Limited
4. L&T-MHPS Boilers Private
Limited
5. L&T-MHPS Turbine Generators
Private Limited
6. Raykal Aluminium Company
Private Limited
7. L&T Special Steels and Heavy
Forgings Private Limited
8. L&T-Howden Private Limited
9. L&T Power Limited
1. L&T Infrastructure
Development Projects Limited
2. L&T Finance Holdings Limited
3. L&T Investment Management
Limited
4. Larsen & Toubro Infotech
Limited
5. L&T Hydrocarbon Engineering
Limited
6. L&T Seawoods Limited
7. L&T Realty Limited
8. L&T Metro Rail (Hyderabad)
Limited
1. Glaxo Smithkline Consumer
Healthcare Limited
2. Batliboi Limited
3. Nicco Parks and Resorts
Limited
4. International Institute of CSR
Foundation
Memberships/Chairmanships of committees across all companies
Member
Audit Committee
Larsen & Toubro Limited
Stakeholders Relationship Committee
Corporation Bank
Member
Nomination and Remuneration Committee
1. L&T-Sargent & Lundy Limited
2. L&T-MHPS Turbine Generators
Private Limited
3. L&T-MHPS Boilers Private
Limited
4. L&T Power Development
Limited
5. Nabha Power Limited
6. L&T Special Steels and Heavy
Forgings Private Limited
7. L&T Howden Private Limited
Stakeholders Relationship Committee
Larsen & Toubro Limited
Member
Audit Committee
1. L&T Finance Holdings Limited
2. L&T Infrastructure
Development Projects Limited
3. L&T Investment Management
Limited
4. L&T Realty Limited
5. L&T Seawoods Limited
6. L&T Metro Rail (Hyderabad)
Limited
Nomination & Remuneration Committee
1. L&T Seawoods Limited
2. L&T Realty Limited
3. L&T Investment Management
Limited
Chairman
Nomination and Remuneration Committee
Larsen & Toubro Limited
Member
Audit Committee
Batliboi Limited
Nomination and Remuneration Committee
1. Batliboi Limited
2. Glaxo Smithkline Consumer
Healthcare Limited

55
Name of the Director Mr. Sushobhan Sarker Mr. Shailendra Roy Mr. R. Shankar Raman Mr. Subodh Bhargava
Corporate Social Responsibility Committee
L&T Power Development Limited
4. L&T Infrastructure
Development Projects Limited
Stakeholder Relationship Committee
L&T Finance Holdings Limited
Corporate Social Responsibility Committee
1. Larsen & Toubro Limited
2. L&T Seawoods Limited
3. L&T Investment Management
Limited
4. L&T Infrastructure
Development Projects Limited
5. L&T Realty Limited
6. L&T Finance Holdings Limited
Number of Meetings attended during the year
9 out of 10 10 out of 10 10 out of 10 9 out of 10
Shareholding of Non-Executive Directors
150* Not Applicable Not Applicable 750
Relationships between directors inter-se
Nil Nil Nil Nil
* Jointly with LIC

56
(ANNEXURE TO NOTICE DATED MAY 29, 2017)
DETAILS OF DIRECTORS SEEKING APPOINTMENT/RE-APPOINTMENT AT THE
FORTHCOMING ANNUAL GENERAL MEETING
[Pursuant to Regulation 36(3) of the SEBI(Listing Obligations and Disclosure Requirements) Regulations, 2015
and Secretarial Standard 2 on General Meetings]
Name of the Director Mr. S.N Subrahmanyan Mr. Arvind Gupta Mr. Jayant Damodar Patil
Date of Birth March 16, 1960 March 24, 1970 December 16, 1954
Date of Appointment on the Board
July 1, 2011 July 1, 2017 July 1, 2017
Qualifications B.Sc., Engg. (Civil) & MBA Finance B.Tech, Masters of Computer Science, MBA B.Tech (Mech.) M. Tech (Prod.)
Expertise Vast Experience in Design and Build (D&B)
contracts, PPP Projects, Engineering and
Construction Industry
Considerable experience in the field of
Consumer Internet, Digital Payment,
Payment System, Big Data and Analytics
Vast Experience in Defence and Aerospace
Industry
Directorships held in other public companies including private companies which are subsidiaries of public companies (excluding foreign companies)
1. Larsen & Toubro Infotech Limited
2. L&T Technology Services Limited
3. L&T Metro Rail (Hyderabad) Limited
1. State Trading Corporation of India
Limited
2. Truevalue Opinions and Advisors Private
Limited
3. Aryan Brothers Private Limited
4. Safeway Enterprises Private Limited
1. L&T Cassidian Limited
2. L&T Shipbuilding Limited
3. L&T Special Steels and Heavy Forgings
Private Limited
4. Spectrum Infotech Private Limited
5. L&T MBDA Missile Systems Limited
Memberships/Chairmanships of committees across all companies
Chairman
Stakeholders Relationship Committee
Larsen & Toubro Infotech Limited
Corporate Social Responsibility Committee
Larsen & Toubro Infotech Limited
Member
Audit Committee
1. Larsen & Toubro Infotech Limited
2. L&T Technology Services Limited
Nomination and Remuneration Committee
Larsen & Toubro Infotech Limited
Chairman
Nomination and Remuneration Committee
State Trading Corporation of India Limited
Corporate Social Responsibility Committee
State Trading Corporation of India Limited
Nil
Number of Meetings attended during the year
10 out of 10 Not Applicable Not Applicable
Shareholding of Non-Executive Directors
Not Applicable Nil Not Applicable
Relationships between directors inter-se
Nil Nil Nil

57
Board Report
Dear Members,
The Directors have pleasure in presenting their 72nd Annual Report and Audited Financial Statements for the year ended March 31, 2017.
FINANCIAL RESULTS:
Particulars 2016-17` crore
2015-16` crore
Profit Before Depreciation, exceptional
items & tax 7079.06 6692.74
Less: Depreciation, amortization,
impairment and obsolescence 1215.19 997.40
Profit before exceptional items and tax 5863.87 5695.34
Add: Exceptional Items 893.97 560.28
Profit before tax 6757.84 6255.62
Less: Provision for tax 1304.10 1256.04
Profit for the period carried to Balance
Sheet 5453.74 4999.58
Add: Balance brought forward from
previous year 7710.27 4522.65
Less: Dividend paid during the year
(Including dividend distribution
tax) 1842.71 1647.02
Add: Gain/(loss) on remeasurement of
the net defined benefit plans (8.02) (8.44)
Balance available for disposal
(which the Directors appropriate as
follows)
11313.28 7866.77
Debenture Redemption Reserve 87.75 156.50
Balance to be carried forward 11225.53 7710.27
The Directors recommend payment of final dividend of ` 21 per
share of ` 2/- each on 93,29,65,803 shares.
CAPITAL & FINANCE:
During the year under review, the Company allotted 14,86,958 equity shares of ` 2/- each upon exercise of stock options by the eligible employees under the Employee Stock Option Schemes.
The Company reduced long-term borrowings during the year under review by way of repayment of Non-Convertible Debentures (NCD) worth ` 550 crore and External Commercial Borrowings (ECB) worth US$126 million on scheduled due dates. The Company did not raise any long-term borrowings during FY2016-17.
CRISIL Limited has assigned AAA (Stable) rating for L&T’s long-term debt facilities. In addition, ICRA Limited also has assigned AAA (Stable) rating for certain borrowings of the Company.
HIVE-OFF OF COIMBATORE UNDERATKING:
Subsequent to the year under review, on April 20, 2017 the Company has received order of National Company Law Tribunal for hive-off of its Coimbatore undertaking engaged in valves manufacturing through a scheme of Arrangement between Larsen & Toubro Limited and L&T Valves Limited, a wholly-owned subsidiary of the Company and their respective shareholders and creditors under the provisions of section 230 to 232 of the Companies Act, 2013. The appointed date of the scheme was April 1, 2016 and the effective date of the scheme was April 22, 2017.
BONUS:
The Board of Directors of your Company at its Meeting held on May 29, 2017, has recommended for approval of the shareholders issue of bonus shares to the holders of the equity shares of the Company in the ratio of 1: 2 (i.e 1 (One) Bonus Equity Share of ` 2/- for every 2 (Two) fully paid-up Equity Shares of ` 2/- each held) by capitalisation of its Reserves. The approval of the shareholders will be sought through Postal Ballot.
CAPITAL EXPENDITURE:
As at March 31, 2017 the gross property, plant and equipment, investment property and other intangible assets including leased assets, stood at ` 9820.17 crore and the net property, plant and equipment, investment property and other intangible assets, including leased assets, at ` 7548.37 crore. Capital Expenditure during the year amounted to ` 749.02 crore.
DEPOSITS:
The Company has not accepted deposits from the public falling within the ambit of Section 73 of the Companies Act, 2013. The Company does not have any unclaimed deposits as of date. All unclaimed deposits have been transferred to Investor Education & Protection Fund.
DEPOSITORY SYSTEM:
As the members are aware, the Company’s shares are compulsorily tradable in electronic form. As on March 31, 2017, 98% of the Company’s total paid up capital representing 91,42,69,231 shares are in dematerialized form. In view of the numerous advantages offered by the Depository system as well as to avoid frauds, members holding shares in physical mode are advised to avail of the facility of dematerialization from either of the depositories.

58
TRANSFER TO INVESTOR EDUCATION AND
PROTECTION FUND:
The Company sends letters to all shareholders, whose dividends are unclaimed so as to ensure that they receive their rightful dues. Efforts are also made in co-ordination with the Registrar to locate the shareholders who have not claimed their dues.
During the year, the Company has transferred a sum of ` 2,59,71,351 to Investor Education & Protection Fund (IEPF), the amount which was due & payable and remained unclaimed and unpaid for a period of seven years as provided in section 125 of the Companies Act, 2013 and the rules made thereunder. Despite the reminder letters sent to each shareholder, this amount remained unclaimed and hence was transferred. Cumulatively, the amount transferred to the said fund was ` 17,16,31,755 as on March 31, 2017.
In accordance with the provisions of the Section 124(6) and Rule 6(3)(a) of the Investor Education and Protection Fund Authority (Accounting, Audit, Transfer and Refund) Rules, 2016, (IEPF Rules), the Company is required to transfer 12,13,804 equity shares of ` 2 each held by 11,057 shareholders to IEPF. The said shares correspond to the dividend which has remained unclaimed for a period of seven consecutive years from the financial year 2008-09. However, the equity shares wherein, disputes are pending and Court Order(s) are available with the Company, shall be retained by the Company. All the remaining shares, as mentioned above, shall be transferred to IEPF. Subsequent to the transfer, the concerned shareholders can claim the said shares along with the dividend(s) from IEPF in accordance with the prescribed procedure and on submission of such documents as prescribed under the IEPF Rules.
The Company has already sent a specific communication to the concerned shareholders at their address registered with the Company and also published notice in Financial Express and Loksatta providing the details of the shares due for transfer and to enable shareholders to take appropriate action. The Company is awaiting further directions on the transfer formalities from the Ministry of Corporate Affairs in terms of the amendment to the IEPF Rules dated 28th February, 2017. In the meantime, the concerned shareholders can approach the Company or its Registrar & Transfer Agent with necessary documents supporting their claims.
SUBSIDIARY / ASSOCIATE / JOINT VENTURE
COMPANIES:
During the year under review, the Company subscribed to / acquired equity / preference shares in various subsidiary
/ associate / joint venture companies. These subsidiaries include companies in general insurance, power, real estate and infrastructure sectors. The details of investments/divestments in subsidiary companies during the year are as under:
A) Shares acquired during the year:
Name of the Company Type of Shares No. of shares
L&T General Insurance Company
Limited
Equity 4,70,00,000
L&T Global Holdings Limited Equity 79,000
L&T Metro Rail (Hyderabad)
Limited
Equity 2,04,18,86,554
L&T Technology Services Limited Equity 2,66,90,392
Marine Infrastructure Developer
Private Limited (Note 1)
Equity 38,80,00,000
Seawoods Realty Private Limited Equity 10,000
Seawoods Retail Private Limited Equity 10,000
L&T Shipbuilding Limited (Note 1) Preference 38,80,00,000
L&T Uttaranchal Hydropower
Limited
Preference 9,65,00,000
L&T Electrical & Automation
Limited (Note 5)
Equity 73,88,796
B) Equity shares sold/transferred during the year:
Name of the Company No. of shares
Larsen & Toubro Infotech Limited (Note 2) 1,75,00,000
L&T Technology Services Limited (Note 3) 1,04,00,000
L&T General Insurance Company Limited (Note 4)
75,20,00,000
Larsen Toubro Arabia LLC 7,500
Note:
1. Pursuant to the Scheme of Demerger approved by National Company Law Tribunal (NCLT), the existing share capital of Marine Infrastructure Developer Limited held by L&T Shipbuilding Limited stands cancelled. The Company has now acquired 38,80,00,000 equity shares of Marine Infrastructure Developer Limited for a consideration of ` 388 crore from L&T Shipbuilding Limited. The acquisition has been completed on 31st March, 2017. Further, 38,80,00,000 equity shares of L&T Shipbuilding Limited held by the Company have been extinguished and 38,80,00,000, 9% non-cumulative, optionally convertible and redeemable preference shares of ` 10

59
each have been issued to the Company in lieu of the same on 29th March, 2017.
2. The Company has sold its 10.30% stake in Larsen & Toubro Infotech Limited (LTI), a subsidiary, through an Initial Public offering of LTI equity shares. LTI got listed on July 21, 2016.
3. The Company has sold its 10.23% stake in L&T Technology Services Limited (LTTS), a subsidiary, through an Initial Public offering of LTTS equity shares. LTTS got listed on 23rd September, 2016.
4. The Company has sold its entire stake in L&T General Insurance Company Limited, a wholly-owned subsidiary, to HDFC ERGO General Insurance Company Limited.
5. The scheme of arrangement between L&T Valves Limited and L&T Electrical & Automation Limited was approved by National Company Law Tribunal on April 27, 2017 with appointed date as November 1, 2016. Pursuant to the scheme L&T Electrical & Automation Limited issued 73,88,796 shares to Larsen & Toubro Limited as a consideration towards transfer of certain assets by L&T Valves Limited. Accordingly the value of investment in L&T Electrical and Automation Limited was increased by ` 40.31 crore and reduced in L&T Valves Limited by ` 40.31 crore during the year 2016-17.
The Company has formulated a policy on identification of material subsidiaries in line with Regulation 16(c) of the SEBI (Listing Obligations & Disclosure Requirements) Regulations, 2015 and the same is placed on the website at http://investors.larsentoubro.com/Listing-Compliance.aspx. The Company does not have any material subsidiaries.
C) Performance and Financial Position of each
subsidiary/associate and joint venture
companies:
A statement containing the salient features of the financial statement of subsidiary/associate/joint venture companies is provided on pages 471 to 480 of this Annual Report.
PARTICULARS OF LOANS GIVEN, INVESTMENTS
MADE, GUARANTEES GIVEN OR SECURITY PROVIDED
BY THE COMPANY:
The Company has disclosed the full particulars of the loans given, investments made or guarantees given or security provided as required under Section 186 of the Companies Act, 2013 and Regulation 34(3) and Schedule V of the
SEBI (Listing Obligations & Disclosure Requirements) Regulations, 2015 in Note 37 and 38 forming part of the financial statements
PARTICULARS OF CONTRACTS OR ARRANGEMENTS
WITH RELATED PARTIES:
The Audit Committee and the Board of Directors have approved the Related Party Transactions Policy and the same has been uploaded on the Company’s website http://investors.larsentoubro.com/Listing-Compliance.aspx.
The Company has a process in place to periodically review and monitor Related Party Transactions.
All the related party transactions were in the ordinary course of business and at arm’s length. The Audit Committee has approved all related party transactions for the FY 2016-17 and estimated transactions for FY 2017-18.
There were no materially significant related party transactions that may have conflict with the interest of the Company.
STATE OF COMPANY AFFAIRS:
The total income for the financial year under review was ` 68,273 crore as against ` 66,154 crore for the previous financial year registering an increase of 3%. The profit before tax from continuing operations including exceptional items was ` 6,758 crore for the financial year under review as against ` 6,256 crore for the previous financial year, registering a increase of 8%. The profit after tax from continuing operations including exceptional items was ` 5,454 crore for the financial year under review as against ` 5,000 crore for the previous financial year, registering an increase of 9%.
AMOUNT TO BE CARRIED TO RESERVE:
The Company has not transferred any amount to the reserves during the current financial year.
DIVIDEND:
The Directors recommend payment of dividend of ` 21 (1050%) per equity share of ` 2/- each on the pre-bonus share capital which works out to ` 14 per equity share post issue of bonus shares.
The Board of Directors of the Company has approved the Dividend Distribution Policy on 22nd November, 2016 in line with regulation 43A of the SEBI (Listing Obligations & Disclosure Requirements) Regulations, 2015. The Policy is provided in Annexure ‘G‘ forming part of this Board Report and also uploaded on the Company’s website at http://investors.larsentoubro.com/Listing-Compliance.aspx.

60
MATERIAL CHANGES AND COMMITMENTS AFFECTING
THE FINANCIAL POSITION OF THE COMPANY,
BETWEEN THE END OF THE FINANCIAL YEAR AND THE
DATE OF THE REPORT:
There are no material changes and commitments affecting the financial position of the Company between the end of the financial year and the date of this report.
CONSERVATION OF ENERGY, TECHNOLOGY
ABSORPTION, FOREIGN EXCHANGE EARNINGS AND
OUTGO:
Information as required to be given under Section 134(3)(m) read with Rule 8(3) of the Companies (Accounts) Rules, 2014 is provided in Annexure ‘A’ forming part of this Board Report.
RISK MANAGEMENT POLICY:
The Apex Risk Management Committee comprises of Mr. A. M. Naik, Mr. S. N. Subrahmanyan and Mr. R. Shankar Raman. Mr. A. M. Naik is the Chairman of the Committee.
The Company has formulated a risk management policy and has in place a mechanism to inform the Board Members about risk assessment and minimization procedures and periodical review to ensure that executive management controls risk by means of a properly designed framework.
A detailed note on risk management is given under financial review section of the Management Discussion and Analysis on pages 225 to 227 of this Annual Report.
CORPORATE SOCIAL RESPONSIBILITY:
The Corporate Social Responsibility Committee comprises of Mr. Vikram Singh Mehta, Mr. R. Shankar Raman and Mr. D. K. Sen as the Members. Mr. Vikram Singh Mehta is the Chairman of the Committee.
The details of the various projects and programs which can be undertaken by the Company as a part of its CSR policy framework is available on its website http://investors.larsentoubro.com/Listing-Compliance.aspx.
The disclosures required to be given under Section 135 of the Companies Act, 2013 read with Rule 8(1) of the Companies (Corporate Social Responsibility Policy) Rules, 2014 are given in Annexure ‘C’ forming part of this Board Report.
DETAILS OF DIRECTORS AND KEY MANAGERIAL
PERSONNEL APPOINTED/ RESIGNED DURING THE
YEAR:
Mr. Bahram Navroz Vakil resigned as Director of the Company on 1st August, 2016. The Board places on
record its appreciation of the contribution by Mr. Vakil as Director of the Company.
Mr. Subodh Bhargava was appointed as an Independent Director of the Company with effect from April 1, 2014 to March 29, 2017. Pursuant to the recommendation of Nomination and Remuneration Committee, the Board at its Meeting held on January 28, 2017 has approved the re-appointment of Mr. Subodh Bhargava as an Independent Director for a further term of 5 years from March 30, 2017 to March 29, 2022, subject to the approval of the shareholders, since the Board was of the opinion that his association would be of immense benefit to the Company and it was desirable to avail services of Mr. Bhargava as an Independent Director.
The Board has appointed Mr. Arvind Gupta as an Additional Director representing Administrator of the Specified Undertaking of the Unit Trust of India with effect from July 1, 2017. Mr. Gupta will hold office till the ensuing Annual General Meeting (AGM) and is eligible for appointment.
The Board has appointed Mr. J. D. Patil as an Additional Director of the Company at its Meeting dated 29th May, 2017 with effect from 1st July, 2017. Mr. Patil will hold office till the ensuing AGM and is eligible for appointment. The Board has also appointed him as the Whole-time Director of the Company with effect from 1st July, 2017, for a period of five years subject to approval of the shareholders.
Mr. Sushobhan Sarker, Mr. R. Shankar Raman and Mr. Shailendra Roy retire by rotation at the ensuing AGM and being eligible offer themselves for re-appointment.
The current term of Mr. A. M. Naik as Group Executive Chairman ends on September 30, 2017. Your Board of Directors had requested Mr. Naik to provide advice, guidance and mentorship to the Company’s executive management in the capacity of Non-Executive Chairman. Mr. Naik has acceded to the Board’s request and shall continue as Non-Executive Chairman with effect from October 1, 2017 for a period of three years.
The Board has appointed Mr. S.N. Subrahmanyan as Chief Executive Officer and Managing Director with effect from 1st July, 2017, for a period of five years subject to approval of the shareholders.
The notice convening the AGM includes the proposal for appointment / re-appointment of Directors.
The terms and conditions of appointment of the Independent Directors are placed on the website

61
of the Company http://investors.larsentoubro.com/Listing-Compliance.aspx.
The Company has also disclosed on its website http://investors.larsentoubro.com/Listing-Compliance.aspx details of the familiarization programs formulated to educate the Directors regarding their roles, rights and responsibilities in the Company and the nature of the industry in which the Company operates, the business model of the Company, etc.
NUMBER OF MEETINGS OF THE BOARD OF
DIRECTORS:
This information is given in Annexure ‘B’ - Report on Corporate Governance forming part of this Report. Members are requested to refer to pages 74 and 75 of this Annual Report.
AUDIT COMMITTEE:
The Company has in place an Audit Committee in terms of the requirements of the Companies Act, 2013 read with the rules made thereunder and Regulation 18 of the SEBI (Listing Obligations & Disclosure Requirements) Regulations, 2015. The details relating to the same are given in Annexure ‘B’ - Report on Corporate Governance forming part of the Board Report. Members are requested to refer to pages 77 to 79 of this Annual Report.
COMPANY POLICY ON DIRECTORS APPOINTMENT
AND REMUNERATION:
The Company has in place a Nomination and Remuneration Committee in accordance with the requirements of the Companies Act, 2013 read with the rules made thereunder and Regulation 19 of the SEBI (Listing Obligations & Disclosure Requirements) Regulations, 2015. The details relating to the same are given in Annexure ‘B’ - Report on Corporate Governance forming part of the Board Report. Members are requested to refer to pages 79 to 81 of this Annual Report.
The Committee has formulated a policy on Director’s appointment and remuneration including recommendation of remuneration of the key managerial personnel and other employees, board diversity, composition and the criteria for determining qualifications, positive attributes and independence of a Director. The Committee has also formulated a policy on Board Diversity.
DECLARATION OF INDEPENDENCE:
The Company has received Declarations of Independence as stipulated under Section 149(7) of the Companies Act, 2013 from Independent Directors confirming that he/she is not disqualified from appointing/continuing as Independent Director. The same are also displayed on the
website of the Company http://investors.larsentoubro.com/Listing-Compliance.aspx.
EXTRACT OF ANNUAL RETURN:
As per the provisions of Section 92(3) of the Companies Act, 2013, an extract of the Annual Return in Form MGT-9 is attached as Annexure ‘F’ to this Report.
DIRECTORS RESPONSIBILITY STATEMENT:
The Board of Directors of the Company confirms:
a) In the preparation of Annual Accounts, the applicable accounting standards have been followed along with proper explanation relating to material departures;
b) The Directors have selected such accounting policies and applied them consistently and made judgements and estimates that are reasonable and prudent so as to give a true and fair view of the state of affairs of the Company at the end of the financial year and of the profit of the Company for that period;
c) The Directors have taken proper and sufficient care for the maintenance of adequate accounting records in accordance with the provisions of the Companies Act, 2013 for safeguarding the assets of the Company and for preventing and detecting fraud and other irregularities;
d) The Directors have prepared the Annual Accounts on a going concern basis;
e) The Directors have laid down an adequate system of internal financial control to be followed by the Company and such internal financial controls are adequate and operating efficiently;
f) The Directors have devised proper systems to ensure compliance with the provisions of all applicable laws and that such systems were adequate and were operating effectively.
ADEQUACY OF INTERNAL FINANCIAL CONTROL:
The Company has designed and implemented a process driven framework for Internal Financial Controls (“IFC”) within the meaning of the explanation to Section 134(5)(e) of the Companies Act, 2013. For the year ended March 31, 2017, the Board is of the opinion that the Company has sound IFC commensurate with the nature and size of its business operations and operating effectively and no material weakness exists. The Company has a process in place to continuously monitor the same and identify gaps, if any, and implement new and/or improved controls wherever the effect of such gaps would have a material effect on the Company’s operations.

62
PERFORMANCE EVALUATION OF THE BOARD, ITS
COMMITTEES AND DIRECTORS:
The Nomination and Remuneration Committee and the Board have laid down the manner in which formal annual evaluation of the performance of the Board, committees and individual directors has to be made.
All Directors responded through a structured questionnaire giving feedback about the performance of the Board, its Committees, Individual directors and the Chairman. The questionnaire included inputs on composition, culture, functioning, information availability, compliance and governance, effectiveness etc. Questionnaire also covered, in the case of individual directors, qualitative assessment and in the case of Chairman additional criteria like leadership qualities and other key aspects of his role.
The Individual Directors’ responses to the questionnaire on the performance of the Board, Committee(s), Directors and Chairman, were analyzed by an independent consultant, to arrive at unbiased conclusions.
The inputs, including areas of improvement, given by all the directors were discussed in the meeting of the Independent Directors held on April 6, 2017 and in the subsequent Meetings of Nomination and Remuneration Committee and the Board. The Group Executive Chairman had a discussion with all the Directors individually.
DISCLOSURE OF REMUNERATION:
The details of remuneration as required to be disclosed under the Companies Act, 2013 and the rules made thereunder are given in Annexure ‘D’ forming part of this Board report.
The information in respect of employees of the Company required pursuant to Rule 5(2) and 5(3) of the Companies (Appointment and Remuneration of Managerial Personnel) Rules, 2014, as amended from time to time, is provided in Annexure ‘H’ forming part of this report. In terms of Section 136(1) of the Act and the rules made thereunder, the Report and Accounts are being sent to the shareholders excluding the aforesaid Annexure. Any Shareholder interested in obtaining a copy of the same may write to the Company Secretary. None of the employees listed in the said Annexure is related to any Director of the Company.
COMPLIANCE WITH SECRETARIAL STANDARDS ON
BOARD AND ANNUAL GENERAL MEETINGS:
The Company has complied with Secretarial Standards issued by the Institute of Company Secretaries of India on Board Meetings and Annual General Meetings.
PROTECTION OF WOMEN AT WORKPLACE:
The Company has formulated a policy on ‘Protection of Women’s Rights at Workplace’ as per the provisions of the Sexual Harassment of Women at Workplace (Prevention, Prohibition & Redressal) Act, 2013. This has been widely disseminated. There were no cases of sexual harassment complaints received by the Company in the financial year 2016-17.
OTHER DISCLOSURES:
ESOP Disclosures: There has been no material change in the Employee Stock Option Schemes (ESOP schemes) during the current financial year. The ESOP Schemes are in compliance with Securities and Exchange Board of India (Share Based Employee Benefits) Regulations, 2014 (“SBEB Regulations”).
The disclosures relating to ESOPs required to be made under the provisions of the Companies Act, 2013 and the rules made thereunder and the SBEB Regulations together with a certificate obtained from the Statutory Auditors, confirming compliance, is provided on the website of the Company http://investors.larsentoubro.com/Listing-Compliance.aspx.
A certificate obtained from the Statutory Auditors, confirming compliance with the Companies Act, 2013 and the SBEB Regulations is provided in Annexure ‘B’ forming part of this Report.
Corporate Governance: Pursuant to Regulation 34 of the SEBI (Listing Obligations & Disclosure Requirements) Regulations, 2015, a Report on Corporate Governance and a certificate obtained from the Statutory Auditors confirming compliance, is provided in Annexure ‘B’ forming part of this Report.
No disclosure is required under Section 67(3)(c) of the Companies Act, 2013, in respect of voting rights not exercised directly by the employees of the Company as the provisions of the said section are not applicable.
VIGIL MECHANISM:
As per the provisions of Section 177(9) of the Companies Act, 2013 (‘Act’), the Company is required to establish an effective Vigil Mechanism for directors and employees to report genuine concerns.
The Company has a Whistle-Blower Policy in place since 2004 to encourage and facilitate employees to report concerns about unethical behaviour, actual/ suspected

63
frauds and violation of Company’s Code of Conduct or Ethics Policy. The Policy has been suitably modified to meet the requirements of Vigil Mechanism under the Act. The policy provides for adequate safeguards against victimisation of persons who avail the same and provides for direct access to the Chairperson of the Audit Committee. The Audit Committee of the Company oversees the implementation of the Whistle-Blower Policy.
The Company has disclosed information about the establishment of the Whistle-Blower Policy on its website http://investors.larsentoubro.com/corporategovernance.aspx. During the year, no person has been declined access to the Audit Committee, wherever desired.
BUSINESS RESPONSIBILITY REPORTING:
The Company has been one of the first engineering and construction companies in India to publish its report on Corporate Sustainability.
As per Regulation 34 of the SEBI (Listing Obligations & Disclosure Requirements) Regulations, 2015, a separate section on Business Responsibility Reporting forms a part of this Annual Report (refer pages 19 to 35).
The detailed Corporate Sustainability Report is also available on the Company’s website http://www.larsentoubro.com/corporate/sustainability.aspx.
DETAILS OF SIGNIFICANT AND MATERIAL ORDERS
PASSED BY THE REGULATORS OR COURTS OR
TRIBUNALS:
During the year under review, there were no material and significant orders passed by the regulators or courts or tribunals impacting the going concern status and the Company’s operations in future.
CONSOLIDATED FINANCIAL STATEMENTS:
Your Directors have pleasure in attaching the Consolidated Financial Statements pursuant to Section 129(3) of the Companies Act, 2013 and Regulation 34 of the SEBI (Listing Obligations & Disclosure Requirements) Regulations, 2015 and prepared in accordance with the applicable Accounting Standards prescribed by the Institute of Chartered Accountants of India, in this regard.
The Auditors’ report to the shareholders does not contain any qualification, observation or adverse comment.
SECRETARIAL AUDIT REPORT:
The Secretarial Audit Report issued by S. N. Ananthasubramanian & Co., Company Secretaries is attached as Annexure ‘E’ to this Annual Report.
The Secretarial Auditor’s report to the shareholders does not contain any qualification.
AUDITORS:
In accordance with provisions of Section 139 of the Companies Act, 2013 and the Companies (Audit and Auditors) Rules, 2014, Sharp & Tannan (firm registration number 109982W) will complete their term as Statutory Auditors of the Company at the conclusion of the forthcoming Annual General Meeting. The Board places on record its appreciation for the services rendered by Sharp & Tannan as the Statutory Auditors of the Company.
In view of the mandatory rotation of auditor requirement and in accordance with the provisions of Companies Act, 2013, Deloitte Haskins & Sells LLP were appointed as Statutory Auditors for a period of 5 continuous years from the conclusion of 70th Annual General Meeting till the conclusion of 75th Annual General Meeting of the Company. A proposal for ratifying their appointment from the conclusion of the 72nd AGM till the conclusion of the 73rd AGM has been included in the Notice of the ensuing AGM.
Deloitte Haskins & Sells LLP, have informed the Company that their appointment would be within the limits prescribed under section 141 of the Companies Act, 2013.
The Auditors have confirmed that they have subjected themselves to the peer review process of Institute of Chartered Accountants of India (ICAI) and hold valid certificate issued by the Peer Review Board of the ICAI.
The Audit Committee reviews the independence and objectivity of the Auditors and the effectiveness of the Audit process.
The Auditors have also furnished a declaration confirming their independence as well as their arm’s length relationship with the Company as well as declaring that they have not taken up any prohibited non-audit assignments for the Company.
REPORTING OF FRAUD:
The Auditors of the Company have not reported any instances of fraud committed against the Company by its officers or employees as specified under Section 143(12) of the Companies Act, 2013.
COST AUDITORS:
Pursuant to the provisions of Section 148 of the Companies Act, 2013 and as per the Companies (Cost Records and Audit) Rules, 2014 and amendments

64
thereof, the Board, on the recommendation of the Audit Committee, at its meeting held on May 29, 2017, has approved the appointment of R. Nanabhoy & Co., Cost Accountants as the Cost Auditors for the Company for the financial year ending March 31, 2018 at a remuneration of ` 11.75 lakhs.
The Report of the Cost Auditors for the financial year ended March 31, 2017 is under finalization and shall be filed with the MCA within the prescribed period.
A proposal for ratification of remuneration of the Cost Auditor for the financial year 2017-18 is placed before the shareholders.
DISCLOSURE ON SPECIFIED BANK NOTES:
The information is covered in Note 59 forming part of the Financial Statements forming part of this Annual Report.
ACKNOWLEDGEMENT:
Your Directors take this opportunity to thank the customers, supply chain partners, employees, Financial Institutions, Banks, Central and State Government authorities, Regulatory authorities, Stock Exchanges and all the various stakeholders for their continued co-operation and support to the Company. Your Directors also wish to record their appreciation for the continued co-operation and support received from the Joint Venture partners / Associates.
For and on behalf of the Board
A. M. Naik
Group Executive Chairman(DIN: 00001514)
Mumbai, May 29, 2017

65
Annexure ‘A’ to the Board Report
Information as required to be given under Section 134(3)(m) read with Rule 8(3) of the Companies (Accounts) Rules, 2014.
[A] CONSERVATION OF ENERGY:
(i) Steps taken or impact on conservation of energy:
Use of Induction lamps in place of mercury vapor lamps for bay lighting at Kancheepuram factory
Replacement of electrical heating coil vaporizer used in the galvanizing plant to vaporize the liquefied LPG from cylinders with heater less hot water vaporizer at Puducherry factory
Conversion of DOL Starter to Variable Frequency Drives (VFD) for Admin Building Chiller Primary pumps
Use of automatic switching off 50% Streetlights during night
Installation of L&T VFD for moulding machine
Implementation of ISO 50001 across ESP MFG Plants
Energy audit and Energy training provided at Ahmednagar Switchgear Works
Replacement of Natural gas heating with electrical heating for heat treatment of jobs
Optimization of DG set capacity in Furnace
Process cooling tower Fan operation converted from manual mode to Automatic mode operation through low cost automation
Upgradation of coolant system of Asquith machine to eliminate 8 no’s of motor along with VFD installation
Replacement of conventional MH Lamps and fluorescent tube lights by LED lamps in working areas at projects as well as for street lights
Installation of HVLS Fan
Use of Flood light LED and power efficient Metal Halide lamps instead of Halogen in campuses
Retrofitting of LED fixtures in place of CFL Fixtures
Cooling Tower Pump Energy Optimization
Conducted “Save Electricity” campaign on campus
Installation of motion sensors at floor areas to reduce the overall electricity consumption
Installation of auto water level controller for domestic pumps
Use of Eco Fuel, which is a direct substitute to High Speed Diesel in Hot Mix Plant
Optimization of Air Compressor operation by connecting 200 CFM Air Compressor exclusively for Shot Blasting Operation
Replacing existing aged inefficient Split AC units with energy efficient units
Utilization of Chiller for HVAC System – Campus FMD initiated and control the chiller running hour for HVAC need during holidays and extended working hours
Clubbing of charges in furnace during rolling process to improve loading factor
Replacement of rotor resistance controlled starter to Drive controller starter for EOT cranes resulting smooth operation and energy saving
Introduction of VSD based compressor
Compressed air optimization
Installation of diffusers and blowers in waste water treatment plants instead of conventional surface aerators, which will lead to energy savings by 12 - 15%
Use of photo electric sensors for lighting control in Integrated Urban Utility Projects / Industrial Township Projects
Use of Hybrid Lighting Masts
Use of Recycled water from STP for sanitation and gardening
Use of Motion sensors and RTC timers fixed at paint booth blowers, HVAC, clock room, Rest Rooms, Garden lights and Food courts
Introduced RTC timer for Domestic Water pump to avoid high pressure leakages in the existing system
Dedicated team for monitoring the lighting system and staff trained for preventing excessive usage of power
Use of VFDs with auto monitoring of pressure and temperature for compressor and blower

66
Implementation of Cold phosphating pre-treatment process (Oxsilan process) in the paint shop
Usage of Variable Speed Drive for better efficiency
Installation of PLC controlled “Auto Mode” Plant and Office Lighting
Use of CNG for Bitumen Heating as a substitute to High Speed Diesel in Hot Mix Plant at Delhi Agra Road Project
Usage of EB power supply instead of DG for construction power supply
Installation of Digital gateways at various P&M assets which enables us to monitor power consumption and reduce maintenance cost
Installation of Fuel sensors to monitor the fuel consumption and optimize its usage
Annual energy Savings in Kansbhal Factory, Odisha is 8.19 Lacs KWH
Replacement of Air Cooled Chiller with Water Cooled Chiller
(ii) Steps taken by the Company for utilizing
alternate sources of energy:
Shift towards usage of windmill power in the place of State Electricity Board at Kancheepuram factory
Installing Solar panels on rooftop
Solar street at ESE campus
Use of solar energy and natural lights in cafeteria
Purchase of Green Power from third party wind farm to reduce carbon footprint
Solar Panels installed at project sites
Power generation through Solar Roof top PV installation at campus
Shift towards usage of power generated through windmill power
Use of high velocity burners in place of low velocity burners
Implementation of hoods for the pre heating
Conversion of weld edge preparation process from planning to milling operation
Re-design impeller of industrial blower from backward curve to airfoil curve
In-house development of remote operated scissor arm for shifting and aligning the hot plate into rolling machine
Improvement is NUB design done to reduce weld deposition
(iii) Capital investment on energy conservation
equipments:
Energy conservation in Air handling units
Replacement of old welding machines with new machines with inverter technology to reduce no load loss and overall consumption
Use of 100 kVA UPS for furnace to reduce diesel consumption of DG set for uninterrupted power supply
Replacement of existing 400W MH lamps with 137W LED lamps for highbay lighting in HE East & West shops
Migrating from HPSV to LED light for BOT (Build Operate Transfer) projects with ESCOs (Energy Saving Companies) for energy conservation in Peripheral Lighting
PLC installation in heating process of LSR to have precise control and saving in NG consumption
Purchase of green power (Hydropower) for HE East & West
Use of grid supply for LSR to replace DG set hiring and running cost thereby saving diesel consumption
Feasibility for infrared heating to be explored and implemented for heating operation
IOT projects for ESSC, SAW and nozzle welding process to save energy and reduce cycle time
The measures taken have resulted in savings in cost of production, power consumption and processing time at all locations.
[B] TECHNOLOGY ABSORPTION:
(i) Efforts made towards technology absorption:
Introduction of Digital Interfaces to monitor progress & cost of work through ERP System
Development M20 and M40 structural grades of concrete with Recycled concrete aggregate (RCA)

67
for residential, commercial and infrastructure construction
Development of IoT techniques for embankment structures near sea coast for continuous monitoring
Re-commissioning of State of art testing and analysis equipment for rebar, strands, concrete, soil, rock and asphalt after Chennai floods
In-house developed self-compacting concrete was used in pile foundations of HEP Chitapur Solar power project in Karnataka
Development of evaluation and qualification of physical and mechanical properties of Embankment materials for SOU project
Implementation of specially designed cement modified WMM mix in the internal roads of Apollo Proton Therapy and Cancer Treatment Hospital Project site which shall help to move heavy duty medical equipment into the hospital building
Development of A2O process at the 318 MLD Waste Water Treatment Plant (WWTP) at Coronation Pillar, New Delhi, wherein the Nitrogen & Phosphorus content in wastewater is treated to desirable limits
Installation of Biomethanation of sewage sludge in the 318 MLD WWTP at Coronation Pillar, New Delhi which produces biogas used to generate electricity and run the WWTP facility
Installation of Micro-filtration (MF) system at Raichur power Plant which is designed to treat the river water without any conventional pre-treatment to give filtered water
Implementation of Virtual reality (VR) / Mixed reality (MR) digital technologies for projects which will enable the engineers from different disciplines to view their design as its final product and visualise the structure in real time scale
Implementation of HTC Vive technology in projects which creates a virtual reality headset designed to utilize “room scale” technology to turn a room into 3D space via sensors, with the virtual world allowing the user to navigate naturally
Implementation of Microsoft HoloLens which embraces virtual reality and augmented reality to create a mixed reality
In-house development of MIS Dashboard to monitor project costs, departmental overheads, inventory and vendor payables
Development of 3D model of components of ship, in off shore patrol vessels, to have better clash free interface between design and production
Adoption of Modular Construction Technology for the erection of 6mm thick carbon steel liner panels for IC wall and top dome lining for Kakrapar Nuclear Power Plant in Gujarat
Designed Bridge builder to erect precast segments by cantilever construction method for straight spans and curved spans upto 128m radius of curvature
Developed segmental bridge launching girder with hinge mechanism and adopted in metro construction projects
Implementing BIM at EDRC – Metros which aims at mapping on a GIS platform, the various aspects and features of Metro Rail with their associated information
Launched emergency response mobile surveillance control and command centre vehicle in Mumbai, first of its kind in India which is capable of recording & transmitting live feed to the police control room
Implemented BIM for road project on pilot basis for a 5 Km stretch
Utilisation of Digital technology for topographic surveys such as vehicle based LIDAR survey
Implemented the 2D Grade Control system on few motor graders in Delhi Agra Road Project
Manufacturing latest technology products in material handling equipment namely Tandem Tippler & Side Arm Charger, High Capacity Stacker cum Reclaimer, Underslung Paddle Feeder, Drag Plough for Coke Oven, Bin Extractors
Introduced New Product Intensity (NPI) index which measures the sales of products introduced in the market in last five years to the total sales in the financial year

68
Development of various new products in the power distribution and motor control sector namely AU range of final distribution products, sub-main Distribution boards, new ratings in Omega range of Air Circuit Breakers and Busbar Trunking systems
Launched submersible pump controllers for agriculture market and DC contactors in telecom applications
Launched comprehensive product portfolio to provide solution for Power Quality Management
Development of new, cost-optimized meter platforms that offer better features, development and integration of modules to facilitate remote communication of meter data over Radio / GSM and development of Pre-Paid Meters, Smart Meters, Protective Relays and Panel Meters
Developed Smart and Pre-paid meter where each and every instance in power distribution will be recorded
Launch MV drives thus completing LV & MV drive range
Development of new, cost-optimized meter platforms that offer better features, development and integration of modules to facilitate remote communication of meter data over Radio / GSM
Introduction of “SMART Comm” solution
Introduction of 67”Hydraulic Tire Curing Press, 750 T Bladder Press and Mixing mill
Introduction of New state-of-the-art Loader for Off The Road (OTR) Tire Curing Presses and automatic Mold Height Adjustment for OTR Presses
Development of newer variants of Power Packs & Tipper Wet Kit
Development of Paver, Pneumatic Tired Roller & Skid Steer Loaders
Introduction of 56.5” -2 position PCI for Domestic order
Introduction of 64” -2 Position PCI with safety fence
Indigenization of various components for Rubber Processing Machinery by designing, developing specifications and adapting to international conditions
Development of cement grouted bituminous macadam for high speed corridors, expressways, aprons and ports
Development of NABL accredited testing facility for geotextiles and geo-synthetics used in sub soil strengthening
Industrial scale production of stockpile, all weather cold pot-hole mix for infra project sites
Development of low cement and impermeable Plastic concrete for Dam structures
Mechanical Studies on light weight concrete for structural application and specially designed double blend structural grade
Development of polymer modified repair mortar for multilevel carparks
Execution of Technology Licensing & Assistance (TLA) Agreement with Chiyoda Corporation for Flue Gas Desulphurization Technology
Development of Armored vehicle mobility simulation capability, Laser based optics simulation capability, Intelligent Collaborative Robotics System, Unmanned / Autonomous Platforms & Systems, Waterjet Propulsion Systems, Field & Air Defence Gun Systems, Laser based Beam directing, tracking and pointing system, Trisonic Wind Tunnel Systems and other technics in the HED Sector
Introduction of portable flux recycler at welding point to avoid ovens
Development of EFNARC and RILEM methodologies in energy absorption of shotcrete panels.
Triple blend shotcrete mix M40 has been used in Special projects for tunnels
Optimized concrete mix design solutions were implemented in PTD–IC
Development of pre-packed concrete for remote site and inaccessible areas
Development of NABL accredited testing facility for fineness by Blaine, Alkali Silica aggregates, Non Destructive Tests on concrete
Development of NABL test facilities for evaluating sealents used in expansion joints of structures
Mechanical studies on water barrier disc tie rods

69
Development of test facilities for MIG and TIG welded specimens for Fatigue and tensile strength on bronze alloy sculpture specimens
Creep studies on M65 grade self-compacting concrete
Development of NABL testing facility for Bituminous Emulsions used in flexible pavement construction
Development of High volume fly-ash concrete for mass foundations
Development of lime and fly-ash stabilized mixes with recycled concrete aggregates for base and sub-base layers for light, medium and heavy traffic pavements
Development of high flexural strength PQC with alternate materials for durable rigid pavements
Development of comprehensive online geotechnical databank as an effective tool for designers and contract teams across ICs
Development of standard concrete mixes for cold weather concreting at sub-zero temperature
Development of Surface Technologies like Alodine, Chromic acid anodization and Electroless Nickel Plating to meet International standards
Establishment of Facility & Development of Painting process to meet International Military standards with precise thickness and gloss requirements
In-house Development of Form Rolling process with combination of Metallic and Non-metallic Rollers
Development of Manufacturing process of High precision Gears with our Business partners
Development of precision mechanical & electronics integration, testing & tuning of Fin Actuation Systems
Introduction of HIL (Hardware-in-the-loop) Simulation & Equipment validation - Equipment’s testing under various environmental & load conditions
Development of High Wear resistance process of Hard anodizing with Teflon impregnation for Aluminium Parts with business partners
In-house Development of Resistance spot welding of Thin Stainless Steel Sheet metal sections
In-house Process development for manufacturing of Precision Thin Section Aero Structural parts
Development of Low Hydrogen Embrittlement Cadmium Plating process of Carbon Steels
Development of Hot Bending Process for Fabrication of Titanium Sections for HSTDV program
Development of Micro-electronics assembly & testing for TGET Fuses
Completed Airworthiness Qualification of Integrated Life Support System - On-board Oxygen Generation System for fighter aircrafts
Completed development and qualification of Oxygen System for Military Helicopters
L&T – HE IC has entered into technology transfer agreement with a leading Global technology provider for Titanium Clad equipment
Buildup capability in static and dynamic stability of amphibious tracked vehicle
Development of plasma welding of Maraging steel and Titanium
Launch of Automatic Tube and Tubesheet welding for Urea applications
Development of weld overlay procedures for super duplex stainless steels, alloys 825 and alloy C-276
Development of Ultra Narrow gap GTAW process for closing seams of process plant equipment
Development of Flux-less Arc Spot Welding with mixed gases for Nuclear export orders
Development of Auto-TIG Overlay on Gasket Face and Split Ring for heat exchangers
Development of Robotic FCAW of trunnions for Trans Nuclear projects
Development of Automated High Sagita Nozzle Welding System
Development of Trisonic Wind Tunnel Systems, Thermal Management system for high pressure and high temperature flow environment

70
Development of Underwater Weapon Launch Systems and Ka Band Feed using additive manufacturing techniques
Development of Driver Vision Enhancement for Armoured Vehicles
Development of Railless Helo Traversing Systems
Environment Protection measures introduced through Process change in bridging system Painting at Talegaon i.e BLT, Sarvatra, SSBS and Modular Bridge were changed from Zinc Chromate primer to Zinc Phosphate primer
Changed the design of pins using stainless steel material to reduce the rework/rejection at site due to corrosion of pins in Bridging projects
Development of 3D Printing for design and development of Micro wave guide component for Ka band telemetry through Metal 3D printing
Adoption of bend plates and negotiating with Mills for supply of extended length of plates for reducing welding in the Tilt beam of TCT-5 production order
Automated Welding process established for 7.5m long RT quality Aluminum Butt joint
Development of Laser cutting process using Diode Laser machine for HSLA Steel & Aluminum
Developed in-house SPM for Hinge boring of BLT
In-house development by modification in IGM Robot, Gantry & Gulco trolley
Development of Hydro-squeezing fixture development in HDP for riveting operation.
Developed U & Z extrusion cutting, slot milling & drilling fixtures for HDP
Development of remote controlled motorized fixture for hot plate handling on rolling machine
Development of internal T-ring (Web to Flange) welding station using Auto GMAW and laser based seam tracking system
Process development for long seam welding and overlay using mechanized system for Coke Drum repairs
Import substitution for hydrostatic expansion process of tube to tube-sheet joints in Heat Exchangers and EO Reactors
Indigenous development of twin head Auto GMAW station with TAB based wireless control and seam tracking mechanism for welding of tube to ring joints in TWC project
Indigenous development of SCADA based system for Hydro Pressure Test Automation
Development of Military Communication Products namely network simulation and emulation for Tactical applications, network Management System for TCS, user services fall back on TDM Network, Desk Access Unit, Radio Relay Modules, manet based Wireless Node points, Radio Gateway for CNR Radios, legacy system interface and NEWN system interface for VLF
Development of India’s first indigenous chemical agent monitoring system in association with DRDE, Gwalior viz. Portable Chemical Agent Detector (PCAD) and Fixed Chemical Agent Detector (FCAD) which can be used by the Army, Navy, Air Force, and NDMA, Para-military forces, SPG and other security agencies
Development for Network simulation and emulation for Battlefield Management System applications
Indigenously developed RF modules like Up Converter, Down Converter, High Power Amplifier, Power Monitor and Switched Filter Bank Modules
Developed a complete rugged field deployable Network Interface Unit (NIU) along with its Technology Partner used for Ethernet to Fiber Optic Media conversion
Developed man-portable communication gateway unit for Indian Navy called Interoperable Communication System FAK which can be used for joint operations with foreign navy and humanitarian aid – disaster relief activities
Developed Capabilities in High-end Finite Element Analysis including advanced FEA, Explicit Dynamic Simulation and Non-Linear Analysis
Developed capability for CFD simulation in areas such as two-phase flow analysis for boiling applications
Development of Technology for Simulation of Manufacturing processes such as, simulation of Welding process and it’s application for various projects such as fabrication of ITER Cryostat

71
vessel and fabrication of various Chemical Equipment
Development of improved High Temperature Heat Recovery (HTHR) for Ethylene Production plants
Development of improved design of Feed Water Heaters for Supercritical Power Plants
Development of Shell & Tube type LNG Vaporizers for land based LNG Regasification terminals
Development of end to end Sales & Procurement cycles through Centralized ERP Server
Introduction of advanced features like Click to Call, Click to Chat on Website, Portal for Customer interaction
(ii) Benefits derived like product improvement,
cost reduction, product development or import
substitution:
Introduction of new products like New 1-phase Meter with IrDA, 3-Phase Meter with IrDA, 1-Phase Pre-Paid Meter (Taurus), 3-phase Pre-Paid Meter (Atria), 1-Phase Smart Meter (Aurora), 3-Phase Smart Meter (Regor), 3-Phase Digital Panel Meter (Nova), New Trip Supervision Relay (TCS01-nX) & Motor Protection Relay (MPR200)
Introduction of L&T’s Outdoor Compact substation- N-Qube following Franchisee model
Introduction of a new variant to the GIS (Gas insulated switchgear) family
Continuous product development in the switchgear business at its various Department of Scientific & Industrial Research, Ministry of Science & Technology accredited R&D facilities in India and filing 101 Patent, 3 Trademark, 4 Design in India and 2 foreign patent applications and 18 foreign trade mark applications
Expansion of switchgear product range and offerings to the infrastructure sector
Strategic alignment with IOmniscient (Australian company) for its video analytics specialty
Use of Emulsion based cold mixes with Reclaimed Asphalt Pavement materials as they are more environmental friendly over conventional bituminous mixes
Use of alternate curing techniques to reduce / eliminate the usage of water for concrete curing.
Use of Geo polymer concrete which ensures elimination of cement from construction activities
Economical and cost effective piles in solar projects thus saving time
The use of clean water for producing aggregates (fine and coarse) drops the price of aggregates by 50% as compared to virgin aggregates use
The recycling process can make the aggregate crushers self –sufficient
The high flexural strength PQC with alternate materials reduces the crust thicknesses of rigid pavements and inturn reduces the overall construction cost of rigid pavements
The enhancement in NABL accredited testing facility with geotextile, geosynthetic, bitumen emulsion, sealants, ASR, fineness by Blaines and NDT tests will improve the Company’s brand image and give competitive advantage over its peers
Development of pre-packed dry concrete is a ready solution for quick concreting in remote project sites and it minimizes manual labour along with improvement in the speed of construction
The special fatigue and tensile tests on bronze alloy specimens were the major criteria for material qualification for prestigious SOU project
The IoT based monitoring system developed for solar trackers, cooling tower remote units, special coastal structures will automate critical data collection and its analysis
Positioning for Futuristic Programs for Indian MoD under ‘Make’ and ‘IDDM’ category
10% reduction in welding in the Tilt beam of TCT-5 production order due to adopting bend plates and extended length of plates pallet and lower costs due to in-house machining of sub-assemblies
QRSAM first prototype on-time delivery by taking constraints under control in-house pallet
Increased self-reliance and savings in Foreign Exchange in process plant and power plant equipment sector

72
Improvement in manufacturing processes resulting in reduction in production cycle time, cost and rework
(iii) Information regarding technology imported
during the last 3 years:
S.
No.
Technology
Imported
Year of
Import
Status of absorption
& reasons for non-
absorption, if any
a) Flue Gas Desulphurization
2016 Absorption has been initiated in FY 2016-17. Its completion is linked with the completion of the first project where L&T Power would install FGDs.
b) UV disinfection system
2015 Absorbed successfully in the 2 MLD President estate STP.
2016 Implementing for the India’s largest gravity channel UV disinfection system in 120 MLD Varanasi STP.
Implementation of Ultra Violet (UV) disinfection system for secondary treated wastewater. This is preferred over the conventional chlorination system which has harmful side effects due to the presence of carcinogens in residual chlorine.
c) Vortex Grit Removal in Sewage Treatment Plant
2015 Absorbed successfully in the 2 MLD STP at President’s Estate, New Delhi.
2016 Works for the 5 new pumping stations of Greater Colombo project is in progress.
S.
No.
Technology
Imported
Year of
Import
Status of absorption
& reasons for non-
absorption, if any
It is the first of its kind to be installed in India for sewage application. It operates on VORTEX Principle where the grit removal happens by tangential Centrifugal force. Grit removal efficiency is about 95 %. The major advantage of this system is that they occupy less area and thus leads to easy maintenance.
This is preferred over the conventional grit removal system for its high grit removal efficiency and compactness.
(iv) Expenditure incurred on Research &
Development:
` crore
2016-17
Capital 53.53
Recurring 145.98
Total 199.51
Total R&D expenditure as a percentage of total turnover
0.30%
[C] FOREIGN EXCHANGE EARNINGS AND OUTGO:
` crore
2016-17
Foreign Exchange earned 16133.05
Foreign Exchange saved / deemed exports
999.00
Total 17132.05
Foreign Exchange used 15588.43

73
Annexure ‘B’ to the Board Report
A. CORPORATE GOVERNANCE
Corporate Governance is a set of principles, processes and systems which govern a company. The elements of Corporate Governance are independence, transparency, accountability, responsibility, compliance, ethics, values and trust. Corporate Governance enables an organization to perform efficiently and ethically generate long term wealth and create value for all its stakeholders.
The Company believes that sound Corporate Governance is crucial for enhancing and retaining investor trust and your Company always seeks to ensure that its performance goals are met accordingly. The Company has established systems and procedures to ensure that its Board of Directors is well informed and well equipped to fulfill its overall responsibilities and to provide management with the strategic direction needed to create long term shareholders’ value. The Company has adopted many ethical and transparent governance practices even before they were mandated by law. The Company has always worked towards building trust with shareholders, employees, customers, suppliers and other stakeholders based on the principles of good corporate governance.
B. COMPANY’S CORPORATE GOVERNANCE PHILOSOPHY
The Company’s essential character revolves around values based on transparency, integrity, professionalism and accountability. At the highest level, the Company continuously endeavors to improve upon these aspects on an ongoing basis and adopts innovative approaches for leveraging resources, converting opportunities into achievements through proper empowerment and motivation, fostering a healthy growth and development of human resources to take the Company forward.
C. THE GOVERNANCE STRUCTURE
The Company has four tiers of Corporate Governance structure, viz.:
(i) Strategic Supervision – by the Board of Directors comprising the Executive, Non-Executive Directors and Independent Directors.
(ii) Executive Management – by the Corporate Management comprising of Group Executive Chairman, the Deputy Managing Director & President, 4 Executive Directors, 1 Non-Executive Director and 3 Senior Managerial Personnel.
(iii) Strategy & Operational Management – by the Independent Company Boards of each Independent Company (IC) (not legal entities) comprising of representatives from the Company Board, Senior Executives from the IC and independent members.
(iv) Operational Management – by the Business Unit (BU) Heads.
The four-tier governance structure, besides ensuring greater management accountability and credibility, facilitates increased autonomy to businesses, performance discipline and development of business leaders, leading to increased public confidence.
D. ROLES OF VARIOUS CONSTITUENTS OF CORPORATE GOVERNANCE IN THE COMPANY
a. Board of Directors (the Board):
The Directors of the Company are in a fiduciary position, empowered to oversee the management functions with a view to ensuring its effectiveness and enhancement of shareholder value. The Board also reviews and approves management’s strategic plan & business objectives and monitors the Company’s strategic direction.
b. Executive Management Committee (EMC):
The EMC plays an important role in maintaining the linkage between IC’s and the Company’s Board as well as in realizing inter-IC synergies and benefits across ICs. The key responsibilities of the EMC include approval of policies cutting across IC’s and also at Corporate level, covering capital investments, expansions, customer and supplier synergy, Corporate Social Responsibility (CSR) and reviewing the consolidated financials and budgets before they are presented to the Company Board.

74
c. Group Executive Chairman (GEC):
The GEC is the Chairman of the Board and the Executive Management Committee. His primary role is to provide leadership to the Board and the Corporate Management for realizing the approved strategic plan and business objectives. He presides over the Board and the Shareholders’ meetings. The GEC provides leadership and devotes his full attention to certain core actions which include, inter alia, focus on restructuring, mentoring of senior executives, succession planning and corporate governance. He is the interface for critical Government entities and major customers of the Company and Group Companies. He provides support to the Company and its Group Companies, wherever necessary.
d. Executive Directors (ED) / Senior Management Personnel:
The Executive Directors, as members of the Board, along with the Senior Management Personnel in the Executive Management Committee, contribute to the strategic management of the Company’s businesses within Board approved direction and framework. They assume overall responsibility for strategic management of business and corporate functions including its governance processes and top management effectiveness.
e. Non-Executive Directors (NED) / Independent Directors:
The Non-Executive Directors / Independent directors play a critical role in enhancing balance to the Board processes with their independent judgement on issues of strategy, performance, resources, standards of conduct, etc., besides providing the Board with valuable inputs.
f. Independent Company Board (IC Board):
As a part of Lakshya 2016, the Company decided to have Hybrid Holdco Structure. Accordingly, 10 Independent Companies (ICs) were created. During the process of evolving Lakshya 2021, the structure was reviewed and it was decided to continue with the IC Boards with certain modifications. The modified mandate of ICs have been implemented/ is under implementation. Needless to mention that the IC structure has enabled the Company to empower people and achieve substantial growth in their businesses.
Since 1999, developing and implementing five-year strategy plan is a regular process followed by the Company. This process called Lakshya has helped the Company to achieve its growth aspirations and created value for all stakeholders. During the year, the strategic plan for the period 2016 – 2021 named Lakshya 2021 was developed and approved by the Board. Necessary processes and review mechanism have been established to ensure implementation of the plan.
E. BOARD OF DIRECTORS
a. Composition of the Board:
The Company’s policy is to have an appropriate mix of Executive, Non-Executive & Independent Directors. As on March 31, 2017, the Board comprises of the Group Executive Chairman, the Deputy Managing Director & President, 4 Executive Directors, 3 Non-Executive Directors (including 2 representing financial institutions), and 11 Independent Directors. The composition of the Board, as on 31st March, 2017, is in conformity with the provisions of the Companies Act, 2013 and Regulation 17 of the SEBI (Listing Obligations & Disclosure Requirements) Regulations, 2015.
b. Meetings of the Board:
The Meetings of the Board are generally held at the Registered Office of the Company at L&T House, Ballard Estate, Mumbai 400 001 and also if necessary, in locations, where the Company operates. The Meetings of the Board have been held at regular intervals with a time gap of not more than 120 days between two consecutive Meetings. During the year under review, 10 meetings were held on April 11, 2016, April 12, 2016, May 25, 2016, May 26, 2016, May 27, 2016, May 28, 2016, July 29, 2016, November 7, 2016, November 22, 2016 and January 28, 2017.
The Independent Directors met on April 6, 2017 to discuss, interalia, the performance evaluation of the Board, Committees, Chairman and the individual Directors.

75
The Company Secretary prepares the agenda and the explanatory notes, in consultation with the Group Executive Chairman and circulates the same in advance to the Directors. Every Director is free to suggest inclusion of items on the agenda. The Board meets at least once every quarter, inter alia, to review the quarterly results. The Company also provides Video Conference facility, if required, for participation of the Directors at the Board/Committee Meetings. Additional Meetings are held, when necessary. Presentations are made on business operations to the Board by Independent Company / Business Units. Senior management personnel are invited to provide additional inputs for the items being discussed by the Board of Directors as and when necessary. The Minutes of the proceedings of the Meetings of the Board of Directors are noted and the draft minutes are circulated amongst the Members of the Board for their perusal. Comments, if any, received from the Directors are also incorporated in the Minutes, in consultation with the Chairman. Thereafter, the minutes are signed by the Chairman of the Board at the next meeting.
The following is the composition of the Board of Directors as on March 31, 2017. Their attendance at the Meetings during the year and at the last Annual General Meeting is as under:
Name of Director Category Meetings held
during the year
No of Board
Meetings
attended
Attendance at
last AGM
Mr. A. M. Naik GEC 10 10 YES
Mr. S. N. Subrahmanyan DMD 10 10 YES
Mr. R. Shankar Raman ED 10 10 YES
Mr. Shailendra Roy ED 10 10 YES
Mr. D. K. Sen ED 10 10 YES
Mr. M. V. Satish ED 10 10 YES
Mr. M. M. Chitale ID 10 10 YES
Mr. Subodh Bhargava ID 10 9 YES
Mr. M. Damodaran ID 10 7 NO
Mr. Vikram Singh Mehta ID 10 9 YES
Mr. Sushobhan Sarker (Note 1) NED 10 9 NO
Mr. Adil Zainulbhai ID 10 9 YES
Mr. Akhilesh Gupta ID 10 10 YES
Mr. Bahram Vakil * ID 7 7 NA
Mr. Swapan Dasgupta (Note 2)! NED 2 2 NA
Ms. Sunita Sharma (Note 1) NED 10 7 NO
Mr. Thomas Mathew T. ID 10 10 YES
Mr. Ajay Shankar ID 10 10 YES
Mr. Subramanian Sarma NED 10 10 YES
Ms. Naina Lal Kidwai ID 10 10 YES
Mr. Sanjeev Aga $ ID 8 7 YES
Mr. Narayanan Kumar@ ID 6 5 YES
Meetings held during the year are expressed as number of meetings eligible to attend.
Note: 1. Representing equity interest of LIC
2. Representing equity interest of SUUTI
@ appointed as a Director w.e.f. 27.5.2016 $ appointed as a Director w.e.f. 25.5.2016
* ceased to be a Director w.e.f 1.8.2016 ! ceased to be a Director w.e.f 15.5.2016
GEC – Group Executive Chairman DMD – Deputy Managing Director & President
ED – Executive Director NED – Non-Executive Director
ID – Independent Director
1. None of the above Directors are related inter-se.
2. None of the Directors hold the office of director in more than the permissible number of companies under the Companies Act, 2013 or Regulation 25 of the SEBI (Listing Obligations & Disclosure Requirements) Regulations, 2015.

76
As on March 31, 2017, the number of other Directorships & Memberships / Chairmanships of Committees of the Board of Directors are as follows:
Name of Director No. of other Company
Directorships
No. of Committee
Memberships
No. of Committee
Chairmanships
Mr. A. M. Naik 3 0 0
Mr. S. N. Subrahmanyan 3 2 1
Mr. R. Shankar Raman 8 7 0
Mr. Shailendra Roy 9 1 0
Mr. D. K. Sen 1 0 0
Mr. M. V. Satish 0 0 0
Mr. M. M. Chitale 7 3 4
Mr. Subodh Bhargava 3 1 0
Mr. M. Damodaran 4 5 2
Mr. Vikram Singh Mehta 7 1 0
Mr. Sushobhan Sarker 2 2 1
Mr. Adil Zainulbhai 7 2 5
Mr. Akhilesh Gupta 0 0 0
Ms. Sunita Sharma 6 1 2
Mr. Thomas Mathew T. 4 3 0
Mr. Ajay Shankar 1 2 0
Mr. Subramanian Sarma 1 0 0
Ms. Naina Lal Kidwai 3 3 0
Mr. Sanjeev Aga 7 5 1
Mr. Narayanan Kumar 8 2 4
Other Company Directorships includes directorships in all entities whose securities are listed and excludes unlisted private limited companies, foreign companies and Section 8 companies.
The details of Committee Chairmanships / Memberships are disclosed as per Regulation 26 of the SEBI (Listing Obligations & Disclosure Requirements) Regulations, 2015.
c. Information to the Board:
The Board of Directors has complete access to the information within the Company, which inter alia includes -
Annual revenue budgets and capital expenditure plans
Quarterly results and results of operations of ICs and business segments
Financing plans of the Company
Minutes of meeting of Board of Directors, Audit Committee, Nomination & Remuneration Committee, Stakeholders Relationship Committee and Corporate Social Responsibility Committee
Details of any joint venture, acquisitions of companies or collaboration agreement
Quarterly report on fatal or serious accidents or dangerous occurrences, any material effluent or pollution problems
Any materially relevant default, if any, in financial obligations to and by the Company or substantial non-payment for goods sold or services rendered, if any
Any issue, which involves possible public or product liability claims of substantial nature, including any Judgment or Order, if any, which may have strictures on the conduct of the Company

77
Developments in respect of human resources
Compliance or Non-compliance of any regulatory, statutory nature or listing requirements and investor service such as non-payment of dividend, delay in share transfer, etc., if any.
d. Post-meeting internal communication
system:
The important decisions taken at the Board / Committee meetings are communicated to the concerned departments / ICs promptly. An Action Taken Report is presented to the Board.
F. BOARD COMMITTEES
The Board currently has 5 Committees: 1) Audit Committee, 2) Nomination and Remuneration Committee, 3) Stakeholders’ Relationship Committee, 4) Corporate Social Responsibility Committee and 5) Risk Management Committee. The terms of reference of the Board Committees are governed by the Board from time to time. The Board is responsible for constituting, assigning and co-opting the members of the Committees. The meetings of each Board Committee are convened by the Company Secretary in consultation with the respective Committee Chairman. The role and composition of these Committees, including the number of meetings held during the financial year and the related attendance are provided below.
1) Audit Committee
i) Terms of reference:
The role of the Audit Committee includes the following:
Oversight of the Company’s financial reporting process and the disclosure of its financial information to ensure that the financial statement is correct, sufficient and credible;
Recommending to the Board, the appointment, re-appointment, terms of appointment and, if required, the replacement or removal of the statutory auditor and the fixation of audit fees;
Approval of payment to statutory auditors for any other services rendered by the statutory auditors;
Discussion with statutory auditors before the audit commences, about the nature and scope of audit as well as post-audit
discussion to ascertain any area of concern;
Reviewing, with the management, the annual financial statements and the audit report before submission to the board for approval, with particular reference to:
1. Matters required to be included in the Directors’ Responsibility Statement to be included in the Board’s report in terms of sub-section (5) of Section 134 of the Companies Act, 2013
2. Changes, if any, in accounting policies and practices and reasons for the same
3. Major accounting entries involving estimates based on the exercise of judgement by management
4. Significant adjustments made in the financial statements arising out of audit findings
5. Compliance with listing and other legal requirements relating to financial statements
6. Disclosure of any related party transactions
7. Qualifications in the draft audit report.
Reviewing, with the management, the quarterly financial statements before submission to the board for approval;
Reviewing, with the management, the statement of uses / application of funds raised through an issue (public issue, rights issue, preferential issue, etc.), the statement of funds utilized for purposes other than those stated in the offer document/prospectus/notice and the report submitted by the monitoring agency monitoring the utilisation of proceeds of public or rights issue, and making appropriate recommendations to the Board to take up steps in this matter;
Reviewing, with the management, performance of statutory and internal
78
auditors, and adequacy of the internal control systems;
Reviewing the adequacy of internal audit function, if any, including the structure of the internal audit department, staffing and seniority of the official heading the department, reporting structure coverage and frequency of internal audit;
Discussion with internal auditors about any significant findings and follow up thereon;
Reviewing the findings of any internal investigations by the internal auditors into matters where there is suspected fraud or irregularity or a failure of internal control systems of a material nature and reporting the matter to the board;
To look into the reasons for substantial defaults in the payment to the depositors, debenture holders, shareholders (in case of non-payment of declared dividends) and creditors;
To review the functioning of the Whistle- Blower mechanism;
Approval of appointment of CFO (i.e., the whole-time Finance Director or any other person heading the finance function or discharging that function) after assessing the qualifications, experience & background, etc. of the candidate;
Carrying out any other function as is mentioned in the terms of reference of the Audit Committee;
The recommendation for appointment, remuneration and terms of appointment of cost auditors of the Company;
Review and monitor the auditor’s independence and performance, and effectiveness of audit process;
Review the management discussion and analysis of financial condition and results of operations;
Approval or any subsequent modification of transactions of the Company with related parties;
Scrutiny of inter-corporate loans and investments;
Valuation of undertakings or assets of the Company, wherever it is necessary;
Evaluation of internal financial controls and risk management systems;
Monitoring the end use of funds raised through public offers and related matters.
Minutes of the Audit Committee Meetings are circulated to the Board of Directors and discussed, if necessary.
ii) Composition:
The Audit Committee of the Board of Directors was formed in 1986 and as on March 31, 2017 comprised 3 Independent Directors and 1 Non-Executive Director.
iii) Meetings:
During the year ended March 31, 2017, 9 meetings of the Audit Committee were held on April 23, 2016, May 13, 2016, May 24, 2016, July 28, 2016, September 28, 2016, November 7, 2016, November 21, 2016, January 27, 2017 and February 20, 2017.
In addition to the above, the members of the Audit Committee also meet without the presence of management.
The attendance of Members at the Meetings was as follows:
Name Status No. of
Meetings
during
the year
No. of
Meetings
Attended
Mr. M. M. Chitale Chairman 9 9
Mr. M. Damodaran Member 9 9
Mr. Sushobhan Sarker Member 9 6
Mr. Bahram Vakil @ Member 4 2
Mr. Sanjeev Aga # Member 4 4
Meetings held during the year are expressed as number of
meetings eligible to attend.
# appointed as a Member w.e.f. 4.10.2016
@ ceased to be a Member w.e.f 1.8.2016
All the members of the Audit Committee are financially literate and have accounting or related financial management expertise.

79
The Whole-time Director & Chief Financial Officer and Head - Corporate Audit Services are permanent invitees to the Meetings of the Audit Committee. The Company Secretary is the Secretary to the Committee.
iv) Internal Audit:
The Company has an internal corporate audit team consisting of Chartered Accountants, Cost Accountants and Engineers. Over a period of time, the Corporate Audit department has acquired in-depth knowledge about the Company, its businesses, its systems & procedures, which knowledge is now institutionalized. The Company’s Internal Audit function is ISO 9001:2008 certified. The Head of Corporate Audit Services is responsible to the Audit Committee. The staff of Corporate Audit department is rotated periodically.
From time to time, the Company’s systems of internal controls covering financial, operational, compliance, IT applications, etc. are reviewed by external experts. Presentations are made to the Audit Committee on the findings of such reviews.
2) Nomination & Remuneration Committee (NRC)
i) Terms of reference:
Identify persons who are qualified to become directors and who may be appointed in senior management in accordance with the criteria laid down by the Committee;
Recommend to the Board appointment and removal of such persons;
Formulate criteria for determining qualifications, positive attributes and independence of a director;
Devise a policy on Board diversity;
Formulation of criteria for evaluation of directors, Board and the Board Committees;
Carry out evaluation of the Board and directors;
Recommend to the Board a policy, relating to remuneration for the directors and key managerial personnel (KMP);
Administration of Employee Stock Option Scheme (ESOS).
ii) Composition:
The Committee has been in place since 1999. As at March 31, 2017, the Committee comprised of 3 Independent Directors and the Group Executive Chairman.
iii) Meetings:
During the year ended March 31, 2017, 6 meetings of the Nomination & Remuneration Committee were held on April 12, 2016, May 19, 2016, May 28, 2016, July 29, 2016, November 22, 2016 and January 28, 2017.
The attendance of Members at the Meetings was as follows:
Name Status No. of
Meetings
during
the year
No. of
Meetings
Attended
Mr. Subodh Bhargava Chairman 6 6
Mr. A. M. Naik Member 6 6
Mr. Adil Zainulbhai Member 6 5
Mr. Thomas Mathew T. Member 6 6
Meetings held during the year are expressed as number of
meetings eligible to attend.
iv) Board Membership Criteria:
While screening, selecting and recommending to the Board new members, the Committee ensures that the Board is objective, there is absence of conflict of interest, ensures availability of diverse perspectives, business experience, legal, financial & other expertise, integrity, managerial qualities, practical wisdom, ability to read & understand financial statements, commitment to ethical standards and values of the Company and ensure healthy debates & sound decisions.
While evaluating the suitability of a Director for re-appointment, besides the above criteria, the NRC considers the past performance, attendance & participation in and contribution to the activities of the Board by the Director.
The Independent Directors comply with the definition of Independent Directors as given

80
under Section 149(6) of the Companies Act, 2013 and Regulation 16(1)(b) of the SEBI (Listing Obligations & Disclosure Requirements) Regulations, 2015. While appointing / re-appointing any Independent Directors / Non-Executive Directors on the Board, the NRC considers the criteria as laid down in the Companies Act, 2013 and Regulation 16(1)(b) of the SEBI (Listing Obligations & Disclosure Requirements) Regulations, 2015.
All the Independent Directors give a certificate confirming that they meet the “independence criteria” as mentioned in Section 149(6) of the Companies Act, 2013 and SEBI (Listing Obligations & Disclosure Requirements) Regulations, 2015.
These certificates have been placed on the website of the Company http://investors.larsentoubro.com/corporategovernance.aspx.
v) Remuneration Policy:
The remuneration of the Board members is based on the Company’s size & global presence, its economic & financial position, industrial trends, compensation paid by the peer companies, etc. Compensation reflects each Board member’s responsibility and performance. The level of compensation to Executive Directors is designed to be competitive in the market for highly qualified executives.
The Company pays remuneration to Executive Directors by way of salary, perquisites & retirement benefits (fixed components) & commission (variable component), based on recommendation of the NRC, approval of the Board and the shareholders. The commission payable is based on the performance of the business / function as well as qualitative factors. The commission is calculated with reference to net profits of the Company in the financial year subject to overall ceilings stipulated under Section 197 of the Companies Act, 2013.
The Independent Directors / Non-Executive Directors are paid remuneration by way of
commission & sitting fees. The Company was paying sitting fees of ` 50,000 per meeting of the Board and ` 25,000 per meeting of the Committee to the Independent Directors / Non-Executive Directors for attending the meetings of the Board & Committees. Since November 22, 2016, the sitting fees were revised to ` 75,000 for Board meetings and ` 40,000 for Audit Committee and Nomination and Remuneration Committee meetings during the year. The sitting fees for the other committees remain the same. The commission is paid subject to a limit not exceeding 1% p.a. of the profits of the Company as approved by shareholders (computed in accordance with section 197 of the Companies Act, 2013).
The commission to Independent Directors / Non-Executive Directors is distributed broadly on the basis of their attendance, contribution at the Board, the Committee meetings, Chairmanship of Committees and participation in IC meetings.
In the case of nominees of Financial Institutions, the commission is paid to the Financial Institutions.
As required by the provisions of Regulation 46 of the SEBI (Listing Obligations & Disclosure Requirements) Regulations, 2015, the criteria for payment to Independent Directors / Non-Executive Directors is made available on the investor page of our corporate website http://investors.larsentoubro.com/Listing-Compliance.aspx.
Performance Evaluation Criteria for IDs:
The performance evaluation questionnaire covers specific criteria with respect to the Board & Committee composition, structure, culture, effectiveness of the Board and Committees, functioning of the Board and Committees, information availability, etc. It also contains specific criteria for evaluating the Chairman and individual Directors. Members are requested to refer to page 62 of this Annual Report.

81
vi) Details of remuneration paid / payable
to Directors for the year ended March 31,
2017:
(a) Executive Directors:
The details of remuneration paid / payable to the Executive Directors is as follows:
` crore
Names Salary Perquisites Retirement Benefits
Commission
Mr. A. M. Naik 3.36 19.27* 38.04** 18.24
Mr. S. N. Subrahmanyan 1.73 7.18 3.51 11.29
Mr. R. Shankar Raman 1.41 3.15 2.38 7.41
Mr. Shailendra N. Roy 1.29 2.98 1.93 5.84
Mr. D. K. Sen 1.01 0.37 1.57 4.82
Mr. M. V. Satish 1.01 0.63 1.44 4.32
The above amounts also include perquisite on exercise of ESOPs
and tax on ESOPs borne by employer
* Perquisites include perquisite value related to employee stock
options exercised during the year in respect of stock options
granted over the past several years by a subsidiary company -
` 19.01 crore.
** Retirement Benefits include encashment of accumulated past
service leave ` 32.21 crore
Notice period for termination of appointment of Deputy Managing Director and other Whole-time Directors is six months on either side.
No severance pay is payable on termination of appointment.
Details of Options granted under Employee Stock Option Schemes are provided on the website of the Company www.larsentoubro.com.
(b) Non-Executive Directors:
The details of remuneration paid / payable to the Non-Executive Directors is as follows:
` crore
Names Sitting Fees for
Board Meeting
Sitting Fees for
Committee Meeting
Commission Total
Mr. M. M. Chitale 0.055 0.026 0.380 0.461
Mr. Subodh Bhargava 0.050 0.017 0.495 0.562
Mr. M. Damodaran 0.040 0.026 0.339 0.405
Mr. Vikram Singh Mehta 0.050 0.010 0.322 0.382
Mr. Sushobhan Sarker 0.050 0.017 0.223# 0.290
Mr. Adil Zainulbhai 0.048 0.014 0.342 0.404
Mr. Akhilesh Gupta 0.055 – 0.150 0.205
Mr. Bahram Vakil * 0.035 0.005 0.165 0.205
` crore
Names Sitting Fees for
Board Meeting
Sitting Fees for
Committee Meeting
Commission Total
Mr. Swapan Dasgupta% 0.010 – 0.050# 0.060
Ms. Sunita Sharma 0.035 0.003 0.108# 0.146
Mr. Thomas Mathew T. 0.055 0.017 0.310 0.382
Mr. Ajay Shankar 0.055 0.010 0.220 0.285
Mr. Subramanian Sarma NIL NIL NIL NIL
Ms. Naina Lal Kidwai 0.055 – 0.150 0.205
Mr. Sanjeev Aga $ 0.040 0.013 0.191 0.244
Mr. Narayanan Kumar@ 0.028 – 0.104 0.132
$ appointed as a Director w.e.f. 25.5.2016
@ appointed as a Director w.e.f. 27.5.2016
* ceased to be a Director w.e.f. 1.8.2016
% ceased to be a Director w.e.f. 15.5.2016
# Payable to respective Institutions they represent.
Details of shares and convertible instruments held by the Independent Directors / Non-Executive Directors as on March 31, 2017 are as follows:
Names No. of Shares held
Mr. M. M. Chitale 1629
Mr. Subodh Bhargava 750
Mr. M. Damodaran 150
Mr. Vikram Singh Mehta 885
Mr. Sushobhan Sarker * 150
Mr. Adil Zainulbhai 100
Mr. Akhilesh Gupta 200
Ms. Sunita Sharma * 100
Mr. Thomas Mathew T. 100
Mr. Ajay Shankar 100
Mr. Subramanian Sarma 21100
Ms. Naina Lal Kidwai 100
Mr. Sanjeev Aga 3000
Mr. Narayanan Kumar 1000
* held jointly with the Institution they represent.
3) Stakeholders’ Relationship Committee:
i) Terms of reference:
The terms of reference of the Stakeholders’ Relationship Committee are as follows:
Redressal of Shareholders’ / Investors’ complaints;
Allotment, transfer & transmission of Shares / Debentures or any other securities and issue of duplicate certificates and new certificates on split / consolidation / renewal etc. as may

82
be referred to it by the Share Transfer Committee.
ii) Composition:
As on March 31, 2017 the Stakeholders’ Relationship Committee comprised of 1 Non-Executive Director, 1 Independent Director and 1 Executive Director.
iii) Meetings:
During the year ended March 31, 2017, 4 meetings of the Stakeholders’ Relationship Committee were held on May 25, 2016, July 29, 2016, November 22, 2016 and January 28, 2017.
The attendance of Members at the Meetings was as follows-
Name Status No. of
Meetings
during
the year
No. of
Meetings
Attended
Ms. Sunita Sharma Chairperson 4 1
Mr. Ajay Shankar Member 4 4
Mr. Shailendra Roy Member 4 4
Meetings held during the year are expressed as number of
meetings eligible to attend.
Mr. N. Hariharan, Company Secretary is the Compliance Officer.
iv) Number of Requests / Complaints:
During the year, the Company has resolved investor grievances expeditiously except for the cases constrained by disputes or legal impediments.
During the year, the Company / its Registrar’s received the following complaints from SEBI / Stock Exchanges and queries from shareholders, which were resolved within the time frames laid down by SEBI.
Particulars Opening Balance
Received Resolved Pending*
Complaints:
SEBI / Stock
Exchange
2 60 58 4
Shareholder Queries:
Dividend
Related
441 6988 6943 486
Transmission /
Transfer
3 2055 1987 71
Demat / Remat 0 347 320 27
* Investor queries shown outstanding as on March 31, 2017 have been subsequently resolved. The substantial increase in number of queries is on account of the Company’s repeated reminders to shareholders regarding unclaimed shares and dividends.
The Board has delegated the powers to approve transfer of shares to a Share Transfer Committee of Executives comprising of four Senior Executives. This Committee held 41 meetings during the year and approved the transfer of shares lodged with the Company.
4) Corporate Social Responsibility Committee:
i) Terms of reference:
The terms of reference of the CSR Committee are as follows:
(a) formulate and recommend to the Board, a Corporate Social Responsibility Policy which shall indicate the activities to be undertaken by the Company;
(b) recommend the amount of expenditure to be incurred on the activities referred to in clause (a); and
(c) monitor the Corporate Social Responsibility Policy of the Company from time to time.
ii) Composition:
As on March 31, 2017 the CSR Committee comprised of 1 Independent Director and 2 Executive Directors.
iii) Meetings:
During the year ended March 31, 2017, 4 meetings of the CSR Committee were held on July 19, 2016, August 11, 2016, November 17, 2016 and March 14, 2017.
The attendace of Members at the Meetings was as follows:
Name Status No. of Meetings
during the year
No. of Meetings Attended
Mr. Vikram Singh Mehta Chairman 4 4
Mr. R. Shankar Raman Member 4 4
Mr. D. K. Sen Member 4 4
Meetings held during the year are expressed as number of
meetings eligible to attend.
83
G. OTHER INFORMATION
a) Directors’ Familiarisation Programme:
All our directors are aware and are also updated as and when required, of their role, responsibilities & liabilities.
The Company holds Board meetings at its registered office and also if necessary, in locations, where it operates. Site / factory visits are organized at various locations for the Directors.
The internal newsletters of the Company, the press releases, etc. are circulated to all the Directors so that they are updated about the operations of the Company.
This information is also available on the website of the Company http://investors.larsentoubro.com/Listing-Compliance.aspx.
b) Information to directors:
The Board of Directors has complete access to the information within the Company, which inter alia, includes items as mentioned on Pages 76 and 77 in this Annexure to the Directors’ Report.
Presentations are made regularly to the Board / NRC / Audit Committee (AC) (minutes of AC, NRC, SRC and CSR Committee are circulated to the Board), where Directors get an opportunity to interact with senior managers. Presentations, inter alia, cover business strategies, management structure, HR policy, management development and succession planning, quarterly and annual results, budgets, treasury policy, review of Internal Audit, risk management framework, operations of subsidiaries and associates, etc.
Independent Directors have the freedom to interact with the Company’s management. Interactions happen during Board / Committee meetings, when senior company personnel are asked to make presentations about performance of their Independent Company / Business Unit, to the Board. Such interactions also happen when these Directors meet senior management in IC meetings and informal gatherings.
c) Risk Management Framework:
Please refer to Page 60 of the Board Report.
d) Vigil Mechanism / Whistle-Blower Policy :
Please refer to Pages 62 and 63 of the Board Report.
e) Statutory Auditors:
Please refer to Page 63 of the Board Report.
f) Code of Conduct:
The Company has laid down a Code of Conduct for all Board members and senior management personnel. The Code of Conduct is available on the website of the Company www.larsentoubro.com. The declaration of Group Executive Chairman is given below:
To the Shareholders of Larsen & Toubro Limited
Sub: Compliance with Code of Conduct
I hereby declare that all the Board Members and Senior
Management Personnel have affirmed compliance
with the Code of Conduct as adopted by the Board of
Directors.
A. M. NaikGroup Executive Chairman
Date: May 29, 2017
Place: Mumbai
g) General Body Meetings:
The last three Annual General Meetings of the Company were held at Birla Matushri Sabhagar, Mumbai as under:
Financial Year Date Time
2015-2016 August 26, 2016 3.00 p.m.
2014-2015 September 9, 2015 3.00 p.m.
2013-2014 August 22, 2014 3.00 p.m.
The following Special Resolutions were passed by the members during the past 3 Annual General Meetings:
Annual General Meeting held on August 26, 2016:
To approve raising of capital through QIP’s by issue of shares / convertible debentures / securities upto an amount of USD 600 million or ` 3600 crore.
To approve raising of debentures upto ` 6000 crore.
Annual General Meeting held on September 9, 2015:
To approve raising of capital through QIP’s by issue of shares / convertible debentures

84
/ securities upto an amount of USD 600 million or ` 3600 crore.
To approve raising of debentures upto ` 6000 crore.
Annual General Meeting held on August 22, 2014:
No special resolutions were listed in the agenda for the meeting.
A meeting of the equity shareholders of the Company was convened on March 14, 2017 as per the directions of National Company Law Tribunal at Mumbai to approve the Scheme of Arrangement between the Company and L&T Valves Limited and their respective shareholders and creditors.
h) Postal Ballot:
During the year, no matters were transacted through postal ballot.
Approval of the Members has been sought vide Postal Ballot Notice dated May 29, 2017, under Section 110 of the Act to issue Bonus Shares in the ratio 1:2 (that is 1 (One) Bonus Equity Share of ` 2/- for every 2 (Two) fully paid-up Equity Shares of ` 2/- each held) by capitalisation of its Reserves.
The E-voting facility will also be made available to the Members. The Board of Directors of the Company, appointed Mr. S. N. Ananthasubramanian, Practicing Company Secretary, (M. No: FCS 4206) and failing him Ms. Aparna Gadgil, Practicing Company Secretary (M.No: ACS 8430), as Scrutinizer for conducting the Postal Ballot in a fair and transparent manner. The results of the Postal Ballot will be announced on July 5, 2017 at the Registered Office of the Company as per the Scrutinizer’s Report.
i) Disclosures:
1. During the year, there were no transactions of material nature with the Directors or the Management or relatives or the subsidiaries that had potential conflict with the interests of the Company.
2. Details of all related party transactions form a part of the accounts as required under IND AS 24 and the same is given in Note 51 forming part of the financial statements.
3. The Company has followed all relevant Accounting Standards notified by the Companies (Accounting Standards) Rules,
2006/ Companies (Indian Accounting Standards) Rules, 2015 while preparing the Financial Statements.
4. The Company makes presentations to Institutional Investors & Equity Analysts on the Company’s performance on a quarterly basis. The same is also available on our website http://investors.larsentoubro.com/Announcements.aspx.
5. There were no instances of non-compliance, penalties, strictures imposed on the Company by the Stock Exchanges on any matter related to the capital markets, during the last three years.
6. The policy for determining material subsidiaries and related party transactions is available on our website http://investors.larsentoubro.com/Listing-Compliance.aspx.
7. Details of risk management including foreign exchange risk, commodity price risk and hedging activities form a part of the Management Discussion & Analysis. Please refer to pages 225 to 227 of this Annual Report.
j) Means of communication:
Financial Results
Quarterly & Annual Results are published in prominent daily newspapers viz. The Financial Express, The Hindu Business Line & Loksatta. The results are also posted on the Company’s website: www.larsentoubro.com.
News Releases Official news releases are sent to stock exchanges as well as displayed on the Company’s website: www.larsentoubro.com.
Website The Company’s corporate website www.larsentoubro.com provides comprehensive information about its portfolio of businesses. Section on “Investors” serves to inform and service the Shareholders allowing them to access information at their convenience. The quarterly shareholding pattern of the Company is available on the website of the Company as well as the stock exchanges. The entire Annual Report and Accounts of the Company and subsidiaries are available in downloadable formats. The entire Annual Report and Accounts of the Company will also be made available on the websites of the Stock Exchanges.

85
Filing with Stock Exchanges
Information to Stock Exchanges is now being also filed online on NEAPS for NSE and BSE Online for BSE.
Annual Report and Annual General Meeting
Annual Report is circulated to all the members and all others like auditors, equity analysts, etc. In order to enable a larger participation of shareholders for the Annual General Meeting, the Company provided Webinar facility of its 71st Annual General Meeting in co-ordination with NSDL. The Company suitably responded to the queries raised by the shareholders through the webinar.
Management Discussion & Analysis
This forms a part of the Annual Report which is mailed to the shareholders of the Company.
Presentations made to Institutional Investors and Analysts
The schedule of analyst / institutional investor meets and presentations made to them on a quarterly basis are displayed on the website.
B. UNCLAIMED SHARES
The Company does not have any unclaimed shares lying with it from any public issue. However certain shares resulting out of the bonus shares issued by the Company are unclaimed by the shareholders. As required under Regulation 39(4) of the SEBI (Listing Obligations & Disclosure Requirements) Regulations, 2015, the Company has already sent reminders in the past to the shareholders to claim these shares. These share certificates are regularly released on requests received from the eligible shareholders after due verification.
All corporate benefits on such shares viz. bonus shares, etc. shall be transferred in accordance with the provisions of Investor Education and Protection Fund Authority (Accounting, Audit, Transfer, and Refund) Rules, 2016 (IEPF Rules) read with Section 124(6) of the Companies Act, 2013. The eligible shareholders are requested to note the same and take action for claiming the shares from the said account upon giving necessary documents.
C. GENERAL SHAREHOLDERS’ INFORMATION
a) Annual General Meeting:
The Annual General Meeting of the Company has been convened on Tuesday, August 22, 2017 at St. Andrews Auditorium, St. Dominic Road,
Bandra (West), Mumbai – 400050 at 3.00 p.m.
b) Financial calendar:
1. Annual Results of
2016-17
May 29, 2017
2. Mailing of Annual
Reports
Third week of July, 2017
3. First Quarter Results During the last week of
July, 2017 *
4. Annual General
Meeting
August 22, 2017
5. Payment of Dividend August 24, 2017
6. Second Quarter
results
During first week of
November, 2017*
7. Third Quarter results During last week of
January, 2018 *
* Tentative
c) Book Closure:
The dates of Book Closure are from Wednesday, August 16, 2017 to Tuesday, August 22, 2017 (both days inclusive) to determine the members entitled to the dividend for financial year 2016-2017.
d) Listing of equity shares / shares underlying
GDRs on Stock Exchanges:
The shares of the Company are listed on BSE Limited (BSE) and the National Stock Exchange of India Limited (NSE).
GDRs are listed on Luxembourg Stock Exchange and traded on London Stock Exchange.
e) Listing Fees to Stock Exchanges:
The Company has paid the Listing Fees for the year 2017-2018 to the above Stock Exchanges.
f) Custodial Fees to Depositories:
The Company has paid custodial fees for the year 2017-2018 to National Securities Depository Limited (NSDL) and Central Depository Services (India) Limited (CDSL).
g) Stock Code / Symbol:
The Company’s equity shares / GDRs are listed on the following Stock Exchanges and admitted for trading in London Stock Exchange:
BSE Limited(BSE) : Scrip Code - 500510
National Stock Exchange of India
Limited (NSE)
: Scrip Code - LT
ISIN : INE018A01030
Reuters RIC : LART.BO
Luxembourg Exchange Stock Code : 005428157
London Exchange Stock Code : LTOD

86
The Company’s shares constitute a part of BSE 30 Index of the BSE Limited as well as NIFTY Index of the National Stock Exchange of India Limited.
h) Stock market data for the year 2016-2017:
Month L&T BSE Price (`) BSE SENSEX
2016High Low Month
CloseHigh Low Month
Close
April 1288.00 1177.00 1253.55 26100.54 24523.20 25606.62
May 1495.00 1224.00 1474.30 26837.20 25057.93 26667.96
June 1515.00 1401.40 1496.20 27105.41 25911.33 26999.72
July 1615.00 1499.00 1558.00 28240.20 27034.14 28051.86
August 1584.95 1420.00 1513.85 28532.25 27627.97 28452.17
September 1545.75 1412.55 1431.65 29077.28 27716.78 27865.96
October 1520.00 1432.20 1476.65 28477.65 27488.30 27930.21
November 1480.15 1295.30 1382.55 28029.80 25717.93 26652.81
December 1401.00 1302.00 1349.40 26803.76 25753.74 26626.46
2017
January 1469.70 1350.00 1444.75 27980.39 26447.06 27655.96
February 1510.00 1444.75 1470.25 29065.31 27590.10 28743.32
March 1593.00 1460.25 1577.60 29824.62 28716.21 29620.50
20001900180017001600150014001300120011001000900800700600
32000
31000
30000
29000
28000
27000
26000
25000
24000
23000
22000
21000
BSE
SEN
SEX
L&T-
BSE
(`)
Apr16
May16
Jun16
Jul16
Aug16
Sep16
Daily Closing Price
Stock Performance
Oct16
Nov16
Dec16
Jan17
Feb17
Mar17
L&T BSE (`) BSE SENSEX
Month L&T NSE Price (`) NIFTY
2016
High Low Month Close
High Low Month Close
April 1288.75 1177.80 1254.60 7992.00 7516.85 7849.80
May 1496.45 1223.30 1473.55 8213.60 7678.35 8160.10
June 1517.00 1401.00 1496.50 8308.15 7927.05 8287.75
July 1615.00 1500.70 1558.85 8674.70 8287.55 8638.50
August 1586.00 1419.20 1512.95 8819.20 8540.05 8786.20
September 1545.95 1411.50 1433.15 8968.70 8555.20 8611.15
Month L&T NSE Price (`) NIFTY
October 1520.00 1431.30 1475.25 8806.95 8506.15 8625.70
November 1481.05 1295.10 1382.75 8598.45 7916.40 8224.50
December 1402.50 1302.50 1349.10 8274.95 7893.80 8185.80
2017
January 1470.25 1349.15 1446.25 8672.70 8223.70 8561.30
February 1511.00 1446.30 1469.20 8982.15 8685.80 8879.60
March 1593.65 1460.00 1574.90 9218.40 8891.95 9173.75
2000
1900
1800
1700
1600
1500
1400
1300
1200
1100
1000
9500
9000
8500
8000
7500
7000
6500
6000
NSE
NIF
TY
L&T-
NSE
(`)
Apr16
May16
Jun16
Jul16
Aug16
Sep16
Daily Closing Price
Stock Performance
Oct16
Nov16
Dec16
Jan17
Feb17
Mar17
L&T NSE (`) NSE NIFTY
i) Registrar and Share Transfer Agents (RTA):
Karvy Computershare Pvt. Ltd. Unit: Larsen & Toubro Limited Karvy Selenium Tower B, Plot number 31 & 32, Financial District, Gachibowli, Nankramguda, Hyderabad, Telangana - 500 032.
j) Share Transfer System:
The share transfer activities under physical mode are carried out by the RTA. Shares in physical mode which are lodged for transfer are processed and returned within the stipulated time. The share related information is available online.
Physical shares received for dematerialization are processed and completed within a period of 21 days from the date of receipt. Bad deliveries are promptly returned to Depository Participants (DP’s) under advice to the shareholders.
As required under Regulation 40 of the SEBI (Listing Obligations & Disclosure Requirements) Regulations, 2015, a certificate on half yearly basis confirming due compliance of share transfer formalities by the Company from Practicing Company Secretary has been submitted to Stock Exchanges within stipulated time.
87
k) Distribution of Shareholding as on March 31,
2017:
No. of Shares Shareholders Shareholding
Number % Number %
Upto 500 8,52,118 92.26 6,92,23,095 7.42
501 – 1000 38,971 4.22 2,76,73,608 2.97
1001 – 2000 17,959 1.94 2,53,31,424 2.72
2001 – 3000 5,560 0.60 1,38,08,145 1.48
3001 – 4000 2,351 0.25 82,06,168 0.88
4001 – 5000 1,505 0.16 67,96,977 0.73
5001 – 10000 2,690 0.29 1,87,50,380 2.01
10001 & Above 2,474 0.27 76,31,76,006 81.80
TOTAL 9,23,628 100.00 93,29,65,803 100.00
l) Categories of Shareholders is as under:
Category
31.03.2017 31.03.2016
No. of Shares
% No. of Shares
%
Financial Institutions 25,04,43,440 26.84 27,55,72,334 29.58
Foreign Institutional
Investors
16,11,32,756 17.27 15,13,62,292 16.25
Shares underlying
GDRs
1,76,21,579 1.89 1,92,13,684 2.06
Mutual Funds 10,32,87,263 11.07 7,67,74,808 8.24
Bodies Corporate 6,43,39,638 6.90 6,50,66,088 6.99
Directors & Relatives 15,09,274 0.16 14,49,515 0.16
L&T Employees
Welfare Foundation
11,47,52,281 12.30 11,47,52,281 12.32
General Public 21,98,79,572 23.57 22,72,87,843 24.40
TOTAL 93,29,65,803 100.00 93,14,78,845 100.00
Categories of Shareholders
as on March 31, 2017
Financial Institutions
26.84%
Foreign Institutional Investors17.27%
General Public23.57%
L&T Employees Welfare
Foundation12.30%
Bodies Corporate6.90%
Directors & Relatives0.16%
Mutual Funds11.07%
Shares underlying GDRs1.89%
m) Dematerialization of shares & Liquidity:
The Company’s Shares are required to be compulsorily traded in the Stock Exchanges in dematerialized form. The Company had sent letters to shareholders holding shares in physical form emphasizing the benefits of dematerialization.
The number of shares held in dematerialized and physical mode is as under:
No. of shares % of total
capital issued
Held in dematerialized form in NSDL 87,83,82,994 94.15
Held in dematerialized form in CDSL 3,58,86,237 3.85
Physical 1,86,96,572 2.00
Total 93,29,65,803 100.00
Shares held in Demat / Physical Form
as on March 31, 2017
NSDL87,83,82,994
94.15%
CDSL3,58,86,237
3.85%
Physical1,86,96,572
2.00%
n) Outstanding GDRs / ADRs / Warrants or any
Convertible Instruments, conversion date
and likely impact on equity:
The outstanding GDRs are backed up by underlying equity shares which are part of the existing paid-up capital.
The Company has the following Foreign Currency Convertible Bonds outstanding as on March 31, 2017:
0.675% USD 200 million Foreign Currency Convertible Bonds due 2019
(i) Principal Value of the Bonds issued USD 200 million
(ii) Principal Value of Bonds converted to
GDRs since issue.
NIL
(iii) Principal Value of Bonds outstanding
as at March 31, 2017
USD 200 million
(iv) Underlying Equity Shares / GDR’s
issued pursuant to conversion as per
(ii) above
NIL
(v) Underlying Equity Shares / GDR’s that
may be issued pursuant to conversion
notices in respect of (iii) above
63,46,986
shares
These Convertible Bonds are listed on the Singapore Exchange Securities Trading Limited.
o) Listing of Debt Securities:
The redeemable Non-Convertible debentures issued by the Company are listed on the Wholesale Debt Market (WDM) of National Stock Exchange of India Limited (NSE) and / or BSE Limited (BSE).
88
p) Debenture Trustees (for privately placed
debentures):
IDBI Trusteeship Services Limited Ground Floor, Asian Building, 17, R. Kamani Marg, Ballard Estate, Mumbai – 400 001.
q) Plant Locations:
The L&T Group’s facilities for design, engineering, manufacture, modular fabrication and production are based at multiple locations within India including Ahmednagar, Ankleshwar, Bengaluru, Chennai, Coimbatore, Faridabad, Hazira (Surat), Kattupalli (near Chennai), Kanchipuram, Mumbai, Navi Mumbai, Mysore, Pithampur, Puducherry, Rajpura, Kansbahal (Rourkela), Talegaon and Vadodara. L&T’s international manufacturing footprint covers the Gulf (Oman, Saudi Arabia, U.A.E), South East Asia (Malaysia and Indonesia) and the U.K. The L&T Group also has an extensive network of offices in India and around the globe. The presence of these offices appear on pages 12 and 13 of this Annual Report.
r) Address for correspondence:
Larsen & Toubro Limited, L&T House, Ballard Estate, Mumbai 400 001. Tel. No. (022) 6752 5656, Fax No. (022) 6752 5893
Shareholder correspondence may be directed to the Company’s Registrar and Share Transfer Agent, whose address is given below:
1. Karvy Computershare Pvt. Ltd. Unit: Larsen & Toubro Limited Karvy Selenium Tower B, Plot 31 & 32, Gachibowli, Financial District, Nanakramguda, Hyderabad, Telengana - 500 032. Tel : (040) 6716 2222 Toll free number: 1-800-3454-001 Fax: (040) 2342 0814 Email: [email protected] Website: www.karvycomputershare.com
2. Karvy Computershare Pvt. Ltd. Unit: Larsen & Toubro Limited 24-B, Raja Bahadur Mansion, Ground Floor, Ambalal Doshi Marg, Behind BSE Limited, Fort, Mumbai – 400 023. Tel : (022) 6623 5454/5412/5427
s) Investor Grievances:
The Company has designated an exclusive e-mail id viz. [email protected] to enable investors to register their complaints, if any. The Company strives to reply to the complaints within a period of 3 working days.
t) Securities Dealing Code:
Pursuant to the SEBI (Prohibition of Insider Trading) Regulations, 2015 (SEBI Insider Trading Regulations), the Company has suitably modified its Securities Dealing Code for prevention of insider trading with effect from May 15, 2015. The objective of the Code is to prevent purchase and / or sale of shares of the Company by an Insider on the basis of unpublished price sensitive information. Under this Code, Designated Persons (Directors, Advisors, Officers and other concerned employees / persons) are prevented from dealing in the Company’s shares during the closure of Trading Window. To deal in securities beyond specified limit, permission of Compliance Officer is also required. All the Designated Employees are also required to disclose related information periodically as defined in the Code. Directors and designated employees who buy and sell shares of the Company are prohibited from entering into an opposite transaction i.e sell or buy any shares of the Company during the next six months following the prior transactions. Directors and designated employees are also prohibited from taking positions in the derivatives segment of the Company’s shares.
Mr. N. Hariharan, Company Secretary has been designated as the Compliance Officer.
The Company has appointed Mr. Arnob Mondal, Vice President (Corporate Accounts & Investor Relations), as Chief Investor Relations Officer. The Company also formulated Code of Practices and Procedures for Fair Disclosure of Unpublished Price Sensitive Information which is available on Company’s Website http://investors.larsentoubro.com/Listing-Compliance.aspx.
u) Awareness Sessions / Workshops on
Governance practices:
Employees across the Company as well as the group are being sensitized about the various policies and governance practices of the Company. The Company had designed in-house training workshops on Corporate Governance with the help of an external faculty

89
covering basics of Corporate Governance as well as internal policies and compliances under Code of Conduct, Whistle Blower Policy, Sexual Harassment of Women at Workplace (Prevention, Prohibition & Redressal) Act, 2013, SEBI Insider Trading Regulations, etc. Workshops were conducted during the last year to create a batch of trainers across various businesses. These trainers have in turn conducted training / awareness sessions within their business and covered almost all employees in supervisory and above cadre since last year. A similar session was also conducted for senior management by external experts on Compliance & Governance.
The Company will continue to conduct such workshops / sessions on a regular basis.
v) ISO 9001:2008 Certification:
The Company’s Secretarial Department which provides secretarial services and investor services for the Company and its Subsidiary and Associate Companies, is ISO 9001:2008 certified.
w) Secretarial Audit as per SEBI requirements:
As stipulated by SEBI, a Qualified Practicing Company Secretary carries out Reconciliation of Share Capital Audit to reconcile the total admitted capital with National Securities
Depository Limited (NSDL) and Central Depository Services (India) Limited (CDSL) and the total issued and listed capital. This audit is carried out every quarter and the report thereon is submitted to the Stock Exchanges. The Audit confirms that the total Listed and Paid-up capital is in agreement with the aggregate of the total number of shares in dematerialized form and in physical form.
The secretarial department of the Company at Mumbai is manned by competent and experienced professionals. The Company has a system to review and audit its secretarial and other statutory compliances by competent professionals, who are employees of the Company. Appropriate actions are taken to continuously improve the quality of compliance.
The Company also has adequate software and systems to monitor compliance.
x) Secretarial Audit as per Companies Act, 2013:
Pursuant to the provisions of section 204(1) of the Companies Act, 2013, S. N. Ananthasubramanian & Co., Company Secretaries, conducts the secretarial audit of the compliance of applicable statutory provisions and the adherence of good corporate practices by the Company.
90
To the Board of Directors of Larsen & Toubro Limited
Dear Sirs,
Sub: CEO / CFO Certificate
{Issue in accordance with provisions of Regulation 17(8) of SEBI
(Listing Obligations & Disclosure Requirements) Regulations, 2015}
We have reviewed the consolidated financial statements, read with the consolidated cash flow statement of Larsen &
Toubro Limited for the year ended March 31, 2017 and that to the best of our knowledge and belief, we state that;
(a) (i) These statements do not contain any materially untrue statement or omit any material fact or contain
statements that may be misleading;
(ii) These statements present a true and fair view of the Company’s affairs and are in compliance with current
accounting standards, applicable laws and regulations.
(b) There are, to the best of our knowledge and belief, no transactions entered into by the Company during the year
which are fraudulent, illegal or in violation of the Company’s code of conduct.
(c) We accept responsibility for establishing and maintaining internal controls for financial reporting. We have evaluated
the effectiveness of internal control systems of the Company and have disclosed to the Auditors and the Audit
Committee, deficiencies, if any, in the design or operation of such internal controls of which we are aware and steps
taken or propose to be taken for rectifying these deficiencies.
(d) We have indicated to the Auditors and the Audit Committee:
(i) that there were no significant changes in internal controls over financial reporting during the year; and
(ii) the significant changes in accounting policies made during the year pursuant to adoption of accounting
standards prescribed vide Companies (indian Accounting Standards) Rules, 2015 and
(iii) that there were no instances of significant fraud of which we have become aware.
Yours sincerely,
R. Shankar Raman A. M. Naik
Chief Financial Officer Group Executive Chairman
Place: Mumbai
Date: May 29, 2017

91
Independent Auditors’ certificate on Employee Stock Option Schemes
1. We have examined Employees Stock Option Schemes (“the Schemes”) of Larsen & Toubro Limited (“the Company”), books of accounts and other relevant records to determine whether the Schemes are in accordance with the rules specified under the Securities and Exchange Board of India (Share Based Employee Benefits) Regulations, 2014 (as amended) (“the Regulations”) and in accordance with the resolutions passed in the general meetings held on 26 August 1999, 22 August 2003 and 25 August 2006 (“the General Meetings).
Management’s responsibility
2. Management is responsible for maintaining the information and documents, which are required to be kept and maintained under the relevant laws and regulations and implementing the Schemes in accordance with the Regulations and the resolutions passed at the General Meetings.
Auditors’ responsibility
3. Our responsibility is limited to examining the procedures and implementation thereof, adopted by the Company for ensuring implementation of the Schemes in accordance with the Regulations and the resolutions passed at the General Meetings. It is neither audit nor expression of opinion on the financial statements of the Company.
4. We have examined the books of accounts and other relevant records and documents maintained by the Company for the purpose of providing reasonable assurance on the implementation of the Schemes by the Company in accordance with the Regulations and the resolutions passed at the General Meetings.
5. We have carried out an examination of the schemes, books of accounts and other relevant records of the Company in accordance with the Guidance Note on Reports or Certificates for Special Purpose (Revised 2016) issued by the Institute of Chartered Accountants of India (“the ICAI”), which requires that we comply with the ethical requirements of the Code of Ethics issued by the ICAI.
6. We have complied with the relevant applicable requirements of the Standard on Quality Control (SQC) 1, Quality Control for Firms that Perform Audits and Reviews of Historical Financial Information, and Other Assurance and related services engagements.
Opinion
7. Based on our examination of the relevant records and according to the information and explanation provided to us and representations provided by management, we certify that the Company has implemented the Schemes in accordance with the Regulations and the resolutions passed at the General Meetings.
Restriction on use
8. The certificate is issued solely for the purpose of complying with the Regulations and may not be suitable for any other purpose.
SHARP & TANNANChartered Accountants
Firm’s Registration No.109982Wby the hand of
FIRDOSH D. BUCHIAPartner
Mumbai, 29 May 2017 Membership No.038332
92
Independent Auditors’ certificate on corporate governance
To the members of Larsen & Toubro Limited
1. We have examined the compliance of conditions of corporate governance by Larsen & Toubro Limited (“the
Company”), for the year ended on 31 March 2017, as stipulated in regulation 17 to 27 and clause (b) to (i) of
regulation 46(2) and paragraphs C, D and E of Schedule V of the Securities and Exchange Board of India (Listing
Obligations and Disclosure Requirements) Regulations, 2015 (“SEBI Listing Regulations”).
Management’s responsibility
2. The compliance of conditions of corporate governance is the responsibility of management. This responsibility
includes the design, implementation and maintenance of internal control and procedures to ensure compliance with
the conditions of corporate governance stipulated in the SEBI Listing Regulations.
Auditors’ responsibility
3. Our responsibility is limited to examining the procedures and implementation thereof, adopted by the Company for
ensuring the compliance of the conditions of the corporate governance. It is neither audit nor expression of opinion
on the financial statements of the Company.
4. We have examined the books of accounts and other relevant records and documents maintained by the Company
for the purpose of providing reasonable assurance on the compliance with corporate governance requirements by
the Company.
5. We have carried out an examination of the relevant records of the Company in accordance with the Guidance Note
on Certification of Corporate Governance issued by the Institute of Chartered Accountants of India (“the ICAI”), the
Standards on Auditing specified under Section 143(10) of the Companies Act, 2013, in so far as applicable for the
purpose of this certificate and as per the Guidance Note on Reports or Certificates for Special Purpose issued by the
ICAI which requires that we comply with the ethical requirements of the Code of Ethics issued by the ICAI.
6. We have complied with the relevant applicable requirements of the Standard on Quality Control (SQC) 1, Quality
Control for Firms that Perform Audits and Reviews of Historical Financial Information, and Other Assurance and
Related Services Engagements.
Opinion
7. Based on our examination of the relevant records and according to the information and explanation provided to us
and representations provided by management, we certify that the Company has complied with the conditions of
corporate governance as specified in regulation 17 to 27, clause (b) to (i) of regulation 46(2) and paragraphs C, D
and E of Schedule V of the SEBI Listing Regulations, as applicable during the year ended 31 March 2017.
8. We state that such compliance is neither an assurance as to the future viability of the Company nor the efficiency or
effectiveness with which the management has conducted the affairs of the Company.
Restriction on use
9. The certificate is issued solely for the purpose of complying with the aforesaid SEBI Listing Regulations and may not
be suitable for any other purpose.
SHARP AND TANNAN
Chartered Accountants
Firm’s Registration No. 109982W
by the hand of
FIRDOSH D. BUCHIA
Partner
Mumbai, 29 May 2017 Membership No. 038332

93
CSR ACTIVITIES FOR 2016-17
1. A brief outline of the Company’s CSR policy,
including overview of projects or programs
proposed to be undertaken and a reference to
the web-link to the CSR policy and projects or
programs.
The CSR projects of the Company are focused on communities that are disadvantaged, vulnerable and marginalized. We strive to contribute positively to improve their standard of living; through our interventions in water & sanitation, heath, education and skill development.
The Company’s CSR Policy framework details the mechanisms for undertaking various programmes in accordance with Section 135 of the Companies Act, 2013 (the Act) for the benefit of the community.
The Company will primarily focus on ‘Building India’s
Social Infrastructure’ as part of its CSR programme which will include, amongst others, the following areas, viz.
Water & Sanitation - may include but not limited to watershed development, making clean drinking water available, promoting rain water harvesting, soil and moisture conservation, enhancing ground water levels by facilitating community management of water resources for improving conditions related to sanitation, health, education and livelihoods of communities through an integrated approach.
Education - may include but not limited to education infrastructure support to educational Institutions, educational programs & nurturing talent at various levels.
Health - may include but not limited to community health centres, mobile medical vans, dialysis centres, general and specialized health camps and outreach programs, support to HIV / AIDS, Tuberculosis control programs.
Skill Development - may include but not limited to vocational training such as skill building, computer training, women empowerment, support to ITI’s, support to specially abled (infrastructure support & vocational training), Construction Skills Training Centres and providing employability skills to women and youth.
Governance, Technology and Innovation would be the Key enabling factors across all these verticals.
The detailed CSR Policy Framework is given in the Governance section on the website of the Company. Please see the link http://investors.larsentoubro.com/Listing-Compliance.aspx.
2. Composition of the CSR Committee.
The CSR Committee of the Board comprises of one Independent Director and two Executive Directors. The Company Secretary acts as Secretary to the Committee.
The present Committee comprises of Mr. Vikram Singh Mehta as Chairman, Mr. R. Shankar Raman and Mr. D.K. Sen as members and Mr. N. Hariharan as the Secretary of the Committee.
3. Average net profit of the Company for the last
three financial years.
The average net profit of the Company for the last three financial years ` 4948.63 crore.
4. Prescribed CSR expenditure (two percent of the
amount as in item 3 above).
The Company was required to spend an amount of ` 98.97 crore as CSR expenditure during the financial year 2016-17.
5. Details of CSR spent during the financial year:
a. Total amount to be spent for the financial
year
The Company was required to spend ` 98.97 crore during the financial year 2016-17. As against this mandate, the Company spent ` 100.77 crore towards various activities for the benefit of the community. This exceeds the required spend by ` 1.8 crore. The CSR spend for FY 2016-17 is 2.04% of the average net profit under Section 135 of the Companies Act, 2013.
b. Amount unspent, if any
Nil
c. Manner in which the amount was spent in
the financial year is detailed below:
As per table enclosed
Annexure ‘C’ to the Board Report

94
6. Reasons for not spending the amount during the
financial year.
NA
7. CSR Committee Responsibility Statement:
The CSR Committee hereby affirms that:
The Company has duly formulated a CSR Policy Framework which includes formulation of a CSR Theme, CSR budget and roles and responsibilities of the Committee as well as the various internal committees formed for implementation of the CSR policy;
The Company has constituted a mechanism to monitor and report on the progress of the CSR programs;
The activities undertaken by the Company as well as the implementation and monitoring mechanisms are in compliance with its CSR objectives and CSR policy.
S. N. Subrahmanyan Vikram Singh Mehta
Deputy Managing Director& President
DIN: 02255382
Chairman – CSR Committee
DIN: 00041197

95
S. No. CSR Project or activity identified Sector in which the project is covered
Projects or Programs 1. Local Area or other 2. Specify the state and district
where projects or program was undertaken
Amount outlay
(budget) project or Program-wise (` In
Lakh)
Direct expenditure on projects
or programs(` In Lakh)
Overhead(` In
Lakh)
Cumulative expenditure upto to the
reporting period (` In
Lakh)
Amount spent: direct or through implementing agency*
1 School support programme-Enhancing the quality of education and learning levels in government schools/ schools running for children from underprivileged backgrounds(teachers training, innovative teaching methodology , support for English and Mathematics, capacity building, promoting extra curricular activities)
Education Punjab & Haryana (Chandigarh, Faridabad), Gujarat (Surat, Vadodara, Ahmedabad), Karnataka (Bangalore, Mysore), Maharashtra (Pune, Mumbai), New Delhi, Orissa (Kansbhal, Sundargarh), Tamil Nadu (Coimbatore, Kancheepuram, Chennai), Uttar Pradesh (Lucknow), West Bengal (Kolkata)
721.86 706.69 48.43 755.12 Implementing agencies
2 Community based programmes-Study Centres/ balwadis/anganwadis run for developing pre school foundation, promoting healthy and hygienic environment for education, developing the learning levels of children at par with their mainstream grades and providing nutritional supplements
Education Maharashtra (Mumbai), Orissa (Raygada), Uttar Pradesh (Bulandshahr)
167.27 158.33 15.89 174.22 Implementing agencies
3 Providing infrastructure support for education (drinking water and sanitation facilities,renovation of classrooms, water proofing of school buildings, providing furniture and light fittings, e-learning facilities, upgradation of libraries, playground development)
Education Telangana (Ranga Reddy, Medak), Andhra Pradesh (Visakahapatnam), Assam (Guwahati), Bihar (Patna), Gujarat (Surat, Jamnagar, Surendranagar), Punjab & Haryana (Faridabad, Chandigarh), Jharkhand (East Singhbhum), Karnataka (Bangalore), Kerala (Kochi), Madhya Pradesh (Bhopal, Khandwa), Maharashtra (Mumbai, Ahmednagar, Nagpur, Talegaon), New Delhi, Orissa (Rourkela, Sundargarh, Bhubaneshwar, Sambalpur, Cuttack), Rajasthan (Jaipur,Barmer, Pali), Tamil Nadu (Coimbatore, Chennai, Cadalore, Dindugul, Pudukottai),Uttar Pradesh (Lucknow, Allahabad, Chandoli, Rampur), West Bengal (Kolkata, Darjeeling, Murshidabad, North 24 parganas, South 24 parganas)
504.36 467.52 19.52 487.04 Direct
4 Providing educational aids to children- books, stationery, sports equipments, uniforms, school bags, shoes, wollen clothes, raincoats etc
Education Andra Pradesh (Hyderabad), Gujarat (Vadodara), Karnataka (Bangalore), Madhya Pradesh (Khargone), Maharashtra (Nagpur, Talegaon), Orissa (Sundargarh), Rajasthan (Pali), Tamil Nadu (Coimbatore, Chennai), Uttar Pradesh (Lucknow) Chattisgarh (Janjgir Champa), West Bengal (Kolkata)
28.65 26.35 1.46 27.81 Direct

96
S. No. CSR Project or activity identified Sector in which the project is covered
Projects or Programs 1. Local Area or other 2. Specify the state and district
where projects or program was undertaken
Amount outlay
(budget) project or Program-wise (` In
Lakh)
Direct expenditure on projects
or programs(` In Lakh)
Overhead(` In
Lakh)
Cumulative expenditure upto to the
reporting period (` In
Lakh)
Amount spent: direct or through implementing agency*
5 Community Health Centres
(running multi-specialty
centers offering diagnostic
services including family
planning, gynecological,
pediatric, immunization, chest
& TB, ophthalmic consultation,
dialysis services, HIV/
AIDS awareness, detection,
treatment, counseling services
to the community)
Health Maharashtra (Ahmednagar,
Mumbai, Thane), Gujarat (Surat)
452.37 410.16 31.82 441.98 Direct
6 Health Camps (general, eye,
dental, vaccinations) and
health awareness
Health Jharkhand (Jamshedpur), Madhya
Pradesh (Bhopal), Maharashtra
(Nagpur), New Delhi, Orissa
(Bhubaneswar), West Bengal
(Kolkata)
6.50 8.04 0.49 8.53 Direct
7 Community Health Initiatives
(Support for preventive ,
diagnostic and curative
services, awareness & camps)
Health Andhra Pradesh
(Vishakhapatnam), Gujarat (Surat,
Ranoli, Vadodara), Haryana
(Faridabad), Jharkhand (Ranchi),
Karnataka (Bangalore), Madhya
Pradesh (Singrauli), Maharashtra
(Mumbai, Ahmednagar,
Talegaon), Orissa (Kansbahal,
Rayagada), Rajasthan (Chhabra,
Banswara, Nagaur), Tamil Nadu
(Kancheepuram, Chennai), West
Bengal (Kolkata)
220.68 204.67 17.75 222.42 Implementing
agencies
8 Blood donation camps Health Andhra Pradesh (Hyderabad),
Gujarat (Vadodara), Jharkhand
(Jamshedpur, Ranchi), Kerala
(Kochi), Madhya Pradesh (Bhopal),
Maharashtra (Nagpur, Pune),
Rajasthan (Jaipur, Banswara,
Nagur) Tamil Nadu (Coimbatore,
Chennai), Uttar Pradesh
(Lucknow), West Bengal (Kolkata)
3.60 3.35 0.22 3.57 Implementing
agencies
9 Infrastructure support to
medical centres
Health Telangana (Ranga Reddy),
Gujrat (Karamsad), Haryana
(Faridabad), Karnataka (Kudgi),
West Bengal (Kolkata), Madhya
Pradesh (Malwa, Jabalpur), Tamil
Nadu (Chennai), Uttarakhand
(Rudraprayag), West Bengal
(Kolkata)
981.00 975.68 75.00 1,050.68 Direct
10 Construction Skill Training
Institute - CSTI
Skill Building Andhra Pradesh (Hyderabad),
Gujarat (Ahmedabad),
Maharashtra (Panvel), Karnataka
(Bangalore), Orissa (Cuttack),
Tamil Nadu (Kanchipuram,
Pulicat), Delhi (Pilkhuwa), West
Bengal (Srirampore)
3,536.90 3,510.61 60.94 3,571.55 Direct
11 Computer training for youth Skill Building Gujarat (Surat) 47.00 46.89 1.14 48.03 Implementing
agencies

97
S. No. CSR Project or activity identified Sector in which the project is covered
Projects or Programs 1. Local Area or other 2. Specify the state and district
where projects or program was undertaken
Amount outlay
(budget) project or Program-wise (` In
Lakh)
Direct expenditure on projects
or programs(` In Lakh)
Overhead(` In
Lakh)
Cumulative expenditure upto to the
reporting period (` In
Lakh)
Amount spent: direct or through implementing agency*
12 Vocational Training Skill Building Gujarat (Vadodara), Madhya
Pradesh (Malwa), Maharashtra
(Mumbai), Rajasthan (Chhabra),
Tamil Nadu (Coimbatore,
Chennai), Uttar Pradesh
(Lucknow)
137.95 128.13 15.53 143.66 Implementing
agencies
13 Women empowerment
through vocational training
Skill Building Orissa (Raygada), Rajasthan
(Jaipur), Tamil Nadu (Chennai),
West Bengal (Kolkata)
17.89 16.33 1.59 17.92 Implementing
agencies
14 Skill building for differently
abled
Persons with
disabilities
Andhra Pradesh
(Vishakhapatnam), Gujarat
(Surat), Madhya Pradesh (Bhopal),
Maharashtra (Nagpur, Pune), New
Delhi, Orissa (Bhubaneswar), Tamil
Nadu (Coimbatore, Chennai), West
Bengal (Kolkata)
43.09 43.74 3.69 47.43 Implementing
agencies
15 Basic infrastructure support in
the community (Water, Health,
Sanitation, roads etc.)
Community
Development
Gujarat (Surat), Jharkhand
(Bokaro, Jamshedpur, Ranchi),
Madhya Pradesh (Khargone),
Maharashtra (Thane, Talegaon),
Orissa (Kansbhal, Balangir),
Rajasthan (Jodhpur, Barmer), Uttar
Pradesh (Lucknow), Uttarakhand
(Rudra Prayag)
937.49 924.88 48.45 973.33 Direct
16 Integrated Community
Development Programme
Community
Development
Maharashtra (Ahmednagar),
Rajasthan (Rajsamand, Udaipur),
Tamil Nadu (Coimbatore)
1,329.71 1,115.70 86.70 1,202.40 Implementing
agencies
17 Greening of public spaces Environment Maharashtra (Mumbai, Nasik,
Ahmednagar, Talegaon), Gujarat
(Vadodara), Tamil nadu (Chennai)
638.54 596.37 55.07 651.44 Direct
18 Tree plantation and
environment protection
Environment Andhra Pradesh (Hyderabad,
Vishakhapatnam), Haryana
(Chandigarh), Gujarat
(Surat, Vadodara, Jamnagar,
Surendranagar), Jharkhand
(Jamshedpur, Ranchi), Kerla
(Kochi), Madhya Pradesh (Bhopal),
Maharashtra (Talegaon), New
Delhi, Orissa (Rourkela, Cuttack,
Sundergarh, Salepur), Rajasthan
(Naguar, Jaipur, Banswara,
Jaisalmer ), Tamil Nadu (Chennai,
Cuddalore), Uttar Pradesh
(Lucknow)
42.70 42.62 1.59 44.21 Direct
19 Awareness
programmes- environment,
energy conservation,road
safety
Environment Maharashtra (Nagpur,
Ahmednagar), Andhra
Pradesh (Vishakhapatnam),
Gujarat (Vadodara), Rajasthan
(Jhunjhunun)
10.63 8.08 0.54 8.62 Implementing
agencies

98
S. No. CSR Project or activity identified Sector in which the project is covered
Projects or Programs 1. Local Area or other 2. Specify the state and district
where projects or program was undertaken
Amount outlay
(budget) project or Program-wise (` In
Lakh)
Direct expenditure on projects
or programs(` In Lakh)
Overhead(` In
Lakh)
Cumulative expenditure upto to the
reporting period (` In
Lakh)
Amount spent: direct or through implementing agency*
20 Employee led community
initiatives
Employee
Volunteering
Andhra Pradesh (Hyderabad,
Vishakhapatnam), Maharashtra
(Mumbai, Pune, Ahmednagar,
Nagpur) Gujarat (Surat, Vadodara),
Orrisa (Sundergarh), Karnataka
(Bangalore), Tamil Nadu
(Chennai), West Bengal (Kolkata),
Jharkhand (Jamshedpur)
193.81 182.86 14.18 197.04 Direct
Total 10,022.00 9,577.00 500.00 10,077.00
Key Implementing Agencies Arpan Seva Sansthan , Seva Mandir, Watershed Organisation Trust , National Agro Foundation, Pratham Education Foundation, Save the Children , NavNirmiti
Eduquality, Angel Xpress Foundation , Children Toy Foundation ,Prayas Trust , St Jude India Childcare Centre, Swami Vivekananda Rural Development Society ,
Balamandir Kamraj Trust , Environmentalist Foundation of India ,Deaf enabled foundation of India , Tanker foundation ,Swami Vivekananda Youth Movement, Sankara
Nethralaya Medical Research Foundation , Deendayal Foundation , Womens India Association ( Adyar Cancer Institute), Charutar Arogya Mandal.
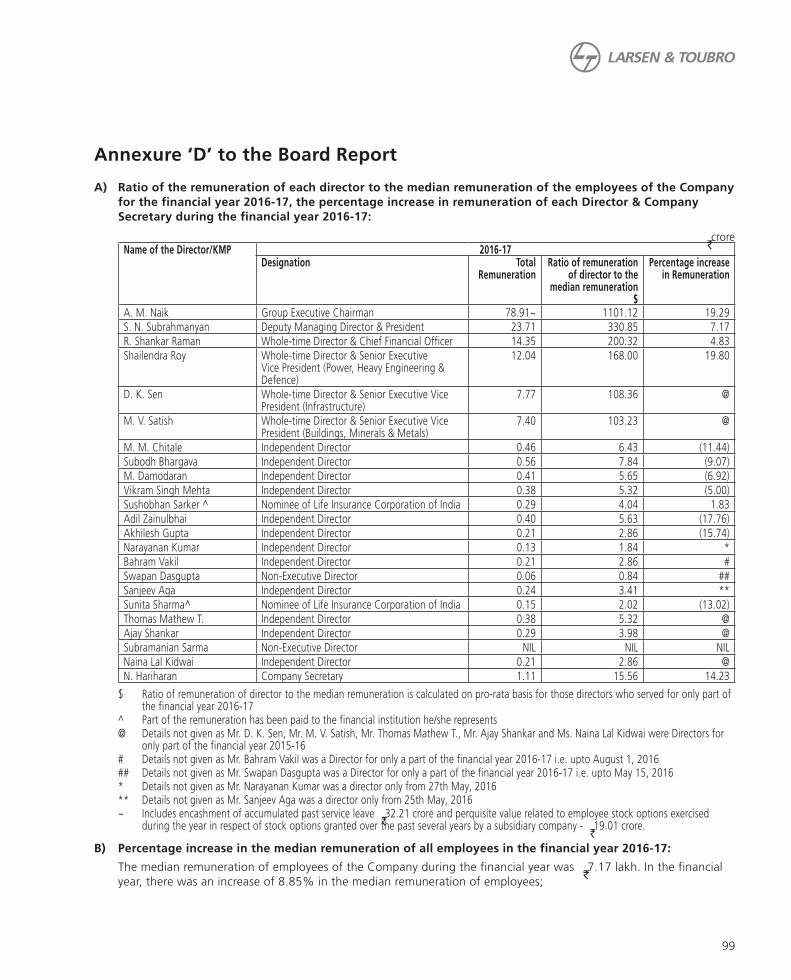
99
Annexure ‘D’ to the Board Report
A) Ratio of the remuneration of each director to the median remuneration of the employees of the Company
for the financial year 2016-17, the percentage increase in remuneration of each Director & Company
Secretary during the financial year 2016-17:
` croreName of the Director/KMP 2016-17
Designation Total
Remuneration
Ratio of remuneration
of director to the
median remuneration
$
Percentage increase
in Remuneration
A. M. Naik Group Executive Chairman 78.91~ 1101.12 19.29S. N. Subrahmanyan Deputy Managing Director & President 23.71 330.85 7.17R. Shankar Raman Whole-time Director & Chief Financial Officer 14.35 200.32 4.83Shailendra Roy Whole-time Director & Senior Executive
Vice President (Power, Heavy Engineering & Defence)
12.04 168.00 19.80
D. K. Sen Whole-time Director & Senior Executive Vice President (Infrastructure)
7.77 108.36 @
M. V. Satish Whole-time Director & Senior Executive Vice President (Buildings, Minerals & Metals)
7.40 103.23 @
M. M. Chitale Independent Director 0.46 6.43 (11.44)Subodh Bhargava Independent Director 0.56 7.84 (9.07)M. Damodaran Independent Director 0.41 5.65 (6.92)Vikram Singh Mehta Independent Director 0.38 5.32 (5.00)Sushobhan Sarker ^ Nominee of Life Insurance Corporation of India 0.29 4.04 1.83Adil Zainulbhai Independent Director 0.40 5.63 (17.76)Akhilesh Gupta Independent Director 0.21 2.86 (15.74)Narayanan Kumar Independent Director 0.13 1.84 *Bahram Vakil Independent Director 0.21 2.86 #Swapan Dasgupta Non-Executive Director 0.06 0.84 ##Sanjeev Aga Independent Director 0.24 3.41 **Sunita Sharma^ Nominee of Life Insurance Corporation of India 0.15 2.02 (13.02)Thomas Mathew T. Independent Director 0.38 5.32 @Ajay Shankar Independent Director 0.29 3.98 @Subramanian Sarma Non-Executive Director NIL NIL NILNaina Lal Kidwai Independent Director 0.21 2.86 @N. Hariharan Company Secretary 1.11 15.56 14.23
$ Ratio of remuneration of director to the median remuneration is calculated on pro-rata basis for those directors who served for only part of the financial year 2016-17
^ Part of the remuneration has been paid to the financial institution he/she represents @ Details not given as Mr. D. K. Sen, Mr. M. V. Satish, Mr. Thomas Mathew T., Mr. Ajay Shankar and Ms. Naina Lal Kidwai were Directors for
only part of the financial year 2015-16 # Details not given as Mr. Bahram Vakil was a Director for only a part of the financial year 2016-17 i.e. upto August 1, 2016 ## Details not given as Mr. Swapan Dasgupta was a Director for only a part of the financial year 2016-17 i.e. upto May 15, 2016 * Details not given as Mr. Narayanan Kumar was a director only from 27th May, 2016 ** Details not given as Mr. Sanjeev Aga was a director only from 25th May, 2016 ~ Includes encashment of accumulated past service leave ` 32.21 crore and perquisite value related to employee stock options exercised
during the year in respect of stock options granted over the past several years by a subsidiary company - ` 19.01 crore.
B) Percentage increase in the median remuneration of all employees in the financial year 2016-17:
The median remuneration of employees of the Company during the financial year was ` 7.17 lakh. In the financial year, there was an increase of 8.85% in the median remuneration of employees;

100
C) Number of permanent employees on the rolls of Company as on March 31, 2017:
There were 41,466 permanent employees on the rolls of Company as on March 31, 2017;
D) Average percentile increase already made in the salaries of the employees other than the managerial
personnel in the last financial year and its comparison with the percentile increase in the managerial
remuneration and justification thereof and point out if there are any exceptional circumstances for
increase in managerial remuneration:
Average percentage increase made in the salaries of employees other than the managerial personnel for the year 2016-17 was 4.54% whereas there is increase in the managerial remuneration by 11.6% because a substantial portion of managerial remuneration is linked to Company performance during the financial year 2016-17. The Profit after Tax for the year 2016-17 increased by 9% directly impacting the variable component of managerial remuneration. Further, the managerial remuneration for this purpose also includes perquisite value of employee stock options exercised during the year and the encashment of accumulated past service leave but excludes gratuity and leave encashment benefits payable on retirement;
E) Affirmation that the remuneration is as per the remuneration policy of the Company:
It is hereby affirmed that the remuneration paid is as per the Remuneration Policy for Directors, Key Managerial Personnel and other Employees.

101
Annexure ‘E’ to the Board Report
To,The Members,Larsen & Toubro Limited CIN L99999MH1946PLC004768L&T House,Ballard Estate,Mumbai – 400 001.
Our Secretarial Audit Report for the Financial Year ended 31st March, 2017, of even date is to be read along with this letter.
Management’s Responsibility
1. It is the responsibility of the management of the Company to maintain secretarial records, devise proper systems to ensure compliance with the provisions of all applicable laws and regulations and to ensure that the systems are adequate and operate effectively.
Auditor’s Responsibility
2. Our responsibility is to express an opinion on these secretarial records, standards and procedures followed by the Company with respect to secretarial compliances.
3. We believe that audit evidence and information obtained from the Company’s management is adequate and appropriate for us to provide a basis for our opinion.
4. Wherever required, we have obtained the management’s representation about the compliance of laws, rules and regulations and happening of events etc.
Disclaimer
5. The Secretarial Audit Report is neither an assurance as to the future viability of the Company nor of the efficacy or effectiveness with which the management has conducted the affairs of the Company.
6. We have not verified the correctness and appropriateness of financial records and books of accounts of the Company.
For S. N. ANANTHASUBRAMANIAN & CO.
Company Secretaries
S. N. ANANTHASUBRAMANIAN
PARTNERC.P No: 1774
Date: May 18, 2017Place: Thane.
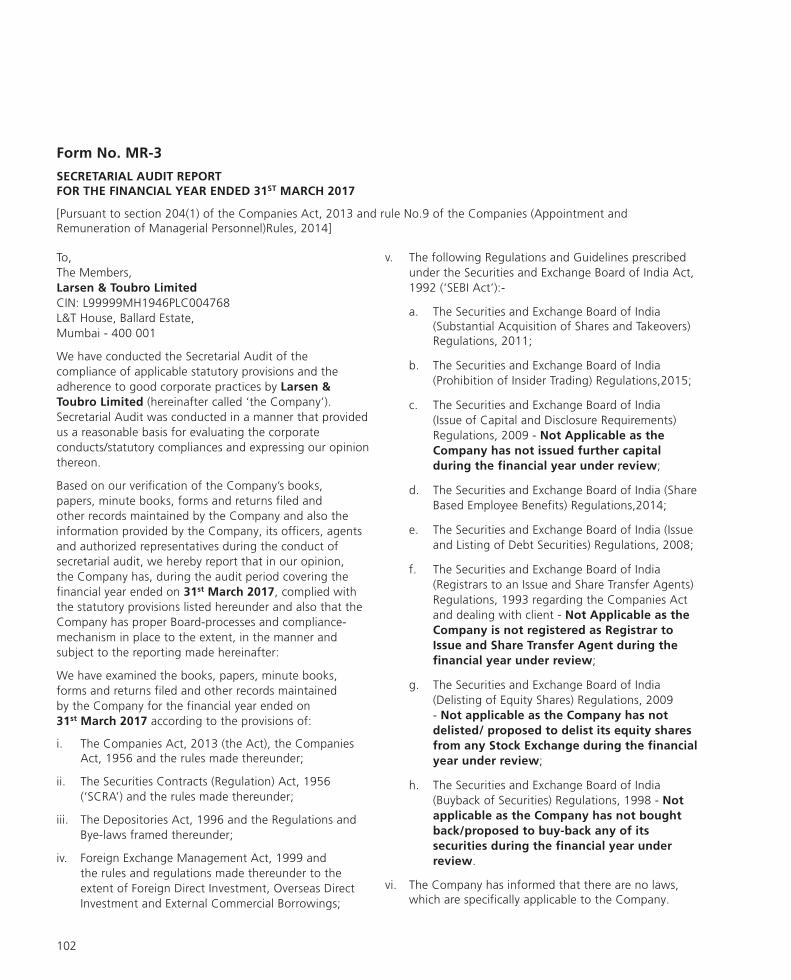
102
To,
The Members,
Larsen & Toubro Limited
CIN: L99999MH1946PLC004768
L&T House, Ballard Estate,
Mumbai - 400 001
We have conducted the Secretarial Audit of the
compliance of applicable statutory provisions and the
adherence to good corporate practices by Larsen &
Toubro Limited (hereinafter called ‘the Company’).
Secretarial Audit was conducted in a manner that provided
us a reasonable basis for evaluating the corporate
conducts/statutory compliances and expressing our opinion
thereon.
Based on our verification of the Company’s books,
papers, minute books, forms and returns filed and
other records maintained by the Company and also the
information provided by the Company, its officers, agents
and authorized representatives during the conduct of
secretarial audit, we hereby report that in our opinion,
the Company has, during the audit period covering the
financial year ended on 31st March 2017, complied with
the statutory provisions listed hereunder and also that the
Company has proper Board-processes and compliance-
mechanism in place to the extent, in the manner and
subject to the reporting made hereinafter:
We have examined the books, papers, minute books,
forms and returns filed and other records maintained
by the Company for the financial year ended on
31st March 2017 according to the provisions of:
i. The Companies Act, 2013 (the Act), the Companies Act, 1956 and the rules made thereunder;
ii. The Securities Contracts (Regulation) Act, 1956
(‘SCRA’) and the rules made thereunder;
iii. The Depositories Act, 1996 and the Regulations and
Bye-laws framed thereunder;
iv. Foreign Exchange Management Act, 1999 and
the rules and regulations made thereunder to the
extent of Foreign Direct Investment, Overseas Direct
Investment and External Commercial Borrowings;
v. The following Regulations and Guidelines prescribed
under the Securities and Exchange Board of India Act,
1992 (‘SEBI Act’):-
a. The Securities and Exchange Board of India (Substantial Acquisition of Shares and Takeovers) Regulations, 2011;
b. The Securities and Exchange Board of India
(Prohibition of Insider Trading) Regulations,2015;
c. The Securities and Exchange Board of India
(Issue of Capital and Disclosure Requirements)
Regulations, 2009 - Not Applicable as the
Company has not issued further capital
during the financial year under review;
d. The Securities and Exchange Board of India (Share
Based Employee Benefits) Regulations,2014;
e. The Securities and Exchange Board of India (Issue
and Listing of Debt Securities) Regulations, 2008;
f. The Securities and Exchange Board of India
(Registrars to an Issue and Share Transfer Agents)
Regulations, 1993 regarding the Companies Act
and dealing with client - Not Applicable as the
Company is not registered as Registrar to
Issue and Share Transfer Agent during the
financial year under review;
g. The Securities and Exchange Board of India
(Delisting of Equity Shares) Regulations, 2009
- Not applicable as the Company has not
delisted/ proposed to delist its equity shares
from any Stock Exchange during the financial
year under review;
h. The Securities and Exchange Board of India
(Buyback of Securities) Regulations, 1998 - Not
applicable as the Company has not bought
back/proposed to buy-back any of its
securities during the financial year under
review.
vi. The Company has informed that there are no laws, which are specifically applicable to the Company.
Form No. MR-3
SECRETARIAL AUDIT REPORT
FOR THE FINANCIAL YEAR ENDED 31ST MARCH 2017
[Pursuant to section 204(1) of the Companies Act, 2013 and rule No.9 of the Companies (Appointment and Remuneration of Managerial Personnel)Rules, 2014]

103
We have also examined compliance with the applicable
provisions of the following:
(i) Secretarial Standards with regard to Meetings of Board of Directors (SS-1) and General Meetings (SS-2) issued by The Institute of Company Secretaries of India;
(ii) The Listing Agreements entered into by the Company with National Stock Exchange of India Limited and BSE Limited and SEBI (Listing Obligations and Disclosure Requirements), Regulations, 2015.
During the period under review the Company has
complied with the provisions of the Act, Rules,
Regulations, Guidelines, Standards, etc. mentioned above.
We further report that: -
The Board of Directors of the Company is duly constituted with proper balance of Executive Directors, Non-Executive Directors including Independent Directors and Women Directors. The changes in the composition of the Board of Directors which took place during the period under review were carried out in compliance with the provisions of the Act.
Adequate notice is given to all Directors to schedule the Board Meetings, agenda and detailed notes on agenda were sent atleast seven days in advance, and a system exists for seeking and obtaining further information and clarifications on the agenda items before the meeting and for meaningful participation at the meeting.
All decisions of Board and Committee meetings were carried with requisite majority.
We further report that based on review of compliance
mechanism established by the Company and on the basis
of the Compliance Certificate(s) issued by the Company
Secretary and taken on record by the Board of Directors
at their meeting(s), we are of the opinion that there are
adequate systems and processes in place in the Company
which is commensurate with the size and operations of
the Company to monitor and ensure compliance with
applicable laws, rules, regulations and guidelines: -
As informed, the Company has responded to notices for demands, claims, penalties, etc., levied by various statutory /regulatory authorities and initiated actions for corrective measures, wherever found necessary.
We further report that during the audit period
The shareholders at the General Meeting convened by National Company Law Tribunal, Mumbai Bench (“NCLT”) on 14th March 2017, approved a Scheme of Arrangement (“Scheme”) between the Company
and L&T Valves Limited and their respective
shareholders and Creditors for transfer of Coimbatore Undertaking (as defined in the Scheme) of the Company as a going concern to L&T Valves
Limited for a consideration ` 43.79 Crore, by way of a Resolution requiring requisite majority. The NCLT approved the said Scheme vide their Order dated 20th April 2017.
The Board of Directors at its meeting held on 28th January 2017 have approved a Scheme of
Amalgamation between the Company and
Spectrum Infotech Private Limited (a Wholly
owned subsidiary of the Company) and their respective shareholders and Creditors. The Company is in the process of seeking necessary statutory and regulatory approvals.
For S. N. ANANTHASUBRAMANIAN & CO.
Company Secretaries
S. N. ANANTHASUBRAMANIAN
PARTNER
C.P No: 1774
Date: May 18, 2017
Place: Thane
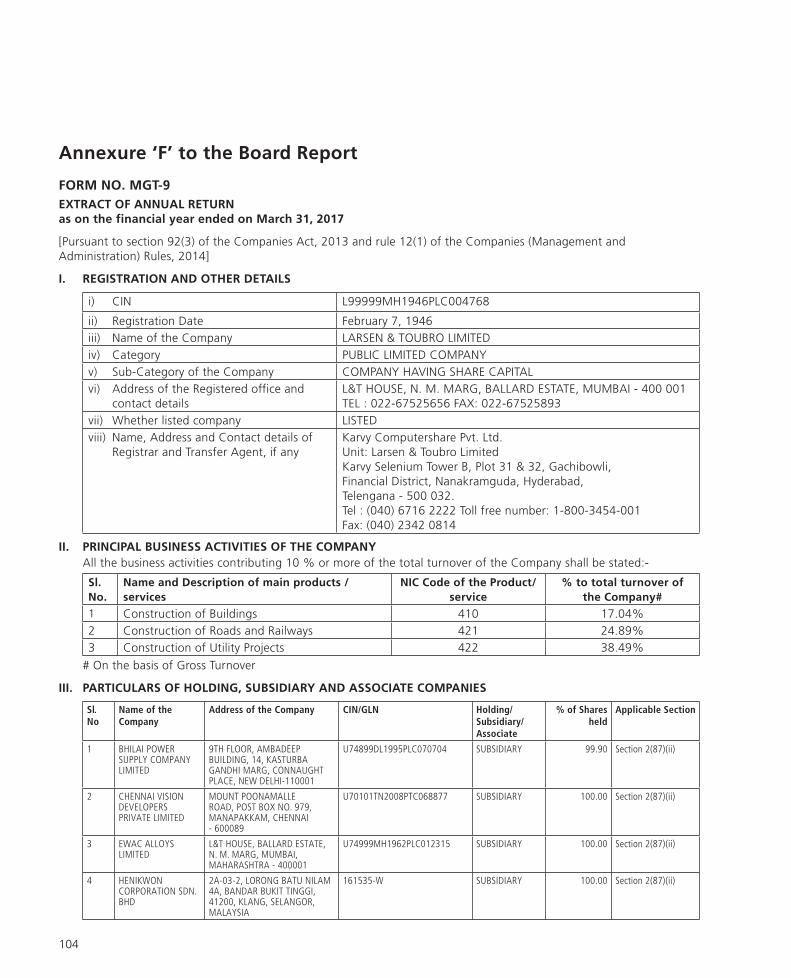
104
Annexure ‘F’ to the Board Report
FORM NO. MGT-9EXTRACT OF ANNUAL RETURNas on the financial year ended on March 31, 2017
[Pursuant to section 92(3) of the Companies Act, 2013 and rule 12(1) of the Companies (Management and Administration) Rules, 2014]
I. REGISTRATION AND OTHER DETAILS
i) CIN L99999MH1946PLC004768
ii) Registration Date February 7, 1946iii) Name of the Company LARSEN & TOUBRO LIMITEDiv) Category PUBLIC LIMITED COMPANYv) Sub-Category of the Company COMPANY HAVING SHARE CAPITALvi) Address of the Registered office and
contact details L&T HOUSE, N. M. MARG, BALLARD ESTATE, MUMBAI - 400 001 TEL : 022-67525656 FAX: 022-67525893
vii) Whether listed company LISTEDviii) Name, Address and Contact details of
Registrar and Transfer Agent, if anyKarvy Computershare Pvt. Ltd. Unit: Larsen & Toubro Limited Karvy Selenium Tower B, Plot 31 & 32, Gachibowli, Financial District, Nanakramguda, Hyderabad, Telengana - 500 032. Tel : (040) 6716 2222 Toll free number: 1-800-3454-001 Fax: (040) 2342 0814
II. PRINCIPAL BUSINESS ACTIVITIES OF THE COMPANY All the business activities contributing 10 % or more of the total turnover of the Company shall be stated:-
Sl. No.
Name and Description of main products / services
NIC Code of the Product/service
% to total turnover of the Company#
1 Construction of Buildings 410 17.04%2 Construction of Roads and Railways 421 24.89%3 Construction of Utility Projects 422 38.49%
# On the basis of Gross Turnover
III. PARTICULARS OF HOLDING, SUBSIDIARY AND ASSOCIATE COMPANIES
Sl. No
Name of the Company
Address of the Company CIN/GLN Holding/Subsidiary/Associate
% of Shares held
Applicable Section
1 BHILAI POWER SUPPLY COMPANY LIMITED
9TH FLOOR, AMBADEEP BUILDING, 14, KASTURBA GANDHI MARG, CONNAUGHT PLACE, NEW DELHI-110001
U74899DL1995PLC070704 SUBSIDIARY 99.90 Section 2(87)(ii)
2 CHENNAI VISION DEVELOPERS PRIVATE LIMITED
MOUNT POONAMALLE ROAD, POST BOX NO. 979, MANAPAKKAM, CHENNAI - 600089
U70101TN2008PTC068877 SUBSIDIARY 100.00 Section 2(87)(ii)
3 EWAC ALLOYS LIMITED
L&T HOUSE, BALLARD ESTATE, N. M. MARG, MUMBAI, MAHARASHTRA - 400001
U74999MH1962PLC012315 SUBSIDIARY 100.00 Section 2(87)(ii)
4 HENIKWON CORPORATION SDN.BHD
2A-03-2, LORONG BATU NILAM 4A, BANDAR BUKIT TINGGI, 41200, KLANG, SELANGOR, MALAYSIA
161535-W SUBSIDIARY 100.00 Section 2(87)(ii)

105
Sl. No
Name of the Company
Address of the Company CIN/GLN Holding/Subsidiary/Associate
% of Shares held
Applicable Section
5 HI-TECH ROCK PRODUCTS & AGGREGATE LIMITED
MOUNT POONAMALLE ROAD, POST BOX NO. 979, MANAPAKKAM, CHENNAI - 600089
U14290TN2008PLC065900 SUBSIDIARY 100.00 Section 2(87)(ii)
6 KANA CONTROLS GENERAL TRADING & CONTRACTING COMPANY WLL
OFFICE NO. 14, 5TH FLOOR, AL-FARWANIYA, BLOCK NO. 44, BLDG. NO. 6, GHASHAM FAHED AL-BASMAN, KUWAIT
10292 SUBSIDIARY 49.00 Section 2(87)(i)
7 KESUN IRON AND STEEL COMPANY PRIVATE LIMITED
L&T ENERGY CENTRE, NEAR CHHANI JAKAT NAKA, VADODARA, GUJARAT-390002
U27100GJ2009PTC055901 SUBSIDIARY 95.00 Section 2(87)(ii)
8 KUDGI TRANSMISSION LIMITED
MOUNT POONAMALLE ROAD, POST BOX NO. 979, MANAPAKKAM, CHENNAI - 600089
U40106TN2012GOI111122 SUBSIDIARY 97.45 Section 2(87)(ii)
9 L&T - GULF PRIVATE LIMITED
L&T HOUSE, BALLARD ESTATE, N M MARG, MUMBAI, MAHARASHTRA - 400001
U74140MH2008PTC177765 SUBSIDIARY 50.0002 Section 2(87)(ii)
10 L&T ACCESS DISTRIBUTION SERVICES LIMITED
PLOT NO. 177, CTS NO. 6970, 6972, VIDYANAGAR MARG, CST ROAD, KALINA, SANTACRUZ (EAST), MUMBAI, MAHARASHTRA - 400 098
U65100MH2011PLC284632 SUBSIDIARY 66.62 Section 2(87)(ii)
11 AHMEDABAD-MALIYA TOLLWAY LIMITED
MOUNT POONAMALLE ROAD, POST BOX NO. 979, MANAPAKKAM, CHENNAI - 600089
U45203TN2008PLC069211 SUBSIDIARY 97.45 Section 2(87)(ii)
12 L&T ARUNACHAL HYDROPOWER LIMITED
L&T HOUSE, BALLARD ESTATE, N M MARG, MUMBAI, MAHARASHTRA - 400001
U40300MH2010PLC204778 SUBSIDIARY 100.00 Section 2(87)(ii)
13 L&T AVIATION SERVICES PRIVATE LIMITED
L&T HOUSE, BALLARD ESTATE, N M MARG, MUMBAI, MAHARASHTRA - 400001
U62100MH2009PTC196917 SUBSIDIARY 100.00 Section 2(87)(ii)
14 L&T BPP TOLLWAY LIMITED
MOUNT POONAMALLE ROAD, POST BOX NO. 979, MANAPAKKAM, CHENNAI - 600089
U45203TN2011PLC080786 SUBSIDIARY 97.45 Section 2(87)(ii)
15 L&T CAPITAL COMPANY LIMITED
L&T HOUSE, BALLARD ESTATE, N M MARG, MUMBAI, MAHARASHTRA - 400001
U67190MH2000PLC125653 SUBSIDIARY 100.00 Section 2(87)(ii)
16 L&T CAPITAL MARKETS LIMITED
L&T HOUSE, BALLARD ESTATE, N M MARG, MUMBAI, MAHARASHTRA - 400001
U67190MH2013PLC240261 SUBSIDIARY 66.62 Section 2(87)(ii)
17 L&T CASSIDIAN LIMITED
L&T HOUSE, BALLARD ESTATE, N M MARG, MUMBAI, MAHARASHTRA - 400001
U29253MH2011PLC216258 SUBSIDIARY 74.00 Section 2(87)(ii)
18 L&T CHENNAI TADA TOLLWAY LIMITED
MOUNT POONAMALLE ROAD, POST BOX NO. 979, MANAPAKKAM, CHENNAI - 600089
U45309TN2008PLC066938 SUBSIDIARY 97.45 Section 2(87)(ii)
19 L&T CONSTRUCTION EQUIPMENT LIMITED
L&T HOUSE, BALLARD ESTATE, N M MARG, MUMBAI, MAHARASHTRA - 400001
U29119MH1997PLC109700 SUBSIDIARY 100.00 Section 2(87)(ii)
20 L&T CUTTING TOOLS LIMITED
L&T HOUSE, BALLARD ESTATE, N M MARG, MUMBAI, MAHARASHTRA - 400001
U28920MH1952PLC008893 SUBSIDIARY 100.00 Section 2(87)(ii)
21 L&T DECCAN TOLLWAYS LIMITED
MOUNT POONAMALLE ROAD, POST BOX NO. 979, MANAPAKKAM, CHENNAI - 600089
U45203TN2011PLC083661 SUBSIDIARY 97.45 Section 2(87)(ii)

106
Sl. No
Name of the Company
Address of the Company CIN/GLN Holding/Subsidiary/Associate
% of Shares held
Applicable Section
22 DEVIHALLI HASSAN TOLLWAY LIMITED
MOUNT POONAMALLE ROAD, POST BOX NO. 979, MANAPAKKAM, CHENNAI - 600089
U45203TN2010PLC075491 SUBSIDIARY 97.45 Section 2(87)(ii)
23 L&T ELECTRICAL & AUTOMATION FZE
WAREHOUSE NO. FZS2ABO5 262158, JEBEL ALI FREE ZONE, DUBAI, UNITED ARAB EMIRATES
107673 SUBSIDIARY 100.00 Section 2(87)(ii)
24 L&T ELECTRICAL AND AUTOMATION SAUDI ARABIA COMPANY LIMITED LLC
MH-4, PLOT NO. 17+19, IIND INDUSTRIAL CITY, DAMMAM, P.O. BOX 77186, AL KHOBAR 31952, KINGDOM OF SAUDI ARABIA
2050051589 SUBSIDIARY 100.00 Section 2(87)(ii)
25 L&T ELECTRICALS AND AUTOMATION LIMITED
L&T HOUSE, BALLARD ESTATE, N M MARG, MUMBAI, MAHARASHTRA - 400001
U31501MH2007PLC176667 SUBSIDIARY 100.00 Section 2(87)(ii)
26 L&T FINANCE HOLDINGS LIMITED
L&T HOUSE, BALLARD ESTATE, N M MARG, MUMBAI, MAHARASHTRA - 400001
L67120MH2008PLC181833 SUBSIDIARY 66.62 Section 2(87)(ii)
27 L&T FINANCE LIMITED
TECHNOPOLIS, 7TH FLOOR, A WING, PLOT NO. 4, BLOCK-BP, SECTOR-C, SALT LAKE, KOLKATA, WEST BENGAL - 700 091
U65910WB1993FLC060810 SUBSIDIARY 66.62 Section 2(87)(ii)
28 L&T HALOL-SHAMLAJI TOLLWAY LIMITED
MOUNT POONAMALLE ROAD, POST BOX NO. 979, MANAPAKKAM, CHENNAI - 600089
U45203TN2008PLC069210 SUBSIDIARY 47.75 Section 2(87)(ii)
29 L&T HIMACHAL HYDROPOWER LIMITED
RAMA COTTAGE, KANLOG, SHIMLA-171001
U40102HP2010PLC031697 SUBSIDIARY 100.00 Section 2(87)(ii)
30 L&T HOUSING FINANCE LIMITED
L&T HOUSE, NAROTTAM MORARJI MARG BALLARD ESTATE MUMBAI 400001
U45200MH1994PLC259630 SUBSIDIARY 66.62 Section 2(87)(ii)
31 L&T HOWDEN PRIVATE LIMITED
L&T HOUSE, BALLARD ESTATE, N M MARG, MUMBAI, MAHARASHTRA - 400001
U31401MH2010PTC204403 SUBSIDIARY 50.10 Section 2(87)(ii)
32 L&T HYDROCARBON ENGINEERING LIMITED
L&T HOUSE, BALLARD ESTATE, N M MARG, MUMBAI, MAHARASHTRA - 400001
U11200MH2009PLC191426 SUBSIDIARY 100.00 Section 2(87)(ii)
33 L&T IDPL TRUSTEE MANAGER PTE. LTD.
8 CROSS STREET, #10-00, PWC BUILDING, SINGAPORE (048424)
201326418G SUBSIDIARY 97.45 Section 2(87)(ii)
34 L&T INFORMATION TECHNOLOGY SERVICES (SHANGHAI) CO., LTD.
ROOM 1100, BUILDING 2, NO.1388, XINGXIAN ROAD, JIADING DISTRICT, SHANGHAI
310000400714060 (JIADING) SUBSIDIARY 84.28 Section 2(87)(ii)
35 L&T INFOTECH FINANCIAL SERVICES TECHNOLOGIES INC
2810, MATHESON BLVD EAST SUITE 500, MISSISSAUGA, ONL4W 4X7 CANADA
770556-5 SUBSIDIARY 84.28 Section 2(87)(ii)
36 L&T INFRA DEBT FUND LIMITED
3B, LAXMI TOWERS, C - 25, ‘G’ BLOCK, BANDRA - KURLA COMPLEX, BANDRA (EAST), MUMBAI-400051
U67100MH2013PLC241104 SUBSIDIARY 66.62 Section 2(87)(ii)
37 L&T INFRA INVESTMENT PARTNERS ADVISORY PRIVATE LIMITED
3B, LAXMI TOWERS, C - 25, ‘G’ BLOCK, BANDRA - KURLA COMPLEX, BANDRA (EAST), MUMBAI-400051
U67190MH2011PTC218046 SUBSIDIARY 66.62 Section 2(87)(ii)
38 L&T INFRA INVESTMENT PARTNERS TRUSTEE PRIVATE LIMITED
PLOT NO. 177, CTS NO. 6970, 6971, VIDYANAGARI MARG, CST ROAD, KALINA, SANTACRUZ (EAST), MUMBAI, MAHARASHTRA - 400 098
U65900MH2011PTC220896 SUBSIDIARY 66.62 Section 2(87)(ii)

107
Sl. No
Name of the Company
Address of the Company CIN/GLN Holding/Subsidiary/Associate
% of Shares held
Applicable Section
39 L&T INFRASTRUCTURE DEVELOPMENT PROJECTS LIMITED
MOUNT POONAMALLE ROAD, POST BOX NO. 979, MANAPAKKAM, CHENNAI - 600089
U65993TN2001PLC046691 SUBSIDIARY 97.45 Section 2(87)(ii)
40 L&T INFRASTRUCTURE ENGINEERING LIMITED
MOUNT POONAMALLE ROAD, POST BOX NO. 979, MANAPAKKAM, CHENNAI - 600089
U74140TN1998PLC039864 SUBSIDIARY 100.00 Section 2(87)(ii)
41 L&T INFRASTRUCTURE FINANCE COMPANY LIMITED
MOUNT POONAMALLE ROAD, POST BOX NO. 979, MANAPAKKAM, CHENNAI - 600089
U67190TN2006PLC059527 SUBSIDIARY 66.62 Section 2(87)(ii)
42 L&T INTERSTATE ROAD CORRIDOR LIMITED
MOUNT POONAMALLE ROAD, POST BOX NO. 979, MANAPAKKAM, CHENNAI - 600089
U45203TN2006PLC058735 SUBSIDIARY 97.45 Section 2(87)(ii)
43 L&T INVESTMENT MANAGEMENT LIMITED
L&T HOUSE, BALLARD ESTATE, N M MARG, MUMBAI, MAHARASHTRA - 400001
U65991MH1996PLC229572 SUBSIDIARY 66.62 Section 2(87)(ii)
44 L&T KOBELCO MACHINERY PRIVATE LIMITED
L&T HOUSE, BALLARD ESTATE, N M MARG, MUMBAI, MAHARASHTRA - 400001
U29253MH2010PTC210325 SUBSIDIARY 51.00 Section 2(87)(ii)
45 KRISHNAGIRI THOPUR TOLL ROAD LIMITED
MOUNT POONAMALLE ROAD, POST BOX NO. 979, MANAPAKKAM, CHENNAI - 600089
U45203TN2005PLC057930 SUBSIDIARY 97.45 Section 2(87)(ii)
46 KRISHNAGIRI WALAJAHPET TOLLWAY LIMITED
MOUNT POONAMALLE ROAD, POST BOX NO. 979, MANAPAKKAM, CHENNAI - 600089
U45203TN2010PLC075446 SUBSIDIARY 97.45 Section 2(87)(ii)
47 L&T METRO RAIL (HYDERABAD) LIMITED
HYDERABAD METRO RAIL ADMINISTRATIVE BUILDING, UPPAL MAIN ROAD, HYDERABAD - 500 039, TELANGANA
U45300TG2010PLC070121 SUBSIDIARY 100.00 Section 2(87)(ii)
48 L&T MODULAR FABRICATION YARD LLC
PO BOX 236, P.C 322, FALAZ AL QABAIL, SOHAR, SULTANATE OF OMAN
1001910 SUBSIDIARY 65.00 Section 2(87)(ii)
49 L&T MUTUAL FUND TRUSTEE LIMITED
L&T HOUSE BALLARD ESTATES, P.O. BOX 278, MUMBAI 400001
U65993MH1996PLC211198 SUBSIDIARY 66.62 Section 2(87)(ii)
50 L&T OVERSEAS PROJECTS NIGERIA LIMITED
252E, MURI OKUNOLA STREET, VICTORIA ISLAND, LAGOS, NIGERIA
601723 SUBSIDIARY 100.00 Section 2(87)(ii)
51 PANIPAT ELEVATED CORRIDOR LIMITED
MOUNT POONAMALLE ROAD, POST BOX NO. 979, MANAPAKKAM, CHENNAI - 600089
U45203TN2005PLC056999 SUBSIDIARY 97.45 Section 2(87)(ii)
52 L&T PORT KACHCHIGARH LIMITED
MOUNT POONAMALLE ROAD, POST BOX NO. 979, MANAPAKKAM, CHENNAI - 600089
U45203TN2008PLC067551 SUBSIDIARY 97.45 Section 2(87)(ii)
53 L&T POWER DEVELOPMENT LIMITED
L&T HOUSE, BALLARD ESTATE, N M MARG, MUMBAI, MAHARASHTRA - 400001
U40101MH2007PLC174071 SUBSIDIARY 100.00 Section 2(87)(ii)
54 L&T POWER LIMITED L&T HOUSE, BALLARD ESTATE, N M MARG, MUMBAI, MAHARASHTRA - 400001
U40100MH2006PLC160413 SUBSIDIARY 99.99 Section 2(87)(ii)
55 L&T RAJKOT-VADINAR TOLLWAY LIMITED
MOUNT POONAMALLE ROAD, POST BOX NO. 979, MANAPAKKAM, CHENNAI - 600089
U45203TN2008PLC069184 SUBSIDIARY 97.45 Section 2(87)(ii)

108
Sl. No
Name of the Company
Address of the Company CIN/GLN Holding/Subsidiary/Associate
% of Shares held
Applicable Section
56 L&T REALTY FZE EXECUTIVE SUITE, P.O.BOX 121576, SAIF ZONE,SHARJAH, U.A.E.
02 - 01 - 05714 SUBSIDIARY 100.00 Section 2(87)(ii)
57 L&T REALTY LIMITED L&T HOUSE, BALLARD ESTATE, N M MARG, MUMBAI, MAHARASHTRA - 400001
U74200MH2007PLC176358 SUBSIDIARY 100.00 Section 2(87)(ii)
58 L&T SAMAKHIALI GANDHIDHAM TOLLWAY LIMITED
MOUNT POONAMALLE ROAD, POST BOX NO. 979, MANAPAKKAM, CHENNAI - 600089
U45203TN2010PLC074501 SUBSIDIARY 97.45 Section 2(87)(ii)
59 L&T SAMBALPUR - ROURKELA TOLLWAY LIMITED
MOUNT POONAMALLE ROAD, POST BOX NO. 979, MANAPAKKAM, CHENNAI - 600089
U45206TN2013PLC093395 SUBSIDIARY 97.45 Section 2(87)(ii)
60 L&T SAPURA OFFSHORE PRIVATE LIMITED
MOUNT POONAMALLE ROAD, POST BOX NO. 979, MANAPAKKAM, CHENNAI - 600089
U11200TN2010PTC077214 SUBSIDIARY 60.00 Section 2(87)(ii)
61 L&T SAPURA SHIPPING PRIVATE LIMITED
MOUNT POONAMALLE ROAD, POST BOX NO. 979, MANAPAKKAM, CHENNAI - 600089
U61100TN2010PTC077217 SUBSIDIARY 60.00 Section 2(87)(ii)
62 L&T SEAWOODS LIMITED
L&T HOUSE, BALLARD ESTATE, N M MARG, MUMBAI, MAHARASHTRA - 400001
U45203MH2008PLC180029 SUBSIDIARY 100.00 Section 2(87)(ii)
63 L&T SHIPBUILDING LIMITED
GROUND FLOOR, TC-1 BUILDING, L&T CONSTRUCTION CAMPUS, MOUNT POONAMALLE ROAD, POST BOX NO. 979, MANAPAKKAM, CHENNAI - 600089
U74900TN2007PLC065356 SUBSIDIARY 97.00 Section 2(87)(ii)
64 L&T SPECIAL STEELS AND HEAVY FORGINGS PRIVATE LIMITED
L&T HOUSE, BALLARD ESTATE, N M MARG, MUMBAI, MAHARASHTRA - 400001
U27109MH2009PTC193699 SUBSIDIARY 74.00 Section 2(87)(ii)
65 L&T TECHNOLOGY SERVICES LIMITED
L&T HOUSE, BALLARD ESTATE, N M MARG, MUMBAI, MAHARASHTRA - 400001
U72900MH2012PLC232169 SUBSIDIARY 89.77 Section 2(87)(ii)
66 L&T TECHNOLOGY SERVICES LLC
2035, LINCOLN HIGHWAY, SUITE # 3002, EDISON, SQUARE WEST, EDISON, NJ - 08817
0479598-9 SUBSIDIARY 89.77 Section 2(87)(ii)
67 L&T THALES TECHNOLOGY SERVICES PRIVATE LIMITED
RR V TOWER, 7TH FLOOR, 33A, DEVELOPED PLOTS, SIDCO INDUSTRIAL ESTATE, GUINDY, CHENNAI-600032
U72200TN2006PTC059421 SUBSIDIARY 66.43 Section 2(87)(ii)
68 L&T TRANSPORTATION INFRASTRUCTURE LIMITED
MOUNT POONAMALLE ROAD, POST BOX NO. 979, MANAPAKKAM, CHENNAI - 600089
U45203TN1997PLC039102 SUBSIDIARY 98.12 Section 2(87)(ii)
69 L&T TRUSTEE COMPANY PRIVATE LIMITED
L&T HOUSE, BALLARD ESTATE, N M MARG, MUMBAI, MAHARASHTRA - 400001
U74990MH2009PTC193936 SUBSIDIARY 100.00 Section 2(87)(ii)
70 L&T UTTARANCHAL HYDROPOWER LIMITED
VILLAGE BEDUBAGAR P.O AUGUSTMUNI RUDRAPRAYAG Rudra Prayag UR 246421
U31401UR2006PLC032329 SUBSIDIARY 100.00 Section 2(87)(ii)
71 VADODARA BHARUCH TOLLWAYS LIMITED
MOUNT POONAMALLE ROAD, POST BOX NO. 979, MANAPAKKAM, CHENNAI - 600089
U45203TN2005PLC058417 SUBSIDIARY 97.45 Section 2(87)(ii)

109
Sl. No
Name of the Company
Address of the Company CIN/GLN Holding/Subsidiary/Associate
% of Shares held
Applicable Section
72 L&T VALVES LIMITED L&T HOUSE, BALLARD ESTATE, N M MARG, MUMBAI, MAHARASHTRA - 400001
U74999MH1961PLC012188 SUBSIDIARY 100.00 Section 2(87)(ii)
73 L&T VISION VENTURES LIMITED
MOUNT POONAMALLE ROAD, POST BOX NO. 979, MANAPAKKAM, CHENNAI - 600089
U74210TN2006PLC061845 SUBSIDIARY 68.00 Section 2(87)(ii)
74 L&T FINANCIAL CONSULTANTS LIMITED
MOUNT POONAMALLE ROAD, POST BOX NO. 979, MANAPAKKAM, CHENNAI - 600089
U65100TN2011PLC081100 SUBSIDIARY 66.62 Section 2(87)(ii)
75 WESTERN ANDHRA TOLLWAYS LIMITED
MOUNT POONAMALLE ROAD, POST BOX NO. 979, MANAPAKKAM, CHENNAI - 600089
U45203TN2005PLC057931 SUBSIDIARY 97.45 Section 2(87)(ii)
76 L&T WESTERN INDIA TOLLBRIDGE LIMITED
MOUNT POONAMALLE ROAD, POST BOX NO. 979, MANAPAKKAM, CHENNAI - 600089
U45203TN1999PLC042518 SUBSIDIARY 97.45 Section 2(87)(ii)
77 L&T-MHPS BOILERS PRIVATE LIMITED
L&T HOUSE, BALLARD ESTATE, N M MARG, MUMBAI, MAHARASHTRA - 400001
U29119MH2006PTC165102 SUBSIDIARY 51.00 Section 2(87)(ii)
78 L&T-MHPS TURBINE GENERATORS PRIVATE LIMITED
L&T HOUSE, BALLARD ESTATE, N M MARG, MUMBAI, MAHARASHTRA - 400001
U31101MH2006PTC166541 SUBSIDIARY 51.00 Section 2(87)(ii)
79 L&T-SARGENT & LUNDY LIMITED
L&T HOUSE, BALLARD ESTATE, N M MARG, MUMBAI, MAHARASHTRA - 400001
U74210MH1995PLC088099 SUBSIDIARY 50.0001 Section 2(87)(ii)
80 LARSEN & TOUBRO (EAST ASIA) SDN. BHD
SUITE 702, 7TH FLOOR, WISMA HANGSAM, JALAN HANG LEKIR, 50000 KUALA LUMPUR, MALAYSIA
390357-T SUBSIDIARY 30.00 Section 2(87)(i)
81 LARSEN & TOUBRO ATCO SAUDIA LLC
AL-TURKI BUILDING, KING KHALED STREET, P.O. BOX 91, DAMMAM
2050055625 SUBSIDIARY 75.00 Section 2(87)(ii)
82 LARSEN & TOUBRO ELECTROMECH LLC
P.O. BOX 1999, RUWI, POSTAL CODE 112, MUSCAT
1/04445/1 SUBSIDIARY 65.00 Section 2(87)(ii)
83 LARSEN & TOUBRO HEAVY ENGINEERING LLC
P.O. BOX 281, POSTAL CODE 325, W LIWA, SULTANATE OF OMAN
1042928 SUBSIDIARY 70.00 Section 2(87)(ii)
84 LARSEN & TOUBRO HYDROCARBON INTERNATIONAL LIMITED LLC
P.O. BOX 6391, AL KHOBAR 34423, KINGDOM OF SAUDI ARABIA
2051053464 SUBSIDIARY 100.00 Section 2(87)(ii)
85 LARSEN & TOUBRO INFOTECH CANADA LIMITED
2810, MATHESON BLVD EAST SUITE 500, MISSISSAUGA, ONL4W 4X7 CANADA
1415026 SUBSIDIARY 84.28 Section 2(87)(ii)
86 LARSEN & TOUBRO INFOTECH GMBH
EURO-ASIA BUSINESS CENTRE, MESSE-ALLEE 2, D-04356, LEIPZIG, GERMANY
HRB15958 SUBSIDIARY 84.28 Section 2(87)(ii)
87 LARSEN & TOUBRO INFOTECH LIMITED
L&T HOUSE, BALLARD ESTATE, N M MARG, MUMBAI, MAHARASHTRA - 400001
U72900MH1996PLC104693 SUBSIDIARY 84.28 Section 2(87)(ii)
88 LARSEN & TOUBRO INFOTECH LLC
1220, N. MARKET ST., SUITE 806, WILMINGTON, DE 19801, USA
270596763 SUBSIDIARY 84.28 Section 2(87)(ii)
89 LARSEN & TOUBRO INTERNATIONAL FZE
OFFICE LOB 16 G 08, POST BOX 41558, HAMRIYAH FREE ZONE, SHARJAH, UNITED ARAB EMIRATES
0067 SUBSIDIARY 100.00 Section 2(87)(ii)

110
Sl. No
Name of the Company
Address of the Company CIN/GLN Holding/Subsidiary/Associate
% of Shares held
Applicable Section
90 LARSEN & TOUBRO KUWAIT CONSTRUCTION GENERAL CONTRACTING COMPANY, WITH LIMITED LIABILITY
PLOT NO. 3, BUILDING NO.1, SHARQ, KUWAIT
117668 SUBSIDIARY 49.00 Section 2(87)(i)
91 LARSEN & TOUBRO LLC
113, BARKSDALE PROFESSIONAL CENTRE, NEWARK CITY, COUNTRY OF NEW CASTLE, G56 ZIP CODE-19711, U.S.A
6 DEL.C 18-101 SUBSIDIARY 100.00 Section 2(87)(ii)
92 LARSEN & TOUBRO OMAN LLC
P.O. BOX 1127, RUWI, POSTAL CODE 112, SULTANATE OF OMAN
1/40304/4 SUBSIDIARY 65.00 Section 2(87)(ii)
93 LARSEN & TOUBRO QATAR LLC
P.O. BOX 24399, SH. THAMOUR BLDG., MEZZANINE FLOOR, AL-HANDASA AREA, NEAR JAIDAH FLYOVER, B RING ROAD, DOHA, QATAR
27454 SUBSIDIARY 49.00 Section 2(87)(i)
94 LARSEN & TOUBRO READYMIX AND ASPHALT CONCRETE INDUSTRIES LLC
JEBEL ALI INDUSTRIAL AREA, JEBEL ALI, DUBAI
583119 SUBSIDIARY 49.00 Section 2(87)(i)
95 LARSEN & TOUBRO SAUDI ARABIA LLC
P.O. BOX NO.20, RIYADH 11351, KINGDOM OF SAUDI ARABIA 11351
1010154437 SUBSIDIARY 100.00 Section 2(87)(ii)
96 LARSEN & TOUBRO TANDD SA (PTY) LIMITED
2ND FLOOR, 4 PENCARROW CRESCENT, LA LUCIA RIDGE OFFICE ESTATE, SOUTH AFRICA 4019
2010/018159/07 SUBSIDIARY 72.50 Section 2(87)(ii)
97 LARSEN AND TOUBRO INFOTECH SOUTH AFRICA (PTY) LIMITED
6TH FLOOR, 119 HERTZOG BOULEVARD, FORESHORE, CAPETOWN, SOUTH AFRICA 8001
2011/007226/07 SUBSIDIARY 63.12 Section 2(87)(ii)
98 LARSEN TOUBRO ARABIA LLC
ALMADA TOWER, PRINCE TURKI STREET, AL KHOBAR, SAUDI ARABIA
2051049523 SUBSIDIARY 75.00 Section 2(87)(ii)
99 MUDIT CEMENT PRIVATE LIMITED
5TH FLOOR, DCM BUILDING, 16, BARAKHAMBA ROAD, CANNAUGHT PLACE, NEW DELHI-110001
U26942DL1990PTC041941 SUBSIDIARY 66.62 Section 2(87)(ii)
100 NABHA POWER LIMITED
PO BOX NO-28, NEAR VILLAGE NALASH, RAJPURA, PATIALA, PUNJAB-140401
U40102PB2007PLC031039 SUBSIDIARY 100.00 Section 2(87)(ii)
101 PNG TOLLWAY LIMITED
MOUNT POONAMALLE ROAD, POST BOX NO. 979, MANAPAKKAM, CHENNAI - 600089
U45203TN2009PLC070741 SUBSIDIARY 72.11 Section 2(87)(ii)
102 PT TAMCO INDONESIA
JALAN RAYA PASAR SERANG, NO. 15, KANDANG RODA, CIKARANG BEKASI 17330, INDONESIA
C2-18.177.HT.01.01.HT 94 SUBSIDIARY 100.00 Section 2(87)(ii)
103 PT. LARSEN & TOUBRO HYDROCARBON ENGINEERING INDONESIA
THE CITY TOWER, 12TH FLOOR, UNIT 1-N, J1.MH., THAMRIN NO.81, CENTRAL JAKARTA, INDONESIA 10310
AHU-0110258.AH.01.09 SUBSIDIARY 95.00 Section 2(87)(ii)
104 RAYKAL ALUMINIUM COMPANY PRIVATE LIMITED
ANNAPURNA COMPLEX, 559, LEWIS ROAD, BHUBANESWAR, KHORDHA-751014
U13203OR1999PTC005673 SUBSIDIARY 75.50 Section 2(87)(ii)

111
Sl. No
Name of the Company
Address of the Company CIN/GLN Holding/Subsidiary/Associate
% of Shares held
Applicable Section
105 SERVOWATCH SYSTEMS LIMITED
THE WOODROPE BUILDING, WOODROLFE ROAD, TOLLESBURY, MALDONESSEX CM9 8SE, UNITED KINGDOM
2159287 SUBSIDIARY 100.00 Section 2(87)(ii)
106 SPECTRUM INFOTECH PRIVATE LIMITED
L&T HOUSE, 38, CUBBON ROAD, BANGALORE, KARNATAKA-560001
U72200KA1995PTC018112 SUBSIDIARY 100.00 Section 2(87)(ii)
107 TAMCO ELECTRICAL INDUSTRIES AUSTRALIA PTY LTD
31, KITCHEN ROAD, DANDENONG, VICTORIA 3175, AUSTRALIA
ACN006140512 SUBSIDIARY 100.00 Section 2(87)(ii)
108 TAMCO SWITCHGEAR (MALAYSIA) SDN BHD
UNIT C508, BLOCK C, KELANA SQUARE, JALAN SS7/26, KELANA JAYA 47301, PETALING JAYA SELANGOR DAR UL EHSAN, MALAYSIA
775268-H SUBSIDIARY 100.00 Section 2(87)(ii)
109 THALEST LIMITED ENDEAVOUR HOUSE, BENTALLS INDUSTRIAL ESTATE, HOLLOWAY ROAD, MALDON, ESSEX, C9 4ER, UNITED KINGDOM
01201246 SUBSIDIARY 100.00 Section 2(87)(ii)
110 L&T GLOBAL HOLDINGS LIMITED
UNIT 7, LEVEL 3, GATE PRECINCT, BUILDING 2, DUBAI INTERNATIONAL FINANCIAL CENTRE, P.O BOX 63671, DUBAI, UAE
CL2106 SUBSIDIARY 100.00 Section 2(87)(ii)
111 MARINE INFRASTRUCTURE DEVELOPER PRIVATE LIMITED
GROUND FLOOR, TC 1 BUILDING, L&T CONSTRUCTION COMPLEX, MOUNT POONAMALLE ROAD, MANAPAKKAM, CHENNAI - 600089
U74999TN2016PTC103769 SUBSIDIARY 97.00 Section 2(87)(ii)
112 L&T INFORMATION TECHNOLOGY SPAIN SOCIEDAD LIMITADA
C/JOSE ABASCAL, 56 2ND FLOOR, MADRID
B87472072 SUBSIDIARY 84.28 Section 2(87)(ii)
113 LARSEN & TOUBRO INFOTECH AUSTRIA GMBH
c/o, OBERHAMMER, RECHTSANWALTE GMBH, KARLSPLATZ, 3/1, VIENNA
FN435491D SUBSIDIARY 84.28 Section 2(87)(ii)
114 AUGMENT IQ DATA SCIENCES PRIVATE LIMITED
GODREJ ETERNIA A, 5TH FLOOR, MUMBAI PUNE ROAD, SHIVAJINAGAR, PUNE, MAHARASHTRA - 400005
U72200PN2012PTC145539 SUBSIDIARY 84.28 Section 2(87)(ii)
115 L&T INFOTECH S. DE. RL.C.V
BOSQUE DE CIRUELOS 180, SUITE PP 101, COL.BOSQUES DE LAS LOMAS, 11700 MEXICO CITY, MEXICO
N2017020633 SUBSIDIARY 84.28 Section 2(87)(ii)
116 SAHIBGANJ GANGES BRIDGE-COMPANY PRIVATE LIMITED
L&T HOUSE BALLARD ESTATE MUMBAI 400001
U45309MH2016PTC283661 SUBSIDIARY 100.00 Section 2(87)(ii)
117 L&T INFRA CONTRACTORS PRIVATE COMPANY LIMITED
L&T HOUSE, BALLARD ESTATE, N M MARG, MUMBAI 400001
U45400MH2017PTC292586 SUBSIDIARY 100.00 Section 2(87)(ii)
118 LTH MILCOM PRIVATE LIMITED
L & T HOUSE, BALLARD ESTATE, MUMBAI 400001
U74999MH2015PTC267502 SUBSIDIARY 56.67 Section 2(87)(ii)
119 SEAWOODS REALTY PRIVATE LIMITED
L&T HOUSE, BALLARD ESTATE, N M MARG, MUMBAI, MAHARASHTRA - 400001
U70109MH2016PTC285064 SUBSIDIARY 100.00 Section 2(87)(ii)
120 SEAWOODS RETAIL PRIVATE LIMITED
L&T HOUSE, BALLARD ESTATE, N M MARG, MUMBAI, MAHARASHTRA - 400001
U70103MH2016PTC285466 SUBSIDIARY 100.00 Section 2(87)(ii)

112
Sl. No
Name of the Company
Address of the Company CIN/GLN Holding/Subsidiary/Associate
% of Shares held
Applicable Section
1 FEEDBACK INFRAPRIVATE LIMITED
311, 3rd Floor,Vardhaman Plaza, Pocket 7, Plot No. 6, Sector 12, Dwarka , New Delhi -110078
U74899DL1990PTC040630 ASSOCIATE 15.42 Section 2(6)
2 GUJARAT LEATHER INDUSTRIES LIMITED
NO 3001, GIDC INDUSTRIAL ESTATE, ANKLESHWAR, GUJARAT
U18104GJ1978SGC003134 ASSOCIATE 50.00 Section 2(6)
3 INDIRAN ENGINEERING PROJECTS AND SYSTEMS KISH (LLC)
POST BOX 1267, NEHA APARTMENT, BAZAAR-E-DANOOS, KISH ISLAND, IRAN
3744 ASSOCIATE 50.00 Section 2(6)
4 INTERNATIONAL SEAPORTS (HALDIA) PRIVATE LIMITED
FLAT NO. 27, 5TH FLOOR, KOHINOOR BUILDING, 105, PARK STREET, KOLKATA 700016
U45205WB1999PTC090733 ASSOCIATE 21.74 Section 2(6)
5 L&T CAMP FACILITIES LLC
P. O. BOX 44357, DUBAI, UNITED ARAB EMIRATES
600640 ASSOCIATE 50.00 Section 2(6)
6 L& T-CHIYODA LIMITED
L&T HOUSE, BALLARD ESTATE, N M MARG, MUMBAI, MAHARASHTRA - 400001
U28920MH1994PLC083035 ASSOCIATE 50.00 Section 2(6)
7 LARSEN & TOUBRO QATAR & HBK CONTRACTING LLC
P. O. BOX 1362, DOHA, QATAR 28634 ASSOCIATE 50.00 Section 2(6)
8 MAGTORQ PRIVATE LIMITED
NO. 58-C, SIPCOT INDUSTRIAL COMPLEX, HOSUR, TAMIL NADU 635126
U02520TZ1989PTC002458 ASSOCIATE 42.85 Section 2(6)
9 Grameen Capital India Private Limited
402, 36 TURNER ROAD,BANDRA WEST, MUMBAI - 400050
U65923MH2007PTC168721 ASSOCIATE 23.84 Section 2(6)

113
IV. SHARE HOLDING PATTERN
i) Category-wise Share Holding:
Category of Shareholders No. of Shares held at the beginning of the year No. of Shares held at the end of the year % Change during the
yearDemat Physical Total % of Total Shares
Demat Physical Total % of Total Shares
A. Promoters
(1) Indian
a) Individual/HUF 0 0 0 0.00 0 0 0 0.00 0.00
b) Central Govt 0 0 0 0.00 0 0 0 0.00 0.00
c) State Govt (s) 0 0 0 0.00 0 0 0 0.00 0.00
d) Bodies Corp. 0 0 0 0.00 0 0 0 0.00 0.00
e) Banks / FI 0 0 0 0.00 0 0 0 0.00 0.00
f) Any Other…. 0 0 0 0.00 0 0 0 0.00 0.00
Sub-total (A) (1):- 0 0 0 0.00 0 0 0 0.00 0.00
(2) Foreign
a) NRIs -Individuals 0 0 0 0.00 0 0 0 0.00 0.00
b) Other –Individuals 0 0 0 0.00 0 0 0 0.00 0.00
c) Bodies Corp. 0 0 0 0.00 0 0 0 0.00 0.00
d) Banks / FI 0 0 0 0.00 0 0 0 0.00 0.00
e) Any Other…. 0 0 0 0.00 0 0 0 0.00 0.00
Sub-total (A) (2):- 0 0 0 0.00 0 0 0 0.00 0.00
Total shareholding of
Promoter (A) =(A)(1)+(A)(2) 0 0 0 0.00 0 0 0 0.00 0.00
B. Public Shareholding
1. Institutions
a) MutualFunds 76,771,070 3,738 76,774,808 8.24 107,273,904 12,822 107,286,726 11.50 3.26
b) Banks / FI 237,142,389 41,177 237,183,566 25.46 67,089,940 31,933 67,121,873 7.19 -18.27
c) Central Govt 1,314,715 0 1,314,715 0.14 1,874,190 0 1,874,190 0.20 0.06
d) State Govt(s) 0 0 0 0.00 0 0 0 0.00 0.00
e) Venture Capital Funds 0 0 0 0.00 0 0 0 0.00 0.00
f) Insurance Companies 41,071,676 0 41,071,676 4.41 185,203,662 450 185,204,112 19.85 15.44
g) FIIs 101,334,166 40,068 101,374,234 10.88 20,810,053 0 20,810,053 2.23 -8.65
h) Foreign Venture Capital Funds
0 0 0 0.00 0 0 0 0.00 0.00
Sub-total (B)(1):- 457,634,016 84,983 457,718,999 49.14 382,251,749 45,205 382,296,954 40.98 -8.16
2. Non-Institutions
a) Bodies Corp.
i) Indian 65,995,102 305,763 66,300,865 7.12 66,318,379 341,383 66,634,899 7.14 0.02
ii) Overseas 0 3,432 3,432 0.00 280,167 23,431 303,598 0.03 0.03
b) Individuals 0.00
i) Individual shareholders holding nominal share capital upto ` 1 lakh
182,938,555 18,745,440 201,683,995 21.65 163,335,385 17,670,044 181,005,429 19.40 -2.25

114
Category of Shareholders No. of Shares held at the beginning of the year No. of Shares held at the end of the year % Change during the
yearDemat Physical Total % of Total Shares
Demat Physical Total % of Total Shares
ii) Individual shareholders holding nominal share capital in excess of ` 2 lakh
11,172,991 0 11,172,991 1.20 19,459,126 218,526 19,677,652 2.11 0.91
c) Others (specify) 0.00
i) Directors & Relatives
1,449,165 350 1,449,515 0.16 1,509,024 250 1,509,274 0.16 0.00
ii) Foreign Nationals 392,713 20,826 413,539 0.04 372,138 14,470 386,608 0.04 0.00
iii) Foreign Portfolio Investors
49,988,226 0 49,988,226 5.37 140,322,703 0 140,322,703 15.04 9.67
iv) Non- Residents 8,354,814 426,504 8,781,318 0.94 8,064,466 390,360 8,454,826 0.91 -0.03
v) Trust 114,734,515 17,766 114,752,281 12.32 114,734,515 17,766 114,752,281 12.30 -0.02
vi) Qualified Foreign Investor
0 0 0 0.00 0 0 0 0.00 0.00
Sub-total (B)(2):- 435,026,081 19,520,081 454,546,162 48.80 514,395,903 18,676,230 533,047,270 57.13 8.33
Total Public Shareholding
(B)=(B)(1)+ (B)(2)
892,660,097 19,605,064 912,265,161 97.94 896,647,652 18,721,435 915,344,224 98.11 0.17
C. Shares held
byCustodian for GDRs
& ADRs
19,213,684 0 19,213,684 2.06 17,621,579 0 17,621,579 1.89 -0.17
Grand Total (A+B+C) 911,873,781 19,605,064 931,478,845 100.00 914,269,231 18,721,435 932,965,803 100.00 0.00
(ii) Shareholding of Promoters:
Sl Shareholders Name Shareholding at the beginning of the year Shareholding at the end of the year % change in share holding
during the year
No. of Shares % of total Shares of
the Company
%of Shares Pledged/
encumbered to total shares
No. of Shares % of total Shares of
the Company
%of Shares Pledged/
encumbered to total shares
1 NIL NIL
Total NIL NIL
(iii) Change in Promoters’ Shareholding (please specify, if there is no change):
Sl. No.
Shareholding at the beginning of the year
Cumulative Shareholding during the year
No. of shares % of total shares of the Company
No. of shares % of total shares of the Company
1 At the beginning of the year
NIL NIL
2 Date wise Increase / Decrease in
Promoters Share holding during
the year specifying the reasons for
increase /decrease (e.g. allotment /
transfer / bonus/sweat equity etc):
3 At the End of the year NIL NIL

115
(iv) Shareholding Pattern of top ten Shareholders (other than Directors, Promoters and Holders of GDRs
and ADRs):
Cumulative Shareholding during the Year
Sl. No.
Name of the Share Holder Date Increase/Decrease in share holding
Reason No of Shares
% of total shares of the
Company
1 LIFE INSURANCE CORPORATION OF INDIA
Shareholding at the
beginning of the Year
153172007 16.44
Date wise Increase / Decrease
in Shareholding during the year
specifying the reasons for increase
and decrease (e.g. allotment/
transfer/bonus/sweat equity etc.)
26/08/2016 5850 Transfer 153177857 16.43
26/08/2016 -5850 Transfer 153172007 16.43
At the end of the year 153172007 16.42
2 L&T EMPLOYEES WELFARE FOUNDATION
Shareholding at the
beginning of the Year
114752281 12.32
Date wise Increase / Decrease
in Shareholding during the year
specifying the reasons for increase
and decrease (e.g. allotment/
transfer/bonus/sweat equity etc.)
At the end of the year 114752281 12.30
3 ADMINISTRATOR OF THE SPECIFIED UNDERTAKING OF THE UNIT TRUST OF INDIA
Shareholding at the
beginning of the Year
75926562 8.15
Date wise Increase / Decrease
in Shareholding during the year
specifying the reasons for increase
and decrease (e.g. allotment/
transfer/bonus/sweat equity etc.)
11/11/2016 -14823702 Transfer 61102860 6.55
At the end of the year 61102860 6.55
4 HDFC TRUSTEE COMPANY LIMITED - HDFC EQUITY FUND
Shareholding at the
beginning of the Year
20473057 2.20
Date wise Increase / Decrease
in Shareholding during the year
specifying the reasons for increase
and decrease (e.g. allotment/
transfer/bonus/sweat equity etc.)
08/04/2016 92449 Transfer 20565506 2.21
08/04/2016 -110 Transfer 20565396 2.21
15/04/2016 183 Transfer 20565579 2.21
22/04/2016 180100 Transfer 20745679 2.23
22/04/2016 -2066 Transfer 20743613 2.23
29/04/2016 1415 Transfer 20745028 2.23
29/04/2016 -336 Transfer 20744692 2.23
06/05/2016 288 Transfer 20744980 2.23
06/05/2016 -162 Transfer 20744818 2.23
13/05/2016 100218 Transfer 20845036 2.24
13/05/2016 -80806 Transfer 20764230 2.23
20/05/2016 35413 Transfer 20799643 2.23
20/05/2016 -88 Transfer 20799555 2.23
27/05/2016 -1501 Transfer 20798054 2.23

116
Cumulative Shareholding during the Year
Sl. No.
Name of the Share Holder Date Increase/Decrease in share holding
Reason No of Shares
% of total shares of the
Company
Date wise Increase / Decrease
in Shareholding during the year
specifying the reasons for increase
and decrease (e.g. allotment/
transfer/bonus/sweat equity etc.)
03/06/2016 550689 Transfer 21348743 2.29
03/06/2016 -119 Transfer 21348624 2.29
10/06/2016 35707 Transfer 21384331 2.29
10/06/2016 -50202 Transfer 21334129 2.29
17/06/2016 188356 Transfer 21522485 2.31
17/06/2016 -46771 Transfer 21475714 2.30
24/06/2016 10773 Transfer 21486487 2.31
24/06/2016 -505 Transfer 21485982 2.31
30/06/2016 4445 Transfer 21490427 2.31
30/06/2016 -600 Transfer 21489827 2.31
08/07/2016 150255 Transfer 21640082 2.32
08/07/2016 -100215 Transfer 21539867 2.31
15/07/2016 150090 Transfer 21689957 2.33
15/07/2016 -51180 Transfer 21638777 2.32
22/07/2016 116900 Transfer 21755677 2.33
22/07/2016 -237 Transfer 21755440 2.33
29/07/2016 205100 Transfer 21960540 2.36
29/07/2016 -128 Transfer 21960412 2.36
05/08/2016 180 Transfer 21960592 2.36
12/08/2016 193880 Transfer 22154472 2.38
12/08/2016 -176 Transfer 22154296 2.38
19/08/2016 283000 Transfer 22437296 2.41
19/08/2016 -160 Transfer 22437136 2.41
26/08/2016 -145 Transfer 22436991 2.41
02/09/2016 466134 Transfer 22903125 2.46
02/09/2016 -99627 Transfer 22803498 2.45
09/09/2016 293060 Transfer 23096558 2.48
09/09/2016 -6469 Transfer 23090089 2.48
16/09/2016 113890 Transfer 23203979 2.49
16/09/2016 -239 Transfer 23203740 2.49
23/09/2016 159609 Transfer 23363349 2.51
23/09/2016 -407 Transfer 23362942 2.51
30/09/2016 164100 Transfer 23527042 2.52
30/09/2016 -1299 Transfer 23525743 2.52
07/10/2016 403311 Transfer 23929054 2.57
14/10/2016 128 Transfer 23929182 2.57
14/10/2016 -25380 Transfer 23903802 2.56
21/10/2016 70219 Transfer 23974021 2.57
21/10/2016 -27500 Transfer 23946521 2.57
28/10/2016 271877 Transfer 24218398 2.60

117
Cumulative Shareholding during the Year
Sl. No.
Name of the Share Holder Date Increase/Decrease in share holding
Reason No of Shares
% of total shares of the
Company
Date wise Increase / Decrease
in Shareholding during the year
specifying the reasons for increase
and decrease (e.g. allotment/
transfer/bonus/sweat equity etc.)
04/11/2016 550 Transfer 24218948 2.60
04/11/2016 -8284 Transfer 24210664 2.60
11/11/2016 1811057 Transfer 26021721 2.79
18/11/2016 1076874 Transfer 27098595 2.91
25/11/2016 1114106 Transfer 28212701 3.03
25/11/2016 -54500 Transfer 28158201 3.02
02/12/2016 847325 Transfer 29005526 3.11
02/12/2016 -100 Transfer 29005426 3.11
09/12/2016 100717 Transfer 29106143 3.12
09/12/2016 -29000 Transfer 29077143 3.12
16/12/2016 338 Transfer 29077481 3.12
16/12/2016 -6067 Transfer 29071414 3.12
23/12/2016 406 Transfer 29071820 3.12
23/12/2016 -65500 Transfer 29006320 3.11
30/12/2016 267621 Transfer 29273941 3.14
06/01/2017 162602 Transfer 29436543 3.16
13/01/2017 224532 Transfer 29661075 3.18
13/01/2017 -894 Transfer 29660181 3.18
20/01/2017 24196 Transfer 29684377 3.18
20/01/2017 -10413 Transfer 29673964 3.18
27/01/2017 196482 Transfer 29870446 3.20
27/01/2017 -14000 Transfer 29856446 3.20
03/02/2017 212950 Transfer 30069396 3.22
03/02/2017 -11819 Transfer 30057577 3.22
10/02/2017 1598 Transfer 30059175 3.22
10/02/2017 -340 Transfer 30058835 3.22
17/02/2017 100134 Transfer 30158969 3.23
17/02/2017 -77 Transfer 30158892 3.23
24/02/2017 39022 Transfer 30197914 3.24
24/02/2017 -61 Transfer 30197853 3.24
03/03/2017 55243 Transfer 30253096 3.24
03/03/2017 -673 Transfer 30252423 3.24
10/03/2017 31740 Transfer 30284163 3.25
10/03/2017 -31045 Transfer 30253118 3.24
17/03/2017 390465 Transfer 30643583 3.28
17/03/2017 -213 Transfer 30643370 3.28
24/03/2017 38140 Transfer 30681510 3.29
24/03/2017 -2409 Transfer 30679101 3.29
31/03/2017 25807 Transfer 30704908 3.29
31/03/2017 -150 Transfer 30704758 3.29
At the end of the year 30704758 3.29

118
Cumulative Shareholding during the Year
Sl. No.
Name of the Share Holder Date Increase/Decrease in share holding
Reason No of Shares
% of total shares of the
Company
5 GENERAL INSURANCE CORPORATION OF INDIA
Shareholding at the
beginning of the Year
17120000 1.84
Date wise Increase / Decrease
in Shareholding during the year
specifying the reasons for increase
and decrease (e.g. allotment/
transfer/bonus/sweat equity etc.)
27/05/2016 -25000 Transfer 17095000 1.83
03/06/2016 -25000 Transfer 17070000 1.83
11/11/2016 798124 Transfer 17868124 1.92
13/01/2017 -83000 Transfer 17785124 1.91
20/01/2017 -117000 Transfer 17668124 1.89
03/02/2017 -80000 Transfer 17588124 1.89
10/02/2017 -100500 Transfer 17487624 1.87
17/02/2017 -19500 Transfer 17468124 1.87
03/03/2017 -100000 Transfer 17368124 1.86
10/03/2017 -120000 Transfer 17248124 1.85
17/03/2017 -130000 Transfer 17118124 1.83
24/03/2017 -235000 Transfer 16883124 1.81
31/03/2017 -65000 Transfer 16818124 1.80
At the end of the year 16818124 1.80
6 ICICI PRUDENTIAL CAPITAL PROTECTION ORIENTED FUND
Shareholding at the
beginning of the Year
14633805 1.57
Date wise Increase / Decrease
in Shareholding during the year
specifying the reasons for increase
and decrease (e.g. allotment/
transfer/bonus/sweat equity etc.)
08/04/2016 4493 Transfer 14638298 1.57
08/04/2016 -78869 Transfer 14559429 1.56
15/04/2016 52800 Transfer 14612229 1.57
22/04/2016 675744 Transfer 15287973 1.64
22/04/2016 -1069213 Transfer 14218760 1.53
29/04/2016 307 Transfer 14219067 1.53
06/05/2016 -3447 Transfer 14215620 1.53
13/05/2016 575753 Transfer 14791373 1.59
13/05/2016 -847395 Transfer 13943978 1.50
20/05/2016 -4688 Transfer 13939290 1.50
27/05/2016 1448 Transfer 13940738 1.50
27/05/2016 -653243 Transfer 13287495 1.43
03/06/2016 363804 Transfer 13651299 1.46
03/06/2016 -576970 Transfer 13074329 1.40
10/06/2016 224 Transfer 13074553 1.40
17/06/2016 1580 Transfer 13076133 1.40
24/06/2016 339 Transfer 13076472 1.40
24/06/2016 -18 Transfer 13076454 1.40
30/06/2016 678 Transfer 13077132 1.40
30/06/2016 -517654 Transfer 12559478 1.35
01/07/2016 -652 Transfer 12558826 1.35
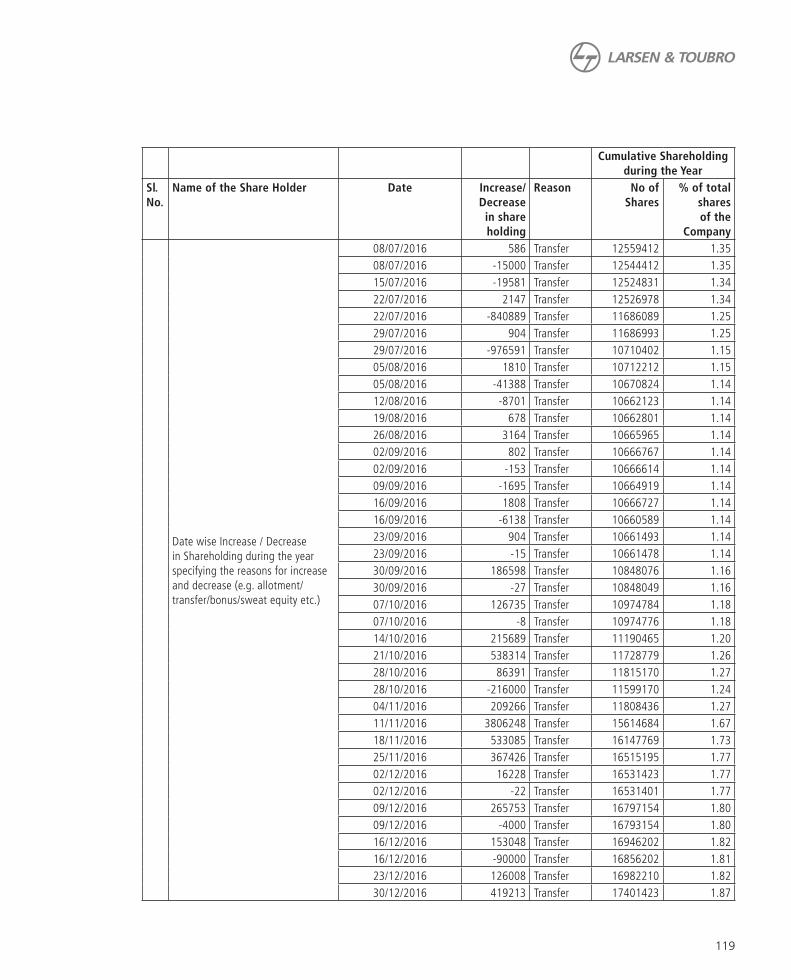
119
Cumulative Shareholding during the Year
Sl. No.
Name of the Share Holder Date Increase/Decrease in share holding
Reason No of Shares
% of total shares of the
Company
Date wise Increase / Decrease
in Shareholding during the year
specifying the reasons for increase
and decrease (e.g. allotment/
transfer/bonus/sweat equity etc.)
08/07/2016 586 Transfer 12559412 1.35
08/07/2016 -15000 Transfer 12544412 1.35
15/07/2016 -19581 Transfer 12524831 1.34
22/07/2016 2147 Transfer 12526978 1.34
22/07/2016 -840889 Transfer 11686089 1.25
29/07/2016 904 Transfer 11686993 1.25
29/07/2016 -976591 Transfer 10710402 1.15
05/08/2016 1810 Transfer 10712212 1.15
05/08/2016 -41388 Transfer 10670824 1.14
12/08/2016 -8701 Transfer 10662123 1.14
19/08/2016 678 Transfer 10662801 1.14
26/08/2016 3164 Transfer 10665965 1.14
02/09/2016 802 Transfer 10666767 1.14
02/09/2016 -153 Transfer 10666614 1.14
09/09/2016 -1695 Transfer 10664919 1.14
16/09/2016 1808 Transfer 10666727 1.14
16/09/2016 -6138 Transfer 10660589 1.14
23/09/2016 904 Transfer 10661493 1.14
23/09/2016 -15 Transfer 10661478 1.14
30/09/2016 186598 Transfer 10848076 1.16
30/09/2016 -27 Transfer 10848049 1.16
07/10/2016 126735 Transfer 10974784 1.18
07/10/2016 -8 Transfer 10974776 1.18
14/10/2016 215689 Transfer 11190465 1.20
21/10/2016 538314 Transfer 11728779 1.26
28/10/2016 86391 Transfer 11815170 1.27
28/10/2016 -216000 Transfer 11599170 1.24
04/11/2016 209266 Transfer 11808436 1.27
11/11/2016 3806248 Transfer 15614684 1.67
18/11/2016 533085 Transfer 16147769 1.73
25/11/2016 367426 Transfer 16515195 1.77
02/12/2016 16228 Transfer 16531423 1.77
02/12/2016 -22 Transfer 16531401 1.77
09/12/2016 265753 Transfer 16797154 1.80
09/12/2016 -4000 Transfer 16793154 1.80
16/12/2016 153048 Transfer 16946202 1.82
16/12/2016 -90000 Transfer 16856202 1.81
23/12/2016 126008 Transfer 16982210 1.82
30/12/2016 419213 Transfer 17401423 1.87

120
Cumulative Shareholding during the Year
Sl. No.
Name of the Share Holder Date Increase/Decrease in share holding
Reason No of Shares
% of total shares of the
Company
Date wise Increase / Decrease
in Shareholding during the year
specifying the reasons for increase
and decrease (e.g. allotment/
transfer/bonus/sweat equity etc.)
06/01/2017 39982 Transfer 17441405 1.87
06/01/2017 -452 Transfer 17440953 1.87
13/01/2017 266695 Transfer 17707648 1.90
13/01/2017 -306015 Transfer 17401633 1.87
20/01/2017 4845 Transfer 17406478 1.87
27/01/2017 175816 Transfer 17582294 1.89
03/02/2017 156544 Transfer 17738838 1.90
03/02/2017 -6346 Transfer 17732492 1.90
10/02/2017 230564 Transfer 17963056 1.93
10/02/2017 -2983 Transfer 17960073 1.93
17/02/2017 8488 Transfer 17968561 1.93
17/02/2017 -810 Transfer 17967751 1.93
24/02/2017 5537 Transfer 17973288 1.93
24/02/2017 -86 Transfer 17973202 1.93
03/03/2017 250121 Transfer 18223323 1.95
03/03/2017 -4606 Transfer 18218717 1.95
10/03/2017 360850 Transfer 18579567 1.99
10/03/2017 -1554 Transfer 18578013 1.99
17/03/2017 1027 Transfer 18579040 1.99
17/03/2017 -206002 Transfer 18373038 1.97
24/03/2017 9464196 Transfer 27837234 2.98
24/03/2017 -9263023 Transfer 18574211 1.99
31/03/2017 24619 Transfer 18598830 1.99
At the end of the year 18598830 1.99
7 ICICI PRUDENTIAL LIFE INSURANCE COMPANY LIMITED
Shareholding at the
beginning of the Year
14024401 1.51
Date wise Increase / Decrease
in Shareholding during the year
specifying the reasons for increase
and decrease (e.g. allotment/
transfer/bonus/sweat equity etc.)
08/04/2016 33527 Transfer 14057928 1.51
15/04/2016 63264 Transfer 14121192 1.52
22/04/2016 422921 Transfer 14544113 1.56
29/04/2016 94145 Transfer 14638258 1.57
06/05/2016 236121 Transfer 14874379 1.60
13/05/2016 -110338 Transfer 14764041 1.58
20/05/2016 617 Transfer 14764658 1.58
27/05/2016 140914 Transfer 14905572 1.60
03/06/2016 80751 Transfer 14986323 1.61
10/06/2016 82074 Transfer 15068397 1.62
17/06/2016 37443 Transfer 15105840 1.62
24/06/2016 157302 Transfer 15263142 1.64
30/06/2016 93636 Transfer 15356778 1.65
30/06/2016 -47044 Transfer 15309734 1.64
08/07/2016 263395 Transfer 15573129 1.67

121
Cumulative Shareholding during the Year
Sl. No.
Name of the Share Holder Date Increase/Decrease in share holding
Reason No of Shares
% of total shares of the
Company
Date wise Increase / Decrease
in Shareholding during the year
specifying the reasons for increase
and decrease (e.g. allotment/
transfer/bonus/sweat equity etc.)
15/07/2016 -33947 Transfer 15539182 1.67
22/07/2016 145138 Transfer 15684320 1.68
29/07/2016 86609 Transfer 15770929 1.69
05/08/2016 19346 Transfer 15790275 1.69
12/08/2016 38335 Transfer 15828610 1.70
19/08/2016 49027 Transfer 15877637 1.70
26/08/2016 -204120 Transfer 15673517 1.68
02/09/2016 -47693 Transfer 15625824 1.68
09/09/2016 302571 Transfer 15928395 1.71
16/09/2016 -167266 Transfer 15761129 1.69
23/09/2016 -82275 Transfer 15678854 1.68
30/09/2016 59307 Transfer 15738161 1.69
07/10/2016 171238 Transfer 15909399 1.71
14/10/2016 68326 Transfer 15977725 1.71
21/10/2016 550645 Transfer 16528370 1.77
28/10/2016 68 Transfer 16528438 1.77
04/11/2016 68064 Transfer 16596502 1.78
11/11/2016 -320258 Transfer 16276244 1.75
18/11/2016 339794 Transfer 16616038 1.78
25/11/2016 127690 Transfer 16743728 1.80
02/12/2016 53124 Transfer 16796852 1.80
09/12/2016 201 Transfer 16797053 1.80
16/12/2016 100030 Transfer 16897083 1.81
23/12/2016 37268 Transfer 16934351 1.82
30/12/2016 233675 Transfer 17168026 1.84
06/01/2017 373055 Transfer 17541081 1.88
13/01/2017 68228 Transfer 17609309 1.89
20/01/2017 -35601 Transfer 17573708 1.88
27/01/2017 6963 Transfer 17580671 1.88
03/02/2017 423396 Transfer 18004067 1.93
03/02/2017 -88250 Transfer 17915817 1.92
10/02/2017 55326 Transfer 17971143 1.93
17/02/2017 18036741 Transfer 36007884 3.86
17/02/2017 -17971143 Transfer 18036741 1.93
24/02/2017 154232 Transfer 18190973 1.95
03/03/2017 60073 Transfer 18251046 1.96
10/03/2017 37959 Transfer 18289005 1.96
17/03/2017 -728 Transfer 18288277 1.96
24/03/2017 60049 Transfer 18348326 1.97
31/03/2017 -21748 Transfer 18326578 1.96
At the end of the year 18326578 1.96

122
Cumulative Shareholding during the Year
Sl. No.
Name of the Share Holder Date Increase/Decrease in share holding
Reason No of Shares
% of total shares of the
Company
8 GOVERNMENT OF SINGAPORE Shareholding at the
beginning of the Year
13776467 1.48
Date wise Increase / Decrease
in Shareholding during the year
specifying the reasons for increase
and decrease (e.g. allotment/
transfer/bonus/sweat equity etc.)
08/04/2016 -97901 Transfer 13678566 1.47
22/04/2016 -157796 Transfer 13520770 1.45
29/04/2016 -110191 Transfer 13410579 1.44
06/05/2016 -133937 Transfer 13276642 1.42
03/06/2016 146632 Transfer 13423274 1.44
10/06/2016 112383 Transfer 13535657 1.45
08/07/2016 -86734 Transfer 13448923 1.44
22/07/2016 -7303 Transfer 13441620 1.44
29/07/2016 -63838 Transfer 13377782 1.44
05/08/2016 -102391 Transfer 13275391 1.42
12/08/2016 -34130 Transfer 13241261 1.42
19/08/2016 -2342 Transfer 13238919 1.42
02/09/2016 77298 Transfer 13316217 1.43
09/09/2016 63943 Transfer 13380160 1.44
07/10/2016 293609 Transfer 13673769 1.47
04/11/2016 -11194 Transfer 13662575 1.47
11/11/2016 -10745 Transfer 13651830 1.46
02/12/2016 108758 Transfer 13760588 1.48
30/12/2016 34173 Transfer 13794761 1.48
06/01/2017 31884 Transfer 13826645 1.48
03/02/2017 56562 Transfer 13883207 1.49
10/02/2017 -66029 Transfer 13817178 1.48
03/03/2017 -24708 Transfer 13792470 1.48
10/03/2017 9304 Transfer 13801774 1.48
17/03/2017 344901 Transfer 14146675 1.52
24/03/2017 105243 Transfer 14251918 1.53
31/03/2017 -96359 Transfer 14155559 1.52
At the end of the year 14155559 1.52
9 RELIANCE CAPITAL TRUSTEE COMPANY LIMITED
Shareholding at the
beginning of the Year
10982876 1.18
Date wise Increase / Decrease
in Shareholding during the year
specifying the reasons for increase
and decrease (e.g. allotment/
transfer/bonus/sweat equity etc.)
08/04/2016 180000 Transfer 11162876 1.20
08/04/2016 -433 Transfer 11162443 1.20
15/04/2016 270000 Transfer 11432443 1.23
22/04/2016 90000 Transfer 11522443 1.24
22/04/2016 -442 Transfer 11522001 1.24
29/04/2016 2413869 Transfer 13935870 1.50
29/04/2016 -2371714 Transfer 11564156 1.24
06/05/2016 90000 Transfer 11654156 1.25

123
Cumulative Shareholding during the Year
Sl. No.
Name of the Share Holder Date Increase/Decrease in share holding
Reason No of Shares
% of total shares of the
Company
Date wise Increase / Decrease
in Shareholding during the year
specifying the reasons for increase
and decrease (e.g. allotment/
transfer/bonus/sweat equity etc.)
06/05/2016 -230 Transfer 11653926 1.25
13/05/2016 192 Transfer 11654118 1.25
13/05/2016 -135000 Transfer 11519118 1.24
20/05/2016 4200 Transfer 11523318 1.24
20/05/2016 -90115 Transfer 11433203 1.23
27/05/2016 -90000 Transfer 11343203 1.22
03/06/2016 60000 Transfer 11403203 1.22
03/06/2016 -20919 Transfer 11382284 1.22
10/06/2016 16800 Transfer 11399084 1.22
10/06/2016 -59747 Transfer 11339337 1.22
17/06/2016 -51170 Transfer 11288167 1.21
24/06/2016 37 Transfer 11288204 1.21
24/06/2016 -48224 Transfer 11239980 1.21
30/06/2016 200 Transfer 11240180 1.21
30/06/2016 -9800 Transfer 11230380 1.20
01/07/2016 90000 Transfer 11320380 1.21
08/07/2016 90046 Transfer 11410426 1.22
08/07/2016 -57876 Transfer 11352550 1.22
15/07/2016 -50512 Transfer 11302038 1.21
22/07/2016 63091 Transfer 11365129 1.22
22/07/2016 -180049 Transfer 11185080 1.20
29/07/2016 11500 Transfer 11196580 1.20
29/07/2016 -1945 Transfer 11194635 1.20
05/08/2016 231500 Transfer 11426135 1.23
05/08/2016 -150650 Transfer 11275485 1.21
12/08/2016 471 Transfer 11275956 1.21
12/08/2016 -275 Transfer 11275681 1.21
19/08/2016 4615 Transfer 11280296 1.21
19/08/2016 -65 Transfer 11280231 1.21
26/08/2016 187500 Transfer 11467731 1.23
02/09/2016 838495 Transfer 12306226 1.32
02/09/2016 -19154 Transfer 12287072 1.32
09/09/2016 75005 Transfer 12362077 1.33
09/09/2016 -6785 Transfer 12355292 1.33
16/09/2016 216500 Transfer 12571792 1.35
16/09/2016 -10256 Transfer 12561536 1.35
23/09/2016 232000 Transfer 12793536 1.37
23/09/2016 -680 Transfer 12792856 1.37
30/09/2016 123000 Transfer 12915856 1.39

124
Cumulative Shareholding during the Year
Sl. No.
Name of the Share Holder Date Increase/Decrease in share holding
Reason No of Shares
% of total shares of the
Company
Date wise Increase / Decrease
in Shareholding during the year
specifying the reasons for increase
and decrease (e.g. allotment/
transfer/bonus/sweat equity etc.)
30/09/2016 -220454 Transfer 12695402 1.36
07/10/2016 82503 Transfer 12777905 1.37
07/10/2016 -155704 Transfer 12622201 1.35
14/10/2016 7500 Transfer 12629701 1.35
14/10/2016 -277964 Transfer 12351737 1.32
21/10/2016 80916 Transfer 12432653 1.33
21/10/2016 -369500 Transfer 12063153 1.29
28/10/2016 4254 Transfer 12067407 1.29
28/10/2016 -75000 Transfer 11992407 1.29
04/11/2016 58198 Transfer 12050605 1.29
04/11/2016 -6000 Transfer 12044605 1.29
11/11/2016 513603 Transfer 12558208 1.35
11/11/2016 -8490 Transfer 12549718 1.35
18/11/2016 30415 Transfer 12580133 1.35
18/11/2016 -8840 Transfer 12571293 1.35
25/11/2016 26181 Transfer 12597474 1.35
25/11/2016 -49 Transfer 12597425 1.35
02/12/2016 160045 Transfer 12757470 1.37
02/12/2016 -2964 Transfer 12754506 1.37
09/12/2016 -193767 Transfer 12560739 1.35
16/12/2016 -99788 Transfer 12460951 1.34
23/12/2016 143162 Transfer 12604113 1.35
23/12/2016 -3654 Transfer 12600459 1.35
30/12/2016 230064 Transfer 12830523 1.38
30/12/2016 -175 Transfer 12830348 1.38
06/01/2017 39004 Transfer 12869352 1.38
06/01/2017 -114 Transfer 12869238 1.38
13/01/2017 136000 Transfer 13005238 1.39
13/01/2017 -74001 Transfer 12931237 1.39
20/01/2017 211500 Transfer 13142737 1.41
20/01/2017 -810456 Transfer 12332281 1.32
27/01/2017 135000 Transfer 12467281 1.34
27/01/2017 -943300 Transfer 11523981 1.24
03/02/2017 -209705 Transfer 11314276 1.21
10/02/2017 100834 Transfer 11415110 1.22
10/02/2017 -325551 Transfer 11089559 1.19
17/02/2017 180000 Transfer 11269559 1.21
17/02/2017 -249121 Transfer 11020438 1.18
24/02/2017 17549 Transfer 11037987 1.18

125
Cumulative Shareholding during the Year
Sl. No.
Name of the Share Holder Date Increase/Decrease in share holding
Reason No of Shares
% of total shares of the
Company
Date wise Increase / Decrease
in Shareholding during the year
specifying the reasons for increase
and decrease (e.g. allotment/
transfer/bonus/sweat equity etc.)
24/02/2017 -438145 Transfer 10599842 1.14
03/03/2017 34753 Transfer 10634595 1.14
03/03/2017 -410548 Transfer 10224047 1.10
10/03/2017 286 Transfer 10224333 1.10
10/03/2017 -52912 Transfer 10171421 1.09
17/03/2017 48435 Transfer 10219856 1.10
17/03/2017 -463101 Transfer 9756755 1.05
24/03/2017 -645440 Transfer 9111315 0.98
31/03/2017 -97980 Transfer 9013335 0.97
At the end of the year 9013335 0.97
10 SBI MAGNUM EQUITY FUND Shareholding at the
beginning of the Year
4716815 0.51
Date wise Increase / Decrease
in Shareholding during the year
specifying the reasons for increase
and decrease (e.g. allotment/
transfer/bonus/sweat equity etc.)
08/04/2016 113173 Transfer 4829988 0.52
08/04/2016 -4665 Transfer 4825323 0.52
15/04/2016 2374 Transfer 4827697 0.52
22/04/2016 21410 Transfer 4849107 0.52
29/04/2016 18654 Transfer 4867761 0.52
29/04/2016 -3871 Transfer 4863890 0.52
06/05/2016 7950 Transfer 4871840 0.52
13/05/2016 1690 Transfer 4873530 0.52
13/05/2016 -12860 Transfer 4860670 0.52
20/05/2016 26274 Transfer 4886944 0.52
27/05/2016 176408 Transfer 5063352 0.54
03/06/2016 42472 Transfer 5105824 0.55
10/06/2016 3696 Transfer 5109520 0.55
10/06/2016 -16162 Transfer 5093358 0.55
17/06/2016 61956 Transfer 5155314 0.55
24/06/2016 111722 Transfer 5267036 0.57
30/06/2016 175758 Transfer 5442794 0.58
30/06/2016 -110 Transfer 5442684 0.58
01/07/2016 144 Transfer 5442828 0.58
01/07/2016 -7615 Transfer 5435213 0.58
08/07/2016 14355 Transfer 5449568 0.58
15/07/2016 578 Transfer 5450146 0.58
15/07/2016 -297 Transfer 5449849 0.58
22/07/2016 5644 Transfer 5455493 0.59
22/07/2016 -1211 Transfer 5454282 0.59
29/07/2016 21606 Transfer 5475888 0.59

126
Cumulative Shareholding during the Year
Sl. No.
Name of the Share Holder Date Increase/Decrease in share holding
Reason No of Shares
% of total shares of the
Company
Date wise Increase / Decrease
in Shareholding during the year
specifying the reasons for increase
and decrease (e.g. allotment/
transfer/bonus/sweat equity etc.)
05/08/2016 17140 Transfer 5493028 0.59
12/08/2016 15398 Transfer 5508426 0.59
19/08/2016 7226 Transfer 5515652 0.59
26/08/2016 51168 Transfer 5566820 0.60
26/08/2016 -212 Transfer 5566608 0.60
02/09/2016 90347 Transfer 5656955 0.61
09/09/2016 65528 Transfer 5722483 0.61
16/09/2016 81430 Transfer 5803913 0.62
23/09/2016 63313 Transfer 5867226 0.63
23/09/2016 -3 Transfer 5867223 0.63
30/09/2016 52882 Transfer 5920105 0.63
30/09/2016 -3 Transfer 5920102 0.63
07/10/2016 266010 Transfer 6186112 0.66
14/10/2016 14357 Transfer 6200469 0.67
21/10/2016 265731 Transfer 6466200 0.69
28/10/2016 50788 Transfer 6516988 0.70
04/11/2016 20453 Transfer 6537441 0.70
11/11/2016 166394 Transfer 6703835 0.72
18/11/2016 148356 Transfer 6852191 0.73
18/11/2016 -7400 Transfer 6844791 0.73
25/11/2016 151330 Transfer 6996121 0.75
02/12/2016 161931 Transfer 7158052 0.77
09/12/2016 78939 Transfer 7236991 0.78
09/12/2016 -8240 Transfer 7228751 0.78
16/12/2016 146194 Transfer 7374945 0.79
23/12/2016 300692 Transfer 7675637 0.82
30/12/2016 294025 Transfer 7969662 0.85
06/01/2017 633331 Transfer 8602993 0.92
06/01/2017 -1091 Transfer 8601902 0.92
13/01/2017 93818 Transfer 8695720 0.93
20/01/2017 249920 Transfer 8945640 0.96
20/01/2017 -14001 Transfer 8931639 0.96
27/01/2017 45581 Transfer 8977220 0.96
03/02/2017 109339 Transfer 9086559 0.97
03/02/2017 -3592 Transfer 9082967 0.97
10/02/2017 152485 Transfer 9235452 0.99
10/02/2017 -254 Transfer 9235198 0.99
17/02/2017 127874 Transfer 9363072 1.00
24/02/2017 321331 Transfer 9684403 1.04
03/03/2017 167275 Transfer 9851678 1.06

127
Cumulative Shareholding during the Year
Sl. No.
Name of the Share Holder Date Increase/Decrease in share holding
Reason No of Shares
% of total shares of the
Company
Date wise Increase / Decrease
in Shareholding during the year
specifying the reasons for increase
and decrease (e.g. allotment/
transfer/bonus/sweat equity etc.)
10/03/2017 50960 Transfer 9902638 1.06
10/03/2017 -15 Transfer 9902623 1.06
17/03/2017 669838 Transfer 10572461 1.13
24/03/2017 609 Transfer 10573070 1.13
24/03/2017 -233997 Transfer 10339073 1.11
31/03/2017 99555 Transfer 10438628 1.12
31/03/2017 -9581 Transfer 10429047 1.12
At the end of the year 10429047 1.12
11 THE NEW INDIA ASSURANCE COMPANY LIMITED
Shareholding at the
beginning of the Year
8758786 0.94
Date wise Increase / Decrease
in Shareholding during the year
specifying the reasons for increase
and decrease (e.g. allotment/
transfer/bonus/sweat equity etc.)
08/04/2016 19217 Transfer 8778003 0.94
15/04/2016 27500 Transfer 8805503 0.95
11/11/2016 880000 Transfer 9685503 1.04
17/02/2017 -31129 Transfer 9654374 1.03
24/02/2017 -45217 Transfer 9609157 1.03
03/03/2017 -66233 Transfer 9542924 1.02
10/03/2017 -36669 Transfer 9506255 1.02
17/03/2017 -117734 Transfer 9388521 1.01
24/03/2017 -56000 Transfer 9332521 1.00
31/03/2017 -51476 Transfer 9281045 0.99
At the end of the year 9281045 0.99
(v) Shareholding of Directors and Key Managerial Personnel:
Sl. No.
Shareholding at the beginning of the year
Cumulative Shareholding during the year
Name of Director / KMP No. of shares
% of total Shares of the
Company
No. of shares
% of total Shares of the
Company
1 A. M. NAIK At the Beginning of the year 1,025,000 0.11
Date wise Increase / Decrease
in Promoters Share holding
during the year specifying the
reasons for increase /decrease
(e.g. allotment / transfer /
bonus/ sweat equity etc):
10-Feb-17 (25000)
At the end of the year 1,000,000 0.11
2 S. N. SUBRAHMANYAN At the beginning of the year 72,056 0.01
Date wise Increase / Decrease
in Promoters Share holding
during the year specifying the
reasons for increase /decrease
(e.g. allotment / transfer /
bonus/sweat equity etc):
26-Aug-16 (ESOP Exercise) 35,000
At the End of the year 107,056 0.01

128
Sl. No.
Shareholding at the beginning of the year
Cumulative Shareholding during the year
Name of Director / KMP No. of shares
% of total Shares of the
Company
No. of shares
% of total Shares of the
Company
3 R. SHANKAR RAMAN At the beginning of the year 174,000 0.02
Date wise Increase / Decrease
in Promoters Share holding
during the year specifying the
reasons for increase /decrease
(e.g. allotment / transfer /
bonus/sweat equity etc):
26-Aug-16 (ESOP Exercise) 15,000
At the End of the year 189,000 0.02
4 SHAILENDRA N. ROY At the beginning of the year 55,350 0.01
Date wise Increase / Decrease
in Promoters Share holding
during the year specifying the
reasons for increase /decrease
(e.g. allotment / transfer /
bonus/sweat equity etc):
26-Aug-16 (ESOP Exercise) 10,000
At the End of the year 65,350 0.01
5 D. K. SEN At the beginning of the year 30,703 0.00
Date wise Increase / Decrease
in Promoters Share holding
during the year specifying the
reasons for increase /decrease
(e.g. allotment / transfer /
bonus / sweat equity etc):
At the End of the year 30,703 0.00
6 M. V. SATISH At the beginning of the year 42,875 0.00
Date wise Increase / Decrease
in Promoters Share holding
during the year specifying the
reasons for increase /decrease
(e.g. allotment / transfer /
bonus / sweat equity etc):
At the End of the year 42,875 0.00
7 M. M. CHITALE At the beginning of the year 1,629 0.00
Date wise Increase / Decrease
in Promoters Share holding
during the year specifying the
reasons for increase /decrease
(e.g. allotment / transfer /
bonus / sweat equity etc):
At the End of the year 1,629 0.00
8 SUBODH BHARGAVA At the beginning of the year 750 0.00
Date wise Increase / Decrease
in Promoters Share holding
during the year specifying the
reasons for increase /decrease
(e.g. allotment / transfer /
bonus / sweat equity etc):
At the End of the year 750 0.00

129
Sl. No.
Shareholding at the beginning of the year
Cumulative Shareholding during the year
Name of Director / KMP No. of shares
% of total Shares of the
Company
No. of shares
% of total Shares of the
Company
9 M. DAMODARAN At the beginning of the year 150 0.00
Date wise Increase / Decrease
in Promoters Share holding
during the year specifying the
reasons for increase /decrease
(e.g. allotment / transfer /
bonus / sweat equity etc):
At the End of the year 150 0.00
10 VIKRAM SINGH MEHTA At the beginning of the year 885 0.00
Date wise Increase / Decrease
in Promoters Share holding
during the year specifying the
reasons for increase /decrease
(e.g. allotment / transfer /
bonus / sweat equity etc):
At the End of the year 885 0.00
11 SUSHOBHAN SARKER jointly with Life Insurance Corporation of India
At the beginning of the year 150 0.00
Date wise Increase / Decrease
in Promoters Share holding
during the year specifying the
reasons for increase /decrease
(e.g. allotment / transfer /
bonus / sweat equity etc):
At the End of the year 150 0.00
12 ADIL ZAINULBHAI At the beginning of the year 100 0.00
Date wise Increase / Decrease
in Promoters Share holding
during the year specifying the
reasons for increase /decrease
(e.g. allotment / transfer /
bonus / sweat equity etc):
–
At the End of the year 100 0.00
13 AKHILESH GUPTA At the beginning of the year 200 0.00
Date wise Increase / Decrease
in Promoters Share holding
during the year specifying the
reasons for increase /decrease
(e.g. allotment / transfer /
bonus / sweat equity etc):
–
At the End of the year 200 0.00
14 SUNITA SHARMA jointly with Life Insurance Corporation of India
At the beginning of the year 100 0.00
Date wise Increase / Decrease
in Promoters Share holding
during the year specifying the
reasons for increase /decrease
(e.g. allotment / transfer /
bonus / sweat equity etc):
At the End of the year 100 0.00

130
Sl. No.
Shareholding at the beginning of the year
Cumulative Shareholding during the year
Name of Director / KMP No. of shares
% of total Shares of the
Company
No. of shares
% of total Shares of the
Company
15 THOMAS MATHEW T. At the beginning of the year 100 0.00
Date wise Increase / Decrease
in Promoters Share holding
during the year specifying the
reasons for increase /decrease
(e.g. allotment / transfer /
bonus / sweat equity etc):
At the End of the year 100 0.00
16 AJAY SHANKAR At the beginning of the year 100 0.00
Date wise Increase / Decrease
in Promoters Share holding
during the year specifying the
reasons for increase /decrease
(e.g. allotment / transfer /
bonus / sweat equity etc):
At the End of the year 100 0.00
17 SUBRAMANIAN SARMA At the beginning of the year 100 0.00
Date wise Increase / Decrease
in Promoters Share holding
during the year specifying the
reasons for increase /decrease
(e.g. allotment / transfer /
bonus / sweat equity etc):
03-Feb-17 21000
At the End of the year 21,100 0.00
18 NAINA LAL KIDWAI At the beginning of the year 100 0.00
Date wise Increase / Decrease
in Promoters Share holding
during the year specifying the
reasons for increase /decrease
(e.g. allotment / transfer /
bonus/sweat equity etc):
At the End of the year 100 0.00
19 NARAYANAN KUMAR As on date of appointment
as Director
–
Date wise Increase / Decrease
in Promoters Share holding
during the year specifying the
reasons for increase /decrease
(e.g. allotment / transfer /
bonus / sweat equity etc):
17-Jun-16 1,000
At the End of the year 1,000 0.00
20 SANJEEV AGA As on date of appointment
as Director
Date wise Increase / Decrease
in Promoters Share holding
during the year specifying the
reasons for increase /decrease
(e.g. allotment / transfer /
bonus / sweat equity etc):
13-May-16 3000
At the End of the year 3,000 0.00

131
Sl. No.
Shareholding at the beginning of the year
Cumulative Shareholding during the year
Name of Director / KMP No. of shares
% of total Shares of the
Company
No. of shares
% of total Shares of the
Company
21 N. HARIHARAN At the beginning of the year 23,140 0.00
Date wise Increase / Decrease
in Promoters Share holding
during the year specifying the
reasons for increase /decrease
(e.g. allotment / transfer /
bonus/sweat equity etc):
At the End of the year 23,140 0.00
V. INDEBTEDNESS
Indebtedness of the Company including interest outstanding/accrued but not due for payment
` crore
Secured Loans
excluding
deposits
Unsecured
Loans
Deposits Total
Indebtedness
Indebtedness at the beginning of the
financial year
i) Principal Amount* 822.40 13102.08 – 13924.48
ii) Interest due but not paid* – – – –
iii) Interest accrued but not due* – – – –
Total (i+ii+iii) 822.40 13102.08 – 13924.48
Change in Indebtedness during the
financial year
Addition^ 5595.91 7984.64 – 13580.55Reduction 5572.36 11272.18 – 16844.54Exchange gain/(loss) – (79.80) – (79.80)Interest accrued but not due – – – –Net Change 23.55 (3367.33) – (3343.79)
Indebtedness at the end of the
financial year
i) Principal Amount* 845.95 9734.75 – 10580.70ii) Interest due but not paid* – – – –iii) Interest accrued but not due* – – – –Total (i+ii+iii) 845.95 9734.75 – 10580.70
* Principal amount mentioned includes interest due but not paid and interest acrrued but not due. Note 60 [C] & Note 60 [J]
^ Addition during the financial year includes interest accrued but not due

132
VI. REMUNERATION OF DIRECTORS AND KEY MANAGERIAL PERSONNEL:
A. REMUNERATION TO MANAGING DIRECTOR, WHOLE-TIME DIRECTORS AND / OR MANAGER:
` crore
Sl. no.
Particulars of Remuneration Name of MD / WTD / Manager Total AmountA M NAIK S N
SUBRAHMANYANR SHANKAR
RAMANSHAILENDRA
ROYD. K. SEN M.V SATISH
1 Gross salary
(a) Salary as per provisions
contained in section 17(1)
of the Income-tax Act, 1961
3.36 1.73 1.41 1.29 1.01 1.01 9.81
(b) Value of perquisites u/s
17(2) Income-tax Act, 1961
19.27~ 7.18 3.15 2.98 0.37 0.63 14.57
(c) Profits in lieu of salary
under section 17(3) Income
tax Act, 1961
– – – – – – –
2 Stock Option – – – – – – –
3 Sweat Equity – – – – – – –
4 Commission
- as % of profit 18.24 11.29 7.41 5.84 4.82 4.32 51.92- others, specify… – – – – – – –
5 Others (Retirement benefits,
Contribution to Provident Fund
& Superannuation Fund)
38.04~ 3.51 2.38 1.93 1.57 1.44 48.87
Total (A) 78.91 23.71 14.35 12.04 7.77 7.40 144.18Ceiling as per the Act 598.09
~ Includes encashment of accumulated past service leave ` 32.21 crore and perquisite value related to employee stock options exercised
during the year in respect of stock options granted over the past several years by a subsidiary company - ` 19.01 crore.
B. REMUNERATION TO OTHER DIRECTORS
` crore
Sl. no.
Particulars of Remuneration
Name of Directors Total AmountM M
ChitaleSubodh
BhargavaM
DamodaranVikram
Singh Mehta
Sushobhan Sarker
Adil Zainulbhai
Akhilesh Gupta
Bahram Vakil *
Swapan Dasgupta
%
Sunita Sharma
Thomas Mathew T
Ajay Shankar
Subrmanian Sarma
Naina Lal Kidwai
Sanjeev Aga $
Narayanan Kumar @
1 Independent Directors
Fee for attending board / committee meetings
0.081 0.067 0.066 0.060 0.062 0.055 0.040 0.072 0.065 NIL 0.055 0.053 0.028 0.704
Commission 0.380 0.495 0.339 0.322 0.342 0.150 0.165 0.310 0.220 NIL 0.150 0.191 0.104 3.168
Others, please specify 0.000
Total (1) 0.461 0.562 0.405 0.382 0.404 0.205 0.205 0.382 0.285 NIL 0.205 0.244 0.132 3.8722 Other Non-Executive
Directors
Fee for attending board / committee meetings
0.067 0.010 0.038 0.115
Commission # 0.223 0.050 0.108 0.381
Others, please specify 0.000
Total (2) 0.290 0.060 0.146 0.000 0.000 0.000 0.496Total (B)=(1+2) 0.461 0.562 0.405 0.382 0.290 0.404 0.205 0.205 0.060 0.146 0.382 0.285 NIL 0.205 0.244 0.132 4.368Total Managerial Remuneration (A) + (B)
148.548
Overall Ceiling as per the Act
657.90
$ appointed as a Director w.e.f. 25.5.2016 @ appointed as a Director w.e.f. 27.5.2016 * ceased to be a Director w.e.f. 1.8.2016
% ceased to be a Director w.e.f. 15.5.2016 # Payable to respective Institutions they represent.

133
C. REMUNERATION TO KEY MANAGERIAL PERSONNEL OTHER THAN MD / MANAGER / WTD
` crore
Sl. no.
Particulars of Remuneration Key Managerial Personnel
CEO Company Secretary
(N. Hariharan)
CFO Total
1 Gross salary
(a) Salary as per provisions contained
in section 17(1) of the Income-tax
Act, 1961
Not Applicable
0.99
Not Applicable
0.99
(b) Value of perquisites u/s 17(2)
Income-tax Act, 1961
0.05 0.05
(c) Profits in lieu of salary under
section 17(3) Income-tax Act, 1961
– –
2 Stock Option – –
3 Sweat Equity – –
4 Commission
- as % of profit – –
- others, specify… – –
5 Others (Contribution to Provident
Fund & Superannuation Fund)
0.07 0.07
Total 1.11 1.11
VII. PENALTIES / PUNISHMENT/ COMPOUNDING OF OFFENCES:
Type Section of the
Companies Act
Brief
Description
Details of
Penalty/
Punishment/
Compounding
fees imposed
Authority [RD/
NCLT/COURT]
Appeal made,
if any (give
Details)
A. COMPANY
Penalty
NIL Punishment
Compounding
B. DIRECTORS
Penalty
NIL Punishment
Compounding
C. OTHER OFFICERS IN DEFAULT
Penalty
NIL Punishment
Compounding

134
Annexure ‘G’ to the Board Report
DIVIDEND DISTRIBUTION POLICY
INTRODUCTION
As per Regulation 43A of the Securities and Exchange Board of India (Listing Obligations and Disclosure Requirements) Regulations, 2015, prescribed Listed Companies are required to frame a Dividend Distribution Policy.
PURPOSE
The purpose of this Policy is to regulate the process of dividend declaration and its pay-out by the Company which would ensure a regular dividend income for the shareholders and long term capital appreciation for all stakeholders of the Company.
AUTHORITY
This Policy has been adopted by the Board of Directors of Larsen & Toubro Limited (‘the Company’) at its Meeting held on 22nd November, 2016. The Policy shall also be displayed in the annual reports and also on the website of the Company.
FORMS OF DIVIDENDS
The Companies Act provides for two forms of Dividend:
• Final Dividend
The final dividend is paid once for the financial year after the annual accounts are prepared. The Board of Directors of the Company has the power to recommend the payment of final dividend to the shareholders for their approval at the general meeting of the Company. The declaration of final dividend shall be included in the ordinary business items that are required to be transacted at the Annual General Meeting.
• Interim Dividend
This form of dividend can be declared by the Board of Directors one or more times in a financial year as may be deemed fit by it. The Board of Directors shall have the absolute power to declare interim dividend during the financial year, in line with this policy. The Board should consider declaring an interim dividend after finalization of quarterly/ half yearly financial results. This would be in order to supplement the annual dividend or to reward shareholders in exceptional circumstances.
QUANTUM OF DIVIDEND AND DISTRIBUTION
Dividend payout in a particular year shall be determined after considering the operating and financial performance
of the Company and the cash requirement for financing the Company’s future growth. In line with the past practice, the payout ratio is expected to grow in accordance with the profitable growth of the Company under normal circumstances.
DECLARATION OF DIVIDEND
Dividend shall be declared or paid only out of-
1) Current financial year’s profit:
a) after providing for depreciation in accordance with law;
b) after transferring to reserves such amount as may be prescribed or as may be otherwise considered appropriate by the Board at its discretion
2) The profits for any previous financial year(s) after providing for depreciation in accordance with law and remaining undistributed; or
3) out of 1) & 2) both.
The circumstances under which shareholders may not expect dividend/or when the dividend could not be declared by the Company shall include, but are not limited to, the following:
a. Due to operation of any other law in force;
b. Due to losses incurred by the Company and the Board considers it appropriate not to declare dividend for any particular year;
c. Due to any restrictions and covenants contained in any agreement as may be entered with the Lenders and
d. Due to any default on part of the company.
FACTORS AFFECTING DIVIDEND DECLARATION:
The Dividend pay-out decision of any company, depends upon certain external and internal factors-
External Factors:
• Legal/ Statutory Provisions and Regulatory concern: The Board should keep in mind the restrictions imposed by Companies Act, any other applicable laws with regard to declaration and distribution of dividend. Further, any restrictions on payment of dividends by virtue of any regulation as may be applicable to the Company may also impact the declaration of dividend.

135
• State of Economy: The Board will endeavor to retain larger part of profits to build up reserves to absorb future shocks in case of uncertain or recessionary economic conditions and in situation where the policy decisions of the Government have a bearing on or affect the business of the Company.
• Nature of Industry: The nature of industry in which a company is operating, influences the dividend decision. Like the industries with stable demand throughout the year are in a position to have stable earnings and thus declare stable dividends.
• Taxation Policy: The tax policy of a country also influences the dividend policy of a company. The rate of tax directly influences the amount of profits available to the company for declaring dividends.
• Capital Markets: In case of unfavorable market conditions, Board may resort to a conservative dividend pay-out in order to conserve cash outflows and reduce the cost of raising funds through alternate resources.
Internal Factors:
Apart from the various external factors, the Board shall take into account various internal factors including the financial parameters while declaring dividend, which inter alia will include -
• Magnitude and Stability of Earnings: The extent of stability and magnitude of company’s earnings will directly influence the dividend declaration. Thus, the dividend is directly linked with the availability of the earnings (including accumulated earnings) with the company.
• Liquidity Position: A company’s liquidity position also determines the level of dividend. If a company does not have sufficient cash resources to make dividend payment, then it may reduce the amount of dividend pay-out.
• Future Requirements: If a company foresees some profitable investment opportunities in near future including but not limited to Brand/ Business Acquisitions, Expansion / Modernization of existing businesses, Additional investments in subsidiaries/associates of the Company, Fresh investments into external businesses, then it may decide for lower dividend payout and vice-versa.
• Leverage profile and liabilities of the Company.
• Any other factor as deemed fit by the Board.
RETAINED EARNINGS
The portion of profits not distributed among the shareholders but retained and used in business are termed as retained earnings. It is also referred to as ploughing back of profit. The Company should ensure to strike the right balance between the quantum of dividend paid and amount of profits retained in the business for various purposes. These earnings may be utilized for internal financing of its various projects and for fixed as well as working capital. Thus the retained earnings shall be utilized for carrying out the main objectives of the company and maintaining adequate liquidity levels.
PARAMETERS THAT SHALL BE ADOPTED WITH
REGARD TO VARIOUS CLASSES OF SHARE
The Company does not have different classes of shares and follows the ‘one share, one vote’ principle.
REVIEW & AMENDMENT
The Policy shall be reviewed as and when required to ensure that it meets the objectives of the relevant legislation and remains effective. The Executive Management Committee has the right to change/amend the policy as may be expedient taking into account the law for the time being in force.

136
in staving off downside risks and securing the
recovery.
Overview of Indian Economy:
Amidst the global backdrop, Indian economy
stood steadfast on its growth trajectory. In the
framework of robust macro-economic stability,
the year 2016-17 was marked by a few but robust
policy developments such as passage of bankruptcy
code, constitutional amendments paving way for
GST and demonetization of notes in the pursuit
of enhancing formalization of various segments of
the economy. The GDP growth for the year 2016-
17 at 7.1% was lower as compared to the previous
year on account of weak investment sentiments
even though Government enhanced spending and
exports rose over the last few months of the year.
Demonetization had a temporary adverse impact,
as labour- intensive construction sector contracted.
Growth in gross fixed capital formation slowed
sharply in FY17 to 27.1% from 29.3% a year ago.
In the fiscal year 2017-18 India is expected to
grow to around 7.2% provided macroeconomic
parameters are favourable. There is an uptick in
India’s exports based on global economic activity.
Consumption is also expected to witness traction
as the economy catches up after demonetization
MANAGEMENT
DISCUSSION AND
ANALYSIS
Overview of World Economy:
In 2016 the global economy witnessed slow
pace of growth and uncertainties with developed
countries adopting protectionist policies. The
current year is showing signs of revival of
investment climate as the capital markets gain
buoyancy, signs of recovery in manufacturing and
trade, likely upside in the economic activity in
Japan driven by healthy net exports and European
countries witnessing traction in domestic demand
paving way for growth. Advanced economies are
expected to make small step-ups while growth in
emerging economies continue to drive the global
growth projections. China is expected to showcase
favourable growth with strong policy support. Oil
prices have shown traction in the recent months
and are expected to be range bound thus bringing
down the level of budget deficits in Middle East,
allowing the Governments to have additional fiscal
space to increase investments.
However protectionist policies by the US and
geopolitical risks persist that may pose impediment
in the global economic recovery. The advanced
economies are facing persistent structural
problems such as low productivity growth and
high income inequality. Against this backdrop,
economic policies have an important role to play

137
• Strengthening execution and operational
efficiency: The Company is focused on bringing
about cost & operational efficiencies for
achieving profitable growth in the competitive
business environment. The emphasis is on better
contract and project management. The endeavor
is to lower costs while maintaining quality and
managing complexity.
• Business value unlocking: The Company
reviews its portfolio and looks for opportunities
to divest from non-core businesses for unlocking
value. The Company is focused on shareholder
value creation and enhancing returns through
monetization of some of the road concessions
and the port assets as a part of its strategic plan.
• Emphasis on improving Working capital
level: The Company will continue to focus on
reducing the working capital levels by emphasis
on speedy customer collections, accelerating
invoicing of work completed and reducing
inventory levels.
• Digitalization: The Company has identified
digitalization as a key driver to enhance its
global competitiveness. Various digitalization
initiatives are under way to aid project
monitoring and enhancing efficiencies. The
Company is threading in various digital strategies
into the business model and also simultaneously
building relevant capabilities to harness the true
power of digital assets.
and cheaper borrowing cost. Emphasis of the
budget proposals on growth simulation through
infrastructure development, focus on affordable
housing, digitalization of the economy, Make in
India campaign are expected to start showing
positive results in the later part of the current year.
Introduction of GST will create a common market,
improve tax compliance and governance, thereby
boost investment and growth.
Certain downside risks do persist, especially on
the banking sector front. High levels of NPAs
and strained balance sheets of the banks pose
constraints to funding for new investments.
Structural reforms for debottlenecking the
economic growth, bringing fiscal prudence in the
state budgets and faster implementation of various
development programmes of the Government are
very important for speedy revival of investment
climate.
Business Scenario:
The performance in the current year 2017-18 lays
reliance on significant pick-up in Government led
expenditure on development of rural and urban
infrastructure, fast tracking of some defence orders
and revival of domestic manufacturing sector.
Select international markets continue to hold
importance for business prospects of Hydrocarbon
and Infrastructure segment.
The Company has identified certain key thrust
areas and strategies to focus on the upcoming
opportunities.

138
Infrastructure Business
For FIFA 2022, L&T is building the Al Rayyan Stadium, using environmentally-friendly building materials and practices. L&T has been associated with several prominent stadiums in India and abroad.
Infrastructure Business Scenario
Indian Construction Sector: A major push from
the Government on the roads, railways, and urban
infrastructure segments has helped construction
companies improve their order book position.
The sector’s pace of recovery is, however, likely
to be modest and will be linked to the on-ground
impact of the policy measures including the release
of 75% arbitral award as well as the availability
of funds for project development. Short term
demonetisation will have a negative impact on
construction activities; however, the impact should
subside and the situation is expected to normalize
from Q1 of FY 2017-18 onwards. Significant
improvements in the liquidity profile and credit
metrics of construction companies will take time
and will be contingent on an improvement in the
working capital cycle and in the pace of execution,
besides their ability to deleverage by raising
long-term funds through stake sale or equity
placements. Revival of private sector participation
will be key to faster infrastructure development.
Railways will be one of the biggest drivers of
infrastructure capex over the medium term.
Global Construction Sector: The story is more
mixed. Investments are projected to increase
through 2018, in line with a projected rise in oil
prices, but overall spending levels will remain far
below the historic highs of 2012 and 2013. Market
consolidation will rebound, larger firms that
survived the last few years now face pressure from
shareholders, analysts, and other stakeholders to
continue creating value. Construction players in

139
rapidly growing economies have spent the past
decade focusing on their home markets, steadily
building up cash positions and internal expertise.
Now, as growth eases in their home markets, they
are expanding outward and seeking to compete
against established global players.
Digital in Construction
L&T Construction is re-inventing its core business
operations by leveraging Digital technologies.
A range of solutions targeted at reducing
operating costs, improving productivity, enhancing
safety, and reducing execution time are being
implemented.
Real time monitoring and analysis of Plant and
Machinery operations powered by Internet of
Things have started providing actionable data and
insights that enable improvement in equipment
utilization and productivity.
Project monitoring enabled by mobile technologies
and advanced analytics are being rolled out across
multiple project sites targeted at delivering the
right insights to operations personnel to improve
project progress.
Digital engineering and design have been set in
motion with Building Information Management,
Augmented and Virtual Reality based solutions.
3D scanning technologies such as LiDAR,
Photogrammetry, satellite remote sensing are
enabling accurate surveys in different terrains,
resulting in better quantity estimations.
Immersive safety training powered by Virtual
Reality is being developed. RFID technologies are
being used for designing solutions for material
tracking and management, and worker safety.
In our endeavor to improve the workmen
management system, linking of workmen database
with their Aadhar and bank accounts is also being
implemented.
All these digital solutions are throwing up a
breadth of rich data at a high velocity. Big data
analytics is the way forward for analyzing this data.
L&T Construction is setting up an Analytics center
of excellence with the right infrastructure and
experienced data scientists.
Implementation of these exciting solutions require
a highly engaged work force and L&T Construction
has been an early mover in this space. With 30,000
plus users and 2000 active groups, Workplace by
Facebook has been a new and successful platform
for collaboration and engagement since August
2016.
Digital is imperative for attaining competitive
advantage in today’s world of business. L&T
Construction will continue to focus on Digital for
building impactful solutions that fuel business
growth.
BUILDINGS AND
FACTORIES
Overview:
L&T’s Buildings & Factories (B&F) business vertical
is a market leader in the arena of Engineering,
Procurement and Construction (EPC) of airports,
hospitals, stadiums, hotels, institutional spaces,
IT parks, office buildings, elite residential
buildings, high rise structures, mass housing The 1600-bed multi-speciality Safdarjung Hospital in Delhi.
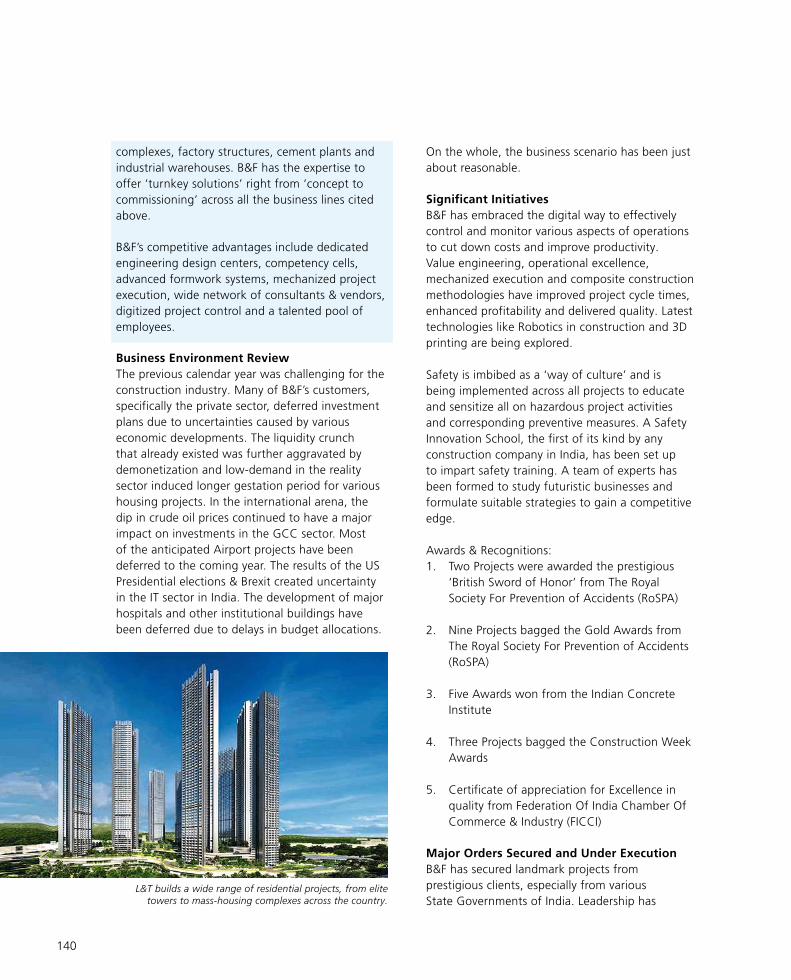
140
complexes, factory structures, cement plants and
industrial warehouses. B&F has the expertise to
offer ‘turnkey solutions’ right from ‘concept to
commissioning’ across all the business lines cited
above.
B&F’s competitive advantages include dedicated
engineering design centers, competency cells,
advanced formwork systems, mechanized project
execution, wide network of consultants & vendors,
digitized project control and a talented pool of
employees.
Business Environment Review
The previous calendar year was challenging for the
construction industry. Many of B&F’s customers,
specifically the private sector, deferred investment
plans due to uncertainties caused by various
economic developments. The liquidity crunch
that already existed was further aggravated by
demonetization and low-demand in the reality
sector induced longer gestation period for various
housing projects. In the international arena, the
dip in crude oil prices continued to have a major
impact on investments in the GCC sector. Most
of the anticipated Airport projects have been
deferred to the coming year. The results of the US
Presidential elections & Brexit created uncertainty
in the IT sector in India. The development of major
hospitals and other institutional buildings have
been deferred due to delays in budget allocations.
On the whole, the business scenario has been just
about reasonable.
Significant Initiatives
B&F has embraced the digital way to effectively
control and monitor various aspects of operations
to cut down costs and improve productivity.
Value engineering, operational excellence,
mechanized execution and composite construction
methodologies have improved project cycle times,
enhanced profitability and delivered quality. Latest
technologies like Robotics in construction and 3D
printing are being explored.
Safety is imbibed as a ‘way of culture’ and is
being implemented across all projects to educate
and sensitize all on hazardous project activities
and corresponding preventive measures. A Safety
Innovation School, the first of its kind by any
construction company in India, has been set up
to impart safety training. A team of experts has
been formed to study futuristic businesses and
formulate suitable strategies to gain a competitive
edge.
Awards & Recognitions:
1. Two Projects were awarded the prestigious
‘British Sword of Honor’ from The Royal
Society For Prevention of Accidents (RoSPA)
2. Nine Projects bagged the Gold Awards from
The Royal Society For Prevention of Accidents
(RoSPA)
3. Five Awards won from the Indian Concrete
Institute
4. Three Projects bagged the Construction Week
Awards
5. Certificate of appreciation for Excellence in
quality from Federation Of India Chamber Of
Commerce & Industry (FICCI)
Major Orders Secured and Under Execution
B&F has secured landmark projects from
prestigious clients, especially from various
State Governments of India. Leadership has L&T builds a wide range of residential projects, from elite
towers to mass-housing complexes across the country.

141
Technology Centre for a global oil major in Bangalore.
been maintained in the construction of various
commercial and residential buildings in the
country.
Major orders were secured from esteemed
customers for the construction of high rise
residential towers in western part of India.
Some of the key projects commissioned by B&F this
year are:
• Offices for IT companies
• Airport at Cochin
• Safdarjung Hospital and medical colleges for the
Govt. of Odisha.
• Secretariat for the Govt. of Andhra Pradesh
• High rise residential towers in various parts of
the country
• Cement Plants
Outlook
To improve the country’s infrastructure and to
boost the economy, the Government has taken
several good steps and B&F is optimistic and
buoyant to capture the momentum. A few positive
factors are furnished below:
• “Housing for all” coupled with the Government’s
credit linked subsidy schemes and a rising middle
class will drive demand for affordable houses
• The GST reform should help in streamlining the
manufacturing sector
• Budget allocation for various AIIMS, IITs and
other national institutions
• Rise in medical tourism is expected to generate
more investments
• Rising internet usage has increased the
requirement for data centers

142
B&F is poised for steady growth in the forthcoming
years against the backdrop of a reviving economy,
improving business climate, healthy order book,
wide customer network, strong organizational
setup, efficient supply chain management,
digitized work culture, requisite resources and a
skilled workforce.
Larsen & Toubro Oman LLC (LTO): Subsidiary
Company
LTO, a JV with Zubair Corporation LLC, has
been providing engineering, construction and
contracting services for nearly a decade in the
Sultanate of Oman. The Company has an excellent
track record in civil projects and continues to enjoy
customer preference in the country. L&T, through
its wholly owned subsidiary L&T International FZE,
holds 65% in the Company.
The oil price impact has limited the investment
plans in the country.
TRANSPORTATION
INFRASTRUCTURE
Overview:
The Transportation Infrastructure business vertical
is well-diversified in terms of its product range
and geography of operations, spread across
India and various GCC countries. The business
offers its services in the fields of Roads, Runways
(Airside Infrastructure) & Elevated Corridors
(RREC), Railways Construction, Railways Systems &
International Infrastructure.
The business leverages its vast experience in Project
Management, Engineering Design & Construction
Management to achieve operational efficiency.
It has Engineering Design Centers in Mumbai,
Faridabad and Chennai and an Offshore
Engineering Centre in Mumbai, besides Area
Offices in India and GCC countries. In addition, the
business has a competency development center at
Kanchipuram, and undertakes workmen training at
CSTI, Ahmedabad.
Business environment
Transportation Business is keen to continue
building a robust order book which includes orders
in both Road and Railway sectors.
The Railway Business has been awarded the
largest ever composite package in the history of
the Indian Railways by DFCCIL (Dedicated Freight
Corridor Corporation of India Limited) for track
laying, electrification and associated S&T works
from Dadri - Rewari for 322 TKms (CTP 14) and
electrification of 881 TKms from Mughal Sarai to
New Bhaupur Section, Uttar Pradesh for Package
CP 204.
The Road business has secured various orders for
the construction of highways during the year.
On the International front, the business
secured the extension of the Tripoli Road and
Improvements of the Algeria Road project in UAE.
The major roads orders received in India are:
the rehabilitation and upgradation of the
Veer (Wadpale) to Bhogaon Khurd section of
NH-17 from PWD and the rehabilitation and
augmentation of the Helwak to Karad section of
NH-166E to 2-lane for a length of 48 Kms from
MORTH.
L&T has deployed a new track construction machine capable of laying 2 km of tracks per day - setting a benchmark in high-speed rail construction.

143
Projects completed during the year include:
• Gr.149 Barauni - Katihar Railway Electrification
Project (437 TKM).
• Bina-Ganj Basoda 3rd Line project: Composite
Railway Project (52 RKM).
• Villupuram - Vriddhachalam Doubling project:
Composite Railway Project (54 RKM).
• Vriddhachalam - Ariyalur Doubling project:
Composite Railway Project (52 RKM).
A few other projects which are in the final stage of
completion include:
• Development of the Unnao Lucknow expressway
63 Km, 6 Lane Expressway in Uttar Pradesh.
• Kanaktora Jharsuguda Road Project 66.9 Km,
2 Lane Highway in Odisha.
• Maharashtra/Karnataka Border to Sangareddy
Road Project 142 Km, 4 Lane Highway in
Telangana and Karnataka
• Sambalpur Rourkela Road Project 162 Km,
4 Lane Highway in Odisha.
• Airside works at Kannur international Airport
– 3.4 Km Runway and Airside Development in
Kerala
During the year, Transportation Infrastructure
business bagged 12 International Safety awards
and 4 prestigious safety awards from National
Safety Council (NSC), India.
Digital Initiatives
Technology is the key to achieve operational
excellence and digital technologies are the
most promising to support business to optimize
its functions. A lot of thrust has been put on
developing and implementing digital solutions
for better visibility and superior decision making.
A host of solutions are being developed and
are being implemented for asset management,
project monitoring, material & resource
management; advanced sensors are being added
to automate equipment operations to achieve
better productivity and specialized P&M are
being added to the fleet to improve execution
process and quality. The 2D control system is
being implemented on Motor Graders in a few of
our projects. This system helps in controlling the
blade movement so as to significantly improve the
accuracy in grading while reducing the time and
effort.
Outlook
For Roads, Runways, (Airside Infrastructure) &
Elevated Corridors (RREC) Business
In the road sector, the budget allocation for
National Highways has been increased by 14% and
stepped up to ` 67,000 crore in 2017-18.
Around 2000 km of coastal roads have been
identified for construction which will help
accelerate the development of Coastal Economic
Zones.
The Ministry has targeted constructing 15,000 km
of national highways during 2017-18 that
translates into 41 km of road construction daily.
For Railway Business
Indian Railways are reportedly planning its
highest outlay of ` 1.31 lakh crore for FY 2017-18,
One of the many flyovers built by L&T in India.

144
an increase over last year outlay of ` 1.21 lakh
crore.
The opportunities for Railways SBG on the
mainline Railways will essentially come from the
tenders floated by RVNL and Zonal Railways which
are of significant size and high value and will be
on EPC mode with internationally accepted FIDIC
conditions.
The Railway SBG will focus on the remaining
packages of the Eastern DFC which includes 3
packages for systems and one package for Civil
and Track. Three more New Freight corridors
totaling 5773 RKM with investment of
` 3.74 lakh crore have been announced in the
Budget and are likely to fructify in next 5 years.
Indian Railways’ initiative Mission Electrification
envisages electrification of nearly 25,000 RKM
in 5yrs (2016-21). During the current year,
opportunities are expected to the tune of
` 20,000 crore for capacity augmentation in
2017-18 backed by innovative institutional
funding. In the electrification space, the business
intends to participate in ‘large value projects’ and
‘projects in EPC mode’.
High speed Rail Project connecting Mumbai –
Ahmedabad is emerging opportunity for this
business. Our Railway business has opportunities
in Track, Electrification and Signalling &
Telecommunication (S&T) works. Upcoming metros
projects will provide more business opportunities
for this segment.
The business is also targeting integrated systems
projects in various countries while exploring
opportunities in some select African countries.
Emphasis on integrated projects are in line with
the long term vision of the business which is to
become a full range system integrator in Railway
Projects.
For International business
The growth projection and development in Middle
East countries is mostly driven by the oil prices.
Looking at the recent prices of crude oil which is
balancing around USD 50 per barrel, the spending
cuts should be less impacted.
Increased infrastructure investment, particularly in
the UAE, Qatar & Kuwait, should further support
the recovery in non-oil activity this year. Both
UAE and Qatar have firm deadlines by which they
need to deliver world class events that require
substantial new infrastructure.
HEAVY CIVIL
INFRASTRUCTURE
Overview:
The Heavy Civil Infrastructure business vertical of
L&T Construction undertakes design, engineering
and construction of projects in several segments
that are crucial to the economy: Metros, Nuclear,
Hydel, Ports, Special Bridges, Tunnels and Defence.
The business has strong presence in India, the
Middle East, Bhutan and Bangladesh. In-house
design strengths and unique construction
methodology cells provide competent concept-
to-commissioning solutions to meet customers’
requirements.
Business environment
Infrastructure is a powerful lever for economic
growth, with both a positive short and long-term
impact. In the short-term, investment in
Lucknow Metro, one of the fastest completed metro rail projects in india

145
infrastructure stimulates economic demand and
creates jobs. Over the medium and longer-terms,
well-designed infrastructure projects drive
productivity by deepening markets and making
economies more competitive.
Heavy Civil Infrastructure was able to report
organic growth of 25% YoY for the 5th
consecutive year, even though the general market
situation remained challenging. Due to challenging
markets, improving profitability, productivity
and flexibility became business’s core focus
areas in 2016. Actions were initiated to improve
cost efficiency, productivity and strengthen its
future competitiveness by, among other things,
re-structuring operations. The results of these
actions are expected to be visible in 2017.
Businesses of Heavy Civil Infrastructure are the
foundation of a modern economy and vital for
socio-economic development. The cornerstone
of Heavy Civil Infrastructure’s strategy relies on
strong focus for leaner construction practices and
commitment to customer satisfaction with the aim
to optimize the value chain of its customers and to
improve their competitiveness through increased
productivity and reliability.
Metros
The Heavy Civil Infrastructure business possesses
expertise in end-to-end engineering and
construction of elevated and underground metros
using sophisticated tunnelling techniques. It
ventured into metro rail construction in 2001 with
the prestigious Delhi Metro project. Since then,
L&T has emerged as the leading builder of metro
systems in the country, executing as many as 17
ongoing projects across 8 cities in India. L&T is also
involved in building major portions of the Riyadh
and Doha Metros. The business also specializes in
delivering metro projects on turnkey basis.
Areas of expertise:
• Elevated viaduct construction using segmental,
U-trough, I-girder methods and balanced
cantilever construction
• Underground tunnel construction using NATM,
cut and cover and TBM methods
• Underground station construction using
top-down and bottom-up approaches
• Elevated metro stations with expertise in spine
beam concept (lean).
Defence
L&T Construction, is well geared with
comprehensive range of Engineering and
Construction Services to meet the specialized
needs of the Defence sector. With massive
investments planned by the Ministry of Defence for
developing world class systems, opportunities are
aplenty for L&T Construction, which is well placed
and equipped for execution.
The specialty of L&T Construction is to offer EPC
(Engineering Procurement Construction) solutions
with single-source responsibility for execution of
mega projects from concept to commissioning
under the realms of Infrastructure facilities for
Defence bases, underground facilities, niche
technologies, security & surveillance and training
facilities.
Nuclear Power
L&T is a leader in the Indian nuclear sector by
constructing the majority of the country’s nuclear
power plants. The business has developed
expertise in both Pressurised Heavy Water (PHWR)
and Light Water (LWR) reactor technologies with a
Dome erection at the Kakrapar Atomic Power project, Gujarat

146
market share of 64%. With its proficiency, L&T is
attracting the global companies in the field of LWR
as tie-up partners to set up new plants in India.
It is currently executing civil works for a mega
order of 2 X 1000MW from NPCIL at Kudankulam
Nuclear Power Project (LWR), one of the largest
projects in India’s nuclear industry.
With such impeccable credentials, L&T is emerging
as a pioneer in supporting India’s plan of supplying
25% of electricity from nuclear power by 2050.
Areas of expertise:
• EPC solutions in civil, mechanical, electrical &
instrumentation in PHWR projects
• Expanding Engineering, Procurement and
Construction capability by venturing in to EPC
contracts in LWR
• Design capacity for end to end civil works
including seismic qualification, procurement and
construction services
• Expertise in Modular Construction Technology
Special Bridges
L&T has built some of the finest bridges across
challenging terrains, incorporating design features
that are among the most complex of their
kind. The Company has pioneered several new
technologies for the construction of bridges such
as incremental launching, segmental construction,
cable stayed, precast, prestressed concrete, steel
and concrete composite construction. Apart from a
pan-India projects scape, the business has presence
in Malaysia, Dubai, Oman, Jordan and Bangladesh.
L&T has built the longest Extra dosed bridge in
India across river Narmada at Bharuch, Gujarat.
Currently L&T is building the longest extra dosed
bridge in the world at Patna, Bihar in a Joint
Venture with Daewoo and is undertaking 3 other
Iconic bridges across India and a major railway
bridge project at Khulna, Bangladesh.
Hydroelectric Power Plants
L&T’s Hydro Business is one of the most significant
players in the development of Hydroelectric Power
Plants and offers a comprehensive ‘Water to Wire’
range of services that facilitate the execution
of Hydroelectric Power Projects on an Engineer-
Procure-Construct basis in tough mountainous
terrains.
Areas of expertise:
• Diversion weirs, Barrages, Concrete / Earthen /
Rockfill Dams, including RCC (Roller-Compacted
Concrete) dams
• Underground tunnels of various geometry and
diameter (both concrete lined and steel lined)
• Open and Underground De-silting Chambers
• Large underground power and surface power
houses
• Pressure Shafts, Drop Shafts and Surge Shafts /
Surge Chambers
• Hydro-mechanical components such as gates,
penstocks, etc., including erection of
electro-mechanical equipment
• Specialised underground structures
An underground section of the Chennai Metro.

147
Ports
The L&T Ports Business unit has been a part
of building marine infrastructure that has
given a great fillip to marine and waterway
transportation. It is also one of the pioneers in
the EPC construction of ports in India since 1950s
thanks to which L&T’s expertise in marine works is
demonstrated all along India’s coastline.
L&T has significantly contributed to the
development of Ports by designing and executing
7000m berthing structures including Liquid
Jetties, Container Terminals, Multipurpose Berths
and Ferry Terminals. The company is proud to
have built 14000m breakwaters and handled
Armour rock of size 20T, Accropod – Max size 6.3
cum, the deepest breakwater (~18m) which is a
state-of-the-art construction having adopted the
innovative concept of partial replacement of rock
core with dredged sand in the construction of
breakwater. It has also executed other maritime
structures like Shipyards, Caissons, Long Span
Approach Trestles, Intake Structures which are
unique in nature.
L&T Geostructure
L&T GeoStructure is a unique entity, focusing
on deep foundations and ground engineering
business, with a fleet of sophisticated foundation
equipment. It has expertise in the areas of river
linking, marine structures and deep foundation-
supported bridges, basement & underground
structures, and deep shafts.
The gamut of unique activities include execution
of large diameter deep piles, marine piles, deep
diaphragm walls, secant pile walls, plastic concrete
cut-off walls, sheet piling, ground improvement,
foundation testing and geotechnical investigation.
Marquee Projects Commissioned
• CC17-Metros
New Orders
• Construction of Hydro Technical Structures for
Ph-2 of KKNPP at Kudankulam, Tamil Nadu
• 2 X 1,000 MW Kudankulam Nuclear Power
Project 3&4 Kudankulam, Tamil Nadu
• Construction of barrage across Godavari river
near Medigadda, Mahadevpur Karimnagar
District, Telangana
• Cable stayed Bridge across Durgam Cheruvu
Lake at Madhapur in Hyderabad in EPC.
• Ahmedabad Metro – UG PKG 2
Track Record
• 2.65 km of Cable Stay bridges completed,
11.82 km of Cable Stay bridges under
construction
• 2.16 km of Railway Bridges completed, 13.89 km
of Railway Bridges under construction
• Part of commissioned India’s first 1,000 MWe
nuclear power plant
• 8,080 MW of reactor containment structures
• 306 km of metro (including ongoing projects)
• 8,315 MW of clean and green power Across River Mandovi in Goa, L&T is building one of India’s
longest cable-stayed bridges.

148
• 90 km of tunnelling in difficult Himalayan
terrains
• 12 dams / barrages / weirs
• 7 Powerhouses including both underground and
surface structures
• LPG underground storage cavern 200 m below
ground level – one of the largest of its kind, and
the first of its kind in South Asia
Digital Initiatives
In order to optimise the cost and enhance
productivity, Heavy Civil Infrastructure has
implemented several digital initiatives including
P&M tracking and Monitoring, Project monitoring
& Control using mobile based applications, use of
E-Measurement books, Workmen tracking using
RFID, etc. BIM (Building Information Modelling) is
being extensively used in Metro projects for Design
and progress monitoring during execution. The
Business is exploring the possibility of using Drones
for survey for various projects.
Outlook
The Union budget 2017-18 has given a major
boost to the infrastructure sector. In the FY18
budget, the government has allocated a record
` 3.96 lakh crore to the infrastructure sector
which should spur economic activity. A majority
of this allocation has been ear-marked to build
Metros, Bridges, Hydro Power Projects and Tunnels,
which form the core expertise of the Heavy Civil
Infrastructure business. The Government intends
to build an effective infrastructure system to make
domestic economy more competitive as compared
to those of other emerging countries. With macros
improving, and measures to revive infrastructure
sector through new forms of awarding (Hybrid
Annuity Model/Swiss Challenge Mode) and new
forms of financing (REITs and InVITs), it is believed
there will be a revival of stranded projects and
easing of cash flows which will provide long
term growth visibility. Also, as ever Heavy Civil
Infrastructure business is focused towards EPC
projects.
POWER TRANSMISSION &
DISTRIBUTION
Overview:
L&T’s Power Transmission and Distribution business
vertical is a leading EPC player in the field of power
transmission and distribution and solar energy.
It offers integrated solutions and end-to-end
services ranging from design, manufacture, supply,
installation and commissioning of Transmission
lines, Substations, Underground cable networks,
Distribution networks, Power quality improvement
projects, Infrastructure electrification, Solar PV
plants, Battery energy storage system and Mini/
micro grid projects. Besides being a dominant
player in the Indian market, the business enjoys
significant share and a strong reputation in the
Middle East, Africa and ASEAN markets.
Extra High Voltage Substation Systems & Power
Distribution Business Unit focuses on providing
turnkey solutions for Extra High Voltage Air
Insulated / Gas Insulated Substations for Utilities
and Power Plants, EHV Cable & Communication
backbone networks, Utility Power Distribution
and Power Quality Improvement works, complete
Electrical & Instrumentation solutions for various
infrastructure projects such as airports, metros, etc.
The Transmission Line business offers turnkey EPC
solutions in Overhead lines for Power Evacuation
India’s first 1200 kV Air-insulated Substation at Bina inMadhya Pradesh.

149
and Transmission, bolstered by its state-of-the-
art tower manufacturing units at Puducherry,
Pithampur and Kanchipuram supplying over 1.3
lakh tones of tower components annually. The
Testing and Research station at Kanchipuram
accredited by NABL is one of the largest in Asia
and is also amongst the most renowned testing
centres in the world. (NABL: National Accreditation
Board for Testing and Calibration Laboratories).
The Solar business provides single point EPC
turnkey solution for solar PV related projects along
with Energy Storage Solutions. Its experience spans
across from flat to highly undulated as well as to
landfill topologies with specialized technologies
including designing & executing contours following
solar PV power plants. The solar business has
in-house capabilities of different module mounting
structure types such as Fixed Tilt, Seasonal Tilt
and HSAT to choose from for most optimal
solutions. As grid stability and power conditioning
requirements gain significance in the wake of large
scale renewable integration, standalone and PV
integrated storage solutions are being offered.
The international units of the business in the
Middle East, Africa and ASEAN offer complete
solutions in the field of Power Transmission and
Distribution, including High Voltage Substations,
Power Transmission Lines, Extra High Voltage
Cabling and Electrical, Instrumentation and
Controls (EI&C) works for Infrastructure projects
such as Airports, Oil & Gas Industries etc. in UAE,
Qatar, Kuwait, Oman, Saudi Arabia, Bahrain,
Algeria, Kenya, Ethiopia, Malawi, Botswana,
Malaysia and Thailand.
Business Environment
In 2016 – 17 too, the distribution sector in India
maintained the momentum it had gained during
the past years backed by several governmental
initiatives such as UDAY scheme. Supported by
central funding agencies, state utilities have
laid emphasis on strengthening their respective
distribution networks for better efficiency,
accountability and management. The business
continued to capitalize on these opportunities
and successfully maintained its leadership position
by securing urban and rural electrification orders
from West Bengal, Odisha, Bihar, Uttar Pradesh
and Karnataka under the Integrated Power
Development Scheme (IPDS) and Deen Dayal
Upadhyay Gram Jyoti Yojana (DDUGJY) scheme.
The business is privileged to be partner with the
central and state governments in illuminating
thousands of households in the economically
backward areas and electrify hundreds of villages.
In a large number of towns, it has significantly
improved the quality of power and reduced AT&C
losses through distribution reformation projects.
The EHV substation related opportunities in 400kV
& 765kV GIS/AIS segments were steady as central
and select state utilities concentrated on Power
System Strengthening schemes to meet their
demands. Though there were positive signs on
the policy front, the general lack of investments
in conventional power generation and industry
segments continued. Gas and Air Insulated
Substation orders were received from PGCIL and
state utilities including a major substation for solar
power evacuation in the state of Karnataka. The
key substation projects commissioned include
765kV GIS at Srikakulam and the receiving
substation for Lucknow metro.
Transmission line projects have been executed for
PGCIL as well as major state transmission utilities
765 kV Gas-insulated Substation, Varanasi.

150
viz. that of Uttar Pradesh, Chhattisgarh, West
Bengal, Punjab, Tamil Nadu, Bihar, Karnataka
etc. Major projects are also being executed for
private players. With its specialized transmission
line construction crew experienced in challenging
terrain & weather conditions and fast track
projects, the business is presently executing several
projects at 765kV AC, 400kV AC & ±800kV HVDC
levels across the country.
A prestigious order has been received from
Medinipur - Jeerat Transmission Limited which is
an SPV formed by Powergrid for the execution of
the Eastern Region Strengthening Scheme-XVIII.
Many orders have been received from Power Grid
Corporation of India Limited across states. Two
significant orders were bagged from Madhya
Pradesh Power Transmission Company Limited
for constructing a transmission corridor from
Malwa to Badnawar through Pithampur. System
strengthening schemes from Jharkhand Urja
Sanchar Nigam Limited have been secured. The
Testing Station continues to attract orders from its
global customers including from USA, KSA, China
and Malaysia.
The Transmission Line business has commissioned
about 20 transmission corridors of 2400KM
length in FY16-17. The projects commissioned
include India’s first longest 765kV D/C Kudgi TL
(380 km) and 400kV Quad Moose D/C Madhugiri
to Bidadi Transmission Line (94km). Yet another
HVDC transmission line 800kV HVDC Champa-
Kurukshetra Pkg-6 (208km) was commissioned
for PGCIL. At 765kV level, Varanasi – Kanpur
Transmission Line (281km), 765kV S/C Lalitpur-
Agra UP line-Ckt-I & Ckt-II (234km), ERE03 &
ERE04 Srikakulam Vemagiri TL(168km) are among
the major projects commissioned. Besides the
400kV Multicircuit Karamadai - Coimbatore
Transmission Line, a fast track project viz. 400kV
D/C Quad line-Kamudhi-Karaikudi Transmission
Line (112km) was completed for Tamilnadu
Transmission Corporation Limited. In Andhra
230 kV double circuit transmission line at Abu Ali, Saudi Arabia.

151
Pradesh & Telengana 400 kV D/C Jammalmadugu
– Urvakonda & 400kV QDMC line Tungabhadra-
Yemmiganoor (150km) and 400kV Veltoor SS
to Tungabhadra (73km) were commissioned. A
major project for Maharashtra State Electricity
Transmission Co. Ltd (125km) for strengthening
Mumbai Metro was completed.
Buoyed by the ambitious capacity addition plans
and faced with declining tariff trends, the Solar
business was selective and has bagged over
300MW projects in 2016-17.
In the Middle East, though the macro economic
scenario was mixed during 2016-17, the business
witnessed significant investments aided by FIFA
2022-related investments in Qatar, Expo 2020
related plans in UAE and stable T&D investment
plans by KSA and Oman. High voltage transmission
lines and substations to improve power reliability
were entrusted upon the business by Saudi
Arabian customers. Despite spend cuts induced
by the oil price causing a sense of anxiety in the
business climate, the business has secured a major
order from KAHRAMAA involving 30 substations
and 560KM of EHV cabling for the expansion of
the electricity transmission network in Qatar. It
continued to play a vital role in the 400kV Grid
Substation network in Oman by securing another
order. In UAE, the business could garner orders for
constructing a number of 132kV GIS Substations
from DEWA and reputed private customers in
UAE. The business commissioned 36 substations
including two 400kV Grid Stations in Oman, 2
cable projects and an Overhead Transmission Line.
Having qualified for the highest voltage levels in its
lines of business, the business has also added new
private customers.
The business has established strong presence in
select focus countries of Northern and Eastern
African countries. The 400kV substation project
in Algeria has been completed. The substation
projects in Ethiopia and Malawi, and the
Kenya-Ethiopia electrical highway are progressing
at the desired pace. The business has secured
400kV Substation and Transmission Line orders
from utilities in East Africa.
The business has gained a significant foothold and
recognition in the ASEAN market. The ongoing
substation and transmission line projects in
Malaysia and Thailand including South East Asia’s
largest gas insulated substation is on track. Though
new prospects in the ASEAN countries witnessed
certain delays in bid finalization due to low oil
prices, currency volatility and leadership changes
etc., they have gained traction of late.
Significant Initiatives
With major thrust on Digitalisation as a key
enabler, the business rolled out several initiatives
including deployment of drones for project
progress monitoring, connecting plant &
machinery for asset monitoring, using geospatial
technologies for surveys, etc. It has deployed
mobility device based project monitoring tools
across all its active Transmission Line projects.
The workmen related processes are being linked
through unique identification. Several operational
excellence initiatives in the areas of on-time
delivery, profitability enhancement, effectiveness
checks of process implementation, working capital
management and risk management are being
pursued.
Apart from expanding the capacity of the existing
Pithampur factory, a new Transmission Line Tower
manufacturing facility is also on the anvil.
One of the many 400 kV Gas-insulated Substations installed by L&T.

152
Initiatives undertaken to enhance safety in
operations include e-learning modules, improvised
safety cards for reporting unsafe acts/conditions,
virtual reality based training, upgrading Safe
Operating Procedures (SOPs) to reflect changing
work methods and mechanization, adoption of
Sagging Bridge (Stringing Working Platform)
technique and the use of motorized winch
machines in place of tractors, in final sag activities
and enhanced training on Behavior-based Safety,
Safety Audit and Training the trainers.
The Solar business rolled out tracker technology on
a large scale and is currently executing more than
200MW of tracker based projects. Through a first
of its kind distributed generation project in Bihar,
the solar business has entered into energy storage
providing solar power to 200 villages.
The business has strengthened its talent base to
execute ongoing jobs in the ASEAN and African
markets, vigorously pursuing emerging potential
and creating corporate brand awareness and
preference. The business continues to develop
long-term relationships with its customers and
foster strategic partnerships and alliances with key
vendors and OEMs.
As a part of its localization and diversity
enhancement strategy, the business expanded
its Graduate Engineering Trainee programme
to educational institutions in KSA and recruited
young Saudi nationals as budding engineers.
Such initiatives promptly earned awards and
recognition for the business during the year. These
include:
• Transmission Line business received ‘Best Safety
Practice Award’ from PGCIL for 800KV HVDC
Champa - Kurukshetra TL
• Solar business bagged prestigious awards from
Dun & Bradstreet, Construction Times, India
Solar Week 2016 and Solar Today Award 2016
• Two Substation projects in Oman secured ASSE
GCC HSE Excellence Awards
• Projects in Saudi Arabia received the highest
number of awards bagged by a single contractor
from National Grid – Saudi Arabia.
• Prestigious National Safety Council of India
award received for R-APDRP Varanasi Project
• RoSPA , British Safety Council awards for safety
performance for multiple projects
Outlook
In the power distribution front, the centrally
driven schemes viz. Deen Dayal Upadhyaya Gram
Jyoti Yojana (DDUGJY) and Integrated Power
Development Scheme (IPDS) continue to offer
substantial opportunities for rural electrification
and power quality improvement projects. The
increasing cost of land and acquisition related
delays have led Power Grid/ State utilities to
increasingly opt for GIS Substations due to
the less footprint they occupy. As the power
transmission / transformation capacities increase
to cater to the growing demand of urban centres,
new opportunities will arise for EHV (Extra
High Voltage) cabling projects in large cities
keeping in view of the right of way, aesthetics
and Operation & Maintenance aspects. Power
quality improvement projects such as STATCOM,
new clientele out of TBCB players, state utilities
strengthening their networks with funding from 60 MWp Solar Tracker Plant, Tamil Nadu

153
multilateral funding agencies, etc. are expected
to provide a much-needed impetus. However,
coal based power generation is yet to revive and
hence associated evacuation substations are
yet to resurface. The financial health of state
utilities, the political situation in several states
and the availability of funding will remain key
determinants.
System strengthening in state utilities will provide
major impetus to transmission line prospects.
Several interstate and intrastate transmission
lines are expected to go through the Tariff Based
Competitive Bidding route. In certain states,
the capacity enhancement using the already
existing corridor may provide opportunities as it
eliminates the need for fresh acquisition of right
of way thereby reducing costs and saving time.
Substantial activity with many prospects is evident
in the SAARC countries viz. Bangladesh and Nepal,
as they are coming up with several high value
prospects.
The solar power market is poised to pursue its
upward growth trajectory. PV module and finance
costs have fallen for solar projects, this in turn has
brought down the tariff rates. With over 12 GW
of solar projects yet to be installed in India, going
forward, the momentum on projects execution
is expected to remain upbeat. FY 2017-18 is
predicted to gain further in terms of yearly
addition compared to 5.5GW of installations in FY
2016-17 with some forecasts expecting close to
10GW. Energy storage integration into solar plants
will see a rise due to grid stability requirements.
In the Middle East, the business is cautiously
optimistic in its outlook. The slow recovery
of the oil price is not expected to hamper
investments in the T&D sector though there may
be policy measures such as taxation and currency
de-pegging. Infrastructure development will
continue as part of diversifying the economy and
will be aided by events such as FIFA 2022. GCC
grid formation, upgradation to higher voltage
levels, integration of renewable energy sources to
the existing power grid and interconnections of
transmission networks are expected to fuel growth
in power distribution throughout the Middle East.
The revival of UAE market fueled by infrastructure
growth related demand is a positive sign. In KSA
(Kingdom of Saudi Arabia), continued Investment
in basic infrastructure such as Housing, Roads
etc. is fueling the Associated Power infrastructure
projects. Power system capacity expansion to cater
to infrastructure growth is proceeding as per plans
in Qatar. Similarly, continued investments ensure
steady growth in Oman. Input costs are bound
to increase with introduction of VAT and removal
of subsidies on fuel, power and water. However,
these will have a similar impact on all the players.
Prioritization of spending / budgetary allocation
and related delays in project finalization are
potential risks.
Africa’s economic growth has been impressive
and is predicted to remain robust. To sustain and
support high growth rates as expected for Africa
through economic diversification and industrial
development, closing the current gap in power
infrastructure will be crucial. The eagerness
of multilateral funding institutions to sponsor
infrastructure projects either directly through
utilities or through infrastructure developers bodes
L&T’s capability in executing projects for power distribution includes switchyards.

154
well for the business. The business is concentrating
on key African economies that have a clear road
map to build Substations and Transmission Lines
to meet increasing demand. The next phase of
grid strengthening in Botswana and Kenya will
offer further prospects. Rural Electrification,
Regional Interconnection and Grid Strengthening
opportunities are being pursued in Northern and
Eastern African countries.
Power Infrastructure is being steadily ramped
up by the ASEAN countries driven by growth
prospects attributable to regional economic
integration and strategic location. The rising power
demand paves the way for significant investments
in grid interconnections, grid development and
strengthening. Also, a significant part of such
investments is funded by multilateral agencies
opening doors for participation of global players.
With each ASEAN country representing a different
aspect of the electricity sector needs, the business
sees immediate prospects in Malaysia, Thailand
and Myanmar.
The overall outlook for the PT&D sector remains
promising on both the domestic and the
international fronts. The business looks forward
to consolidate its position in established markets
and gain significantly in new growth areas ably
supported by its initiatives on cost leadership and
smart delivery.
Major Subsidiary Company:
LARSEN & TOUBRO OMAN LLC (LTO)
LTO, set up in collaboration with Muscat Trading
Company (Zubair Corporation Group), provides
engineering, construction and contracting services
in the Sultanate of Oman. LTO made its maiden
venture into Oman in 1994 and has completed 23
years, emerging as one of the leading construction
companies. During the past year, the Company
managed to bag a slew of projects including a
major 400kV Grid Station project.
The business expects a stable political and
economic scenario in Oman with growing
opportunities in the T&D segment.
LARSEN & TOUBRO SAUDI ARABIA LLC (LTSA)
LTSA is a wholly-owned subsidiary providing
engineering, construction and contracting
services in the sphere of T&D in the Kingdom of
Saudi Arabia. During the past year, the Company
secured orders for a sizeable number of projects
involving High Voltage Substations and Overhead
Transmission Lines.
With a stable political environment and the
continuing need for strengthening of Transmission
& Distribution network, LTSA is well poised to
garner sizeable opportunities in the coming year.
WATER & EFFLUENT
TREATMENT
Overview:
Water is life. Growing pressure on water resources
due to rise in population, economic growth,
climate change, pollution and other challenges
have had a major impact on our social, economic
and environmental well-being. Many of our most
important aquifers are being over-pumped, causing
widespread declines in groundwater levels.
Sensing the huge potential in this arena, L&T
Construction’s Water & Effluent Treatment
181 MLD water treatment plant for Vellore Water Supplyscheme.

155
business segment has quickly enhanced its process
knowhow and detailed engineering capabilities
across all streams of Water and Wastewater
business in India, Sri Lanka, Middle East and Africa.
The formidable in-house engineering capabilities
coupled with impeccable project management
skills have put this segment much ahead of
competition.
The business has built over 2600 MLD of water
treatment plants; laid over 31,000 km of water
and wastewater pipeline; In addition the business
has also laid pipeline networks to bring more than
1 lac hectare of land into cultivation.
Projects Commissioned & Orders Received
The Water & Effluent Treatment Business has
commissioned several important water projects in
2016-17. These include:
a) Bankura Water Supply Scheme in West Bengal
b) 52 MGD Water Treatment Plant at South 24
Parganas in West Bengal
c) Water Supply Scheme in Pudukottai &
Cuddalore in Tamil Nadu
d) Plant Water Systems at Raichur for RPCL in
Karnataka which is recognized as Asia’s largest
Micro-filtration plant
e) Lift Irrigation Scheme in Hanamapur in
Karnataka
f) Sauni Yojana Link 3 Package 3 in Gujarat
g) Ganga River Front Development Project in
Patna, Bihar
The Business has also been successful in securing
orders from various business domains like lift
irrigation, drinking water supply, common effluent
treatment plants, municipal waste water collection
& treatment and integrated urban infrastructure.
Some of these include:
a) NC-35, NC-36, NC-37 Water Supply Scheme,
Gujarat b) Sikar, Alwar & Bhiwadi Wastewater
Scheme, Rajasthan c) Construction of Water
Storage Reservoir at Vizag Steel Plant, Andhra
Pradesh d) Bansujara Lift Irrigation Scheme,
Madhya Pradesh e) 30 MLD CETP at Ahmedabad,
Gujarat f) Comprehensive Storm Water Drainage
Scheme at Vijayawada, Andhra Pradesh
g) Providing 24x7 Water Supply to Tumakuru
city, Karnataka h) Sewerage integration work
and sewage treatment at Barrackpore, West
Bengal i) Improvement of Water Supply to Greater
Berhampur, Odisha j) Chaigaonmakhan Lift
Irrigation Scheme, Madhya Pradesh k)Integrated
Wastewater Scheme at Sri Ganganagar, Rajasthan
l) Lift Irrigation Scheme at Clusters IX & XII,
Odisha m) Alirajpur Lift Irrigation Scheme, Madhya
Pradesh n) Nandawadagi Lift Irrigation Scheme,
Karnataka o) Sauni Yojana Link-2 Package-4,
Gujarat.
On the International front, the Business has
secured a project in Sri Lanka for Provision of New
Gravity Sewer, Force Mains and Pump Stations and
another project in Tanzania involving extension of
water transmission pipeline from the Lake Victoria
Water Supply Scheme to Tabora, Nzega and Igunga
towns.
Business Environment
The per capita water availability in the country is
rapidly decreasing due to an increase in population
and its consumption. The average annual per
capita availability of water in India was 5177 cubic
meters in 1915, which decreased to 1500 cubic
Hanamapur lift irrigation project, Karnataka.

156
meters as per the 2011 census. It was estimated
that by 2015, the per capita availability would go
down further to 1100 cubic meters.
The Government of India has plans to prevent the
contamination of surface water bodies by stopping
untreated wastewater flowing into these bodies. It
also plans to adopt modern irrigation techniques
so that the dependency on monsoon can be
reduced.
Industries are planning to recycle and reuse
their effluent by adopting advanced treatment
technologies thereby reducing the consumption
of fresh water requirement for their day to day
processes.
Significant Initiatives
With huge opportunities in integrated water
supply prospects, lift irrigation, sewage and
effluent treatment space, significant initiatives
have been taken to ensure that the WET business
of L&T continues to be ahead of competition, both
in terms of market share and profitability. Some of
these initiatives are:-
• Foray into Specialized WTP & Desalination with
technology partnerships.
• Participation in Mega Lift Irrigation System
tenders, in which water is not transported by a
natural flow but is lifted with pumps
• Focus on Zero Liquid Discharge (ZLD) process
along with combined effluent treatment
packages in various states and industries across
India
• Upcoming medium to large scale STP tenders
will improve the quality of urban life.
• The business has provided water infrastructure
facilities, solar powered treatment plants, desks
and important aids to visually challenged and
differently abled children which has resulted in
bringing down the number of school dropouts
and increasing enrollment in schools.
Digital Initiatives
WET business has implemented several digital
initiatives like a) Online prospects tracker
b) Linking workmen database with Aadhaar and
bank accounts c) Online risk management portal
d) Application to monitor the progress of the
projects online. Some of the other digital initiatives
include:-
• Implementation of digital solution to track the
productivity of some of the key assets.
• Elimination of paper log/measurement books
and adoption of online work measurements.
• In geo-spatial arena, usage of LIDAR survey in
some of the wastewater projects.
• Developing design models using BIM.
Risks & Concerns
WET projects carry various risks like ROW issues,
longer O&M periods, fund constraints with client,
bulk materials shortage due to mining issues
at various projects. These risks are mitigated by
continuous follow-ups with the client, formations
of a dedicated O&M segment, detailed financial
analysis of clients during the pre-bid stage and
meticulous planning.
Outlook
There are mega government policies to drive
water infrastructure in India that include AMRUT
(Atal Mission for Rejuvenation and Urban
Transformation), Namami Gange, Pradhan Mantri
Krishi Sinchayee Yojana and Delhi Mumbai
Industrial Corridor Development. In addition, large
investments have been proposed by multi-lateral
funding agencies for water supply and sewer
projects to improve the urban quality of life.
Desalination and Water Management projects are
likely to fructify during the current year due to the
prevailing water stress conditions in most parts
of India. Mega lift irrigation projects have been
proposed across major states along with proposals
to connect rivers with 15,000 km of canals. To
this effect the Pradhan Mantri Krishi Sinchayee
Yojana (PMKSY) has been formulated with the
vision of extending the coverage of irrigation ‘Har
Khet ko pani’ and improving water use efficiency
‘More crop per drop’ in a focused manner
with end to end solutions on source creation,
distribution, management, field application

157
and extension activities. The Government has
already set in motion an integrated Ganga
conservation plan - ‘Namami Gange’ which
envisages investments for sewage infrastructure
across several urban habitations along the river.
Stringent implementation of pollution norms
is in place to encourage setting up of common
effluent treatment plants. The Delhi-Mumbai
Industrial Corridor (DMIC) is India’s most ambitious
infrastructure programme aiming to develop new
industrial cities as ‘Smart Cities’ and converging
next generation technologies across infrastructure
sectors. The programme envisages development of
infrastructure linkages like power plants, assured
water supply, high capacity transportation and
logistics facilities.
In the International market, opportunities have
been identified for desalination and sewage
treatment plants in GCC. The business has already
set its footprint in Tanzania and Sri Lanka and
more are expected from these geographies.
SMART WORLD &
COMMUNICATION
Overview:
India is rapidly gearing up to create smart
infrastructure that will soon be the backbone
of the economy. With the mandate to build a
smart and digital India being at the top of the
Government’s priority list, this area will be abound
with huge opportunities in the near future. The
potential business opportunities are in the areas
of city surveillance, intelligent traffic management
systems, transport & logistics, OFC cabling,
communication network including backbone,
telecom infrastructure, smart governance
& education, Critical Infra and Smart City
Development.
With a successful track-record complemented
by domain knowledge across business verticals,
L&T’s Smart World & Communication Business
Unit (SW&C) is well positioned to be a key Master
L&T creates smart cities by offering integrated capabilities from several of its businesses - L&T Construction, L&T Electrical & Automation, L&T Infotech and L&T Technology Services.
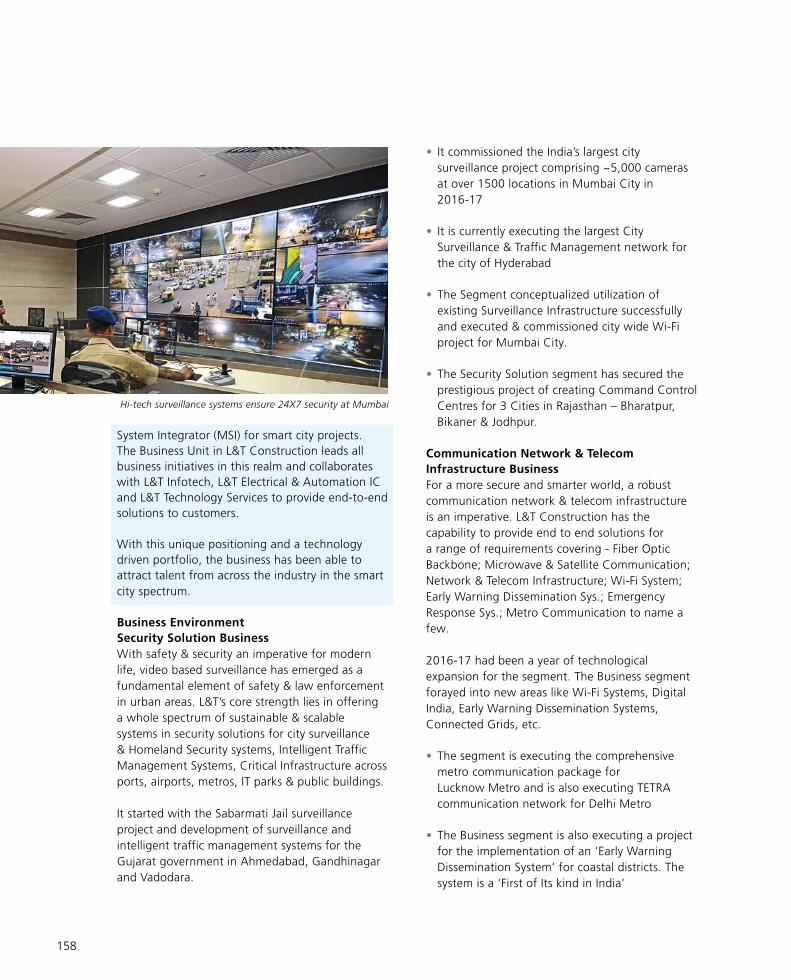
158
System Integrator (MSI) for smart city projects.
The Business Unit in L&T Construction leads all
business initiatives in this realm and collaborates
with L&T Infotech, L&T Electrical & Automation IC
and L&T Technology Services to provide end-to-end
solutions to customers.
With this unique positioning and a technology
driven portfolio, the business has been able to
attract talent from across the industry in the smart
city spectrum.
Business Environment
Security Solution Business
With safety & security an imperative for modern
life, video based surveillance has emerged as a
fundamental element of safety & law enforcement
in urban areas. L&T’s core strength lies in offering
a whole spectrum of sustainable & scalable
systems in security solutions for city surveillance
& Homeland Security systems, Intelligent Traffic
Management Systems, Critical Infrastructure across
ports, airports, metros, IT parks & public buildings.
It started with the Sabarmati Jail surveillance
project and development of surveillance and
intelligent traffic management systems for the
Gujarat government in Ahmedabad, Gandhinagar
and Vadodara.
• It commissioned the India’s largest city
surveillance project comprising ~5,000 cameras
at over 1500 locations in Mumbai City in
2016-17
• It is currently executing the largest City
Surveillance & Traffic Management network for
the city of Hyderabad
• The Segment conceptualized utilization of
existing Surveillance Infrastructure successfully
and executed & commissioned city wide Wi-Fi
project for Mumbai City.
• The Security Solution segment has secured the
prestigious project of creating Command Control
Centres for 3 Cities in Rajasthan – Bharatpur,
Bikaner & Jodhpur.
Communication Network & Telecom
Infrastructure Business
For a more secure and smarter world, a robust
communication network & telecom infrastructure
is an imperative. L&T Construction has the
capability to provide end to end solutions for
a range of requirements covering - Fiber Optic
Backbone; Microwave & Satellite Communication;
Network & Telecom Infrastructure; Wi-Fi System;
Early Warning Dissemination Sys.; Emergency
Response Sys.; Metro Communication to name a
few.
2016-17 had been a year of technological
expansion for the segment. The Business segment
forayed into new areas like Wi-Fi Systems, Digital
India, Early Warning Dissemination Systems,
Connected Grids, etc.
• The segment is executing the comprehensive
metro communication package for
Lucknow Metro and is also executing TETRA
communication network for Delhi Metro
• The Business segment is also executing a project
for the implementation of an ‘Early Warning
Dissemination System’ for coastal districts. The
system is a ‘First of Its kind in India’
Hi-tech surveillance systems ensure 24X7 security at Mumbai

159
• Communication Business aligning with the
vision for a Digital India is executing projects
for creating communication backbone (GPON)
and providing digital connectivity (Wi-Fi) across
various locations of the country
Smart Infrastructure Business
L&T SW&C offers multi-pronged smart solutions
on a turnkey basis that are postmodern & reliable
for a whole spectrum of smart infrastructure which
covers Smart city solutions, Integrated Command
& Control; Smart Communication; Smart Mobility;
Smart Energy; Smart Lighting; Citizen Apps, etc.
The segment has successfully commissioned the
Jaipur Smart City Project – India’s First Smart City.
• In 2016-17 Smart World Communication BU
secured India’s ‘First Integrated Smart City’
project for Nagpur City in Maharashtra. The
project scope involves laying of a citywide
optical fiber network backbone, creating City
Wi-Fi hotspots at key locations, establishing
digital interactive kiosks and developing city
surveillance systems with IP based cameras.
Additionally, the city has identified a strip of
approximately 6 kms to be developed as a ‘Smart
Strip’ with state-of-the-art systems powered with
smart ICT interventions like smart parking, solid
waste management, smart lighting etc.
• The segment also secured a prestigious Smart
City project for Pune under the Smart City
Mission of the Government of India for the
development of Pune as a Smart City. The
Pune Smart Elements Project includes enabling
Wi-Fi at around 200 strategic locations,
establishing Emergency Call Boxes and Public
Address Systems, putting up Environmental
Sensors, Variable Messaging Displays, Network
Connectivity and Video analytics Integration.
The project includes a state-of-the-art Smart
City Operation Centre (SCOC) to integrate all its
services and applications on a single platform.
• The segment also secured an order to
implement Smart City Solutions for the city
of Vishakhapatnam under the Smart City
Mission. The scope of work includes citywide
Surveillance, Variable Message Boards, Public
Address Systems, Wi-Fi Access Points, Data
Centre with Disaster recovery, Command
Control Centre, Collaborative Monitoring and
Facility Management Systems. Apart from these
the Project includes implementation of Smart
Elements such as Solid Waste Management
System, Smart Transport, Smart Poles, Smart
Lighting, Environmental Sensors and Enterprise
Resource Planning.
Outlook
2017-18 looks promising for the SW&C business
given the boost the government has given for safe
and smart cities and other digital initiatives.
The union budget 2017-18 projected allocations
that cover the areas of business being pursued
by SW&C - Digital India - Bharat Net; Smart
City & AMRUT; Homeland Security and Border
Management System; Metro & Railway Surveillance
and Telecommunication; Emergency Response &
Police Modernization, etc.
Security Solution Business
The trigger for the surveillance business, will
essentially come from the initiatives taken by State
Police Departments, State Industrial development
Authorities given that safety of people is a state
subject.
Several of the tier-2 cities are planning tenders for
city surveillance & intelligent traffic management
systems to ensure safety and security of citizens.
With special thrust by Central and State Govt.
for Highway Managements Systems, the segment
envisages traction for Integrated Highway
Management System opportunities in 2017-18 &
2018-19.
Homeland Security is another area of importance
for the Govt. of India. Border Security and
Management Systems are expected to grow and
business is anticipating big opportunities in this

160
space. Other areas such as Airbase and Naval base
security are in the RFI phase.
Communication Network & Telecom
Infrastructure Business
With the Government’s initiatives like Digital India
and thrust towards e-governance, the National
Optical Fiber Network (NOFN), which faced certain
delays in 2016-17, with a mandate from DoT,
will be translating to a large scale opportunity
for development of a robust and nationwide
broadband telecom infrastructure in 2017-18. The
Bharat Net program plans to connect 2.52 lakh
Gram Panchayats of the country with high speed
digital network.
The business made a breakthrough in 2016-17
in the domain of Early Warning Dissemination
Systems for Coastal districts of AP & Odisha.
Other coastal states are also coming up with
similar requirements to issue early alerts in case of
cyclones and other natural calamities.
Metro Communication packages in various cities
project a good market potential. Metro projects
for several cities are already in the pipeline and
with the experience from LMRC & DMRC projects,
the business unit is well positioned to tap these
emerging opportunities.
Smart Infrastructure Business
Under the Central Government’s Smart City
Mission for developing 109 smart cities across
India, 60 cities have already been shortlisted,
several of which are in advanced stages of RFPs
and have received Central Govt. funding. These
cities will be coming up with RFPs shortly and the
balance cities are also likely to follow in 2017-18.
SW&C is well positioned to leverage the diversified
offerings of L&T and collaborate with the State
municipal corporations and governments to create
smart infrastructure based on the experience
gained in Jaipur, Nagpur, Pune and Vizag.

161
Power Business
Natural-gas-fired combined cycle power plant built by L&T at Vemagiri in Andhra Pradesh.
ultra-supercritical/supercritical boilers, turbines,
generators, pulverisers, axial fans, air-preheaters
and electrostatic precipitators. It also has design
and project management centres at Vadodara,
Faridabad and Chennai that ensure international
standards of project management, quality, safety
and on-time delivery.
The business has an organization structure with
focused business units supported by competency-
based capability centres and service functions.
Business Environment:
The Power sector saw sustained momentum
across the power value chain like lower power
deficits, reforms in distribution, capacity
addition and grid augmentation during the
Overview:
Power business is one of the leading EPC players
that provides “design to commission” integrated
solutions in the field of coal and gas-fired power
projects on a Lump sum turnkey basis. The
successful completion of various projects and
continuous additions of capacity has made the
business “a proven and complete solution provider
in the Thermal Power Segment”.
L&T’s Power business has a pan-India presence
with multiple project sites, project management
centres & manufacturing facilities.
The business has a state-of-the-art facility
at Hazira in Gujarat, where it manufactures

162
year. This makes the business optimistic and it
anticipates that there will be around 40 to 50
GW of ultra-supercritical/supercritical ordering in
coal-based projects over the next five years.
During the year, the business bagged 1.98 GW
of Boiler Island order from Neyveli Uttar Pradesh
Power Limited through competitive bidding, while
the main plant orders of 4.6 GW materialised in
2016-17.
The business continued its foray outside India
and was successful in getting export orders worth
over USD 200 million through its joint venture
companies.
Tenders for Flue Gas Desulphurisation (FGD)
and Selective Catalytic Reduction (SCR) business
started floating in the market. The Power business
is hopeful of securing sizable orders in this new
segment.
With increasing competition and shrinking market,
cost optimisation has been the focal point for the
business. It planned various initiatives to achieve
cost leadership and at the same time, continued
its focus on execution excellence and customer
delight by demonstrating high quality and safety
standards.
Business continued to raise its own standards on
‘delivery terms’ to ensure contractual commitments
and customer delight by saving time and money.
Synchronisation of the first unit of Rajasthan Rajya
Vidyut Utpadan Nigam Limited’s (RRVUNL) project
in record time of 42 months and hydro test of the
first unit of Madhya Pradesh Power Generating
Company Limited’s project, three months ahead
of the schedule bore testimony to this. It also
achieved open cycle synchronisation of its two
gas-based power projects in Bangladesh - NWPGCL
360 Bheramara CCPP & BPDB 225 Sikalbaha CCPP.
The awards from CII-EXIM Bank for business
excellence and from FICCI for quality systems
excellence are proof of the business’s belief in
On EPC basis, L&T undertook the 375 MW single-shaft combined cycle power plant project for Gujarat State Electricity Corporation at Dhuvaran in Gujarat.

163
‘total quality organisation’ for sustained business
results. It also received the National Safety Award
for the ongoing Rajasthan Rajya Vidyut Utpadan
Nigam Limited’s project at Chhabra.
The business continued its focus on enhancing
competencies among its employees through Power
Training Institute to further its contribution to the
sector. Recognition of the institute by the Ministry
of Power, Government of India, is a pointer in this
direction.
Significant Initiatives:
The business formulated its business strategy with
three-pronged approach of cost optimisation,
portfolio enhancement and internationalisation.
Progress monitoring, review mechanism,
timeliness, department responsibilities and
accountability have been identified as the key areas
to ensure successful implementation of its strategy.
In its pursuit of portfolio enhancement, the
business signed long-term technology licence
agreements with Chiyoda Corporation for FGD
and with Mitsubishi Hitachi Power Systems for
SCR. The partnership with the world’s technology
leaders has provided an edge over its competitors
in the new job opportunities that are coming up
in the thermal power sector due to new emission
norms notified by the Ministry of Environment,
Forest & Climate Change, Government of India.
On the international front, the business will
continue its focus on South East Asia and Middle
East markets for gas-based power projects. For
coal-based power projects, select opportunities in
neighbouring markets are also being pursued.
The full-fledged office in Dhaka to support
execution of current projects and tap new
opportunities in the Power sector in Bangladesh is
an example of management’s foresightedness to
expand in the territory.
The business reviewed its internal controls and
ensured that the controls which are commensurate
with the size of its operations exist. It also
continued with its risk mitigation initiatives
through risk management practices and regular
reviews.
Outlook:
Looking ahead, the Power sector is expected
to unfold many positive trends in the areas of
generation, transmission & distribution. The impact
of UDAY scheme and 100% rural electrification,
etc. will also be seen in the years to come. Power
sector in the country is set to grow to meet the
increased demand which is likely to be fuelled
by the expected GDP growth of the country.
The business expects a major thrust from the
Government to boost the sector with equal focus
on thermal, nuclear and renewables like solar,
hydro, etc.
Though emergence of alternative sources in the
form of renewables is another challenge for the
business, it is believed that coal will continue to
be the mainstay of the domestic power sector for
providing reliable and robust base load.
Business potential of Flue-gas desulfurization
(FGD) systems to meet the environmental norms
has opened new opportunities and the business is
ready to capitalise on it. The business also sees the
opportunities in ‘replacement market’. Some plants
have aged and are due for retirement. These plants
run at very low PLF, less efficiency level and are
non-complaint to revised emission norms. Due to
these factors, the old plants will be replaced with
the new ultra-supercritical/supercritical technology
which is much more efficient. It is expected that
around 15 GW of ordering will happen in the next
three to four years in the replacement market
alone.
Excess capacity and aggressive pricing will continue
to haunt the EPC players and it would reflect in
the pricing and financials. The gas-based power
plants are not expected to revive in India in the
near future. However, South East Asia continues
to offer good opportunities for gas-based plants.
The business has taken various steps to enter
these markets. The target countries for gas-based
projects are Bangladesh, Sri Lanka, UAE and
Indonesia.

164
As we go further, the impact of GST regime on the
Power sector is another major area which needs to
be analysed and seen.
Major Subsidiary Companies:
L&T-MHPS BOILERS PRIVATE LIMITED (LMB):
LMB is a joint venture incorporated in India
between L&T, having 51% stake and Mitsubishi
Hitachi Power Systems Limited (MHPS) Japan,
having 49% stake, for the engineering, design,
manufacture, erection and commissioning of
ultra-supercritical/supercritical boilers in India. The
manufacturing hub of LMB is at Hazira, Gujarat
while it has established design and engineering
centres at Faridabad and Chennai. The company
can manufacture ultra-supercritical/supercritical
boilers up to a single unit of 1000 MW at its Hazira
complex.
The company received its biggest domestic order
from NUPPL for 3X660MW Ghatampur Thermal
Power Project. It also received its biggest export
order from MHPS for supply of Pressure parts for
2X1000MW Central Java Project in Indonesia. The
Hazira factory recorded the highest production
ever since the start of the operations.
The company also signed Technology and License
agreement with MHPS for Selective Catalytic
Reduction system. This will help the company to
grab market opportunities created post issuance
of strict environment norms in India. The company
further strengthened its position in export market
and received orders over ` 380 crore.
L&T-MHPS TURBINE GENERATORS PRIVATE
LIMITED (LMTG):
LMTG is a joint venture incorporated in India
between L&T and Mitsubishi Hitachi Power
Systems Limited (MHPS), Japan and Mitsubishi
Electric Corp. (MELCO). L&T has a 51% stake in
the joint venture, with MHPS holding 39% and
MELCO holding 10% stake. The company has a
state-of-the-art manufacturing facility at Hazira,
Gujarat for manufacture of STG equipment of
capacity ranging from 500 MW to 1000 MW. The
company is engaged in the engineering, design,
manufacture, erection and commissioning of ultra-
supercritical/supercritical turbines and generators
in India.
The year saw major improvement in the financials
of the company on the back of good orders
on hand. The factory utilization also improved
substantially during the year. Exports continue to
be the major thrust area for the company with
global customers responding to the company’s
high-quality standards & competitiveness. The
Company has aimed to add Repairs & Services and
Spares business to its existing revenue streams to
enhance its business portfolio and at the same
time improve its factory utilization & financials.
L&T-SARGENT & LUNDY LIMITED (LTSL):
LTSL is a joint venture between L&T and Sargent
& Lundy LLC, USA (S&L), a global Consulting firm
in Power industry. L&T’s stake is just over 50% in
the joint venture. LTSL’s main Design Centres are
located in Vadodara & Faridabad.
LTSL offers complete Power Plant Engineering
& Consultancy services - from concept to
commissioning. Besides having considerable
expertise in gas based and sub-critical coal based
power projects, the company is also involved in
engineering of ultra-supercritical/supercritical coal
based projects and forms the engineering base
for L&T’s focus on turnkey execution of ultra-
supercritical/supercritical technology.
Supercritical boiler manufactured at L&T’s state-of-the-art manufacturing facilities at Hazira.

165
The company continues to focus on major EPC
Players from Turkey, Korea, SE Asia etc., for
future business opportunities. The company was
successful in having a breakthrough in Qatar
during the year. The company was also successful
in bagging three orders from Nationalised Banks
& PSU agencies for offering project management
consultancy (PMC) services to lenders for stressed
power projects. The company also received various
other domestic and overseas orders during the
year.
The company continued its high business standards
which is demonstrated by engineering of around
24000 MW of generation capacity of gas-turbine
based power plants and around 22000 MW of
generation capacity of coal-based power plants,
across the globe.
L&T HOWDEN PRIVATE LIMITED (LTH):
LTH is a joint venture between L&T and Howden
Group, UK. L&T has 50.1% stake in the joint
venture. The company supplies high end fans
and air pre-heaters for thermal power plants.
The company has a state-of-the-art facility for
manufacture of fans and air pre-heaters at Hazira,
Gujarat along with a fan testing facility. It also has
a design and engineering centre at Faridabad.
The company is optimistic about receiving the
orders through LMB and other Boiler OEMs.
On execution front, the company focused on
streamlining of engineering, it also focused on the
process improvements and capacity improvement.
The company achieved full load of its APH basket
production line and fan testing facility during the
year.
The recent environmental rules requiring FGDs
will further boost demand for the company’s axial
fans. Further, the company has aimed to improve
its project delivery and optimise the cost through
various initiatives to make itself more competitive.
Fabrication of a turbine for a power plant.

166
Heavy Engineering Business
Eight ARDS reactors, ready for despatch to the Refinery and Petrochemical Integrated Development (RAPID) Project of Petronas, Malaysia.
1) Process Plant Equipment and Nuclear
(PP&N) SBG is involved in manufacture
of large complex equipment such as
hydro-processing reactors & high pressure
heat exchangers for process plants and
equipment for the nuclear power sector.
Heavy manufacturing is undertaken at work
centres located in Mumbai, Hazira and Sohar
in Oman. Precision fabrication in stainless
steel and titanium on process plant side
is handled from Vadodara manufacturing
facility. Fabrication of critical piping spools
for applications in the power, refinery,
petrochemical, fertilizer and chemical sectors
is done in a separate unit located at Hazira.
During the year, PP&N SBG underwent
significant organisational changes to
Overview:
The Heavy Engineering (HE) business designs,
fabricates and integrates custom designed,
engineered critical equipment & systems to
core sector industries like Fertiliser, Refinery,
Petrochemical, Chemical, Oil & Gas, Thermal
& Nuclear Power, Aerospace and for Defence
applications. The business has a track record of
executing large size and complex projects with
capabilities, that include in-house engineering,
equipped fabrication facilities, R&D centres, an
experienced project team and safe work culture.
The Heavy Engineering business is structured into
two Strategic Business Groups (SBGs):
• Process Plant Equipment and Nuclear
• Defence and Aerospace

167
K9 VAJRA-T, a 155mm/ 52 Cal Tracked Self Propelled (SP) Gun, being built in collaboration with Hanwha Techwin.
strengthen the marketing and execution
teams. It also focussed on cost control and
zero defect manufacturing, identified core
and non-core products and consolidated its
operations at Hazira.
2) Defence and Aerospace (D&A) SBG,
having evolved from technology and
product development to serial production
of equipment and systems to platforms has
resulted in the emergence of L&T as India’s
largest private sector company in the Indian
defence sector. L&T is today engaged in
design-to-delivery of solutions across its
chosen defence segments. For over three
decades, L&T has focussed on building
indigenous products and technologies
with Defence Research and Development
Organisation, India (DRDO), as well as with its
in-house research and development.
D&A SBG has developed and produces naval
platforms, artillery systems, air-defence
systems, land and naval weapon systems,
fire-control systems, naval equipment and
systems, engineering systems for land and
marine forces, military bridging systems,
communication systems, missile sub-systems
and rocket motors for space-launch vehicles.
L&T is committed to “Make in India”, and
has invested in multiple work centres across
the country dedicated for defence business,
including assembly & integration facility
at Talegaon near Pune, missile sub-system
manufacturing facility at Coimbatore and
defence electronics facility at Bengaluru.
Besides these dedicated facilities, specific
work-centres are set-up at Hazira for the
strategic program, Ranoli for advanced
composites, at Powai (Mumbai) for
prototype development & testing and a site
at Vishakhapatnam operated under GOCO
model for a strategic program.
L&T continues to develop indigenous
products, systems and solutions for the
‘Indigenously Designed, Developed and
Manufactured’ (IDDM), ‘Make’ and ‘Buy
and Make Indian’ category of programs
under the Defence Procurement Policy.
It shall continue to invest in its Product &
Technology Development Centre at Powai
and Bengaluru.
Business Environment:
During the year 2016-17, in the Process Plant
and Nuclear space, the oil prices continued to
be in the range of 40-60 $/bbl resulting in lower
revenues and profits for oil companies. This led
to deferment of many investment decisions as
well as cancellation / suspension of many projects
announced earlier. Delay in procurement in the
domestic sector also impacted order inflow in
the nuclear business. Surplus capacities and
limited demand has resulted in aggressive
competition and has put extensive pressure
on pricing and deliveries. Protectionist policies
and export credit agency (ECA) financing has
further limited the opportunities. PP&N SBG
has focused on operational excellence to deal
with the challenging market scenario and regain
competitiveness.
Some of the major orders executed in 2016-17
were ARDS Reactors and FCC Reactor Regenerator

168
Package for RAPID in Malaysia, K-COT Converter
Unit for Lotte Chemicals in Malaysia, Heat
Exchanger package for KNPC in Kuwait, Synthesis
Loop Waste Heat Boilers for IFFCO in India,
Steam Generators for NPCIL in India, and high
pressure piping for Greensville Power Project
at Virginia in USA. The SBG also booked orders
from international power sector players - GE and
Mitsubishi Hitachi Power systems for supercritical
thermal power projects.
In case of the D&A SBG, the Government of
India (GOI) brought about major changes and
improvements in policies in the defence sector.
These were in consonance with the ‘Make in
India’ and the ‘Ease of doing business’ agenda
of the GOI. A marked shift towards indigenous
procurement is evident from the clearances
granted (82% by share and greater than ` 3.2
lakh crore by value) by the Defence Acquisition
Council in the past two and a half years for Indian
companies to participate as prime bidders. The
overall policy framework is being modified to
offer a level playing field for the Indian private
sector and the defence public sector undertakings.
GOI has also advised a target of USD 2 billion for
defence exports. Defence exports are a part of
India’s foreign diplomacy initiative, particularly
in the South East Asian region. GOI may grant
military aid / export credit financing to promote
such exports.
The GOI has received recommendations from
series of Committees with respect to the selection
/ short listing of private sector entities as Strategic
partners (SP). SPs shall be entities with track
record and industrial capabilities and each shall be
identified for manufacture of large and complex
defence platforms in an identified domain. This
shall permit long term investment by the private
sector and accelerate the acquisition process. L&T
through its D&A SBG has been a long term player
in the defence segment in India with a wide range
of technologies, products, systems and complex
defence platforms.
In the Aerospace segment, Indian Space Research
Organization (ISRO) plans to involve private sector
as well as public sector firms for industrialising
production of Polar Satellite Launch Vehicles
Launch of India’s PSLV from SDSC SHAR. Over the last 40 years, L&T has built critical subsystems for all of ISRO’s space launch missions.

169
(PSLV), and to this effect, a framework is under
discussion.
Significant Initiatives:
In order to maintain leadership position in
the Process Plant & Defence sectors, focussed
team initiatives have been undertaken under
Organizational Excellence initiatives.
The businesses have drawn up their Strategic
Plan with sharp focus up to 2021, and profitable
growth is the aspiration. It continues to invest
in intra-organisational excellence initiatives
like Six Sigma, Total Productive Maintenance,
Workplace Management Systems and Knowledge
Management to ensure superior quality products
and services. People-centric initiatives, competency
build-up, talent and leadership development
remain vital to the growth strategies of the
business.
Sustainability and CSR initiatives have been
undertaken by the Sustainability and CSR team
of Heavy Engineering business with significant
contribution by the employees and guidance from
the central co-ordination teams. These include
community development, skill development
initiatives, volunteering by L&T employees
for community welfare programs, community
infrastructure development, contribution to
educational infrastructure, health camps,
monitoring water and electricity consumption
and greenhouse gas emission etc. Health, Safety
& Environment policies and programmes help
increase awareness amongst employees, the
community and our stakeholders.
Outlook:
The business outlook for Process Plant sector
looks optimistic with major investments in South
East Asia, MENA and domestic market. Nuclear
Power Corporation of India Limited’s (NPCIL) bulk
procurement program shall be major opportunity
during the year.
In view of increase in global demand, Investments
are expected in five to six refineries all over the
world. Major opportunities include - Takreer in
Abu Dhabi, BAPCO in Bahrain, DUQM in Oman,
KNPC in Kuwait, Pertamina in Indonesia, Thai Oil
in Thailand, CPC in Taiwan, and Dung Quat in
Vietnam. Investments are also seen in the domestic
sector by IOCL, HPCL, HMEL, and BPCL for capacity
enhancement and BS-VI up gradation to comply
with the applicable fuel standards. The low oil
price has attracted investments in other value
added products in the petrochemical sector. Major
projects include – PTTGC - USA, SABIC - Saudi
Arabia, Hengli- China and GCGV-USA.
In Fertilizer sector, major opportunities include
revival of sick FCI and HFCL units, energy saving
and capacity enhancement projects driven by New
Urea Policy 2015 (NUP 2015).
In Thermal Power sector, potential exists in
domestic projects at Ghatampur, Obra and
Jawaharpur in Uttar Pradesh. Across the globe,
some major opportunities are expected from the
upcoming Combined Cycle Power Plants and
Supercritical Plants especially in South East Asia
and Middle East regions.
In Nuclear sector, the GOI has approved annual
budget allocation of ` 3000 crore for expansion of
Indigenous Programme viz. Kudankulam 5&6 and
End shields for a nuclear power plant being fabricated at L&T’s Hazira facility.

170
PHWR projects. On foreign technology LWR project
opportunities will be in the year 2018-19.
For the D&A SBG, the simplified DPP 2016
came into effect from April 1, 2016. Defence
procurement is expected to gain traction and
programmes worth approximately ` 2 lakh crore
for Indian industry are expected to get converted
into orders over coming two years. The preference
for indigenously designed and developed products
will result in opportunities in newer domains.
Over the medium-term, significant opportunities
are envisaged in programmes for new-build naval
(surface as well as underwater) platforms, refit of
conventional submarines, artillery and air defence
guns, close-in weapons systems, military bridging
systems, missile programmes (repeat orders) and
sub-systems for space launch vehicles. L&T is
prepared for a proactive role in ensuring self-
reliance of our nation through a successful ‘Make
in India’ initiative.
Major Subsidiary Companies
L&T SPECIAL STEELS AND HEAVY FORGINGS
PRIVATE LIMITED (LTSSHF):
L&T Special Steels and Heavy Forgings Private
Limited (LTSSHF) is a joint venture (JV) between
Larsen & Toubro Limited (L&T) and Nuclear Power
Corporation of India Limited (NCPIL), with L&T &
NPCIL holding 74% and 26% stakes respectively.
The JV has set up a fully integrated forging
facility (from steel scrap to finished forgings of
alloy steels, carbon steel & stainless steels) with a
capacity to produce a single piece ingot upto 300
MT and forgings up to 120 MT in the first phase.
These have applications in critical equipment in
nuclear power and hydrocarbon industry, for
rotors in power industry, blocks for oil & gas
segment and for other heavy forgings for general
engineering applications.
Business Scenario
The demand for heavy forgings is dependent on
the outlook of the industry segments comprising
refineries, petrochemicals, thermal and nuclear
power, hydro power and other industries like steel.
The JV has been witnessing fierce competition
from global established players having excess
capacities. The domestic sectors in the fields
of nuclear and defence are expected to grow
in coming years. ‘Make in India’ campaign is
also likely to have positive impact on domestic
manufacturing sector.
The JV has been successful in getting approvals
and qualifications from many key customers. The
Company has been successful in manufacturing of
high quality Stainless Steel grade forgings required
for International Thermonuclear Experimental
Reactor (ITER) and all critical forgings for 700 MW
domestic nuclear power program. The JV is also
developing special grade steels and forgings for
domestic defence strategic programs.
The JV has been manufacturing heavy forgings
for refineries, petrochemical and fertilizer plants.
The Company has successfully supplied Blow out
Preventers (BOP) and forged blocks required for oil
& gas segment
The JV is focusing on stabilizing the production
processes and improving manufacturing
efficiencies so as to remain competitive in the
market. A series of initiatives have been taken
in the areas of cost control and improving
process efficiencies. The Company has embarked
on establishment of Quality Systems in the
new facility, complying with ISO 9001. The Dished ends forged at L&T’s forging facility at Hazira, Gujarat.

171
Company has been accredited by NABL
certification for laboratories.
The strategic focus of the Company remains to
fill the technological and manufacturing gap in
the country for critical heavy forgings for nuclear,
strategic, defence and other engineering sectors.
The Company has demonstrated its capability
to manufacture critical forgings for the Indian
Pressurized Heavy Water Reactor (PHWR) plants.
It has also taken up the development of critical
forgings for the next generation IPWR - nuclear
plants. Discussions are on with foreign technology
partners for possible development of forgings to
meet their specifications for future Indian nuclear
installations.
SPECTRUM INFOTECH PRIVATE LIMITED (SIPL):
SIPL is a wholly owned subsidiary of Larsen &
Toubro Limited. SIPL concentrates largely on
product development in embedded solutions,
sensors, control and signal processing and
undertakes technology development and
manufacture of avionics LRUs for military
applications. SIPL is certified by Centre for Military
Airworthiness and Certification (CEMILAC) of the
Ministry of Defence, India for the same. SIPL has
obtained AS9100 Rev C, ISO 9001 and IS0 27001
certifications.
The company continues to work with the Ministry
of Defence and Hindustan Aeronautics Limited
and its parent Larsen & Toubro Limited to jointly
develop new products and enhance market
presence. The Company is taking steps towards
integration of its businesses with Larsen & Toubro
Limited to drive growth and cost optimisation.
LARSEN & TOUBRO HEAVY ENGINEERING LLC:
Larsen & Toubro Heavy Engineering LLC is
a Joint Venture with Zubair Corporation,
established in Sohar, Sultanate of Oman. L&T,
through its wholly owned subsidiary Larsen
and Toubro International FZE, holds 70% in the
Company. The Heavy Engineering facility was
commissioned in October 2009. The Company
focuses on customers and projects in the
Middle East and supplements the manufacturing
and fabrication facilities of Process Plant
& Nuclear SBG in India. The Company has
been impacted by thinning customer project
margins due to intense competition, increase
in costs due to local regulations. The Company
has undertaken significant cost control and
right-sizing decisions in the wake of the aforesaid.
In addition to its direct outreach to customers in
the Middle East region, it also proposes to align
with other businesses/ subsidiaries of L&T Group in
the future.
L&T made a critical contribution to India’s first nuclear-powered submarine
Visual for representational purposes only

172
Electrical & Automation Business
L&T offers India’s widest range of switchgear to a variety of sectors – agricultural, industrial, building and commercial. For over six decades, L&T has been an industry leader in power distribution systems.
manufacturing. E&A runs six Switchgear Training
Centres across the country that impart training
and learning on good electrical practices to
engineers, consultants, contractors, technicians
and electricians.
Currently, E&A has manufacturing facilities at
Navi Mumbai (Mahape & Rabale), Ahmednagar,
Vadodara, Coimbatore and Mysuru in India as
well as in Saudi Arabia, Jebel Ali (UAE), Kuwait,
Malaysia, Indonesia, and the UK.
The constituents of E&A business are two
Strategic Business Groups (SBGs) and designated
subsidiaries. In India, both the SBGs have under
them two Business Units (BUs) each. The Products
SBG includes Electrical Standard Products (ESP) and
Overview
The Electrical & Automation (E&A) business of
Larsen & Toubro Limited offers a wide range of
products and solutions for electricity distribution
and control in industries, utilities, infrastructure,
buildings and agriculture sectors. Its basket of
offerings includes Low and Medium Voltage
Switchgear components, Electrical Systems,
Marine Switchgear systems, Industrial & Building
Automation Solutions, Surveillance Systems,
Energy Meters and Protection Relays.
The business is supported by its five decades of
experience in in-house design & development
that facilitates the introduction of contemporary
products and a high precision tool manufacturing
facility which is a pre-requisite for high quality

173
Metering & Protection System (MPS) business units
while Projects SBG comprises Electrical Systems &
Equipment (ESE) and Control & Automation (C&A)
business units respectively.
Business Environment
Global economic growth rate is projected at
3.6 percent in 2017 compared to 3.4 percent in
2016. The pickup in global activity is projected to
be more gradual especially in emerging markets
and developing economies. The slowdown and
rebalancing of the Chinese economy, upward
movement in commodity prices, and strains in
some large emerging market economies will
continue to weigh on growth and profitability
prospects in 2017-18. Other factors such as lower
prices for energy, and the gradual tightening of
monetary conditions in the United States and
concerns of European market post Brexit still
continue to cause uncertainty. Financial markets
have been adversely impacted and global trade
has contracted. Amidst these global headwinds,
the Indian economy has held its ground firmly.
The Indian GDP has grown at a robust 7.1%.
Manufacturing sector did better than expected.
Due to a good harvest and good rainfall after
two years of drought, there is likely to be an
improvement in rural demand which will translate
into opportunities for the switchgear business.
The LV Switchgear market is expected to grow
between 8 to 10 percent and is expected to reach
` 7600 crore in 2020. Various Govt. reforms have
been initiated such as Make in India, Smart Cities,
increased infrastructure spending, etc. to boost the
economy. New Initiatives like Dindayal Upadhyaya
Gram Jyoti Yojana, UDAY, Smart Cities, Smart
Grid, Pradhan Mantri Krishi Sinchayee Yojana &
increased focus on renewable energy taken by the
government, show a promising future. But these
initiatives will take time to get to ground and
start generating business. These initiatives will see
incremental revenue for coming 5 years.
Rising investment in alternative source of energy is
expected to contribute to the growth of Medium
Voltage and Low Voltage switchgear used for
switching and general protection. Moreover,
this application area will also trigger demand for
Miniature circuit breaker (MCB) and Molded case
Circuit breaker (MCCB).
Telecom sector looks promising with grand
scale launch of Reliance Jio, which has added
competition in consumer market place. Further,
this sector is witnessing consolidation. We received
good share of business from Reliance Jio in
2016-17 and continue to expect similar business
opportunities.
Huge Infrastructure opportunities are seen
in ASEAN region, especially in Indonesia and
Thailand. Also, there are opportunities in
Infrastructure segment in Qatar, Kingdom of Saudi
Arabia and UAE particularly in Metros, Airports &
Hospitals in the wake of FIFA 2022 (Qatar) & EXPO
2020 (UAE).
Significant Initiatives:
The business continued to devote its resources
and capabilities to research and development
endeavours, which is one of its core strengths. Its
in-house design & development capabilities are
rated among the best in the industry. The facilities
at Powai-Mumbai, Ahmednagar, Mysuru, Mahape
and Coimbatore are approved by the Department
of Scientific & Industrial Research, Ministry of
Science & Technology. These centres network with
international labs, testing centres and academic
institutions to keep abreast of new technology
trends and introduce them to customers in
different segments.
Range of Digital Panel Meters

174
During the year, E&A business filed as many as
101 Patents, 3 Trademarks, 4 Design applications
in India, along with 2 foreign patent applications
(both in Malaysia) and 18 foreign trade mark
applications (6 trademarks each applied for
registration in Indonesia, Vietnam and Malaysia).
This was the 10th consecutive year of filing more
than 100 patent applications. The business has
received grants for 50 patent applications (46 in
India, 1 in USA, 1 in Australia & 2 in European
Patent office)
In 2016-17, focused R&D activities have enabled
ESP to have a healthy New Product Intensity (NPI)
index of >25%-an index which measures the sales
of products introduced in the market in last five
years to the total sales in the financial year.
In 2016-17, various new products and variants
were introduced in the areas of power distribution
and motor control. Some of the notable additions
are AU range of final distribution products,
Sub-main Distribution boards, new ratings in
Omega range of Air Circuit Breakers and Busbar
Trunking systems. New versions in submersible
pump controllers for the agriculture market and
DC contactors in telecom applications were also
launched. Comprehensive product portfolio to
provide solution for Power Quality Management
was launched. SMARTComm solution is now
available to its customers.
The Metering & Protection Systems (MPS) business
unit is engaged in the design, development and
manufacture of electricity meters, protective
relays and metering solutions. The product range
includes Meters for every segment of consumers
as well as for inter and intra utility electricity
exchange – residential, commercial, industrial and
feeder meters.
In 2016-17, the business unit has focussed on
the introduction and deployment of meters and
solutions for new segments which include Prepaid
Switchboard installation at a power plant. L&T provides power distribution and control solutions across the value chain, from generation to end user.

175
Metering, Automated Remote Meter Reading
and Smart Metering. These solutions will enable
L&T to participate in the upcoming Smart Grid
and Smart City initiatives of the Government of
India. The Smart Metering solutions are aimed at
helping Electricity Utilities improve their efficiency
by reducing aggregate technical and commercial
losses through prepaid collection of money, meter
reading free from human intervention, on-line
alarms and alerts for failure/theft of energy,
remote disconnection on non-payment of dues,
etc. The range also includes bi-directional meters
which are capable of recording energy generated
through renewable resources like Solar and Wind.
In addition, MPS has also worked on improving
cost efficiencies through the introduction of new
cost-effective platforms for the core conventional
meters.
The technology and design of these meters and
solutions is totally in-house with a high focus
on quality and reliability and compliance to
specifications and standards.
In 2016-17, the Electrical Systems & Equipment
(“ESE”) business unit put in a lot of effort to
introduce new product and technology absorption
for better penetration not only in domestic market
but also in international domain. ESE has increased
its Low Voltage product portfolio by introducing
ODU (Outdoor Unit) & Feeder pillars which are
widely used in infrastructure segment. ESE has
also introduced the most compact variant in GIS
(Gas Insulated Switchgear) Family. This variant will
give ESE an edge to set a new foot print in Wind
energy segment. In the coming year 2017-18,
ESE Research and Development team is working
to introduce its FRTU (Front remote terminal unit)
RMU & 11kV GIS (Gas Insulated Switchgear) for
strengthening its infrastructure & utility portfolio.
2016-17 marked as an important year for Control
and Automation (C&A) business with introduction
to new technology. During the year, Control and
Automation made an entry into Solar business
with help of a tie up with an Italian Company
for L&T branded Solar inverter completing the
portfolio for solar solution. C&A also made a
strategic alignment with IOmniscient (an Australian
company) for its video analytics specialty. During
the year, C&A also embarked on a journey to
launch its own manufactured MV drives which is
expected to be introduced in market by end of
2017-18 and completing C&A’s LV & MV drive
range. These initiatives have resulted into both,
and intangible benefits, like cost reduction, saving
of foreign exchange, expanded product range and
expansion in offerings to the infrastructure sector.
Business Outlook
Even with the new reforms initiated by the
government, the core sectors continue to show no
signs of pickup. However, launch of Schemes like
DDUGJY and IPDS give hope to see a movement
toward premium products like AMR, Prepaid &
Smart Meters in the coming years. Also scheme
UDAY is expected to improve health of DISCOMS
which will lead to higher investment by the
utilities.
Overall market will remain competitive as liquidity
with major customers continues to be a case of
worry. The business witnessed a financial crunch at
major industrial houses due to which new plants/
expansion are not being announced. Overall
industrial sector shows a muted trend. However,
the business sees an upward trend in infrastructure
sector (Metro, Airports, Railways, etc.) and its
efforts in launching products for infrastructure
sector are expected to yield results in 2017-18.
The margins in infrastructure sector, however, are
negligible due to competition from local players.
The business also sees an improvement in demand
from Agro / food processing industries during the
year 2017-18. The Marine business sees a positive
sentiment through ‘Make in India’ initiative
taken by the government which emphasizes on
indigenous content giving it an edge over foreign
suppliers. Also Indian Navy has reckoned L&T as a
strategic partner resulting in thrust on setting up
Life Cycle Support facilities in the Navi Mumbai
factory.
With continuous low oil prices, some projects
have been deferred but going forward, market is

176
showing signs of improvement and is expected
to show growth with projects picking up speed
of execution. Social infrastructure projects like
hospitals and metros are expected to continue
as planned and new high end infrastructure
projects are being announced in Dubai market
for Expo 2020 and Qatar Market for FIFA 2022.
Our dedicated focus on GCC metro projects is
expected to yield result in 2017-18. Also, unrest in
Middle East and Africa region is shifting respective
government priorities toward defence related
initiatives. South East Asia market looks attractive
as major investments are seen in building sector
for Indonesia and power sector in Bangladesh.
TAMCO GROUP OF COMPANIES:
TAMCO is the leading manufacturer of Low
and Medium Voltage switchgear in South East
Asia with manufacturing facilities in Malaysia
and Indonesia. Its products are widely used in
power, oil & gas, construction and manufacturing
industries. Through extensive R&D and advanced
manufacturing technology, the TAMCO group is
able to deliver high quality, safe, reliable and cost
effective products. TAMCO’s strength has been its
flexibility to develop and adapt products to meet
customers need and therefore has a high reference
list across the globe. TAMCO celebrated 50 years
of operations this year.
The business environment in 2016-17 continued
to be challenging as low crude oil prices negatively
impacted Tamco’s main export market, the Middle
East. There were lesser opportunities which led to
price war between competitors and brought down
the market prices of our products. In addition to
that, a setback in its type test for Kahramaa, Qatar,
affected all Utility and private market prospects
in Qatar and also led to cancellation of over
` 300 crore of order backlog. Even the domestic
Malaysian market was adversely affected by oil
prices and political turmoil, leading to delays
in projects and new investments. However, the
depreciation of the local currency (Ringgit) helped
it maintain its profitability in export jobs, despite
drop in prices.
The positives for the year were approval of its Gas
Insulated Switchgear, GV3N in UK Utilities and
approval in KNPC, Kuwait. TAMCO concluded
an agreement with Fullpower, UAE to buy kits
from it to build Gas insulated switchgears in
Iran. Despite delays in new projects in Malaysia,
TAMCO managed to secure a large share in Utility
tenders and retained its market share in this
market. TAMCO was also awarded the Frost &
Sullivan award for “MV Switchgear manufacturer
of the year” for the second year in row. Malaysian
economy is likely to grow in infrastructure with
many projects planned for the upcoming year.
L&T ELECTRICAL & AUTOMATION FZE
(LTEAFZE):
L&T Electrical & Automation FZE (LTEAFZE) is
a 100% subsidiary of L&T International FZE
based in UAE. The company provides Systems
Integration solutions in the Oil & Gas, Power,
Water and Waste Water and Infrastructure
space like Airports, Hospitals, Stadiums and
Transportation segment like Metro and Rail. The
solutions are centered around Process Automation
and Telecommunication applications catering to
customers / contractors in the Middle East, Africa,
CIS and Turkey markets. It has a state-of- the-art
integration facility in Jebel Ali Free Zone and is
accredited with ISO 9001, 18001, 27001 and TUV
for functional safety. Mumbai International Airport’s Network Operations Centre
– powered by L&T’s Control and Automation solutions

177
With decline in oil revenues leading to shortfalls
in budgeted incomes for all oil economies in the
region compounded with heightened security
concerns due to increased political disturbance in
the region, there is a general slowdown in pace
of O&G project investment. Nevertheless, O&G
investments continued in Kuwait and Oman,
while Qatar and KSA governments primarily are
committed to improving their infrastructure.
Airport, Metro / Railway, Hospital related
investment continued to gain importance.
With increasing number of System Integration
companies in the market, the markets have
become extremely competitive. As a result,
LTEAFZE saw drop in Process Automation
project opportunities from the O&G and Utility
industries. However, it saw considerable scope
for Infrastructure Automation with Building
Management System along with Extra Low
Voltage (ELV), Electronic Security (ESS) and
Telecommunication (TCom) Systems. The
Automation Product OEMs continue to lobby with
end clients / consultants for restricting competition
to limited participants through direct OEM bidder
nomination.
Despite stiff competition, LTEAFZE won a major
order worth ` 500 crore from Qatar Rail Company
(QRail) for Phase 1 of Doha Metro for a network-
wide Building Automation & Control System.
This project will build a significant reference
for its business and open doors for many such
opportunities in the future.
Healthcare, Transport, Power Generation and
key event driven development viz. FIFA 2022 in
Qatar and EXPO 2020 in Dubai would continue
to generate business opportunities through
2017-18. While some countries show some
investment slowdown in energy and infrastructure
sector, Oman, Qatar and Kuwait continue to
move forward with earlier announced projects
finalized earlier, which will give opportunities
to LTEAFZE in 2017-18. Projects focused on any
process improvement, Security, Surveillance and
/ or Environment friendly practices will generally
continue to get implemented across industries.
LTEAFZE is fast aligning with the new A&T arena
with delivery capability as Main Automation or
Telecom Contractor, and is poised to leap forward
into the next league.
L&T ELECTRICALS AND AUTOMATION SAUDI
ARABIA COMPANY LIMITED, LLC (LTEASA):
L&T Electrical & Automation Saudi Arabia
Company Limited was established in 2006
as Limited Liability Company, where, 75% of
shares are held by Larsen & Toubro International
FZE and 25% by TAMCO Switchgear Malaysia
Sdn. Bhd. It manufactures LV/MV switchgear/
control gear panels of all sorts and undertakes
installation and commissioning of these products
along with associated products viz., PLCs, Drives,
Transformers, Cables, etc., to offer a one window
solution to customers. The company has been
approved by almost all major end users in the
Kingdom e.g., SABIC and Saudi Aramco.
During the year 2016-17, LTEASA saw lower order
inflow in view of deferment and cancellation of
projects which led to drying up of the order book
and lower sales, leading to a negative bottom
line. While it is expected that stable oil prices may
lead to revival of critical projects in KSA mainly in
Oil and Power, the economy is expected to grow
slowly. LTEASA received order from Alstom A/c
Riyadh Metro for MV and LV equipment, and going
forward, it expects many opportunities in Metros,
Airports and Port projects. Introduction of VAT will
impact buying decision and will have a favorable
impact on local manufacturing.
The fiscal year 2017-18 will be a challenging
year for LTEASA. The key focus areas for LTEASA
during the year would be getting LV and MV
approvals from SEC, Aramco and other consultants
in KSA, providing better reach in Saudi market.
As major growth opportunities will be generated
from non-oil segments, the key focus area would
be the infrastructure sector, especially Mega
Metro and airport projects. Due to availability of
product range now, LTEASA feels confident about
addressing requirements in these segments.

178
HENIKWON CORPORATION SDN BHD,
MALAYSIA:
Established in 1982, Henikwon Corporation is
a leading manufacturer of Low Voltage (LV) &
Medium Voltage (MV) bus duct systems. The
Henikwon acquisition brought strong customer
base of large corporations to E&A’s business and
complements its portfolio to make comprehensive
offerings for the building, industry and
infrastructure segment projects across regions.
It further enhances L&T’s presence in South East
Asia, India and Middle East markets. Henikwon
offers high quality products that comply with
international quality standards. The 12,300 sq.mt.
manufacturing unit is located in Selangor state of
Malaysia.
Business environment in 2016-17 was not
favourable and Henikwon lost orders, mostly
on account of cost. With material content
being more than 70% in its products, it will be
crucial to maximize penetration in new smart
& cost competitive ‘S-line’ range in 2017-18.
Significant opportunities are seen in buildings
& infrastructure segment in regions relevant to
its operations. Henikwon is closely collaborating
with key stake holders in some of the major
infrastructure and metro projects coming up across
multiple locations e.g., KSA, Qatar, Malaysia,
India etc. Manufacturing of the product range in
India has commenced which is likely to increase
competitiveness.
SERVOWATCH SYSTEMS LTD, UK
Servowatch is a marine automation company
based in Maldon Essex UK. Acquired by
L&T in April 2012, it currently has 43 personnel
working within the business. Servowatch is
recognized as a world’s leading system integrator
for Modern naval platforms, Super Yacht
installations and Commercial marine operators.
Unique software design allows integration of third
party software into a common operator platform
environment. “Task Orientation” for specific user
profiles with portability from station to station
creates a highly redundant multifunctional
operating environment. Typical applications include
machinery, navigation, radar, electronic charting,
internal and external communications, tactical
sensors, auxiliary ship systems, camera networks,
mission logging and playback functionality.
The highly trained and professional teams at
Servowatch are able to offer an extensive range of
services.
Servowatch partners with leading manufacturers
of hardware and software to allow flexibility in
meeting project requirements, and providing full
through life product support capability.
During the year 2016-17, Servowatch successfully
completed MARS Project (Tankers for Re-fuelling
UK Royal Navy built by DSME in South Korea) using
the new software Winmon 9. The project includes
total of 4 vessels out of which 1st vessel sailed for
sea trials. This will be a significant reference for
large naval vessel systems and open doors to other
markets. With approval & successful sailing of the
Royal Navy Ship, orders are also expected from
New Zealand & Thai navy.
KANA CONTROLS GEN. TRADE AND CONT. CO.,
KUWAIT
LTEAFZE acquired the Kuwait-based Kana
Controls General Control & Trading Company in
September 2013. Kana Controls, established in
1990, offers systems solutions in Automation &
telecom. Kana Controls is approved with most
customers in Kuwait and provides a good platform
to serve the control and automation business
opportunities in Kuwait. Also with increased focus
on implementations of security and surveillance
solutions by in-kingdom companies, Kana Controls
is better placed for such jobs in Kuwait.

179
Hydrocarbon Business
One of many mega-offshore projects executed by L&T’s hydrocarbon business. Picture shows captive heavy-lift-cum-pipelay vessel LTS 3000 in the background.
world-class modular fabrication facilities as well
as onshore construction and offshore installation
capabilities. The business has repeatedly delivered,
large, critical and complex projects, globally, by
virtue of its customer focus & responsiveness,
experienced & highly skilled human resources,
world-class Quality & HSE practices and culture
of excellence. The principles of the Company’s
business philosophy are striving for excellence in
corporate governance, HSE & quality standards,
extensive IT enablement & state-of-the-art IT
security practices, on-time delivery and cost
competitiveness.
Major facilities in India include Engineering
& Project Management Centres at Mumbai,
Vadodara, Chennai and Bengaluru and Fabrication
Overview:
The Hydrocarbon business provides integrated
‘design to build’ turnkey solutions for the global
Oil & Gas Industry including oil & gas extraction
and processing, petroleum refining, chemicals &
petrochemicals, fertiliser sectors and cross country
pipelines and terminals. The in-house capabilities
enable it to deliver complete end-to-end
solutions from front-end design through detailed
engineering, procurement, fabrication, project
management, construction and installation up to
commissioning services. The Hydrocarbon business
is primarily housed in a wholly owned subsidiary,
L&T Hydrocarbon Engineering Limited (LTHE).
The business has a fully integrated capability chain
including in-house engineering and R&D centres,

180
Yards at Hazira (near Surat) and Kattupalli (near
Chennai),whereas, overseas presence is primarily
in the Middle East in UAE (Sharjah), Saudi Arabia
(Al-Khobar), Kuwait and Oman (Muscat). The
business also has a major Modular Fabrication
Facility at Sohar in Oman held through a
subsidiary.
The business caters to clients across the
hydrocarbon value chain through its following
business verticals:
• Hydrocarbon Offshore
• Hydrocarbon Onshore
• Hydrocarbon Construction Services
• Hydrocarbon Modular Fabrication Services
• Hydrocarbon Engineering Services
Hydrocarbon Offshore:
The business offers lump sum turnkey EPCIC
solutions to the Global Offshore Oil & Gas industry
encompassing wellhead platforms, process
platforms & modules, subsea systems & pipelines,
brownfield developments, offshore drilling rigs
(upgrade and new-builds), floating production
storage & offloading (FPSO) topsides and offshore
wind farms. For more than 25 years, the business
has been successfully executing large offshore
platforms and pipeline projects on east and west
coasts of India, the Middle East, South East Asia
and Africa, for global companies such as ONGC,
GSPC, British Gas, ADMA-OPCO, Saudi Aramco,
Bunduq, Qatar Petroleum, Maersk Oil Qatar, PTTEP,
Petronas Carigali and Songas.
Its Offshore Engineering Centre has comprehensive
engineering capabilities covering the complete
project life cycle from concept studies, FEED, 3-D
model based detailed engineering, and special
studies to commissioning for offshore projects. The
installation capability resides in the joint ventures
L&T Sapura Shipping Private Limited, (which owns
and operates a Heavy Lift Cum Pipe Lay Vessel –
LTS 3000) and L&T Sapura Offshore Private Limited
(which provides offshore installation services).
The business secured major EPCI awards in
consortium, under a Long Term Agreement (LTA)
with Saudi Aramco. These include the development
of Hasbah Offshore Gas Field involving 6 wellhead
topsides, 2 tie-in platforms, about 520 km of
offshore / onshore pipelines followed by two
separate contracts, one for supply & installation
Additional development of Vasai East Project for ONGC. The scope included EPCIC of 2 wellhead platforms, 35 km pipelines and modification.

181
of 4 wellhead decks in the Safaniya field and the
other one for upgradation of 17 platforms in
various offshore fields of Saudi Arabia.
On the domestic front, the business secured an
EPCIC contract for Neelam Re-development &
B173AC project of ONGC involving a new process
platform, three new wellhead platforms, 32 km
pipeline and clamp-on / modification of existing
platforms in the Neelam Field in the western
offshore basin in India. During the year, the
Company successfully completed the Additional
Development of Vasai East Project for ONGC.
Contributing to India’s exploration and production
activities in the Oil and Gas sector, the business
has signed an exclusive Memorandum of
Understanding with GE Oil & Gas to partner in
the manufacture of subsea manifolds for future
deepwater projects in the Krishna-Godavari basin
on the east coast of India.
Hydrocarbon Onshore:
The business provides EPC solutions for a wide
range of hydrocarbon projects covering upstream
oil & gas processing, refining, petrochemicals,
fertilisers (ammonia & urea complexes), cryogenic
storage tanks & regasification terminals including
LNG and cross country pipelines. The business
has a track record of successful simultaneous
execution of multiple mega projects using diverse
technologies from process licensors like UOP,
Axens, Haldor Topsøe, CB&I Lummus, Black &
Veatch, Ortloff, ExxonMobil, BOC Parsons, Invista
and Davy Process Technologies.
Its Design Engineering Centres viz., L&T-Chiyoda
for onshore engineering and L&T-GULF for
Pipeline engineering enable the vertical to offer a
complete spectrum of FEED, process and detailed
engineering to clients. The Company’s subsidiary
Larsen Toubro Arabia is registered as In-Kingdom
EPC (‘IK-EPC’) company in Saudi Arabia and
addresses onshore IK-EPC opportunities.
The business has executed Lump-Sum Turnkey
(LSTK) projects for various Indian oil majors such as
IOCL, MRPL, ONGC, OMPL, BPCL, HPCL, Reliance
Industries, etc., as well as fertilizer companies like
NFL, GNFC, RCF, and others.
Internationally, the business group is prequalified
by major international oil & gas producers and
has a successful track record of project execution
with international bellwethers like Saudi Aramco,
Abu Dhabi Gas Industries (GASCO), Petroleum
Development Oman (PDO), KOC, KNPC, Petronas,
Dolphin Energy, Chemanol, etc.
During the year, the business received orders from
Indian Oil Corporation for a Coke Drum System
Package of Delayed Coker Unit (1.7 MMTPA)
at Haldia Refinery in West Bengal as well as for
setting up a 0.74 MMTPA INDMAX Fluid Cracking
Unit (FCC) including a LPG Treatment Facility at
Bongaigaon Refinery in Assam. The business also
received an EPC contract for Paraffin & Derivative
complex in Saudi Arabia from Farabi Petrochemical
Company.
During the year, the business successfully
commissioned the world’s largest Ethane-
cum-LNG Storage facility at Dahej in India.
Further, four international projects viz., Aviation
Fuel Depot at New Abu Dhabi International
Airport for TAKREER(UAE), Yibal Third Stage
Depletion Compression and Saih Rawl Depletion
Compression Projects for PDO (Oman) and Export
Gas Compression Facilities Upgrade Project
52”x 107 km Habshan-Ruwais-Shuweihat Gas Pipeline Project for GASCO, Abu Dhabi (UAE).

182
for Dolphin Energy (Qatar) were completed.
The Midyan Gas Processing Facilities for SAUDI
ARAMCO achieved mechanical completion.
Hydrocarbon Construction Services:
The vertical renders turnkey construction services
for refineries, petrochemicals, chemical plants,
fertilizers, gas gathering stations, crude oil & gas
terminals and underground cavern storage systems
for LPG and cross country oil & gas pipelines.
The vertical’s major capabilities include heavy lift
competency, advanced welding technologies, high
levels of automation, management of manpower &
material in large volume at construction sites and
Quality / HSE systems conforming to international
practices. The business has also invested in
strategic construction equipment, a range of
pipeline spread equipment, automatic welding
machines and other plant and machinery for
electro-mechanical construction works.
The business has executed projects for major
private sector customers like Cairn Energy, Reliance
Industries (RIL), HPCL Mittal Energy (HMEL) as
well as major oil PSUs like BPCL, HPCL, IOCL,
ONGC and international customers like Abu Dhabi
Company for Onshore Oil Operations (ADCO), Abu
Dhabi Oil Refining Company (TAKREER), Abu Dhabi
Gas Industries (GASCO), Saudi Aramco, Sadara,
Dolphin Energy etc.
The Company’s country specific entities render
construction support to international onshore
projects – Larsen & Toubro Electromech LLC in
Oman, Larsen & Toubro ATCO Saudia LLC in Saudi
Arabia and, Larsen & Toubro Kuwait Construction
General Contracting WLL in Kuwait.
During the year, the business received three new
orders for pipelines and associated works in
the western region of India viz. Palanpur – Pali
and Barmer – Pali pipelines for GIGL and Anjar
– Mundra pipeline for GSPL. The business also
received an order for composite mechanical works
for the Low-Cost Expansion Project of HMEL at
Bathinda and an order for additional work from an
existing client in India.
The business successfully completed an
underground Pipe-in-Pipe System for
transportation of cryogenic ethane, executed
for the first time in India, for RIL at Dahej and
installation of cross-country pipelines and
construction of Gas Gathering Stations & Well-Site
Facilities for Coal Bed Methane Development
Project Phase I for RIL at Shadol.
Hydrocarbon Modular Fabrication Services:
This business vertical offers comprehensive
modular Engineering, Procurement and Fabrication
(EPF) solutions for projects primarily in the offshore
and onshore oil & gas segments. World-class
modular fabrication facilities at Hazira (India’s west
coast), Kattupalli (India’s east coast) and Sohar
(Oman) have a combined annual capacity in excess
of 150000 MT depending on the product mix.
These facilities offer competitive and year-round
delivery capability with robust QHSE and delivery
performance.
These facilities are situated on the waterfront
with easy access to clients across the globe and
have load-out jetties for the dispatch of large
& heavy modules via ocean-going vessels &
barges. The facilities are also accredited with
global certifications and pre-qualifications from
major oil & gas customers and have state-of-
the-art equipment to deliver complex modules &
structures, duly tested at the facilities itself.An aromatic complex built on LSTK basis for ONGC Mangalore Petrochemicals Limited
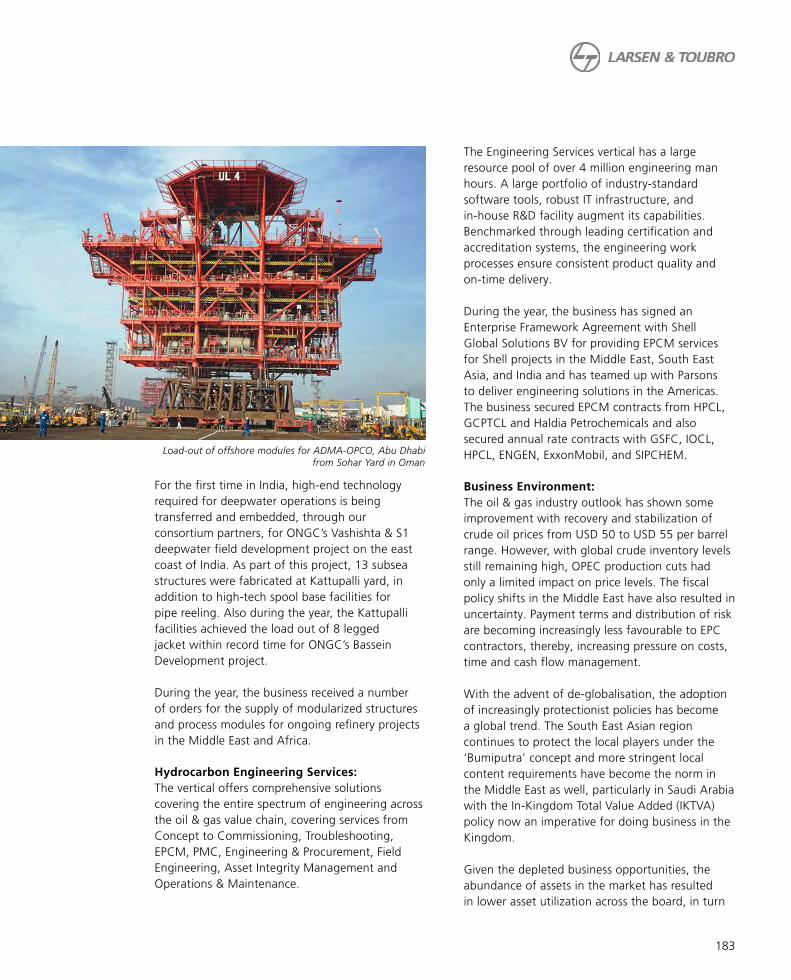
183
For the first time in India, high-end technology
required for deepwater operations is being
transferred and embedded, through our
consortium partners, for ONGC’s Vashishta & S1
deepwater field development project on the east
coast of India. As part of this project, 13 subsea
structures were fabricated at Kattupalli yard, in
addition to high-tech spool base facilities for
pipe reeling. Also during the year, the Kattupalli
facilities achieved the load out of 8 legged
jacket within record time for ONGC’s Bassein
Development project.
During the year, the business received a number
of orders for the supply of modularized structures
and process modules for ongoing refinery projects
in the Middle East and Africa.
Hydrocarbon Engineering Services:
The vertical offers comprehensive solutions
covering the entire spectrum of engineering across
the oil & gas value chain, covering services from
Concept to Commissioning, Troubleshooting,
EPCM, PMC, Engineering & Procurement, Field
Engineering, Asset Integrity Management and
Operations & Maintenance.
The Engineering Services vertical has a large
resource pool of over 4 million engineering man
hours. A large portfolio of industry-standard
software tools, robust IT infrastructure, and
in-house R&D facility augment its capabilities.
Benchmarked through leading certification and
accreditation systems, the engineering work
processes ensure consistent product quality and
on-time delivery.
During the year, the business has signed an
Enterprise Framework Agreement with Shell
Global Solutions BV for providing EPCM services
for Shell projects in the Middle East, South East
Asia, and India and has teamed up with Parsons
to deliver engineering solutions in the Americas.
The business secured EPCM contracts from HPCL,
GCPTCL and Haldia Petrochemicals and also
secured annual rate contracts with GSFC, IOCL,
HPCL, ENGEN, ExxonMobil, and SIPCHEM.
Business Environment:
The oil & gas industry outlook has shown some
improvement with recovery and stabilization of
crude oil prices from USD 50 to USD 55 per barrel
range. However, with global crude inventory levels
still remaining high, OPEC production cuts had
only a limited impact on price levels. The fiscal
policy shifts in the Middle East have also resulted in
uncertainty. Payment terms and distribution of risk
are becoming increasingly less favourable to EPC
contractors, thereby, increasing pressure on costs,
time and cash flow management.
With the advent of de-globalisation, the adoption
of increasingly protectionist policies has become
a global trend. The South East Asian region
continues to protect the local players under the
‘Bumiputra’ concept and more stringent local
content requirements have become the norm in
the Middle East as well, particularly in Saudi Arabia
with the In-Kingdom Total Value Added (IKTVA)
policy now an imperative for doing business in the
Kingdom.
Given the depleted business opportunities, the
abundance of assets in the market has resulted
in lower asset utilization across the board, in turn
Load-out of offshore modules for ADMA-OPCO, Abu Dhabi from Sohar Yard in Oman

184
leading to fierce pricing competition. However,
this has impacted the sustainability of some of our
competitors. Oil & Gas companies as well as their
contractors, are adjusting to the new paradigm
through reduced capex, efficiency improvement
programs and cost rationalization measures.
While investment in GCC countries have slowed
down due to budget constraints, investment
in gas projects is continuing, albeit at a slower
pace. Saudi Arabia continues to embark on major
offshore/onshore gas field development and
downstream petrochemical projects.
In spite of the extremely challenging external
environment, the Company did very well to
achieve order inflow growth of more than 80%,
over the previous financial year.
Significant Initiatives:
The fiscal year 2016-17 was a year of
transformation and turnaround for the
hydrocarbon business. The business has set a
vision to “Revolutionize the Hydrocarbon Industry”
and mission of “Execution Par Excellence”. The
Company is implementing a transformation plan
with a view to offer integrated services, reduce
costs, improve competitiveness and aid profitable
execution.
As a part of company-wide LAKSHYA 2021
Strategic plan which was unveiled during the year,
a number of initiatives have been taken up. The
business embarked upon an Operation Excellence
initiative, which is aimed towards achieving refined
cost structures, alignment for timely project
deliveries, and optimizing fund deployment. This
initiative is progressing well and is expected to give
sustainable results.
The capability building initiative is well
underway. This initiative aims towards building
globally-benchmarked project leadership teams
for executing large international projects and
developing & institutionalizing an international
project capability development engine. The
business has also launched a Digital transformation
initiative towards further improving productivity
across the business functions.
A dedicated International Business Development
set-up across the business verticals was established
during the year, which has started yielding results
in terms of significant international order inflow
and penetration into newer geographies like
Algeria & Azerbaijan through pre-qualifications.
Risk Management & Internal Controls:
Pro-active Risk Management has been
identified as a key strategic initiative to ensure
sustainable growth. Risk Management is an
integral part of the overall governance process to
identify, segregate, mitigate, control and monitor
various risks at business, prospect and operational
levels.
The risk management policy and guidelines
incorporate global best practices and
procedures, which enable the business to
anticipate challenges and opportunities to achieve
strategic objectives.
The major risks such as onerous contract terms
by client, tight schedule, counter-party risk,
localization requirements, forex exposure, etc. are
mitigated through specific actions like operational
excellence initiatives, alliances, cost optimisation,
improved customer intimacy, compliance with 3-D CAD model of Gathering Centre (GC-30) for Kuwait Oil Company

185
stringent HSE standards, proactive forex hedging,
strong contract & claims management and
identification of key personnel and talent at the
pre-bid stage.
All projects undergo a structured pre-bid risk
review process by the Apex Risk Management
Committee (ARMC) at business and at the
corporate level as per well-defined authorization
limits. The process involves a detailed assessment
of risks and deliberation on mitigation measures by
the ARMC. Periodic risk assessments of the overall
business and ongoing projects are also carried
out to effectively control & mitigate emerging
business risks. Project managers/selected project
team members undergo a certified Risk Induction
Program conducted by ECRI (Engineering &
Construction Risk Institute) on a continuous basis
to get acquainted with industry’s best practices.
Structured risk management framework will
further strengthen business governance, leading to
improved operational performance and setting the
course towards realizing LAKSHYA 2021.
A strong Internal Control framework is an
important part of operations and corporate
governance. The management has established
internal control systems commensurate with the
size and complexity of the business. The internal
control manual provides a structured approach
for identification, rectification, monitoring
and reporting of gaps in the internal control
systems and processes. The Group follows well
documented Standard Operating Procedures
(SOPs). The operating effectiveness of various
controls is periodically tested, and deficiencies, if
any, are promptly rectified.
An in-depth exercise for evaluating the adequacy
of Internal Financial Controls and their Operating
Effectiveness was carried out in the earlier years.
This activity included understanding and testing
of Internal Financial Controls and evaluating their
operating effectiveness based on the assessed risk
factors. During the year, the effectiveness of the
controls was validated.
Human Resource Development:
The business is on a growth trajectory and
has started sailing through the transformation
phase. To keep abreast with the growing needs
of the business, the HR team has been holding
the baton for achieving excellence by being
the frontrunner in various initiatives. In order
to effectively percolate the transformation plan
and management expectations, regular town
hall sessions are conducted at various locations
with the Senior Management. This has helped
in enhancing the employees’ morale and
collaborative spirit.
To realise the vision, HR function of the business
is ably supporting the building of capability and
capacity, towards which a multi-pronged strategy
has been developed and deployed. In particular,
the HR team has been at the forefront of the
company-wide capability building initiative.
Further, HR policies & practices have been aligned
to achieve an efficient delivery model and meet
dynamic business requirements.
Health Safety Environment (HSE) &
Sustainability:
Health, Safety & Environment is the cornerstone
of the Group’s business philosophy. The business
strives for continuous improvement for the
protection and development of health, safety,
and environmental assets of its employees and
stakeholders.
As part of the Corporate HSE Plan, cross-functional
HSE audits were initiated across all business units.
To spread safety awareness, various theme based
campaigns were observed on various important
dates during the year. Lessons learnt during
project execution were shared throughout the
organisation by way of well-documented HSE
Learnings and HSE alerts. Various HSE training
programmes were held, and motivational schemes
were instituted. This has resulted in a marked
improvement in safety statistics over the previous
year.
The Company has released its Sustainability Report
– “Engineering the Transformation” in December

186
2016 which covers various initiatives taken across
the Company and highlights the need to enhance
performance across all sustainability parameters
– safety, energy, water conservation and
productivity. As a responsible Corporate Citizen,
the business is aware of its responsibility towards
social upliftment, which is an integral part of the
corporate culture. The CSR Framework of the
business lays down the principles and programmes
for the community at large, in accordance
with section 135 of the Companies Act 2013.
In-line with the Group’s CSR theme “Building
India’s Social Infrastructure”, L&T Hydrocarbon
is committed to implementing projects that will
contribute to improving the quality of life in
the communities in which it operates, including
education, healthcare, skill training institutes,
water supply and sanitation facilities.
The consistent and ardent efforts of the business
to achieve consistent safety performance
have been well appreciated particularly in the
international operations. The business has won
several national and international accolades from
eminent institutions like Frost and Sullivan (F&S)
and The Economic Times (India Manufacturing
Excellence Award (IMEA)) and clients like British
Gas, Petronas Carigali Myanmar, Kuwait Oil
Company, ADNOC/Takreer and Reliance Industries.
Outlook:
Following the prolonged downturn, the oil &
gas industry is showing some signs of revival,
with oil prices expected to be range bound in
the mid-fifties per barrel in the near future.
In the domestic offshore sector, the launch of
Open Acreage Licensing Policy is expected to
attract investment in the E&P sector and ONGC,
in particular, is progressing on its USD 5 billion,
4 year investment plan for the development of
deepwater field KG/98-2 off the east coast of
India. This will provide significant opportunities to
the Group’s offshore and fabrication verticals over
the medium term, given its strategically located
Kattupalli yard on the east coast and the recent
tie-up with McDermott & GE to develop cost
effective subsea solutions. A number of brownfield
and decommissioning projects are also expected to
come up in the near future.
The Indian Public Sector refineries are embarking
on upgrades to comply with BS-VI emission norms,
Gas processing facilities for Saudi Aramco near Tabuk in Saudi Arabia.

187
though the mode of execution is expected to
evolve over the period. These refineries also have
investment plans for integrating petrochemical
projects along with refinery upgrades, which
will offer opportunities to Onshore as well as
Construction Services verticals.
The roll-out of comprehensive Urea Policy by the
Government is expected to revive Public Sector
urea plants at Gorakhpur, Sindri, and Barauni.
Energy efficiency improvement projects are
being actively pursued in existing fertilizer units.
The Government is focusing on setting up LNG
infrastructure and investments in LNG receiving
plants, both land-based terminals as well as
Floating Storage Regasification Unit (FSRU) are on
the anvil.
In the Middle East, Saudi Arabia is launching
ambitious Oil to Chemical projects with an
investment of over USD 30 billion till 2030
and the Kingdom will be a key market for
both Onshore and Offshore verticals. In the
light of oil price rebound, an uptick in onshore
upstream investment is expected in the UAE. The
downstream sector in the region is also expected
to attract additional CAPEX and is witnessing
integration between refinery & petrochemical
projects.
Towards providing geographical risk diversification,
the business is looking to explore newer markets
which offer good long-term business potential
and has undertaken intense & successful pre-
qualifications efforts in North Africa and CIS
regions.
Shale gas/oil will drive petrochemical and
fertilizer investment in the US, which will offer
an opportunity for high-value engineering and
modular fabrication services.
Modular Fabrication business is also aggressively
exploring alternative product lines such as
wind farms & process skids as well as strategic
partnerships to enhance asset utilization.
Engineering Services reimbursable business is being
expanded to de-risk the cyclical EPC business. The
Enterprise Framework Agreement with Shell Global
Solutions for providing EPCM services and the
collaboration agreement with Parsons to deliver
engineering solutions in the Americas will provide
significant growth opportunities to the business.
With a strong focus on building the Order Book
while maintaining Cost-to-Complete at bid levels,
the business is expected to show significant
improvement in its performance.

188
Information Technology Business
in the world, including 52 of the Fortune 500
companies.
LTI offers an extensive range of IT services to
its clients in diverse industries such as Banking
and Financial services, Insurance, Energy and
Process, Consumer Packaged Goods, Retail
and Pharmaceuticals, Hi-Tech and Media
and Entertainment, Hi-tech and Automotive
and Aerospace. Its range of services includes
Application Development, Maintenance and
Outsourcing, Enterprise Solutions, Infrastructure
Management Services, Testing, Digital Solutions
and Platform-based Solutions. The company serves
its clients across these industries, leveraging its
real-world domain expertise, diverse technological
capabilities, wide geographical reach, an efficient
Overview:
The Information Technology Services business of
the Group is housed in L&T Infotech (LTI).
In 2016, NASSCOM ranked the Company as the
sixth largest Indian IT services company in terms of
export revenues. The Company was rated amongst
the Top 15 Sourcing Service Providers (Sourcing
Standout) by Information Services Group (ISG)
in 2017. It was listed among the Breakthrough
15 for the Americas region based on Annual
Contract Value (ACV) won over the last 12 months
according to the 4Q 2016 Global ISG Index™.
Its clients comprise some of the largest and well-
known corporations and Government agencies
L&T Infotech’s global headquarters in Mumbai. The Company’s solutions focus on improving efficiencies for its clients.
189
global delivery model, thought partnership and
‘new age‘ digital offerings solving for complex
business challenges at the convergence of physical
and digital world.
LTI was incorporated in 1996 and is headquartered
in Mumbai, India. It leverages the strengths and
heritage of its Parent Company. The L&T Group
provides access to professionals with deep industry
knowledge in the sectors in which the Company
does business. LTI has inherited from the L&T
Group its corporate governance practices, which
place the Company in good stead in relation
to its business. In addition, it benefits from the
commonality of business verticals with its Parent
Company.
The Company’s growth has been marked by
significant expansion of digital business in various
verticals and geographies.
It provides services globally to clients in North
America, Europe, Asia Pacific and rest of the world
including India.
Business Environment:
Global IT-BPM industry grew by 3.9% and the
IT-BPM market (excluding hardware) stood at
USD 1.2 trillion in 2016. Indian IT-BPM industry
revenues excluding hardware stood at USD
140 billion in FY2017. The industry added USD
11 billion in incremental revenues last year,
representing year-on-year growth of 7.6% in USD
terms (8.6% in constant currency). IT-BPM export
revenues for the industry for FY2017 were USD
116 billion, growth of ~7.4% over the past year.
Domestic IT-BPM revenues were USD 24 billion,
a growth of ~9% from USD 22 billion in FY16.
IT-BPM export revenues are expected to grow by
7-8% in FY18 and the domestic market is likely to
grow by 10-11% next year.
The impact of digital technologies-Analytics,
Internet of Things, Cloud, Artificial Intelligence/
Machine Learning, Cognitive Sciences and Mobility
continues to be felt, with the growth in these
segments higher than the rest. These technologies
are expected to be the major growth segments in
global IT spends going forward.
Source: NASSCOM IT-BPM Strategic Review 2017
Significant Initiatives:
• Client-centricity – at the heart of LTI:
LTI’s strong long-term business relationships with
its clients (96% revenue from returning business)
have helped increase scope of engagements. The
Company has also partnered with clients in various
industries to identify priority solutions focused
on efficiencies, decisions and inferences for their
respective businesses, helping clients achieve
growth in a dynamic environment.
The core focus of the Company is to solve complex
problems at the convergence of digital and
physical world for its clients.
As times are changing, the line between the
physical world and digital world is blurring by
the day. Automation marked the start of this
convergence while the future will see further
amalgamation of technologies with day-to-day
operations in both B2B and B2C settings. Cycle-
times have reduced manifold, requiring frequent
changes to the approach and decisions being
made by clients. To support such needs for data
driven and dynamic decisions, LTI, in conjunction
with its domain knowledge and strong parentage,
is working to provide a complete ecosystem right
from thought-leadership, innovative approaches
to business problems to development and
maintenance of solutions (a balanced mix of digital
and traditional offerings).
Through its renewed focus on emerging
technologies, the company looks to assist its
clients to be ‘future-ready’ to engage with their
’millennial’ customer segment.
In Banking and Financial Services and the Insurance
industries, LTI is well prepared to take advantage
of emerging trends such as Robotic process
Automation (RPA) and artificial intelligence. With
deep expertise in leading insurance products

190
like Duck Creek, Insurity, Guidewire etc., the
Company is uniquely positioned to help clients
co-innovate. In the Energy and Process industries,
the Company is working towards creating leaner
operating models for its clients. Digital supply
chain and customer analytics are driving factors for
the hi-tech, media and entertainment industry. In
Auto/Aero industry, LTI is working as an innovation
partner leveraging its manufacturing experience
due its parentage.
The Company is particularly targeting clients who
have potential to offer opportunities with large
total contract values towards transforming their
business in the wake of the digital revolution. It
plans to achieve a higher value client portfolio by
focusing on new-age Application Management
Services, PaaS and infrastructure management
service deals, which tend to be long-term in
nature.
• Building capabilities on Digital technologies:
The Company has been steadily building
capabilities in digital technologies. Digital
businesses contribute to 26% of the revenue LTI is
working towards including Analytics and Digital in
Every Account (ADEA in Company parlance). It has
also begun its foray in newer technologies such as
virtual reality, augmented reality and the likes.
LTI’s proprietary digital platform MosaicTM is an
exhaustive representation of how LTI brings
together the power of exponential technologies to
deliver real-world business outcomes. Intellectual
Property and Offerings developed by the
company are housed in the following elements
of the MosaicTM platform for IoT, Analytics, User
Experience, Automation, AI and various other
Digital technologies:
• MosaicTM Things
• MosaicTM Decisions
• MosaicTM Automation
• MosaicTM Experience
• MosaicTM Artificial Intelligence
This platform houses all digital and next-
generation offerings under one unified umbrella
which is enabled by a four-layered ecosystem of
digital-focused practices, platforms, thought-
leadership and solutions. MosaicTM is a powerful
platform for creating new age solutions for clients.
LTI has also established business relationships with
niche players in the digital space for cloud, IoT
L&T Infotech’s Mosaic Experience Centre.

191
and Automation among others with companies
like Nutanix, GE Predix, Pega, Coupa etc.
Combined with the domain expertise and existing
capabilities of the Company, such partnerships
have helped develop end-to-end offerings through
sophisticated ecosystems which can solve complex
problems in a digital economy, thus bringing
bespoke value-added propositions to clients.
Building on increasing its digital focus, in
November 2016, the Company acquired
AugmentIQ, a start-up offering IP-based, big data
and analytics solutions that allows enterprises
derive business benefits from big data. This
acquisition has helped the Company increase its
footprint in the analytical space.
In addition to acquisitions, the Company is also
investing in partnering with startups to help
enhance its digital offerings and in turn, give
startups a platform and opportunity to scale-up.
With increased adoption of SaaS and other services
components, LTI is also investing in Security as a
practice, to serve clients with services to cope with
large-scale migrations to the public and private
clouds.
The Company is actively partnering with academic
institutions such as Massachusetts Institute of
Technology (MIT), Indian Institute of Management
Ahmedabad (IIMA), Veermata Jijabai Technological
Institute (VJTI) in order to provide thought-
leadership to its clients for future digital solutions.
• Focus on organizational transformation:
Our new quality policy reaffirms our client
commitment and focus on delivering rich and
meaningful experiences to customers.
LTI is amongst the few IT Services firm to have such
a differentiated policy, with the idea that in order
to rise in the experience economy in the digital
age, there needs to be a fundamental shift from
the services mindset to the experience mindset.
With a focus on transforming the experiences of
its clients, people and systems, LTI has launched
a rigorous transformation program which
focuses on changing the way it works, interacts
and collaborates both within and outside the
organization. The Company is working towards
transforming the way it works by incorporating
Design Thinking in various capacities in the
organization across all levels.
The Company is also looking to transform the way
it delivers the traditional Application Development
and Application Maintenance projects by
automating services and inducing a DevOps
method of working with continuous, progressive
changes which complement the client business
landscape replacing the traditional delivery model
that has rigid support cycles. Flexibility and agility
are two key objectives for the Company. This will
help in a non-linear growth in the company with
faster and more efficient delivery of projects.
• Focus on people transformation:
The most crucial element of an organization is
its people. LTI has transformed various aspects of
work life for its people. The transformation begins
with articulating five key beliefs:
• Be agile
• Go the extra mile
• Push frontiers of innovation
• Keep learning
• Solve for Society
These five guiding principles aim for the
organization to be nimble towards changes,
work over and beyond the call of duty to serve its
clients, innovate on a day-to-day basis to transform
the approach to work, continuously enhance their
way of working and keep its focus on welfare for
the society.
Collaboration is key to the growth of an
organization. LTI not only provides digital solutions
and offerings to its clients, it has also adopted
digital solutions for enhancing its own approach
to work. LTI was the first company to implement
Workplace (the collaborative platform of Facebook
for organizations) in the IT services industry.

192
The 20,000+ employees use this platform for
collaborative discussions and sharing of directives
within the firm across all geographies, levels and
business units. LTI is also a global service partner
for Facebook to help organizations rollout the
Workplace platform. Comprehensive services
from the Company offers comprehensive services
for change management strategy, adoption
roadmap, setup, installation, integration, use-case
development, and API extension and development.
LTI has also framed a talent strategy for adopting
newer ways of hiring such as hackathons,
online social media and improving learning
and development by offering custom courses,
conducting leadership programs and revamping
fresher hiring models.
To support all these initiatives, the Company
has upgraded its in-house IT systems to be more
digital-focused.
The Company is also recruiting global talent in
local markets particularly for high end digital
competencies.
Thus, Hiring, Engaging and retaining talent
continues to be the major focus areas for the
company. LTI added 951 professionals into its
family (net new hires), through campus recruitment
and lateral hiring in this fiscal year with an increase
in hiring premium college graduates as well. The
global headcount of the Company as on March 31,
2017 was 21,023.
• Expand geographical presence:
LTI markets and distributes its solutions directly
through its global delivery model. Apart from
penetrating into new clients in North America
and Europe, the Company is targeting further
expansion in other markets with potential, such
as Australia, Singapore, Japan, South Africa,
Ireland, Saudi Arabia and the Middle East. It has
augmented its teams in these markets to further
explore the opportunities therein.
The Company has allocated resources to these
markets to identify opportunities through greater
regional experience, expertise and client referrals.
It has recruited local nationals to assist in market
penetration efforts, in addition to complying
with local regulatory requirements. In the Middle
East, the Company intends to leverage the strong
presence of the L&T Group, which is engaged in
the oil and gas, construction and transportation
sectors. The Company has increased presence in
Germany, France and the Nordic region and will
continue to enhance its capabilities and address
gaps in language capability and geographic
coverage in these regions.
Outlook
Enterprises today are facing an expanding base
of demanding born-digital consumers, disruptive
new entrants and intensified competition from
digital-savvy competitors. As a result, Enterprises
are looking for client-centric and nimble IT service
providers who can deliver outcomes quickly.
With our rich, real-world expertise, engineering
mindset, an enviable client list and deep desire to
be relevant, LTI is uniquely positioned to win in this
new world order. We are committed to, and have
made good progress, in our journey to become a
next generation IT services and solutions company,
focused on solving the challenges of physical and
digital convergence.
In FY2017, we delivered an industry leading
revenue growth of 10% in constant currency terms
and 9.3% in USD terms. With intense focus on
client success and comprehensive transformation
capabilities across digital, analytics, IoT, automation
and cloud, we are optimistic about our future.

193
Technology Services Business
The key differentiators for LTTS are its domain
expertise and multi-vertical presence in industry
segments like Transportation, Industrial Products,
Telecom & Hi-tech, Process Engineering and
Medical Devices. LTTS has been recognized as an
Expansive and Established player in Zinnov Zones
2016 Product Engineering Services and features
in the Leadership Zone across 10 major industries
due to its best in class solutions, capabilities and
offerings that combine digital technology with an
innovation led orientation.
LTTS operates in five industry segments namely
Transportation, Industrial products, Telecom &
Hitech, Process industry and Medical devices. LTTS
also provides two horizontal service offerings –
Overview:
L&T Technology Services Limited (LTTS) is a
leading global pure-play ER&D services company.
LTTS offers design and development solutions
throughout the product development chain
and provide services and solutions in the areas
of mechanical and manufacturing engineering,
embedded systems, engineering analytics and
process engineering.
A well-defined Digital Engineering strategy helps it
deliver differentiated solutions for building Smart
Products, Smart Manufacturing and enabling
Smart Services. As part of this strategy, LTTS has
developed IP led solutions like its IoT platform
UBIQWeise and smart building framework i-BEMS
that has been launched in the global market.
Headquartered at Knowledge City, Vadodara, L&T Technology Services helps clients gain the competitive edge by building smartproducts, enabling smart manufacturing and offering smart services.

194
Embedded systems and Mechanical, which cater to
all the vertical segments.
1. Transportation:
Transportation segment partners with OEMs
and Tier 1 suppliers serving aerospace,
automotive, rail, commercial vehicles, off-
highway and polymer segments. The segment
delivers end-to-end services from concept to
detailed design through manufacturing and
sourcing support and helps OEMs develop cost
effective vehicles.
2. Industrial Products:
The Industrial Products engineering vertical
partners with OEM customers across building
automation, home and office products,
energy, process control and machinery.
This segment offers end-to-end product
development counsel, leveraging expertise
spanning software, electronics, connectivity,
mechanical engineering, industrial networking
protocols, user interface/user experience (UI/
UX), test frameworks and enterprise control
solutions.
3. Telecom & Hi-tech:
Telecom & Hi-tech segment caters to OEM/
ODMs, Chipset vendors, Telecom carriers
and ISVs, delivering end-to-end embedded
software design and development, hardware
platform design and development, product
maintenance, enhancement & sustenance,
Testing & Validation, System Integration
for communication and related solutions &
systems and field implementation services.
4. Process Engineering:
Process engineering segment provides end
to end engineering services for leading plant
operators across the globe. The industry
span and services are broadly for chemical,
consumer packaged goods (FMCG) and
energy and utility sector clients.
5. Medical Devices:
Medical Devices engineering is a dedicated
practice that is revolutionizing delivery of
healthcare by providing product development
solutions across a variety of Class I, II and
III devices, with concept design, embedded
systems, hardware and software, mechanical
engineering services, application software,
value analysis and value engineering,
manufacturing engineering and regulatory
compliance. The medical device industry is
comprised of diagnostic, life sciences, surgical,
cardiovascular, home healthcare, general
medical and other devices.
LTTS services more than 50 of the Fortune
500 companies and over 40 of the world’s
top ER&D spenders. LTTS is well poised to
meet future requirements of its customers
by investing in new industry segments and
state of the art innovation labs, adopting new
technology initiatives, expanding into new
geographies, and establishing alliances and
partnerships.
The 10,000 + highly-skilled personnel of
LTTS across 12 delivery centres and 27 sales
offices globally enable its clients to achieve a
sustainable competitive advantage. LTTS has
34 innovation labs spread across key delivery
centres in India.
Business Environment
According to Zinnov, corporations spent a total of
USD 1062 billion on research and development
and engineering activities such as product and
process development, manufacturing engineering
and other allied engineering in 2016. Of this
amount, the 500 biggest corporate spenders
TELECOMMUNICATION
ENERGY
CONSTRUCTION & HEAVY MACHINERY
AUTOMOTIVE
TRANSPORT
INDUSTRIAL PRODUCTS
AEROSPACE
MEDICAL DEVICES
TELECOMMUNICATION
ENERGY
CONSTRUCTION & HEAVY MACHINERY
AUTOMOTIVE
TRANSPORT
INDUSTRIAL PRODUCTS
CONSUMER ELECTRONICS
SEMICONDUCTOR
AEROSPACE
MEDICAL DEVICES
TELECOMMUNICATION
ENERGY
CONSTRUCTION & HEAVY MACHINERY
AUTOMOTIVE
TRANSPORT
INDUSTRIAL PRODUCTS
6VERTICALS RATED IN
LEADERSHIP ZONE
8VERTICALS RATED IN
LEADERSHIP ZONE
10VERTICALS RATED IN
LEADERSHIP ZONE
2014 2015 2016

195
in ER&D globally (the “G500 ER&D spend”)
contributed USD 621 billion or nearly 58%.
With respect to the total ER&D offshoring market
for product engineering services as addressed by
offshore third-party service providers and global
in-house centres (the “Global Addressed Market”),
the overall revenue was USD 85 billion in 2016,
of which offshore in-house R&D centres and
third-party service providers contributed USD 34
billion and USD 51 billion, respectively. The total
R&D offshoring market revenue generated by
both India-based third-party service providers and
India-based in-house centres to global clients in
2016 was USD 22.3 billion. Of this, the third-party
service providers and in-house ER&D centres
contributed USD 8.9 billion and USD 13.4 billion of
revenue in 2016, respectively.
“Strong sales in emerging markets are leading to
a requirement of products that are tailored to the
needs of customers, thereby driving engineering
towards these markets. Increased product
complexity is translating into a greater need for
engineering work that needs to be done. Also, the
war for talent, especially engineering talent, is real
in many mature markets, and this bottleneck has
opened up opportunities for players with a strong,
well-qualified talent pipeline. All of these trends
catalyzed the ER&D industry in India,” comments
Dr Wilfried Aulbur, Partner, Roland Berger Strategy
Consultants GmbH.
India’s ER&D services sector has indeed been on a
growth path over the past five years. The market,
which is expected to reach USD 35-40 billion by
2020, is creating deep impact in verticals such
as automotive, avionics, construction and heavy
engineering and telecom.
All emerging currencies have seen significant
volatility against the US Dollar on account of
changing political and economic scenario across
the globe. For Indian third party service providers
in ER&D segment, any appreciation in Rupee will
cause a dip in margins on a sequential basis. Short-
term rupee appreciation will not have big impact
considering the hedging strategies of companies.
However, in case the Indian rupee appreciation
continues for a long time, companies may have
to offset the margin impact by tighter control on
cost, execution and delivery-efficiency measures,
etc. towards sustainable growth.
Significant Initiatives
LTTS aspires to continue to be a global leader in
the ER&D segment. Key initiatives to achieve this
objective include:
• Account Mining and Farming: As a part of
its sales strategy, LTTS has decided to focus on
top 30 customers, which contribute 65% of its
revenues. This strategy has been christened as
T-30. Under this strategy, as a client relationship
matures and deepens, LTTS seeks to maximise
its revenues and profitability by expanding the
scope of services offered to that client with
the objective of winning more business from
the clients, particularly in relation to its more
substantive and value-added services.
• Transformation Initiatives: LTTS has
initiated a few transformational projects to
further strengthen its processes, systems and
global delivery models to achieve operational
excellence. Identifying Account Delivery
Managers (ADMs) and Account Relationship
Managers (ARMs) to ensure account level
leadership, setting up onshore, near shore
strategic and client-led centres in geographies
like Poland, Western Europe(Auto), EU & US(CPG
& Chemicals), building processes, governance
models and leadership development plans are a
few initiatives of the transformation project.
• Investment in Technologies & Innovation
Engine: LTTS is focused on driving innovation

196
and adopting solutions in line with technological
trends. Its culture of innovation since its
establishment has enabled it to expand the
range of its offerings to customers and improve
the delivery of its solutions and products. LTTS
has initiated Proofs of Concepts (POCs), which
demonstrate the viability of a design concept
and it has also set up labs and developed new
centres of excellence, where it has invested in
new technologies such as engineering analytics,
power electronics, IoT and M2M, which has
allowed LTTS to capitalise on key growth areas
and trends.
• Patents: Since inception, LTTS has filed for 57
proprietary patents and has co-authored 197
patents with its customers. Its patent portfolio
covers many aspects of its products and the
processes for making those products and are
focused on developing mature solutions such as
UbiqWeise™, iBEMS™ in emerging technology
areas.
• Technology Events: LTTS promotes annual
technology events such as Tech Panorama,
which is an initiative by its Technology Solutions
and Innovation Centre team which serves as
a platform for its employees to participate in
technical events and forums to showcase their
skill and demonstrate their ideas. Also its open-
innovation initiative, TECHgium™ - co-sponsored
by its customers, provides a platform for the
nation’s talented engineering graduates to solve
real-world engineering problems and also get
due recognition for it. Students are given an
opportunity to use their futuristic ideas to come
up with creative solutions.
• Awards & Recognition: L&T Technology
Services was recognized as the Company of
the Year by the Indo American Chamber of
Commerce (IACC) in 2016. The IACC also
awarded the company as the Best Green Office
Space of the year for its eco-friendly campuses.
In March 2017, L&T Technology Services was
conferred with the Golden Peacock National
Quality Award, 2017, as a recognition of the
company’s consistent focus in enabling new
technologies for global businesses. LTTS has also
won the Dataquest Vertical Warrior Award in
IT/ ITeS for innovative use of digital technology
earlier in 2017.
Its delivery centres are ISO 9001:2008-certified.
Its Aerospace & Medical Devices practices are
AS 9100C and ISO 13485:2003 certified. Also
its Embedded Systems & Software activities are
assessed at Maturity Level 5 of SEI’s CMMi®
Development.
• Partnerships and Alliances: The recent global
alliances established by LTTS include a Digital
Engineering Transformation partnership with
Microsoft Corporation to deliver Microsoft Azure
Engineering Solutions for global enterprises
across industries. This strategic partnership
enables enterprises around the world to leverage
the cutting-edge IP-led Digital Engineering
solutions of LTTS hosted on Microsoft’s Azure
enterprise cloud-first, mobile-first infrastructure.
LTTS has also partnered with UTC Climate,
Controls & Security and Otis, units of United
Technologies Corp. to create an innovation
laboratory focused on integrated buildings, smart
homes and cold chain technologies. Other notable
alliances and partnerships include AUTOSAR, Tele2,
National Instruments, Sierra Wireless & Thing
Worx.
Engineering services that enhance efficiency, while reducing time-to-market and costs.

197
Outlook
While traditionally the technology services industry
globally has been impacted by macro-economic
factors and is sensitive to the cyclic nature of
certain businesses, the potential remains as
strong as ever for relevance of engineering
services. For instance, global automotive OEMs
are moving rapidly towards implementation of
infotainment systems and autonomous vehicles.
The Industrial Products market continues to offer
immense growth potential, while the positivity
in the Telecom & Hi-tech market is boosted
by technological advancements, infrastructure
availability, high customer demand and supplier
push by the semiconductor industry. Medical
device manufactures are aggressively looking at
emerging markets and new product development.
Notwithstanding volatile commodity prices and the
slowdown in capex spending by manufacturing
companies in the Process Industry, the potential for
growth is visible in certain specific segments like
the Food Industry.
LTTS has established a strategic presence
in differentiated sectors and developed the
specialized domain knowledge that should enable
it to successfully help customers and gain from an
economic upturn.
LTTS will capitalize on disruptive technology
trends as part of its five year strategic plan
Lakshya that emphasizes profitable growth. It will
harness opportunities in four critical areas - digital
engineering for smart products & services,
smart manufacturing & operations, perceptual
engineering and pervasive technologies. LTTS
took a big step in this direction with the recent
acquisition of US-based Esencia Technologies, a
move that will strengthen LTTS footprint in ASIC,
VLSI, Embedded Design Services and Hi-Tech
sectors, where it foresees growth momentum.
LTTS will continue on its journey of using advanced
technological solutions to delight customers and
create value for all stakeholders.

198
Financial Services Business
Management business, is carried out through its
wholly owned subsidiaries.
Business Environment
1. Rural Finance
LTFH’s strength in Rural Finance makes it one of
the fastest growing NBFCs in this sector. LTFH is
now a single brand under L&T Financial Services
(LTFS) offering through multi channels, multiple
financing products like Farm Equipment Finance,
Two-wheeler Finance and Microfinance.
(a) Farm Equipment Finance: The tractor industry
grew ~15% in the year 2016-17 after two
continuous years of market contraction. The
positive growth was on account of a normal
monsoon cycle which has helped reinvigorate
The Financial Services business segment comprise
of retail and corporate finance, housing finance,
infrastructure finance, investment and wealth
management business carried through the
subsidiaries of L&T Finance Holdings Limited.
The Financial Services business also included
general insurance which was housed in a wholly-
owned subsidiary, L&T General Insurance Company
Limited (L&T GICL). The group divested its stake in
L&T GICL during the year.
L&T Finance Holdings (LTFH)
L&T Finance Holdings’ business organised under
verticals structured as the Retail and Wholesale
Platform, Investment Management and Wealth
L&T Financial Services’ offerings span the geo-socio-economic spectrum and comprise solutions in retail finance, wholesale finance, investment management and wealth management.

199
the demand in this sector. With monsoons
expected to be normal this industry is
expected to grow at ~ 7-8% this year.
During the year, LTFH gained market share,
doubling its share of the farm equipment
financing market to 8.6% in the second half
of the year 2016-17 from a 4.2% in the first
half. However, the business witnessed a YoY
Contraction by 11% in disbursement, along
with a book de growth of 6%. This trend is
expected to reverse in the current year with
excellent growth in both disbursements and
book.
LTFH has competitive advantage in this
segment in terms of its proven ability to
last through the cycles, differentiated value
proposition for top Dealers, analytics driven
business mix and channel management and
technology led sourcing and credit decisioning
for superior service proposition.
In this segment, the future strategy of LTFH
is to create a right portfolio mix across
geographies, OEMs and new/refinance,
digitise the entire process and provide a
differentiated value proposition to LTFH
partners to capture higher counter share at
chosen dealers through a differentiated value
proposition
(b) Two-Wheeler Finance : The Two-wheeler
industry posted a healthy YoY growth of 8%.
The market in FY18 is expected to remain
stable with a demand influenced by structural
factors like growing middle class segment and
urbanization.
Technology-led sourcing along with analytics
driven channel segmentation enabled
LTFH to gain market share. LTFH’s domain
expertise and in-depth knowledge in chosen
geographies have laid the foundation of its
strong business growth. A well-established
network and tie-ups with OEMs enabled LTFH
to retain a strong market position. In FY 17,
the two-wheeler finance business witnessed
a YoY growth of 10% in disbursement, along
with a book growth of 20%.
LTFH has competitive advantage in this
segment in terms of technology led sourcing
and decisioning, analytics driven channel
selection and differentiated value proposition
for top dealers and market depth in chosen
geographies
In this segment, the future strategy of LTFH is
to enhance TAT proposition through mobility
solutions and automated credit decisioning,
further increase market penetration in
its chosen geographies and develop new
locations and increase market depth by
exploring entry into self-financed segment
(c) Microfinance: The microfinance industry
has recorded a 26% YoY growth for the
year the year 2016-17. However, there
has been a trend of decrease in growth
since demonetization. LTFH believes that
the decrease is not entirely attributable to
demonetization as other external factors and
vested interests also impacted performance
in certain geographies. The industry appears
cautious and a pause in growth can be
expected in the short term.
The Retail Finance business participates across the income cycles of the rural economy – from farm equipment to
commodity storage and more…

200
During the year 2016-17, LTFH launched
mobility solutions, aimed towards improving
the operational efficiencies and making
the disbursement process simpler. This
move enabled LTFH to achieve the highest
single-month disbursement of ~ ` 460
crore in September, 2016. LTFH continued
its key initiatives of enhancing customer
reach, building scalability, and managing
risks effectively, attaining process excellence
and cost excellence. Microfinance business
witnessed a YoY growth of 39% in
disbursement, along with a book growth of
59%.
The post demonetization period was marked
with increased delays in repayments in certain
geographies. While the situation has improved
significantly from March onwards, LTFH
expects stress in some areas to continue for
some more time. In line with its conservative
polices, LTFH has made adequate loan loss
provisions in the year 2016-17 and will
continue to do so based on how the situation
develops.
LTFH has competitive advantage in terms of
robust risk management framework, best in
Industry productivity through differentiated
business model, proven ability to scale rapidly
and an efficient and technology enabled
delivery channel.
The future strategy of LTFH is to transform
Microfinance into a steady state retail business
by moving further towards a technology
and analytics-driven platform, expand into
under penetrated new geographies to
further enhance customer reach and further
strengthen risk management framework,
processes and systems
2. Wholesale Finance
LTFH is focused on Infrastructure Project Financing
(including Infra Debt Fund), Structured Corporate
Finance, Debt Capital Market and Supply
Chain Financing. LTFH’s strength lies in strong
underwriting ability, structuring and syndication
capabilities.
(a) Infrastructure Financing: Over the last year,
the Government of India introduced several
policy changes targeted at speeding up the
infrastructure development in the country.
The Renewable Energy sector reported a
record capacity addition of over 11 GW in
the year 2016-17, an increase of around
60% over 7.1 GW reported in FY16. The
outlook for the road sector has improved
through improvements in dispute resolution
framework, focus on EPC contracts and
generating financial resources for future road
construction.
The infrastructure book in its focus sectors
of renewables, roads and transmission
showed a healthy growth. The infrastructure
lending platform saw its fee income
doubling in the year 2016-17 through larger
underwriting and advisory mandates. This
was ably supported by the down-selling
desk which doubled its down-sell quantum
in this year. The Infrastructure Debt Fund
(IDF) also increased its asset base to over
` 4000 crore. Considering the stress in the
overall infra sector, LTFH proactively made
accelerated provisions over and above the
regulatory requirements in order to strengthen
the balance sheet. Infrastructure Finance
business witnessed a YoY growth of 21% in
disbursement, along with a book growth of
19%
L&T Infra Finance is a specialised project financier that finances renewable energy and road projects.

201
LTFH has competitive advantage in this
segment in terms of in depth sector
knowledge, efficient transaction processing
and management capabilities, superior advice
to customers through all stages of the project
life cycle, minimal turnaround time and an
operational IDF platform
In this segment, the future strategy of
LTFH is to broaden the sectoral expertise &
develop framework for new sectors, leverage
successful PE interface in renewables for
entry into new sectors and sharper focus on
selection and structuring of project parameters
(b) Structured Corporate Finance: In the year
2016-17, the bank credit slowed down to a
60 year low of 5.1% on the back of lower
credit demand and increased reliance on the
bond market for debt requirement. Despite
the above trend, LTFH’s structured corporate
finance expanded its asset base in the year
2016-17 with persistent focus on both growth
and profitability. The growth trajectory has
been backed by robust origination ability and
detailed appraisal process. The structured
corporate finance asset size showed a healthy
28% growth and doubling of disbursement
numbers in the year 2016-17.
LTFH has competitive advantage in terms
of robust origination ability & exhaustive
appraisal process and expanded product suite
with introduction of IPO funding in response
to conducive market environment
The future strategy of LTFH is to deliver steady
state high spreads along with high fee income
through superior structuring of financing
solutions
(c) Debt & Capital Market (DCM) : LTFH’s
DCM business invests in select infra
project issuances and financial institutions.
Additionally DCM entered structured finance
segment in the year 2016-17. DCM desk
doubled its disbursements, sell downs
and profitability to demonstrate excellent
investment and portfolio management
philosophy.
LTFH has competitive advantage in this
segment in terms of credit focussed
approach to the business and large ticket size
underwriting capability
In this segment, the future strategy of LTFH is
to aim to take sole/ anchor investor positions
thereby positioning L&T financial services as a
significant player
(d) Supply Chain Finance : During the year
2016-17, LTFH tied up with marquee names
in the distribution business of information
technology and mobility segment. The
supply chain business showed consistent
disbursements while increasing the
profitability through increase in margins
and opex control. Supply chain Finance
business witnessed a YoY growth of 10% in
disbursement, however, along with a book
degrowth of 7%.
3. Housing Finance
LTFH has identified housing finance as one of
its core sectors based on the long term growth
prospects of this industry. LTFH’s products in this
sector include Home loans, Loan against property
& Real estate finance.
(a) Home Loans & Loan against Property (LAP):
The year 2016-17 witnessed sluggish trend in
real estate sector on account of high prices,
inventory overhang and high interest rates.
While overall price levels have largely been
unchanged in most cities, luxury segment has
seen some correction. Demand for housing
is expected to see revival this year after a
slowdown over the past 2-3 years. This is
primarily on account of affordable housing
segment, which includes residential units for
Economically Weaker Sections, Lower Income
Group and Middle Income Group segments.
At beginning of the year 2016-17, LTFH
realigned its focus towards disbursing loans
to self-employed customers. It also focused

202
on doing a larger share of business through
direct sourcing. Despite challenging market
situations, LTFH’s Home Loan and LAP book
grew by 21% during the year, touching a new
milestone of ` 7500 crore.
LTFH has competitive advantage in this
segment in terms of sharpened proposition
to strengthen the product offering to
self-employed customers and streamlined
processes to deliver faster sanctions and
disbursement TAT to the customer.
In this segment, the future strategy of LTFH
is to drive operational efficiencies through
digitisation and automation, go digital and
use analytics for direct sourcing and cross
selling, focus on key locations to bring in value
contributors and manpower productivity and
leverage L&T ecosystem for business growth
and market intelligence
(b) Real Estate finance: Real Estate is transitioning
towards a more regulated industry with
the introduction of Real Estate Regulatory
Authority (RERA). Low home mortgage
interest rates, Government schemes such
as Pradhan Mantri Awas Yojana and State
Affordable Housing Policies are providing a
fillip to the real estate sector and consequently
real estate finance business. In the commercial
office segment, major metros have seen
strong demand for Grade A office space
leading to a higher occupancy and robust
rental growth. Real estate finance business
witnessed robust YoY growth of 74% in
disbursement, along with a book growth of
40%.
LTFH has competitive advantage in this
segment in terms of comprehensive product
suite to address top developers’ funding
requirements, robust risk management &
early warning signal mechanism and strong
processes to deliver faster TAT
In this segment, the future strategy of LTFH
is to focus on top real estate developers with
the aim to build sustainable relationships,
build a wider product portfolio and focus on
Syndication/Sell down for risk distribution
and leverage the L&T ecosystem for business
growth and market intelligence
4. Mutual Fund
India’s mutual fund industry witnessed a 35%
growth during the quarter-ended March 2017,
taking the Average Assets Under Management
(AAUM) to ` 1829583 crore, as compared to
` 1353443 crore AAUM recorded during the
quarter-ended March 2016.
During the year 2016-17, the Mutual Fund
business continued its previous year’s growth
momentum. With YoY growth of 39%, the
business outperformed the industry growth rate,
while maintaining a healthy mix of core assets
under equities and fixed income and a strong
investment performance, supported by strong
inflows into the core products.
LTFH has competitive advantage in this segment in
terms of robust performance of the Fund’s equity
schemes and diversified and ever-expanding reach
across distribution channels
In this segment, the future strategy of LTFH is to
focus on building core assets to achieve the dual
purpose of achieving higher profitability while
L&T Housing Finance fulfills the desire for home ownership in over 40 markets across the country.

203
ensuring stability in overall AUM, increase SIP book
to ensure steady flows and establish presence
in key counters to gain a higher share of assets,
thereby widening LTFH’s reach
5. Wealth Management
With a GDP growth hovering over 7-8% and
a strong future outlook, India’s growth story
is making it an increasingly attractive market
for wealth management firms. The regulatory
environment too is evolving, presenting
opportunities for established wealth managers to
expand their offerings.
The year 2016-17 was a turnaround year for the
business – from a loss of ` 24 crore in year 2015-
16 to a profit of ` 5 crore in the year 2016-17,
the average assets under management grew by
almost 46% during the year with Q4 2016-17
AAUS being more than ` 13000 crore. Company’s
revenue witnessed a rise of 71% during the year
2016-17, being at ` 50 crore.
LTFH has competitive advantage in this segment
in terms of comprehensive services suite including
Loan against shares, Mutual funds. Real estate
finance complements the Company’s key offerings
for HNIs. Offerings like Debt Capital Markets
significantly strengthen the customer value
proposition. A strong track record of AUS and
revenue growth ranks it high amongst the key
market players and strong partnerships established
since inception have enabled LTFH to service the
differing needs of clients across segments, asset
classes and markets.
In this segment, the future strategy of LTFH is to
focus on Investment advisory and family office to
form new meaningful relationships and deepen
existing relationships with clients to attain a
higher wallet share. Acquisition of new clients
will continue to remain a key area of focus for the
business and increase sales strength.
Significant Initiatives
(a) Human Resources: LTFH have embarked upon
the “Transform” journey to LTFH 2.0 with a
sharp “Focus” on creating superior
shareholder value by “Delivering” top quartile
Return on Equity (RoE). The role of Human
Resources has significantly transformed since
2016, from being a function which used to
manage the human resources of LTFH to being
the prime driver of the change in culture
required for the successful transformation of
LTFH. All the initiatives in this area have been
designed for transforming the old LTFS into
LTFS 2.0.
LTFH firmly believes that any transformation
journey needs to be sustainable. While
the strategy LTFH has embarked upon for
delivering a top quartile RoE is a 4 year
strategy, superior value generation for the
shareholders will come only if the new way of
‘Results not Reasons’ becomes a way of life.
LTFH believes that this journey will become
sustainable if it gets 3 aspects right: (i) Clarity
and communication of Management Intent;
(ii) A well-honed execution engine and (iii) A
performance oriented Culture
LTFH’s endeavour is to ensure that its HR
processes are completely aligned with the
above three aspects and they work towards
creating leadership which makes the
transformation smooth and sustainable.
L&T Mutual Fund and L&T Capital Markets Limited provide investors with a range of investment and wealth
management options.

204
(b) Risk Management: The transformation journey
embarked by LTFH involves rapid growth in
its chosen businesses. Having embarked on
this transformational journey, LTFH recognises
the criticality of risk management practices
towards a longer term success. LTFH has a
robust management framework covering
various families of risk like credit risk, portfolio
risk, market risk and operational risk.
During the year 2016-17, LTFH engaged a
leading global risk management consultancy
to further strengthen its risk management
framework. Based on their recommendations,
LTFH is strengthening its capabilities in the
four key areas to ensure that the businesses
operate fearlessly within the defined risk
appetite and risk tolerance levels.
• Risk Appetite Statement (RAS)
A robust RAS is setup that acts as a
governing framework from board to front
line to facilitate trade-offs between risk,
value and growth monitors. It helps in
effective risk and return management
while providing greater clarity and
autonomy to businesses.
• Risk Dashboards & Early Warning Signals
(EWS)
Dashboards should provide cross-risk view
and are anchored to LTFH’s Risk Appetite
Statement. It leverages risk measurement
and analytics to further enhance early
warning capabilities and to use those in
driving decisions. EWS helps in timely
identification of portfolios with increasing
risk, enabling timely remedial measures
(where applicable) and eventually driving
lower NPAs.
• Treasury Risk Management
This gives the ability to effectively manage
the Market risk (liquidity and interest rate
risks) emanating from the core businesses
of LTFH. A robust governance framework
is setup to monitor and manage the
Market Risk Operations.
• Risk-adjusted pricing
This tool helps to track transaction level
and portfolio level actual pricing vis-à-vis
risk-adjusted pricing. Thus giving more
clarity on value creation by products/
portfolios. This pricing tool incorporates
weighted average tenor, based on
behavioural maturity in order to align
with expected cash-flows.
(c) Digitisation & Analytics: In line with the
theme of “Grow Fearlessly”, LTFH’s Digital
& Data Analytics roadmap encompasses
achieving multi-fold increase in “Scale”, “Cost
Effectiveness” and “Customer Experience”.
In order to enable it for achieving the same,
LTFH has decided on the following design
principles: Biometric based data capturing,
Paperless On-boarding, Transact with it on any
day in the year.
LTFH has relooked at the existing architecture,
to revamp it completely to achieve the digital
aspiration that it thrives to achieve. The end
state architecture will be modular and agile,
enabling LTFH to keep pace with changing
technology. A strong digital and data analytics
roadmap touching every aspect of the
customer journey will not only improve the
customer experience but also substantially
enhance efficiency and productivity
(d) Corporate Social Responsibility
CSR witnessed a transformation during the
year 2016-17. LTFH’s overarching theme of
Sustainable livelihoods was revisited to align
to the larger needs of the rural ecosystem
- through Integrated Water Resource
Management (IWRM). LTFS committed
itself to come up with long-term innovative
solutions benefitting the water-deprived
communities. The IWRM programme engaged
with communities to implement interventions
in order to address their core needs in water
and facilitate the rural economy through
agriculture and allied activities.
In addition to this, LTFH also focussed on Financial
Literacy. It helped in spreading the message

205
of financial literacy to rural India, resulting in
enhanced absorption of facilities and schemes
granted by the Government and other financial
institutions.
Thrust areas were re-modelled to rake in the 3S
approach which believes in:
• Social Impact through right projects aligned with
company’s focussed businesses
• Sustainable development, creating right
structures
• Achieve Scale by collaborating with right
partners
Some of the highlights of the CSR activities are:
• Constructing water harvesting structures, known
as Dohas
• Creating disaster relief shelters , towards the
Tamil Nadu floods in November 2015
• Nurturing 100 Integrated livelihood development
centres in villages
• Initiating remedial education programmes
• Garnering volunteers from the organisation
(Boondein) to contribute towards CSR initiatives
Outlook
Major leading indicators suggest that the
economic activity is gradually improving. This
is driven by improving global demand and a
remonetisation-led pick-up in domestic activity.
IMF expects India to resume the 8% growth path
in the medium term. This should happen as soon
as the short-term dislocation to consumption from
demonetization passes. The nation is expected to
remain the fastest growing economy on the back
of high private consumption levels and gradually
implemented domestic reforms.
LTFH sees growth picking up significantly,
supported by a normal monsoon, modest costs
of borrowing, pay hikes for state government
employees and stronger export demand. Other
growth supportive factors will be Government’s
continued thrust on physical infrastructure and the
Real Estate Regulation Act (RERA), which will pave
way for greater transparency and accountability
in the real estate sector. The Goods & Services
Tax, implemented in July 2017, will also have
long term structural benefits, despite short-term
execution and adjustment risks during the course
of 2017-18.

206
Developmental Projects Business
Kudgi Power Transmission Line project, Karnataka.
in the Public Private Partnership (PPP) format, toll
collection including annuity based road projects,
power development and power transmission,
development and operation of port facilities and
providing related advisory services. Significant cash
generating assets have been created under the
current business model which are being explored
for monetisation on a continuous basis in order
to maximise value creation for the benefit of
stakeholders.
L&T IDPL Group:
Overview:
L&T Infrastructure Development Projects Limited
(L&T IDPL) is a major player in the Public-Private
Partnership projects in India with business interests
Developmental Projects business segment
comprises (a) Infrastructure projects executed
through its joint venture company L&T
Infrastructure Development Limited and its
subsidiaries and associates (L&T IDPL Group);
(b) the Hyderabad Metro Rail project, executed
through its subsidiary L&T Metro Rail Hyderabad
Limited (c) Power Development Projects executed
through its subsidiary L&T Power Development
Limited and its subsidiaries (L&T PDL Group)
and (d) Kattupalli Port operations of Marine
Infrastructure Developer Private Limited, a
subsidiary company.
The operations of developmental projects business
segment primarily involves development, operation
and maintenance of basic infrastructure projects

207
across Roads and Bridges, Ports, Wind energy
and emerging sectors such as Power Transmission
Lines. As of March 2017, L&T IDPL has a portfolio
of 17 projects at an estimated project cost of
about ` 17555 crore which includes 15 road
projects with 7182 kms, one transmission line
project and a port berth at Haldia.
L&T IDPL’s portfolio of infrastructure assets also
includes windmills in Tamil Nadu.
Roads & Bridges:
No. of Projects : 15Lane Km : 7,182 KmTotal Project Cost : ` 16,080 crore
13 Operational Projects 2 Implementing Projects
Port:
No. of Projects : 1Capacity : 4.5 MTPATotal Project Cost : ` 125 crore
LTIDPL has 21% stake in Berth No. 4A of Haldia
Transmission Line:
No. of Projects : 1Capacity : 2,400 MWTotal Project Cost : ` 1,300 crore
• ”Transmission System for Power evacuation“ from NTPC Kudgi (3x800 MW) of Madhugiri in Karnataka.
• 3 sections comprising a total length-470 KM
Total No. of Projects : 17
Project Cost : ` 17,555 crore
Business Environment
Infrastructure is a key sector that propels overall
development of the Indian economy. The
significant expansion of the economy over the
past two decades has led to demand for strong
infrastructure in the country. The county’s capacity
to absorb and benefit from new technology and
industries depends on quality and efficiency of
infrastructure. In order to augment economic
growth, the government initiated several policy
and enabling measures to support the creation of
high-quality infrastructure and efficient delivery of
services to its citizens.
The recent slowdown of Public Private Partnership
(PPP) projects could be attributed to a combination
of events, namely global economic slowdown,
weak regulatory and institutional frameworks,
delay in issue of clearances by authorities,
financing issues (over-leveraged debt and paucity
of equity), acquisition of land, aggressive bidding
by developers, contractual issues, including long
drawn out dispute resolution arising in a maturing
PPP landscape, inadequate diligence and appraisal
by lenders, and lack of flexibility in contractual
arrangements.
The infrastructure credit has witnessed a sharp
increase in stressed advances. The Reserve Bank
of India (RBI) has taken steps like allowing flexible
restructuring of infrastructure loans to ease cash
flow pressure in the infrastructure sector.
The budget allocation for National Highways
for the year 2017-18 is ` 64000 crore. Besides,
the union budget has also earmarked ` 27000
crore for its rural roads development programme,
Pradhan Mantri Gram Sadak Yojana (PMGSY),
under the Rural Development Ministry, which
together makes it more than ` 91000 crore for
road development. The road sector had exclusive
allocation as the Government had identified 2000
km of coastal connectivity roads for construction
and development, which would ultimately lead to
better connectivity of remote villages. The union
budget had allocated a substantial amount to
infrastructure development and termed it as top
priority of the Government.

208
The government, through a series of initiatives, is
working on policies to attract significant investor
interest. The Indian government plans to develop
roads under different programmes such as National
Highways Development Project (NHDP), Special
Accelerated Road Development Programme in
North East (SARDP-NE) and Left Wing Extremism
(LWE). The government has identified development
of 2,000 km of coastal roads to improve the
connectivity between ports and remote villages.
Significant Developments
Demonetization: Since almost 98% of toll
collections are by way of cash, the announcement
of demonetization caught both the road users
and concessionaires by surprise. To avoid hardship
to the public and long queues at toll plazas, the
Roads Ministry and NHAI advised stoppage of toll
at all National Highway toll plazas exempting all
traffic from tolls across the country from November
9 – December 2, 2016 (over 23 days). The
compensation payable for such a force majeure
event varies under different concessions and
hence NHAI came out with a Standard Operating
Procedure in this regard. While the developers
have sought a cash compensation for revenues
lost, NHAI is looking at only reimbursing certain
costs and in certain cases, extension of concession
period.
Road subsidiaries of L&T IDPL have submitted their
claims to NHAI and only about half of the total
claims have been paid by NHAI so far.
L&T Kudgi Transmission Limited (L&T KTL) being
the first transmission line project of L&T IDPL
had achieved the commencement of commercial
operations (COD) in September 2016. The
elements of the project are (a) Element 1: 400KV
line A&B between Kudgi and Narendra (New) with
a line length of 17.66 km; (b) Element 2: 765KV
line between Narendra (New) and Madhugiri with
a line length of 379.84 km (c) Element 3: 400KV
line between Madhugiri and Bidadi with a line
length of 93 km. With a total of 1169 towers
across 492 km length, the project had successfully
entered revenue stream. The project has reported
book profits from the first period of operations.
This project was also refinanced in March 2017,
thereby reducing interest rates significantly.
Construction work is in full swing in Deccan
Tollways (DTL) in Telangana and Sambalpur
Rourkela (SRTL) in Odisha. The two road projects
are expected to commence tolling in the year
2017-18.
Three road subsidiaries had issued notices of
termination of projects owing to political force
majeure and/or default by the Authorities under
the respective concession agreements. In case of
the two national highway projects, NHAI has taken
over the project operations during the year but
has not accepted the cause of termination and
arbitration proceedings have been initiated for
realisation of the claims for termination payments.
The Company has proactively engaged with project
lenders and taken legal steps wherever possible to
protect the interests of the lenders.
In the case of a state highway in Gujarat, the
subsidiary of L&T-IDPL has withdrawn its notice in
order to facilitate implementation of Strategic Debt
Restructuring Scheme by lenders to the project.
The subsidiary of L&T-IDPL and the lenders are
negotiating with the state government to improve
the project viability.
During the year 2016-17, NITI Ayog came out
with a new policy to provide cash relief to An Elevated Corridor sweeping over a city – one of L&T’s
many road development projects.

209
concessionaires and contractors in the Roads
sector. Under this, the Authority would pay
75% of the Arbitration Award to the aggrieved
concessionaire against a bank guarantee and the
funds will need to be utilised for other national
highway projects. The policy is applicable to two
subsidiaries of the Company and while one of
the subsidiaries has already received claim of
` 69 crore, the second project is awaiting receipt
of claim of ` 121 crore. There are several other
claims of the road projects that are under different
stages of dispute resolution and they too would
benefit from an early settlement.
During the year 2016-17, the Company mitigated
its risk in its subsidiary in Colombo by selling its
stake. With a view to have direct management
control over the Hyderabad Metro project and also
considering its other commitments in the state of
Telangana, L&T has decided to take over the stake
held by the Company (L&TIDPL) in L&T Metro Rail
(Hyderabad) Limited. The shares held by LTIDPL
were purchased by L&T in March 2017 after receipt
of necessary approvals/ consents. By divesting
this large investment, L&T-IDPL is now in a good
position to fund its growth.
During the year 2016-17, M/s. Kudgi Transmission
Ltd & L&T Krishnagiri Walajahpet Tollway Limited
(L&T KWTL) refinanced their debt taking advantage
of the softening of interest rates and the ratings of
the projects.
Outlook:
The pace of recovery in the sector is likely to be
slow and will be linked to the on-ground impact of
the policy measures taken as well as the availability
of funds. Aggressive bidding in the past and
inability or limited ability to raise equity for Built-
Operate-Transfer (BOT) projects have impacted the
viability of infrastructure projects and have reduced
the risk appetite of developers for new projects.
The Government initiatives in rebalancing of risk
sharing, resolving legacy issues, strengthening
institutional capacity and scaling up finance etc.,
would revive the sector.
With an estimated traffic growth of 8% in the
new fiscal, the road subsidiaries are expected to
perform better during 2017-18. The Company
will continue to look for opportunities to churn its
portfolio and would refinance some of the road
projects during the year 2017-18 as well.
A five-year business plan is under finalisation
and L&T-IDPL is well poised to be on the growth
trajectory. L&T-IDPL is evaluating the new models
in the Roads sector (such as Hybrid Annuity Model
and Toll Operate and Transfer) and is expected to
participate in bids to bag projects in the road and
transmission line sectors besides looking at good
brownfield opportunities.
L&T Metro Rail (Hyderabad) Limited
Overview
L&T Metro Rail (Hyderabad) Limited (L&TMRHL)
was incorporated on 24th August 2010 as a Special
Purpose Vehicle to undertake the business to
construct, operate and maintain the Metro Rail
System including the Transit Oriented Development
in Hyderabad under Public Private Partnership
model on Design, Build, Finance, Operate and
Transfer (DBFOT) basis. The company entered
into a Concession Agreement with the erstwhile
Government of Andhra Pradesh on 04.09.2010.
The Metro Rail system shall be constructed on
three elevated corridors from Miyapur to L.B.Nagar,
Jubilee Bus Station to Falaknuma and from Nagole
to Shilparamam covering a total distance of 71.16
Kms. The concession period of the project is for 35
years including the initial construction period of 5
years. The Concession period is extendable for a
further period of 25 years subject to fulfillment of
certain conditions by the Company as set out in
the Concession Agreement.
The estimated project cost is ` 16375 crore which
includes the cost of rail system and 6 million TOD
which is to be funded by a term loan of ` 11478
crore, equity share capital of ` 3439 crore and
Viability Gap Fund from Government of ` 1458
crore. The company has tied up entire debt and
achieved financial closure on 1st March 2011.
In terms of the Concession Agreement, both
the Government of Telangana (State Govt) and

210
L&TMRHL are required to comply with certain
conditions precedent for the occurrence of
appointed date which shall be the date for
commencement of concession period. The State
Govt has declared the appointed date as 5th July,
2012 upon fulfillment of the condition precedent
(CP) from both the parties i.e. L&T Metro Rail
(Hyderabad) Limited and the State Govt.
The company is executing the project covering a
total distance of 71.16 Kms in 3 different corridors.
This entire distance is further sub divided into 6
stages for ease of implementation. Project cost
incurred during the year 2016-17 is ` 2325 crore
and cumulative upto 31.03.2017 is ` 12482 crore.
The company has achieved 5th Project milestone as
per the Concession Agreement having expended
75% of the project cost by 31st July, 2016. CMRS
(Commissioner of Metro Rail Safety) approval has
been obtained for Stage 1 & 2 of the project,
which are fully ready for commissioning. The
overall physical progress of the project as on
31.03.2017 is 72%. Construction works in Stage
3, 4 and 5 are going on at brisk pace.
The company has filed applications with the State
Government seeking grant of power at cost of
service basis, longer sub-lease rights on TOD,
the Government to bear the cost of Security at
stations etc. which are crucial for commissioning
the project. As there have been delays from the
Government’s side in providing continuous RoW,
the company has applied to the Government for
interim extension of time of scheduled completion
date upto November, 2019, keeping in view the
present progress of the project. The corresponding
cost implications are being prepared and shall
be submitted to the government upon receipt of
approval for extension of time.
The Company continued to successfully obtain
further tranches of Viability Grant of Funding
(VGF) from the Central Government during
2016-17 and the total VGF drawn stood at ` 957
crore as on 31st March 2017. This confirms the
certainty of the Central Government participating
in the project.
Business Environment
About 9 million transport trips are performed every
day in Hyderabad city and major share is taken by
Bus transport (50%). The City roads are congested
with 8% road area and has a very low average
speed (about 8KMPH). L&T MRHL will provide
safe & punctual travel and reduce the customer
pain points through Last Mile Connectivity, Digital
ticketing, Mobile app, etc. join attracting the
commuters. Non fare revenue generation will
be achieved through cross selling of products
to commuters. This will be further strengthened
by Metro expansion which will result in higher
ridership.
The company has been granted rights for Real
Estate development of 18.5 Million sq.ft., with
strategically located land parcels interspersed at
prime city locations, adjoining Metro Stations &
Metro corridors. Developments would encompass
Grade-A commercial developments for IT/ITES
Office, Healthcare, Retail and Hospitality.
Significant Initiatives
With a view to reduce the OPEX cost, the company
has tied-up with a solar power developer for
generating captive solar power of about 15MW
at a very competitive price. Though Metro
commercial operations were not started during the
FY 2016-17, L&T-MRHL explored various revenue
generating options through resources & skills that
it has developed for over a period of 5 years in
Metro Industry.
L&T MRHL has come up with following non-fare
revenue generating initiatives:
• Leasing out space for erecting mobile towers.
• Leasing out Optical Fibre
• Training its upcoming Metro staff with the
existing infrastructure
Rigorous follow up is on with the State
Government for favorable resolution of the power,
sub-lease, security, compensation for delays and
scope change, time-extension and other issues
pending with the Government. L&T-MRHL has
worked out certain models to obviate TOD related

211
threats, while leveraging on the various advantages
of the offering like metro rail connect, strategic
locational offering, etc.,
L&T-MRHL is also undertaking rigorous follow
up with the Central Government for smooth
disbursement of further tranches of VGF. L&T-
MRHL has targeted to gear up to commission
Stage 1 and Stage 2 of the project during the
current financial year. It has also been decided to
exercise strict control on costs and optimize the
revenue sources. It is also pursuing to re-negotiate
and mitigate the claims from contractor/ vendors
in the best possible way.
L&T MRHL has undertaken development of 4
Grade A Retail Mall projects adding to 1.25
Mn.sft. at key locations along the Metro corridor.
Development is nearing completion and launch of
Malls at Punjagutta & HITEC City is planned in H1
of 2017-18, with a strong booking of about 90%
at both the malls. Major brands signed up include
PVR, Marks & Spencer, Lifestyle, Shoppers Stop,
Pantaloons, Hyper City, Reliance Retail, etc. The
other two malls at Erramanzil & Musarambagh are
scheduled for completion in H2 of 2017-18, with
strong customer bookings already made.
The Company has a robust Risk Management
Process, having identified risks and categorized
them as Major, Moderate and Minor. The major
risks for this Project are non-availability of required
Right of Way ( RoW) and delay in approvals
from the Railways. Risk Mitigation measures in
the form of increased liaison with Government
instrumentalities to get early approvals, Stage wise
implementation with focus to mobilize and execute
only on available work fronts and fill up the gaps
subsequently have assisted in optimization of
resources with minimal cost and time overruns.
L&T-MRHL has a robust internal control framework
system in place which has been certified by an
external consulting firm namely BDO during 2015-
16. The framework has been reviewed from time
to time and found to be operating effectively.
On the human resources front, L&T-MRHL
implemented revised minimum wages across all
sectors for its sub-contractors deployed in the
The Hyderabad Metro project is the world’s largest public-private-partnership in the urban transportation sector.

212
category of “constructions or maintenance roads
& buildings”, “shops & establishments”, “security
services” etc. It also extended maternity leave
period from 12 weeks to 26 weeks for first two
children, and for contract labour, it has extended
amended provisions under the Payment of Bonus
Act (revised). Similarly, under ESI Act, 1948 gross
limit was increased from ` 15000 to ` 21000 and
the same is being implemented. L&T-MRHL has
provided employment to 65 employees in 2016-17
Outlook
L&T-MRHL is planning to open two out of three
corridors of Metro (Blue & Red lines) by the end
of 2017-18 with an expected ridership of approx.
12 lakh per day. Measures like fare integration
with other transport modes and collaborations
with various feeder services for first & last Mile
connectivity are being pursued so as to strengthen
fare revenue. L&T-MRHL is also exploring other
Non- Fare Revenue initiatives like consultancy
services with in-house competency on Metro
system, Wi-Fi, Radio, etc., that will add extra
revenue to the company.
Buoyed by the success of Phase 1 Malls, L&T-
MRHL intends to start with a 1 Million sq.ft Mall
at Raidurg along with a Built-to-Suit IT Office
Tower of around 1 Mn.sft for a client with whom
negotiations are in advanced stage. Discussions
with customers to kick start a few other
developments of the portfolio are underway.
L&T Power Development Group
Overview
L&T PDL, a wholly owned subsidiary of L&T, has
been incorporated as its Power Development
arm with an objective of developing, investing,
operating and maintaining power generation
projects.
Currently, L&T PDL portfolio comprises projects in
thermal and hydel power generation.
Hydel Power Projects
Hydel projects with an aggregate capacity of 870 MW are in various stages of development. A brief status is
depicted below:
Name of Project Capacity (MW) State Name of Subsidiary Current Status
Singoli-Bhatwari
Hydro Electric
Project
99 Uttarakhand L&T Uttaranchal
Hydropower Limited
Advanced stage of
construction
Tagurshit Hydro
Electric Project
74 Arunachal Pradesh L&T Arunachal
Hydropower Limited
CEA meeting
for grant of
Techno-Economic
Concurrence held
in Oct-16
Sach-Khas Hydro
Electric Project
267 Himachal Pradesh L&T Himachal
Hydropower Limited
Reoli-Dugli Hydro
Electric Project
430 Himachal Pradesh L&T Himachal
Hydropower Limited
Detailed Project
Report submitted
Total 870
Thermal Power Projects – Nabha Power Limited (NPL)
NPL owns and operates a 2X700 MW supercritical thermal power plant at Rajpura, Punjab. Entire power
generated from this plant is sold to Punjab State Power Corporation Limited (PSPCL) for a period of twenty
five years under a Power Purchase Agreement (PPA). The plant is built on super critical technology of
Mitsubishi, Japan. It is the first ‘made in India’ supercritical power plant to be commissioned and operational
in the country.

213
The plant sources its fuel from South Eastern
Coalfields Ltd. (subsidiary of Coal India Limited)
under a 20-year Fuel Supply Agreement (FSA).
NPL also secured approvals to arrange coal from
alternative sources to make up for any shortage
in supply of coal under the FSA. Bhakra-Nangal
distributary is the perennial source of water
for the plant under an allocation by the State
Government. The plant is operated by an in-house
team of experienced operations and maintenance
professionals.
The power plant has been running successfully for
over three years with an availability of 93% during
2016-17. NPL has been the most reliable source of
power for the state of Punjab and has supported
its requirements with uninterrupted supply during
peak season.
NPL also happens to be the lowest cost power
producer within Punjab with benchmark
operational efficiency.
Business Environment
Growth in demand for power during 2016-17
remained muted with all India Plant Load Factor
(PLF) hovering at 60%. Thermal Power Generation
continues to contribute 80% of the overall Power
requirement in India. Renewables sector also made
an impact where record low solar (` 3.3/kWh) and
wind tariffs (` 3.46/kWh) discovered via auction
route brought renewable closer to grid parity with
thermal.
Coal India Limited(CIL) increased e-auction quota
by way of reducing allocation to improve returns.
Third Party Sampling and testing through CIMFR
(Central Institute of Mining and Fuel Research)
has been operationalized for the rail mode to
mitigate the grade slippage issue in linkage coal.
Domestic Coal prices are expected to go up as the
Government is considering a revision in royalty on
coal and lignite.
Significant Milestones & Initiatives
• 93.06% availability achieved
• Reduced oil consumption to 0.12 ml/kwh
• Overhaul Operational efficiency measures
implemented & monitored to improve efficiency
• Unit Start-up procedure further optimised to
reduce cost and time
• Reliability Centred Maintenance approach
implemented
• In house workshop established to optimise cost
through reverse engineering
• Performance linked allocation made for
improvement in coal quality
• Reduction in interest cost through reduction
in borrowing and lower interest rate achieved
through iterative financing
• NIL availability loss on account of shortage of
Coal
• 99% of dry fly ash disposal achieved – received
runners up award for Fly Ash Utilisation by
Mission Energy Efficiency
• Awarded the best Thermal Plant Award by
Bureau of Energy Efficiency
• CSR initiatives focussing on development of
village infrastructure, education, skill building,
gender equality, health and environment were
implemented during the year
First supercritical coal-fired power project (full EPC) by L&T for Nabha Power Ltd. at Rajpura in Punjab.
214
L&T-PDL is committed to generate reliable and
environment friendly power under safe working
conditions. A policy on Quality, Environment,
Health and Safety has been put in place. Emphasis
is laid on continual improvement of our processes
and practices to achieve improved environmental,
health and safety performance. Training on HSE
for employees and stake holders is undertaken on
a regular basis to foster a culture of health and
safety.
On the Human Resources front, L&T-PDL has built a
committed team of 270 professionals experienced
in the field of operations and maintenance of
power plants. Special emphasis is given to training
and development of the workforce through various
training programs. In addition to the competency
building programs the company also focusses on
soft skills and leadership development.
Outlook
Lower per capita consumption continues to
promise robust long term demand. On the fuel
side coal production capacity is expected to further
increase to cater to the requirements. Punjab is
expected to witness a flat growth in demand for
electricity during 2017-18. NPL is likely to remain
the lowest cost power producer amongst the IPPs
in the state which shall translate into a plant load
factor in 2017-18 at ~77%.
L&T-PDL has embarked on a five year strategic plan
under the ‘Lakshya 2021’ program of the group.
Major focus areas for L&T-PDL during 2017-18
would be maximising plant availability, improving
operational efficiency, enhancing fuel quality,
resolving the regulatory issues, cost management
and HSE compliance.
Increasing global warming triggered awareness
and need for long-term sustainable energy
security has renewed the focus on the cleanest
traditional power source hydro power. Accordingly,
Government is considering policy initiatives for
revival of hydro power sector. L&T-PDL expects
that approval and timely implementation of
these initiatives by the Government in the near
future may positively impact the hydro-power
development in the country.
Focus area for hydel business would be expediting
construction activities at its Singoli-Bhatwari hydel
project.
Marine Infrastructure Developer Private
Limited: Kattupalli Port
Kattupalli Port at Chennai is a container Port with
capacity to handle 1.2 million TEUs per annum.
It has a container terminal with two container
berths, and has been accorded SEZ status. The
port complex was earlier housed within L&T
Shipbuilding Limited. In 2016-17, the business
was demerged into a separate company Marine
Infrastructure Developer Private Limited.
During the year 2015-16, the Company (L&T)
entered into an agreement with Adani Group (a
port operator) to demerge the port business and
divest the stake in the resulting company. The
Company is in an advanced stage of divesting
its ownership in the container port to a strategic
investor, and has demerged that business into a
separate company to facilitate the divestment. It
is planned to complete the transfer of the port
ownership in entirety in 2017-18.

215
I. L&T CONSOLIDATED
A. PERFORMANCE REVIEW
L&T continued to perform well during the financial year 2016-17 despite challenging business environment. Domestic investment climate remained sluggish and customers have been deferring capex spending in the business segments where L&T predominantly operates. The financial year 2016-17 was also marked by a few major policy developments including demonetization which led to disruption of business for a few months. The government has remained focused on structural reforms and we expect this to improve India’s long-term growth potential. On the global front, uncertainties amplified as developed economies were supportive of protectionist policies and Middle East countries continued to face fiscal constraints on the face of soft oil prices. The business environment remained competitive with both domestic and international competitors looking to increase business in India which is still one of the fastest growing economies.
The Company recorded satisfactory performance during the year with its presence in diverse sectors, turnaround in some of its businesses, focus on containing working capital and better funds management. As a part of L&T’s goal of maximising shareholder value creation, the Company successfully listed two of its subsidiaries, Larsen & Toubro Infotech Limited and L&T Technology Services Limited during the course of the year. The Company also exited the general insurance business. The Company is in an advanced stage of divesting its ownership in a container port in Tamil Nadu to a strategic investor and has demerged that business into a separate company in 2016-17 to facilitate the divestment.
As at March 31, 2017, L&T Group comprises of 89 subsidiaries, 10 associates, 34 joint venture companies and 27 joint operations. Most of the group companies are strategic extensions of the project and product businesses of L&T. Project business catering to the hydrocarbon sector is housed in a separate group of companies to provide the business with focus and independent functioning. Majority of the subsidiaries support L&T’s core businesses and enable access to new geographies, products and business segments. Certain distinct service businesses such as Information Technology, Technology Services, Developmental Projects and Financial Services are housed in separate subsidiary and joint venture companies of L&T.
The Financial Statements for the year 2016-17 have been prepared in compliance with the new set of Indian Accounting Standards (IND AS) and the comparatives
for the corresponding previous year 2015-16 have been restated under IND AS for making items comparable. The reserves as on 1-4-2015 have been restated under IND AS. Up to FY 2014-15, the Financial Statements were prepared under previously notified accounting standards usually referred to as I-GAAP (Indian Generally Accepted Accounting Principles).
Order Inflow & Order Book
L&T Group achieved order inflow of ` 142995 crore during the year 2016-17, growing at 5.1% over the previous year. Domestic order grew by 9.5% while international order inflow declined by 4.3% y-o-y. International orders at ` 41507 crore constituted 29% of the total order inflow during the year. Middle East continues to be the key region for the Company and a large proportion of Order Inflows were obtained from that Region. Generally lower oil prices have, however, imposed fiscal hurdles on policy makers in Middle East countries and they have responded with reduced allocations on infrastructure spending, which still provide a good opportunity basket for the Company. In India, government spending did not gain momentum as expected in the areas of defence, hi-tech manufacturing and infrastructure development. Capital allocation from Indian private sector is still lacking due to a significant under-utilisation of existing capacities, diminishing returns, financial stress on account of higher debt levels and uncertain global business outlook.
Order inflow improved in Hydrocarbon and Heavy Engineering segments on the back of a few large orders. Infrastructure segment saw a decline of 7.5 % in the order inflow due to order deferrals especially in Buildings & Factories space that witnessed weak demand and cash flow crunch. A lower level of order inflows from the Middle East also contributed to the decline. Infrastructure segment with its order intake of ` 78492 crore, however, remains a major contributor to the total consolidated order inflow for the year.
Financial Review 2016-17

216
L&T continues to carry a robust order book of ` 261341 crore as at March 31, 2017 that is higher by 4.9% as compared to the previous year. This gives multi-year revenue and margin visibility to the Company. Composition of international order book declined to 26.7% as at March 31, 2017 as compared to 28.2% in the previous year, mainly arising from contraction of infrastructure spends in the Middle East.
Infrastructure segment contributed 74% of the consolidated order book, comprising mainly Building & Factories 18.3%, Transportation Infrastructure business 14.6%, Heavy Civil Infrastructure 17.0%, Power Transmission & Distribution 13.0% and Water & Effluent Treatment 10.1%.
Revenue from Operations
L&T Group achieved a revenue of ` 110011 crore during the year with a growth of 7.9% y-o-y. Revenue from international operations stood at 34.2% as compared to 32% in the previous year.
The increase in revenue was achieved despite disruption in business operations for a few months due to the demonetization exercise undertaken by the Government. The increase was largely contributed by Infrastructure, Hydrocarbon and Power segments supported by project execution. Delayed payments and approvals, workfront non-availability, challenges to the right of way and customer clearances impacted the revenue accrual in Building & Factories and Power Transmission & Distribution businesses. Heavy Engineering, Electrical & Automation recorded muted revenue growth due to deferral of anticipated orders and lackluster industrial demand. Service oriented businesses housed in Financial Services group and Information Technology & Technology Services group, however, continue to perform well adding to overall growth momentum of the Company.
Operating Cost and PBDIT
Manufacturing, Construction and Operating (MCO) expenses increased by 7.8% y-o-y at ` 78039 crore, broadly in line with revenue growth. These expenses mainly comprise cost of construction material and other raw materials, subcontracting expenses, manpower costs of Information Technology & Technology Services Segment and interest expense of Financial Services business.
Staff expenses for the year 2016-17 at ` 13853 crore increased by 3.9% as compared to the previous year mainly due to increased international operations. The increase in staff cost expenses were contained through manpower rationalization, increased productivity and substitution of natural attrition through automation measures. The Company continues to lay focus on

217
speedier and cost effective operations through higher levels of automation.
Sales and administration expenses increased by 22.0% y-o-y to ` 7044 crore mainly due to higher provisioning by Financial Service business and increase in warranty provisions for projects entering defect liability period.
The Group operating profit grew by 5.8% y-o-y at ` 11075 crore for the year 2016-17, however, the EBITDA margin for the year declined by 20 basis points to 10.1%. Impairment losses provided on a few commercial ships, lower margins recorded by Infrastructure segment on account of extended stay in a few jobs and increase in the provision for doubtful loans and non-performing assets by Financial Services had adverse impact on the total operating margin for the year 2016-17, as compared with the previous year.
Depreciation & Amortization charge
Depreciation and amortization charge for the year 2016-17 was higher by 32.6% at ` 2370 crore as compared to ` 1787 crore in previous year. Apart from increase in the depreciation on additions to the fixed assets, impairment of capitalized borrowing costs in the assets of L&T Seawoods has resulted in increase in the depreciation charge for the year.
Other Income
Other income mainly consists of the profit on sale of liquid investments, interest and dividend income from treasury investments. Higher treasury income led by deployment of surplus funds generated through operations as well as through divestment of stake in subsidiaries resulted in boosting other income during the year at ` 1401 crore as compared to ` 904 crore in the previous year.
Finance cost
The interest expense for the year 2016-17 at ` 1340 crore was lower by 19% in comparison to ` 1655 crore for the previous year. Refinancing/repayment of loans and lower exchange loss attributable to interest cost resulted in reduction of the average borrowing cost for the year 2016-17 to 7.2% as compared to 9.0% in the previous year.
Exceptional Items
Exceptional items of ` 121 crore in the Statement of Profit & Loss in current year mainly represent gain on divestment of stake in L&T General Insurance reduced by provision for impairment of road concessions portfolio housed in L&T-IDPL.
Tax Expense
Income Tax charge for the year has declined to ` 2007 crore compared to ` 2485 crore in previous year mainly on the back of higher investment led tax incentive, variations in Dividend Distribution Tax applicable on Dividends from subsidiaries and tax impact on merger of some subsidiaries of L&T Finance Holdings Ltd.
Profit after Tax & EPS
Consolidated Profit after Tax (PAT) at ` 6041 crore for the year 2016-17 rose by 42.7% over the previous year.
Consolidated Earnings per Share (EPS) including exceptional items for the year 2016-17 at ` 64.80 is higher by 42.5% over the previous year.
Net Worth, Capital employed and Returns
The Net Worth of the shareholders at ` 50217 crore as at March 31, 2017 increased by ` 6037 crore as compared to the position as on March 31, 2016. Return on Net Worth (RONW) for the year 2016-17 was higher at 12.8% as compared to 9.9% in the previous year driven by significant increase in the net earnings. Capital employed increased to ` 77458 crore as compared to ` 72729 crore as at March 31, 2016.
Liquidity & Gearing
Cash flow from operations increased significantly to ` 11979 crore as compared to ` 7345 crore in the previous year mainly driven by healthy operational performance coupled with better working capital management. Cash flow is further improved by Company’s divestment activities mainly in Technology businesses viz. Larsen & Toubro Infotech Limited and L&T Technology Services Limited. The Company deployed its surplus funds in current investments which in turn, led to increase in treasury income during the year.

218
Infrastructure segment clocked gross revenue of ` 53921 crore for the year 2016-17 registering 6.7% growth over the previous year. Execution of orders in hand by Building & Factories was adversely affected due to the demonetization exercise undertaken by the Government. Execution impediments by way of customer clearances, workfront availability and right of way issues also adversely affected execution progress in some jobs of Building & Factories, Heavy Civil, Power Transmission & Distribution and WET (Water & Effluent Treatment) businesses leading to muted growth for the segment as a whole.
Revenue from international operations constituted 32.8% of the total revenues of the segment during the year as compared to 28.8% in the previous year. The increase was mainly on the back of a robust opening order book position in the beginning of 2016-17 led by Transportation Infra, Heavy Civil and Power Transmission & Distribution.
Infrastructure Segment operating profit was lower by 2.2% y-o-y at ` 5372 crore for 2016-17. Operating margins declined by 100 basis points at 10.2% during the year 2016-17 owing to cost overruns due to extended stay in a few jobs.
The Group incurred capital expenditure of ` 2822 crore during the year mainly attributable to L&T Hyderabad Metro Rail project. There was a net decrease of ` 22 crore in the cash balances as at March 31, 2017 as compared to the beginning of the year.
Fund Flow Statement ` crore
Particulars FY 16-17 FY 15-16
Operating activities 11979 7345
Borrowings (net of repayments) (671) (69)
Net (investment)/ divestment * 3 204
Payment (to)/from minority interest (net) 2059 971
Treasury and dividend income 1158 615
Others 53 70
Sources of Funds 14581 9136
Capital expenditure (net) (2822) (4123)
(Purchase)/Sale of other investments (8079) (1322)
Dividend paid (2093) (1842)
Interest paid (1565) (2462)
(Increase)/Decrease in cash balance (22) 613
Utilisation of Funds (14581) (9136)
*This includes (investment)/divestment of long term investments, consideration received on sale of stake in subsidiaries/ joint ventures and net cash flows on loans/deposits made with associate companies and third parties
The total borrowings as at March 31, 2017 stood at ` 93976 crore as compared to ` 88135 crore as at March 2016. The gross Debt Equity ratio is 1.75:1 as at March 31, 2017 as compared to 1.87:1 as at March 31, 2016.
B. SEGMENT WISE PERFORMANCE (GROUP)
1. Infrastructure Segment
Infrastructure segment bagged fresh orders worth ` 78492 crore for the year 2016-17, lower by 7.5% over the previous year. The segment witnessed an elongation of bid-to-award timelines in the domestic market and a reduced opportunity in the Middle East arising out of fiscal policy measures in those countries. New projects for commercial buildings did not gain traction during the year. Residential buildings prospects received major set-back due to liquidity constraints aggravated by demonetisation. Competition remained intense and some bids were lost to competitors on price. Order inflow growth was realised in Heavy Civil Infrastructure and Smart World & Communication businesses which mitigated the decline in order inflows of other businesses within the Infrastructure segment.
International order wins, led by Power Transmission & Distribution business, constituted 18.7% of the total international order inflows during the year.
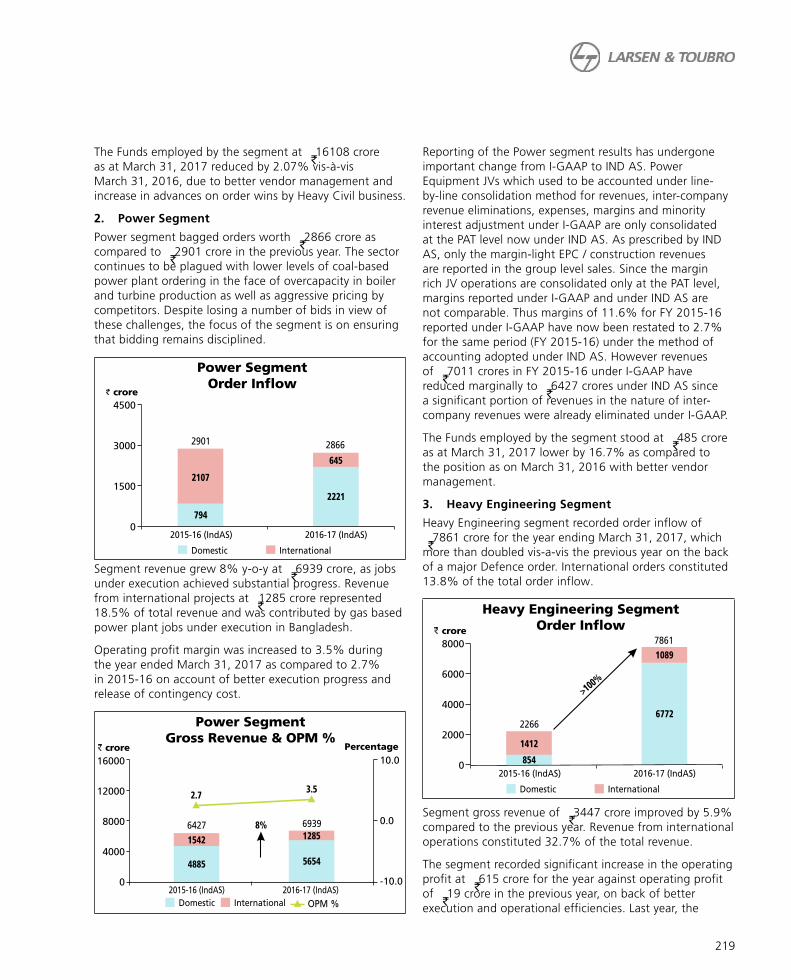
219
The Funds employed by the segment at ` 16108 crore as at March 31, 2017 reduced by 2.07% vis-à-vis March 31, 2016, due to better vendor management and increase in advances on order wins by Heavy Civil business.
2. Power Segment
Power segment bagged orders worth ` 2866 crore as compared to ` 2901 crore in the previous year. The sector continues to be plagued with lower levels of coal-based power plant ordering in the face of overcapacity in boiler and turbine production as well as aggressive pricing by competitors. Despite losing a number of bids in view of these challenges, the focus of the segment is on ensuring that bidding remains disciplined.
Segment revenue grew 8% y-o-y at ` 6939 crore, as jobs under execution achieved substantial progress. Revenue from international projects at `1285 crore represented 18.5% of total revenue and was contributed by gas based power plant jobs under execution in Bangladesh.
Operating profit margin was increased to 3.5% during the year ended March 31, 2017 as compared to 2.7% in 2015-16 on account of better execution progress and release of contingency cost.
Reporting of the Power segment results has undergone important change from I-GAAP to IND AS. Power Equipment JVs which used to be accounted under line-by-line consolidation method for revenues, inter-company revenue eliminations, expenses, margins and minority interest adjustment under I-GAAP are only consolidated at the PAT level now under IND AS. As prescribed by IND AS, only the margin-light EPC / construction revenues are reported in the group level sales. Since the margin rich JV operations are consolidated only at the PAT level, margins reported under I-GAAP and under IND AS are not comparable. Thus margins of 11.6% for FY 2015-16 reported under I-GAAP have now been restated to 2.7% for the same period (FY 2015-16) under the method of accounting adopted under IND AS. However revenues of ` 7011 crores in FY 2015-16 under I-GAAP have reduced marginally to ` 6427 crores under IND AS since a significant portion of revenues in the nature of inter-company revenues were already eliminated under I-GAAP.
The Funds employed by the segment stood at ` 485 crore as at March 31, 2017 lower by 16.7% as compared to the position as on March 31, 2016 with better vendor management.
3. Heavy Engineering Segment
Heavy Engineering segment recorded order inflow of ` 7861 crore for the year ending March 31, 2017, which more than doubled vis-a-vis the previous year on the back of a major Defence order. International orders constituted 13.8% of the total order inflow.
Segment gross revenue of ` 3447 crore improved by 5.9% compared to the previous year. Revenue from international operations constituted 32.7% of the total revenue.
The segment recorded significant increase in the operating profit at ` 615 crore for the year against operating profit of ` 19 crore in the previous year, on back of better execution and operational efficiencies. Last year, the

220
operating profit was adversely impacted on account of cost and time overruns on a few jobs which were also partly contributed by a prolonged labour strike at the Company’s facility in Hazira.
Funds employed by the segment decreased by 21.9% y-o-y at ` 1297 crore as at March 31, 2017 on account of lower construction work- in-progress and inventory.
4. Electrical & Automation Segment (E&A)
E&A segment faced a difficult business environment in 2016-17 due to a prolonged period of low offtake from industrial sector even though sales from agricultural sector were strong due to a good monsoon in 2016. The business thus recorded gross revenue of ` 5367 crore for the year with a marginal drop of 0.6% compared with the previous year. Revenue from international operations constituted 29.4% of the total revenues of the segment during the year as compared to 31.4% in the previous year.
Segment operating profit for the year improved to 15.10% y-o-y to ` 702 crore. Operating margins improved by 260 basis points during the year 2016-17 owing to favourable product mix and improved operational efficiencies.
Funds employed at ` 2429 crore decreased by 9.9% y-o-y aided by higher provisions and taxes.
5. Hydrocarbon Segment
The Hydrocarbon segment registered a turnaround in 2016-17 in terms of Order Inflows, Revenues and margins. This was achieved through stronger execution processes, close out of challenging legacy jobs in the Middle East, forging deeper customer relationship, manpower rationalization, cost containment measures and resolute attention to control on Working Capital. The segment secured fresh orders aggregating to ` 18525 crore during the year registering a steep growth of 81% y-o-y driven by large size international EPC orders. Consequently, International orders accounted for 66.8% of total order inflow for 2016-17 as compared to 31.4% in previous year.
Segment revenue grew by 11.7% y-o-y at ` 9628 crore for the year as jobs under execution progressed. International revenue contributed 48.6% of the total revenue of the segment as compared to 45.3% in the previous year.
Focused attention to costs and close out of challenging legacy projects in the Middle East resulted in an operating profit of ` 657 crore as compared to ` 53 crore in the previous year and consequent margin improvement.

221
Funds employed by the segment at ` 1139 crore as at March 31, 2017 decreased by 27.7% as compared to March 31, 2016 aided by liquidation of old customer outstanding, receipt of customer advances and favourable WIP in projects under execution.
6. IT & Technology Services (IT & TS)
IT & TS segment comprises L&T Infotech group of companies and L&T Technology Services group of companies. During the year, these companies have been listed. Segment recorded gross revenue of ` 9888 crore for the year ended March 31, 2017 with growth of 9.7% over the previous year. International revenue constitutes 93% the total revenue of the segment.
The Segment Operating profit stood at ` 2063 crore for the year 2016-17 as compared to ` 1816 crore in the previous year. Operating margin improvement of 70 basis points is on account of higher manpower utilization.
The Funds employed by the segment at ` 4272 crore as at March 31, 2017 is higher by 58% as compared to March 31, 2016 due to increase in unbilled revenue & investments.
7. Financial Services (FS)
Financial Services segment comprises of Rural, Wholesale and Housing Finance as well as Investment and Wealth Management businesses housed within L&T Finance Holdings Limited (LTFH) and its subsidiaries. The segment also included general insurance business which was divested during the year ended March 31, 2017. Excluding the general insurance business, Segment revenue grew 13.1% y-o-y at ` 8377 crore during the year ended March 31, 2017 on a comparable basis aided by good momentum in all its businesses.
Disbursal of fresh Loans and Advances in the Focus businesses, namely Rural, Wholesale and Housing Finance, amounted to ` 49305 crore during the year ended March 31, 2017, a growth of 29% y-o-y. In line with the disbursements, Asset Book in focused lending businesses stood at ` 63978 crore as at March 31, 2017 recording a growth of 20% y-o-y. Net interest margins at 5.86% remained stable.
The Gross Non-Performing Assets (GNPA) ratio increased marginally from 4.85% as at March 31, 2016 to 4.94% as at March 31, 2017. LTFH, however, has been strengthening its balance sheet throughout the year by making accelerated provisions in addition to those required under regulations. Consequently, the coverage on GNPA increased from 22.19% in the year ended March 31, 2016 to 42.82% in the year ended March 31, 2017 indicating a much stronger balance sheet. As a result of this, Net NPA ratio has reduced substantially from 3.82% to 2.89% over the same period.
LTFH also witnessed strong growth in its Investment & Wealth Management businesses. Average Assets under

222
Management (AAUM) in Investment Management business increased to v 39300 crore in the last quarter of the year ended March 31, 2017 – a growth of 51%. Average Assets under Service (AAUS) in Wealth Management business increased to v 13623 crore in last quarter of the year ended March 31, 2017 – a growth of 46%.
8. Developmental Projects (DP)
The Group has acquired concessions through competitive bidding process for the development of Power projects, Roads, Bridges, Hyderabad Metro Rail and Power Transmission Lines. Total portfolio of the group consists of 5 power projects, 15 roads & bridges projects, 1 transmission line project, 1 port & 1 metro rail project. The metro rail project is developed by L&T Metro Rail (Hyderabad) Limited (L&T MRHL) which is now a 100% subsidiary of L&T. Power projects are developed by L&T Power Development Limited & other projects are developed by L&T Infrastructure Development Projects Limited. The total estimated cost of projects pegged at v 52609 crore as on March 31, 2017, involving equity commitment of v 11106 crore of which equity infusion of v 8757 crore has been completed as at March 31, 2017. In addition, the company is in the process of divesting its ownership in a container port in Kattupalli, Tamil Nadu to a strategic investor and has demerged the port business into a separate company in 2016-17 to facilitate the divestment.
The segment recorded revenue of v 4367 crore for the year ended March 31, 2017 lower compared to v 4620 crore in the previous year due to lower construction revenue in Hyderabad Metro project partly compensated by higher revenue from Rajpura power plant.
The segment clocked operating profit at v 90.8 crore for the year 2016-17 declining by 69.4 % y-o-y due to non-accrual of revenues on disputed receivables in Rajpura power plant.
The Funds employed increased by 15.2% y-o-y at v 19309 crore as at March 31, 2017 driven mainly by capex outlay for Hyderabad Metro Rail project.
9. “Others” Segment
Others Segment covers Metallurgical and Material Handling (MMH), Realty, Shipbuilding, Construction Equipment & Others, Machinery & Industrial products businesses.
MMH segment, which was reported as a separate segment last year, has now been merged under the Others segment. Accordingly figures are regrouped wherever necessary.
Revenue growth during the year was driven by MMH and Realty businesses. The operating margin was adversely impacted on write down of the inventories of commercial ships.
II. L&T STANDALONE
PERFORMANCE REVIEWL&T’s standalone financials capture the performance of Infrastructure segment, Power, Heavy Engineering, Electrical & Automation and Others segment comprising, Metallurgical and Material Handling business, a part of Realty business, Shipbuilding business and Construction & Mining Machinery business.
L&T’s performance during the year reinforces the capabilities of the Company to tackle the adverse market conditions and generate steady returns. L&T continues to target operating margin improvement by adopting value engineering and operational excellence initiatives, higher cash flow generation through working capital reduction and divestment of non-core assets.
Order Inflow & Order BookOrder inflow during 2016-17 stood at v 93201 crore almost in line with previous year. Infrastructure segment

223
order inflow remained at the same levels as previous year and contributed 82.1% of the total order inflow during the year as compared to 84.3% in the previous year. Heavy Engineering reported strong order inflow led by select wins in defence sector. Sharp drop was seen in Power due to slowdown in the sectoral investment momentum and aggressive bidding by competitors for the few bids on offer, and in Others segment due to low industrial demand. International order inflow declined to 16.4% of the total order inflow for 2016-17 as compared to 23.4% in the previous year.
Order Book as at March 31, 2017 stood at ` 224715 crore, 83.9% of which is contributed by Infrastructure segment. International orders constituted 19.9% of the current order book. L&T continues to carry healthy order book to revenue ratio at 3.39 providing visibility for achieving satisfactory growth in coming years.
Revenue from Operations
L&T achieved a moderate revenue growth of 3.9% at ` 66301 crore as compared to ` 63813 crore in the previous year. Infrastructure segment was particularly affected in a backdrop of tight liquidity consequent to currency demonetization event in India. Revenue was also impacted due to delay in customer clearances, availability of workfront, right of way issues and generally delayed milestone payments.
Power and Heavy Engineering segment saw a revenue growth of 8.0% and 13.5% respectively led by pick up in project execution. Electrical & Automation business and Others business segment grew merely by 2.3% and 3.5% respectively due to continuing low industrial demand.
Operating Cost and PBDIT
Manufacturing, Construction and Operating (MCO) expenses comprising cost of construction material, manufacturing materials, components and subcontracting
expenses amounted to ` 51990 crore registering an increase of 3.6%. These costs represent 78.4% of Revenue, a decline of 21 basis points over the previous year. Reduction in MCO cost percentage to revenue is mainly driven by change in the stage and mix of projects under execution.
The Staff expenses for the year at ` 5146 crore increased by 3.5% y-o-y due to annual pay revisions, manpower additions in international operations. The Company’s manpower strength stood at 41080 as compared to 42780 as at March 31, 2016.
Sales and administration expenses for the year at ` 2740 crore declined by 3.5% y-o-y due to lower provision for doubtful debts & advances and reduction in exchange losses.
The operating profit margin for the year at 9.7% improved by 56 bps y-o-y. Consequently, Profit before depreciation, interest and tax (PBDIT) stood at ` 6425 crore for the year, higher by 10.2% over the previous year.
Depreciation & Amortization charge
Depreciation and amortization charge for the year 2016-17 increased by 21.8% at ` 1215 crore as compared to ` 997 crore in the previous year. The increase is mainly attributable to international operations of Infrastructure segment.
Other Income
Other income for the year 2016-17 amounted to ` 1972 crore as against ` 2341 crore for the previous year. The decline is mainly on lower dividend from group companies. However, the same is partly offset by higher treasury income aided by better investment positioning along with deployment of additional funds generated by listing of two subsidiaries on stock exchanges.

224
Other Income consists of dividend from group companies ` 405 crore (PY ` 1008 crore) and treasury income ` 1047 crore (PY ` 502 crore).
Finance cost
The interest expenses for the year at ` 1318 crore were lower by 10.8% vis-à-vis ` 1477 crore for the previous year. The decrease in the interest expense is attributable to repayment of borrowings along with lower borrowing rates. The average borrowing cost for the year 2016-17 was lower by 80 basis points at 8.3% p.a.
Exceptional Items
Exceptional items of ` 894 crore in the Statement of Profit & Loss for the current year mainly includes gain on part stake-sale in L&T Infotech and L&T Technology Services pursuant to the IPO of these companies partly offset by loss on stake sale in L&T General Insurance.
The Company has provided for impairment in its investment in L&T Infrastructure Development Projects Limited that holds portfolio of non power concessions.
Profit after Tax & EPS
Profit after Tax (PAT), including exceptional items, for the year 2016-17 grew by 9.1% to ` 5454 crore as compared to ` 5000 crore in the previous year, contributed by increase in operating profit, higher treasury income and lower interest expenses. The Earnings per Share (EPS) for the year 2016-17 at ` 58.49 grew by 8.9% over the previous year.
Other comprehensive income (OCI)
Other Comprehensive income as on March 31, 2017 amounted to ` 157 crore as compared to ` 83 crore in the previous year. OCI mainly comprises the gain on hedges taken towards foreign currency and interest risk exposures.
Funds Employed and Returns
Funds Employed by the Company at ` 56308 crore as at March 31, 2017 increased by ` 404 crore during the year.
The Company incurred ` 635 crore (net) towards capital expenditure during the year, largely on procurement of plant and equipment.
At the segment aggregate level, net working capital as on March 31, 2017 at ` 14014 crore decreased to 21.14% of revenue as compared to ` 15286 crore at 23.95% of revenue as on March 31, 2016. Release in working capital is attributable to improved collections and better credit terms negotiated with vendors.
During the year, investments in and loans to subsidiary and associate companies decreased by ` 1306 crore (net of proceeds from divestment). Major reduction was seen in L&T Shipbuilding – port business, General Insurance and Hydrocarbon business. However, additional funding was done in Hyderabad Metro and Nabha Power.
Return on Net Worth (RONW) including the exceptional items for the year 2016-17 is 12.4% in line with the previous year. Return on Capital Employed (ROCE) for the year 2016-17 at 11.3% is higher as compared to 11.1% of the previous year. Capacity underutilization in some of the capital intensive businesses continues, resulting in lower returns.
Liquidity & Gearing
Business operations generated cash flows of ` 6147 crore during the year significantly higher than ` 3300 crore in the previous year mainly supported by release of working capital. Dividend and treasury income flows contributed ` 1896 crore to the cash along with divestment proceeds of ` 1306 crore. The Company used cash flows mainly for repayment of borrowings ` 3110 crore, and parked surplus funds in current investments ` 2535 crore.

225
Fund Flow Statement ` crore
Particulars 2016-17 2015-16
Operating activities 6147 3300
Divestment / (Investment) in Group Cos 1306 (1820)
Dividend from group companies and Treasury income 1896 1568
Others 53 70
Sources of Funds 9402 3118
Borrowings (net of repayments )/ (Repayments) (3110) 321
Sale/(purchase) of investments (2535) (473)
Capital Expenditure (635) (797)
Interest paid (1153) (1209)
Dividend Paid (1843) (1647)
(Increase) / decrease in cash balance (127) 687
Utilisation of Funds (9402) (3118)
The total borrowings as on March 31, 2017 stood at ` 10581 crore as compared to ` 13924 crore in the previous year. The loan portfolio of the Company comprises a mix of domestic and suitably hedged foreign currency loans. The gross debt equity ratio decreased to 0.23:1 as at March 31, 2017 from 0.33:1 as at March 31, 2016. The Company has nil net debt considering the cash & cash equivalent and short term investments in liquid funds from debt.
III. RISK MANAGEMENT
L&T has a comprehensive Enterprise Risk Management (ERM) framework in place for identification, assessment, treatment & reporting of risks. The Company’s risk management processes ensure that the Company accepts risks as per the boundary conditions based on the risk appetite of the organisation. The Audit Committee of the Board oversees the efficacy of the risk management processes. Business level risks for each vertical are discussed in detail in the respective Top Management/Board meetings. The Risk Management Committee is informed on the critical risks impacting the Company for their review and suggestions. Mitigation plans are drawn up and implemented as appropriate within the overall ERM framework of the Company.
The Company is predominantly in project business and has developed robust project risk management processes. The key processes of risk reviews include country clearance in case of venturing into a new country, pre-bid risk reviews, execution risk reviews and project close out risk reviews. Pre-bid reviews are carried out based on a bid authorization matrix as determined by the Risk
Management Committees. Execution risk reviews of the projects are held at regular intervals for tracking the project performance, movement of risks in the project and effectiveness of mitigation measures. Close out risk reviews are held to capture key learnings from the projects and what went right/wrong analysis which helps in factoring the learnings in future bids.
The Company has been conferred the prestigious ‘Golden Peacock Award for Risk Management’ for 2016 by the Institute of Directors (IoD). L&T also has been conferred the prestigious ‘Best Capital Projects & Infrastructure Risk Management Award’ at the India Risk Management Awards event organized by CNBC TV18.
The Company emphasizes on continuous learning and has initiated several knowledge based initiatives to improve risk awareness across the organization including the launching of an e-learning training program on Enterprise Risk Management (ERM) for employees to disseminate knowledge and enhance capabilities on risk management which will lead to better business performance. Periodic training workshops on risk management are also held across the Company to spread awareness.
Other initiatives include Risk Management Conclaves for Risk Officers and senior management with focus on risk management of large and mega projects, interaction with industry experts and knowledge sharing with risk management heads of global corporates.
The top Enterprise level risks for the Company and the mitigation measures being implemented are:
Geopolitical Risks: Unexpected Political changes in some of the Developed Countries, BREXIT, Trade barriers and increasing conflict in Middle East are some of the risks that the Company faces. The Company monitors the geopolitical risks & develops appropriate mitigation strategies from time to time.
Slow recovery of key sectors: Growth in some of the sectors like Power, Nuclear, and Metals & Minerals etc. continued to be hampered by a number of constraints. Being a diversified conglomerate Diversification of the business portfolio smoothens the inherent cyclicality that individual sectors periodically face and mitigates volatility in revenue and margins at the company level.
Fall in oil price: It has resulted in budget constraints in Middle Eastern Countries leading to decline/delay in investment with some projects being put on hold. The Company has started focusing on domestic business and selectively foraying into new markets like Bangladesh, Srilanka, Africa, CIS & South East Asia.

226
Competition: It has been observed that competition from foreign and domestic players has considerably increased in the past few years. Learnings from past execution of complex jobs, Joint Ventures and alliances with other global players to leverage each others strengths, and other operational excellence measures like value engineering, cost control, manpower rationalization and cost reduction through automation of process are some of the key mitigation measures that the Company takes to remain competitive in different businesses.
Reputation and Brand: Corporate Governance and Compliance policy is in place mandating adherence to Code of conduct and Internal Controls. Regular knowledge sharing across the organisation and appropriate controls are implemented to mitigate reputational risk.
Other Operational Risks:
Execution challenges: Company faces execution challenges like geological setbacks, availability of work front, land acquisition & right of way (ROW), pending approvals and clearances from Government agencies, working in difficult/harsh weather conditions and terrain, manpower issues etc. The Company closely tracks the key risks for each project to effect timely mitigation.
Partner risks: The Company partners with different contractors (Joint Venture / consortium projects) across businesses based on technical requirements/local market conditions. Partner’s performance & financial strength is crucial for project success. Learnings from the past projects are incorporated in the inter-se agreement with the partners and clauses on liability of each partner is drafted after a legal due diligence.
Working capital challenges: Project delays and adverse contractual payment terms lead to increased working capital requirements. Company has strengthened the process for close monitoring of cash flows at the project level. Company ensures regular follow up for delay in payments by client & has ensured improvement in the working capital levels.
Claims management: Company maintains a strong documentation and follow up with clients / sub-contractors / vendors for any claim that is submitted. Legal teams are consulted periodically to ensure a robust process of claims management.
Human resource challenges:
The Company actively scans the environment for talent with skill sets suited to the expanding and changing needs of the business though availability of such resources are limited. The leadership pipeline has been strengthened and proper processes are being put in place for hiring the
best talent. Suitable retention policies are being constantly worked upon to minimize attrition of key resources.
The Company has institutionalized the risk management processes to map & monitor the risks across the businesses and respond effectively to achieve the strategic objectives. The Company has been successful in tapping the opportunities both in domestic and international markets. The Company sees risk management as a business enabler and believes that risk is an integral part of every business and promotes a culture of building the ability to anticipate and manage risks effectively and converting them into opportunities.
Financial Risks
Capital Structure, Liquidity and Interest Rate Risks
The Company continues its policy of maintaining a conservative capital structure which has ensured that it retains the highest credit rating in a tough economic environment. Low gearing levels also equip the Company with the ability to navigate business stresses on one hand and raise growth capital on the other. This policy also provides flexibility of fund-raising options for future, which is especially important in times of global economic volatility. Despite the challenging economic environment in 2016-17, the Company managed to restrain the working capital usage, both at a gross and net level. The Company has been investing capital into subsidiaries as scheduled and in some cases to provide for deterioration in performance caused by the sluggish economic/business downturn and also to optimise overall Group level interest rate costs. The Company plans to maintain adequate liquidity on the Balance Sheet to deal with periods of slow recovery/downturn in economic conditions.
The Company judiciously deploys its temporary surplus funds in short term investments in line with the corporate treasury policy. The Company constantly monitors the liquidity levels, economic and capital market conditions and maintains access to the lowest cost means of sourcing liquidity through banking lines, trade finance and capital markets. The Company further optimized the cost of debt by using subsidized export financing scheme of RBI and issuing Commercial Papers. The Company dynamically manages interest rate risks through a mix of fund-raising products, investment products and derivative products across maturity profiles and currencies within a robust risk management framework.
Foreign Exchange and Commodity Price Risks
The various businesses of the Company are exposed to fluctuations in foreign exchange rates and commodity prices. It also has exposures to foreign currency denominated financial assets and liabilities. The business

227
related financial risks, especially involving commodity prices, by and large, are managed contractually through price variation clauses, while the foreign exchange and residual commodity price risks are managed by an appropriate choice of treasury products for balancing risks and optimising the hedging costs at the same time.
The above risk management activity is carried out under the framework of Risk Management Policy approved by Audit Committee and noted by the Board. Financial risks in each business portfolio are measured and managed centrally within the Company. These risks are reviewed periodically, quantified and managed within the acceptable thresholds as laid out in the Risk Management Policy of the Company under the aegis of the Audit Committee.
The financial year 2016-17 was characterised by a relatively strong USD against developed market currencies post US presidential elections due to potential fiscal expansion which subsequently got subdued in Q4 FY 16-17. The rupee followed broader global trends with an appreciation bias with increased reform momentum in fiscal/monetary policies and political developments during 2016-17. The combination of lower exchange rate volatility with robust financial risk management processes resulted in lower financial cost and input cost volatility.
IV. INTERNAL CONTROLS
The Company believes that a strong internal control framework is an important pillar of Corporate Governance. It has established internal control mechanisms commensurate with the size and complexity of its business. A strong Internal Control framework is established through right tone at the top for good corporate governance which serves as a foundation for excellence and same is embedded in operations through its policies and procedures. Employees of the Company are guided by the Company’s ‘Code of Conduct’. As a part of good governance, the Company’s ‘Whistle Blower’ policy enables the employees to have direct access to the Chairman of the Audit Committee without interference from other levels of management.
From 2016-17, Whistle Blower policy has also been implemented for Vendors & Channel partners as well to facilitate expression of genuine concerns about unethical behaviour, improper practice, any misconduct, any violation of legal or such requirements, actual or suspected fraud by any official of the Company without fear of punishment or unfair treatment. Senior Management and the Audit Committee of the Board is periodically apprised on the internal processes of the Company with respect to Internal Controls, Statutory Compliances and Assurance.
The Company has laid down Internal Financial Controls as detailed in the Companies Act, 2013 and has covered all major processes commensurate with the size of business operations. These have been established at the entity and process levels and are designed to ensure compliance to internal control requirements, regulatory compliance and appropriate recording and reporting of financial and operational information. The Company has reviewed and sustained internal financial controls by adopting a systematic approach to evaluate, control design and operating effectiveness.
The Internal Control Organisation
As the first line of defence, primary responsibility for design, establishment of internal controls and its operating effectiveness lies with Heads of business and support functions in their respective areas of operation. There is a Policy on Internal Controls at Corporate level and individual businesses also have Internal control frameworks and procedures documented in the form of Internal Controls Manuals, Standard Operating Procedures, Accounting Guidelines including regular management reporting and monitoring thereof. Policies and procedures are reviewed periodically for any changes required, to changing business needs as well as improvements in processes to strengthen the internal control systems. Authorisation Matrices for financial transactions are derived based on Board decisions which are delegated to individuals based on business needs within the overall limits of Corporate Authorisation Guidelines. Financial powers are vested based on business requirement and there is no automatic vesting of powers based on designation / grade of an individual.
The Corporate Internal Control (CIC) department is the second line of defence to facilitate and monitor the efficacy of the Internal controls embedded in Operations so as to assist management in establishing strong internal controls. CIC formulates procedures and guidelines for areas of weaknesses which are identified during internal audit or as triggered by process owners or management based on internal or external risk factors. Apart from the internal mechanism to review and monitor internal controls; the Company also periodically engages independent professional firms to carry out review of the effectiveness of various key control processes in businesses and support functions. Their observations and suggestions on good practices are reviewed by the management for implementation and strengthening of the controls.
Corporate Audit Services (CAS) serves as third line of defence which gives assurance on Internal Controls effectiveness by carrying out independent internal audits. CAS is staffed adequately with qualified professionals

228
in both technical and financial fields. The department conducts audit of all units of L&T and its major S&A companies at regular intervals. Based on observations of CAS, respective process owners carry out necessary process/system improvements and thereby strengthen the overall control mechanism. The process of Internal Audit is reviewed by the Management and Audit Committee of the Board.
V. INFORMATION TECHNOLOGY
The Company views Information Technology (IT) as a key enabler for efficiency and providing competitive advantage. IT is accordingly managed through a robust governance process that covers value delivery, cost optimisation, technology management, support and education. The Information Technology systems in the Company form the backbone for carrying out all the business processes, for communication, collaboration and for providing information for effective decision making, monitoring and management control. The Information Systems at Company, implemented and refined over many years are maintained systematically to enhance capability with new features and also to remain current on technology with upgrades. These systems are geared
towards improving productivity and efficiency of all our operations. Over the years, the newer systems help the Company to connect seamlessly with customers, provide better products and services and enable better execution of large projects.
While ERPs are the backbone of our Business, Digitalization is identified as key driver to make the company globally competitive in future. The Company believes that the digital world will disrupt every aspect of business viz project monitoring, machines & material availability, labour & skills tracking, design work flows etc. A number of projects have been identified in almost all areas of business. A separate Big Data Analytics practice has been established with adequate resources. Data from machines and other systems is now getting accumulated in real time to facilitate analysis and decision making.
Upgrade/update to IT infrastructure is being done at regular intervals to meet the growing demand of automation and digitisation. A complete scan of IT security policies, practices and technology is reviewed and a Security ‘Centre of Excellence’ has been commissioned with latest tools and technologies to monitor and meet the phenomenon of growing cybersecurity threats.

229
INDEPENDENT AUDITORS’ REPORT TO THE MEMBERS OF LARSEN & TOUBRO LIMITED
Report on the Standalone Ind AS Financial Statements
We have audited the accompanying standalone Ind AS financial statements of Larsen & Toubro Limited (the “Company”), which comprise the Balance Sheet as at March 31, 2017, the Statement of Profit and Loss (including Other Comprehensive Income), the Statement of Cash Flows and the Statement of Changes in Equity for the year then ended, and a summary of the significant accounting policies and other explanatory information, which includes 25 Joint Operations (herein after referred to as “standalone Ind AS financial statements”).
Management’s Responsibility for the Standalone Ind AS Financial Statements
The Company’s Board of Directors is responsible for the matters stated in Section 134(5) of the Companies Act, 2013 (the “Act”) with respect to the preparation of these standalone Ind AS financial statements that give a true and fair view of the financial position, financial performance including other comprehensive income, cash flows and changes in equity of the Company including its joint operation in accordance with the accounting principles generally accepted in India, including the Indian Accounting Standards (“Ind AS”) prescribed under section 133 of the Act.
The Boards of Directors of the Company and those charged with governance of its joint operation are responsible for maintenance of adequate accounting records in accordance with the provisions of the Act for safeguarding the assets of the Company and its joint operation and for preventing and detecting frauds and other irregularities; selection and application of appropriate accounting policies; making judgments and estimates that are reasonable and prudent; and design, implementation and maintenance of adequate internal financial controls, that were operating effectively for ensuring the accuracy and completeness of the accounting records, relevant to the preparation and presentation of the standalone Ind AS financial statements that give a true and fair view and are free from material misstatement, whether due to fraud or error.
Auditor’s Responsibility
Our responsibility is to express an opinion on these standalone Ind AS financial statements based on our audit.
In conducting our audit, we have taken into account the provisions of the Act, the accounting and auditing standards and matters which are required to be included in the audit report under the provisions of the Act and the Rules made thereunder.
We conducted our audit of the standalone Ind AS financial statements in accordance with the Standards on Auditing specified under Section 143(10) of the Act. Those Standards require that we comply with ethical requirements and plan and perform the audit to obtain reasonable assurance about whether the standalone Ind AS financial statements are free from material misstatement.
An audit involves performing procedures to obtain audit evidence about the amounts and the disclosures in the standalone Ind AS financial statements. The procedures selected depend on the auditor’s judgment, including the assessment of the risks of material misstatement of the standalone Ind AS financial statements, whether due to fraud or error. In making those risk assessments, the auditor considers internal financial control relevant to the Company’s preparation of the standalone Ind AS financial statements that give a true and fair view in order to design audit procedures that are appropriate in the circumstances. An audit also includes evaluating the appropriateness of the accounting policies used and the reasonableness of the accounting estimates made by the Company’s Directors, as well as evaluating the overall presentation of the standalone Ind AS financial statements.
We believe that the audit evidence obtained by us and other auditors in terms of their reports referred to in the Other Matters paragraph below, is sufficient and appropriate to provide a basis for our audit opinion on the standalone Ind AS financial statements.
Opinion
In our opinion and to the best of our information and according to the explanations given to us, and based on the consideration of reports of the other auditors on separate financial statements of joint operations referred to in the Other Matters paragraph below, the aforesaid standalone Ind AS financial statements give the information required by the Act in the manner so required and give a true and fair view in conformity with the accounting principles generally accepted in India, of the state of affairs of the Company as at March 31, 2017, and its profit, total comprehensive income, cash flows and the changes in equity for the year ended on that date.
Other Matters
a) We did not audit the financial statements / information of 16 joint operations included in the standalone Ind AS financial statements of the Company whose financial statements reflect total assets of v 3,647.41 crore as at March 31, 2017, total revenues of v 4,360.69 crore, total profit after tax (net) of v 268.96 crore and total comprehensive income (net) of v 269.03 crore for the year ended on that date, as considered in the standalone Ind AS financial statements. The financial statements of these joint operations have been audited by the other auditors whose reports have been furnished to us, and our opinion in so far as it relates to the amounts and disclosures included in respect of these joint operations and our report in terms of subsection (3) of Section 143 of the Act, in so far as it relates to aforesaid joint operations, is based solely on the reports of such other auditors.
Out of above, there are 7 joint operations which are located outside India whose financial results have been prepared in accordance with accounting principles generally accepted in their respective countries and which have been audited by other auditors under generally accepted auditing standards applicable in their respective countries. The Company’s management has converted the financial statements of such joint
DELOITTE HASKINS & SELLS LLP
Chartered Accountants
Indiabulls Finance Centre, Tower 3
27th – 32nd Floor, Senapati Bapat Marg
Elphinstone Road (West)
Mumbai 400013.
SHARP & TANNAN
Chartered Accountants
Ravindra Annexe
194, Churchgate Reclamation
Dinshaw Vachha Road
Mumbai 400 020.

230
operations located outside India from accounting principles generally accepted in their respective countries to accounting principles generally accepted in India. We have audited these conversion adjustments made by the Company’s management. Our audit report in so far as it relates to the balances and affairs of such joint operations located outside India is based on the reports of other auditors and the conversion adjustments prepared by the management of the Company and audited by us.
b) The comparative financial information of the Company for the transition date opening balance sheet as at 1st April 2015 included in these standalone Ind AS financial statements, are based on the statutory financial statements prepared in accordance with the Companies (Accounting Standards) Rules, 2006 audited by one of the joint auditors whose report for the year ended March 31, 2015 dated May 30, 2015 expressed an unmodified opinion on those standalone financial statements, and have been restated to comply with Ind AS. Adjustments made to the previously issued said financial information prepared in accordance with the Companies (Accounting Standards) Rules, 2006 to comply with Ind AS have been audited by us.
c) The comparative financial information for the year ended March 31, 2016 in respect of 4 joint operations included in this standalone Ind AS financial statements prepared in accordance with the Ind AS have been audited by the other auditors.
The comparative financial information for the year ended March 31, 2016 in respect of 16 joint operations included in this standalone Ind AS financial statements prepared in accordance with the Ind AS have not been audited by their auditors and have been furnished to us by the Management.
Our opinion on the standalone Ind AS financial statements, and our report on Other Legal and Regulatory Requirements below, is not modified in respect of these matters with respect to our reliance on the work done and the reports of the other auditors and the financial information certified by the Management.
Report on Other Legal and Regulatory Requirements
1. As required by Section 143(3) of the Act, based on our audit and on the consideration of the reports of the other auditor on the separate financial statements / information of the joint operation, referred to in the Other Matters paragraph above we report, to the extent applicable that:
a) We have sought and obtained all the information and explanations which to the best of our knowledge and belief were necessary for the purposes of our audit;
b) In our opinion, proper books of account as required by law have been kept by the Company and its joint operation so far as it appears from our examination of those books and the reports of the other auditors;
c) The Balance Sheet, the Statement of Profit and Loss including Other Comprehensive Income, the Statement of Cash Flows and Statement of Changes in Equity dealt with by this Report are in agreement with the relevant books of account;
d) In our opinion, the aforesaid standalone Ind AS financial statements comply with the Indian Accounting Standards prescribed under section 133 of the Act read with relevant rules issued thereunder;
e) On the basis of the written representations received from the directors as on March 31, 2017 taken on record by the Board of Directors and the report of the statutory auditor of its joint operation company incorporated in India, none of the directors is disqualified as on March 31, 2017 from being appointed as a director in terms of Section 164(2) of the Act;
f) With respect to the adequacy of the internal financial controls over financial reporting of the Company and joint operation which is a Company incorporated in India and the operating effectiveness of such controls, refer to our separate Report in “Annexure A”. Our report expresses an unmodified opinion on the adequacy and operating effectiveness of the Company’s and it’s joint operation’s internal financial controls over financial reporting; and
g) With respect to the other matters to be included in the Auditor’s Report in accordance with Rule 11 of the Companies (Audit and Auditors) Rules, 2014, as amended, in our opinion and to the best of our information and according to the explanations given to us:
i. The Company has disclosed the impact of pending litigations on its financial position in its standalone Ind AS financial statements;
ii. The Company has made provision, as required under the applicable law or accounting standards, for material foreseeable losses, if any, on long-term contracts including derivative contracts;
iii. There has been no delay in transferring amounts, required to be transferred, to the Investor Education and Protection Fund by the Company; and
iv. To the best of our information and according to the information and explanations given to us and having regard to the nature of business and size of its operations and cash payments made by the Company in the ordinary course of business and based on the Company’s practices for recording such transactions, the Company has provided the requisite disclosures in its financial statements as to holdings as well as dealings in Specified Bank Notes as defined in the Notification S.O. 3407(E) dated the 8th November, 2016 of the Ministry of Finance, during the period from November 8, 2016 to December 30, 2016. Based on audit procedures performed and the representations provided to us by the management, we report that the disclosures are in accordance with the relevant books of account maintained by the Company and as produced before us and other auditor by the management.
2. As required by the Companies (Auditor’s Report) Order, 2016 (“the Order”) issued by the Central Government in terms of Section 143(11) of the Act, we give in “Annexure B” a statement on the matters specified in paragraphs 3 and 4 of the Order.
For DELOITTE HASKINS & SELLS LLP For SHARP & TANNAN
Chartered Accountants Chartered Accountants(Firm Registration No. 117366W/W-100018) (Firm Registration No. 109982W)
P. R. RAMESH FIRDOSH D. BUCHIA
(Partner) (Partner)(Membership No. 70928) (Membership No. 38332)
MUMBAI, May 29, 2017

231
ANNEXURE “A” TO THE INDEPENDENT AUDITORS’ REPORT (Referred to in paragraph 1 (f) under ‘Report on Other Legal and Regulatory Requirements’ section of our report of even date)
Report on the Internal Financial Controls Over Financial Reporting under Clause (i) of Sub-section 3 of Section 143 of the Companies Act,
2013 (“the Act”)
We have audited the internal financial controls over financial reporting of Larsen & Toubro Limited (the “Company”) as of March 31, 2017 in
conjunction with our audit of the standalone Ind AS financial statements of the Company as at end for the year ended on that date which includes
internal financial controls over financial reporting of the Company’s joint operation which is a Company incorporated in India.
Management’s Responsibility for Internal Financial Controls
The Board of Directors of the Company and those charged with governance of its joint operation which is a Company incorporated in India are
responsible for establishing and maintaining internal financial controls based on the internal control over financial reporting criteria established by the
Company considering the essential components of internal control stated in the Guidance Note on Audit of Internal Financial Controls Over Financial
Reporting issued by the Institute of Chartered Accountants of India. These responsibilities include the design, implementation and maintenance of
adequate internal financial controls that were operating effectively for ensuring the orderly and efficient conduct of its business, including adherence
to respective company’s policies, the safeguarding of its assets, the prevention and detection of frauds and errors, the accuracy and completeness of
the accounting records, and the timely preparation of reliable financial information, as required under the Companies Act, 2013.
Auditor’s Responsibility
Our responsibility is to express an opinion on the Company’s internal financial controls over financial reporting based on our audit. We conducted
our audit in accordance with the Guidance Note on Audit of Internal Financial Controls Over Financial Reporting (the “Guidance Note”) issued by the
Institute of Chartered Accountants of India and the Standards on Auditing prescribed under Section 143(10) of the Companies Act, 2013, to the extent
applicable to an audit of internal financial controls. Those Standards and the Guidance Note require that we comply with ethical requirements and plan
and perform the audit to obtain reasonable assurance about whether adequate internal financial controls over financial reporting was established and
maintained and if such controls operated effectively in all material respects.
Our audit involves performing procedures to obtain audit evidence about the adequacy of the internal financial controls system over financial reporting
and their operating effectiveness. Our audit of internal financial controls over financial reporting included obtaining an understanding of internal
financial controls over financial reporting, assessing the risk that a material weakness exists, and testing and evaluating the design and operating
effectiveness of internal control based on the assessed risk. The procedures selected depend on the auditor’s judgement, including the assessment of
the risks of material misstatement of the financial statements, whether due to fraud or error.
We believe that the audit evidence we have obtained and the audit evidence obtained by the other auditor of the joint operation which is a Company
incorporated in India, in terms of their report referred to in the Other Matters section of our report of even date, is sufficient and appropriate to
provide a basis for our audit opinion on the Company’s internal financial controls system over financial reporting.
Meaning of Internal Financial Controls Over Financial Reporting
A company’s internal financial control over financial reporting is a process designed to provide reasonable assurance regarding the reliability of
financial reporting and the preparation of financial statements for external purposes in accordance with generally accepted accounting principles. A
company’s internal financial control over financial reporting includes those policies and procedures that (1) pertain to the maintenance of records that,
in reasonable detail, accurately and fairly reflect the transactions and dispositions of the assets of the company; (2) provide reasonable assurance that
transactions are recorded as necessary to permit preparation of financial statements in accordance with generally accepted accounting principles, and
that receipts and expenditures of the company are being made only in accordance with authorisations of management and directors of the company;
and (3) provide reasonable assurance regarding prevention or timely detection of unauthorised acquisition, use, or disposition of the company’s assets
that could have a material effect on the financial statements.
Inherent Limitations of Internal Financial Controls Over Financial Reporting
Because of the inherent limitations of internal financial controls over financial reporting, including the possibility of collusion or improper management
override of controls, material misstatements due to error or fraud may occur and not be detected. Also, projections of any evaluation of the internal
financial controls over financial reporting to future periods are subject to the risk that the internal financial control over financial reporting may become
inadequate because of changes in conditions, or that the degree of compliance with the policies or procedures may deteriorate.
Opinion
In our opinion, to the best of our information and according to the explanations given to us and based on the consideration of the report of the
other auditor on internal financial controls system over financial reporting of the joint operation referred to in the Other Matters section of our report
of even date, the Company has, in all material respects, an adequate internal financial controls system over financial reporting and such internal
financial controls over financial reporting were operating effectively as at March 31, 2017, based on the internal control over financial reporting criteria
established by the respective Company considering the essential components of internal control stated in the Guidance Note on Audit of Internal
Financial Controls Over Financial Reporting issued by the Institute of Chartered Accountants of India.

232
ANNEXURE “B” TO THE INDEPENDENT AUDITORS’ REPORT(Referred to in paragraph 2 under ‘Report on Other Legal and Regulatory Requirements’ section of our report of even date)
(i) (a) The Company has maintained proper records showing full particulars, including quantitative details and situation of fixed
assets.
(b) The Company has a program of verification of its fixed assets to cover all the items in a phased manner over a period of
3 years which, in our opinion, is reasonable having regard to the size of the Company and the nature of its fixed assets.
Pursuant to the program, certain fixed assets were physically verified by the Management during the year. According to the
information and explanations given to us, no material discrepancies were noticed on such verification.
(c) According to the information and explanations given to us and the records examined by us and based on the examination
of the registered sale deed / transfer deed / conveyance deed provided to us, we report that, the title deeds, comprising
all the immovable properties of land and buildings (including land whose title deed have been pledged as security against
debentures issued by the Company), are held in the name of the Company as at the balance sheet date, except the following:
v crore
Type of asset Total no. of
cases
Leasehold /
freehold
Gross block as at
March 31, 2017
Net block as at
March 31, 2017
Remarks
Land 3 Freehold 1.27 1.27 Conveyance deed pending
to be executed.
Buildings 2 Freehold 3.54 0.94 Conveyance deed pending
to be executed.
In respect of immovable properties of land and buildings that have been taken on lease and disclosed as fixed asset in
the financial statements, the lease agreements are in the name of the Company, where the Company is the lessee in the
agreement.
(ii) As explained to us, the inventories were physically verified during the year by the Management at reasonable intervals and no
material discrepancies were noticed on physical verification between the physical stock and the book records.
(iii) According to the information and explanations given to us, the Company has granted loans, secured or unsecured, to companies,
firms, Limited Liability Partnerships or other parties covered in the register maintained under section 189 of the Act, in respect of
which:
(a) The terms and conditions of the grant of such loans are, in our opinion, prima facie, not prejudicial to the Company’s interest.
(b) The schedule of repayment of principal and payment of interest has been stipulated and repayments or receipts of principal
amounts and interest have been regular as per stipulations.
(c) There is no overdue amount remaining outstanding as at the balance sheet date.
Other Matters
Our aforesaid report under Section 143(3)(i) of the Act on the adequacy and operating effectiveness of the internal financial controls over financial
reporting insofar as it relates to a joint operation which is a Company incorporated in India, is based on the corresponding report of the other auditor
of such Company incorporated in India.
Our opinion is not modified in respect of this matter.
For DELOITTE HASKINS & SELLS LLP For SHARP & TANNAN
Chartered Accountants Chartered Accountants(Firm Registration No. 117366W/W-100018) (Firm Registration No. 109982W)
P. R. RAMESH FIRDOSH D. BUCHIA
(Partner) (Partner)(Membership No. 70928) (Membership No. 38332)
MUMBAI, May 29, 2017

233
(iv) In our opinion and according to the information and explanations given to us, the Company has complied with the provisions
of Sections 185 and 186 of the Act in respect of grant of loans, making investments and providing guarantees and securities, as
applicable.
(v) According to the information and explanations given to us, the Company has not accepted any deposit during the year and hence
reporting under paragraph 3 (v) of the Order is not applicable to the Company.
(vi) The maintenance of cost records has been specified by the Central Government under section 148(1) of the Act. We have broadly
reviewed the cost records maintained by the Company pursuant to the Companies (Cost Records and Audit) Rules, 2014, as
amended and prescribed by the Central Government under sub-section (1) of Section 148 of the Act, and are of the opinion that,
prima facie, the prescribed cost records have been made and maintained. We have, however, not made a detailed examination of
the cost records with a view to determine whether they are accurate or complete.
(vii) According to the information and explanations given to us, in respect of statutory dues:
(a) The Company has been generally regular in depositing undisputed statutory dues, including Provident Fund, Employees’ State
Insurance, Income-tax, Sales Tax, Service Tax, Customs Duty, Excise Duty, Value Added Tax, cess and other material statutory
dues applicable to it to the appropriate authorities.
(b) There were no undisputed amounts payable in respect of Provident Fund, Employees’ State Insurance, Income-tax, Sales Tax,
Service Tax, Customs Duty, Excise Duty, Value Added Tax, cess and other material statutory dues in arrears as at March 31,
2017 for a period of more than six months from the date they became payable.
(c) Details of dues of Income-tax, Sales Tax, Service Tax, Customs Duty, Excise Duty, and Value Added Tax which have not been
deposited as on March 31, 2017 on account of disputes are given below:
Name of
Statute
Nature of Dues Forum where
Dispute is
Pending
Period to which Amount
Relates
Amount
Involved
(v crore)
Amount
Unpaid
(v crore)
Central Sales Tax Act, Local Sales Tax Acts and Works Contract Tax Act
Taxability of sub-contractor turnover, rate of tax for declared goods, inter-state sales and non-submission of forms
Supreme Court 2000-01 to 2006-07 12.13 3.14
Dispute regarding question of law,
non-submission of forms, classification
dispute, tax deducted at source at
lower rate, sales in transit, high seas
sales, labour turnover, local VAT, rate
of tax on declared goods and other
matters.
High Court 1986-87 to 1987-88,
1993-94, 1994-95, 1998-
99 to 2002-03, 2005-06,
2006-07 to 2012-13
74.62 65.49
Non-submission of forms, classification
disputes, disallowance of sales
occasioning import, arbitrary demand
raised, sub-contractors turnover
disallowed, pumping and freight
charges, inter-state sales turnover, tax
deducted at source disallowed, rates
of tax of declared goods, classification
dispute, disallowance of Entry tax and
other matters.
Sales Tax/ VAT
Tribunal
1989-90 to 2013-14 417.09 360.28
Dispute regarding question of law,
non-submission of forms, classification
dispute, disallowance of setoff,
valuation of goods, sales in transit and
high seas sales, and other matters.
Commissioner
(Appeal)
2000-01, 2003-04 to 2012-
13, 2014-15 to 2015-16
43.44 40.82
Commissioner 2008-09, 2012-13 0.33 0.33
Non Submission of Forms and other
matters.
Additional
Commissioner
2011-12 to 2012-13 2.59 2.58

234
Name of
Statute
Nature of Dues Forum where
Dispute is
Pending
Period to which Amount
Relates
Amount
Involved
(v crore)
Amount
Unpaid
(v crore)
Dispute regarding question of law,
non-submission of forms, sales in
transit, local VAT and other matters.
Joint
Commissioner
2006-07, 2009-10,
2011-12 to 2015-16
27.18 4.02
Non-submission of forms, additional
demands for pending forms, rate of
tax dispute, disallowance of branch
transfer, sub-contractors turnover,
considering supply agreement as
Works Contract Tax, disallowance
of sales in transit, stock transfer and
other matters.
Assistant /
Deputy / Joint
Commissioner
– Appeals
1998-99, 2000-01 to
2014-15
1219.32 1128.36
Sales in transit, local VAT and other
matters.
Assessing/
Commercial Tax
Officer
1996-97 to 1998-99, 2001-
02 to 2007-08, 2009-10 to
2012-13
7.97 7.13
The Central
Excise Act,
1944, Service
Tax under
Finance Act,
1994 and
Customs Act,
1962
Export rebate claim, service tax on
commercial construction services,
service tax liability against rate change
and penalty imposed for wrong
availment of CENVAT credit.
High Court 2005-06 to 2007-08,
2009-10 to 2012-13
42.48 40.74
Demand of excise duty on Fabrication
of Cable tray supports/ ED exemption/
Export rebate disallowance / Service
Tax on Business Auxiliary Services/
Valuation Dispute pertaining to
Excise/ Duty on Supply of Bolts &
nuts/ GTA services, site jobs, export
rebate disallowance, MRP valuation
disputes, CENVAT credit availed,
non-maintenance of separate records,
and other matters.
CESTAT 1991-92, 2001-02 to
2011-12
1025.48 1001.52
Disallowance of CENVAT credit, excise
duty refund, excise duty on site jobs,
short payment of service tax, service
tax rate dispute, valuation dispute and
other matters.
Commissioner
(Appeal)
2006-07 to 2012-13,
2015-16
13.87 13.57
Disallowance of CENVAT credit, short
payment of service tax, service tax rate
dispute, valuation dispute and other
matters.
Commissioner 2005-06 to 2013-14 78.69 77.58
Disallowance of CENVAT credit, short
payment of service tax and other
matters.
Tribunal 2006-07 to 2009-10,
2011-12 to 2012-13
78.97 78.12
Non fulfilment of Export Obligations
under Export promotion scheme
Directorate
General of
Foreign Trade
2015-16 to 2016-17 12.49 12.49
Income-tax Act,
1961
Demands arising out of Regular
Assessment/ Reassessment
ITAT 2003-04, 2006-07 to
2011-12
1616.42 491.16

235
(viii) In our opinion and according to the information and explanations given to us, the Company has not defaulted in the repayment of
loans or borrowings to financial institutions and banks and dues to debenture holders. The Company has not borrowed any funds
from the government.
(ix) In our opinion and according to the information and explanations given to us, the Company has not raised any money by way of
initial public offer or further public offer (including debt instruments) or term loans and hence reporting under paragraph 3 (ix) of
the Order is not applicable to the Company.
(x) To the best of our knowledge and according to the information and explanations given to us, no fraud by the Company and no
material fraud on the Company by its officers or employees has been noticed or reported during the year.
(xi) In our opinion and according to the information and explanations given to us, the Company has paid / provided managerial
remuneration in accordance with the requisite approvals mandated by the provisions of section 197 read with Schedule V to the
Act.
(xii) In our opinion and according to the information and explanations given to us, the Company is not a Nidhi Company and hence
reporting under paragraph 3 (xii) of the Order is not applicable to the Company.
(xiii) In our opinion and according to the information and explanations given to us, the Company is in compliance with Section 177 and
188 of the Act, where applicable, for all transactions with the related parties and the details of related parties and the details of
related party transactions have been disclosed in the financial statements etc. as required by the applicable accounting standards.
(xiv) According to the information and explanations given to us, during the year the Company has not made any preferential allotment
or private placement of shares or fully or partly convertible debentures and hence reporting under paragraph 3 (xiv) of the Order is
not applicable to the Company.
(xv) In our opinion and according to the information and explanations given to us, during the year the Company has not entered into
any non-cash transactions with its directors or persons connected with him and hence provisions of section 192 of the Act are not
applicable to the Company.
(xvi) The Company is not required to be registered under section 45-IA of the Reserve Bank of India Act, 1934.
For DELOITTE HASKINS & SELLS LLP For SHARP & TANNAN
Chartered Accountants Chartered Accountants
(Firm Registration No. 117366W/W-100018) (Firm Registration No. 109982W)
P. R. RAMESH FIRDOSH D. BUCHIA
(Partner) (Partner)
(Membership No. 70928) (Membership No. 38332)
MUMBAI, May 29, 2017

236
Balance Sheet as at March 31, 2017
As at 31-3-2017 As at 31-3-2016 As at 1-4-2015
Note v crore v crore v crore v crore v crore v croreASSETS:
Non-current assets
Property, plant and equipment 2 6522.85 7129.89 7068.96
Capital work-in-progress 2 302.53 253.22 385.73
Investment property 3 396.70 446.90 471.18
Other intangible assets 4 125.04 138.58 84.94
Intangible assets under development 4 201.25 158.91 189.50
Financial assets
Investments 5 19776.81 19187.86 17446.14
Loans 6 1770.54 2797.52 3002.86
Other financial assets 7 500.33 474.09 346.46
22047.68 22459.47 20795.46
Deferred tax assets/(liabilities) [net] 49(e) 285.22 156.14 (95.97)
Other non-current assets 8 2222.67 1786.70 1450.22
Current assets
Inventories 9 1762.86 1955.11 2260.77
Financial assets
Investments 10 6982.08 4803.32 5518.05
Trade receivables 11 19919.97 18967.75 16790.00
Cash and cash equivalents 12 2202.26 2075.83 2764.78
Other bank balances 13 1599.97 1494.43 255.84
Loans 14 1919.41 2432.26 1381.61
Other financial assets 15 2054.63 1880.49 1428.09
34678.32 31654.08 28138.37
Other current assets 16 33263.70 33481.95 28454.83
Group(s) of assets classified as held for sale 42 388.00 – 141.79
TOTAL ASSETS 102196.82 99620.95 89345.78
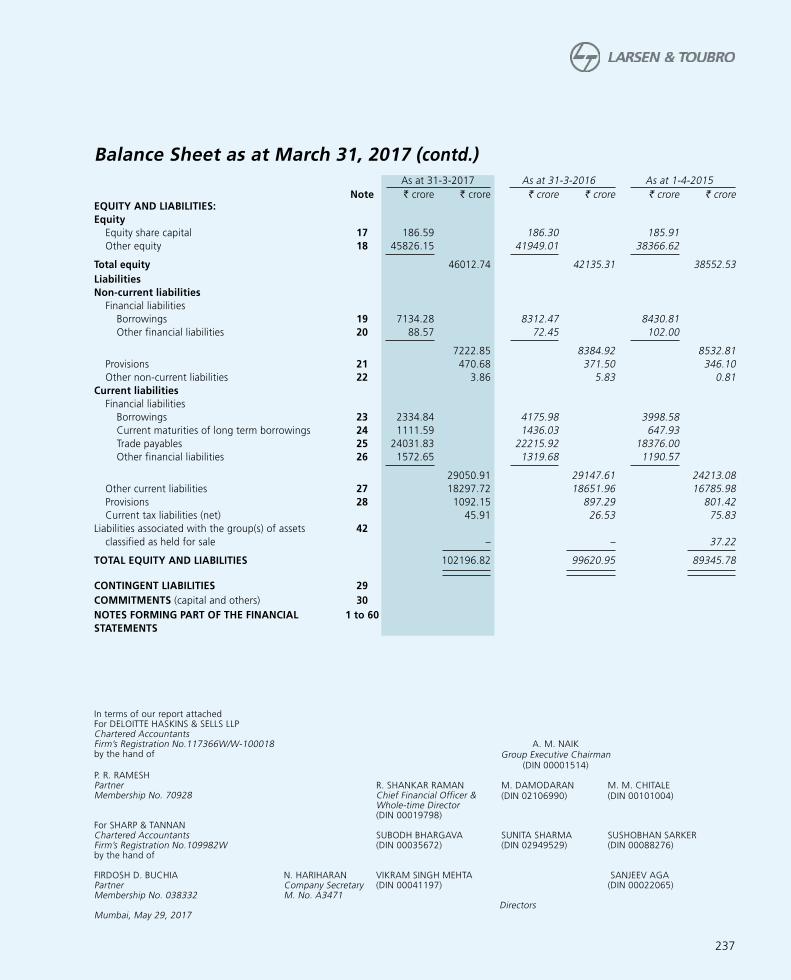
237
In terms of our report attachedFor DELOITTE HASKINS & SELLS LLPChartered AccountantsFirm’s Registration No.117366W/W-100018 A. M. NAIK
Group Executive Chairman (DIN 00001514)
by the hand of
P. R. RAMESHPartner R. SHANKAR RAMAN M. DAMODARAN
(DIN 02106990)M. M. CHITALE(DIN 00101004)Membership No. 70928 Chief Financial Officer &
Whole-time Director (DIN 00019798)
For SHARP & TANNANChartered Accountants SUBODH BHARGAVA SUNITA SHARMA SUSHOBHAN SARKERFirm’s Registration No.109982W (DIN 00035672) (DIN 02949529) (DIN 00088276)by the hand of
FIRDOSH D. BUCHIA N. HARIHARAN VIKRAM SINGH MEHTA SANJEEV AGAPartner Company Secretary (DIN 00041197) (DIN 00022065)Membership No. 038332 M. No. A3471
DirectorsMumbai, May 29, 2017
As at 31-3-2017 As at 31-3-2016 As at 1-4-2015
Note v crore v crore v crore v crore v crore v croreEQUITY AND LIABILITIES:
Equity
Equity share capital 17 186.59 186.30 185.91
Other equity 18 45826.15 41949.01 38366.62
Total equity 46012.74 42135.31 38552.53
Liabilities
Non-current liabilities
Financial liabilities
Borrowings 19 7134.28 8312.47 8430.81
Other financial liabilities 20 88.57 72.45 102.00
7222.85 8384.92 8532.81
Provisions 21 470.68 371.50 346.10
Other non-current liabilities 22 3.86 5.83 0.81
Current liabilities
Financial liabilities
Borrowings 23 2334.84 4175.98 3998.58
Current maturities of long term borrowings 24 1111.59 1436.03 647.93
Trade payables 25 24031.83 22215.92 18376.00
Other financial liabilities 26 1572.65 1319.68 1190.57
29050.91 29147.61 24213.08
Other current liabilities 27 18297.72 18651.96 16785.98
Provisions 28 1092.15 897.29 801.42
Current tax liabilities (net) 45.91 26.53 75.83
Liabilities associated with the group(s) of assets
classified as held for sale
42
– – 37.22
TOTAL EQUITY AND LIABILITIES 102196.82 99620.95 89345.78
CONTINGENT LIABILITIES 29
COMMITMENTS (capital and others) 30
NOTES FORMING PART OF THE FINANCIAL
STATEMENTS
1 to 60
Balance Sheet as at March 31, 2017 (contd.)

238
Statement of Profit and Loss for the year ended March 31, 2017
2016-17 2015-16
Note v crore v crore v crore v crore
INCOME:
Revenue from operations 31 66301.35 63812.65
Other income 32 1971.85 2341.04
Total income 68273.20 66153.69
EXPENSES:
Manufacturing, construction and operating expenses 33
Cost of raw materials components consumed 7370.57 7397.55
Excise duty 577.49 635.39
Construction materials consumed 18493.31 18804.70
Purchase of stock-in-trade 1390.84 1129.45
Stores, spares and tools consumed 1446.67 1349.23
Sub-contracting charges 16770.61 15567.87
Changes in inventories of finished goods, work-in-progress and
stock-in-trade and property development 131.59 76.57
Other manufacturing, construction and operating expenses 5808.52 5208.33
51989.60 50169.09
Employee benefits expense 34 5146.47 4974.80
Sales, administration and other expenses 35 2741.55 2845.77
Finance costs 36 1318.03 1476.82
Depreciation, amortisation, impairment and obsolescence 1215.19 997.40
62410.84 60463.88
Less: Overheads capitalised 1.51 5.53
Total expenses 62409.33 60458.35
Profit before exceptional items and tax 5863.87 5695.34
Exceptional items 46 893.97 560.28
Profit before tax 6757.84 6255.62
Carried forward 6757.84 6255.62

239
In terms of our report attachedFor DELOITTE HASKINS & SELLS LLPChartered AccountantsFirm’s Registration No.117366W/W-100018 A. M. NAIK
Group Executive Chairman
(DIN 00001514)
by the hand of
P. R. RAMESHPartner R. SHANKAR RAMAN M. DAMODARAN
(DIN 02106990)M. M. CHITALE(DIN 00101004)Membership No. 70928 Chief Financial Officer &
Whole-time Director (DIN 00019798)
For SHARP & TANNANChartered Accountants SUBODH BHARGAVA SUNITA SHARMA SUSHOBHAN SARKERFirm’s Registration No.109982W (DIN 00035672) (DIN 02949529) (DIN 00088276)by the hand of
FIRDOSH D. BUCHIA N. HARIHARAN VIKRAM SINGH MEHTA SANJEEV AGAPartner Company Secretary (DIN 00041197) (DIN 00022065)Membership No. 038332 M. No. A3471
DirectorsMumbai, May 29, 2017
2016-17 2015-16
Note v crore v crore v crore v crore
Brought forward 6757.84 6255.62
Tax expenses
Current tax 49(a) 1675.20 1530.01
Deferred tax 49(a) (371.10) (273.97)
1304.10 1256.04
Profit after tax 5453.74 4999.58
Other Comprehensive Income
A. Items that will not be reclassified to Profit or Loss:
Remeasurements of the defined benefit plans [net of tax] (8.02) (8.44)
B. Items that will be reclassified to Profit or Loss:
Debt instruments through Other Comprehensive Income [net of tax] (10.25) (2.59)
Exchange differences in translating the financial statements of
foreign operations [net of tax]
(4.32) 4.14
Effective portion of gains and losses on hedging instruments in a cash
flow hedge [net of tax] 223.37 78.41
Cost of hedging reserve [net of tax] (43.43) 11.34
Other Comprehensive Income for the year [net of tax] 157.35 82.86
Total Comprehensive Income for the year 5611.09 5082.44
Basic earnings per equity share (v) 52 58.49 53.71
Diluted earnings per equity share (v) 52 58.30 53.47
Face value per equity share (v) 2.00 2.00
NOTES FORMING PART OF THE FINANCIAL STATEMENTS 1 to 60
Statement of Profit and Loss for the year ended March 31, 2017 (contd.)

240
Statement of changes in Equity for the year ended March 31, 2017
A. Equity share capital
Particulars
2016-17 2015-16
Number of shares
v crore Number of shares
v crore
Issued, subscribed and fully paid up equity shares outstanding at the beginning of the year 93,14,78,845 186.30 92,95,62,061 185.91Add: Shares issued on exercise of employee stock options during the year 14,86,958 0.29 19,16,784 0.39
Issued, subscribed and fully paid up equity shares outstanding at the end of the year 93,29,65,803 186.59 93,14,78,845 186.30
B. Other equity(v crore)
Particulars
Equity component
of foreign currency
convertible bonds
Reserves and surplus Items of Other Comprehensive Income
Total other equityCapital
reserve
Securities premium account
Employee share options (net)
Debenture redemption
reserve
General reserve
Retained earnings
Foreign currency
translation reserve
Hedging reserve
Debt instruments
through Other Comprehensive
Income
Balance as at 1-4-2015 153.20 10.52 7963.16 308.84 400.01 25054.47 4522.65 0.73 (125.58) 78.62 38366.62Profit for the year (a) – – – – – – 4999.58 – – – 4999.58Other Comprehensive Income (b) – – – – – – (8.44) 4.14 89.75 (2.59) 82.86
Total comprehensive income for the year (a+b) – – – – – – 4991.14 4.14 89.75 (2.59) 5082.44
Issue of equity shares – – 201.63 – – – – – – – 201.63Share issue expenses – – (0.07) – – – – – – – (0.07)Transfer from/to general reserve/retained
earnings during the year – – – (12.02) 6.50 162.02 (156.50) – – – –Employee share options (net) – – – (54.59) – – – – – – (54.59)Dividend paid for the previous year (including
tax on dividend) – – – – – – (1647.02) – – – (1647.02)
Balance as at 31-3-2016 153.20 10.52 8164.72 242.23 406.51 25216.49 7710.27 4.87 (35.83) 76.03 41949.01
Profit for the year (c) – – – – – – 5453.74 – – – 5453.74Other Comprehensive Income (d) – – – – – – (8.02) (4.32) 179.94 (10.25) 157.35
Total comprehensive income for the year (c+d) – – – – – 5445.72 (4.32) 179.94 (10.25) 5611.09
Issue of equity shares – – 154.18 – – – – – – – 154.18Share issue expenses – – (0.05) – – – – – – – (0.05)Transfer from/to general reserve/retained
earnings during the year – – – (19.61) (49.75) 157.11 (87.75) – – – – Employee share options (net) – – – (45.37) – – – – – – (45.37)Dividend paid for the previous year (including
tax on dividend) – – – – – – (1842.71) – – – (1842.71)
Balance as at 31-3-2017 153.20 10.52 8318.85 177.25 356.76 25373.60 11225.53 0.55 144.11 65.78 45826.15
In terms of our report attachedFor DELOITTE HASKINS & SELLS LLPChartered AccountantsFirm’s Registration No.117366W/W-100018 A. M. NAIK
Group Executive Chairman (DIN 00001514)
by the hand of
P. R. RAMESHPartner R. SHANKAR RAMAN M. DAMODARAN
(DIN 02106990)
M.M.CHITALE
(DIN 00101004)Membership No. 70928 Chief Financial Officer & Whole-time Director (DIN 00019798)
For SHARP & TANNANChartered Accountants SUBODH BHARGAVA SUNITA SHARMA SUSHOBHAN SARKERFirm’s Registration No.109982W (DIN 00035672) (DIN 02949529) (DIN 00088276)by the hand of
FIRDOSH D. BUCHIA N.HARIHARAN VIKRAM SINGH MEHTA SANJEEV AGAPartner Company Secretary (DIN 00041197) (DIN 00022065)Membership No. 038332 M. No. A3471
DirectorsMumbai, May 29, 2017

241
Statement of Cash Flows for the year ended March 31, 20172016-17 2015-16
v crore v crore
A. Cash flow from operating activities:
Profit before tax (excluding exceptional items) 5863.87 5695.34
Adjustments for:
Dividend received (1065.10) (1121.35)
Depreciation, amortisation, impairment and obsolescence (net) 1215.19 997.40
Exchange difference on items grouped under financing/investing activities (67.40) 59.47
Effect of exchange rate changes on cash and cash equivalents 0.11 2.00
Interest expense 1318.03 1476.82
Interest income (539.31) (530.72)
Profit on sale of fixed assets (net) (23.70) (82.51)
Profit on sale of investments (net) [including fair valuation] 72.44 (150.87)
Employee stock option-discount forming part of employee benefits expense 61.77 60.34
Operating profit before working capital changes 6835.90 6405.92
Adjustments for:
(Increase)/decrease in trade and other receivables (1343.12) (7781.31)
(Increase)/decrease in inventories 192.26 305.65
Increase/(decrease) in trade payables and customer advances 1981.62 5985.83
Cash (used in)/generated from operations 7666.66 4916.09
Direct taxes refund/(paid) [net] (1519.29) (1616.23)
Net cash (used in)/from operating activities 6147.37 3299.86
B. Cash flow from investing activities:
Purchase of fixed assets (749.02) (1087.23)
Sale of fixed assets (including advance received) 114.35 290.00
Investment in subsidiaries, associates and joint ventures (3375.61) (2545.89)
Divestment of stake in subsidiaries, associates and joint ventures 3348.24 2289.55
Sale of non-current investments – 106.65
(Purchase)/sale of current investments (net) (2304.55) 681.89
Change in other bank balance and cash not available for immediate use (230.92) (1261.18)
Deposits/loans (given) - subsidiaries, associates, joint ventures and third parties (1085.78) (12498.99)
Deposits/loans repaid - subsidiaries, associates, joint ventures and third parties 2336.24 9790.42
Advance towards equity commitment (addition) (6.35) (5.25)
Advance towards equity commitment refund 5.25 1070.15
Interest received 830.53 446.58
Dividend received from subsidiaries 405.47 994.16
Dividend received from other investments 659.63 127.19
Consideration received on transfer of Foundry Business Unit 83.65 79.70
Net cash (used in)/from investing activities [non-cash transaction: Note (51(c)#), (51(c)##)] 31.13 (1522.25)

242
Statement of Cash Flows for the year ended March 31, 2017 (contd.)
2016-17 2015-16
v crore v crore
C. Cash flow from financing activities:
Proceeds from fresh issue of share capital 53.32 70.19
Proceeds from non-current borrowings 378.26 1589.29
Repayment of non-current borrowings (1643.23) (1420.79)
(Repayments)/proceeds from other borrowings (net) (1845.06) 152.59
Dividends paid (1701.51) (1512.33)
Additional tax on dividend (141.20) (134.69)
Interest paid (including cash flows from interest rate swaps) (1152.54) (1208.59)
Net cash (used in)/from financing activities (6051.96) (2464.33)
Net (decrease)/increase in cash and cash equivalents (A + B + C) 126.54 (686.72)
Cash and cash equivalents at beginning of the year 2078.06 2764.78
Cash and cash equivalents at end of the year 2204.60 2078.06
Notes:
1. Statement of cash flows has been prepared under the indirect method as set out in the Ind AS 7 “Statement of Cash Flows” as specified in the Companies (Indian Accounting Standards) Rules, 2015.
2. Purchase of fixed assets represents additions to property, plant and equipment, investment property and other intangible assets adjusted for movement of (a) capital-work-in-progress for property, plant and equipment and investment property and (b) intangible assets under development during the year.
3. Cash and cash equivalents included in the Statement of cash flows comprise the following:
2016-17 2015-16
v crore v crore
(a) Cash and cash equivalents disclosed under current assets [Note 12] 2202.26 2075.83
(b) Other bank balances disclosed under current assets [Note 13] 1599.97 1494.43
(c) Cash and cash equivalents disclosed under non-current assets [Note 7] 223.56 98.18
Total cash and cash equivalents as per Balance Sheet 4025.79 3668.44
Add: (i) Unrealised exchange (gain)/loss on cash and cash equivalents 2.34 2.23
Less: (ii) Other bank balances disclosed under current assets [Note 13] 1599.97 1494.43
Less: (iii) Cash and cash equivalents disclosed under non-current assets [Note 7] 223.56 98.18
Total cash and cash equivalents as per Statement of Cash Flows 2204.60 2078.06
4. Previous year’s figures have been regrouped/reclassified wherever applicable.
In terms of our report attachedFor DELOITTE HASKINS & SELLS LLPChartered AccountantsFirm’s Registration No.117366W/W-100018 A. M. NAIK
Group Executive Chairman(DIN 00001514)
by the hand of
P. R. RAMESHPartner R. SHANKAR RAMAN M. DAMODARAN
(DIN 02106990)M. M. CHITALE(DIN 00101004)Membership No. 70928 Chief Financial Officer &
Whole-time Director (DIN 00019798)
For SHARP & TANNANChartered Accountants SUBODH BHARGAVA SUNITA SHARMA SUSHOBHAN SARKERFirm’s Registration No.109982W (DIN 00035672) (DIN 02949529) (DIN 00088276)by the hand of
FIRDOSH D. BUCHIA N. HARIHARAN VIKRAM SINGH MEHTA SANJEEV AGAPartner Company Secretary (DIN 00041197) (DIN 00022065)Membership No. 038332 M. No. A3471
DirectorsMumbai, May 29, 2017

243
NOTE [1]
Significant Accounting Policies
(a) Statement of compliance
The company’s financial statements have been prepared in accordance with the provisions of the Companies Act, 2013 and the Indian Accounting Standards (“Ind AS”) notified under the Companies (Indian Accounting Standards) Rules, 2015 issued by Ministry of Corporate Affairs in respect of sections 133 read with sub-section (1) of Section 210A of the Companies Act, 1956 (1 of 1956). In addition, the guidance notes/announcements issued by the Institute of Chartered Accountants of India (ICAI) are also applied except where compliance with other statutory promulgations require a different treatment. The financials for the year ended March 31, 2017 of the company are the first financial statements prepared in compliance with Ind AS. The date of transition to Ind AS is April 1, 2015. The financial statements upto the year ended March 31, 2016, were prepared in accordance with the accounting standards notified under the Companies (Accounting Standards) Rules, 2006 ( “I-GAAP”) and other relevant provisions of the Act. The figures for the year ended March 31, 2016 have now been restated as per Ind AS to provide comparability. These financials statements have been approved for issue by the Board of Directors at their meeting held on May 29, 2017.
(b) Basis of accounting
The Company maintains accounts on accrual basis following the historical cost convention, except for certain financial instruments that are measured at fair value in accordance with Ind AS and certain items of property, plant and equipment that were revalued in earlier years in accordance with the I-GAAP principles. The carrying value of all the items of property, plant and equipment and investment property as on date of transition is considered as the deemed cost.
Fair value measurements under Ind AS are categorised as below based on the degree to which the inputs to the fair value measurements are observable and the significance of the inputs to the fair value measurement in its entirety:
• Level 1 inputs are quoted prices (unadjusted) in active markets for identical assets or liabilities that the company can access at measurement date;
• Level 2 inputs are inputs, other than quoted prices included in level 1, that are observable for the asset or liability, either directly or indirectly; and
• Level 3 inputs are unobservable inputs for the valuation of assets/liabilities
(c) Presentation of financial statements
The Balance Sheet and the Statement of Profit and Loss are prepared and presented in the format prescribed in the Schedule III to the Companies Act, 2013 (“the Act”). The statement of cash flows has been prepared and presented as per the requirements of Ind AS 7 “Statement of Cash flows”. The disclosure requirements with respect to items in the Balance Sheet and Statement of Profit and Loss, as prescribed in the Schedule III to the Act, are presented by way of notes forming part of the financial statements along with the other notes required to be disclosed under the notified Accounting Standards and the SEBI (Listing Obligations and Disclosure Requirements) Regulations, 2015.
Amounts in the financial statements are presented in Indian Rupees in crore [1 crore = 10 million] rounded off to two decimal places as permitted by Schedule III to the Companies Act, 2013. Per share data are presented in Indian Rupees to two decimals places.
(d) Operating cycle for current and non-current classification
Operating cycle for the business activities of the company covers the duration of the specific project/contract/product line/service including the defect liability period wherever applicable and extends up to the realisation of receivables (including retention monies) within the agreed credit period normally applicable to the respective lines of business.
(e) Revenue recognition
Revenue is recognised based on nature of activity when consideration can be reasonably measured and recovered with reasonable certainty. Revenue is measured at the fair value of the consideration received or receivable and is reduced for estimated customer returns, rebates and other similar allowances.
(i) Revenue from operations
Revenue includes excise duty and adjustments made towards liquidated damages and price variation wherever applicable. Escalation and other claims, which are not ascertainable/acknowledged by customers are not taken into account.
A. Sale of goods
Revenue from the sale of manufactured and traded goods is recognised when the goods are delivered and titles have been passed, provided all the following conditions are satisfied:
1. significant risks and rewards of ownership of the goods are transferred to the buyer;
Notes forming part of the Financial Statements

244
2. the company retains neither continuing managerial involvement to the degree usually associated with ownership nor effective control over the good sold;
3. the amount of revenue can be measured reliably;
4. it is probable that the economic benefits associated with the transaction will flow to the company; and
5. the costs incurred or to be incurred in respect of the transaction can be measured reliably.
B. Revenue from construction/project related activity and contracts for supply/commissioning of complex plant and equipment is recognised as follows:
1. Cost plus contracts: Revenue from cost plus contracts is determined with reference to the recoverable costs incurred during the period and the margin as agreed with the customer.
2. Fixed price contracts: Contract revenue is recognised only to the extent of cost incurred till such time the outcome of the job cannot be ascertained reliably subject to condition that it is probable that such cost will be recoverable. When the outcome of the contract is ascertained reliably, contract revenue is recognised at cost of work performed on the contract plus proportionate margin, using the percentage of completion method. Percentage of completion is the proportion of cost of work performed to-date, to the total estimated contract costs.
The estimated outcome of a contract is considered reliable when all the following conditions are satisfied:
i. the amount of revenue can be measured reliably;
ii. it is probable that the economic benefits associated with the contract will flow to the company;
iii. the stage of completion of the contract at the end of the reporting period can be measured reliably; and
iv. the costs incurred or to be incurred in respect of the contract can be measured reliably.
Expected loss, if any, on a contract is recognised as expense in the period in which it is foreseen, irrespective of the stage of completion of the contract.
For contracts where progress billing exceeds the aggregate of contract costs incurred to-date and recognised profits (or recognised losses, as the case may be), the surplus is shown as the amount due to customers. Amounts received before the related work is performed are disclosed in the Balance Sheet as a liability towards advance received. Amounts billed for work performed but yet to be paid by the customer are disclosed in the Balance Sheet as trade receivables. The amount of retention money held by the customers is disclosed as part of other current assets and is reclassified as trade receivables when it becomes due for payment.
C. Revenue from property development activity which are in substance similar to delivery of goods is recognised when all significant risks and rewards of ownership in the land and/or building are transferred to the customer and a reasonable expectation of collection of the sale consideration from the customer exists.
D. Revenue from property development activity in the nature of a construction contract is recognised based on the ‘Percentage of completion method’ (POC) when the outcome of the contract can be estimated reliably upon fulfillment of all the following conditions:
1. all critical approvals necessary for commencement of the project have been obtained;
2. contract costs for work performed (excluding cost of land/developmental rights and borrowing cost) constitute at least 25% of the estimated total contract costs representing a reasonable level of development;
3. at least 25% of the saleable project area is secured by contracts or agreements with buyers; and
4. at least 10% of the total revenue as per the agreements of sale or any other legally enforceable documents is realised at the reporting date in respect of each of the contracts and the parties to such contracts can be reasonably expected to comply with the contractual payment terms.
The costs incurred on property development activities are carried as “Inventories” till such time the outcome of the project cannot be estimated reliably and all the aforesaid conditions are fulfilled. When the outcome of the project can be ascertained reliably and all the aforesaid conditions are fulfilled, revenue from property development activity is recognised at cost incurred plus proportionate margin, using percentage of completion method. Percentage of completion is determined based on the proportion of actual cost incurred to-date, to the total estimated cost of the project. For the purpose of computing percentage of construction, cost of land, developmental rights and borrowing costs are excluded.
Expected loss, if any, on the project is recognised as an expense in the period in which it is foreseen, irrespective of the stage of completion of the contract.
Notes forming part of the Financial Statements (contd.)
NOTE [1]
Significant Accounting Policies (contd.)

245
E. Rendering of services
Revenue from rendering services is recognised when the outcome of a transaction can be estimated reliably by reference to the stage of completion of the transaction. The outcome of a transaction can be estimated reliably when all the following conditions are satisfied:
1. the amount of revenue can be measured reliably;
2. it is probable that the economic benefits associated with the transaction will flow to the company;
3. the stage of completion of the transaction at the end of the reporting period can be measured reliably; and
4. the costs incurred or to be incurred in respect of the transaction can be measured reliably.
Stage of completion is determined by the proportion of actual costs incurred to-date, to the estimated total costs of the transaction
Unbilled revenue represents value of services performed in accordance with the contract terms but not billed.
F. Revenue from contracts for rendering of engineering design services and other services which are directly related to the construction of an asset is recognised on the same basis as stated in (B) supra.
G. Commission income is recognised as and when the terms of the contract are fulfilled.
H. Other operational revenue represents income earned from the activities incidental to the business and is recognised when the right to receive the income is established as per the terms of the contract.
(ii) Other income
A. Interest income is accrued on a time basis by reference to the principal outstanding and the effective interest rate.
B. Dividend income is accounted in the period in which the right to receive the same is established.
C. Other government grants, which are revenue in nature and are towards compensation for the qualifying costs incurred by the company, are recognised as income in the Statement of Profit and Loss in the period in which such costs are incurred.
D. Other items of income are accounted as and when the right to receive such income arises and it is probable that the economic benefits will flow to the company and the amount of income can be measured reliably.
(f) Exceptional items
An item of income or expense which by its size, type or incidence requires disclosure in order to improve an understanding of the performance of the company is treated as an exceptional item and the same is disclosed in the notes to accounts.
(g) Property, plant and equipment (PPE)
PPE is recognised when it is probable that future economic benefits associated with the item will flow to the company and the cost of the item can be measured reliably. PPE is stated at original cost net of tax/duty credits availed, if any, less accumulated depreciation and cumulative impairment, if any. Property, plant and equipment acquired on hire purchase basis are recognised at their cash values. Cost includes professional fees related to the acquisition of PPE and for qualifying assets, borrowing costs capitalised in accordance with the company’s accounting policy.
For transition to Ind AS, the company has elected to adopt as deemed cost, the carrying value of PPE measured as per I-GAAP less accumulated depreciation and cumulative impairment on the transition date of April 1, 2015. In respect of revalued assets, the value as determined by valuers as reduced by accumulated depreciation and cumulative impairment is taken as cost on transition date.
Own manufactured PPE is capitalised at cost including an appropriate share of overheads. Administrative and other general overhead expenses that are specifically attributable to construction or acquisition of PPE or bringing the PPE to working condition are allocated and capitalised as a part of the cost of the PPE.
PPE not ready for the intended use on the date of the Balance Sheet are disclosed as “capital work-in-progress”. (Also refer to policies on leases, borrowing costs, impairment of assets and foreign currency transactions infra).
Depreciation is recognised using straight line method so as to write off the cost of the assets (other than freehold land and properties under construction) less their residual values over their useful lives specified in Schedule II to the Companies Act, 2013, or in the case of assets where the useful life was determined by technical evaluation, over the useful life so determined. Depreciation method is reviewed at each financial year end to reflect the expected pattern of consumption of the future economic benefits embodied in the asset. The estimated useful life and residual values are also reviewed at each financial year end and the effect of any change in the estimates of useful life/residual value is accounted on prospective basis.
Notes forming part of the Financial Statements (contd.)
NOTE [1]
Significant Accounting Policies (contd.)

246
Where cost of a part of the asset (“asset component”) is significant to total cost of the asset and useful life of that part is different from the useful life of the remaining asset, useful life of that significant part is determined separately and such asset component is depreciated over its separate useful life.
Depreciation on additions to/deductions from, owned assets is calculated pro rata to the period of use. Extra shift depreciation is provided on a location basis.
Depreciation charge for impaired assets is adjusted in future periods in such a manner that the revised carrying amount of the asset is allocated over its remaining useful life.
Assets acquired under finance leases are depreciated on a straight line basis over the lease term. Where there is reasonable certainty that the company shall obtain ownership of the assets at the end of the lease term, such assets are depreciated based on the useful life prescribed under Schedule II to the Companies Act, 2013 or based on the useful life adopted by the company for similar assets.
Freehold land is not depreciated.
(h) Investment property
Properties, including those under construction, held to earn rentals and/or capital appreciation are classified as investment property and measured and reported at cost, including transaction costs.
For transition to Ind AS, the company has elected to adopt as deemed cost, the carrying value of investment property as per I-GAAP less accumulated depreciation and cumulative impairment as on the transition date of April 1, 2015. In respect of revalued assets, the value as determined by valuers as reduced by accumulated depreciation and cumulative impairment, is taken as cost on transition date.
Depreciation is recognised using straight line method so as to write off the cost of the investment property less their residual values over their useful lives specified in Schedule II to the Companies Act, 2013 or in case of assets where the useful life was determined by technical evaluation, over the useful life so determined. Depreciation method is reviewed at each financial year end to reflect the expected pattern of consumption of the future benefits embodied in the investment property. The estimated useful life and residual values are also reviewed at each financial year end and the effect of any change in the estimates of useful life/residual value is accounted on prospective basis. Freehold land and properties under construction are not depreciated.
An investment property is derecognised upon disposal or when the investment property is permanently withdrawn from use and no future economic benefits are expected from the disposal. Any gain or loss arising on derecognision of property is recognised in the Statement of Profit and Loss in the same period.
(i) Intangible assets
Intangible assets are recognised when it is probable that the future economic benefits that are attributable to the asset will flow to the enterprise and the cost of the asset can be measured reliably. Intangible assets are stated at original cost net of tax/duty credits availed, if any, less accumulated amortisation and cumulative impairment. Administrative and other general overhead expenses that are specifically attributable to acquisition of intangible assets are allocated and capitalised as a part of the cost of the intangible assets.
Research and development expenditure on new products:
(i) Expenditure on research is expensed under respective heads of account in the period in which it is incurred.
(ii) Development expenditure on new products is capitalised as intangible asset, if all of the following can be demonstrated:
A. the technical feasibility of completing the intangible asset so that it will be available for use or sale;
B. the company has intention to complete the intangible asset and use or sell it;
C. the company has ability to use or sell the intangible asset;
D. the manner in which the probable future economic benefits will be generated including the existence of a market for output of the intangible asset or intangible asset itself or if it is to be used internally, the usefulness of intangible assets;
E. the availability of adequate technical, financial and other resources to complete the development and to use or sell the intangible asset; and
F. the company has ability to reliably measure the expenditure attributable to the intangible asset during its development.
Notes forming part of the Financial Statements (contd.)
NOTE [1]
Significant Accounting Policies (contd.)

247
Development expenditure that does not meet the above criteria is expensed in the period in which it is incurred.
Intangible assets not ready for the intended use on the date of the Balance Sheet are disclosed as “intangible assets under development”.
Intangible assets are amortised on straight line basis over the estimated useful life. The method of amortisation and useful life is are reviewed at the end of each accounting year with the effect of any changes in the estimate being accounted for on a prospective basis.
Amortisation on impaired assets is provided by adjusting the amortisation charge in the remaining periods so as to allocate the asset’s revised carrying amount over its remaining useful life.
(j) Impairment of assets
As at the end of each accounting year, the company reviews the carrying amounts of its PPE, investment property, intangible assets and investments in subsidiary, associate and joint venture companies to determine whether there is any indication that those assets have suffered an impairment loss. If such indication exists, the said assets are tested for impairment so as to determine the impairment loss, if any. Goodwill and the intangible assets with indefinite life are tested for impairment each year.
Impairment loss is recognised when the carrying amount of an asset exceeds its recoverable amount. Recoverable amount is determined:
(i) in the case of an individual asset, at the higher of the net selling price and the value in use; and
(ii) in the case of a cash generating unit (a group of assets that generates identified, independent cash flows), at the higher of the cash generating unit’s net selling price and the value in use.
(The amount of value in use is determined as the present value of estimated future cash flows from the continuing use of an asset and from its disposal at the end of its useful life. For this purpose, the discount rate (pre-tax) is determined based on the weighted average cost of capital of the company suitably adjusted for risks specified to the estimated cash flows of the asset).
For this purpose, a cash generating unit is ascertained as the smallest identifiable group of assets that generates cash inflows that are largely independent of the cash inflows from other assets or groups of assets.
If recoverable amount of an asset (or cash generating unit) is estimated to be less than its carrying amount, such deficit is recognised immediately in the Statement of Profit and Loss as impairment loss and the carrying amount of the asset (or cash generating unit) is reduced to its recoverable amount.
When an impairment loss subsequently reverses, the carrying amount of the asset (or cash generating unit) is increased to the revised estimate of its recoverable amount, but so that the increased carrying amount does not exceed the carrying amount that would have been determined had no impairment loss is recognised for the asset (or cash generating unit) in prior years. A reversal of an impairment loss is recognised immediately in the Statement of Profit and Loss.
(k) Employee Benefits
(i) Short term employee benefits:
Employee benefits such as salaries, wages, short term compensated absences, expected cost of bonus, ex-gratia and performance-linked rewards falling due wholly within twelve months of rendering the service are classified as short term employee benefits and are expensed in the period in which the employee renders the related service.
(ii) Post-employment benefits:
A. Defined contribution plans: The company’s superannuation scheme, state governed provident fund scheme, employee state insurance scheme and employee pension scheme are defined contribution plans. The contribution paid/payable under the schemes is recognised during the period in which the employee renders the related service.
B. Defined benefit plans: The employees’ gratuity fund schemes and employee provident fund schemes managed by board of trustees established by the company, the post-retirement medical care plan and the company pension plan represent defined benefit plans. The present value of the obligation under defined benefit plans is determined based on actuarial valuation using the Projected Unit Credit Method.
The obligation is measured at the present value of the estimated future cash flows using a discount rate based on the market yield on government securities of a maturity period equivalent to the weighted average maturity profile of the defined benefit obligations at the Balance Sheet date.
Notes forming part of the Financial Statements (contd.)
NOTE [1]
Significant Accounting Policies (contd.)

248
Remeasurement, comprising actuarial gains and losses, the return on plan assets (excluding amounts included in net interest on the net defined benefit liability or asset) and any change in the effect of asset ceiling (wherever applicable) is recognised in other comprehensive income and is reflected in retained earnings and the same is not eligible to be reclassified to profit or loss.
Defined benefit employee costs comprising current service cost, past service cost and gains or losses on settlements are recognised in the Statement of Profit and Loss as employee benefits expense. Interest cost implicit in defined benefit employee cost is recognised in the Statement of Profit and Loss under finance cost. Gains or losses on settlement of any defined benefit plan are recognised in profit or loss when such settlement occurs. Past service cost is recognised as expense at the earlier of the plan amendment or curtailment and when the company recognises related restructuring costs or termination benefits.
In case of funded plans, the fair value of the plan assets is reduced from the gross obligation under the defined benefit plans to recognise the obligation on a net basis.
(iii) Long term employee benefits:
The obligation for long term employee benefits such as long term compensated absences, long service award etc. is measured at present value of estimated future cash flows expected to be made by the company and is recognised in a similar manner as in the case of defined benefit plans vide (ii)(B) supra.
Long term employee benefit costs comprising current service cost and gains or losses on curtailments and settlements, remeasurements including actuarial gains and losses are recognised in the Statement of Profit and Loss as employee benefit expenses. Interest cost implicit in long term employee benefit cost is recognised in the Statement of Profit and Loss under finance cost.
(iv) Termination benefits:
Termination benefits such as compensation under employee separation schemes are recognised as expense when the company’s offer of the termination benefit is accepted or when the company recognises the related restructuring costs whichever is earlier.
(l) Leases
The determination of whether an agreement is, or contains, a lease is based on the substance of the agreement at the date of inception.
(i) Finance leases:
A. Leases where the company has substantially all the risks and rewards of ownership of the related assets are classified as finance leases. Assets under finance leases are capitalised at the commencement of the lease at the lower of the fair value or the present value of minimum lease payments and a liability is created for an equivalent amount. Each lease rental paid is allocated between the liability and the interest cost, so as to obtain a constant periodic rate of interest on the outstanding liability for each period.
B. Assets given under a finance lease are recognised as a receivable at an amount equal to the net investment in the lease. Lease income is recognised over the period of the lease so as to yield a constant rate of return on the net investment in the lease.
(ii) Operating leases:
The leases which are not classified as finance lease are operating leases.
A. Lease rentals on assets under operating lease are charged to the Statement of Profit and Loss on a straight line basis over the term of the relevant lease.
B. Assets leased out under operating leases are continued to be shown under the respective class of assets. Rental income is recognised on a straight line basis over the term of the relevant lease.
(Also refer to policy on depreciation, supra)
(m) Financial instruments
Financial assets and/or financial liabilities are recognised when the company becomes party to a contract embodying the related financial instruments. All financial assets, financial liabilities and financial guarantee contracts are initially measured at transaction values and where such values are different from the fair value, at fair value. Transaction costs that are attributable to
Notes forming part of the Financial Statements (contd.)
NOTE [1]
Significant Accounting Policies (contd.)

249
the acquisition or issue of financial assets and financial liabilities (other than financial assets and financial liabilities at fair value through profit or loss) are added to or deducted from as the case may be, the fair value of such assets or liabilities, on initial recognition. Transaction costs directly attributable to the acquisition of financial assets or financial liabilities at fair value through profit or loss are recognised immediately in profit or loss. In case of interest free or concession loans given to subsidiary companies, the excess of the actual amount of the loan over initial measure at fair value is accounted as an equity investment.
The financial assets and financial liabilities are offset and presented on net basis in the Balance Sheet when there is a current legally enforceable right to set-off the recognised amounts and it is intended to either settle on net basis or to realise the asset and settle the liability simultaneously.
(i) Financial assets:
A. All recognised financial assets are subsequently measured in their entirety at amortised cost or at fair value depending on the classification of the financial assets as follows:
1. Investments in debt Instruments that are designated as fair value through profit or loss (FVTPL) - at fair value.
2. Other investments in debt instruments – at amortised cost, subject to following conditions:
• The asset is held within a business model whose objective is to hold assets in order to collect contractual cash flows; and
• The contractual terms of instrument give rise on specified dates to cash flows that are solely payments of principal and interest on the principal amount outstanding.
3. Debt instruments that meet the following conditions are subsequently measured at fair value through other comprehensive income (FVTOCI) (unless the same are designated as fair value through profit or loss)
• The asset is held within a business model whose objective is achieved both by collecting contractual cash flows and selling financial assets; and
• The contractual terms of instrument give rise on specified dates to cash flows that are solely payments of principal and interest on the principal amount outstanding.
4. Investment in equity instruments issued by subsidiary, associates and joint ventures are measured at cost less impairment.
5. Investment in preference shares of the subsidiary companies are treated as equity instruments if the same are convertible into equity shares or are redeemable out of the proceeds of equity instruments issued for the purpose of redemption of such investments. Investment in preference shares not meeting the aforesaid conditions are classified as debt instruments at FVTPL.
6. Investments in equity instruments are classified as at FVTPL, unless the related instruments are not held for trading and the company irrevocably elects on initial recognition to present subsequent changes in fair value in Other Comprehensive Income.
B. For financial assets that are measured at FVTOCI, income by way of interest, dividend and exchange difference (on debt instrument) is recognised in profit or loss and changes in fair value (other than on account of such income) are recognised in Other Comprehensive Income and accumulated in other equity. On disposal of debt instruments measured at FVTOCI, the cumulative gain or loss previously accumulated in other equity is reclassified to profit or loss. In case of equity instruments measured at FVTOCI, such cumulative gain or loss is not reclassified to profit or loss on disposal of investments.
C. A financial asset is primarily derecognised when:
1. the right to receive cash flows from the asset has expired, or
2. the company has transferred its rights to receive cash flows from the asset or has assumed an obligation to pay the received cash flows in full without material delay to a third party under a pass-through arrangement; and (a) the company has transferred substantially all the risks and rewards of the asset, or b) the company has neither transferred nor retained substantially all the risks and rewards of the asset, but has transferred control of the asset.
Notes forming part of the Financial Statements (contd.)
NOTE [1]
Significant Accounting Policies (contd.)

250
On derecognition of a financial asset in its entirety, the difference between the carrying amount measured at the date of derecognition and the consideration received is recognised in profit or loss.
D. Impairment of financial assets: The company recognises impairment loss on trade receivables using expected credit loss model, which involves use of a provision matrix constructed on the basis of historical credit loss experience as permitted under Ind AS 109. Impairment loss on investments
(ii) Financial liabilities:
A. Financial liabilities, including derivatives and embedded derivatives, which are designated for measurement at FVTPL are subsequently measured at fair value. Financial guarantee contracts are subsequently measured at the amount of impairment loss allowance or the amount recognised at inception net of cumulative amortisation, whichever is higher. All other financial liabilities including loans and borrowings are measured at amortised cost using Effective Interest Rate (EIR) method.
B. A financial liability is derecognised when the related obligation expires or is discharged or cancelled.
(iii) The company designates certain hedging instruments, such as derivatives, embedded derivatives and in respect of foreign currency risk, certain non-derivatives, as either fair value hedges or cash flow hedges or hedges of net investments in foreign operations. Hedges of foreign exchange risk on firm commitments are accounted as cash flow hedges.
A. Fair value hedges: Changes in fair value of the designated portion of derivatives that qualify as fair value hedges are recognised in profit or loss immediately, together with any changes in the fair value of the hedged asset or liability that are attributable to the hedged risk.
Hedge accounting is discontinued when the hedging instrument expires or is sold, terminated, or exercised, or when it no longer qualifies for hedge accounting. The fair value adjustment to the carrying amount of the hedged item arising from the hedged risk is amortised to profit or loss from that date.
B. Cash flow hedges: In case of transaction related hedges, the effective portion of changes in the fair value of derivatives that are designated and qualify as cash flow hedges is recognised in other comprehensive income and accumulated in equity as ‘hedging reserve’. The gain or loss relating to the ineffective portion is recognised immediately in profit or loss. Amounts previously recognised in other comprehensive income and accumulated in equity relating to the effective portion, are reclassified to profit or loss in the periods when the hedged item affects profit or loss, in the same head as the hedged item. The effective portion of the hedge is determined at the lower of the cumulative gain or loss on the hedging instrument from inception of the hedge and the cumulative change in the fair value of the hedged item from the inception of the hedge and the remaining gain or loss on the hedging instrument is treated as ineffective portion.
In case of time period related hedges, the forward element and the spot element of a forward contract is separated and only the change in the value of the spot element of the forward contract is designated as the hedging instrument. Similarly, wherever applicable, the foreign currency basis spread is separated from the financial instrument and is excluded from the designation of that financial instrument as the hedging instrument in case of time period related hedges. The changes in the fair value of the forward element of the forward contract or the foreign currency basis spread of the financial instrument is accumulated in a separate component of equity as ‘cost of hedging’. The changes in the fair value of such forward element or foreign currency basis spread are reclassified to profit or loss as a reclassification adjustment on a straight line basis over the period of the forward contract or the financial instrument.
Hedge accounting is discontinued when the hedging instrument expires or is sold, terminated, or exercised, or when it no longer qualifies for hedge accounting. Any gain or loss recognised in other comprehensive income and accumulated in equity at that time remains in equity and is recognised when the forecast transaction is ultimately recognised in profit or loss. When a forecast transaction is no longer expected to occur, the gain or loss accumulated in equity is recognised immediately in profit or loss.
(iv) Compound financial instruments issued by the company which can be converted into fixed number of equity shares at the option of the holders irrespective of changes in the fair value of the instrument are accounted by separately recognising the liability and the equity components. The liability component is initially recognised at the fair value of a comparable liability that does not have an equity conversion option. The equity component is initially recognised at the difference between the fair value of the compound financial instrument as a whole and the fair value of the liability component. The directly attributable transaction costs are allocated to the liability and the equity components in proportion to their initial carrying amounts.
Notes forming part of the Financial Statements (contd.)
NOTE [1]
Significant Accounting Policies (contd.)

251
Subsequent to initial recognition, the liability component of the compound financial instrument is measured at amortised cost using the effective interest method. The equity component of a compound financial instrument is not remeasured subsequently.
(n) Inventories
Inventories are valued after providing for obsolescence, as under:
a) Raw materials, components, construction materials, stores, spares and loose tools at lower of weighted average cost or net realisable value. However, these items are considered to be realisable at cost if the finished products in which they will be used, are expected to be sold at or above cost.
b) Manufacturing work-in-progress at lower of weighted average cost including related overheads or net realisable value. In some cases, manufacturing work-in-progress are valued at lower of specifically identifiable cost or net realisable value. In the case of qualifying assets, cost also includes applicable borrowing costs vide policy relating to borrowing costs.
c) Finished goods and stock-in-trade (in respect of goods acquired for trading) at lower of weighted average cost or net realisable value. Cost includes related overheads and excise duty paid/payable on such goods.
d) Completed property/work-in-progress (including land) in respect of property development activity at lower of specifically identifiable cost or net realisable value.
Assessment of net realisable value is made in each subsequent period and when the circumstances that previously caused inventories to be written-down below cost no longer exist or when there is clear evidence of an increase in net realisable value because of changed economic circumstances, the write-down, if any, in the past period is reversed to the extent of the original amount written-down so that the resultant carrying amount is the lower of the cost and the revised net realisable value.
(o) Cash and bank balances
Cash and bank balances also include fixed deposits, margin money deposits, earmarked balances with banks and other bank balances which have restrictions on repatriation. Short term and liquid investments being subject to more than insignificant risk of change in value, are not included as part of cash and cash equivalents.
(p) Securities premium account
(i) Securities premium includes:
A. The difference between the face value of the equity shares and the consideration received in respect of shares issued pursuant to Stock Options Scheme.
B. The fair value of the stock options which are treated as expense, if any, in respect of shares allotted pursuant to Stock Options Scheme.
(ii) The issue expenses of securities which qualify as equity instruments are written off against securities premium account.
(q) Borrowing Costs
Borrowing costs include interest expense calculated using the effective interest method, finance charges in respect of assets acquired on finance lease and exchange differences arising on foreign currency borrowings to the extent they are regarded as an adjustment to interest costs.
Borrowing costs net of any investment income from the temporary investment of related borrowings, that are attributable to the acquisition, construction or production of a qualifying asset are capitalised/inventoried as part of cost of such asset till such time the asset is ready for its intended use or sale. A qualifying asset is an asset that necessarily requires a substantial period of time to get ready for its intended use or sale. All other borrowing costs are recognised in profit or loss in the period in which they are incurred.
(r) Share-based payment arrangements
The stock options granted pursuant to the company’s Stock Options Scheme, are measured at the fair value of the options at the grant date. The fair value of the options is treated as discount and accounted as employee compensation cost over the vesting period on a straight line basis. The amount recognised as expense each year is arrived at based on the number of grants expected to vest. If a grant lapses after the vesting period, the cumulative discount recognised as expense in respect of such grant is transferred to the general reserve within equity.
The fair value of the stock options granted to employees of the company by the company’s subsidiaries is accounted as employee compensation cost over the vesting period and where such fair value is not recovered by the subsidiaries, the same is treated as dividend declared by them.
Notes forming part of the Financial Statements (contd.)
NOTE [1]
Significant Accounting Policies (contd.)

252
(s) Foreign currencies
(i) The functional currency and presentation currency of the company is Indian Rupee.
(ii) Transactions in currencies other than the company’s functional currency are recorded on initial recognition using the exchange rate at the transaction date. At each Balance Sheet date, foreign currency monetary items are reported using the closing rate. Non-monetary items that are measured in terms of historical cost in foreign currency are not retranslated. Exchange differences that arise on settlement of monetary items or on reporting of monetary items at each Balance Sheet date at the closing spot rate are recognised in profit or loss in the period in which they arise except for:
A. exchange differences on foreign currency borrowings relating to assets under construction for future productive use, which are included in the cost of those assets when they are regarded as an adjustment to interest costs on those foreign currency borrowings; and
B. exchange differences on transactions entered into in order to hedge certain foreign currency risks.
(iii) Financial statements of foreign operations whose functional currency is different than Indian Rupee are translated into Indian Rupees as follows:
A. assets and liabilities for each Balance Sheet presented are translated at the closing rate at the date of that Balance Sheet;
B. income and expenses for each income statement are translated at average exchange rates; and
C. all resulting exchange differences are recognised in other comprehensive income and accumulated in equity as foreign currency translation reserve for subsequent reclassification to profit or loss on disposal of such foreign operations.
(t) Accounting and reporting of information for Operating Segments
Operating segments are those components of the business whose operating results are regularly reviewed by the chief operating decision making body in the company to make decisions for performance assessment and resource allocation.
The reporting of segment information is the same as provided to the management for the purpose of the performance assessment and resource allocation to the segments.
Segment accounting policies are in line with the accounting policies of the company. In addition, the following specific accounting policies have been followed for segment reporting:
i) Segment revenue includes sales and other operational revenue directly identifiable with/allocable to the segment including inter segment revenue.
ii) Expenses that are directly identifiable with/allocable to segments are considered for determining the segment result.
iii) Most of the centrally incurred costs are allocated to segments mainly on the basis of their respective expected segment revenue estimated at the beginning of the reported period.
iv) Income which relates to the company as a whole and not allocable to segments is included in “unallocable corporate income”.
v) Segment result includes margins on inter-segment capital jobs, which are reduced in arriving at the profit before tax of the company.
vi) Segment assets and liabilities include those directly identifiable with the respective segments. Unallocable corporate assets and liabilities represent the assets and liabilities that relate to the company as a whole.
vii) Segment non-cash expenses forming part of segment expenses includes the fair value of the employee stock options which is accounted as employee compensation cost [Note 1(r) supra] and is allocated to the segment.
viii) Segment revenue resulting from transactions with other business segments is accounted on the basis of transfer prices which are either determined to yield a desired margin or agreed on a negotiated basis.
(u) Taxes on income
Tax on income for the current period is determined on the basis of taxable income and tax credits computed in accordance with the provisions of the Income tax Act 1961, and based on the expected outcome of assessments/appeals.
Notes forming part of the Financial Statements (contd.)
NOTE [1]
Significant Accounting Policies (contd.)
253
Deferred tax is recognised on temporary differences between the carrying amounts of assets and liabilities in the company’s
financial statements and the corresponding tax bases used in computation of taxable profit and quantified using the tax rates and
laws enacted or substantively enacted as on the Balance Sheet date.
Deferred tax liabilities are generally recognised for all taxable temporary differences including the temporary differences associated
with investments in subsidiaries and associates, and interests in joint ventures, except where the company is able to control the
reversal of the temporary difference and it is probable that the temporary difference will not reverse in the foreseeable future.
Deferred tax assets are generally recognised for all taxable temporary differences to the extent that is probable that taxable profits
will be available against which those deductible temporary differences can be utilised. The carrying amount of deferred tax assets is
reviewed at the end of each reporting period and reduced to the extent that it is no longer probable that sufficient taxable profits
will be available to allow all or part of the asset to be recovered.
Deferred tax assets relating to unabsorbed depreciation/business losses/losses under the head “capital gains” are recognised and
carried forward to the extent of available taxable temporary differences or where there is convincing other evidence that sufficient
future taxable income will be available against which such deferred tax assets can be realised.
The measurement of deferred tax liabilities and assets reflects the tax consequences that would follow from the manner in which
the company expects, at the end of reporting period, to recover or settle the carrying amount of its assets and liabilities.
Transaction or event which is recognised outside profit or loss, either in other comprehensive income or in equity, is recorded along
with the tax as applicable.
(v) Interests in Joint operations
The company as a joint operator recognises in relation to its interest in a joint operation, its share in the assets/liabilities held/
incurred jointly with the other parties of the joint arrangement. Revenue is recognised for its share of revenue from the sale of
output by the joint venture. Expenses are recognised for its share of expenses incurred jointly with other parties as part of the joint
arrangement.
Interests in joint operations are included in the segments to which they relate.
(w) Provisions, contingent liabilities and contingent assets
Provisions are recognised only when:
a) the company has a present obligation (legal or constructive) as a result of a past event;
b) it is probable that an outflow of resources embodying economic benefits will be required to settle the obligation; and
c) a reliable estimate can be made of the amount of the obligation.
Provision is measured using the cash flows estimated to settle the present obligation and when the effect of time value of money
is material, the carrying amount of the provision is the present value of those cash flows. Reimbursement expected in respect of
expenditure required to settle a provision is recognised only when it is virtually certain that the reimbursement will be received.
Contingent liability is disclosed in case of:
a) a present obligation arising from past events, when it is not probable that an outflow of resources will be required to settle
the obligation; and
b) a present obligation arising from past events, when no reliable estimate is possible.
Contingent assets are disclosed where an inflow of economic benefits is probable.
Provisions, contingent liabilities and contingent assets are reviewed at each Balance Sheet date.
Where the unavoidable costs of meeting the obligations under the contract exceed the economic benefits expected to be received
under such contract, the present obligation under the contract is recognised and measured as a provision.
Notes forming part of the Financial Statements (contd.)
NOTE [1]
Significant Accounting Policies (contd.)

254
(x) Commitments
Commitments are future liabilities for contractual expenditure, classified and disclosed as follows:
a) estimated amount of contracts remaining to be executed on capital account and not provided for;
b) uncalled liability on shares and other investments partly paid;
c) funding related commitment to subsidiary, associate and joint venture companies; and
d) other non-cancellable commitments, if any, to the extent they are considered material and relevant in the opinion of
management.
Other commitments related to sales/procurements made in the normal course of business are not disclosed to avoid excessive
details.
(y) Non-current assets held for sale
Non-current assets and disposal groups are classified as held for sale if their carrying amount is intended to be recovered principally
through a sale (rather than through continuing use) when the asset (or disposal group) is available for immediate sale in its present
condition subject only to terms that are usual and customary for sale of such asset (or disposal group) and the sale is highly
probable and is expected to qualify for recognition as a completed sale within one year from the date of classification.
Non-current assets and disposal groups classified as held for sale are measured at lower of their carrying amount and fair value less
costs to sell.
(z) Statement of Cash Flows
Statement of Cash Flows is prepared segregating the cash flows into operating, investing and financing activities. Cash flow from
operating activities is reported using indirect method, adjusting the net profit for the effects of:
i. changes during the period in inventories and operating receivables and payables transactions of a non-cash nature;
ii. non-cash items such as depreciation, provisions, deferred taxes, unrealised foreign currency gains and losses, and
undistributed profits of associates; and
iii. all other items for which the cash effects are investing or financing cash flows.
Cash and cash equivalents (including bank balances) shown in the Statement of Cash Flows exclude items which are not available
for general use as on the date of Balance Sheet.
(aa) Key sources of estimation
The preparation of financial statements in conformity with Ind AS requires that the management of the company makes estimates
and assumptions that affect the reported amounts of income and expenses of the period, the reported balances of assets and
liabilities and the disclosures relating to contingent liabilities as of the date of the financial statements. The estimates and
underlying assumptions are reviewed on an ongoing basis. Revisions to accounting estimates include useful lives of property, plant
and equipment, Intangible assets, allowance for doubtful debts/advances, future obligations in respect of retirement benefit plans,
expected cost of completion of contracts, provision for rectification costs, fair value measurement etc. Difference, if any, between
the actual results and estimates is recognised in the period in which the results are known.
(ab) First time adoption of Ind AS
The company has prepared opening Balance Sheet as per Ind AS as of April 1, 2015 (transition date) by recognising all assets
and liabilities whose recognistion is required by Ind AS, derecognising items of assets or liabilities which are not permitted to be
recognised by Ind AS, reclassifying items from I-GAAP to Ind AS as required, and applying Ind AS to measure the recognised assets
and liabilities. The exemptions availed by the company under Ind AS 101 are as follows:
(i) The company has adopted the carrying value determined in accordance with I-GAAP for all of its property plant & equipment
and investment property as deemed cost of such assets at the transition date.
(ii) Ind AS 102 Share-based Payment has not been applied to equity instruments in share-based payment transactions that vested
before April 1, 2015.
(iii) The estimates as at April 1, 2015 and at March 31, 2016 are consistent with those made for the same dates in accordance
with I-GAAP.
Notes forming part of the Financial Statements (contd.)
NOTE [1]
Significant Accounting Policies (contd.)

255
NOTE [2]
Property, plant and equipment & capital work-in-progress
v crore
Class of assets
Cost Depreciation Impairment Book value
As at 1-4-2016
Additions
Trf to
investment
property
Foreign
currency
fluctuation
DeductionsAs at
31-3-2017
Up to 31-3-2016
For the
period*
Trf to
investment
property
Foreign
currency
fluctuation
DeductionsUp to
31-3-2017
Up to
31-3-2017
As at
31-3-2017
As at 31-3-2016
Land - freehold 360.31 2.03 – – – 362.34 – – – – – – – 362.34 360.31
Buildings
Owned 2105.19 113.40 4.39 (1.21) 30.73 2182.26 98.44 91.29 0.42 (0.22) 1.16 187.93 87.25 1907.08 2006.75
Leased out 13.02 – – – – 13.02 0.60 0.60 – – – 1.20 – 11.82 12.42
Sub-total - buildings 2118.21 113.40 4.39 (1.21) 30.73 2195.28 99.04 91.89 0.42 (0.22) 1.16 189.13 87.25 1918.90 2019.17
Plant & equipment
Owned 4828.59 351.45 – (7.84) 54.73 5117.47 659.08 766.64 – (1.28) 14.98 1409.46 15.50 3692.51 4169.51
Leased out 2.63 – – – – 2.63 0.85 0.47 – – – 1.32 – 1.31 1.78
Sub-total - plant & equipment
4831.22 351.45 – (7.84) 54.73 5120.10 659.93 767.11 – (1.28) 14.98 1410.78 15.50 3693.82 4171.29
Computers 231.23 70.20 – (0.04) 7.47 293.92 73.96 73.91 – (0.01) 5.52 142.34 – 151.58 157.27
Office equipment 97.62 26.26 – (0.13) 0.26 123.49 32.24 29.62 – (0.03) 0.23 61.60 0.01 61.88 65.38
Furniture and fixtures 132.02 10.24 – (0.06) 1.09 141.11 23.07 23.15 – (0.01) 0.33 45.88 0.24 94.99 108.95
Vehicles 162.20 38.36 – (0.43) 15.98 184.15 30.17 32.82 – (0.06) 6.12 56.81 – 127.34 132.03
Other assets
Ships 37.57 – – – 0.32 37.25 4.92 4.84 – – 0.09 9.67 – 27.58 32.65
Assets taken on finance
lease 84.32 2.63 – – – 86.95 1.48 1.05 – – – 2.53 – 84.42 82.84
Sub-total - other assets 121.89 2.63 – – 0.32 124.20 6.40 5.89 – – 0.09 12.20 – 112.00 115.49
Total 8054.70 614.57 4.39 (9.71) 110.58 8544.59 924.81 1024.39 0.42 (1.61) 28.43 1918.74 103.00 6522.85 7129.89
Add: Capital work-in-progress 302.53 253.22
6825.38 7383.11
* v 3.99 crore pertains to foreign currency fluctuation
Notes forming part of the Financial Statements (contd.)

256
v crore
Class of assets
Cost Depreciation Book value
As at 1-4-2015
AdditionsForeign
currency fluctuation
DeductionsAs at
31-3-2016Up to
1-4-2015For the
period*
Foreign currency
fluctuationDeductions
Up to 31-3-2016
As at 31-3-2016
As at 1-4-2015
Land - freehold 363.76 0.65 – 4.10 360.31 – – – – – 360.31 363.76
Buildings
Owned 2002.70 118.99 0.57 13.76 2108.50 – 100.24 – 1.75 98.49 2010.01 2002.70
Leased out 9.76 – – – 9.76 – 0.55 – – 0.55 9.21 9.76
Sub total - Buildings 2012.46 118.99 0.57 13.76 2118.26 – 100.79 – 1.75 99.04 2019.22 2012.46
Plant & equipment
Owned 4134.78 872.41 3.32 182.50 4828.01 – 663.75 – 4.91 658.84 4169.17 4134.78
Leased out 3.27 – – – 3.27 – 1.17 – – 1.17 2.10 3.27
Sub total - plant & equipment 4138.05 872.41 3.32 182.50 4831.28 – 664.92 – 4.91 660.01 4171.27 4138.05
Computers 149.27 87.11 0.10 4.95 231.53 – 75.95 – 1.98 73.97 157.56 149.27
Office equipment 68.50 29.81 0.26 1.39 97.18 – 32.72 – 0.55 32.17 65.01 68.50
Furniture and fixtures 106.52 26.00 0.04 0.61 131.95 – 23.14 – 0.08 23.06 108.89 106.52
Vehicles 108.86 61.47 0.33 8.80 161.86 – 31.65 – 1.49 30.16 131.70 108.86
Other assets
Ships 38.01 – – – 38.01 – 4.92 – – 4.92 33.09 38.01
Assets taken on finance lease 83.53 0.79 – – 84.32 – 1.48 – – 1.48 82.84 83.53
Sub total - other assets 121.54 0.79 – – 122.33 – 6.40 – – 6.40 115.93 121.54
Total 7068.96 1197.23 4.62 216.11 8054.70 – 935.57 – 10.76 924.81 7129.89 7068.96
Add: Capital work-in-progress 253.22 385.73
7383.11 7454.69
* v 0.15 crore deduction pertains to foreign currency fluctuation
a. Cost of freehold land includes v 1.27 crore (previous year: v 0.27 crore) for which conveyance is yet to be completed.
b. Cost of buildings includes ownership accommodations:
i. A. in various co-operative societies, shop-owners’ associations and non-trading corporations: v 88.09 crore, including 2550 shares of v 50 each, 232 shares of v 100 each and 1 share of v 250. (Previous year : in various co-operative societies, shop-owners’ associations and non-trading corporations: v 86.92 crore, including 2570 shares of v 50 each, 232 shares of v 100 each and 1 share of v 250).
B. in various apartments: v 11.20 crore (previous year: v 11.20 crore).
C. in various co-operative societies: v 7.94 crore (previous year: v 12.88 crore) for which share certificates are yet to be issued.
D. in proposed co-operative societies: v 27.80 crore. (previous year: v 0.53 crore).
ii. ownership accommodations of v 3.53 crore in respect of which the deed of conveyance is yet to be executed. (previous year: v 3.86 crore).
iii. ownership accommodations of v 8.45 crore representing undivided share in properties at various locations. (previous year: v 8.45 crore).
c. Additions during the year and capital work-in-progress include v 13.65 crore (previous year: v 6.15 crore) being borrowing cost capitalised in accordance with Indian Accounting Standard (Ind AS) 23 on “Borrowing Costs”. Asset wise break-up of borrowing costs capitalised is as follows:
v crore
Class of assets 2016-17 2015-16
Buildings (owned) 3.63 3.13
Capital work-in-progress 10.02 3.02
Total 13.65 6.15
Notes forming part of the Financial Statements (contd.)
NOTE [2] (contd.)

257
d. The average capitalisation rate for borrowing cost is 7.91% (previous year: 7.85%).
e. In addition to depreciation, obsolescence amounting to v 22.90 crore (previous year: v 10.45 crore) and impairment amounting to v 103 crore (previous year: v Nil) have been recognised in Profit and Loss during the year.
f. Owned assets given on operating lease have been presented separately under respective class of assets as “Leased out” pursuant to Ind AS 17 “Leases”.
g. Cost as at April 1, 2016 and April 1, 2015 of individual assets has been reclassified wherever necessary.
h. Out of its leasehold land at Hazira, the Company has given certain portion of land for the use to its subsidiary company and the lease deed is under execution.
i. Depreciation is provided based on useful life supported by the technical evaluation considering business specific usage, the consumption pattern of the assets and the past performance of similar assets.
a. Estimated useful life of the following assets is in line with useful life prescribed in schedule II of The Companies Act, 2013:
Sr.
No.Asset Class Minimum useful life (in years) Maximum useful life (in years)
1. Owned Buildings 3 60
2. Owned Plant and Equipment 8 15
3. Computer 3 6
4. Office Equipment 4 5
5. Furniture and Fixture 10 10
6. Owned Vehicles 7 10
7. Ships 14 14
b. Estimated useful life of following assets is different than useful life as prescribed in schedule II of The Companies Act, 2013.
Assets used in Heavy Engineering and Shipbuilding Business:
Sr. No
Category of Assets Sub-category of AssetsUseful life as per
Schedule II (in years)Useful life
adopted (in years)
1. Plant & Equipment General Boring/Rolling/Drilling/Milling machines
15
10-30
Modular Furnace 5-15
Other Furnaces 5-30
Horizontal Autoclaves 10-30
Load bearing structures 50
Cranes 10-30
2. Roads Carpeted Roads-other than RCC 5 5-15
Assets used in Electrical & Automation business:
Sr. No
Category of Assets Sub-category of AssetsUseful life as per
Schedule II (in years)Useful life adopted
(in years)
1. Plant & Equipment General Specialised machine tools, dies, jigs, fixtures, gauges for electrical business
15 5
Assets used in Construction business:
Sr. No
Category of Assets Sub-category of AssetsUseful life as per
Schedule II (in years)Useful life adopted
(in years)
1. Photographic equipment 15 5
Notes forming part of the Financial Statements (contd.)
NOTE [2] (contd.)

258
Assets used in Metallurgical & Material Handling business:
Sr. No
Category of Assets Sub-category of AssetsUseful life as per
Schedule II (in years)Useful life adopted
(in years)
1. Office Equipment Assets deployed at project site 5 3
2. Air conditioning and refrigeration equipment
Assets deployed at project site 15 3
3. Photographic equipment Assets deployed at project site 15 3
j. Carrying value of Property plant and equipment pledged as collateral for liabilities and /or commitments as at March 31, 2017
v 0.09 crore (v 0.09 crore as at March 31,2016, v 0.09 crore as at April 1,2015)
NOTE [3]
Investment property
v crore
Class of assets
Cost Depreciation Book Value
As at 1-4-2016
AdditionsTransfer
from PPE Deductions
As at 31-3-2017
Upto31-3-2016
For the yearTransfer
from PPEDeductions
Up to 31-3-2017
As at 31-3-2017
As at 31-3-2016
Land 41.22 – – 1.17 40.05 – – – – – 40.05 41.22
Buildings 422.82 – 4.40 35.51 391.71 17.14 19.03 0.42 1.53 35.06 356.65 405.68
Total 464.04 – 4.40 36.68 431.76 17.14 19.03 0.42 1.53 35.06 396.70 446.90
v crore
Class of assets
Cost Depreciation Book Value
As at 1-4-2015
AdditionsTransfer
from PPE Deductions
As at 31-3-2016
Upto1-4-2015
For the yearTransfer
from PPEDeductions
Up to 31-3-2016
As at 31-3-2016
As at 1-4-2015
Land 41.22 – – – 41.22 – – – – – 41.22 41.22
Buildings 429.96 – – 7.14 422.82 – 17.14 – – 17.14 405.68 429.96
Total 471.18 – – 7.14 464.04 – 17.14 – – 17.14 446.90 471.18
Note: Depreciation is provided based on useful life supported by the technical evaluation considering business specific usage, the consumption pattern of the assets and the past performance of similar assets:
Sr. no. Class of assetsMinimum useful life
(in years)
Maximum useful life
(in years)
1. Buildings 3 60
Disclosure pursuant to Ind AS 40 “Investment Property”
a. Amount recognised in the Statement of Profit and Loss for investment property:
v crore
Sr.
no. Particulars
2016-17 2015-16
1. Rental income derived from investment property 149.01 153.68
2. Direct operating expenses arising from investment property that generated rental income 21.12 22.14
Notes forming part of the Financial Statements (contd.)
NOTE [2] (contd.)

259
b. Fair value of investment property: v 3412.55 crore as at March 31, 2017 (v 3220.45 crore as at March 31, 2016; v 2972.86 crore
as at April 1, 2015).
c. The fair values of investment properties have been determined with the help of internal architectural department and independent
valuer on a case to case basis. Fair value of properties that are evaluated by independent valuer v 3012.75 crore (As at March 31,
2016: v 2475.77 crore, as at April 1, 2015: v 2319.23 crore). Valuation is based on government rates, market research, market
trend and comparable values as considered appropriate.
NOTE [4]
Other intangible assets and intangible assets under development
v crore
Class of assets
Cost Amortisation Book value
As at
1-4-2016Additions
Foreign
currency
fluctuation
Deductions As at
31-3-2017
Up to
31-3-2016
For the
period
Foreign
currency
fluctuation
Deductions Up to
31-3-2017
As at
31-3-2017
As at
31-3-2016
Specialised softwares 182.15 6.58 (0.01) 5.51 183.21 133.74 15.28 – 2.55 146.47 36.74 48.41
Technical know-how 23.03 20.93 – – 43.96 16.79 3.57 – – 20.36 23.60 6.24
New product design and
development 109.07 3.80 – – 112.87 25.14 23.03 – – 48.17 64.70 83.93
Total 314.25 31.31 (0.01) 5.51 340.04 175.67 41.88 – 2.55 215.00 125.04 138.58
Add: Intangible assets under development 201.25 158.91
326.29 297.49
v crore
Class of assets
Cost Amortisation Book value
As at
1-4-2015 Additions
Foreign
currency
fluctuation Deductions
As at
31-3-2016
Up to
1-4-2015
For the
period
Foreign
currency
fluctuation Deductions
Up to
31-3-2016
As at
31-3-2016
As at
1-4-2015
Specialised softwares 165.73 17.99 – 1.57 182.15 116.26 19.05 – 1.57 133.74 48.41 49.47
Technical know-how 19.09 3.94 – – 23.03 15.41 1.38 – – 16.79 6.24 3.68
New product design and
development 42.97 66.10 – – 109.07 11.18 13.96 – – 25.14 83.93 31.79
Total 227.79 88.03 – 1.57 314.25 142.85 34.39 – 1.57 175.67 138.58 84.94
Add: Intangible assets under development 158.91 189.50
297.49 274.44
Notes forming part of the Financial Statements (contd.)
NOTE [3] (contd.)

260
NOTE [4] (contd.)
Additions during the year
v crore
Class of assets
2016-17 2015-16
Internal
development
Acquired
- external
Total Internal
development
Acquired
- external
Total
Specialised softwares – 6.58 6.58 1.15 16.84 17.99
Technical know-how – 20.93 20.93 – 3.94 3.94
New product design and development 3.80 – 3.80 66.10 – 66.10
Total 3.80 27.51 31.31 67.25 20.78 88.03
Note: Depreciation is provided based on useful life supported by the technical evaluation considering business specific usage, the consumption pattern of the assets and the past performance of similar assets:
Sr. no. Class of assetsMinimum useful life
(in years)
Maximum useful life
(in years)
1. Specialised softwares 3 6
2. Technical know-how 3 13
3. New product design and development 3 5
NOTE [5]
Financial Assets: Investments - non-current
Particulars As at 31-3-2017 As at 31-3-2016 As at 1-4-2015
v crore v crore v crore v crore v crore v crore
(A) Investment in equity instruments
(a) Subsidiary companies 16381.00 15004.95 13396.84
(b) Associate companies 4.42 4.42 30.07
(c) Joint venture companies 2730.25 3680.50 3800.28
(d) Other companies 56.04 56.04 173.30
19171.71 18745.91 17400.49
(B) Investment in preference shares of
subsidiary companies (Debt portion) 605.10 441.95 45.65
19776.81 19187.86 17446.14
Details of Investments - non-current
Face value
per unit
Number of units
As at
31-3-2017
As at
31-3-2016
As at
1-4-2015
Particulars As at
31-3-2017
v v crore v crore v crore
(A) Investments in fully paid equity instruments
(a) Subsidiary companies:
(i) Investments in fully paid equity instruments:
L&T Valves Limited* 100 18,00,000 161.23 201.54 201.54
Bhilai Power Supply Company Limited 10 49,950 0.05 0.05 0.05
EWAC Alloys Limited 100 8,29,440 150.24 150.24 150.24
Hi-Tech Rock Products & Aggregates Limited 10 50,000 0.05 0.05 0.05
Kesun Iron and Steel Company Private Limited 10 9,500 0.01 0.01 0.01
Carried forward 311.58 351.89 351.89
Notes forming part of the Financial Statements (contd.)

261
NOTE [5]
Details of Investments - non-current (contd.)
Face value
per unit
Number of units
As at
31-3-2017
As at
31-3-2016
As at
1-4-2015
Particulars As at
31-3-2017
v v crore v crore v crore
(i) Investments in fully paid equity instruments (contd.)
Brought forward 311.58 351.89 351.89
Larsen & Toubro Consultoria E Projeto Ltda R$ 1 – – – 0.27
L&T Aviation Services Private Limited 10 4,56,00,000 45.60 45.60 45.60
L&T Capital Company Limited 10 50,000 0.05 0.05 22.00
L&T Cassidian Limited 10 37,000 0.04 0.04 0.04
L&T Finance Holdings Limited (quoted) 10 1,16,97,09,304 1468.18 1468.18 1575.15
L&T Construction Equipment Limited 10 12,00,00,000 84.32 84.32 84.32
L&T General Insurance Company Limited 10 – – 570.00 620.00
L&T Infocity Limited 10 – – – 16.02
L&T Metro Rail (Hyderabad) Limited 10 2,06,21,93,172 2062.19 20.31 19.82
L&T Natural Resources Limited 10 – – – 0.05
L&T Power Development Limited 10 3,11,27,00,000 3112.70 3112.70 2729.30
L&T Power Limited 10 51,157 0.05 0.05 0.05
L&T Powergen Limited 10 – – – 0.05
L&T Realty Limited 10 4,71,60,700 47.16 47.16 47.16
L&T Seawoods Limited 10 1,99,95,50,000 1999.55 1999.55 1999.55
L&T Shipbuilding Limited 10 43,06,80,000 430.68 818.68 818.68
L&T Solar Limited 10 – – – 0.05
L&T Electricals and Automation Limited* 10 74,38,796 40.36 0.05 0.05
L&T Hydrocarbon Engineering Limited 10 1,00,00,50,000 1000.05 1000.05 1000.05
L&T Technology Services Limited (Face value reduced from v 40 per
share to v 2 per share w.e.f April 1, 2016) (quoted) 2 9,12,90,392 942.62 300.00 300.00
L&T-Valdel Engineering Limited 10 – – – 23.89
Larsen & Toubro Infotech Limited (quoted) 1 14,37,50,000 119.68 134.25 134.25
Larsen & Toubro International FZE AED
550500
– – – 1147.40
Larsen & Toubro Arabia LLC SAR 1000 – – 11.08 11.08
Larsen & Toubro Hydrocarbon International Limited LLC SAR 1000 450 0.68 0.68 0.68
Larsen & Toubro LLC USD 1 50,000 0.23 0.23 0.23
Larsen & Toubro (Saudi Arabia) LLC SAR 1000 625 1.06 1.06 –
Spectrum Infotech Private Limited 10 4,40,000 6.80 6.80 6.80
L&T Infrastructure Engineering Limited 10 36,00,000 21.85 21.85 21.85
L&T Cutting Tools Limited 1000 68,000 0.30 0.30 0.30
L&T Global Holdings Limited USD 100 80,000 53.16 0.67 –
Marine Infrastructure Developer Private Limited 10 – – 0.01 –
Seawoods Realty Private Limited 10 10,000 0.01 – –
Seawoods Retail Private Limited 10 10,000 0.01 – –
11748.91 9995.56 10976.58
Notes forming part of the Financial Statements (contd.)

262
Notes forming part of the Financial Statements (contd.)
Face value
per unit
Number of units
As at
31-3-2017
As at
31-3-2016
As at
1-4-2015
Particulars As at
31-3-2017
v v crore v crore v crore
(ii) Preference shares - (equity portion)
L&T Shipbuilding Limited -12% Cumulative redeemable preference
shares, October 22, 2028 10 9,00,00,000 67.77 67.77 67.78
L&T Shipbuilding Limited -12% Non-convertible cumulative
redeemable preference shares, June 24, 2029 10 5,00,00,000 37.06 37.06 37.06
L&T Shipbuilding Limited -12% Non-convertible cumulative
redeemable at par preference shares, April 16, 2030 10 11,00,00,000 77.26 77.26 –
L&T Shipbuilding Limited - 9% Non-convertible, non-cumulative
redeemable at par preference shares, May 28, 2030 10 42,18,60,000 300.25 300.25 –
L&T Shipbuilding Limited - 9% Non-convertible, non-cumulative
redeemable at par preference shares, August 10, 2030 10 25,00,00,000 177.98 177.98 –
L&T Shipbuilding Limited - 9% Non-convertible, non-cumulative
redeemable at par preference shares, September 29, 2030 10 7,50,00,000 53.24 53.24 –
L&T Shipbuilding Limited - 9% Non-convertible, non-cumulative
redeemable at par preference shares, December 8, 2030 10 25,90,00,000 181.97 181.97 –
L&T Shipbuilding Limited - 9% Non-convertible, non-cumulative
redeemable at par preference shares, February 4, 2031 10 21,60,00,000 153.15 153.15 –
L&T Shipbuilding Limited - 9% Non-cumulative optionally convertible
and redeemable at par preference shares, March 28, 2032 10 38,80,00,000 276.23 – –
1324.91 1048.68 104.84
(iii) Preference share considered equity as per terms
L&T Technology Services Limited -10% Convertible non-cumulative
redeemable preference shares, February 14, 2024 10 – – 400.00 400.00
L&T Technology Services Limited -10% Convertible non-cumulative
redeemable preference shares, September 21, 2024 10 – – 350.00 350.00
L&T Seawoods Limited -10% Convertible non-cumulative redeemable
preference shares, March 30, 2022 2 1,03,60,00,000 1036.00 1036.00 1036.00
L&T Seawoods Limited -10% Non-cumulative, optionally convertible
and redeemable at par preference shares, May 12, 2022 2 4,80,00,000 48.00 48.00 –
L&T Seawoods Limited -10% Non-cumulative, optionally convertible
and redeemable at par preference shares, July 14, 2022 2 4,22,50,000 42.25 42.25 –
L&T Seawoods Limited -10% Non-cumulative, optionally convertible
and redeemable at par preference shares, September 4, 2022 2 4,20,00,000 42.00 42.00 –
L&T Hydrocarbon Engineering Limited -10% Convertible non-
cumulative redeemable preference shares, February 6, 2029 10 50,00,00,000 500.00 500.00 500.00
L&T Hydrocarbon Engineering Limited -12% Non-cumulative, optionally
convertible, redeemable preference shares, October 19, 2030 10 13,00,00,000 130.00 130.00 –
L&T Hydrocarbon Engineering Limited -12% Non-cumulative, optionally
convertible, redeemable preference shares, March 30, 2031 10 13,00,00,000 130.00 130.00 –
L&T Uttaranchal Hydropower Limited - 10% Non-cumulative, optionally
convertible and redeemable at par preference shares, May 10, 2030 2 52,30,00,000 523.00 523.00 –
L&T Uttaranchal Hydropower Limited - 10% Non-cumulative, optionally
convertible and redeemable at par preference shares, June 8, 2030 2 1,65,00,000 16.50 16.50 –
Carried forward 2467.75 3217.75 2286.00
NOTE [5]
Details of Investments - non-current (contd.)

263
Face value
per unit
Number of units
As at
31-3-2017
As at
31-3-2016
As at
1-4-2015
Particulars As at
31-3-2017
v v crore v crore v crore
(iii) Preference shares considered equity as per terms (contd.)
Brought forward 2467.75 3217.75 2286.00
L&T Uttaranchal Hydropower Limited - 10% Non-cumulative, optionally
convertible and redeemable at par preference shares, July 21, 2030 2 70,00,000 7.00 7.00 –
L&T Uttaranchal Hydropower Limited - 10% Non-cumulative, optionally
convertible and redeemable at par preference shares, October 16,
2030 2 3,20,00,000 32.00 32.00 –
L&T Uttaranchal Hydropower Limited - 10% Non-cumulative, optionally
convertible and redeemable at par preference shares, January 10,
2031 2 70,00,000 7.00 7.00 –
L&T Uttaranchal Hydropower Limited - 10% Non-cumulative, optionally
convertible and redeemable at par preference shares, March 17, 2031 2 1,92,50,000 19.25 19.25 –
L&T Uttaranchal Hydropower Limited - 10% Non-cumulative optionally
convertible and redeemable at par preference shares, May 1, 2031 2 92,50,000 9.25 – –
L&T Uttaranchal Hydropower Limited - 10% Non-cumulative optionally
convertible and redeemable at par preference shares, June 17, 2031 2 1,05,00,000 10.50 – –
L&T Uttaranchal Hydropower Limited - 10% Non-cumulative optionally
convertible and redeemable at par preference shares, July 19, 2031 2 80,00,000 8.00 – –
L&T Uttaranchal Hydropower Limited - 10% Non-cumulative optionally
convertible and redeemable at par preference shares, October 4,
2031 2 1,45,00,000 14.50 – –
L&T Uttaranchal Hydropower Limited - 10% Non-cumulative optionally
convertible and redeemable at par preference shares, December 8,
2031 2 1,70,50,000 17.05 – –
L&T Uttaranchal Hydropower Limited - 10% Non-cumulative optionally
convertible and redeemable at par preference shares, February 10,
2032 2 1,87,00,000 18.70 – –
L&T Uttaranchal Hydropower Limited - 10% Non-cumulative optionally
convertible and redeemable at par preference shares, February 20,
2032 2 10,00,000 1.00 – –
L&T Uttaranchal Hydropower Limited - 10% Non-cumulative optionally
convertible and redeemable at par preference shares, March 29,
2032 2 1,75,00,000 17.50 – –
L&T Realty Limited - 12% Convertible non-cumulative redeemable at
par preference shares, May 26, 2025 10 64,83,00,000 648.30 648.30 –
3277.80 3931.30 2286.00
(iv) Other equity investments
L&T Aviation Services Private Limited 0.64 0.67 0.68
L&T Shipbuilding Limited 28.74 28.74 28.74
29.38 29.41 29.42
Total - (a) = (i)+(ii)+(iii)+(iv) 16381.00 15004.95 13396.84
Notes forming part of the Financial Statements (contd.)
NOTE [5]
Details of Investments - non-current (contd.)

264
Face value
per unit
Number of units
As at
31-3-2017
As at
31-3-2016
As at
1-4-2015
Particulars As at
31-3-2017
v v crore v crore v crore
(b) Associate companies:
Gujarat Leather Industries Limited 10 7,35,000 – – –
JSK Electricals Private Limited 10 – – – 2.12
L&T-Chiyoda Limited 10 – – – 4.50
Magtorq Private Limited 100 9,000 4.42 4.42 4.42
Rishi Consfab Private Limited 10 – – – 2.70
Salzer Electronics Limited (quoted) 10 – – – 16.33
4.42 4.42 30.07
(c) Joint venture companies:
(i) Investments in fully paid equity instruments
Ahmedabad-Maliya Tollway Limited (formerly known as L&T Ahmedabad-
Maliya Tollway Limited) [v 1000 (previous year: v 1000)]
10 100 – – –
L&T-Gulf Private Limited 10 – – – 4.00
L&T Sapura Offshore Private Limited 10 – – – 0.01
L&T Sapura Shipping Private Limited 10 – – – 95.31
L&T Chennai-TADA Tollway Limited [v 1000 (previous year: v 1000)] 10 100 – – –
Devihalli Hassan Tollway Limited (formerly known as L&T Devihalli
Hassan Tollway Limited) [v 1000 (previous year: v 1000)]
10 100 – – –
L&T Halol-Shamlaji Tollway Limited [v 1000 (previous year: v 1000)] 10 100 – – –
L&T Howden Private Limited 10 1,50,30,000 15.03 15.03 15.03
L&T Infrastructure Development Projects Limited 10 31,28,69,096 1746.48 2696.48 2696.48
L&T Kobelco Machinery Private Limited 10 2,55,00,000 25.50 25.50 25.50
L&T Krishnagiri Walajahpet Tollway Limited [v 26000
(previous year: v 26000)]
10 2,600 – – –
L&T-MHPS Boilers Private Limited 10 11,93,91,000 119.39 119.39 119.39
L&T-MHPS Turbine Generators Private Limited 10 36,24,06,000 362.41 362.41 362.41
L&T Rajkot-Vadinar Tollway Limited [v 1000 (previous year: v 1000)] 10 100 – – –
L&T Samakhiali Gandhidham Tollway Limited 10 13,000 0.01 0.01 0.01
L&T Special Steels and Heavy Forgings Private Limited 10 41,92,84,000 419.28 419.28 419.28
L&T Transportation Infrastructure Limited 10 1,08,64,000 10.86 10.86 10.86
L&T-Sargent & Lundy Limited 10 27,82,736 0.82 0.82 0.82
PNG Tollway Limited 10 2,24,22,660 22.42 22.42 43.97
Raykal Aluminum Company Private Limited 10 37,750 0.04 0.04 0.04
2722.24 3672.24 3793.11
(ii) Other equity investments:
L&T-MHPS Boilers Private Limited 2.24 2.27 2.27
L&T-MHPS Turbine Generators Private Limited 5.77 5.99 4.90
8.01 8.26 7.17
Total - (c) = (i) + (ii) 2730.25 3680.50 3800.28
(d) Other companies:
International Seaport Dredging Limited 10000 15,899 – – –
BBT Elevated Road Private Limited 10 1,00,000 0.10 0.10 0.10
Utmal Multi purpose Service Co-operative Society Limited (B Class)
(non-trade investments) [v 30000 (previous year: v 30000)] 100 300 – – –
Astra Microwave Products Limited (quoted) 2 – – – 117.26
Tidel Park Limited [Note 45(f)] 10 40,00,000 55.94 55.94 55.94
56.04 56.04 173.30
Total - (A) = (a)+(b)+(c)+(d) 19171.71 18745.91 17400.49
Notes forming part of the Financial Statements (contd.)
NOTE [5]
Details of Investments - non-current (contd.)

265
Face value
per unit
Number of units
As at
31-3-2017
As at
31-3-2016
As at
1-4-2015
Particulars As at
31-3-2017
v v crore v crore v crore
(B) Investments in preference shares of subsidiary companies
(Fair value debt portion):
L&T Shipbuilding Limited -12% Cumulative redeemable preference shares,
October 22, 2028 10 9,00,00,000 35.23 30.84 29.91
L&T Shipbuilding Limited -12% Non-convertible cumulative redeemable
preference shares, June 24, 2029 10 5,00,00,000 18.53 16.38 15.74
L&T Shipbuilding Limited -12% Non-convertible cumulative redeemable at par
preference shares, April 16, 2030 10 11,00,00,000 37.41 33.65 –
L&T Shipbuilding Limited - 9% Non-convertible, non-cumulative redeemable at
par preference shares, May 28, 2030 10 42,18,60,000 142.09 127.80 –
L&T Shipbuilding Limited - 9% Non-convertible, non-cumulative redeemable at
par preference shares, August 10, 2030 10 25,00,00,000 82.81 74.45 –
L&T Shipbuilding Limited - 9% Non-convertible, non-cumulative redeemable at
par preference shares, September 29, 2030 10 7,50,00,000 24.56 22.08 –
L&T Shipbuilding Limited - 9% Non-convertible, non-cumulative redeemable at
par preference shares, December 8, 2030 10 25,90,00,000 83.48 75.02 –
L&T Shipbuilding Limited - 9% Non-convertible, non-cumulative redeemable at
par preference shares, February 4, 2031 10 21,60,00,000 68.71 61.73 –
L&T Shipbuilding Limited - 9% Non-cumulative optionally convertible and
redeemable at par preference shares, March 28, 2032 10 38,80,00,000 112.28 – –
Total - (B) 605.10 441.95 45.65
Total investments non-current (A)+(B) 19776.81 19187.86 17446.14
Details of quoted/unquoted investments:
ParticularsAs at
31-3-2017As at
31-3-2016As at
1-4-2015
v crore v crore v crore
(a) Aggregate amount of quoted investments and market value thereof;
Book value 2530.48 1468.18 1708.73
Market value 31883.81 7468.59 8060.92
(b) Aggregate amount of unquoted investments;
Book value 17246.33 17719.68 15737.41
(c) Aggregate amount of impairment in value of investments is v 966.46 crore
(As at 31-3-2016: v 151.46 crore, as at 1-4-2015: v 16.46 crore)
* The scheme of arrangement between L&T Valves Limited and L&T Electrical & Automation Limited was approved by National Company Law Tribunal on April
27, 2017 with appointed date as November 1, 2016. Pursuant to the scheme L&T Electrical & Automation Limited issued 73,88,796 shares to Larsen &
Toubro Limited as a consideration towards transfer of certain assets by L&T Valves Limited. The value of shares issued is derived based on fair value of assets
transferred to the total value of assets of L&T Valves Limited as at appointed date. Accordingly the value of investment in L&T Electrical and Automation
Limited was increased by v 40.31 crore and reduced in L&T Valves Limited by v 40.31 crore during the year 2016-17.
Notes forming part of the Financial Statements (contd.)
NOTE [5]
Details of Investments - non-current (contd.)

266
NOTE [6]
Financial Assets: Loans - non-current
Particulars As at 31-3-2017 As at 31-3-2016 As at 1-4-2015
v crore v crore v crore v crore v crore v crore
Unsecured security deposits, considered goods: 84.20 90.29 66.80
Unsecured security deposits, doubtful: 0.45 0.45 0.45
Less: Provision for doubtful security deposits 0.45 0.45 0.45
– – –
Secured long term loans and advances to related
parties [KMPs] – – 0.01
Unsecured long term loans and advances to related
parties:
Subsidiary companies:
Advances towards equity commitment [Note 38(B)] 6.35 5.25 1986.84
Inter-corporate deposits [Note 37 & 38(A)(i)] 512.00 1921.00 371.00
518.35 1926.25 2357.84
Joint venture:
Inter-corporate deposits [Note 37 & 38(A)(i)] 1167.22 779.72 572.71
Other secured loans, considered good:
Loans against mortgage of house property 0.74 1.24 2.36
Other inter-corporate deposits – – 3.00
0.74 1.24 5.36
Other unsecured loans, considered good:
Advance recoverable in cash 0.03 0.02 0.14
Other loans unsecured, doubtful:
Doubtful other loans and advances 2.28 2.85 2.28
Less: Allowance for doubtful advances 2.28 2.85 2.28
– – –
1770.54 2797.52 3002.86
NOTE [7]
Other financial assets - non-current
Particulars As at 31-3-2017 As at 31-3-2016 As at 1-4-2015
v crore v crore v crore
Cash and bank balances not available for immediate
use [Note 7(a)] 223.56 98.18 75.59
Forward contract receivables 273.76 367.68 258.55
Embedded derivative receivables – 2.38 0.23
Premium receivable on financial guarantee contracts 3.01 5.85 12.09
500.33 474.09 346.46
Notes forming part of the Financial Statements (contd.)

267
7(a) Particulars of cash and bank balances not available for immediate use
v crore
Sr. no.
ParticularsAs at
31-3-2017As at
31-3-2016As at
1-4-2015
1. Amount received (including interest accrued thereon) from customers of property development business – to be handed over to housing society on its formation 23.51 21.50 20.72
2. Contingency deposits (including interest accrued thereon) received from customers of property development business towards their sales tax liability - to be refunded/adjusted depending on the outcome of the legal case 23.09 20.79 16.73
3. Other bank balances (including interest accrued thereon) not available for immediate use being in the nature of security offered for bids submitted, loans availed etc. 342.12 244.56 228.55
Total 388.72 286.85 266.00
Less: Amount reflected under current assets [Note 13] 165.16 188.67 190.41
Amount reflected under other financial assets - non-current [Note 7] 223.56 98.18 75.59
NOTE [8]
Other non-current assets
Particulars As at 31-3-2017 As at 31-3-2016 As at 1-4-2015
v crore v crore v crore
Capital advances:
Secured – 1.15 1.63
Unsecured 66.06 36.01 57.46
Advances recoverable other than in cash 2108.85 1713.30 1365.28
Current tax receivable (net) 47.76 36.24 25.85
2222.67 1786.70 1450.22
NOTE [9]
Inventories (at cost or net realisable value whichever is lower)
Particulars As at 31-3-2017 As at 31-3-2016 As at 1-4-2015
v crore v crore v crore
Raw materials [includes goods-in-transit v 1.86 crore (As at 31-3-2016: v 7.10 crore, as at 1-4-2015: v 19.96 crore)]
328.80 356.63 438.52
Components [includes goods-in-transit v 16.30 crore (As at 31-3-2016: v 7.98 crore, as at 1-4-2015: v 17.73 crore)]
264.40 304.27 394.34
Construction materials [includes goods-in-transit v 55.70 crore (As at 31-3-2016: v 113.42 crore, as at 1-4-2015: v 74.34 crore)]
61.59 117.85 76.27
Manufacturing work-in-progress 360.01 372.18 571.94
Finished goods 221.52 161.68 261.20
Stock-in-trade [includes goods-in-transit v 18.77 crore (As at 31-3-2016: v 34.80 crore, as at 1-4-2015: v 35.95 crore)]
169.68 159.77 161.13
Stores and spares [includes goods-in-transit v 3.59 crore (As at 31-3-2016: v 2.69 crore, as at 1-4-2015: v 6.34 crore)]
71.72 170.12 149.78
Loose tools 3.31 7.79 6.48
Property development related work-in-progress [Note 48(c)(iv)]
281.83 304.82 201.11
1762.86 1955.11 2260.77
Note: During the year R 17.92 crore (previous year: R 35.36 crore) was recognised as expense towards write-down of inventory.
Notes forming part of the Financial Statements (contd.)

268
NOTE [10]
Financial Assets: Investments - current
Particulars As at 31-3-2017 As at 31-3-2016 As at 1-4-2015
v crore v crore v crore v crore v crore v crore
(A) Government and trust securities 779.59 1077.88 1510.75
(B) Debentures and bonds
(i) Subsidiary companies 22.75 22.49 23.00
(ii) Others 1148.71 1022.67 942.82
1171.46 1045.16 965.82
(C) Mutual funds 5031.03 2680.28 3041.48
6982.08 4803.32 5518.05
Details of current investments
Number of units
Particulars Face value
per unit
As at
31-3-2017
As at
31-3-2017
As at
31-3-2016
As at
1-4-2015
v v crore v crore v crore
(A) Government and trust securities (quoted):
8.28% Government of India Bonds 2032 100 5,00,000 5.36 5.23 5.22
7.16% Government of India Bonds 2023 100 – – – 83.75
8.15% Government of India Bonds 2022 100 20,00,000 21.65 20.91 20.81
8.33% Government of India Bonds 2026 100 75,00,000 81.86 79.33 78.94
8.28% Government of India Bonds 2027 100 24,00,000 25.84 128.74 103.92
9.20% Government of India Bonds 2030 100 1,77,84,000 204.56 467.16 291.77
8.32% Government of India Bonds 2032 100 15,00,000 16.47 15.73 15.85
6.90% Oil Mktg Cos GOI Special Bonds 2026 100 13,00,000 12.71 12.44 12.05
9.23% Government of India Bonds 2043 100 2,45,00,000 298.13 348.34 –
8.83% Government of India Bonds 2023 100 – – – 246.07
9.23% Government of India Bonds 2043 100 – – – 353.33
8.17% Government of India Bonds 2044 100 – – – 32.10
8.27% Government of India Bonds 2020 100 – – – 266.92
7.59% Government of India Bonds 2026 100 10,00,000 10.65 – –
7.59% Government of India Bonds 2029 100 1,00,00,000 102.36 – –
Total - (A) 779.59 1077.88 1510.75
(B) Debentures and bonds (quoted)
(i) Subsidiary companies:
L&T Finance Limited - 10.24% Secured redeemable non-convertible
Debenture, September 17, 2019 1000 2,15,770 22.75 22.49 23.00
Total - (i) 22.75 22.49 23.00
(ii) Other debentures and bonds:
6.86% IIFCL Tax Free Bonds March 26, 2023 1000 – – – 27.68
7.18% IRFC Ltd. Tax Free Bonds February 19, 2023 1000 – – – 349.35
10.75% The Tata Power Co. Ltd. NCD August 21, 2072 1000000 1,037 132.36 128.90 136.26
8.00% Indian Overseas Bank Bonds March 13, 2016 1000000 – – – 4.60
8.20% PFC Ltd. Tax Free Bonds February 1, 2022 1000 6,04,355 74.83 74.22 74.37
Carried forward 207.19 203.12 592.26
Notes forming part of the Financial Statements (contd.)

269
Number of units
Particulars Face value
per unit
As at
31-3-2017
As at
31-3-2017
As at
31-3-2016
As at
1-4-2015
v v crore v crore v crore
(ii) Other debentures and bonds:
Brought forward 207.19 203.12 592.26
8.46% PFC Ltd. Tax Free Bonds August 30, 2028 1000000 27 3.83 31.50 31.50
1.44% Inflation Indexed Bonds June 5, 2023 100 50,00,000 51.62 47.49 43.12
10.05% HDB Financial Services Ltd. Bonds SR-I/1/5 December 20, 2023 1000000 – – – 29.20
10.20% HDB Financial Services Ltd. Bonds August 9, 2022 1000000 – – – 2.43
8.41% NTPC Ltd. Tax Free Bonds SR-1A December 16, 2023 1000 79,162 10.23 10.10 10.11
8.46% REC Ltd. Tax Free Bonds SR-3B August 29, 2028 1000000 70 9.92 51.37 51.35
ECL Finance Ltd. NCD SR-J5K403 November 4, 2015 10000000 – – – 24.16
ECL Finance Ltd. NCD SR-L5L402 December 15, 2015 10000000 – – – 26.31
Edelweiss Finance & Investments Ltd. NCD SR-A6A501 January 6, 2016 10000000 – – – 29.73
Edelweiss Finance & Investments Ltd. NCD SR-A6A502 January 8, 2016 10000000 – – – 29.88
Edelweiss Finance & Investments Ltd. NCD SR-A6A503 January 11, 2016 10000000 – – – 27.23
Edelweiss Finance & Investments Ltd. NCD SR-K5L401 December 17, 2015 10000000 – – – 26.89
8.70% PNB Housing Finance Ltd. Bonds SR-III November 24, 2024 1000000 – – – 15.50
7.40% Syndicate Bank TI-2 SR-8 NCD April 20, 2015 1000000 – – – 3.17
ECL Finance Ltd. NCD SR-D6D502A- April 26, 2016 10000000 – – 32.56 –
ECL Finance Ltd. NCD SR-E6E501A - May 11, 2016 10000000 – – 28.90 –
ECL Finance Ltd. NCD SR-C7C601A March 22, 2017 10000000 – – 24.28 –
ECL Finance Ltd. NCD SR-C7C601B March 22, 2017 10000000 – – 24.28 –
ECL Finance Ltd. NCD SR-C7C601C March 22, 2017 10000000 – – 24.28 –
ECL Finance Ltd. NCD SR-C7C601D March 22, 2017 10000000 – – 24.28 –
ECL Finance Ltd. NCD SR-C7C601E March 22, 2017 10000000 – – 24.25 –
ECL Finance Ltd. NCD SR-C7C601F March 22, 2017 10000000 – – 24.90 –
ECL Finance Ltd. NCD SR-A8L601A 10000000 25 27.61 – –
ECL Finance Ltd. NCD SR-A8L601B 10000000 25 27.61 – –
ECL Finance Ltd. NCD SR-A8L601C 10000000 22 24.29 – –
Edelweiss Finvest Private Limited SR-B8B702A BR NCD March 26, 2018 10000000 25 24.40 – –
Edelweiss Finvest Private Limited SR-B8B702B BR NCD March 26, 2018 10000000 25 24.40 – –
Edelweiss Finvest Private Limited SR-B8B702C BR NCD March 26, 2018 10000000 25 24.40 – –
Edelweiss Finvest Private Limited SR-B8B702D BR NCD March 26, 2018 10000000 25 24.40 – –
Edelweiss Finvest Private Limited SR-B8B702E BR NCD March 26, 2018 10000000 25 25.24 – –
Edelweiss Finance & Investments Ltd.NCD K6K501A November 4, 2016 10000000 – – 23.68 –
Edelweiss Finance & Investments Ltd. NCD SR-K6K502A November 14, 2016 2500000 – – 22.46 –
ECL Finance Ltd. NCD SR-B7B601A February 15, 2017 10000000 – – 23.12 –
ECL Finance Ltd. NCD SR-B7B601B February 15, 2017 10000000 – – 23.12 –
8.60% LTIDPL NCD December 26, 2016 1000000 2,500 264.42 – –
Indiabulls Housing Finance Limited 9 LOA June 28, 2018 1000000 100 10.86 – –
6.86% IIFCL Tax Free Bonds March 26, 2023 1000 2,50,000 28.64 27.88 –
7.18% IRFC Ltd. Tax Free Bonds February 19, 2023 1000 30,00,000 359.67 351.08 –
Total - (ii) 1148.71 1022.67 942.82
Total - (B) = (i) + (ii) 1171.46 1045.16 965.82
Notes forming part of the Financial Statements (contd.)
NOTE [10]
Details of current investments (contd.)

270
Number of units
Particulars Face value
per unit
As at
31-3-2017
As at
31-3-2017
As at
31-3-2016
As at
1-4-2015
v v crore v crore v crore
(C) Mutual funds (unquoted):
HDFC Liquid Fund - Growth 10 – – – 50.02
SBI Premier Liquid Fund - Regular Plan 1000 11,78,787 300.08 – –
JP Morgan India Liquid Fund - Super IP - Growth 10 – – – 50.02
HDFC F R I F - STF - WP - Growth 10 1,99,47,661 56.39 – –
LIC Nomura MF Liquid Fund - Growth 10 – – – 50.02
HSBC Cash Fund - Growth 10 – – – 100.06
Reliance Medium Term Fund - Direct Plan - Growth 1000 10,33,31,866 358.46 – –
DWS Short Maturity Fund - Direct Plan - Annual Bonus 10 – – – 118.47
JM Money Manager Fund - Super Plus Plan - Bonus 10 – – – 360.94
DWS Treasury Fund - Investment Plan - Direct Plan - Bonus 10 – – – 21.49
IDFC Cash Fund - Reg - Growth 1000 – – – 200.13
L&T Floating Rate Fund Direct Plan - Growth 10 – – – 25.57
L&T Liquid Fund - Growth 1000 – – 300.27 581.54
SBI Premier Liquid Fund - Regular Plan - Growth 1000 76,64,299 1951.09 100.13 100.05
DWS Ultra Short Term Fund - Direct Plan - Annual Bonus 10 – – – 37.55
Principal Cash Mgmt Fund - Regular Plan - Growth 1000 – – – 20.01
Birla Sun Life Cash Plus - Regular Plan - Growth 100 38,39,652 100.03 200.19 100.07
Pramerica Liquid Fund - Growth 1000 – – – 20.01
L&T Emerging Businesses Fund - Direct Plan - Growth 10 – – 14.24 14.57
JM Arbitrage Advantage Fund - Direct Plan - Bonus 10 – – – 487.77
ICICI Prudential Flexible Income - Regular Plan - Growth 10 98,79,555 307.59 – –
L&T Business Cycles Fund - Direct Plan - Growth 10 – – – 12.44
L&T Resurgent India Corporate Bond Fund - Direct Plan - Growth 10 – – – 10.19
DSP BlackRock India Tiger Fund - Reg - Growth 10 – – – 5.23
DSP BlackRock Small and Midcap Fund - Reg - Growth 1000 53,87,931 26.55 – –
IDFC Sterling Equity Fund - Regular Plan - Growth 10 – – – 10.42
BNP Paribas Overnight Fund - Growth 10 4,01,559 100.03 – 100.05
Indiabulls Liquid Fund - Growth 10 3,16,046 50.01 – –
Taurus Liquid Fund - Super IP - Growth 1000 – – – 100.04
UTI Liquid Fund - Cash Plan - IP - Growth 1000 – – – 100.05
ICICI Prudential Money Market Fund - Regular Plan - Growth 1000 – – – 100.04
DWS Treasury Fund - Cash - Reg - Growth 10 – – – 50.03
Reliance Liquid Fund - TP - Growth 1000 – – 400.37 100.05
DWS Ultra Short Term Fund - Direct Plan - Growth 10 – – – 50.45
HDFC Small & Midcap Fund - Growth 10 – – 31.89 32.80
Birla Sun Life Manufacturing Equity Fund - Direct - Dividend 10 – – – 10.14
Kotak Floater - ST - Growth 1000 3,75,507 100.03 300.27 –
UTI Money Market - IP - Growth 1000 – – 130.12 –
L&T Resurgent India Corporate Bond Fund - Dividend 10 1,08,25,229 12.00 10.99 –
L&T Arbitrage Opportunities Fund - Growth 10 – – – 21.26
DSP BlackRock India Tiger Fund - Direct - Growth 10 62,00,166 53.31 – –
Carried forward 3451.57 1488.48 3041.48
Notes forming part of the Financial Statements (contd.)
NOTE [10]
Details of current investments (contd.)

271
Number of units
Particulars Face value
per unit
As at
31-3-2017
As at
31-3-2017
As at
31-3-2016
As at
1-4-2015
v v crore v crore v crore
(C) Mutual funds:
Brought forward 3451.57 1488.48 3041.48
Birla Sun Life Floating Rate Fund - LTP-Direct Plan - Growth 10 64,41,412 129.25 – –
Tata Infrastructure Fund - Direct - Growth 10 1,00,77,922 53.12 – –
Reliance Mid & Small Cap Fund - Direct -Growth 10 1,23,49,155 52.72 – –
ICICI Pru Multicap Plan - Direct - Growth 10 20,13,288 52.98 – –
Kotak Emerging Equity-Direct-Dividend Reinvestment 10 75,48,765 26.52 – –
Axis Enhanced Arbitrage Fund Direct Growth 10 2,06,34,724 25.15 – –
BSL Pure Value Fund - Growth - Direct 10 98,69,116 52.54 – –
JM Equity Fund Quarterly Dividend Payout-Regular 1000 29,13,16,266 688.04 – –
JM Balanced Fund - Direct -Quarterly Dividend 1000 6,80,64,962 134.60 – –
JM Arbitrage Advantage Fund-Regular Plan-Quarterly Dividend 1000 34,16,26,312 400.56 – –
JM Arbitrage Adv Fund - Ann Bonus - Principal - Direct 10 – – 515.43 –
JM Balanced Fund - Quarterly Dividend Payout 10 – – 453.68 –
JM Equity Fund Half Yearly Dividend Payout 10 – – 211.50 –
L&T Business Cycles Fund - Direct Plan - Dividend Payout 10 – – 11.19 –
Total - (C) 5031.03 2680.28 3041.48
Total current investments (A)+(B)+(C) 6982.08 4803.32 5518.05
Details of quoted/unquoted investments:
ParticularsAs at
31-3-2017As at
31-3-2016As at
1-4-2015
v crore v crore v crore
(a) Aggregate amount of quoted current investments and market value thereof;
Book value 1951.05 2123.04 2476.57
Market value 1951.05 2123.04 2476.57
(b) Aggregate amount of unquoted current investments;
Book value (accounted based on NAV) 5031.03 2680.28 3041.48
Notes forming part of the Financial Statements (contd.)
NOTE [10]
Details of current investments (contd.)

272
Notes forming part of the Financial Statements (contd.)
NOTE [11]
Financial Assets - current: Trade receivables
Particulars As at 31-3-2017 As at 31-3-2016 As at 1-4-2015
v crore v crore v crore v crore v crore v crore
Secured, considered good – 0.50 4.71
Unsecured:
Considered good 19919.97 18967.25 16785.29
Considered doubtful 1916.66 1568.79 1008.78
21836.63 20536.04 17794.07
Less: Allowance for doubtful debts 1916.66 1568.79 1008.78
19919.97 18967.25 16785.29
19919.97 18967.75 16790.00
NOTE [12]
Financial Assets - current: Cash and cash equivalents
Particulars As at 31-3-2017 As at 31-3-2016 As at 1-4-2015
v crore v crore v crore
Balance with banks 1823.24 1590.10 2329.40
Cheques and drafts on hand 365.13 456.40 168.77
Cash on hand 1.78 2.43 90.81
Fixed deposits with banks (maturity less than 3 months) 12.11 26.90 175.80
2202.26 2075.83 2764.78
NOTE [13]
Financial Assets - current: Other bank balances
Particulars As at 31-3-2017 As at 31-3-2016 As at 1-4-2015
v crore v crore v crore
Fixed deposits with banks 1383.51 1259.94 22.15
Earmarked balances with banks - unclaimed dividend 46.61 39.33 33.59
Margin money deposits with banks 4.69 6.49 9.69
Cash and bank balances not available for
immediate use [Note 7(a)] 165.16 188.67 190.41
1599.97 1494.43 255.84

273
Notes forming part of the Financial Statements (contd.)
NOTE [14]
Financial Assets: Loans - current
Particulars As at 31-3-2017 As at 31-3-2016 As at 1-4-2015
v crore v crore v crore v crore v crore v crore
Unsecured security deposits, considered good 305.29 266.08 266.62
Unsecured security deposits, doubtful 3.69 3.31 5.69
Less: Provision for doubtful security deposits 3.69 3.31 5.69
– – –
Unsecured long term loans and advances to related
parties:
Subsidiary companies
Inter-corporate deposits [Note 37 & 38(A)(i)] 1595.67 1984.69 1000.86
Associate companies
Advances – – 3.65
Joint ventures
Inter-corporate deposits [Note 37 & 38(A)(i)] 18.20 105.04 39.51
Other secured loans, considered good:
Loans against mortgage of house property 0.24 0.79 0.89
Other inter-corporate deposits – 75.62 70.00
0.24 76.41 70.89
Other unsecured loans, considered good:
Others 0.01 0.04 0.08
1919.41 2432.26 1381.61
NOTE [15]
Other current financial assets
Particulars As at 31-3-2017 As at 31-3-2016 As at 1-4-2015
v crore v crore v crore v crore v crore v crore
Advances to related parties:
Subsidiary companies 706.04 597.18 482.00
Associate companies 3.96 5.83 –
Joint venture companies 67.49 46.02 46.91
777.49 649.03 528.91
Advances recoverable in cash 1188.73 1082.35 878.32
Premium receivable on financial guarantee contracts 6.82 15.54 8.76
Embedded derivative receivable 81.59 133.57 12.10
Doubtful advances:
Deferred credit sale of ships 26.97 27.55 25.99
Other loans and advances 131.35 133.74 136.32
158.32 161.29 162.31
Less: Allowance for doubtful loans and advances 158.32 161.29 162.31
– – –
2054.63 1880.49 1428.09

274
NOTE [16]
Other current assets
Particulars As at 31-3-2017 As at 31-3-2016 As at 1-4-2015
v crore v crore v crore
Due from customers (construction and project related
activity) 21329.29 21854.21 18935.75
Due from customers (property development activity)
[Note 48(c)]
71.28 10.24 48.71
Unbilled revenue including retention money 8027.61 7286.65 6158.59
Balances with excise customs port trust 86.52 91.20 86.75
Advances recoverable other than in cash 3701.94 4188.96 3168.79
Government grants receivable 45.57 45.57 49.73
Others 1.49 5.12 6.51
33263.70 33481.95 28454.83
NOTE [17]
Equity share capital
(a) Share capital authorised, issued, subscribed and paid up:
Particulars
As at 31-3-2017 As at 31-3-2016 As at 1-4-2015
Number of shares
v crore Number of shares
v crore Number of shares
v crore
Authorised:
Equity shares of v 2 each 1,62,50,00,000 325.00 1,62,50,00,000 325.00 1,62,50,00,000 325.00
Issued, subscribed and fully paid up:
Equity shares of v 2 each 93,29,65,803 186.59 93,14,78,845 186.30 92,95,62,061 185.91
(b) Reconciliation of the number of equity shares and share capital:
Particulars
2016-17 2015-16
Number of shares
v crore Number of shares
v crore
Issued, subscribed and fully paid up equity shares outstanding at the beginning of the
year 93,14,78,845 186.30 92,95,62,061 185.91
Add: Shares issued on exercise of employee stock options during the year 14,86,958 0.29 19,16,784 0.39
Issued, subscribed and fully paid up equity shares outstanding at the end of the year 93,29,65,803 186.59 93,14,78,845 186.30
(c) Terms/rights attached to equity shares:
The Company has only one class of share capital, i.e., equity shares having face value of v 2 per share. Each holder of equity share
is entitled to one vote per share.
Notes forming part of the Financial Statements (contd.)

275
(d) Shareholder holding more than 5% of equity shares as at the end of the year:
Name of the shareholders
As at 31-3-2017 As at 31-3-2016 As at 1-4-2015
Number of shares
Shareholding %
Number of shares
Shareholding %
Number of shares
Shareholding %
Life Insurance Corporation of India 14,64,24,938 15.69 14,64,19,088 15.72 15,55,22,285 16.73
L&T Employees Welfare Foundation 11,47,52,281 12.30 11,47,52,281 12.32 11,16,06,174 12.01
Administrator of the Specified Undertaking
of the Unit Trust of India 6,11,02,860 6.55 7,59,26,462 8.15 7,59,25,962 8.17
(e) Shares reserved for issue under options outstanding as at the end of the year on un-issued share capital:
Particulars
As at 31-3-2017 As at 31-3-2016 As at 1-4-2015
Number of equity shares
to be issued as fully paid
v crore (at face value)
Number of equity shares to
be issued as fully paid
v crore (at face value)
Number of equity shares to
be issued as fully paid
v crore (at face value)
Employee stock options granted and
outstanding # 42,47,360 0.85* 57,93,042 1.16* 77,08,842 1.54*
0.675% 5 years & 1 day US$ denominated
foreign currency convertible bonds
(FCCB) ## 63,46,986 1.27** 63,46,986 1.27** 63,46,986 1.27**
* The equity shares will be issued at a premium of v 146.71 crore (as at 31-3-2016: v 203.97 crore and as at 1-4-2015: v 278.09 crore)
** The equity shares will be issued at a premium of v 1215.13 crore (as at 31-3-2016: v 1215.13 crore and as at 1-4-2015: v 1215.13 crore)
on the exercise of options by the bond holders
# Note 17(h) for terms of employee stock option schemes
## Note 19(b) for terms of foreign currency convertible bonds
(f) The aggregate number of equity shares allotted as fully paid up by way of bonus shares in immediately preceding five years ended
March 31, 2017 are 30,82,94,576 (previous period of five years ended March 31, 2016: 30,82,94,576 shares)
(g) The aggregate number of equity shares issued pursuant to contract, without payment being received in cash in immediately
preceding last five years ended on March 31, 2017 – Nil (previous period of five years ended March 31, 2016: Nil)
(h) Stock option schemes
(i) Terms:
A. The grant of options to the employees under the stock option schemes is on the basis of their performance and other
eligibility criteria. The options are vested equally over a period of 4 years [5 years in the case of series 2006(A)], subject
to the discretion of the management and fulfillment of certain conditions.
B. Options can be exercised anytime within a period of 7 years from the date of grant and would be settled by way of issue
of equity shares. Management has discretion to modify the exercise period.
Notes forming part of the Financial Statements (contd.)
NOTE [17]
Equity share capital (contd.)

276
(ii) The details of the grants under the aforesaid schemes under various series are summarised below:
Sr.
no.Series reference
2000 2002 (A) 2002 (B) 2003 ( A) 2003 (B) 2006 2006 (A)
2016-17 2015-16 2016-17 2015-16 2016-17 2015-16 2016-17 2015-16 2016-17 2015-16 2016-17 2015-16 2016-17 2015-16
1 Grant price - (v) 2.30 2.30 2.30 2.30 2.30 2.30 11.70 11.70 11.70 11.70 400.70 400.70 400.70 400.70
2 Grant dates 1-6-2000 19-4-2002 19-4-2002 23-5-2003 onwards 23-5-2003 onwards 1-9-2006 onwards 1-7-2007 onwards
3 Vesting commences on 1-6-2001 19-4-2003 19-4-2003 23-5-2004 onwards 23-5-2004 onwards 1-9-2007 onwards 1-7-2008 onwards
4 Options granted and outstanding at
the beginning of the year 25,200 25,200 32,250 32,250 59,550 59,550 47,178 47,178 5,26,919 5,85,284 2,57,366 3,04,656 48,44,579 66,54,724
5 Options lapsed during the year – – – – – – – – 41,662 40,611 35,747 11,270 4,54,865 4,42,400
6 Options granted during the year – – – – – – – – 89,100 1,50,400 – – 3,84,450 3,44,865
7 Options exercised during the year 12,000 – – – – – – – 1,47,226 1,68,154 45,035 36,020 12,82,697 17,12,610
8 Options granted and outstanding at
the end of the year 13,200 25,200 32,250 32,250 59,550 59,550 47,178 47,178 4,27,131 5,26,919 1,76,584 2,57,366 34,91,467 48,44,579
Of which
Options vested 13,200 25,200 32,250 32,250 59,550 59,550 47,178 47,178 75,692 96,458 1,76,584 2,57,366 17,46,787 23,34,008
Options yet to vest – – – – – – – – 3,51,439 4,30,461 – – 17,44,680 25,10,571
9 Weighted average remaining
contractual life of options (in years) Nil Nil Nil Nil Nil Nil Nil Nil 4.98 5.18 Nil Nil 3.48 3.61
(iii) The number and weighted average exercise price of stock options are as follows:
Particulars
2016-17 2015-16
No. of stock
options
Weighted
average
exercise price
(v)
No. of stock
options
Weighted
average
exercise price
(v)
(A) Options granted and outstanding at the beginning of the year 57,93,042 354.10 77,08,842 362.74
(B) Options granted during the year 4,73,550 327.51 4,95,265 282.57
(C) Options allotted during the year 14,86,958 358.97 19,16,784 366.57
(D) Options lapsed during the year 5,32,274 370.25 4,94,281 368.74
(E) Options granted and outstanding at the end of the year 42,47,360 347.41 57,93,042 354.10
(F) Options exercisable at the end of the year out of (E) supra 21,51,241 359.04 28,52,010 364.76
(iv) Weighted average share price at the date of exercise for stock options exercised during the year is v 1386.19 (previous year:
v 1543.13) per share.
(v) A. In respect of stock options granted pursuant to the Company’s stock options schemes, the fair value of the options is
treated as discount and accounted as employee compensation over the vesting period.
B. Expense on Employee Stock Option Schemes debited to the Statement of Profit and Loss during 2016-17 is v 60.35 crore
(previous year: v 59.18 crore) net of recoveries of v 1.42 crore (previous year: v 1.16 crore) from its group companies
towards the stock options granted to deputed employees, pursuant to the employee stock option schemes (Note 34).
The entire amount pertains to equity-settled employee share-based payment plans.
(vi) During the year, the Company has recovered v 13.81 crore (previous year: v 14.28 crore) from its subsidiary companies
towards the stock options granted to their employees, pursuant to the Employee Stock Option Schemes.
(vii) Weighted average fair values of options granted during the year is v 1056.73 (previous year: v 965.39) per option.
Notes forming part of the Financial Statements (contd.)
NOTE [17]
Equity share capital (contd.)
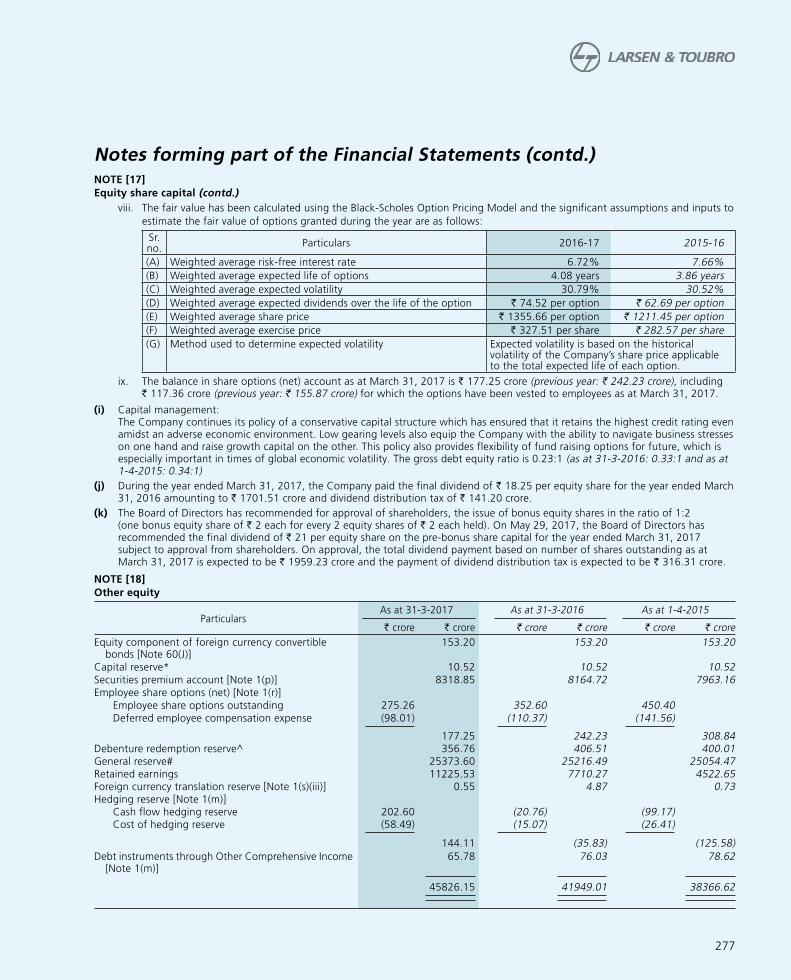
277
viii. The fair value has been calculated using the Black-Scholes Option Pricing Model and the significant assumptions and inputs to
estimate the fair value of options granted during the year are as follows:
Sr. no.
Particulars 2016-17 2015-16
(A) Weighted average risk-free interest rate 6.72% 7.66%
(B) Weighted average expected life of options 4.08 years 3.86 years
(C) Weighted average expected volatility 30.79% 30.52%
(D) Weighted average expected dividends over the life of the option v 74.52 per option v 62.69 per option
(E) Weighted average share price v 1355.66 per option v 1211.45 per option
(F) Weighted average exercise price v 327.51 per share v 282.57 per share
(G) Method used to determine expected volatility Expected volatility is based on the historical volatility of the Company’s share price applicable to the total expected life of each option.
ix. The balance in share options (net) account as at March 31, 2017 is v 177.25 crore (previous year: v 242.23 crore), including v 117.36 crore (previous year: v 155.87 crore) for which the options have been vested to employees as at March 31, 2017.
(i) Capital management: The Company continues its policy of a conservative capital structure which has ensured that it retains the highest credit rating even amidst an adverse economic environment. Low gearing levels also equip the Company with the ability to navigate business stresses on one hand and raise growth capital on the other. This policy also provides flexibility of fund raising options for future, which is especially important in times of global economic volatility. The gross debt equity ratio is 0.23:1 (as at 31-3-2016: 0.33:1 and as at 1-4-2015: 0.34:1)
(j) During the year ended March 31, 2017, the Company paid the final dividend of v 18.25 per equity share for the year ended March 31, 2016 amounting to v 1701.51 crore and dividend distribution tax of v 141.20 crore.
(k) The Board of Directors has recommended for approval of shareholders, the issue of bonus equity shares in the ratio of 1:2 (one bonus equity share of v 2 each for every 2 equity shares of v 2 each held). On May 29, 2017, the Board of Directors has recommended the final dividend of v 21 per equity share on the pre-bonus share capital for the year ended March 31, 2017 subject to approval from shareholders. On approval, the total dividend payment based on number of shares outstanding as at March 31, 2017 is expected to be v 1959.23 crore and the payment of dividend distribution tax is expected to be v 316.31 crore.
NOTE [18]
Other equity
Particulars As at 31-3-2017 As at 31-3-2016 As at 1-4-2015
v crore v crore v crore v crore v crore v crore
Equity component of foreign currency convertible bonds [Note 60(J)]
153.20 153.20 153.20
Capital reserve* 10.52 10.52 10.52Securities premium account [Note 1(p)] 8318.85 8164.72 7963.16Employee share options (net) [Note 1(r)] Employee share options outstanding 275.26 352.60 450.40 Deferred employee compensation expense (98.01) (110.37) (141.56)
177.25 242.23 308.84Debenture redemption reserve^ 356.76 406.51 400.01General reserve# 25373.60 25216.49 25054.47Retained earnings 11225.53 7710.27 4522.65Foreign currency translation reserve [Note 1(s)(iii)] 0.55 4.87 0.73Hedging reserve [Note 1(m)] Cash flow hedging reserve 202.60 (20.76) (99.17) Cost of hedging reserve (58.49) (15.07) (26.41)
144.11 (35.83) (125.58)
Debt instruments through Other Comprehensive Income [Note 1(m)]
65.78 76.03 78.62
45826.15 41949.01 38366.62
Notes forming part of the Financial Statements (contd.)
NOTE [17]
Equity share capital (contd.)

278
* Capital Reserve: It represents the gains of capital nature which mainly includes the excess of value of net assets acquired over consideration paid by the Company for business amalgamation transaction in earlier years.
^ Debenture redemption reserve (DRR): The Company has issued redeemable non-convertible debentures and created DRR out of the profits of the Company in terms of the Companies (Share capital and Debenture) Rules, 2014 (as amended). The Company is required to maintain a DRR of 25% of the value of debentures issued, either by a public issue or on a private placement basis. The amounts credited to the DRR may not be utilised by the company except to redeem debenture.
# General Reserve: The Company created a General Reserve in earlier years pursuant to the provisions of the Companies Act wherein certain percentage of profits were required to be transferred to General Reserve before declaring dividends. As per Companies Act 2013, the requirement to transfer profits to General Reserve is not mandatory. General Reserve is a free reserve available to the Company.
NOTE [19]
Financial Liabilities: Borrowings - non-current
Particulars
As at 31-3-2017 As at 31-3-2016 As at 1-4-2015
Secured Unsecured Total Secured Unsecured Total Secured Unsecured Total
v crore v crore v crore v crore v crore v crore v crore v crore v crore
Redeemable non-convertible fixed rate
debentures [Note 19(a)(i) & (ii)] 408.55 2179.48 2588.03 408.31 2180.12 2588.43 408.49 1716.68 2125.17
Redeemable non-convertible inflation linked
debentures [Note 19(a)(iii)] – 113.61 113.61 – 110.32 110.32 – 111.30 111.30
0.675% Foreign currency convertible bonds
[Note 19(b)] – 1201.78 1201.78 – 1190.86 1190.86 – 1089.81 1089.81
Term loan from banks [Note 19(c)] – 3230.58 3230.58 – 4422.51 4422.51 – 5103.91 5103.91
Sales tax deferment loan [Note 19(d)] – 0.08 0.08 – 0.28 0.28 – 0.62 0.62
Finance lease – 0.20 0.20 – 0.07 0.07 – – –
408.55 6725.73 7134.28 408.31 7904.16 8312.47 408.49 8022.32 8430.81
19(a)(i) Secured redeemable non-convertible fixed rate debentures (privately placed):
Face value per
debenture (v)
Date of
allotment
As at
31-3-2017
v crore
As at
31-3-2016
v crore
As at
1-4-2015
v crore
Interest for the
year 2016-2017
Terms of repayment for
debentures outstanding as
on 31-3-2017
1000000 January 5,
2009
408.55 408.31 408.49 9.15% p.a.
payable annually
Redeemable at face value at
the end of 10th year from
the date of allotment.
Security: The debentures are secured by way of a first charge having pari passu rights on the immovable property at certain
locations and part of a movable property of a business division, both present and future.
19(a)(ii) Unsecured redeemable non-convertible fixed rate debentures (privately placed):
Sr. no.
Face value per debenture (v)
Date of allotment
As at 31-3-2017
v crore
As at 31-3-2016
v crore
As at 1-4-2015
v crore
Interest for the year 2016-2017
Terms of repayment for debentures outstanding as at 31-3-2017
1. 1000000 April 10, 2012
273.39 273.48 273.37 9.75% p.a. payable annually
Redeemable at face value at the end of 10th year from the date of allotment.
2. 1000000 May 26,
2011
322.52 322.51 322.35 8.95% p.a.
payable annually
Redeemable at face value at
the end of 10th year from
the date of allotment.
Notes forming part of the Financial Statements (contd.)
NOTE [18]
Other equity (contd.)

279
Sr. no.
Face value per debenture (v)
Date of allotment
As at 31-3-2017
v crore
As at 31-3-2016
v crore
As at 1-4-2015
v crore
Interest for the year 2016-2017
Terms of repayment for debentures outstanding as at 31-3-2017
3. 1000000 May 11,
2010
324.14 324.13 323.91 9.15% p.a.
payable annually
Redeemable at face value at
the end of 10th year from
the date of allotment.
4. 1000000 April 13,
2010
216.83 216.83 216.64 8.80% p.a.
payable annually
Redeemable at face value at
the end of 10th year from
the date of allotment.
5. 1000000 August 21,
2014
– 229.66 211.13
6. 1000000 August 22,
2014
– 369.52 369.28
7. 1000000 December
11, 2014
– – 307.51
8. 1000000 February 2,
2015
– – 303.51
9. 1000000 September
24, 2015
1042.60 1042.87 – 8.40% p.a.
payable annually
Redeemable at face value
at the end of 5th year from
the date of allotment.
Total 2179.48 2779.00 2327.70
Less: – 598.88 611.02 Current maturity of long
term borrowings [Note 24)]
2179.48 2180.12 1716.68 Borrowings - non-current
[Note 19]
19(a)(iii) Unsecured redeemable non-convertible inflation linked debentures:
Face value per debenture (v)
Date of allotment
As at 31-3-2017
v crore
As at 31-3-2016
v crore
As at 1-4-2015
v crore
Interest for the year 2016-2017
Terms of repayment for debentures outstanding as at 31-3-2017
1000000 May 23, 2013 113.61@ 110.32@ 111.30 @ 1.65% p.a. payable on
inflation adjusted principal as on the
date of coupon payment
Redeemable at the end of 10th year from the date of allotment. Redemption value calculated as [{Average Ref WPI (on Maturity Date) / Average Ref WPI (on Issue Date)} x face value] with Floor Rate as 3 % and Cap Rate as 12%. WPI here refers to Wholesale Price Index
@ The principal amount has been calculated as [{Average Ref WPI as at reporting period / Average Ref WPI (as at 23/5/2013)} x Face Value]
19(b) Foreign currency convertible bonds:
0.675% US$ denominated 5 years & 1 day Foreign Currency Convertible Bonds (FCCB) carried at 1201.78 crore as at March 31,
2017 (previous year: v 1190.86 crore) represent 1,000 bonds of US$ 200000 each. The bonds are convertible into the Company’s
fully paid equity shares of 2 each at a conversion price of v 1916.50 per share at the option of the bond holders at any time on
and after December 1, 2014 up to October 15, 2019. The bonds are redeemable, subject to fulfillment of certain conditions, in
whole but not in part, at the option of the Company, on or at any time after October 22, 2017 but not less than seven business
days prior to the maturity date, at the principal amount together with accrued interest (calculated up to but excluding the date
of redemption) on the date fixed for redemption, unless the bonds have been previously redeemed, converted or purchased and
cancelled.
Notes forming part of the Financial Statements (contd.)
NOTE [19]
19(a)(ii) Unsecured redeemable non-convertible fixed rate debentures (privately placed) (contd.)

280
19(c) Details of term loans (unsecured): Foreign currency loans:
Sr. no.
As at 31-3-2017
v crore
As at 31-3-2016
v crore
As at 1-4-2015
v crore
Rate of interest Terms of repayment of term loan outstanding as at 31-03-2017
1. 1288.32 1312.64 1235.31 USD LIBOR + Spread Repayable on October 21, 2019
2. 642.97 654.77 616.36 USD LIBOR + Spread Repayable in 3 installments on (i) November 3, 2018 (ii) November 3, 2019 and (iii) November 3, 2020
3. 323.96 330.75 311.82 USD LIBOR + Spread Repayable on July 2, 2018
4. 129.51 131.95 124.34 USD LIBOR + Spread Repayable on September 27, 2017
5. 162.14 165.64 156.26 USD LIBOR + Spread Repayable on July 14, 2017
6. 157.56 291.65 273.96 USD LIBOR + Spread Repayable in 2 installments on (i) August 30, 2017 and (ii) June 28, 2018
7. 203.87 402.83 378.15 USD LIBOR + Spread Repayable in 2 installments on (i) August 30, 2017 and (ii) June 28, 2018
8. 452.61 659.34 619.62 USD LIBOR + Spread Repayable in 2 installments on (i) August 30, 2017 and (ii) June 28, 2018
9. 549.57 658.91 619.62 USD LIBOR + Spread Repayable in 2 installments on (i) August 30, 2017 and (ii) June 28, 2018
10. 193.22 369.40 346.73 USD LIBOR + Spread Repayable on August 30, 2017
11. – – 312.50 Fixed Interest Rate
12. 75.61 115.80 145.70 USD LIBOR + Spread Repayable in 2 equal installments on (i) September 18, 2017 and (ii) June 18, 2018
13. 162.13 165.64 – USD LIBOR + Spread Repayable on October 19, 2018
Total 4341.47 5259.32 5140.37
Less: 1110.89 836.81 36.46 Current maturities of long term borrowings [Note 24]
3230.58 4422.51 5103.91 Borrowings non-current [Note 19]
Loans guaranteed by directors - v Nil (previous year v Nil)
19(d) Sales tax deferment loan (unsecured):
Sr. no.
As at 31-3-2017
v crore
As at 31-3-2016
v crore
As at 1-4-2015
v crore
Rate of Interest Terms of repayment as at March 31, 2017
1. 0.16 0.24 0.33
Interest Free
Repayable in 2 annual installments of v 0.08 crore ending April 26, 2018
2. 0.12 0.24 0.36 Repayable on April 26, 2017
3. – 0.14 0.28
4. – – 0.10
Total 0.28 0.62 1.07
Less: 0.20 0.34 0.45 Current maturities of long term borrowings [Note 24]
0.08 0.28 0.62 Borrowings non-current [Note 19]
Notes forming part of the Financial Statements (contd.)
NOTE [19] (contd.)

281
NOTE [20]
Other financial liabilities - non-current
Particulars As at 31-3-2017 As at 31-3-2016 As at 1-4-2015
v crore v crore v crore
Forward contract payables 26.94 34.01 44.74
Embedded derivative payables 22.46 – 19.24
Financial guarantee contracts 11.83 16.93 24.66
Due to others 27.34 21.51 13.36
88.57 72.45 102.00
NOTE [21]
Provisions - non-current
Particulars As at 31-3-2017 As at 31-3-2016 As at 1-4-2015
v crore v crore v crore
Employee pension scheme [Note 50(a)] 290.29 227.08 202.38
Post-retirement medical benefits plan [Note 50(a)] 180.39 144.42 138.86
Provision for interest rate guarantee – – 4.86
470.68 371.50 346.10
NOTE [22]
Other non-current liabilities
Particulars As at 31-3-2017 As at 31-3-2016 As at 1-4-2015
v crore v crore v crore
Other payables 3.86 5.83 0.81
NOTE [23]
Financial Liabilities: Borrowings - current
Particulars
As at 31-3-2017 As at 31-3-2016 As at 1-4-2015
Secured Unsecured Total Secured Unsecured Total Secured Unsecured Total
v crore v crore v crore v crore v crore v crore v crore v crore v crore
Loans repayable on demand from banks
[Note 23(b)]
221.35 – 221.35 125.07 – 125.07 57.79 8.94 66.73
Short term loan and advances from banks
[Note 23(b)]
216.06 1449.20 1665.26 289.02 3253.10 3542.12 391.72 2485.80 2877.52
Commercial paper – 442.71 442.71 – 499.54 499.54 – 997.08 997.08
Loans from related parties – 5.52 5.52 – 9.25 9.25 – 57.25 57.25
437.41 1897.43 2334.84 414.09 3761.89 4175.98 449.51 3549.07 3998.58
23(a) Loans guaranteed by directors v Nil (previous year v Nil)
23(b) Loans repayable on demand from banks include fund based working capital facilities viz. cash credits and demand loans. The
secured portion of loans repayable on demand from banks, short term loans and advances from the banks, working capital
facilities and other non-fund based facilities viz. bank guarantees and letter of credit, are secured by hypothecation of inventories
and trade receivables. Amount of inventories and trade receivables that are pledged as collateral: v 6149.71 crore as at March 31,
2017; v 6188.72 crore as at March 31, 2016; v 6098.53 crore as at April 1, 2015.
Notes forming part of the Financial Statements (contd.)

282
NOTE [24]
Financial liabilities: Current maturities of long term borrowings
Particulars As at 31-3-2017 As at 31-3-2016 As at 1-4-2015
v crore v crore v crore
Unsecured:
Redeemable non-convertible fixed rate debentures
[Note 19(a)(ii)]
– 598.88 611.02
Term loans from banks [Note 19(c)] 1110.89 836.81 36.46
Sales tax deferment loan [Note 19(d)] 0.20 0.34 0.45
Finance lease obligation 0.50 – –
1111.59 1436.03 647.93
24(a) Loans guaranteed by directors v Nil (previous year v Nil)
NOTE [25]
Financial liabilities - current: Trade payables
Particulars As at 31-3-2017 As at 31-3-2016 As at 1-4-2015
v crore v crore v crore v crore v crore v crore
Acceptances 399.78 660.83 920.16Due to related parties: Subsidiary companies 638.02 601.89 379.38 Associate companies 4.16 5.35 22.81 Joint venture companies 1836.93 1674.82 1412.95
2479.11 2282.06 1815.14Micro and small enterprises [Note 57] 124.08 134.32 115.46Due to others 21028.86 19138.71 15525.24
24031.83 22215.92 18376.00
NOTE [26]
Other financial liabilities - current
Particulars As at 31-3-2017 As at 31-3-2016 As at 1-4-2015
v crore v crore v crore
Unclaimed dividend 46.61 39.33 33.59
Embedded derivative payables 111.23 149.54 11.18
Financial guarantee contracts 8.88 18.03 13.07
Due to others [Note 26(a)] 1405.93 1112.78 1132.73
1572.65 1319.68 1190.57
26(a) Due to others include due to directors R 55.58 crore (as at 31-3-2016: R 51.30 crore; as at 1-4-2015: R 53.83 crore)
NOTE [27]
Other current liabilities
Particulars As at 31-3-2017 As at 31-3-2016 As at 1-4-2015
v crore v crore v crore
Due to customers (construction related activity) 4231.98 4733.71 4013.17Due to customers (property development projects) 57.88 222.17 365.21Advances from customers 12628.78 12518.95 11147.06Other payables 1379.08 1177.13 1260.54
18297.72 18651.96 16785.98
Notes forming part of the Financial Statements (contd.)

283
Notes forming part of the Financial Statements (contd.)
NOTE [28]
Current liabilities: Provisions
Particulars As at 31-3-2017 As at 31-3-2016 As at 1-4-2015
v crore v crore v crore v crore v crore v crore
Provision for employee benefits:
Gratuity [Note 50(a)] 71.94 52.70 35.85
Compensated absences 518.64 502.10 486.02
Employee pension scheme [Note 50(a)] 22.46 56.17 13.26
Post-retirement medical benefits plan [Note 50(a)] 5.25 11.16 10.04
618.29 622.13 545.17
Others:
Other provisions (Ind AS 37 related) [Note 54] 473.86 275.16 256.25
1092.15 897.29 801.42
NOTE [29]
Contingent liabilities
Particulars As at 31-3-2017 As at 31-3-2016 As at 1-4-2015
v crore v crore v crore
(a) Claims against the Company not acknowledged as debts 1743.95 1025.52 883.06
(b) Sales tax liability that may arise in respect of matters in appeal 141.50 156.72 132.13
(c) Excise duty/service tax/customs duty liability that may arise
including those in respect of matters in appeal/challenged by the
Company in Writ 69.20 60.73 55.41
(d) Income tax liability that may arise in respect of which the Company
is in appeal 460.55 531.84 826.44
(e) Corporate guarantees for debt given on behalf of subsidiary
companies/joint venture companies 8450.61 7327.31 8723.55
(f) Corporate and bank guarantees for performance given on behalf of
subsidiary companies 16384.12 8847.53 9201.96
(g) Contingent liabilities, if any, incurred in relation to interests in joint
operations 7018.24 4170.76 3248.49
(h) Share in contingent liabilities of joint operations for which the
Company is contingently liable 53.24 58.18 80.13
(i) Contingent liabilities in respect of liabilities of other joint operators
of joint operations 6230.96 8006.19 10840.81
Notes:
1. The Company does not expect any reimbursements in respect of the above contingent liabilities.
2. It is not practicable to estimate the timing of cash outflows, if any, in respect of matters at (a) to (d) above pending resolution
of the arbitration/appellate proceedings. Further, the liability mentioned in (a) to (d) above excludes interest and penalty in cases
where the company has determined that the possibility of such levy is remote.
3. In respect of matters at (e), the cash outflows, if any, could generally occur up to ten years, being the period over which the
validity of the guarantees extends except in a few cases where the cash outflows, if any, could occur any time during the
subsistence of the borrowings to which the guarantees relate.
4. In respect of matters at (f), the cash outflows, if any, could generally occur up to three years, being the period over which the
validity of the guarantees extends.
5. In respect of matters at (g) to (i), the cash outflows, if any, could generally occur upto completion of projects undertaken by the
respective joint operations.

284
Notes forming part of the Financial Statements (contd.)
NOTE [30]
Commitments
v crore
Sr. no.
ParticularsAs at
31-3-2017As at
31-3-2016As at
1-4-2015(a) Estimated amount of contracts remaining to be executed on capital account
(net of advances)533.49 196.72 294.40
(b) Funding committed by way of equity/loans to subsidiary/joint venture companies 1063.20 1281.00 2738.00(c) Share in capital commitments, of joint operations for which the company is
contingently liable – 2.61 159.34
NOTE [31]
Revenue from operations
Particulars 2016-17 2015-16
v crore v crore v crore v crore
Sales and service:
Construction and project related activity [Note 48(a)(i)] 58498.42 55522.22 Manufacturing and trading activity 5730.98 5957.40 Property development activity [Note 48(c)(i)] 403.18 843.60 Engineering and service fees 24.73 44.74 Servicing 597.88 760.57 Commission 140.81 137.30
65396.00 63265.83Other operational income:
Income from hire of plant and equipment 80.28 77.54 Technical fees – 0.36 Lease rentals 67.79 71.85 Income from services to Group companies 170.74 112.16 Premium earned (net) on related forward exchange contracts 48.45 38.02 Miscellaneous income 538.09 246.89
905.35 546.82
66301.35 63812.65
NOTE [32]
Other income
Particulars 2016-17 2015-16
v crore v crore v crore v crore
Interest income: Subsidiary and associate companies 325.62 268.24 Others 213.69 262.48
539.31 530.72Dividend income: From investments - non-current Subsidiary companies 405.47 994.16 Associate companies – 0.38 Joint venture companies – 13.75 Others 659.63 113.06
1065.10 1121.35Net gain/(loss) on sale or fair valuation of investments (72.44) 150.87Net gain/(loss) on sale of property, plant and equipment 23.70 82.51Lease rentals 70.48 39.90Miscellaneous income (net of expenses) 345.70 415.69
1971.85 2341.04

285
NOTE [33]
Manufacturing, construction and operating expenses
Particulars 2016-17 2015-16
v crore v crore v crore v crore
Materials consumed:
Raw materials and components 7444.84 7455.04
Less: Scrap sales 74.27 57.49
7370.57 7397.55
Excise duty 577.49 635.39
Construction materials consumed 18493.31 18804.70
Purchase of stock-in-trade 1390.84 1145.94
Value of stock-in-trade transferred on sale of business – (16.49)
1390.84 1129.45
Stores, spares and tools consumed 1446.67 1349.23
Sub-contracting charges 16770.61 15567.87
Changes in inventories of finished goods, work-in-progress,
stock-in-trade and property development:
Closing stock:
Finished goods 221.52 161.68
Stock-in-trade 169.68 159.77
Work-in-progress 3044.67 3246.01
3435.87 3567.46
Less: Opening stock:
Finished goods 161.68 261.20
Stock-in-trade 159.77 161.13
Work-in-progress 3246.01 3221.70
3567.46 3644.03
131.59 76.57
Other manufacturing, construction and operating expenses:
Excise duty 16.30 (4.91)
Power and fuel 1041.49 911.55
Royalty and technical know-how fees 15.75 20.62
Packing and forwarding 340.15 316.38
Hire charges - plant and equipment and others 1015.13 707.42
Engineering, technical and consultancy fees 761.70 676.35
Insurance 187.07 167.53
Rent 415.25 418.24
Rates and taxes 366.42 307.84
Travelling and conveyance 759.81 771.58
Repairs to plant and equipment 56.54 49.65
Repairs to buildings 6.10 8.08
General repairs and maintenance 303.18 254.88
Bank guarantee charges 151.15 144.67
Miscellaneous expenses 372.48 458.45
5808.52 5208.33
51989.60 50169.09
Notes forming part of the Financial Statements (contd.)

286
NOTE [34]
Employee benefits expense
Particulars 2016-17 2015-16
v crore v crore v crore v crore
Salaries, wages and bonus 4554.79 4282.55
Contribution to and provision for:
Provident funds and pension fund 114.67 116.39
Superannuation/employee pension schemes (4.40) 47.57
Gratuity funds [Note 50(b)] 67.30 57.70
177.57 221.66
Expenses on employees stock option schemes [Note 17(v)(B)] 61.77 60.34
Insurance expenses - medical and others 77.17 75.25
Staff welfare expenses 618.72 574.08
Recoveries on account of deputation (343.55) (239.08)
5146.47 4974.80
NOTE [35]
Sales, administration and other expenses
Particulars 2016-17 2015-16
v crore v crore v crore v crore
Power and fuel 59.26 65.83
Packing and forwarding 91.05 104.75
Professional fees 224.58 292.75
Audit fees [Note 55] 5.33 4.40
Insurance 37.86 33.16
Rent 229.51 219.72
Rates and taxes 50.91 49.41
Travelling and conveyance 280.10 284.27
Repairs to buildings 9.53 8.97
General repairs and maintenance 229.67 213.51
Directors‘ fees 0.82 0.59
Telephone, postage and telegrams 104.84 98.86
Advertising and publicity 77.80 61.96
Stationery and printing 38.40 41.76
Commission:
Distributors and agents 27.27 28.33
Others 4.88 2.74
32.15 31.07
Bank charges 57.96 64.83
Miscellaneous expenses 599.05 403.68
Bad debts and advances written off 87.48 121.19
Less: Allowance for doubtful debts and advances written back 45.05 12.96
42.43 108.23
Carried forward 2171.25 2087.75
Notes forming part of the Financial Statements (contd.)

287
Particulars 2016-17 2015-16
v crore v crore v crore v crore
Brought forward 2171.25 2087.75
Discount on sales (0.01) -
Allowance for doubtful debts and advances (net) 395.29 594.93
Provision/(reversal) for foreseeable losses on construction contracts (5.93) 9.47
Exchange (gain)/loss (net) (22.40) 134.58
Other provisions [Note 54(a)] 203.35 19.04
2741.55 2845.77
NOTE [36]
Finance costs
Particulars 2016-17 2015-16
v crore v crore
Interest expenses 1252.78 1345.98
Other borrowing costs 0.56 1.19
Exchange loss (attributable to finance costs) 64.69 129.65
1318.03 1476.82
NOTE [37]
Particulars in respect of loans and advances in the nature of loans to related parties as required by the SEBI (Listing Obligations and
Disclosure Requirements) Regulations, 2015:
v crore
Sr.
no.Name of the company
Balance as at Maximum outstanding during
31-3-2017 31-3-2016 2016-2017 2015-2016
Loans and advances in the nature of loans given to subsidiaries:
A L&T Seawoods Limited – 190.82 341.20 249.20
B L&T Realty Limited 16.56 269.98 397.41 644.44
C L&T Shipbuilding Limited 512.00 2018.01 2651.87 2680.62
D L&T Special Steels & Heavy Forgings Private Limited 1167.22 866.55 1167.22 870.54
E PNG Tollway Limited 18.20 18.20 18.20 62.17
F EWAC Alloys Limited – 16.00 16.00 16.00
G L&T Hydrocarbon Engineering Limited 2.23 507.90 511.74 2163.55
H L&T Valves Limited – – – 15.07
I Nabha Power Limited 1576.88 902.99 1827.99 3240.44
J L&T-MHPS Turbine Generators Private Limited – – 300.08 179.09
Total 3293.09 4790.45
Notes forming part of the Financial Statements (contd.)
NOTE [35]
Sales, administration and other expenses (contd.)

288
Notes forming part of the Financial Statements (contd.)
Notes:
– Above figures include interest accrued
– Loans to employees (including directors) under various schemes of the Company (such as housing loan, furniture loan, education
loan, etc.) have been considered to be outside the purview of disclosure requirements.
– Subsidiary classification is in accordance with the Companies Act, 2013
NOTE [38]
Disclosure pursuant to section 186 of the Companies Act, 2013:
v crore
Sr.
no.
Nature of the transaction (loans given/investment made/guarantee
given/security provided)
Purpose for which the loan/
guarantee/security is proposed to be
utilised by the recipient
As at
31-3-2017
As at
31-3-2016
(A) Loan and advances:
(i) Subsidiary companies:
L&T Realty Limited Project funding 16.56 269.98
L&T Seawoods Limited Project funding – 190.82
L&T Shipbuilding Limited Working capital and project funding 512.00 2018.01
L&T Special Steels & Heavy Forgings Private Limited Working capital and project funding 1167.22 866.55
PNG Tollway Limited Project funding 18.20 18.20
EWAC Alloys Limited Short term funding – 16.00
L&T Hydrocarbon Engineering Limited Working capital 2.23 507.90
Nabha Power Limited Project funding 1576.88 902.99
3293.09 4790.45
(ii) Others:
Boyance Infrastructure Private Limited General corporate purpose – 75.62
Total (i)+(ii) 3293.09 4866.07
(B) Other advances:
Subsidiary companies:
L&T Uttaranchal Hydropower Limited Towards capital contribution – 5.25
L&T Metro Rail (Hyderabad) Private Limited Towards capital contribution 6.35 –
6.35 5.25
(C) Guarantees:
Subsidiary companies:
L&T Aviation Services Private Limited Corporate guarantee given for
subsidiary’s debt
44.64 57.01
L&T-MHPS Boilers Private Limited Corporate guarantee given for
subsidiary’s debt
120.61 233.97
L&T-MHPS Turbine Generators Private Limited Corporate guarantee given for
subsidiary’s debt
472.36 548.32
L&T Shipbuilding Limited Corporate guarantee given for
subsidiary’s debt
2781.00 1331.00
Nabha Power Limited Corporate guarantee given for
subsidiary’s debt
5032.00 5157.00
Larsen & Toubro ATCO Saudi LLC Corporate guarantee for subsidiary’s
project performance
– 909.51
Larsen & Toubro Arabia LLC Corporate guarantee for subsidiary’s
project performance
5369.27 1013.25
Larsen & Toubro Infotech Limited Corporate guarantee for subsidiary’s
project performance
202.26 238.68
NOTE [37]
Particulars in respect of loans and advances in the nature of loans to related parties as required by the SEBI (Listing Obligations and
Disclosure Requirements) Regulations, 2015 (contd.)

289
v crore
Sr.
no.
Nature of the transaction (loans given/investment made/guarantee
given/security provided)
Purpose for which the loan/
guarantee/security is proposed to be
utilised by the recipient
As at
31-3-2017
As at
31-3-2016
L&T Technology Services Limited Corporate guarantee for subsidiary’s
project performance (It includes
corporate guarantee given for L&T
Technology Services LLC)
917.62 589.79
L&T Electrical & Automation FZE Corporate guarantee for subsidiary’s
project performance
– 19.75
Larsen & Toubro Heavy Engineering LLC Corporate guarantee for subsidiary’s
project performance
1172.46 1197.86
Larsen & Toubro (Saudi Arabia) LLC Corporate guarantee for subsidiary’s
project performance
3272.69 2693.04
Spectrum Infotech Private Limited Corporate guarantee for subsidiary’s
project performance
2.90 2.90
L&T Hydrocarbon Engineering Limited Corporate guarantee for subsidiary’s
project performance
5418.32 2173.23
L&T-MHPS Boilers Private Limited Guarantees issued by bank out
of the Company’s sanctioned
limits to customer of L&T-MHPS
Boilers Private Limited for Project
performance
28.60 9.52
24834.73 16174.84
(D) Investments in fully paid equity instruments and current
investments [Note 5 and Note 10 ]
Note: Subsidiary classification is in accordance with the Companies Act, 2013
NOTE [39]
Amount required to be spent by the Company on Corporate Social Responsibility (CSR) related activities during the year is v 98.97 crore
(previous year: R 101.46 crore).
(a) The amount recognised as expense in the Statement of Profit and Loss on CSR related activities is v 100.77 crore (previous year:
R 119.89 crore), which comprises of:
v crore
Sr.
no.Particulars
Disclosed
under
2016-17 2015-16In Cash Yet to be
paid in
cash
Total In Cash Yet to be
paid in
cash
Total
i) Construction/acquisition of assets charged
and shown under sales, administration
and other expenses Note 35 6.19 3.30 9.49 5.53 0.33 5.86ii) Other revenue expenses:
charged and shown under sales,
administration and other expenses Note 35 61.48 10.34 71.82 95.71 4.01 99.72charged and shown under employee
benefits expense Note 34 19.03 0.43 19.46 14.09 0.22 14.31Total 86.70 14.07 100.77 115.33 4.56 119.89
NOTE [40]
The expenditure on research and development activities recognised as expense in the Statement of Profit and Loss is v 145.98 crore
(previous year: v 149.62 crore). Further, the company has incurred capital expenditure on research and development activities as follows:
(a) on tangible assets of v 9.43 crore (previous year: v 5.19 crore);
(b) on intangible assets being expenditure on new product development of v 43.01 crore (previous year: v 48.19 crore) [Note 1(i)(ii)] and
(c) on other intangible assets of v 1.09 crore (previous year: v 0.55 crore).
Notes forming part of the Financial Statements (contd.)
NOTE [38]
Disclosure pursuant to section 186 of The Companies Act 2013 (contd.)

290
NOTE [41]
Disclosures pursuant to Ind AS 17 “Leases”:
(a) Where the Company is a lessor
(i) Operating leases:
The Company has given a building under non-cancellable operating lease, the future minimum lease payments receivable in
respect of which are as follows:
v crore
Sr.
no.Particulars
As at
31-3-2017
As at
31-3-2016
As at
1-4-2015
1. Receivable not later than 1 year 48.69 46.42 20.02
2. Receivable later than 1 year and not later than 5 years 34.41 67.47 12.28
3. Receivable later than 5 years – – –
Total 83.10 113.89 32.30
(b) Where the Company is a lessee:
(i) Finance leases:
(A) Assets acquired on finance lease comprises plant and equipment and land. The leases have a primary period, which is
fixed and non-cancellable. The company has an option to renew the lease for a secondary period.
(B) The minimum lease rentals and the present value of minimum lease payments in respect of assets acquired under finance
leases are as follows:
v crore
Sr.
no.Particulars
Minimum lease paymentsPresent value of minimum lease
payments
As at
31-3-2017
As at
31-3-2016
As at
1-4-2015
As at
31-3-2017
As at
31-3-2016
As at
1-4-2015
1. Payable not later than 1 year 0.56 0.01 – 0.50 – –
2. Payable later than 1 year and not later than 5
years 0.16 0.02 – 0.14 – –
3. Payable later than 5 years 0.15 0.15 – 0.06 0.07 –
Total (1+2+3) 0.87 0.18 – 0.70 0.07 –
Less: Future finance charges 0.17 0.11 – – – –
Present value of minimum lease payments 0.70 0.07 – 0.70 0.07 –
(C) Contingent rent recognised in the Statement of Profit and Loss: v Nil (previous year: v Nil)
(ii) Operating leases:
(A) The Company has taken various commercial premises and plant and equipment under cancellable operating leases.
These lease agreements are normally renewed on expiry.
(B) Assets acquired on non-cancellable operating lease comprises commercial premises, cars and technology assets, the
future minimum lease payments in respect of which are as follows:
v crore
Sr.
No.Particulars
As at
31-3-2017
As at
31-3-2016
As at
1-4-2015
1. Payable not later than 1 year 18.33 18.05 13.09
2. Payable later than 1 year and not later than 5 years 27.13 20.27 9.23
3. Payable later than 5 years – – –
Total 45.46 38.32 22.32
(C) Lease rental expense in respect of operating leases: v 109.10 crore (previous year: v 76.97 crore)
(D) Contingent rent recognised in the Statement of Profit and Loss: v Nil (previous year: v Nil)
Notes forming part of the Financial Statements (contd.)

291
NOTE [42]
Disclosure pursuant to Ind AS 105 “Non-current assets held for sale and discontinued operations”:
v crore
ParticularsAs at
31-3-2017
As at
31-3-2016
As at
1-4-2015
Investments held for sale (A) 388.00 – –
Assets of disposal group classified as held for sale (B) – – 141.79
Group(s) of assets as classified as held for sale 388.00 – 141.79
Liabilities of disposal group classified as held for sale (B) – – 37.22
The Company has identified the above as held for sale to optimise the capital allocation and focus on core business. The sale is
envisaged through transfer of title deeds for identified assets held for sale and through divestment of stake/business transfer agreement
in case of disposal group held for sale. The proposed sale are expected to be completed within 12 months from the respective reporting
dates.
(A) Investments held for sale:
(i) Through a scheme of arrangement of demerger, the Port business in L&T Shipbuilding Limited (effective date March 22, 2017)
is transferred to Marine Infrastructure Developer Private Limited (MIDPL). As a shareholder L&T has received 38,80,00,000
equity shares of v 10 each. L&T is planning to divest its stake in MIDPL to an identified strategic partner. Accordingly, the
investment in MIDPL is presented as assets held for sale.
(ii) The Investment held for sale forms part of the unallocable corporate assets. [Note 47(a)].
(B) Assets and Liabilities of disposal group classified as held for sale:
(i) Pursuant to Board of Directors decision on November 7, 2014, to sell Company’s Foundry Business Unit a definitive agreement
with M/S Bradken Operations Pty Limited was executed on November 11, 2014. The associated assets and liabilities are
consequently presented as held for sale as at April 1, 2015. The Foundry Business was subsequently sold on March 31, 2016.
(ii) Details of assets and liabilities of disposal group classified as held for sale as at April 1, 2015:
Particulars v crore
Assets classified as held for sale:
Property, plant and equipment 75.53
Other intangible assets 0.22
Inventories 22.42
Trade receivables 34.63
Cash and cash equivalents 0.11
Other current assets 8.88
Total assets of disposal group classified as held for sale 141.79
Particulars v crore
Liabilities directly associated with assets classified as held for sale:
Borrowings 0.01
Trade payables 32.89
Provisions 0.46
Other current liabilities 3.86
Total liabilities of disposal group classified as held for sale 37.22
(iii) The assets and liabilities of the disposal group are presented in assets and liabilities of construction equipment & others
segment reported under “Others” segment. [Note 47(a)].
Notes forming part of the Financial Statements (contd.)

292
NOTE [43]
Disclosure pursuant to Ind AS 1 “Presentation of financial statements”:
(a) Current assets expected to be recovered within twelve months and after twelve months from the reporting date:
v crore
Particulars Note
As at 31-3-2017 As at 31-3-2016 As at 1-4-2015
Within
twelve
months
After
twelve
months
Total
Within
twelve
months
After
twelve
months
Total
Within
twelve
months
After
twelve
months
Total
Inventories 9 1706.03 56.83 1762.86 1914.84 40.27 1955.11 2236.19 24.58 2260.77
Trade receivables 11 19527.21 392.76 19919.97 18516.81 450.94 18967.75 16233.86 556.14 16790.00
Loans - current 14 1914.37 5.04 1919.41 2432.23 0.03 2432.26 1377.11 4.50 1381.61
Other financial assets 15 1949.83 104.80 2054.63 1772.38 108.11 1880.49 1318.01 110.08 1428.09
Other current assets 16 23972.84 9290.86 33263.70 23418.54 10063.41 33481.95 19909.13 8545.70 28454.83
(b) Current liabilities expected to be settled within twelve months and after twelve months from the reporting date:
v crore
Particulars Note
As at 31-3-2017 As at 31-3-2016 As at 1-4-2015
Within
twelve
months
After
twelve
months
Total
Within
twelve
months
After
twelve
months
Total
Within
twelve
months
After
twelve
months
Total
Trade payables 25 22779.22 1252.61 24031.83 21223.65 992.27 22215.92 17215.21 1160.79 18376.00
Other financial liabilities 26 1529.91 42.74 1572.65 1280.68 39.00 1319.68 1159.37 31.20 1190.57
Other current liabilities 27 12184.01 6113.71 18297.72 13186.78 5465.18 18651.96 11149.24 5636.74 16785.98
Provisions 28 963.70 128.45 1092.15 821.76 75.53 897.29 754.28 47.14 801.42
NOTE [44]
Disclosure pursuant to Ind AS 107 “Financial Instruments: Disclosures”: Market risk management
(a) Foreign exchange rate and interest rate risk:
The Company regularly reviews its foreign exchange forward and option positions and interest rate swaps, both on a standalone
basis and in conjunction with its underlying foreign currency and interest rate related exposures. The Company follows cash flow
hedge accounting for Highly Probable Forecasted Exposures (HPFE) hence the movement in mark to market (MTM) of the hedge
contracts undertaken for such exposures is likely to be offset by contra movements in the underlying exposures values. However,
till the point of time that the HPFE becomes an on Balance Sheet exposure, the changes in MTM of the hedge contracts will impact
the Balance Sheet of the Company. Further, given the effective horizons of the Company’s risk management activities which
coincide with the durations of the projects under execution and could extend across 3-4 years and the business uncertainties
associated with the timing and estimation of the project exposures, the recognition of the gains and losses related to these
instruments may not always coincide with the timing of gains and losses related to the underlying economic exposures and,
therefore, may affect the Company’s financial condition and operating results. Hence, the Company monitors the potential risk
arising out of the market factors like exchange rates, interest rates, price of traded investment products etc. on a regular basis. For
on Balance Sheet exposures, the Company monitors the risks on net unhedged exposures.
(i) Foreign exchange rate risk:
In general, the Company is a net receiver of foreign currency. Accordingly, changes in exchange rates, and in particular a
strengthening of the Indian Rupee, will negatively affect the Company’s net sales and gross margins as expressed in Indian
Rupees. There is a risk that the Company may have to adjust local currency product pricing due to competitive pressures
when there have been significant volatility in foreign currency exchange rates.
The Company may enter into foreign currency forward and option contracts with financial institutions to protect against
foreign exchange risks associated with certain existing assets and liabilities, certain firmly committed transactions, forecasted
Notes forming part of the Financial Statements (contd.)

293
future cash flows and net investments in foreign subsidiaries. In addition, the Company has entered and may enter in the
future, into non-designated foreign currency contracts to partially offset the foreign currency exchange gains and losses on its
foreign-denominated debt issuances. The Company’s practice is to hedge a portion of its material foreign exchange exposures
with tenors in line with the project/business life cycle, however, the Company may choose not to hedge certain foreign
exchange exposures for a variety of reasons.
The net exposure to foreign currency risk (based on notional amount) in respect of recognised financial assets, recognised
financial liabilities and derivatives is as follows:
v crore
Particulars
As at 31-3-2017 As at 31-3-2016 As at 1-4-2015
US Dollars
including
pegged
currencies
EURO Japanese
Yen
US Dollars
including
pegged
currencies
EURO Japanese
Yen
US Dollars
including
pegged
currencies
EURO Japanese
Yen
Net exposure to foreign currency risk in
respect of recognised financial assets/
(recognised financial liabilities) (1729.90) (397.06) (366.03) (933.60) (190.65) (206.00) (1587.07) (104.70) (206.44)
Derivatives including embedded
derivatives for hedging receivable/
(payable) exposure with respect
to firm commitments and forecast
transactions 3664.22 (1085.56) 604.27 3027.96 (855.69) 105.37 2787.36 (1069.82) 94.63
Receivable/(payable) exposure with
respect to forward contracts
and embedded derivatives not
designated as cash flow hedge 752.13 (5.42) – 119.60 (27.30) – 7.00 21.33 –
To provide a meaningful assessment of the foreign currency risk associated with the Company’s foreign currency derivative
positions against off-Balance Sheet exposures and unhedged portion of on-Balance Sheet financial assets and liabilities,
the Company uses a multi-currency correlated value-at-risk (“VAR”) model. The VAR model uses a Monte Carlo simulation
to generate thousands of random market price paths for foreign currencies against Indian Rupee taking into account the
correlations between them. The VAR is the expected loss in value of the exposures due to overnight movement in spot
exchange rates, at 95% confidence interval. The VAR model is not intended to represent actual losses but is used as a risk
estimation tool. The model assumes normal market conditions and is a historical best fit model. Because the Company uses
foreign currency instruments for hedging purposes, the loss in fair value incurred on those instruments are generally offset by
increase in the fair value of the underlying exposures for on Balance Sheet exposures. The overnight VAR for the Company at
95% confidence level is v 59.80 crore as at March 31, 2017 and v 27.60 crore as at March 31, 2016.
Actual future gains and losses associated with the Company’s investment portfolio and derivative positions may differ
materially from the sensitivity analysis performed as at March 31, 2017 due to the inherent limitations associated with
predicting the timing and amount of changes in foreign currency exchange rates and the Company’s actual exposures and
position.
(ii) Interest rate risk:
The Company’s exposure to changes in interest rates relates primarily to the Company’s outstanding floating rate debt. While
most of the Company’s outstanding debt in local currency is on fixed rate basis and hence not subject to interest rate risk.
A major portion of foreign currency debt is linked to international interest rate benchmarks like LIBOR. The Company also
hedges a portion of these risks by way of derivative instruments like interest rate swaps and currency swaps.
The exposure of the Company’s borrowing to interest rate changes at the end of the reporting period are as follows:
v crore
Particulars As at 31-3-2017 As at 31-3-2016 As at 1-4-2015
Floating rate borrowings 4470.01 6570.15 5958.86
A hypothetical 25 basis point shift in respective currency LIBORs on the unhedged loans would result in a corresponding
increase/decrease in interest cost for the Company on a yearly basis.
Notes forming part of the Financial Statements (contd.)
NOTE [44] (contd.)

294
v crore
Particulars
Impact on Profit and Loss after tax
Impact on equity
2016-17 2015-16 As at 31-3-2017
As at 31-3-2016
Indian Rupee
Interest rates - increase by 0.25% in INR interest rate * (0.55) (0.32) (0.55) (0.32)
Interest rates - decrease by 0.25% in INR interest rate * 0.55 0.32 0.55 0.32
US Dollar
Interest rates - increase by 0.25% in USD interest rate * (6.77) (9.88) (6.77) (9.88)
Interest rates - decrease by 0.25% in USD interest rate * 6.77 9.88 6.77 9.88
* Holding all other variables constant
(b) Liquidity risk management:
The Company manages liquidity risk by maintaining sufficient cash and marketable securities and by having access to funding
through an adequate amount of committed credit lines. Given the need to fund diverse businesses, the Company maintains
flexibility in funding by maintaining availability under committed credit lines to meet obligations when due. Management regularly
monitors the position of cash and cash equivalents vis-à-vis projections. Assessment of maturity profiles of financial assets and
financial liabilities including debt financing plans and maintenance of Balance Sheet liquidity ratios are considered while reviewing
the liquidity position.
The Company’s investment policy and strategy are focused on preservation of capital and supporting the Company’s liquidity
requirements. The Company uses a combination of internal and external management to execute its investment strategy and
achieve its investment objectives. The Company typically invests in money market funds, large debt funds, government of india
securities, equity funds and other highly rated securities under a limits framework which governs the credit exposure to any one
issuer as defined in its investment policy. The policy requires investments generally to be investment grade, with the primary
objective of minimising the potential risk of principal loss. To provide a meaningful assessment of the price risk associated with the
Company’s investment portfolio, the Company performed a sensitivity analysis to determine the impact of change in prices of the
securities that would have on the value of the investment portfolio assuming a 0.25% movement in debt funds and debt securities
and a 5% movement in the NAV of the equity funds. Based on the investment position a hypothetical 0.25% change in the fair
market value of debt securities would result in a value change of +/- v 4.08 crore as at March 31, 2017 and +/- v 14.83 crore as
at March 31, 2016. 5% change in the equity funds NAV would result in a value change of +/- v 17.14 crore as at March 31, 2017
and +/- v 2.87 crore as at March 31, 2016. The investments in money market funds are for the purpose of liquidity management
only and are held only overnight and hence not subject to any material price risk.
(c) Credit Risk Management:
The Company’s customer profile include public sector enterprises, state owned companies and large private corporates.
Accordingly, the Company’s customer credit risk is low. The Company’s average project execution cycle is around 24 to 36 months.
General payment terms include mobilisation advance, monthly progress payments with a credit period ranging from 45 to 90 days
and certain retention money to be released at the end of the project. In some cases retentions are substituted with bank/corporate
guarantees. The Company has a detailed review mechanism of overdue customer receivables at various levels within organisation
to ensure proper attention and focus for realisation.
The company is making provisions on trade receivables based on Expected Credit Loss (ECL) model. The reconciliation of ECL is as
follows:
v crore
Particulars 2016-17 2015-16
Opening balance 1568.79 1008.78
Changes in loss allowance (Provision for doubtful debts):
Loss allowance based on ECL 220.71 345.66
Additional provision 167.14 221.31
Write off as bad debts (39.98) (6.96)
Closing balance [reported under Note 11] 1916.66 1568.79
Notes forming part of the Financial Statements (contd.)
NOTE [44] (contd.)

295
NOTE [45]
Other disclosure pursuant to Ind AS 107 “Financial Instruments: Disclosures”:
(a) Category-wise classification for applicable financial assets:
v crore
Sr. no.
Particulars As at
31-3-2017 As at
31-3-2016 As at
1-4-2015
I. Measured at fair value through Profit or Loss (FVTPL):
(i) Investment in equity instruments 56.04 56.04 173.30
(ii) Investment in preference shares 605.10 441.95 45.65
(iii) Investment in mutual funds 5031.03 2680.28 3041.48
(iv) Investment in bonds 202.33 300.13 164.19
(v) Derivative instruments not designated as cash flow hedges 6.08 1.31 18.41
(vi) Embedded derivatives not designated as cash flow hedges 78.97 131.64 10.39
Sub-total (I) 5979.55 3611.35 3453.42
II. Measured at amortised cost:
(i) Loans 3683.59 5224.53 2397.63
(ii) Trade receivables 19919.97 18967.75 16790.00
(iii) Advances recoverable in cash 796.49 954.51 631.25
(iv) Cash and cash equivalents and bank balances 4025.79 3668.44 3096.21
(v) Other receivables 787.33 670.43 549.76
Sub-total (II) 29213.17 29485.66 23464.85
III. Measured at fair value through Other Comprehensive Income (FVTOCI):
(i) Investment in government securities, bonds and debentures 1748.72 1822.91 2312.38
(ii) Derivative financial instruments designated as cash flow hedges 659.92 494.21 487.21
(iii) Embedded derivatives designated as cash flow hedges 2.62 4.31 1.94
Sub-total (III) 2411.26 2321.43 2801.53
Total (I+II+III) 37603.98 35418.44 29719.80
(b) Category-wise classification for applicable financial liabilities:
v crore
Sr. no.
Particulars As at
31-3-2017 As at
31-3-2016 As at
1-4-2015
I. Measured at fair value through profit or loss (FVTPL):
(i) Derivative Instruments not designated as cash flow hedges 8.53 18.61 14.99
(ii) Embedded derivatives not designated as cash flow hedges 83.26 141.09 7.10
Sub-total (I) 91.79 159.70 22.09
II. Measured at amortised cost:
(i) Borrowings 10580.01 13924.41 13077.32
(ii) Trade payables 24031.83 22215.92 18376.00
(iii) Others 1217.12 1057.15 853.81
Sub-total (II) 35828.96 37197.48 32307.13
III. Derivative instruments (including embedded derivatives) through Other
Comprehensive Income:
(i) Derivative Instruments designated as cash flow hedges 279.60 130.29 353.97
(ii) Embedded derivatives designated as cash flow hedges 50.43 8.45 23.32
Sub-total (III) 330.03 138.74 377.29
IV. Financial guarantee contracts 20.71 34.96 37.73
Total (I+II+III+IV) 36271.49 37530.88 32744.24
Notes forming part of the Financial Statements (contd.)

296
(c) Items of income, expense, gains or losses related to financial instruments:
v crore
Sr. no.
Particulars2016-17 2015-16
I Net gains/(losses) on financial assets and financial liabilities measured at fair value through Profit or Loss and amortised cost:
A Mandatorily measured at fair value through Profit or Loss:
(i) Gains/(losses) on fair valuation or sale of investment (180.66) 11.98
(ii) Gains/(losses) on fair valuation or settlement of forward contracts not designated as cash flow hedges (33.57) (25.45)
(iii) Gains/(losses) on fair valuation or settlement of embedded derivative contracts not designated as cash flow hedges 9.93 (0.16)
Sub-total (A) (204.30) (13.63)
B Financial assets measured at amortised cost:
(i) exchange difference gains/(losses) on revaluation or settlement of items denominated in foreign currency (trade receivables, loans given etc.) (173.03) 291.03
(ii) (Allowance)/reversal for ECL recognised during the year in the Statement of Profit and Loss
(220.71) (345.66)
(iii) Provision for doubtful debts (other than ECL) (net) (167.14) (221.31)
(iv) Bad debts written off (net) (42.43) (108.23)
Sub-total (B) (603.31) (384.17)
C Financial liabilities measured at amortised cost:
(i) exchange difference gains/(losses) on re-valuation or settlement of items denominated in foreign currency (trade payables, borrowings availed etc.) 277.28 (831.25)
(ii) Unclaimed credit balances written back 130.71 57.11
Sub-total (C) 407.99 (774.14)
Total [I] = (A+B+C) (399.62) (1171.94)
II Net gains/(losses) on financial assets and financial liabilities measured at fair value through Other Comprehensive Income:
A Financial assets measured at fair value through Other Comprehensive Income:
(i) Gains/(losses) recognised in Other Comprehensive Income:
1. Gains/(losses) on fair valuation or sale of government securities, bonds, debentures etc.
103.82 (29.81)
2. Gains/(losses) on fair valuation or settlement of forward contracts designated as cash flow hedges (129.42) (146.14)
3. Gains/(losses) on fair valuation or settlement of embedded derivative contracts designated as cash flow hedges (24.02) 9.72
Sub-total (i) (49.62) (166.23)
Less:
(ii) Gains/(losses) reclassified to Profit and Loss from Other Comprehensive Income:
1. On government securities, bonds, debentures etc. upon sale 112.99 (25.94)
2. On forward contracts upon hedged future cash flows affecting the profit or Loss or related assets or liabilities (142.39) 274.12
3. On embedded derivative contracts upon hedged future cash flows affecting the profit or loss or related asset or liability (4.08) –
Sub-total (ii) (33.48) 248.18
Net gain recognised in Other Comprehensive Income [II] = [(i)-(ii)] (16.14) (414.41)
III Other income/expense:
A Dividend income:
(i) Dividend income from investments measured at FVTPL 659.63 113.06
B Interest income:
(i) Financial assets measured at amortised cost 380.28 330.27
(ii) Financial assets measured at fair value through Other Comprehensive Income 157.84 199.13
(iii) Financial assets measured at fair value through Profit or Loss 1.08 1.29
Sub-total (B) 539.20 530.69
Notes forming part of the Financial Statements (contd.)
NOTE [45]
Disclosure pursuant to Ind AS 107 “Financial Instruments: Disclosures” (contd.)

297
v crore
Sr. no.
Particulars2016-17 2015-16
C Interest expense
(i) Financial liabilities measured at fair value through Other Comprehensive Income (401.21) (528.20)
(ii) Financial liabilities measured at amortised cost (832.36) (863.84)
(iii) Financial liabilities measured at fair value through Profit or Loss 5.69 (27.85)
Sub-total (C) (1227.88) (1419.89)
Total [III] = (A+B+C) (29.05) (776.14)
(d) Fair value of financial assets and financial liabilities measured at amortised cost:
(i) Financial assets measured at amortised cost:
The carrying amounts of trade receivables and cash and cash equivalents are considered to be the same as their fair values
due to their short term nature. The carrying amounts of long term loans given with floating rate of interest are considered to
be close to the fair value.
(ii) Financial liabilities measured at amortised cost:v crore
Particulars
As at 31-3-2017 As at 31-3-2016 As at 1-4-2015 Fair value
hierarchyCarrying
amount
Fair value Carrying
amount
Fair value Carrying
amount
Fair value
0.675 % Foreign currency
convertible bonds 1201.78 1222.20 1190.86 1236.75 1089.81 1106.46 L2*
Redeemable non-convertible fixed
rate debentures 2588.03 2677.39 3187.31 3234.66 2736.19 2789.39 L2*
Foreign currency non-resident loan – – – – 315.18 314.93 L2*
Total 3789.81 3899.59 4378.17 4471.41 4141.18 4210.78
Note: The carrying amounts of trade and other payables are considered to be the same as their fair values due to their short
term nature. The carrying amounts of borrowings with floating rate of interest are considered to be close to the fair value.
* Valuation technique L2: Future cash flows discounted using G-sec/LIBOR rates plus corporate spread.
(e) Fair value hierarchy of financial assets and liabilities measured at fair value: v crore
ParticularsNote As at 31-3-2017 As at 31-3-2016 As at 1-4-2015
Level 1 Level 2 Level 3 Total Level 1 Level 2 Level 3 Total Level 1 Level 2 Level 3 Total
Financial assets:
Investments at FVTPL
(i) Equity shares (other than
those held in subsidiary &
associate companies) 5 – – 56.04 56.04 – – 56.04 56.04 117.26 – 56.04 173.30
(ii) Preference shares 5 – 605.10 – 605.10 – 441.95 – 441.95 – 45.65 – 45.65
(iii) Mutual fund units 10 5031.03 – – 5031.03 2680.28 – – 2680.28 3041.48 – – 3041.48
(iv) Bonds 10 202.33 – – 202.33 300.13 – – 300.13 164.19 – – 164.19
(v) Derivative instruments not
designated as cash flow
hedges 7,15 – 6.08 – 6.08 – 1.31 – 1.31 – 18.41 – 18.41
(vi) Embedded derivative
instruments not designated
as cash flow hedges 7,15 – 78.97 – 78.97 – 131.64 – 131.64 – 10.39 – 10.39
Notes forming part of the Financial Statements (contd.)
NOTE [45]
(c) Items of income, expense, gains or losses related to financial instruments (contd.)

298
v crore
ParticularsNote As at 31-3-2017 As at 31-3-2016 As at 1-4-2015
Level 1 Level 2 Level 3 Total Level 1 Level 2 Level 3 Total Level 1 Level 2 Level 3 Total
Investments at FVTOCI
(i) Debt instruments viz.
government securities, bonds,
debentures etc. 10 1748.72 – – 1748.72 1822.91 – – 1822.91 2312.38 – – 2312.38
(ii) Derivative financial
instruments designated as
cash flow hedges 7, 15 – 659.92 – 659.92 – 494.21 – 494.21 – 487.21 – 487.21
(iii) Embedded derivative financial
instruments designated as
cash flow hedges 7, 15 – 2.62 – 2.62 – 4.31 – 4.31 – 1.94 – 1.94
Total 6982.08 1352.69 56.04 8390.81 4803.32 1073.42 56.04 5932.78 5635.31 563.60 56.04 6254.95
Financial liabilities:
Financial liabilities at FVTPL
(i) Designated as at FVTPL
(a) Derivative instruments not
designated as cash flow
hedges 20,26 – 8.53 – 8.53 – 18.61 – 18.61 – 14.99 – 14.99
(b) Embedded derivative
instruments not designated
as cash flow hedges 20,26 – 83.26 – 83.26 – 141.09 – 141.09 – 7.10 – 7.10
(ii) Derivative instruments
(including embedded
derivatives)
(a) Derivative financial
instruments designated as
cash flow hedges 20,26 – 279.60 – 279.60 – 130.29 – 130.29 – 353.97 – 353.97
(b) Embedded Derivative financial
instruments designated as
cash flow hedges 20,26 – 50.43 – 50.43 – 8.45 – 8.45 – 23.32 – 23.32
Total – 421.82 – 421.82 – 298.44 – 298.44 – 399.38 – 399.38
Valuation technique and key inputs used to determine fair value:
A. Level 1: Mutual funds, bonds, debentures and government securities - Quoted price in the active market.
B. Level 2: (a) Derivative instruments – Present value technique using forward exchange rates at the end of reporting period.
(b) Preference shares – Future cash flows are discounted using G-sec rates as at reporting date.
(f) Significant unobservable inputs used in level 3 fair value measurements and sensitivity of the fair value measurement to changes in
unobservable inputs:
v crore
Particulars
Fair Value
as at
31-3-2017
Fair Value
as at
31-3-2016
Fair Value
as at
1-4-2015
Significant unobservable inputs
Sensitivity
Equity investment in
Tidel Park Limited
55.94 55.94 55.94 1. Lease realisation: Net
realisation per month v 30
per sq/ft.
1% change in net realisation would
result in +/- v 0.38 crore
2. Capitalisation rate 12% 25 bps change in capitalisation rate
would result in +/- v 0.78 crore
Notes forming part of the Financial Statements (contd.)
NOTE [45]
(e) Fair value hierarchy of financial assets and liabilities measured at fair value (contd.)

299
(g) Maturity profile of financial liabilities:
v crore
Particulars Note
As at 31-3-2017 As at 31-3-2016 As at 1-4-2015
Within
twelve
months
After
twelve
months
Total
Within
twelve
months
After
twelve
months
Total
Within
twelve
months
After
twelve
months
Total
A. Non-derivative liabilities
Borrowings 19, 23, 24 3731.18 7797.02 11528.20 5947.08 9295.07 15242.15 5040.48 9403.71 14444.19
Trade payables 25 22776.80 1255.03 24031.83 21217.48 998.44 22215.92 17215.16 1160.83 18376.00
Other financial liabilities 20, 26 1160.08 81.09 1241.17 1007.55 89.79 1097.34 819.72 72.69 892.41
Total 27668.06 9133.14 36801.20 28172.11 10383.30 38555.41 23075.36 10637.24 33712.60
B. Derivative liabilities
Forward contracts 20, 26 267.62 30.21 297.83 119.10 37.23 156.33 328.03 49.69 377.72
Embedded derivatives 20, 26 120.33 26.42 146.75 170.75 – 170.75 12.78 23.07 35.85
Total 387.95 56.63 444.58 289.85 37.23 327.08 340.81 72.76 413.57
(h) Details of outstanding hedge instruments for which hedge accounting is followed:
(i) Outstanding currency exchange rate hedge instruments:
(A) Forward covers taken to hedge exchange rate risk and accounted as cash flow hedge:
Particulars
As at 31-3-2017 As at 31-3-2016 As at 1-4-2015
Nominal amount
(v crore)
Average rate (v)
Within twelve
months(v crore)
After twelve
months(v crore)
Nominal amount
(v crore)
Average rate (v)
Within twelve
months(v crore)
After twelve
months(v crore)
Nominal amount
(v crore)
Average rate (v)
Within twelve
months(v crore)
After twelve
months(v crore)
(a) Receivable hedges
US Dollar 2817.69 66.87 2185.09 632.60 2572.61 66.75 1988.31 584.30 2026.73 66.34 1624.77 401.96
EURO 723.40 84.61 507.79 215.61 926.50 86.04 495.64 430.86 785.34 86.69 298.22 487.12
Malaysian Ringgit 331.20 14.86 331.20 – 258.49 18.57 45.24 213.25 – – – –
Saudi Riyal – – – – 63.65 18.34 63.65 – 42.94 17.14 42.94 –
Omani Riyal 324.75 172.04 309.74 15.01 44.67 176.63 44.67 – 65.82 137.55 65.82 –
Arab Emirates Dirham 1229.22 17.59 1029.47 199.75 1097.11 18.83 955.63 141.48 1149.04 17.78 1010.21 138.83
Canadian Dollar 9.41 50.29 9.41 – – – – – – – – –
British Pound 6.12 81.60 6.12 – – – – – 2.35 94.05 2.35 –
Japanese Yen 845.50 0.66 467.82 377.68 262.44 0.64 159.10 103.34 207.39 0.70 0.16 207.23
Kuwaiti Dinar 187.89 220.92 164.74 23.15 141.21 228.69 118.06 23.15 165.75 211.81 165.75 –
Qatari Riyal 1184.17 15.58 1061.92 122.25 1681.41 19.07 1317.65 363.76 1477.36 17.78 1314.38 162.98
Bahraini Dinar – – – – 18.98 158.12 18.98 – – – – –
Particulars
As at 31-3-2017 As at 31-3-2016 As at 1-4-2015
Nominal amount
(v crore)
Average rate (v)
Within twelve
months(v crore)
After twelve
months(v crore)
Nominal amount
(v crore)
Average rate (v)
Within twelve
months(v crore)
After twelve
months(v crore)
Nominal amount
(v crore)
Average rate (v)
Within twelve
months(v crore)
After twelve
months(v crore)
(b) Payable hedges
US Dollar 7232.88 62.41 6082.60 1150.28 9328.85 67.54 5508.25 3820.60 7734.12 63.71 3889.00 3845.12
EURO 1907.72 71.72 1799.42 108.30 1934.13 75.92 1876.46 57.67 2135.94 73.42 2062.80 73.14
Arab Emirates Dirham 7.24 18.11 7.24 – 7.33 18.20 7.33 – – – – –
Swiss Franc 266.74 67.51 266.74 – 299.54 74.49 219.68 79.86 160.06 69.43 160.06 –
Chinese Yuan 63.51 9.63 63.51 – 104.77 10.70 104.77 – 2.21 10.06 2.21 –
British Pound 2.97 81.81 2.97 – 10.61 101.00 10.61 – 16.61 97.34 16.61 –
Japanese Yen 385.36 0.61 385.36 – 614.50 0.59 614.50 – 110.06 0.57 110.06 –
Kuwaiti Dinar 4.40 219.94 4.40 – – – – – – – – –
Qatari Riyal – – – – 244.46 18.57 244.46 – 175.69 17.22 175.69 –
Saudi Riyal – – – – 71.76 18.17 71.76 –
Notes forming part of the Financial Statements (contd.)
NOTE [45] (contd.)

300
(B) Options taken to hedge exchange rate risk and accounted as cash flow hedge:
Particulars
As at 31-3-2017 As at 31-3-2016 As at 1-4-2015
Nominal amount
(v crore)
Average rate (v)
Within twelve
months (v crore)
After twelve
months (v crore)
Nominal amount
(v crore)
Average rate (v)
Within twelve
months (v crore)
After twelve
months (v crore)
Nominal amount
(v crore)
Average rate (v)
Within twelve
months(v crore)
After twelve
months (v crore)
Receivable hedges
US Dollar – – – – – – – – 148.53 63.54 148.53 –
(C) Forward covers taken to hedge exchange rate risk and accounted as net investment hedge:
Particulars
As at 31-3-2017 As at 31-3-2016 As at 1-4-2015
Nominal amount
(v crore)
Average rate (v)
Within twelve
months (v crore)
After twelve
months(v crore)
Nominal amount
(v crore)
Average rate (v)
Within twelve
months (v crore)
After twelve
months (v crore)
Nominal amount
(v crore)
Average rate (v)
Within twelve
months (v crore)
After twelve
months (v crore)
Receivable hedges
Saudi Riyal 785.74 19.44 27.79 757.95 584.21 20.81 – 584.21 366.36 19.54 366.36 –
(ii) Outstanding interest rate hedge instruments:
Interest rate swaps taken to hedge interest rate risk and accounted as cash flow hedge:
Particulars
As at 31-3-2017 As at 31-3-2016 As at 1-4-2015
Nominal amount
(v crore)
Average rate (%)
Within twelve
months (v crore)
After twelve
months (v crore)
Nominal amount
(v crore)
Average rate (%)
Within twelve
months (v crore)
After twelve
months (v crore)
Nominal amount
(v crore)
Average rate (%)
Within twelve
months (v crore)
After twelve
months (v crore)
Floating interest rate borrowings 1433.26 8.00 672.70 760.56 1614.52 8.01 181.30 1433.22 1614.52 8.01 – 1614.52
(iii) Outstanding commodity price hedge instruments:
Commodity Forward Contract
Particulars
As at 31-3-2017 As at 31-3-2016 As at 1-4-2015
Nominal amount
(v crore)
Average rate(v)
Within twelve
months(v crore)
After twelve
months(v crore)
Nominal amount
(v crore)
Average rate(v)
Within twelve
months(v crore)
After twelve
months(v crore)
Nominal amount
(v crore)
Average rate(v)
Within twelve
months(v crore)
After twelve
months(v crore)
Silver (Kg) – – – – – – – – 13.45 37373.00 13.45 – Copper (Tn) 30.99 290443.90 30.99 – 282.83 316014.00 282.83 – 123.25 357981.55 123.25 – Aluminium (Tn) 8.20 112943.72 8.20 – 122.62 111517.20 122.62 – 80.59 120551.00 80.59 – Iron Ore (Tn) 71.66 3592.00 43.19 28.47 41.83 3053.00 23.38 18.45 – – – – Coking Coal (Tn) 50.40 11494.00 42.07 8.33 16.86 5526.00 16.86 – – – – – Zinc (Tn) 9.53 177153.00 9.53 – 46.56 121345.00 46.56 – 17.15 135003.00 17.15 – Lead (Tn) 0.23 150777.00 0.23 – 13.16 121104.00 13.16 – 10.65 112455.00 10.65 –
(i) Carrying amounts of hedge instruments for which hedge accounting is followed:
Cash flow hedge v crore
Particulars As at 31-3-2017 As at 31-3-2016 As at 1-4-2015
Currency exposure
Interest rate exposure
Commodity price
Currency exposure
Interest rate exposure
Commodity price
Currency exposure
Interest rate exposure
Commodity price
(i) Forward contracts Current: Asset - Other financial assets 236.80 – 29.03 128.74 – 0.69 205.96 6.55 Liability - Other financial liabilities 286.77 – (4.89) 115.43 – 0.06 316.29 3.54 Non-current: Asset - Other financial assets 105.25 – 3.34 27.62 – – 57.24 Liability - Other financial liabilities 46.76 – 1.39 22.67 – – 53.41(ii) Swap contracts Current: Asset - Other financial assets 123.06 (1.38) – Liability - Other financial liabilities – – – 0.58 – – 0.52 – – Non-current: Asset - Other financial assets 116.91 (15.69) – 328.98 (2.73) – 167.74 22.49 – Liability - Other financial liabilities – – – – – – (6.70) 10.23 –
Notes forming part of the Financial Statements (contd.)
NOTE [45] (contd.)

301
Net Investment v crore
Particulars
As at 31-3-2017 As at 31-3-2016 As at 1-4-2015
Currency
exposure
Interest rate
exposure
Commodity
price
Currency
exposure
Interest rate
exposure
Commodity
price
Currency
exposure
Interest rate
exposure
Commodity
price
(i) Forward contracts
Current:
Asset - Other financial assets 1.47 – – – – – 29.17 – –
Non-current:
Asset - Other financial assets 63.75 – – 15.22 – – – – –
(j) Breakup of cash flow hedging reserve and cost of hedging reserve:
v crore
Particulars
As at 31-3-2017 As at 31-3-2016 As at 1-4-2015
Cash flow
hedging
reserve
Cost of
hedging
reserve
Cash flow
hedging
reserve
Cost of
hedging
reserve
Cash flow
hedging
reserve
Cost of
hedging
reserve
Balance towards continuing hedges 186.68 (58.49) 4.46 (15.07) (21.99) (26.41)
Balance for which hedge accounting discontinued 15.92 – (25.22) – (77.18) –
(k) Reclassification of hedging reserve and cost of hedging reserve to Profit or Loss:
v crore
ParticularsHedge reserve
2016-17 2015-16
Future cash flows are no longer expected to occur:
Sales, administration and other expenses (9.69) 43.85
Hedged expected future cash flows affecting profit or loss:
Progress billing 118.94 (19.59)
Revenue from operations 43.53 (14.68)
Manufacturing, construction and operating expenses (133.47) (141.36)
Finance costs (401.21) (528.20)
Sales, administration and other expenses (46.84) 386.31
(l) Movement of hedging reserve and cost of hedging reserve:
v crore
Hedging reserve2016-17 2015-16
Gross Tax Net of tax Gross Tax Net of tax
Opening balance (31.74) 10.98 (20.76) (151.65) 52.48 (99.17)
Changes in the spot element of the forward contracts which is designated as hedging instrument for time period related hedges (209.15) 72.44 (136.71) 231.72 (80.12) 151.60
Changes in fair value of forward contracts designated as hedging instruments 264.25 (91.52) 172.73 (22.52) 7.78 (14.74)
Changes in intrinsic value of option contracts – – – (0.13) 0.05 (0.08)
Changes in fair value of swaps 55.38 (19.18) 36.20 (15.22) 5.26 (9.96)
Amount reclassified to Profit or Loss 346.79 (120.11) 226.68 (93.71) 32.36 (61.35)
Amount included in non-financial assets/liabilities (115.56) 40.02 (75.54) 19.77 (6.83) 12.94
Closing balance 309.97 (107.37) 202.60 (31.74) 10.98 (20.76)
Notes forming part of the Financial Statements (contd.)
NOTE [45]
(i) Carrying amounts of hedge instruments for which hedge accounting is followed (contd.)

302
v crore
Cost of hedging reserve2016-17 2015-16
Gross Tax Net of tax Gross Tax Net of tax
Opening balance (23.04) 7.97 (15.07) (40.38) 13.97 (26.41)
Changes in the forward element of the forward contracts
where changes in spot element of forward contract is
designated as hedging instrument for time period related
hedges (263.92) 91.34 (172.58) (330.27) 114.37 (215.90)
Amount reclassified to Profit or Loss 197.51 (68.35) 129.16 347.61 (120.37) 227.24
Closing balance (89.45) 30.96 (58.49) (23.04) 7.97 (15.07)
NOTE [46]
Exceptional items for the year ended March 31, 2017 include the following:
(i) Gain of v 1947.89 crore on sale of the Company’s part stake in subsidiary companies viz. Larsen & Toubro Infotech Limited -
v 1191.70 crore and L&T Technology Services Limited - v 756.19 crore;
(ii) Loss on divestment of stake in L&T General Insurance Company Limited - v 92.84 crore;
(iii) Loss on sale of company’s full stake in subsidiary company L&T Arabia LLC - v 11.08 crore to a wholly owned subsidiary company
and
(iv) Provision for impairment of investment in Infrastructure Development Projects Limited - v 950 crore.
Exceptional items for the year ended March 31, 2016 include the following:
(i) Gain on sale of the Company’s part stake in L&T Finance Holdings Limited - v 488.39 crore,
(ii) Gain on divestment of stake in L&T-Valdel Engineering Limited - v 36.59 crore, L&T-Gulf Private Limited – v 6.74 crore and L&T
Sapura Shipping Private Limited – v 9.18 crore to a wholly owned subsidiary company.
(iii) Gain of v 105.86 crore on sale of the Company’s stake in associate companies viz. Salzer Electronics Limited - v 57.46 crore and
L&T-Chiyoda Limited - v 48.40 crore;
(iv) Gain of v 48.52 crore on sale of the Company’s Foundry Business Unit and
(v) Provision for impairment of investment in L&T General Insurance Company Limited - v 135 crore.
NOTE [47]
Disclosure pursuant to Ind AS 108 “Operating Segment”
(a) Information about reportable segment
v crore
ParticularsFor the year ended 31-3-2017 For the year ended 31-3-2016
External Inter-segment Total External Inter-segment Total
Revenue
Infrastructure 46573.35 321.07 46894.42 45236.94 409.50 45646.44
Power 6938.79 – 6938.79 6425.48 1.33 6426.81
Heavy Engineering 3098.38 233.39 3331.77 2779.17 156.32 2935.49
Electrical & Automation 4058.19 223.15 4281.34 3874.66 308.69 4183.35
Others 5632.64 483.17 6115.81 5496.40 410.24 5906.64
Elimination – (1260.78) (1260.78) – (1286.08) (1286.08)
Total 66301.35 – 66301.35 63812.65 – 63812.65
Segment result [Profit/(Loss) before interest and tax]
Infrastructure 4147.12 4701.14
Power 201.18 112.84
Heavy Engineering 530.88 (98.48)
Electrical & Automation 520.39 436.59
Others 492.07 384.36
Total 5891.64 5536.45
Notes forming part of the Financial Statements (contd.)
NOTE [45]
(l) Movement of hedging reserve and cost of hedging reserve (contd.)

303
v crore
ParticularsFor the year ended 31-3-2017 For the year ended 31-3-2016
External Inter-segment Total External Inter-segment Total
Inter-segment margin on capital jobs (32.83) (11.02)
5858.81 5525.43
Unallocated corporate income/(expenditure) (net) 783.78 1116.01
Operating Profit (PBIT) 6642.59 6641.44
Interest expense (1318.03) (1476.82)
Interest income 539.31 530.72
Profit before tax (PBT) 5863.87 5695.34
Provision for current tax (1675.20) (1530.01)
Provision for deferred tax 371.10 273.97
Profit after tax (before exceptional items) 4559.77 4439.30
Profit from exceptional items 893.97 560.28
Profit after tax (after exceptional items) 5453.74 4999.58
v crore
Segment assets Segment liabilities
Particulars As at As at As at As at As at As at
31-3-2017 31-3-2016 1-4-2015 31-3-2017 31-3-2016 1-4-2015
Infrastructure 43931.92 42284.29 35811.84 29858.24 27176.56 23933.86
Power 6241.46 7470.09 6158.33 6362.49 7382.07 6126.57
Heavy Engineering 4868.03 5017.80 5023.67 3270.32 3318.20 2533.52
Electrical & Automation 3007.54 2907.22 3005.70 1530.93 1338.19 1410.52
Others 7940.91 8011.28 8013.04 3967.19 3887.56 3358.18
Total 65989.86 65690.68 58012.58 44989.17 43102.58 37362.65
Unallocable corporate assets/liabilities 36742.92 34515.85 31924.50 11730.87 14968.64 14021.90
Inter-segment assets/liabilities (535.96) (585.58) (591.30) (535.96) (585.58) (591.30)
Total assets/liabilities 102196.82 99620.95 89345.78 56184.08 57485.64 50793.25
v crore
Particulars
Depreciation, amortisation, impairment & obsolescence
included in segment expense
Other non-cash expenses included in segment expense
Additions to non-current assets
For the year ended
31-3-2017
For the year ended
31-3-2016
For the year ended
31-3-2017
For the year ended
31-3-2016
For the year ended
31-3-2017
For the year ended
31-3-2016
Infrastructure 591.45 430.54 19.81 22.09 564.53 1158.73
Power 44.40 58.31 1.99 3.23 100.17 450.04
Heavy Engineering 105.75 110.84 2.49 3.31 92.98 231.09
Electrical & Automation 130.81 123.10 3.83 4.87 165.38 297.63
Others 122.60 151.06 4.45 5.61 75.04 131.22
Total 995.01 873.85 32.57 39.11 998.10 2268.71
Unallocable corporate 220.18 123.55 29.20 21.23 567.07 130.37
Inter-segment – – – – (166.44) (514.43)
Total 1215.19 997.40 61.77 60.34 1398.73 1884.65
Note: There is no impairment in non-financial assets of the segments. Unallocable corporate expenses include impairment loss of
v 103 crore for the year ended March 31, 2017 (previous year: v Nil).
Notes forming part of the Financial Statements (contd.)
NOTE [47(a)]
Disclosure pursuant to Indian Accounting Standard (Ind AS) 108 “Operating Segment” (contd.)
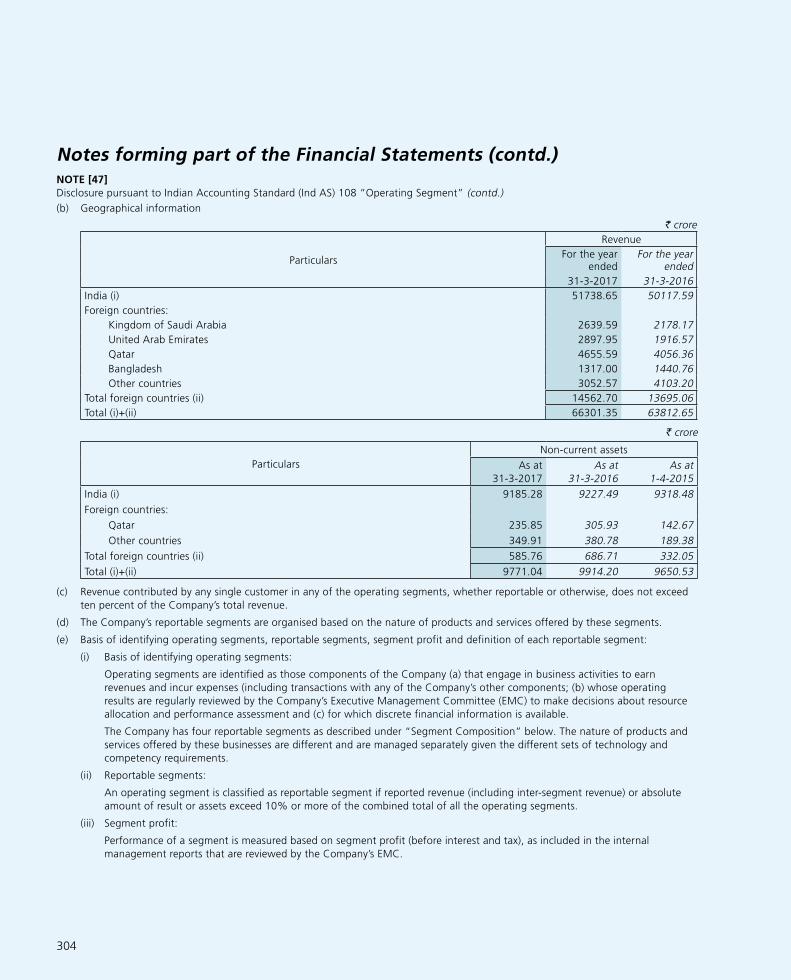
304
(b) Geographical information
v crore
Revenue
ParticularsFor the year
endedFor the year
ended
31-3-2017 31-3-2016
India (i) 51738.65 50117.59
Foreign countries:
Kingdom of Saudi Arabia 2639.59 2178.17
United Arab Emirates 2897.95 1916.57
Qatar 4655.59 4056.36
Bangladesh 1317.00 1440.76
Other countries 3052.57 4103.20
Total foreign countries (ii) 14562.70 13695.06
Total (i)+(ii) 66301.35 63812.65
v crore
Particulars
Non-current assets
As at
31-3-2017
As at
31-3-2016
As at
1-4-2015
India (i) 9185.28 9227.49 9318.48
Foreign countries:
Qatar 235.85 305.93 142.67
Other countries 349.91 380.78 189.38
Total foreign countries (ii) 585.76 686.71 332.05
Total (i)+(ii) 9771.04 9914.20 9650.53
(c) Revenue contributed by any single customer in any of the operating segments, whether reportable or otherwise, does not exceed
ten percent of the Company’s total revenue.
(d) The Company’s reportable segments are organised based on the nature of products and services offered by these segments.
(e) Basis of identifying operating segments, reportable segments, segment profit and definition of each reportable segment:
(i) Basis of identifying operating segments:
Operating segments are identified as those components of the Company (a) that engage in business activities to earn
revenues and incur expenses (including transactions with any of the Company’s other components; (b) whose operating
results are regularly reviewed by the Company’s Executive Management Committee (EMC) to make decisions about resource
allocation and performance assessment and (c) for which discrete financial information is available.
The Company has four reportable segments as described under “Segment Composition” below. The nature of products and
services offered by these businesses are different and are managed separately given the different sets of technology and
competency requirements.
(ii) Reportable segments:
An operating segment is classified as reportable segment if reported revenue (including inter-segment revenue) or absolute
amount of result or assets exceed 10% or more of the combined total of all the operating segments.
(iii) Segment profit:
Performance of a segment is measured based on segment profit (before interest and tax), as included in the internal
management reports that are reviewed by the Company’s EMC.
Notes forming part of the Financial Statements (contd.)
NOTE [47]
Disclosure pursuant to Indian Accounting Standard (Ind AS) 108 “Operating Segment” (contd.)

305
(iv) Segment composition:
• Infrastructure segment comprises engineering and construction of building and factories, transportation
infrastructure, heavy civil infrastructure, power transmission & distribution, water & effluent treatment and smart world
& communication projects.
• Power segment comprises turnkey solutions for Coal-based and Gas-based thermal power plants including power
generation equipment with associated systems and/or balance-of-plant packages.
• Heavy Engineering segment comprises manufacture and supply of custom designed, engineered critical equipment
and systems to core sector industries like Fertiliser, Refinery, Petrochemical, Chemical, Oil & Gas, Thermal & Nuclear
Power, Aerospace and Defence.
• Electrical & Automation segment comprises manufacture and sale of low and medium voltage switchgear
components, custom built low and medium voltage switchboards, electronic energy meters/protection (relays) systems,
control & automation products.
• Others segment includes metallurgical & material handling systems, realty, shipbuilding, manufacture, marketing
and servicing of construction equipment and parts thereof, marketing and servicing of mining machinery and parts
thereof, manufacture and sale of rubber processing machinery & castings (upto the date of sale). None of the businesses
reported as part of others segment meet any of the quantitative thresholds for determining reportable segments in the
year ended March 31, 2017, the year ended March 31, 2016 or as at April 1, 2015.
NOTE [48]
(a) Disclosures pursuant to Ind AS 11 “Construction Contracts”:
v crore
Sr. no.
Particulars2016-17 2015-16 1-4-2015
i) Contract revenue recognised for the financial year [Note 31] 58498.42 55522.22 Not applicable
ii) Aggregate amount of contract costs incurred and recognised profits
(less recognised losses) as at end of the financial year for all contracts in
progress as at that date 217253.39* 210231.40* 184245.08*
iii) Amount of customer advances outstanding for contracts in progress as at
end of the financial year 12205.69 11791.52 10431.14
iv) Retention amounts by customers for contracts in progress as at end of the
financial year 6981.26 6506.01 5767.20
*includes provision for foreseeable loss: v 121.66 crore (2015-16: v 127.83 crore and 1-4-2015: v 118.36 crore)
(b) The Company has revised certain estimates used in determining the cost of completion of projects, as a part of periodic review of
estimates. As a result, the revenue and profit before tax for the year increased by v 121.46 crore (previous year: v 395.73 crore).
(c) Disclosures pursuant to Guidance Note on Accounting for Real Estate Transactions issued by the Institute of Chartered Accountants
of India:
v crore
Sr. no.
Particulars2016-17 2015-16 1-4-2015
i) Amount of project revenue recognised for the financial year [Note 31] 403.18 843.60 Not applicable
ii) Aaggregate amount of costs incurred and profits recognised (less
recognised losses) as at the end of the financial year 2332.26 2228.80 1464.99
iii) Amount of advances received 19.16 15.73 31.40
iv) Amount of work-in-progress and the value of inventories [Note 9] 281.83 304.82 201.11
v) Excess of revenue recognised over actual bills raised (unbilled revenue)
[Note 16] 71.28 10.24 48.71
Notes forming part of the Financial Statements (contd.)
NOTE [47]
Disclosure pursuant to Indian Accounting Standard (Ind AS) 108 “Operating Segment” (contd.)

306
NOTE [49]
Disclosure pursuant to Ind AS 12 “Income Taxes”
(a) Major components of tax expense/(income):
v crore
Sr. no.
Particulars2016-17 2015-16
(a) Profit or Loss section:(i) Current income tax: Current income tax expense 1671.58 1515.58 Tax expense of prior periods 3.62 14.43
1675.20 1530.01(ii) Deferred tax: Tax expense on origination and reversal of temporary differences (349.24) (273.97) Effect of previously unrecognised tax losses used to reduce tax expense (21.86) –
(371.10) (273.97)Income tax expense reported in Profit or Loss [(i)+(ii)] 1304.10 1256.04
(b) Other Comprehensive Income (OCI) section:(i) Items not to be reclassified to profit or loss in subsequent periods: Current tax expense/(income): On remeasurement of defined benefit plans (4.25) (4.47)
(4.25) (4.47)(ii) Items to be reclassified to profit or loss in subsequent periods: (A) Current tax expense/(income): Forward covers settled, retained in hedging reserve (14.47) 26.54
(14.47) 26.54 (B) Deferred tax expense/(income): Net gain/(loss) on cost of hedging reserve (22.99) 6.00 On MTM of cash flow hedges 132.82 14.96 On gain/(loss) on fair value of debt securities 1.08 (1.29) On foreign currency translation of joint operations (2.29) 2.19
108.62 21.86Income tax expense reported in Other Comprehensive Income [(i)+(ii)] 89.90 43.93
(c) Retained earnings:Current income tax (133.40) –Deferred tax 133.40 –Income tax expense reported in retained earnings – –
(b) Reconciliation of tax expense and the accounting profit multiplied by domestic tax rate applicable in India:
v crore
Sr. no.
Particulars2016-17 2015-16
(a) Profit before tax 6757.84 6255.62(b) Corporate tax rate as per Income Tax Act, 1961 34.61% 34.61%(c) Tax on Accounting profit (c)=(a)*(b) 2338.75 2164.94(d) (i) Tax on income exempt from tax:
(A) Dividend income (368.61) (388.08) (B) Long term capital gains exempt from tax (675.59) (253.24) (C) Interest on tax free bonds (10.58) (11.76)(ii) Tax on expenses not tax deductible:
(A) CSR expenses 34.87 41.70 (B) Expenses in relation to exempt income 19.83 50.24 (C) Tax on employee perquisites borne by the Company 3.28 2.93(iii) Weighted deduction on R&D expenditure and deduction u/s 80IA (368.93) (269.36)(iv) Tax effect on impairment losses recognised and on which deferred tax asset
is not recognised 328.78 46.72(v) Effect of previously unrecognised tax losses used to reduce tax expense (21.86) –(vi) Tax effect of losses of current year on which no deferred tax benefit is
recognised 42.99 5.94(vii) Tax effect on various other items (18.83) (133.99)Total effect of tax adjustments [(i) to (vii)] (1034.65) (908.90)
(e) Tax expense recognised during the year (e)=(c)-(d) 1304.10 1256.04(f) Effective tax Rate (f)=(e)/(a) 19.30% 20.08%
Notes forming part of the Financial Statements (contd.)

307
(c) i. Unused tax losses for which no deferred tax asset is recognised in Balance Sheet
Particulars
As at 31-3-2017 As at 31-3-2016 As at 1-4-2015
Base amount
(v crore)
Deferred tax
(v crore)
Expiry date (Assessment
year)
Base amount
(v crore)
Deferred tax
(v crore)
Expiry date (Assessment
year)
Base amount
(v crore)
Deferred tax
(v crore)
Expiry date (Assessment
year)
Tax losses (capital loss on which no tax asset is created)
Assessment Year 2017-18 1336.82 247.71 31-3-2026 – – – – – –
Assessment Year 2016-17 1149.58 265.23 31-3-2025 1149.58 265.23 31-3-2025 – – –
Total 2486.40 512.94 – 1149.58 265.23 – – – –
ii. Unrecognised deductible temporary differences for which no deferred tax asset is recognised in Balance Sheet
v crore
Sr.
no.Particulars
As at 31-3-2017 As at 31-3-2016 As at 1-4-2015
Base amount Deferred tax Base amount Deferred tax Base amount Deferred tax
(a) Deductible temporary differences towards provision
for diminution in value of investments on which
DTA not created 1019.47 243.23 204.47 55.19 46.04 15.65
(b) Temporary differences arising out of revaluation
of tax base of assets (on account of indexation
benefit) 4736.69 1092.85 3706.06 855.06 3832.28 868.39
Total 5756.16 1336.08 3910.53 910.25 3878.32 884.04
(d) Components of deferred tax (assets) and liabilities recognised in Balance Sheet and Statement of Profit or Loss:
v crore
Sr.
no.Particulars
Balance Sheet Statement of Profit or Loss
As at 31-3-2017
As at 31-3-2016
As at 1-4-2015
2016-17 2015-16
(a) Disputed statutory liabilities claimed on payment basis u/s 43B of the Income Tax Act, 1961
150.54 113.65 100.48 36.89 13.17
(b) Items disallowed u/s 43B of the Income Tax Act,
1961
(213.79) (197.34) (173.52) (16.45) (23.82)
(c) Provision for doubtful debts and advances (740.19) (616.97) (403.72) (123.21) (213.26)
(d) Difference between book depreciation and tax
depreciation
510.22 587.29 605.17 (77.07) (17.89)
(e) Gain/(loss) on derivative transactions 18.80 (91.20) (112.03) – –
(f) Other temporary differences (10.80) 48.43 79.59 (191.26) (32.17)
Deferred tax expense/(income) (371.10) (273.97)
Net deferred tax (assets)/liabilities (285.22) (156.14) 95.97
(e) Reconciliation of deferred tax (assets)/liabilities:
v crore
Sr. no.
Particulars2016-17 2015-16
(a) Opening balance as at April 1 (156.14) 95.97
(b) Tax (income)/expense during the period recognised in:
(i) statement of Profit and Loss in Profit or Loss section (371.10) (273.97)
(ii) statement of Profit and Loss under OCI section 108.62 21.86
(iii) retained earnings 133.40 –
Closing balance as at March 31 (285.22) (156.14)
Notes forming part of the Financial Statements (contd.)
NOTE [49]
Disclosure pursuant to Ind AS 12 “Income Taxes” (contd.)

308
NOTE [50]
Disclosure pursuant to Ind AS 19 “Employee Benefits”:
(I) Defined contribution plans - Note 1(k)(ii)(A): Amount of v 118.34 crore (previous year: v 102.98 crore) is recognised as an expense.
(II) Defined benefit plans - Note 1(k)(ii)(B):
(a) The amounts recognised in Balance Sheet are as follows:
v crore
Particulars
Gratuity Plan Post-retirement medical benefit plan
As at
31-3-2017
As at
31-3-2016
As at
1-4-2015
As at
31-3-2017
As at
31-3-2016
As at
1-4-2015
A) Present value of defined benefit obligation
– Wholly funded 445.79 415.70 422.36 – – –
– Wholly unfunded 71.94 52.70 35.85 185.64 155.58 148.90
517.73 468.40 458.21 185.64 155.58 148.90
Less: Fair value of plan assets 439.61 385.85 364.71 – – –
Add: Amount not recognised as an asset (limit in para 64(b)) – – 2.08 – – –
Amount to be recognised as liability or (asset) 78.12 82.55 95.58 185.64 155.58 148.90
B) Amounts reflected in Balance Sheet
Liabilities 78.12 82.55 95.58 185.64 155.58 148.90
Assets – – – – – –
Net liability/(asset) 78.12 82.55 95.58 185.64 155.58 148.90
Net liability/(asset) - current 78.12 82.55 95.58 5.25 11.16 10.04
Net liability/(asset) - non-current – – – 180.39 144.42 138.86
v crore
Particulars
Company pension plan Trust-managed provident fund plan
As at
31-3-2017
As at
31-3-2016
As at
1-4-2015
As at
31-3-2017
As at
31-3-2016
As at
1-4-2015
A) Present value of defined benefit obligation
– Wholly funded – – – 2146.56 1986.97 1856.97
– Wholly unfunded 312.75 283.25 215.64 – 9.87 27.78
312.75 283.25 215.64 2146.56 1996.84 1884.75
Less: Fair value of plan assets – – – 2156.30 1990.14 1857.15
Amount to be recognised as liability or (asset) 312.75 283.25 215.64 (9.74) 6.70 27.60
B) Amounts reflected in Balance Sheet
Liabilities 312.75 283.25 215.64 23.33 22.29 27.60
Assets – – – – – –
Net liability/(asset) 312.75 283.25 215.64 23.33 22.29 27.60
Net liability/(asset) - current # 22.46 56.17 13.26 23.33 22.29 22.74
Net liability/(asset) - non-current 290.29 227.08 202.38 – – 4.86
Notes forming part of the Financial Statements (contd.)

309
(b) The amounts recognised in the Statement of Profit and Loss are as follows:
v crore
Particulars
Gratuity Plan Post-retirement medical benefit plan
Company pension plan Trust-managed provident fund plan
2016-17 2015-16 2016-17 2015-16 2016-17 2015-16 2016-17 2015-16
1 Current service cost 67.21 57.90 10.83 7.04 2.47 3.24 66.55 72.66
2 Interest cost 27.92 30.03 11.68 11.27 21.14 16.30 168.78 154.87
3 Interest income on plan assets (27.56) (34.51) – – – – (168.78) (154.87)
4 Actuarial losses/(gains) - others 19.37 1.37 15.69 (5.09) 23.63 14.14 (9.87) (17.91)
5 Actuarial losses/(gains) - difference between
actual return on plan assets and interest
income (46.42) 2.49 – – – – (10.02) (10.55)
6 Past service cost – – – 0.97 – 49.58 – –
7 Actuarial gain/(loss) not recognised in Books – – – – – – 19.89 28.46
8 Translation adjustments 0.19 – – – – – – –
9 Amount capitalised out of the above/
recovered from S&A (0.10) (0.20) (0.01) (0.01) – – – –
Total (1 to 9) 40.61 57.08 38.19 14.18 47.24 83.26 66.55 72.66
i Amount included in “employee benefits
expense” 67.30 57.70 10.82 8.00 2.47 52.82 66.55 72.66
ii Amount included as part of “finance cost” 0.36 (4.48) 11.68 11.27 21.14 16.30 – –
iii Amount included as part of “other
comprehensive income” (27.05) 3.86 15.69 (5.09) 23.63 14.14 – –
Total (i + ii + iii) 40.61 57.08 38.19 14.18 47.24 83.26 66.55 72.66
Actual return on plan assets 73.98 31.95 – – – – 178.80 165.42
(c) The changes in the present value of defined benefit obligation representing reconciliation of opening and closing balances
thereof are as follows:
v crore
Particulars
Gratuity Plan Post-retirement medical benefit plan
Company pension plan Trust-managed provident fund plan
As at
31-3-2017
As at
31-3-2016
As at
31-3-2017
As at
31-3-2016
As at
31-3-2017
As at
31-3-2016
As at
31-3-2017
As at
31-3-2016
Opening balance of the present value of defined
benefit obligation 468.40 458.21 155.58 148.90 283.25 215.64 1996.84 1884.75
Add: Current service cost 67.21 57.90 10.83 7.04 2.47 3.24 66.55 72.66
Add: Interest cost 27.92 30.03 11.68 11.27 21.14 16.30 168.78 154.87
Add: Contribution by plan participants
i) Employee – – – – – – 171.66 174.70
ii) Transfer-in/(out) – – – – – – 3.64 5.61
Add/(less): Actuarial losses/(gains)
i) Actuarial (gains)/losses arising
from changes in financial
assumptions 19.28 1.19 17.26 1.05 16.80 1.01 (9.87) (17.91)
i) Actuarial (gains)/losses arising
from changes in experience
adjustments 0.09 0.18 (1.57) (6.14) 6.83 13.13 – –
Less: Benefit paid (64.99) (79.29) (8.14) (7.51) (17.74) (15.65) (251.04) (277.84)
Add: Past service cost – – – 0.97 – 49.58 – –
Add/(less): Translation adjustments (0.18) 0.18 – – – – – –
Closing balance of the present value of defined
benefit obligation 517.73 468.40 185.64 155.58 312.75 283.25 2146.56 1996.84
Notes forming part of the Financial Statements (contd.)
NOTE [50]
Disclosure pursuant to Ind AS 19 “Employee Benefits” (contd.)

310
(d) Changes in the fair value of plan assets representing reconciliation of the opening and closing balances thereof are as follows:
v crore
Particulars
Gratuity Plan Trust-managed provident fund plan
As at
31-3-2017
As at
31-3-2016
As at
31-3-2017
As at
31-3-2016
Opening balance of the fair value of the plan assets 385.85 364.71 1990.14 1857.15
Add: Interest income on plan assets * 27.56 34.51 168.78 154.87
Add/(Less): Actuarial gains/(losses)
Difference between actual return on plan assets and interest income 46.42 (2.49) 10.02 10.55
Add: Contribution by the employer 44.77 68.41 64.75 66.22
Add/(less): Transfer in/(out) – – 3.64 5.61
Add: Contribution by plan participants – – 170.01 173.58
Less: Benefits paid (64.99) (79.29) (251.04) (277.84)
Closing balance of the plan assets 439.61 385.85 2156.30 1990.14
* Basis used to determine interest income on plan assets:
The Trust formed by the Company manages the investments of provident funds and gratuity fund. Interest income on plan
assets is determined by multiplying the fair value of the plan assets by the discount rate stated in (g)(i) below both determined
at the start of the annual reporting period.
The Company expects to fund v 6.18 crore (previous year: v 29.85 crore) towards its gratuity plan and v 73.21 crore (previous
year: v 79.93 crore) towards its trust-managed provident fund plan during the year 2017-18.
# Employer’s and employees’ contribution due towards Provident Fund.
(e) The fair value of major categories of plan assets are as follows:
v crore
Particulars
Gratuity plan
As at 31-3-2017 As at 31-3-2016 As at 1-4-2015
Quoted Unquoted Total Quoted Unquoted Total Quoted Unquoted Total
Cash and cash equivalents – 2.41 2.41 – 0.41 0.41 – 0.78 0.78
Equity instruments 14.89 – 14.89 6.71 – 6.71 7.13 – 7.13
Debt instruments - Corporate bonds 66.30 150.47 216.77 71.88 113.42 185.30 21.63 114.81 136.44
Debt instruments - Central
government bonds 135.01 – 135.01 128.16 – 128.16 145.21 – 145.21
Debt instruments - State
government bonds 123.17 – 123.17 95.44 – 95.44 53.49 – 53.49
Debt instruments - PSU bonds – 70.68 70.68 – 76.70 76.70 – 36.08 36.08
Mutual funds – Equity – 63.87 63.87 – 54.55 54.55 – 83.35 83.35
Mutual funds – Debt – 0.50 0.50 – 0.50 0.50 – 0.50 0.50
Mutual funds – Others – 0.10 0.10 – – – – – –
Fixed deposits – 1.15 1.15 – 1.20 1.20 – 3.05 3.05
Special deposit scheme – 1.46 1.46 – 1.46 1.46 – 1.46 1.46
Advances taken – (175.00) (175.00) – (175.00) (175.00) – (115.00) (115.00)
Other (payables)/receivables – (15.40) (15.40) – 10.42 10.42 – 12.22 12.22
Closing balance of the plan assets 339.37 100.24 439.61 302.19 83.66 385.85 227.46 137.25 364.71
Notes forming part of the Financial Statements (contd.)
NOTE [50]
Disclosure pursuant to Ind AS 19 “Employee Benefits” (contd.)

311
v crore
Particulars
Trust-managed provident fund plan
As at 31-3-2017 As at 31-3-2016 As at 1-4-2015
Quoted Unquoted Total Quoted Unquoted Total Quoted Unquoted Total
Cash and cash equivalents – 8.77 8.77 – 6.95 6.95 – 8.98 8.98
Debt instruments - Corporate bonds 225.16 83.05 308.21 93.47 81.23 174.70 40.72 97.07 137.79
Debt instruments - Central
government bonds 433.43 – 433.43 494.73 – 494.73 451.10 – 451.10
Debt instruments - State
government bonds 451.64 – 451.64 311.63 – 311.63 276.50 – 276.50
Debt instruments - PSU bonds 252.00 446.47 698.47 251.92 519.50 771.42 221.92 551.91 773.83
Mutual funds – Equity 7.37 45.88 53.25 – 14.02 14.02 – – –
Mutual funds – Debt – 2.70 2.70 – 12.14 12.14 – 1.30 1.30
Special deposit scheme – 199.83 199.83 – 204.55 204.55 – 207.65 207.65
Closing balance of the plan assets 1369.60 786.70 2156.30 1151.75 838.39 1990.14 990.24 866.91 1857.15
(f) The average duration of the defined benefit plan obligations at the end of the reporting period is as follows:
Plans As at 31-3-2017 As at 31-3-2016 As at 1-4-2015
1. Gratuity plan 7.53 7.19 7.06
2. Company pension plan 8.02 8.04 9.60
3. Post-retirement medical benefit plan 16.65 15.85 18.55
(g) Principal actuarial assumptions at the Balance Sheet date (expressed as weighted averages):
Particulars As at 31-3-2017 As at 31-3-2016 As at 1-4-2015
i) Discount rate:
(a) Gratuity plan 7.19% 7.79% 7.83%
(b) Company pension plan 7.19% 7.79% 7.83%
(c) Post-retirement medical benefit plan 7.19% 7.79% 7.83%
ii) Annual increase in healthcare costs (see note below) 5.00% 5.00% 5.00%
iii) Salary Growth rate:
(a) Gratuity plan 5.00% 5.00% 5.00%
(b) Company pension plan 6.00% 6.00% 6.00%
iv) Attrition Rate:
(a) For post-retirement medical benefit plan and Company pension plan, the attrition rate varies from 2% to 8%
(previous year: 2% to 8%) for various age groups.
(b) For gratuity plan the attrition rate varies from 1% to 6% (previous year: 1% to 6%) for various age groups.
v) The estimates of future salary increases, considered in actuarial valuation, take into account inflation, seniority,
promotion and other relevant factors, such as supply and demand in the employment market.
vi) The interest payment obligation of trust-managed provident fund is assumed to be adequately covered by the interest
income on long term investments of the fund. Any shortfall in the interest income over the interest obligation is
recognised immediately in the statement of Profit and Loss.
Notes forming part of the Financial Statements (contd.)
NOTE [50]
Disclosure pursuant to Ind AS 19 “Employee Benefits” (contd.)

312
vii) The obligation of the Company under the post-retirement medical benefit plan is limited to the overall ceiling limits. At
present, healthcare cost, as indicated in the principal actuarial assumption given above, has been assumed to increase at
5.00% p.a.
viii) (A) One percentage point change in actuarial assumptions would have the following effects on the defined benefit
obligation of gratuity plan:
v crore
ParticularsEffect of 1% increase Effect of 1% decrease
2016-17 2015-16 2016-17 2015-16
Impact of change in salary growth rate 36.73 32.84 (32.01) (28.77)
Impact of change in discount rate (31.16) (27.81) 36.29 32.22
(B) One percentage point change in actuarial assumptions would have the following effects on the defined benefit
obligation of company pension plan:
v crore
ParticularsEffect of 1% increase Effect of 1% decrease
2016-17 2015-16 2016-17 2015-16
Impact of change in discount rate (25.62) (21.60) 26.15 25.04
(C) One percentage point change in actuarial assumptions would have the following effects on the defined benefit
obligation of post-retirement medical benefit plan:
v crore
ParticularsEffect of 1% increase Effect of 1% decrease
2016-17 2015-16 2016-17 2015-16
Impact of change in health care cost 22.91 18.19 (18.36) (14.66)
Impact of change in discount rate (27.42) (21.97) 35.33 28.10
(h) Characteristics of defined benefit plans and associated risks:
1. Gratuity plan:
The Company operates gratuity plan through a trust wherein every employee is entitled to the benefit equivalent
to fifteen days last salary drawn for each completed year of service. The same is payable on termination of service
or retirement whichever is earlier. The benefit vests after five years of continuous service. The Company’s scheme is
more favourable as compared to the obligation under Payment of Gratuity Act, 1972. The defined benefit plan for
gratuity of the Company is administered by separate gratuity funds that are legally separate from the Company. The
trustees nominated by the Company are responsible for the administration of the plan. There are no minimum funding
requirements of these plans. The funding of these plans are based on gratuity funds actuarial measurement framework
set out in the funding policies of the plan. These actuarial measurements are similar compared to the assumptions set
out in (g) supra. A small part of the gratuity plan, which is not material, is unfunded and managed by the Company.
Employees do not contribute to any of these plans.
2. Post-retirement medical care plan:
The Post-retirement medical care plan provides for reimbursement of health care costs to certain categories of employees
post their retirement. The reimbursement is subject to an overall ceiling sanctioned based on cadre of the employee at
the time of retirement. The plan is unfunded. Employees do not contribute to the plan.
3. Company’s pension plan:
In addition to contribution to state-managed pension plan (EPS scheme), the Company operates a post retirement
pension scheme, which is discretionary in nature for certain cadres of employees. The quantum of pension depends on
the cadre of the employee at the time of retirement. The plan is unfunded. Employees do not contribute to the plan.
Notes forming part of the Financial Statements (contd.)
NOTE [50]
Disclosure pursuant to Ind AS 19 “Employee Benefits” (contd.)

313
4. Trust managed provident fund plan:
The Company manages provident fund plan through a provident fund trust for its employees which is permitted
under the Provident Fund and Miscellaneous Provisions Act, 1952. The plan mandates contribution by employer at a
fixed percentage of employee’s salary. Employees also contribute to the plan at a fixed percentage of their salary as
a minimum contribution and additional sums at their discretion. The plan guarantees interest at the rate notified by
Employees’ Provident Fund Organisation. The contribution by employer and employee together with interest are payable
at the time of separation from service or retirement whichever is earlier. The benefit under this plan vests immediately on
rendering of service.
The interest payment obligation of trust-managed provident fund is assumed to be adequately covered by the interest
income on long term investments of the fund. Any shortfall in the interest income over the interest obligation is
recognised immediately in the Statement of Profit and Loss as actuarial loss. Any loss/gain arising out of the investment
risk and actuarial risk associated with the plan is also recognised as expense or income in the period in which such loss/
gain occurs.
All the above defined benefit plans expose the Company to general Actuarial risks such as Interest rate risk and market
(investment) risk.
NOTE [51]
Disclosure of related parties/related party transactions pursuant to Ind AS 24 “ Related Party Disclosures”.
(a) List of related parties over which control exist and status of transactions entered during the year:
Sr. no.
Name of the related party Nature of relationship Transaction entered during the year
(Yes/No)
1 L&T Cutting Tools Limited Wholly owned subsidiary Yes
2 Bhilai Power Supply Company Limited Subsidiary Yes
3 Spectrum Infotech Private Limited Wholly owned subsidiary Yes
4 L&T-Valdel Engineering Limited %% Wholly owned subsidiary of L&T Hydrocarbon Engineering Limited
Yes
5 L&T Shipbuilding Limited Subsidiary Yes
6 L&T Electricals and Automation Limited Wholly owned subsidiary Yes
7 Hi-Tech Rock Products & Aggregates Limited Wholly owned subsidiary Yes
8 L&T Seawoods Limited Wholly owned subsidiary Yes
9 Kesun Iron and Steel Company Private Limited Subsidiary Yes
10 L&T Infocity Limited** Subsidiary Yes
11 L&T Hitech City Limited** Subsidiary of L&T Infocity Limited Yes
12 Hyderabad International Trade Expositions Limited** Subsidiary of L&T Infocity Limited Yes
13 EWAC Alloys Limited Wholly owned subsidiary Yes
14 L&T Geostructure LLP Subsidiary Yes
15 L&T Valves Limited Wholly owned subsidiary Yes
16 L&T Realty Limited Wholly owned subsidiary Yes
17 L&T Asian Realty Project LLP Subsidiary of L&T Realty Limited Yes
18 L&T Parel Project LLP Subsidiary of L&T Realty Limited Yes
19 Chennai Vision Developers Private Limited Wholly owned subsidiary of L&T Realty Limited Yes
20 L&T South City Projects Limited % Subsidiary of L&T Realty Limited Yes
21 L&T Vision Ventures Limited Subsidiary of L&T Realty Limited Yes
22 L&T Power Limited Subsidiary Yes
23 CSJ Infrastructure Private Limited* Wholly owned subsidiary of L&T Realty Limited Yes
24 L&T Cassidian Limited Subsidiary Yes
25 Consumer Financial Services Limited %%% Wholly owned subsidiary of L&T Housing Finance Limited Yes
26 L&T General Insurance Company Limited*** Wholly owned subsidiary Yes
27 L&T Aviation Services Private Limited Wholly owned subsidiary Yes
28 Larsen & Toubro Infotech Limited Subsidiary Yes
Notes forming part of the Financial Statements (contd.)
NOTE [50]
Disclosure pursuant to Ind AS 19 “Employee Benefits” (contd.)

314
Sr. no.
Name of the related party Nature of relationship Transaction entered during the year
(Yes/No)
29 GDA Technologies Limited @@@ Wholly owned subsidiary of Larsen & Toubro Infotech Limited
Yes
30 L&T Finance Holdings Limited Subsidiary Yes
31 L&T Housing Finance Limited Wholly owned subsidiary of L&T Finance Holdings Limited Yes
32 L&T Infra Investment Partners # Subsidiary of L&T Infrastructure Finance Company Limited No
33 L&T Finance Limited (formerly known as Family Credit Limited) Wholly owned subsidiary of L&T Finance Holdings Limited Yes
34 L&T Finance Limited ~ Wholly owned subsidiary Yes
35 L&T Capital Markets Limited Wholly owned subsidiary Yes
36 L&T Investment Management Limited Wholly owned subsidiary of L&T Finance Holdings Limited Yes
37 L&T Mutual Fund Trustee Limited Wholly owned subsidiary of L&T Finance Holdings Limited No
38 L&T FinCorp Limited ~ Wholly owned subsidiary of L&T Finance Holdings Limited Yes
39 L&T Infrastructure Finance Company Limited Wholly owned subsidiary of L&T Finance Holdings Limited Yes
40 L&T Infra Debt Fund Limited Wholly owned subsidiary of L&T Finance Holdings Limited Yes
41 L&T Infra Investment Partners Advisory Private Limited Wholly owned subsidiary of L&T Infrastructure Finance Company Limited
Yes
42 L&T Infra Investment Partners Trustee Private Limited Wholly owned subsidiary of L&T Infrastructure Finance Company Limited
No
43 L&T Financial Consultants Limited (formerly known as L&T Vrindavan Properties Limited)
Wholly owned subsidiary of L&T Finance Holdings Limited Yes
44 L&T Access Distribution Services Limited Wholly owned subsidiary of L&T Finance Holdings Limited Yes
45 Mudit Cement Private Limited Wholly owned subsidiary of L&T Financial Consultants Limited (formerly known as L&T Vrindavan Properties Limited)
Yes
46 L&T Capital Company Limited Wholly owned subsidiary Yes
47 L&T Trustee Company Private Limited Wholly owned subsidiary of L&T Capital Company Limited Yes
48 L&T Power Development Limited Wholly owned subsidiary Yes
49 L&T Uttaranchal Hydropower Limited Wholly owned subsidiary of L&T Power Development Limited
Yes
50 L&T Arunachal Hydropower Limited Wholly owned subsidiary of L&T Power Development Limited
Yes
51 L&T Himachal Hydropower Limited Wholly owned subsidiary of L&T Power Development Limited
Yes
52 Nabha Power Limited Wholly owned subsidiary of L&T Power Development Limited
Yes
53 L&T Metro Rail (Hyderabad) Limited Wholly owned subsidiary Yes
54 L&T Technology Services Limited Subsidiary Yes
55 L&T Construction Equipment Limited Wholly owned subsidiary Yes
56 L&T Infrastructure Engineering Limited Wholly owned subsidiary Yes
57 L&T Thales Technology Services Private Limited Subsidiary of L&T Technology Services Limited Yes
58 L&T Hydrocarbon Engineering Limited Wholly owned subsidiary Yes
59 Sahibganj Ganges Bridge-Company Private Limited^ Wholly owned subsidiary of L&T Capital Limited Yes
60 Seawoods Retail Private Limited^^ Wholly owned subsidiary Yes
61 Seawoods Realty Private Limited^^^ Wholly owned subsidiary Yes
62 Marine Infrastructure Developer Private Limited Subsidiary Yes
63 AugmentIQ Data Sciences Private Limited ## Subsidiary of L&T Infotech Limited No
Notes forming part of the Financial Statements (contd.)
NOTE [51]
(a) List of related parties over which control exist and status of transactions entered during the year (contd.)

315
Sr. no.
Name of the related party Nature of relationship Transaction entered during the year
(Yes/No)
64 L&T Infra Contractors Private Limited ### Wholly owned subsidiary of L&T Capital Limited No
65 Larsen & Toubro LLC Subsidiary No
66 Larsen & Toubro Infotech, GmbH Wholly owned subsidiary of Larsen & Toubro Infotech Limited
Yes
67 Larsen & Toubro Infotech Canada Limited Wholly owned subsidiary of Larsen & Toubro Infotech Limited
No
68 Larsen & Toubro Infotech LLC Wholly owned subsidiary of Larsen & Toubro Infotech Limited
No
69 L&T Infotech Financial Services Technologies Inc. Wholly owned subsidiary of Larsen & Toubro Infotech Limited
No
70 Larsen & Toubro Infotech South Africa (PTY) Limited Subsidiary of Larsen & Toubro Infotech Limited No
71 L&T Information Technology Services (Shanghai) Co. Ltd. Subsidiary No
72 L&T Realty FZE Wholly owned subsidiary of L&T Realty Limited No
73 Larsen & Toubro International FZE Wholly owned subsidiary of L&T Global Holdings Limited Yes
74 Larsen & Toubro Hydrocarbon International Limited LLC Subsidiary No
75 Thalest Limited Wholly owned subsidiary of Larsen & Toubro International FZE
No
76 Servowatch Systems Limited Wholly owned subsidiary of Thalest Limited Yes
77 Larsen & Toubro (Oman) LLC Subsidiary of Larsen & Toubro International FZE Yes
78 L&T Modular Fabrication Yard LLC Subsidiary of Larsen & Toubro International FZE Yes
79 Larsen & Toubro (East Asia) SDN. BHD Subsidiary Yes
80 Larsen & Toubro Qatar LLC Subsidiary of Larsen & Toubro International FZE Yes
81 L&T Overseas Projects Nigeria Limited Wholly owned subsidiary of Larsen & Toubro International FZE
No
82 PT Larsen & Toubro Hydrocarbon Engineering Indonesia Subsidiary of Larsen & Toubro International FZE No
83 L&T Electricals & Automation Saudi Arabia Company Limited LLC
Subsidiary of Larsen & Toubro International FZE Yes
84 Larsen & Toubro Kuwait Construction General Contracting Company WLL
Subsidiary of Larsen & Toubro International FZE Yes
85 Larsen & Toubro Readymix & Asphalt Concrete Industries LLC
Subsidiary of Larsen & Toubro International FZE Yes
86 Larsen & Toubro (Saudi Arabia) LLC Subsidiary Yes
87 Larsen Toubro Arabia LLC Subsidiary Yes
88 Larsen & Toubro ATCO Saudia LLC Subsidiary of Larsen & Toubro International FZE Yes
89 Tamco Switchgear (Malaysia) SDN. BHD Wholly owned subsidiary of Larsen & Toubro International FZE
Yes
90 Henikwon Corporation SDN. BHD Wholly owned subsidiary of Tamco Switchgear (Malaysia) SDN. BHD
Yes
91 Larsen & Toubro Consultoria E Projeto Ltda @ Subsidiary of Larsen & Toubro International FZE No
92 Larsen & Toubro (Qingdao) Rubber Machinery Company Limited @@
Wholly owned subsidiary of Larsen & Toubro International FZE
Yes
93 Tamco Electrical Industries Australia Pty Ltd. Wholly owned subsidiary of Larsen & Toubro International FZE
No
94 PT Tamco Indonesia Subsidiary of Larsen & Toubro International FZE Yes
95 Larsen & Toubro Heavy Engineering LLC Subsidiary of Larsen & Toubro International FZE Yes
Notes forming part of the Financial Statements (contd.)
NOTE [51]
(a) List of related parties over which control exist and status of transactions entered during the year (contd.)

316
Sr. no.
Name of the related party Nature of relationship Transaction entered during the year
(Yes/No)
96 L&T Electrical & Automation FZE Wholly owned subsidiary of Larsen & Toubro International FZE
Yes
97 Kana Controls General Trading & Contracting Company WLL Subsidiary of L&T Electrical & Automation FZE No
98 Larsen & Toubro T&D SA (Proprietary) Limited Subsidiary of Larsen & Toubro International FZE Yes
99 L&T Technology Services LLC Wholly owned subsidiary of L&T Technology Services Limited
Yes
100 L&T Infotech Austria GmbH Wholly owned subsidiary of Larsen & Toubro Infotech Limited
No
101 L&T Global Holdings Limited Wholly owned subsidiary Yes
102 L&T Information Technology Spain SL Wholly owned subsidiary of Larsen & Toubro Infotech Limited
No
103 L&T Natural Resource Limited %%%% Wholly owned subsidiary of L&T Capital Company Limited Yes
104 L&T Solar Limited %%%% Wholly owned subsidiary of L&T Capital Company Limited Yes
105 L&T Powergen Limited %%%% Wholly owned subsidiary of L&T Capital Company Limited Yes
* The Company through its subsidiary has sold its stake on November 16, 2015
** The Company through its subsidiary has sold its stake on March 31, 2016
*** The Company has sold its stake on September 9, 2016
@ The Company is dissolved on November 6, 2015
@@ The Company is dissolved on June 9, 2015
@@@ The Company is merged with Larsen & Toubro Infotech Limited w.e.f. April 1, 2016
~ The Company is merged with Family Credit Limited (subsequently renamed as L&T Finance Limited) w.e.f. April 1, 2016
^ The Company is incorporated on July 14, 2016
^^ The Company is incorporated on September 2, 2016
^^^ The Company is incorporated on October 23, 2016
# The Fund is incorporated on August 22, 2013
## The Company through its subsidiary acquired stake on November 30, 2016
### The Company is incorporated on March 17, 2017
% The Company through its subsidiary has sold its stake on March 20, 2017
%% The Company is merged with L&T Hydrocarbon Engineering Limited w.e.f. April 1, 2016
%%% The Company is merged with L&T Housing Finance Limited w.e.f. April 1, 2015
%%%% Companies merged with L&T Capital Company Limited with effect from April 1, 2015
(b) (i) Names of associates with whom transactions were carried out during the year:
Sr.
no.
Associate companies
1 L&T-Chiyoda Limited
2 Feedback Infra Private Limited
3 Salzer Electronics Limited*
4 JSK Electricals Private Limited #
5 Magtorq Private Limited
* The Company has sold its stake in July and August, 2015
# The Company has sold its stake on March 29, 2016
Notes forming part of the Financial Statements (contd.)
NOTE [51]
(a) List of related parties over which control exist and status of transactions entered during the year (contd.)

317
(ii) Names of joint ventures with whom transactions were carried out during the year:
Sr.
no.
Joint ventures Sr.
no.
Joint ventures
1. Larsen & Toubro Electromech LLC 2. L&T-Sargent & Lundy Limited
3. L&T IDPL Trustee Manager Pte. Ltd. 4. L&T Chennai–Tada Tollway Limited
5. L&T BPP Tollway Limited 6. L&T Rajkot-Vadinar Tollway Limited
7. L&T Deccan Tollways Limited 8. L&T Samakhiali Gandhidham Tollway Limited
9. Kudgi Transmission Limited 10. L&T Sambalpur-Rourkela Tollway limited
11. L&T Infrastructure Development Projects Limited 12. Panipat Elevated Corridor Limited (formerly known
as L&T Panipat Elevated Corridor Limited)
13. Krishnagiri Thopur Toll Road Limited (formerly known
as L&T Krishnagiri Thopur Toll Road Limited)
14. Western Andhra Tollways Limited (formerly known as
L&T Western Andhra Tollways Limited)
15. Vadodara Bharuch Tollway Limited (formerly known as
L&T Vadodara Bharuch Tollway Limited)
16. L&T Transportation Infrastructure Limited
17. L&T Western India Tollbridge Limited 18. L&T Port Kachchigarh Limited
19. Ahmedabad-Maliya Tollway Limited (formerly known
as L&T Ahmedabad-Maliya Tollway Limited)
20. L&T Halol-Shamlaji Tollway Limited
21. L&T Krishnagiri Walajahpet Tollway Limited 22. Devihalli Hassan Tollway Limited (formerly known as
L&T Devihalli Hassan Tollway Limited)
23. L&T Howden Private Limited 24. L&T Sapura Shipping Private Limited
25. L&T Sapura Offshore Private Limited 26. L&T-Gulf Private Limited
27. L&T-MHPS Boilers Private Limited 28. L&T-MHPS Turbine Generators Private Limited
29. Raykal Aluminium Company Private Limited 30. L&T Special Steels and Heavy Forgings Private
Limited
31. PNG Tollway Limited 32. L&T Kobelco Machinery Private Limited
(iii) Name of post-employment benefit plans with whom transactions were carried out during the year:
Sr.
no.
Provident Fund Trust
1. The Larsen & Toubro Officers & Supervisory Staff Provident Fund
2. The Larsen & Toubro Limited Provident Fund of 1952
3. The Larsen & Toubro Limited Provident Fund
4. L&T Kansbahal Officers & Supervisory Provident Fund
5. L&T Kansbahal Staff & Workmen Provident Fund
Sr.
no.
Gratuity Trust
1. Larsen & Toubro Officers & Supervisors Gratuity Fund
2. Larsen & Toubro Gratuity Fund
(iv) Name of key management personnel and their relatives with whom transactions were carried out during the year:
Sr.
no.
Executive Director Sr.
no.
Executive Director
1. Mr. A. M. Naik (Group Executive Chairman) 2. Mr. K. Venkataramanan (CEO & Managing Director) *
Mrs. Jyothi Venkataramanan (wife)
3. Mr. M. V. Kotwal (Whole-time Director)** 4. Mr. S. N. Subrahmanyan (Whole-time Director)
5. Mr. R. Shankar Raman (CFO & Whole-time Director) 6. Mr. Shailendra Roy (Whole-time Director)
7. Mr. D. K. Sen (Whole-time Director) # 8. Mr. M. V. Satish (Whole-time Director) ##
Notes forming part of the Financial Statements (contd.)
NOTE [51] (contd.)

318
Notes forming part of the Financial Statements (contd.)
Sr.
no.
Independent/Non-executive Director Sr.
no.
Independent/Non-executive Director
1. Mr. Subodh Bhargava 2. Mr. Vikram Singh Mehta
3. Mr. Sushobhan Sarker 4. Mr. M. M. Chitale
5. Mr. M. Damodaran 6. Mr. Thomas Mathew T. ###
7. Ms. Naina Lal Kidwai $$$ 8. Mr. Akhilesh Krishna Gupta
9. Ms. Sunita Sharma *** 10. Mr. Bahram Vakil @@@
11. Mr. Ajay Shankar $ 12. Mr. Subramanian Sarma $$
13. Mr. Sanjeev Aga @ 14. Mr. Narayanan Kumar @@
15. Mr. Adil Zainulbhai 16. Mr. Swapan Dasgupta ~
*Retired on September 30, 2015 **Retired on August 26, 2015
# Appointed w.e.f. October 1, 2015 ## Appointed w.e.f. January 29, 2016
*** Appointed w.e.f. April 1, 2015 ### Appointed w.e.f. April 3, 2015
$ Appointed w.e.f. May 30, 2015 $$ Appointed w.e.f. August 19, 2015
$$$ Appointed w.e.f. March 1, 2016 @ Appointed w.e.f. May 25, 2016
@@ Appointed w.e.f. May 27, 2016 @@@ Separated w.e.f. August 1, 2016
~ Appointed w.e.f. April 1, 2015 and Separated w.e.f. May 15, 2016
(c) Disclosure of related party transactions:
v crore
Sr. no.
Nature of transaction/relationship/major parties
2016-17 2015-16
Amount Amounts for major parties
Amount Amounts for major parties
i. Purchase of goods & services (including commission paid)
Subsidiaries, including: 1121.13 850.31
L&T Shipbuilding Limited 428.06 249.71
Hi-Tech Rock Products and Aggregates Limited 169.61 142.12
L&T Geostructure LLP 172.14
Larsen & Toubro Readymix and Asphalt Concrete Industries LLC 96.07
Joint ventures, including: 2323.92 1910.69
L&T-MHPS Boilers Private Limited 1675.16 1256.68
L&T-MHPS Turbine Generators Private Limited 530.79 536.02
Associates, including: 7.01 74.54
JSK Electricals Private Limited – 27.99
Salzer Electronics Limited – 37.33
Feedback Infra Private Limited 2.58
L&T-Chiyoda Limited 1.10
Magtorq Private Limited 3.33
Total 3452.06 2835.54
NOTE [51]
(iii) Name of key management personnel and their relatives with whom transactions were carried out during the year (contd.)

319
v crore
Sr. no.
Nature of transaction/relationship/major parties
2016-17 2015-16
Amount Amounts for major parties
Amount Amounts for major parties
ii. Sale of goods/contract revenue & services
Subsidiaries, including: 2359.81 3452.08
L&T Metro Rail (Hyderabad) Limited 1231.51 1395.17
Larsen and Toubro (Saudi Arabia) LLC 623.78
L&T Seawoods Limited 281.62 477.52
L&T Parel Project LLP 380.75
Nabha Power Limited 364.41
Joint ventures, including: 1070.75 1314.49
L&T Infrastructure Development Projects Limited 544.27 653.99
L&T Deccan Tollways Limited 394.35 533.50
L&T-MHPS Boilers Private Limited 124.02
Associate: 0.14 –
L&T-Chiyoda Limited 0.14 –
Total 3430.70 4766.57
iii. Purchase/lease of property, plant and equipment
Subsidiaries, including: 26.45 15.45
Larsen and Toubro Infotech Limited 12.49
L&T Construction Equipment Limited 9.38
L&T Hydrocarbon Engineering Limited 11.42
Joint venture: 0.02 0.04
L&T Infrastructure Development Projects Limited 0.02 0.04
Total 26.47 15.49
iv. Sale of property, plant and equipment
Subsidiaries, including: 58.68 1.51
Larsen and Toubro (Oman) LLC 1.07
L&T Electrical and Automation FZE – 0.16
L&T Valves Limited 45.01
L&T Shipbuilding Limited 6.56 –
Joint ventures: – 0.50
L&T-MHPS Turbine Generators Private Limited – 0.26
L&T Special Steels and Heavy Forgings Private Limited – 0.19
L&T Howden Private Limited – 0.05
Key management personnel: – 9.29
Mr. K Venkataramanan* – 8.85
Mr. M. V. Kotwal** – 0.44
Total 58.68 11.30
v. Sale of Receivables
Subsidiary: 297.01 44.83
L&T Finance Limited 297.01 44.83
Total 297.01 44.83
Notes forming part of the Financial Statements (contd.)
NOTE [51]
(c) Disclosure of related party transactions: (contd.)

320
Notes forming part of the Financial Statements (contd.)
v crore
Sr. no.
Nature of transaction/relationship/major parties
2016-17 2015-16
Amount Amounts for major parties
Amount Amounts for major parties
vi. Investments including subscription to equity and preference shares (including application money paid)
Subsidiaries, including: 1262.84# 3073.00
L&T Power Development Limited 383.40
L&T Technology Services Limited 750.00 –
L&T Shipbuilding Limited 276.24 943.84
L&T Realty Limited – 648.30
L&T Uttaranchal Hydropower Ltd 604.75
Joint ventures: (0.25) 1.09
L&T-MHPS Boilers Private Limited (0.03) –
L&T-MHPS Turbine Generators Private Limited (0.22) 1.09
Total 1262.59 3074.09
vii. Purchase of investments from
Subsidiaries, including: 388.00 4234.01
L&T Capital Company Limited – 4233.64
L&T Shipbuilding Limited 388.00## –
Joint venture: 2041.57 –
L&T Infrastructure Development Projects Limited 2041.57 –
Total 2429.57 4234.01
viii. Sale of investments to
Subsidiaries, including: 11.08 5520.73
L&T Capital Company Limited – 4232.03
L&T Global Holdings Limited – 1147.40
L&T Hydrocarbon Engineering Limited 11.08
Joint venture: – 21.54
L&T Infrastructure Development Projects Limited – 21.54
Total 11.08 5542.27
ix. Capital Reduction by
Subsidiary: – 21.95
L&T Capital Company Limited – 21.95
Total – 21.95
x. Charges paid for miscellaneous services
Subsidiaries, including: 139.13 145.26
Larsen & Toubro Infotech Limited 101.42 84.93
L&T Aviation Services Private Limited 23.74 23.91
L&T Technology Services Limited 16.49
Joint ventures, including: 3.64 7.23
L&T-Sargent & Lundy Limited 3.62 7.07
Associates, including: 0.19 0.59
Feedback Infra Private Limited 0.17 –
L&T-Chiyoda Limited 0.59
Total 142.96 153.08
NOTE [51]
(c) Disclosure of related party transactions: (contd.)

321
v crore
Sr. no.
Nature of transaction/relationship/major parties
2016-17 2015-16
Amount Amounts for major parties
Amount Amounts for major parties
xi. Rent paid, including lease rentals under leasing/hire purchase arrangements
Subsidiaries, including: 1.37 1.66
L&T Electrical & Automation FZE 0.79 0.86
L&T Infocity Limited – 0.37
PT Tamco Indonesia 0.31 0.23
Joint venture: – 0.01
L&T Infrastructure Development Projects Limited – 0.01
Key management personnel: – 0.01
Mr. K. Venkataramanan* and Mrs. Jyothi Venkataramanan – 0.01
Total 1.37 1.68
xii.(a) Charges incurred for deputation of employees from related parties
Subsidiaries, including: 12.65 13.70
L&T Hydrocarbon Engineering Limited 2.18
L&T Electricals and Automation Saudi Arabia Company Limited LLC 1.38 2.18
L&T Electrical and Automation FZE 6.16 4.43
Larsen and Toubro Infotech Limited 2.59
PT Tamco Indonesia 1.55
Total 12.65 13.70
xii.(b) Charges recovered for deputation of employees to related parties
Subsidiaries, including: 84.47 77.04
L&T Parel Project LLP 22.39 25.35
L&T Electrical and Automation FZE 8.54
L&T Construction Equipment Limited 8.96
Joint ventures, including: 3.99 2.46
L&T-MHPS Boilers Private Limited 0.64 0.58
L&T Special Steels and Heavy Forgings Private Limited 1.21 1.87
L&T Infrastructure Development Projects Limited 2.14 –
Associate: 18.01 18.72
L&T-Chiyoda Limited 18.01 18.72
Total 106.47 98.22
xiii. Dividend received
Subsidiaries, including: 405.47 994.16
Larsen & Toubro Infotech Limited 149.48 526.48
L&T Technology Services Limited 99.05 302.00
L&T Finance Holdings Limited 93.58 100.39
Joint venture: – 13.75
L&T-Sargent & Lundy Limited – 13.75
Associate: 0.38
Salzer Electronics Limited 0.38
Total 405.47 1008.29
Notes forming part of the Financial Statements (contd.)
NOTE [51]
(c) Disclosure of related party transactions: (contd.)

322
Notes forming part of the Financial Statements (contd.)
v crore
Sr. no.
Nature of transaction/relationship/major parties
2016-17 2015-16
Amount Amounts for major parties
Amount Amounts for major parties
xiv. Commission received, including those under agency arrangements
Subsidiary: 5.82 4.84
L&T Construction Equipment Limited 5.82 4.84
Joint venture: 0.65 2.64
L&T Kobelco Machinery Private Limited 0.65 2.64
Total 6.47 7.48
xv. Rent received, overheads recovered and miscellaneous income
Subsidiaries, including: 423.18 538.26
Larsen & Toubro Infotech Limited 67.78 77.23
L&T Technology Services Limited 49.04 69.89
L&T Hydrocarbon Engineering Limited 90.99 96.83
L&T Geostructure LLP 77.44
L&T Capital Company Limited 72.65
Joint ventures, including: 90.00 81.48
L&T-MHPS Boilers Private Limited 35.50 23.42
L&T-Sargent & Lundy Limited 17.70 17.64
L&T-MHPS Turbine Generators Private Limited 9.64 10.31
L&T Special Steels and Heavy Forgings Private Limited 10.00
Associate: 2.77 1.06
L&T-Chiyoda Limited 2.77 1.06
Key management personnel: 0.07 –
Mr. D. K. Sen$ 0.07 –
Total 516.02 620.80
xvi. Guarantee charges recovered from
Subsidiaries, including: 30.98 22.58
Nabha Power Limited 9.45 9.90
L&T Shipbuilding Limited 3.45
L&T Hydrocarbon Engineering Limited 6.40 6.02
Larsen & Toubro (Saudi Arabia) LLC 4.64
Larsen Toubro Arabia LLC 5.53 –
Total 30.98 22.58
xvii. Interest received from
Subsidiaries, including: 248.30 212.60
L&T Realty Limited 69.94
L&T Shipbuilding Limited 71.21 90.62
Nabha Power Limited 62.41 31.50
Marine Infrastructure Developer Private Limited 69.64 –
Joint ventures, including: 79.54 57.86
L&T Special Steels and Heavy Forgings Private Limited 78.98 52.58
Total 327.84 270.46
NOTE [51]
(c) Disclosure of related party transactions: (contd.)

323
v crore
Sr. no.
Nature of transaction/relationship/major parties
2016-17 2015-16
Amount Amounts for major parties
Amount Amounts for major parties
xviii. Interest paid to
Subsidiaries, including: 45.38 13.88
L&T Hydrocarbon Engineering Limited 40.04 6.31
Nabha Power Limited 4.70
L&T Construction Equipment Limited – 1.98
Joint venture: – 3.89
L&T Infrastructure Development Projects Limited – 3.89
Total 45.38 17.77
xix. Contribution to post-employment benefit plan
(a) Transaction with trust managed provident fund
(i) Towards Employer’s contribution: 59.68 60.26
The Larsen & Toubro Officers & Supervisory Staff Provident Fund 51.52 52.05
The Larsen & Toubro Limited Provident Fund of 1952 6.64 6.65
Total 59.68 60.26
(ii) Towards advance contribution: – 0.43
The Larsen & Toubro Limited Provident Fund – 0.43
Total – 0.43
(iii) Subscription or purchase by the fund of the debt securities issued by the company:
– 25.00
The Larsen & Toubro Officers & Supervisory Staff Provident Fund – 25.00
Total – 25.00
(b) Transaction with approved gratuity fund
(i) Towards Employer’s contribution: 29.85 59.73
Larsen & Toubro Officers & Supervisors Gratuity Fund 23.59 47.73
Larsen & Toubro Gratuity Fund 6.26 12.00
Total 29.85 59.73
(ii) Towards advance contribution: – 60.00
Larsen & Toubro Officers & Supervisors Gratuity Fund – 48.15
Larsen & Toubro Gratuity Fund – 11.85
Total – 60.00
“Major parties” denote entities account for 10% or more of the aggregate for that category of transaction during respective period.
# The scheme of arrangement between L&T Valves Limited and L&T Electrical & Automation Limited was approved by National Company Law Tribunal
on April 27, 2017 with appointed date as November 1, 2016. Pursuant to the scheme L&T Electrical & Automation Limited issued 73,88,796 shares to
Larsen & Toubro Limited as a consideration towards transfer of certain assets by L&T Valves Limited. The value of shares issued is derived based on fair
value of assets transferred to the total value of assets of L&T Valves Limited as at appointed date. Accordingly the value of investment in L&T Electrical
and Automation Limited was increased by v 40.31 crore and reduced in L&T Valves Limited by v 40.31 crore during the year 2016-17.
## Pursuant to the scheme of demerger approved by National Company Law Tribunal (NCLT), the existing share capital of Marine Infrastructure Developer
Limited held by L&T Shipbuilding Limited stands cancelled. The Company has now acquired 38,80,00,000 equity shares of Marine Infrastructure
Developer limited for a consideration of v 388 crore from L&T Shipbuilding Limited. The acquisition has been completed on March 31, 2017. Further,
38,80,00,000 equity shares of L&T Shipbuilding Limited held by the Company have been extinguished and 38,80,00,000 9% non-cumulative, optionally
convertible and redeemable preference shares of v 10 each have been issued to the Company in lieu of the same on March 29, 2017.
Notes forming part of the Financial Statements (contd.)
NOTE [51]
(c) Disclosure of related party transactions: (contd.)

324
Notes forming part of the Financial Statements (contd.)
xx. Compensation paid to key management personnel:
v crore
Key Management Personnel
2016-17 2015-16
Short term
employee
benefits
Post-
employment
benefits
Other
long term
benefits
Total
short term
employee
benefits
post-
employment
benefits
Other
long term
benefits
share-based
paymentsTotal
Mr. A. M. Naik 21.86 5.83 32.21 *** 59.90 21.57 5.76 – – 27.33Mr. K. Venkataramanan* – – – – 4.74 22.43 13.53 – 40.70Mr. M. V. Kotwal** – – – – 3.35 15.35 7.89 – 26.59Mr. S. N. Subrahmanyan 13.26 3.51 – 16.77 11.53 3.06 – – 14.59Mr. R. Shankar Raman 9.00 2.38 – 11.38 8.28 2.19 – – 10.47Mr. Shailendra Roy 8.13 1.93 – 10.06 6.43 1.47 – – 7.90
Mr. D. K. Sen $ 6.20 1.57 – 7.77 2.60 0.69 – – 3.29Mr. M. V. Satish $$ 5.96 1.44 – 7.40 0.93 0.24 – – 1.17Mr. Subramanian Sarma(Non-executive director) – – – – – – – 10.35^ 10.35Other non-executive directors 4.37 – – 4.37 4.06 – – – 4.06Total 68.78 16.66 32.21 117.65 63.49 51.19 21.42 10.35 146.45
* Retired on September 30, 2015 ** Retired on August 26, 2015 *** Represents encashment of past service accumulated leave
$ Appointed w.e.f. October 1, 2015 $$ Appointed w.e.f. January 29, 2016
^ Represents fair value of employee stock options granted during 2015-16 to be vested over a period of time. The fair value of the stock options is
being recovered from L&T Hydrocarbon Engineering Limited over the period of vesting.
(d) Amount due to/from related parties:
v crore
Sr. no.
Nature of transaction/relationship/major parties
As at 31-3-2017 As at 31-3-2016 As at 1-4-2015
Amount Amounts for major
parties
Amount Amounts for major
parties
Amount Amounts for major
parties
i. Accounts receivable Subsidiaries, including: 535.22 926.92 1007.57 L&T Metro Rail (Hyderabad) Limited 212.29 297.99 115.04
Larsen and Toubro (Saudi Arabia) LLC 202.25 253.41 Nabha Power Limited 256.39
Joint ventures, including: 396.97 535.68 435.67 L&T-MHPS Boilers Private Limited 65.55 102.69 77.32
L&T Infrastructure Development Projects Limited 78.42 129.61 111.56L&T Samakhiali Gandhidham Tollway Limited 43.30 58.20 89.13L&T Deccan Tollways Limited 125.63 139.21 90.97L&T Krishnagiri Walajahpet Tollway Limited 44.68 – –
Total 932.19 1462.60 1443.24
ii. Accounts payables, including other payables
Subsidiaries, including: 635.25 601.89 379.38
Larsen and Toubro Infotech Limited 77.60
Hi-Tech Rock Products and Aggregates Limited 103.27
Larsen and Toubro (Oman) LLC 118.89 94.99 97.38
L&T Geostructure LLP 108.78
Tamco Switchgear (Malaysia) SDN BHD 75.54
Joint ventures, including: 1843.77 1676.32 1414.86
L&T-MHPS Boilers Private Limited 1171.07 1042.25 830.70
L&T-MHPS Turbine Generators Private Limited 605.53 555.34 547.20
Assosiates, including: 1.99 5.35 22.81
Feedback Infra Private Limited 1.27 0.98
Magtorq Private Limited 0.57 3.18
L&T-Chiyoda Limited 1.19
Salzer Electronics Limited – – 18.54
Total 2481.01 2283.56 1817.05
NOTE [51] (contd.)

325
v crore
Sr. no.
Nature of transaction/relationship/major parties
As at 31-3-2017 As at 31-3-2016 As at 1-4-2015
Amount Amounts for major
parties
Amount Amounts for major
parties
Amount Amounts for major
parties
iii. Investments in debt securities
Subsidiaries, including: 627.85 464.43 68.64
L&T Shipbuilding Limited 605.10 441.95 45.65
L&T Finance Limited 23.00
Total 627.85 464.43 68.64
iv. Loans and advances recoverable
Subsidiaries, including: 3197.90 4738.83 1357.61
L&T Shipbuilding Limited 932.58 2275.52 412.50
L&T Hydrocarbon Engineering Limited 582.43 199.32
Nabha Power Limited 1587.64 918.16
L&T Realty Limited 710.90
Joint ventures, including: 1667.61 1631.55 1682.91
L&T Special Steels and Heavy Forgings Private Limited 1184.98 877.59 564.15
L&T-MHPS Boilers Private Limited 215.18 431.85 606.23
L&T-MHPS Turbine Generators Private Limited 210.22 282.66 421.59
Associates, including: 4.36 5.83 3.16
L&T-Chiyoda Limited 3.96 5.83 3.16
Key management personnel: – – 0.01
Mr. K Venkataramanan* and Mrs Jyothi Venkataramanan – – 0.01
Total 4869.87 6376.21 3043.69
v. Advances against equity contribution
Subsidiaries, including: 6.35 5.25 1986.84
L&T Uttaranchal Hydropower Limited – 5.25 523.00
L&T Power Development Limited – – 379.40
L&T Realty Limited – – 648.29
L&T Shipbuilding Limited – – 421.86
L&T Metro Rail (Hyderabad) Limited 6.35 – –
Total 6.35 5.25 1986.84
vi. Unsecured loans (including lease finance)
Subsidiaries: 5.52 9.25 57.25
L&T Hydrocarbon Engineering Ltd 5.52 – –
L&T Cutting Tools Limited – 9.25 12.25
L&T Construction Equipment Limited – – 45.00
Total 5.52 9.25 57.25
Notes forming part of the Financial Statements (contd.)
NOTE [51]
(d) Amount due to/from related parties: (contd.)

326
Notes forming part of the Financial Statements (contd.)
v crore
Sr. no.
Nature of transaction/relationship/major parties
As at 31-3-2017 As at 31-3-2016 As at 1-4-2015
Amount Amounts for major
parties
Amount Amounts for major
parties
Amount Amounts for major
parties
vii. Advances received in the capacity of supplier of goods/services classified as “advances from customers” in the Balance Sheet
Subsidiaries, including: 90.12 147.48 357.26 L&T Metro Rail (Hyderabad) Limited 73.15 129.40 223.24
L&T Seawoods Limited 82.95 Joint ventures, including: 23.21 119.26 228.85
L&T Infrastructure Development Projects Limited 68.84 122.24L&T Deccan Tollways Limited 36.97 96.03L&T-MHPS Boilers Private Limited 21.54 13.46
Total 113.33 266.74 586.11
viii. Due to whole-time directors #: (Key management personnel) 55.58 51.30 53.83 Mr. A. M. Naik 18.24 17.96 18.19 Mr. K. Venkataramanan* – 3.77 7.39 Mr. S. N. Subrahmanyan 11.29 9.90 8.73 Mr. R. Shankar Raman 7.41 6.90 6.91
Mr. Shailendra Roy 5.84 4.40 4.48 Mr. M. V. Kotwal** – 2.04 4.91 Mr. D. K. Sen 4.93 2.13 – Mr. M. V. Satish 4.32 0.73 –
Total 55.58 51.30 53.83
ix.(a) Capital commitments given Subsidiaries, including: 8.93 1.51 1.77
L&T Construction Equipment Limited 5.30 1.51 0.24 Larsen and Toubro (Oman) LLC – – 1.31 L&T Technology Services Limited 1.60 – – L&T Hydrocarbon Engineering Limited 1.99 – –
Total 8.93 1.51 1.77
ix.(b) Revenue commitments given Subsidiaries, including: 1660.62 1775.11 324.79
Henikwon Corporation SDN. BHD 35.81L&T Shipbuilding Limited 1260.35 1655.69 209.32Larsen & Toubro Readymix and Asphalt Concrete
Industries LLC – 42.50L&T Geostructure LLP 290.20 –
Joint ventures, including: 3386.85 3385.37 517.08L&T-MHPS Boilers Private Limited 2232.20 2254.94 300.05L&T-MHPS Turbine Generators Private Limited 1086.15 1066.91 177.16
Associates, including: 3.89 3.53 5.82Feedback Infra Private Limited 0.80 1.59L&T-Chiyoda Limited 0.96 1.29 0.78Magtorq Private Limited 2.13 0.65JSK Electricals Private Limited – – 3.10Salzer Electronics Limited – – 1.67
Total 5051.36 5164.01 847.69
NOTE [51]
(d) Amount due to/from related parties: (contd.)

327
v crore
Sr. no.
Nature of transaction/relationship/major parties
As at 31-3-2017 As at 31-3-2016 As at 1-4-2015
Amount Amounts for major
parties
Amount Amounts for major
parties
Amount Amounts for major
parties
x. Commitment to Fund
Subsidiaries, including: 1063.20 876.00 1294.59
L&T Seawoods Limited – 413.00 734.40
L&T Uttaranchal Hydropower Limited 442.75 459.00 546.00
L&T Metro Rail (Hyderabad) Limited 620.45
Joint venture: – 405.00 1443.41
L&T Infrastructure Development Projects Limited – 405.00 1443.41
Total 1063.20 1281.00 2738.00
xi. Revenue commitments received
Subsidiaries, including: 2261.68 3550.18 5651.12
L&T Metro Rail (Hyderabad) Limited 1396.43 2650.68 3299.75
L&T Parel Project LLP 397.04 665.80
L&T Asian Realty Project LLP 237.62
Larsen and Toubro (Saudi Arabia) LLC 621.93
L&T Seawoods Limited 775.01
Joint ventures, including: 138.67 1000.60 2225.39
L&T Deccan Tollways Limited 25.95 350.30 883.80
L&T Infrastructure Development Projects Limited 60.00 593.65 1236.11
L&T Krishnagiri Walajahpet Tollway Limited 13.65 – –
L&T BPP Tollway Limited 26.27
Total 2400.35 4550.78 7876.51
xii. Capital commitments received
Subsidiary: 0.77 – –
L&T Shipbuilding Ltd 0.77 – –
Total 0.77 – –
“Major parties” denote entities account for 10% or more of the aggregate for that category of transaction during respective
period.
# Includes commission due to non-executive directors v 3.55 crore (As at 31-3-2016: v 3.47 crore; as at 1-4-2015: v 3.22 crore)
* Retired on September 30, 2015
** Retired on August 26, 2015
$ Appointed w.e.f. October 1, 2015
Notes forming part of the Financial Statements (contd.)
NOTE [51]
(d) Amount due to/from related parties: (contd.)

328
Notes forming part of the Financial Statements (contd.)
NOTE [52]
Basic and Diluted Earnings per share [EPS] computed in accordance with Ind AS 33 “Earnings per Share”:
Particulars 2016-17 2015-16
Basic earnings per share
Profit after tax as per accounts (v crore) A 5453.74 4999.58
Weighted average number of equity shares outstanding B 93,23,49,030 93,07,61,648
Basic EPS (v) A/B 58.49 53.71
Diluted earnings per share
Profit after tax as per accounts (v crore) A 5453.74 4999.58
Weighted average number of equity shares outstanding B 93,23,49,030 93,07,61,648
Add: Weighted average number of potential equity shares on account of employee stock
options
C 31,60,400 43,02,265
Weighted average number of equity shares outstanding for diluted EPS D=B+C 93,55,09,430 93,50,63,913
Diluted EPS (v) A/D 58.30 53.47
Face value per share (v) 2 2
The following potential equity shares are anti-dilutive and are therefore excluded from the weighted average number of equity shares
for the purpose of diluted earnings per share:
Particulars 2016-17 2015-16
Weighted average number of potential equity shares on account of conversion of foreign currency convertible bonds 63,46,986 63,46,986
Note: On May 29, 2017, the Board of Directors has recommended for the approval of shareholders, the issue of bonus equity shares in
the ratio of 1:2 (one bonus equity share of v 2 each for every two equity shares of v 2 each held). The effect of the said bonus issue will
be given in the year 2017-18 post approval by shareholders.
NOTE [53]
Disclosure pursuant to Ind AS 27 “Separate Financial Statements”
Investment in following subsidiary companies, joint venture companies and associates is accounted at cost.
Subsidiaries :
As at 31-3-2017 As at 31-3-2016 As at 1-4-2015
Sr. no.
Name of subsidiary company
Principal place of business
Effective proportion
of ownership Interest (%)
Effective proportion of voting power
held (%)
Effective proportion
of ownership Interest (%)
Effective proportion of voting power
held (%)
Effective proportion
of ownership Interest (%)
Effective proportion of voting power
held (%)
Indian subsidiaries
1 L&T Cutting Tools Limited India 100.00 100.00 100.00 100.00 100.00 100.00
2 Bhilai Power Supply Company Limited India 99.90 99.90 99.90 99.90 99.90 99.90
3 Spectrum Infotech Private Limited India 100.00 100.00 100.00 100.00 100.00 100.00
4 L&T-Valdel Engineering Limited %% India – – 100.00 100.00 100.00 100.00
5 L&T Shipbuilding Limited India 97.00 97.00 97.00 97.00 97.00 97.00
6 L&T Electricals and Automation Limited India 100.00 100.00 100.00 100.00 100.00 100.00
7 Hi-Tech Rock Products & Aggregates Limited India 100.00 100.00 100.00 100.00 100.00 100.00
8 L&T Seawoods Limited India 100.00 100.00 100.00 100.00 100.00 100.00
9 Kesun Iron and Steel Company Private Limited India 95.00 95.00 95.00 95.00 95.00 95.00
10 L&T Infocity Limited India – – – – 89.00 89.00
11 EWAC Alloys Limited India 100.00 100.00 100.00 100.00 100.00 100.00
12 L&T Valves Limited India 100.00 100.00 100.00 100.00 100.00 100.00
13 L&T Realty Limited India 100.00 100.00 100.00 100.00 100.00 100.00
14 L&T Power Limited India 99.99 99.99 99.99 99.99 99.99 99.99

329
As at 31-3-2017 As at 31-3-2016 As at 1-4-2015
Sr. no.
Name of subsidiary company
Principal place of business
Effective proportion
of ownership Interest (%)
Effective proportion of voting power
held (%)
Effective proportion
of ownership Interest (%)
Effective proportion of voting power
held (%)
Effective proportion
of ownership Interest (%)
Effective proportion of voting power
held (%)
Indian subsidiaries
15 L&T Cassidian Limited India 74.00 74.00 74.00 74.00 74.00 74.00
16 L&T General Insurance Company Limited* India – – 100.00 100.00 100.00 100.00
17 L&T Aviation Services Private Limited India 100.00 100.00 100.00 100.00 100.00 100.00
18 Larsen & Toubro Infotech Limited India 84.28 84.28 94.96 94.96 100.00 100.00
19 L&T Finance Holdings Limited India 66.62 66.62 66.71 66.71 72.95 72.95
20 L&T Capital Company Limited India 100.00 100.00 100.00 100.00 100.00 100.00
21 L&T Power Development Limited India 100.00 100.00 100.00 100.00 100.00 100.00
22 L&T Metro Rail (Hyderabad) Limited India 100.00 100.00 97.48 97.48 97.48 97.48
23 L&T Technology Services Limited India 89.77 89.77 100.00 100.00 100.00 100.00
24 L&T Construction Equipment Limited India 100.00 100.00 100.00 100.00 100.00 100.00
25 L&T Infrastructure Engineering Limited India 100.00 100.00 100.00 100.00 100.00 100.00
26 L&T Hydrocarbon Engineering Limited India 100.00 100.00 100.00 100.00 100.00 100.00
27 Seawoods Retail Private Limited^^ India 100.00 100.00 – – – –
28 Seawoods Realty Private Limited^^^ India 100.00 100.00 – – – –
29 L&T Natural Resources Limited India – – – – 100.00 100.00
30 L&T Powergen Limited India – – – – 100.00 100.00
31 L&T Solar Limited India – – – – 100.00 100.00
32 Marine Infrastructure Developer Private
Limited
India 97.00 97.00 100.00 100.00 – –
* The Company has sold its stake on September 9, 2016
%% The Company is merged with L&T Hydrocarbon Engineering Limited w.e.f. April 1,2016
^^ The Company is incorporated on September 2, 2016
^^^ The Company is incorporated on October 23, 2016
As at 31-3-2017 As at 31-3-2016 As at 1-4-2015
Sr. no.
Name of subsidiary company Principal place of business
Effective proportion
of ownership Interest (%)
Effective proportion of voting power
held (%)
Effective proportion
of ownership Interest (%)
Effective proportion of voting power
held (%)
Effective proportion
of ownership Interest (%)
Effective proportion of voting power
held (%)
Foreign subsidiaries
1 Larsen & Toubro LLC USA 100.00 100.00 100.00 100.00 100.00 100.00
2 Larsen & Toubro International FZE UAE 100.00 100.00 100.00 100.00 100.00 100.00
3 Larsen & Toubro Hydrocarbon International
Limited LLC
Kindgom of
Saudi Arabia 100.00 100.00 100.00 100.00 100.00 100.00
4 Larsen & Toubro (Saudi Arabia) LLC Kindgom of
Saudi Arabia
100.00 100.00 100.00 100.00 100.00 100.00
5 Larsen Toubro Arabia LLC Kindgom of
Saudi Arabia
75.00 75.00 75.00 75.00 75.00 75.00
6 Larsen & Toubro Consultoria E Projeto Ltda Brazil – – – – 100.00 100.00
7 L&T Global Holdings Limited UAE 100.00 100.00 100.00 100.00 – –
Notes forming part of the Financial Statements (contd.)
NOTE [53] (contd.)

330
Notes forming part of the Financial Statements (contd.)
Associate companies:
As at 31-3-2017 As at 31-3-2016 As at 1-4-2015
Sr. no.
Name of associate company Principal place of business
Effective proportion
of ownership Interest (%)
Effective proportion of voting power
held (%)
Effective proportion
of ownership Interest (%)
Effective proportion of voting power
held (%)
Effective proportion
of ownership Interest (%)
Effective proportion of voting power
held (%)
1 L&T-Chiyoda Limited India 50.00 50.00 50.00 50.00 50.00 50.00
2 Gujarat Leather Industries Limited @ India 50.00 50.00 50.00 50.00 50.00 50.00
3 Salzer Electronics Limited India – – – – 26.06 26.06
4 JSK Electricals Private Limited India – – – – 26.00 26.00
5 Rishi Consfab Private Limited India – – – – 26.00 26.00
6 Magtorq Private Limited India 42.85 42.85 42.85 42.85 42.85 42.85
@ The Company is under liquidation
Joint ventures:
As at 31-3-2017 As at 31-3-2016 As at 1-4-2015
Sr. no.
Name of joint venture Principal place of business
Effective proportion
of ownership interest (%)
Effective proportion of
ownership interest (%)
Effective Proportion of
ownership interest (%)
1 L&T Chennai-Tada Tollway Limited India 97.45 97.45 97.45
2 L&T Rajkot-Vadinar Tollway Limited India 97.45 97.45 97.45
3 L&T Samakhiali Gandhidham Tollway Limited India 97.45 97.45 97.45
4 L&T Infrastructure Development Projects Limited India 97.45 97.45 97.45
5 L&T Transportation Infrastructure Limited India 98.12 98.12 98.12
6 Ahmedabad - Maliya Tollway Limited India 97.45 97.45 97.45
7 L&T Halol-Shamlaji Tollway Limited India 47.75 97.45 97.45
8 L&T Krishnagiri Walajahpet Tollway Limited India 97.45 97.45 97.45
9 Devihalli Hassan Tollway Limited India 97.45 97.45 97.45
10 L&T Howden Private Limited India 50.10 50.10 50.10
11 L&T Sapura Shipping Private Limited India 60.00 60.00 60.00
12 L&T Sapura Offshore Private Limited India 60.00 60.00 60.00
13 L&T-Gulf Private Limited India 50.00 50.00 50.00
14 L&T-MHPS Boilers Private Limited India 51.00 51.00 51.00
15 L&T-MHPS Turbine Generators Private Limited India 51.00 51.00 51.00
16 Raykal Aluminium Company Private Limited India 75.50 75.50 75.50
17 L&T Special Steels and Heavy Forgings Private Limited India 74.00 74.00 74.00
18 PNG Tollway Limited India 72.11 72.11 72.77
19 L&T Kobelco Machinery Private Limited India 51.00 51.00 51.00
20 L&T-Sargent & Lundy Limited India 50.00 50.00 50.00
NOTE [53] (contd.)

331
Notes forming part of the Financial Statements (contd.)
NOTE [54]
Disclosures pursuant to Ind AS 37 “Provisions, Contingent Liabilities and Contingent Assets”
(a) Movement in provisions:
v crore
Sr.
no. Particulars
Class of provisions
Product
warranties
Expected tax
liability in respect
of indirect taxes
Litigation related
obligations
Contractual
rectification cost
- construction
contracts
Total
1. Balance as at 1-4-2016 10.09 132.36 6.94 125.77 275.16
2. Additional provision during the year 12.24 54.75 – 231.67 298.66
3. Provision used/reversed during the year # (1.38) (5.22) – (94.10) (100.70)
4. Additional provision for unwinding of interest and
change in discount rate
0.30 – 0.44 – 0.74
5. Balance as at 31-3-2017 (5=1+2+3+4) 21.25 181.89 7.38 263.34 473.86
# includes provision used during the year v 5.39 crore
(b) Nature of provisions:
i. Product warranties: The Company gives warranties on certain products and services, undertaking to repair or replace the
items that fail to perform satisfactorily during the warranty period. Provision made as at March 31, 2017 represents the
amount of the expected cost of meeting such obligations of rectification/replacement. The timing of the outflows is expected
to be within a period of two to five years from the date of Balance Sheet.
ii. Expected tax liability in respect of indirect taxes represents mainly the differential sales tax liability on account of non-
collection of declaration forms.
iii. Provision for litigation related obligations represents liabilities that are expected to materialise in respect of matters in appeal.
iv. Contractual rectification cost represents the estimated cost the Company is likely to incur during defect liability period as per
the contract obligations in respect of completed construction contracts accounted under Ind AS 11 “Construction Contracts”.
(c) Disclosure in respect of contingent liabilities is given as part of Note 29 to the Balance Sheet.
NOTE [55]
Auditors’ remuneration (excluding service tax):
v crore
Sr.
no.Particulars
2016-17 2015-16
a. For Audit fees 2.45 1.70
b. For Taxation matters 0.48 0.48
c. For Company law matters 0.25 0.25
d. For Other services:
(i) Limited review of standalone and consolidated financial statements on a quarterly basis 1.30 1.30
(ii) Other services including certification work 0.58 0.54
e. For reimbursement of expenses 0.27 0.13
NOTE [56]
Contribution to political parties during the year 2016-17 is v Nil (previous year v Nil).

332
NOTE [57]
The Company has amounts due to suppliers under The Micro, Small and Medium Enterprises Development Act, 2006, [MSMED Act] as
at March 31, 2017. The disclosure pursuant to the said Act is as under:
v crore
Particulars 2016-17 2015-16
Principal amount due to suppliers under MSMED Act, 2006 106.28 121.14
Interest accrued, due to suppliers under MSMED Act on the above amount, and unpaid 3.39 2.90
Payment made to suppliers (other than interest) beyond the appointed day during the year 187.48 264.03
Interest paid to suppliers under MSMED Act (other than Section 16) – –
Interest paid to suppliers under MSMED Act (Section16) – 0.01
Interest due and payable towards suppliers under MSMED Act for payments already made 3.60 7.83
Interest accrued and remaining unpaid at the end of the year to suppliers under MSMED Act 14.08 13.16
Amount of further interest remaining due and payable even in the succeeding years 8.20 1.20
NOTE [58]
There are no amounts due and outstanding to be credited to Investor Education & Protection Fund as at March 31, 2017.
NOTE [59]
Disclosure on Specified Bank Notes (SBN) pursuant to MCA notification 308(E) dated March 30, 2017:
v crore
Particulars
SBNs Other
denomination
notes
Total
Closing cash in hand as on 08.11.2016 5.39 8.73 14.12
(+) Permitted receipts – 15.71 15.71
(-) Permitted payments 0.02 20.09 20.11
(-) Amount deposited in Banks 5.37 0.03 5.40
Closing cash in hand as on 30.12.2016 – 4.32 4.32
Notes forming part of the Financial Statements (contd.)

333
Notes forming part of the Financial Statements (contd.)
NOTE [60]
Disclosure pursuant to Ind AS 101 “First time adoption of Indian Accounting Standards”
(a) Effect of Ind AS adoption on Balance Sheet as at April 1, 2015:
Particulars Note I-GAAP Ind AS Adjustments Ind AS
v crore v crore v crore v crore v crore v crore
ASSETS:
Non-current assets
Property, plant and equipment A, B, M 7402.20 (333.24) 7068.96
Capital work-in-progress A 304.54 81.19 385.73
Investment property A, B – 471.18 471.18
Other intangible assets M 85.16 (0.22) 84.94
Intangible assets under development 189.50 – 189.50
Financial Assets
Investments A, D, E 17672.83 (226.69) 17446.14
Loans A, F, M 3017.38 (14.52) 3002.86
Other financial assets E 334.76 11.70 346.46
21024.97 (229.51) 20795.46
Deferred tax assets/(liabilities) [net] A, G (362.99) 267.02 (95.97)
Other non-current assets A, C 1405.72 44.50 1450.22
Current assets
Inventories A, C, M 2270.72 (9.95) 2260.77
Financial assets
Investments D 5426.91 91.14 5518.05
Trade receivables A, H, M 16891.29 (101.29) 16790.00
Cash and cash equivalents A, M 1346.95 1417.83 2764.78
Other bank balances A 235.94 19.90 255.84
Loans A 1368.04 13.57 1381.61
Other financial assets A, E, I, N 1281.40 146.69 1428.09
26550.53 1587.84 28138.37
Other current assets A, C, H,
M, N
27554.18 900.65 28454.83
Group(s) of assets classified as held for sale
M – 141.79 141.79
TOTAL ASSETS 86424.53 2921.25 89345.78

334
Notes forming part of the Financial Statements (contd.)
Particulars Note I-GAAP Ind AS Adjustments Ind AS
v crore v crore v crore v crore v crore v crore
EQUITY AND LIABILITIES:
Equity
Equity share capital 185.91 – 185.91
Other equity 36898.67 1467.95 38366.62
Total equity 37084.58 1467.95 38552.53
Liabilities
Non-current liabilities
Financial Liabilities
Borrowings C, J 8596.85 (166.04) 8430.81
Other financial liabilities E, F 78.21 23.79 102.00
8675.06 (142.25) 8532.81
Provisions O 344.83 1.27 346.10
Other non-current liabilities F – 0.81 0.81
Current liabilities
Financial Liabilities
Borrowings A 3804.21 194.37 3998.58
Current maturities of long term borrowings C 648.31 (0.38) 647.93
Trade payables A, M 17838.72 537.28 18376.00
Other financial liabilities A, E, K, N 888.37 302.20 1190.57
23179.61 1033.47 24213.08
Other current liabilities A, M, N 14617.31 2168.67 16785.98
Provisions A, L, M 2447.31 (1645.89) 801.42
Current tax liabilities (net) 75.83 – 75.83
Liabilities associated with group(s) of assets classified as held for sale M – 37.22 37.22
TOTAL EQUITY AND LIABILITIES 86424.53 2921.25 89345.78
(b) Statement of reconciliation of equity under Ind AS and equity reported under I-GAAP as at April 1, 2015:
Sr.
no.Particulars
Note v crore
Equity as per I-GAAP 37084.58
I Provision for expected credit loss H (483.50)
II Provision for employee benefits based on constructive obligations K (353.22)
III Gain on fair valuation of investments D 247.83
IV Increase in borrowing cost pursuant to application of effective interest rate method C (29.34)
V Reversal of Dividend & DDT L 1644.87
VI Equity component of other financial instruments (FCCB) J 153.20
VII Others J, E, N, O 21.09
VIII Deferred and current taxes G 267.02
Equity as per Ind AS 38552.53
NOTE [60]
(a) Effect of Ind AS adoption on Balance Sheet as at April 1, 2015 (contd.)

335
(c) Effect of Ind AS adoption on Balance Sheet as at March 31, 2016:
Particulars Note I-GAAP Ind AS Adjustments Ind AS
v crore v crore v crore v crore v crore v crore
ASSETS:
Non-current assets
Property, plant and equipment A, B 7120.59 9.30 7129.89
Capital work-in-progress A, C, N 250.69 2.53 253.22
Investment property A, B – 446.90 446.90
Other intangible assets A 138.40 0.18 138.58
Intangible assets under development 158.91 – 158.91
Financial Assets
Investments A, D, E 19897.94 (710.08) 19187.86
Loans A, F 2809.71 (12.19) 2797.52
Other financial assets E 468.38 5.71 474.09
23176.03 (716.56) 22459.47
Deferred tax assets/(liabilities) [net] G (203.35) 359.49 156.14
Other non-current assets A, C 1775.66 11.04 1786.70
Current assets
Inventories A, C 1888.00 67.11 1955.11
Financials assets
Investments D 4701.55 101.77 4803.32
Trade receivables A, H 19089.92 (122.17) 18967.75
Cash and cash equivalents A 1505.19 570.64 2075.83
Other bank balances A 237.30 1257.13 1494.43
Loans A 2417.83 14.43 2432.26
Other financial assets A, E, I, N 1713.32 167.17 1880.49
29665.11 1988.97 31654.08
Other current assets A, C, H, N 32600.81 881.14 33481.95
TOTAL ASSETS 96570.85 3050.10 99620.95
Notes forming part of the Financial Statements (contd.)
NOTE [60] (contd.)

336
Notes forming part of the Financial Statements (contd.)
Particulars Note I-GAAP Ind AS Adjustments Ind AS
v crore v crore v crore v crore v crore v crore
EQUITY AND LIABILITIES:
Equity
Equity share capital 186.30 – 186.30
Other equity 40532.03 1416.98 41949.01
Total equity 40718.33 1416.98 42135.31
Liabilities
Non-current liabilities
Financial liabilities
Borrowings C, J 8486.18 (173.71) 8312.47
Other financial liabilities E, F 60.94 11.51 72.45
8547.12 (162.20) 8384.92
Provisions O 370.23 1.27 371.50
Other non-current liabilities F 0.58 5.25 5.83
Current liabilities
Financial liabilities
Borrowings A, C 3881.87 294.11 4175.98
Current maturities of long
term borrowings
1436.03 – 1436.03
Trade payables A 21391.11 824.81 22215.92
Other financial liabilities A, E, K, N 966.38 353.30 1319.68
27675.39 1472.22 29147.61
Other current liabilities A, N 16530.46 2121.50 18651.96
Provisions A, L, O 2703.11 (1805.82) 897.29
Current tax liabilities (net) A 25.63 0.90 26.53
TOTAL EQUITY AND LIABILITIES 96570.85 3050.10 99620.95
(d) Statement of reconciliation of equity under Ind AS and equity reported under I-GAAP as at March 31, 2016:
Sr.
no.Particulars
Note v crore
Equity as per I-GAAP 40718.33
I Provision for expected credit loss H (785.56)
II Provision for employee benefits based on constructive obligations K (379.07)
III Gain on fair valuation of investments D 172.49
IV Increase in borrowing cost pursuant to application of effective interest rate method C (53.91)
V Reversal of Dividend & DDT L 1840.83
VI Equity component of other financial instruments (FCCB) J 153.20
VII Others J, E, N 109.51
VIII Deferred and current taxes G 359.49
Equity as per Ind AS 42135.31
NOTE [60]
(c) Effect of Ind AS adoption on Balance Sheet as at March 31, 2016 (contd.)

337
(e) Effect of Ind AS adoption on the Statement of Profit and Loss for the period ended March 31, 2016:
Note I-GAAP Ind AS Adjsutments Ind AS
v crore v crore v crore v crore v crore v crore
INCOME
Revenue from operations A, N 60415.00 3397.65 63812.65
Other income A, D 2395.82 (54.78) 2341.04
Total income 62810.82 3342.87 66153.69
EXPENSES
Manufacturing, construction and operating expenses
Cost of raw materials components consumed A 7396.35 1.20 7397.55
Excise duty 635.39 – 635.39
Construction materials consumed A, N 17805.37 999.33 18804.70
Purchase of stock-in-trade A 1129.18 0.27 1129.45
Stores, spares and tools consumed A 1448.90 (99.67) 1349.23
Sub-contracting charges A 14066.80 1501.07 15567.87
Changes in inventories of finished goods,
work-in-progress and stock-in-trade A 114.98 (38.41) 76.57
Other manufacturing, construction and operating
expenses
A
4667.51 540.82 5208.33
47264.48 2904.61 50169.09
Employee benefits expense A, K,
O, P
4480.20 494.60 4974.80
Sales, administration and other expenses A, H 2494.91 350.86 2845.77
Finance costs A, C 1449.04 27.78 1476.82
Depreciation, amortisation, impairment and
obsolescence A 998.88 (1.48) 997.40
56687.51 3776.37 60463.88
Less: Overheads capitalised 5.53 – 5.53
Total expenses 56681.98 3776.37 60458.35
Profit before exceptional items and tax 6128.84 (433.50) 5695.34
Exceptional items 560.28 – 560.28
Profit before tax 6689.12 (433.50) 6255.62
Tax expenses
Current tax A, G 1551.19 (21.18) 1530.01
Deferred tax A, G (173.54) (100.43) (273.97)
1377.65 (121.61) 1256.04
Profit after tax 5311.47 (311.89) 4999.58
Other Comprehensive Income [net of tax] D, G
N, P
– 82.86 82.86
Total comprehensive income 5311.47 (229.03) 5082.44
Notes forming part of the Financial Statements (contd.)
NOTE [60] (contd.)

338
Notes forming part of the Financial Statements (contd.)
NOTE [60] (contd.)
(f) Statement of reconciliation of total comprehensive income for the period ended March 31, 2016:
Sr.
no.Particulars
Note v crore
Net Profit after tax as per I-GAAP 5311.46
I Impact of provision for expected credit loss H (302.06)
II Provision for employee benefits based on constructive obligations K (25.85)
III Impact of fair valuation of investments D (71.46)
IV Increase in borrowing cost pursuant to application of effective interest rate method C (24.57)
V Reclassification of net actuarial loss on employee defined benefit obligations to OCI P 12.90
VI Others E, J, N, O (23.78)
VII Deferred and current taxes G 122.94
Net Profit after tax as per Ind AS 4999.58
VIII Other comprehenvice income [net of tax] D, G, N, P 82.86
Total comprehensive income as per Ind AS 5082.44
(g) Effect of Ind AS adoption on Statement of Cash Flows for the period ended March 31, 2016:
v crore
Particulars Note I-GAAP Ind AS
Adjustments
Ind AS
Net cash flows from operating activities A 3272.72 27.14 3299.86
Net cash flows from investing activities A (545.27) (976.98) (1522.25)
Net cash flows from financing activities A (2567.21) 102.88 (2464.33)
Net increase/(decrease) in cash and cash equivalents 160.24 (846.96) (686.72)
Cash and cash equivalents as at April 1, 2015 1347.18 1417.60 2764.78
Cash and cash equivalents as at March 31, 2016 A 1507.42 570.64 2078.06
(h) Following assets and liabilities of joint operations have been consolidated in standalone financials on a line by line basis under Ind
AS as against a single line item accounted under I-GAAP (Note A).
As at 31-3-2016 As at 1-4-2015
v crore v crore v crore v crore
ASSETS:
Non-current assets
Property, plant and equipment 448.91 205.24
Capital work-in-progress 1.20 81.19
Investment property 7.56 14.38
Other intangible assets 0.18 –
Deferred tax assets (net) – 1.13
Other non-current assets 36.25 25.85
Carried forward 494.10 327.79

339
As at 31-3-2016 As at 1-4-2015
v crore v crore v crore v crore
Brought forward 494.10 327.79
Current assets
Inventories 67.12 12.39
Financials assets
Trade receivables 597.82 371.00
Cash and cash equivalents 570.53 1417.16
Other bank balances 1257.13 19.90
Loans 14.43 13.57
Other financial assets 135.20 123.07
2575.11 1944.70
Other current assets 1060.49 1145.90
TOTAL (A) 4196.82 3430.78
LIABILITIES
Current liabilities
Financial Liabilities
Borrowings 293.55 194.37
Trade payables 863.12 652.99
Other financials liabilities 519.69 304.43
1676.36 1151.79
Other current Liabilities 2158.52 2145.37
Provisions 8.65 1.87
Current tax liabilities (net) 0.90
TOTAL (B) 3844.43 3299.03
Net assets recognised under Ind AS [C = (A)-(B)] 352.39 131.75
Presented as a part of investments in Integrated Joint Ventures under
I-GAAP 352.39 131.75
Notes forming part of the Financial Statements (contd.)
NOTE [60] (contd.)

340
Notes forming part of the Financial Statements (contd.)
NOTE [60] (contd.)
(i) Following items of income and expenses of joint operations have been consolidated in standalone financials on a line by line basis
under Ind AS as against a Company’s share of profit or loss accounted under I-GAAP (Note A).
v crore v crore
INCOME:
Revenue from operations 3578.64
Other income 11.88
Total Income 3590.52
EXPENSES:
Manufacturing ,construction and operating expenses 2782.57
Employee benefits expense 422.16
Sales, administration and other expenses 146.46
Finance costs 11.76
Depreciation ,amortization ,impairment and obsolescence (1.48)
Total expenses 3361.47
Profit before exceptional items and tax 229.05
Exceptional items –
Profit before tax 229.05
Tax expenses
Current tax 1.18
Deferred tax 0.45
1.63
Profit after tax recognised under Ind AS 227.42
Company’s share of profit accounted under I-GAAP 227.42
Notes:
A. The Company is executing some of the projects through unincorporated joint ventures (UJV). Such arrangements have been
classified as joint operations pursuant to Ind AS 111 and accordingly Company’s share in assets, liabilities, income and expenses
of UJVs has been consolidated in standalone financials on a line by line basis. Under I-GAAP the investment in UJVs was being
presented as a single line item in the Balance Sheet and the Company’s share in the net profit or loss was accounted as a single
line item in the Statement of Profit and Loss.
B. Pursuant to Ind AS requirements, investment property is presented separately. Under I-GAAP the same was presented as part of
tangible assets. Tangible assets have been now divided into two categories under Ind AS viz. Property, plant and equipment and
Investment property.
C. Under Ind AS 23 borrowing cost is calculated following effective rate of interest (EIR) method as described under Ind AS
109. Under I-GAAP borrowing cost was computed by applying the coupon rate to the principle amount for the period with
consequential impact in the asset items where borrowing cost is capitalised/inventorised. Borrowings are recognised at fair value at
the inception and subsequently at amortised cost with interest recognised based on EIR method.
D. All Investments except investments in group companies have been fair valued in accordance with Ind AS 109. Investments in debt
securities are fair valued through OCI and reclassified to profit or loss on their sale. Other investments are fair valued through profit
or loss. Under I-GAAP the current investments were carried at cost net of diminution in their value as at the Balance Sheet date.
The long term investments were carried at cost net of permanent diminution, if any.
E. Financial guarantee contracts have been recognised at fair value at the inception in accordance with Ind AS 109 along with
accrued guarantee charges. Under I-GAAP financial guarantee given was disclosed as contingent liability and commitments.

341
Notes forming part of the Financial Statements (contd.)
NOTE [60] (contd.)
F. Under Ind AS financial assets and liabilities are measured at fair value at the inception and subsequently at amortised cost or at fair
value based on their classification. Under I-GAAP the financial assets and liabilities were measured at cost.
G. Deferred tax under Ind AS has been recognised for temporary differences between tax base and the book base of the relevant
assets and liabilities. Under I-GAAP the deferred tax was accounted based on timing differences impacting the Statement of Profit
and Loss for the period.
H. The provision is made against trade receivables based on “expected credit loss” model as per Ind AS 109. Under I-GAAP the
provision was made when the receivable turned doubtful based on the assessment on case to case basis.
I. ESOP charge is accounted using fair value method. The portion of ESOP charge recoverable from the group companies is
accordingly measured and recognised at fair value. Under I-GAAP ESOP charge was calculated based on intrinsic value method.
J. Pursuant to Ind AS 32, Foreign Currency Convertible Bonds (FCCB) issued by the Company is split into equity and liability
component and presented accordingly. The measurement of liability component is done at fair value at the inception and
subsequently at amortised cost. Under I-GAAP FCCB was accounted at cost and presented as borrowing.
K. Provision is made under Ind AS towards constructive obligations of the Company related to payment of performance linked
rewards to the employees and tax on ESOP benefits, wherever applicable. Under I-GAAP the cost was recognised on actual
payments.
L. Under Ind AS the final dividend including related tax is recognised in the period in which the obligation to pay is established on its
approval, post reporting of financial statements. Under I-GAAP a provision was required to be made in the financial statements for
the proposed final dividend in the period to which the liability related.
M. In accordance with Ind AS 105 group of assets held for sale and liabilities associated with such group is presented separately.
Under I-GAAP there was no such requirement.
N. Change in fair value of derivative instrument taken to hedge off-Balance Sheet item is accounted in the hedging reserve. Under
I-GAAP the premium on these derivative instrument was recognised on accrual basis in the Statement of Profit and Loss.
O. Past service cost arising out of modifications in the post-retirement benefits is recognised in Profit or Loss pursuant to Ind AS 19.
Under I-GAAP the past service cost was amortised over a period.
P. Actuarial gains and losses pertaining to defined benefit obligations and re-measurement pertaining to return on plan assets are
recognised in Other Comprehensive Income in accordance with Ind AS 19 and are not reclassified to profit or loss. Further, there
are certain other items (as presented in OCI) that are accounted in Other Comprehensive Income and subsequently reclassified to
Profit or Loss in accordance with Ind AS requirements.
Q. The previous year I-GAAP figures have been reclassified/regrouped to make them comparable with Ind AS presentation.

342
NOTES

343
INDEPENDENT AUDITORS’ REPORTTO THE MEMBERS OF
LARSEN & TOUBRO LIMITED
Report on the Consolidated Ind AS Financial Statements
We have audited the accompanying Consolidated Ind AS financial statements of LARSEN & TOUBRO LIMITED (hereinafter referred
to as the “Parent”) and its subsidiaries (the Parent and its subsidiaries together referred to as the “Group”) its joint ventures and
associates, comprising the Consolidated Balance Sheet as at March 31, 2017, the Consolidated Statement of Profit and Loss (including
Other Comprehensive Income), the Consolidated Statement of Cash Flows, and the Consolidated Statement of Changes in Equity, for
the year then ended, and a summary of the significant accounting policies and other explanatory information (hereinafter referred to as
“the consolidated Ind AS financial statements”) and which also includes Joint operations of the Group.
Management’s Responsibility for the Consolidated Ind AS Financial Statements
The Parent’s Board of Directors is responsible for the preparation of these consolidated Ind AS financial statements in terms of the
requirements of the Companies Act, 2013 (hereinafter referred to as the “Act”) that give a true and fair view of the consolidated
financial position, consolidated financial performance (including other comprehensive income), consolidated statement of cash flows
and the consolidated statement of changes in equity of the Group including its joint operations, joint ventures and associates in
accordance with the accounting principles generally accepted in India, including the Indian Accounting Standards (Ind AS) prescribed
under Section 133 of the Act. The respective Boards of Directors of the companies included in the Group and of its joint operations,
joint ventures and associates are responsible for maintenance of adequate accounting records in accordance with the provisions of
the Act for safeguarding the assets of the Group, and of its joint operations, joint ventures and associates and for preventing and
detecting frauds and other irregularities; the selection and application of appropriate accounting policies; making judgments and
estimates that are reasonable and prudent; and the design, implementation and maintenance of adequate internal financial controls,
that were operating effectively for ensuring the accuracy and completeness of the accounting records, relevant to the preparation and
presentation of the financial statements that give a true and fair view and are free from material misstatement, whether due to fraud
or error, which have been used for the purpose of preparation of the consolidated Ind AS financial statements by the Directors of the
Parent, as aforesaid.
Auditors’ Responsibility
Our responsibility is to express an opinion on these consolidated Ind AS financial statements based on our audit. In conducting our
audit, we have taken into account the provisions of the Act, the accounting and auditing standards and matters which are required to
be included in the audit report under the provisions of the Act and the Rules made thereunder.
We conducted our audit in accordance with the Standards on Auditing specified under Section 143(10) of the Act. Those Standards
require that we comply with ethical requirements and plan and perform the audit to obtain reasonable assurance about whether the
consolidated Ind AS financial statements are free from material misstatement.
An audit involves performing procedures to obtain audit evidence about the amounts and the disclosures in the consolidated Ind AS
financial statements. The procedures selected depend on the auditors’ judgment, including the assessment of the risks of material
misstatement of the consolidated Ind AS financial statements, whether due to fraud or error. In making those risk assessments, the
auditor considers internal financial control relevant to the Parent’s preparation of the consolidated Ind AS financial statements that give
a true and fair view in order to design audit procedures that are appropriate in the circumstances. An audit also includes evaluating
Consolidated Financial Statements 2016-17
INDEPENDENT AUDITORS’ REPORT ON THE CONSOLIDATED IND AS FINANCIAL STATEMENTS
OF A GROUP UNDER THE COMPANIES ACT, 2013 AND THE RULES THEREUNDER
DELOITTE HASKINS & SELLS LLP
Chartered Accountants
Indiabulls Finance Centre, Tower 3
27th – 32nd Floor, Senapati Bapat Marg
Elphinstone Road (West)
Mumbai 400 013.
SHARP & TANNAN
Chartered Accountants
Ravindra Annexe
194, Churchgate Reclamation,
Dinshaw Vachha Road
Mumbai 400 020.

344
the appropriateness of the accounting policies used and the reasonableness of the accounting estimates made by the Parent’s Board of
Directors, as well as evaluating the overall presentation of the consolidated Ind AS financial statements.
We believe that the audit evidence obtained by us and other auditors in terms of their reports referred to in sub-paragraphs (a) and (b)
of the Other Matters paragraph below, is sufficient and appropriate to provide a basis for our audit opinion on the consolidated Ind AS
financial statements.
Opinion
In our opinion and to the best of our information and according to the explanations given to us and based on the consideration of
reports of the other auditors on separate financial statements of joint operations, subsidiaries, joint ventures and associates referred to
below in the Other Matters paragraph, the aforesaid consolidated Ind AS financial statements give the information required by the Act
in the manner so required and give a true and fair view in conformity with the accounting principles generally accepted in India, of the
consolidated state of affairs of the Group, its joint operations, joint ventures and associates as at March 31, 2017, and its consolidated
profit, consolidated total comprehensive income, consolidated statement of cash flows and consolidated statement of changes in equity
for the year ended on that date.
Other Matters
(a) The consolidated Ind AS financial statements include the financial statements of 16 joint operations included in the standalone
financial statements of the Parent included in the Group whose financial statements reflect total assets of v 3,647.41 crore as at
March 31, 2017 and total revenues of v 4,360.69 crore for the year ended on that date, as considered in the standalone financial
statements of the Parent included in the Group. The financial statements of these joint operations have been audited by the other
auditors whose reports have been furnished to us and our opinion in so far as it relates to the amounts and disclosures included in
respect of these joint operations, and our report in terms of sub section (3) of Section 143 of the Act, in so far as it relates to the
aforesaid joint operations is based solely on the report of such other auditors.
The above includes 7 joint operations which are located outside India whose financial statements have been prepared in
accordance with accounting principles generally accepted in their respective countries and which have been audited by other
auditors under generally accepted auditing standards applicable in their respective countries. The Parent’s management has
converted the financial statements of such joint operations located outside India from accounting principles generally accepted
in their respective countries to accounting principles generally accepted in India. We have audited these conversion adjustments
made by the Parent management. Our opinion in so far as it relates to the amounts and disclosures included in respect of said
joint operations located outside India is based on the report of other auditors and the conversion adjustments prepared by the
management of the Parent and audited by us.
(b) The consolidated Ind AS financial statements include the financial statements of 34 subsidiaries, whose financial statements reflect
total assets of v 55,693.16 crore as at March 31, 2017, total revenues of v 15,300.27 crore and net cash outflows amounting
to v 343.25 crore for the year ended on that date, as considered in the consolidated Ind AS financial statements which have not
been audited by us. The consolidated Ind AS financial statements also include the Group’s share of loss (net) of v 561.10 crore
for the year ended March 31, 2017, as considered in the consolidated Ind AS financial statements, in respect of 4 joint ventures,
whose financial statements have not been audited by us. These financial statements have been audited by other auditors whose
reports have been furnished to us by the Management and our opinion on the consolidated Ind AS financial statements, in so far
as it relates to the amounts and disclosures included in respect of these subsidiaries, joint ventures and associates, and our report
in terms of sub-section (3) of Section 143 of the Act, in so far as it relates to the aforesaid subsidiaries and joint ventures is based
solely on the reports of the other auditors.
The above include 28 subsidiaries and a joint venture which are located outside India whose financial statements have been
prepared in accordance with accounting principles generally accepted in their respective countries and which have been audited by
other auditors under generally accepted auditing standards applicable in their respective countries. The Parent’s management has
converted the financial statements of such subsidiaries and joint venture located outside India from accounting principles generally
accepted in their respective countries to accounting principles generally accepted in India. We have audited these conversion
adjustments made by the Parent’s management. Our opinion in so far as it relates to the amounts and disclosures included in
respect of said subsidiaries and joint venture located outside India is based on the report of other auditors and the conversion
adjustments prepared by the management of the parent and audited by us.
(c) The consolidated Ind AS financial statements include the financial statements/information of 14 subsidiaries, whose financial
statements reflect total assets of v 70.15 crore as at March 31, 2017, total revenues of v 333.18 crore and net cash outflows
amounting to v 31.38 crore for the year ended on that date, as considered in the consolidated Ind AS financial statements
which have not been audited by us. The consolidated Ind AS financial statements also include the Group’s share of profit (net)
v 7.37 crore for the year ended March 31, 2017, as considered in the consolidated Ind AS financial statements, in respect of 2
joint ventures and 6 associates, whose financial statements/information have not been audited by their auditors. These financial

345
statements/information are unaudited and have been furnished to us by the Management and our opinion on the consolidated
Ind AS financial statements, in so far as it relates to the amounts and disclosures included in respect of these subsidiaries, joint
ventures and associates, is based solely on such unaudited financial statements/information. In our opinion and according to the
information and explanations given to us by the Management, these financial statements/information are not material to the
Group.
(d) The comparative financial statements for the year ended March 31, 2016 in respect of 4 joint operations, 37 subsidiaries and 4
joint ventures included in this consolidated Ind AS financial statements prepared in accordance with the Ind AS have been audited
by other auditors and have been relied upon by us.
The consolidated Ind AS financial statements also includes the comparative financial statements/information for the year ended
March 31, 2016 in respect of 16 joint operations, 22 subsidiaries, 3 joint ventures and 10 associates included in consolidated
Ind AS financial statements prepared in accordance with the Ind AS have not been audited by their auditors. These financial
statements/information are unaudited and have been furnished to us by the Management and our opinion on the consolidated
Ind AS financial statements, in so far as it relates to the amounts and disclosures included in respect of these joint operations,
subsidiaries, joint ventures and associates, is based solely on such unaudited financial statements/ information. In our opinion and
according to the information and explanations given to us by the Management, these financial statements are not material to the
Group.
Our opinion on the consolidated Ind AS financial statements above, and our report on Other Legal and Regulatory Requirements below,
is not modified in respect of the above matters with respect to our reliance on the work done and the reports of the other auditors and
the financial statements/information certified by the Management.
Report on Other Legal and Regulatory Requirements
As required by Section 143(3) of the Act, based on our audit and on the consideration of the report of other auditors on separate
financial statements and the other financial information of joint operations, subsidiaries, joint venture and associate companies
incorporated in India, referred in the Other Matters paragraph above we report, to the extent applicable, that:
(a) We have sought and obtained all the information and explanations which to the best of our knowledge and belief were necessary
for the purposes of our audit of the aforesaid consolidated Ind AS financial statements.
(b) In our opinion, proper books of account as required by law relating to preparation of the aforesaid consolidated Ind AS financial
statements have been kept so far as it appears from our examination of those books, returns and the reports of the other auditors.
(c) The consolidated Balance Sheet, the consolidated Statement of Profit and Loss (including other comprehensive income), the
consolidated Statement of Cash Flows and consolidated Statement of Changes in Equity dealt with by this report are in agreement
with the relevant books of account maintained for the purpose of preparation of the consolidated Ind AS financial statements.
(d) In our opinion, the aforesaid consolidated Ind AS financial statements comply with the Indian Accounting Standards prescribed
under Section 133 of the Act.
(e) On the basis of the written representations received from the directors of the Parent as on March 31, 2017 taken on record by
the Board of Directors of the Parent and the reports of the statutory auditors of its subsidiary companies, associate companies
and joint venture companies incorporated in India, none of the directors of the Group companies, its associate companies and
joint venture companies incorporated in India is disqualified as on March 31, 2017 from being appointed as a director in terms of
Section 164 (2) of the Act.
(f) With respect to the adequacy of the internal financial controls over financial reporting and the operating effectiveness of such
controls, refer to our separate Report in “Annexure A”, which is based on the auditors’ reports of the Parent, joint operation
companies, subsidiary companies, associate companies and joint venture companies incorporated in India. Our report expresses an
unmodified opinion on the adequacy and operating effectiveness of the Parent’s internal financial controls over financial reporting.
(g) With respect to the other matters to be included in the Auditors’ Report in accordance with Rule 11 of the Companies (Audit and
Auditor’s) Rules, 2014, as amended, in our opinion and to the best of our information and according to the explanations given to
us:
i. The consolidated Ind AS financial statements disclose the impact of pending litigations on the consolidated financial position
of the Group, its associates and joint ventures.
ii. Provision has been made in the consolidated Ind AS financial statements, as required under the applicable law or accounting
standards, for material foreseeable losses, if any, on long-term contracts including derivative contracts.
iii. There has been no delay in transferring amounts required to be transferred, to the Investor Education and Protection Fund by
the Parent and its subsidiary companies, associate companies and joint venture companies incorporated in India.

346
ANNEXURE “A” TO THE INDEPENDENT AUDITORS’ REPORT (Referred to in paragraph “f” under ‘Report on Other Legal and Regulatory Requirements’ section of our report of even date)
Report on the Internal Financial Controls Over Financial Reporting under Clause (i) of Sub-section 3 of Section 143 of the
Companies Act, 2013 (the “Act”)
In conjunction with our audit of the consolidated Ind AS financial statements of the Company as of and for the year ended March 31,
2017, we have audited the internal financial controls over financial reporting of LARSEN & TOUBRO LIMITED (hereinafter referred to
as the “Parent”) and its subsidiary companies (hereinafter referred to as the “Group”), which includes internal financial controls over
financial reporting of the joint operations which are companies incorporated in India, its joint ventures and associate companies, which
are companies incorporated in India, as of that date.
Management’s Responsibility for Internal Financial Controls
The respective Boards of Directors of the Parent, its joint operations, its subsidiary companies, its joint ventures and its associate
companies, which are companies incorporated in India, are responsible for establishing and maintaining internal financial controls based
on the internal control over financial reporting criteria established by the respective Companies considering the essential components
of internal control stated in the Guidance Note on Audit of Internal Financial Controls Over Financial Reporting issued by the Institute
of Chartered Accountants of India (“ICAI”). These responsibilities include the design, implementation and maintenance of adequate
internal financial controls that were operating effectively for ensuring the orderly and efficient conduct of its business, including
adherence to the respective company’s policies, the safeguarding of its assets, the prevention and detection of frauds and errors, the
accuracy and completeness of the accounting records, and the timely preparation of reliable financial information, as required under the
Companies Act, 2013.
Auditors’ Responsibility
Our responsibility is to express an opinion on the internal financial controls over financial reporting of the Parent, its subsidiary
companies, its joint operations, its joint ventures and its associate companies, which are companies incorporated in India, based on our
audit. We conducted our audit in accordance with the Guidance Note on Audit of Internal Financial Controls Over Financial Reporting
(the “Guidance Note”) issued by the ICAI and the Standards on Auditing, prescribed under Section 143(10) of the Companies Act,
2013, to the extent applicable to an audit of internal financial controls. Those Standards and the Guidance Note require that we comply
with ethical requirements and plan and perform the audit to obtain reasonable assurance about whether adequate internal financial
controls over financial reporting was established and maintained and if such controls operated effectively in all material respects.
Our audit involves performing procedures to obtain audit evidence about the adequacy of the internal financial controls system over
financial reporting and their operating effectiveness. Our audit of internal financial controls over financial reporting included obtaining
an understanding of internal financial controls over financial reporting, assessing the risk that a material weakness exists, and testing
and evaluating the design and operating effectiveness of internal control based on the assessed risk. The procedures selected depend
iv. To the best of our information and according to the information and explanations given to us, we report that, except
where, for reasons explained in note no. 59 to the consolidated financial statements, the disclosures by certain subsidiaries
in the financial services segments of the Group with regard to the Specified Bank Notes (“SBNs”) were restricted to readily
available information and also considering that certain amounts directly deposited into the bank accounts of those entities
by their customers for which information relating to SBNs was not available with those entities were classified as “Permitted
receipts/Other Denomination Notes”, the Parent Company has provided requisite disclosures in the consolidated financial
statements as regards the Group entities’ holding and dealings in SBNs, as defined in the Notification S.O. 3407(E) dated 8th
November, 2016, of the Ministry of Finance, during the period from November 9, 2016 to December 30, 2016. Based on
audit procedures performed by us and the representations provided to us by the management, we report that the disclosures
are in accordance with the relevant books of accounts maintained by those entities for the purpose of preparation of the
consolidated Ind AS financial statements which, as the case may be, were produced before us or other auditors by the
managements of the respective Group entities.
For DELOITTE HASKINS & SELLS LLP For SHARP & TANNAN
Chartered Accountants Chartered Accountants(Firm Registration No. 117366W/W-100018) (Firm Registration No. 109982W)
P. R. RAMESH FIRDOSH D. BUCHIA
(Partner) (Partner)(Membership No. 70928) (Membership No. 38332)
MUMBAI, May 29, 2017

347
on the auditors’ judgement, including the assessment of the risks of material misstatement of the financial statements, whether due to
fraud or error.
We believe that the audit evidence we have obtained and the audit evidence obtained by the other auditors of the subsidiary
companies, joint operations, joint ventures and associate companies, which are companies incorporated in India, in terms of their
reports referred to in the Other Matters paragraph below, is sufficient and appropriate to provide a basis for our audit opinion on the
internal financial controls system over financial reporting of the Parent, its subsidiary companies, its joint operations, its joint ventures
and associate companies, which are companies incorporated in India.
Meaning of Internal Financial Controls Over Financial Reporting
A Company’s internal financial control over financial reporting is a process designed to provide reasonable assurance regarding the
reliability of financial reporting and the preparation of financial statements for external purposes in accordance with generally accepted
accounting principles. A company’s internal financial control over financial reporting includes those policies and procedures that (1)
pertain to the maintenance of records that, in reasonable detail, accurately and fairly reflect the transactions and dispositions of the
assets of the company; (2) provide reasonable assurance that transactions are recorded as necessary to permit preparation of financial
statements in accordance with generally accepted accounting principles, and that receipts and expenditures of the company are being
made only in accordance with authorisations of management and directors of the company; and (3) provide reasonable assurance
regarding prevention or timely detection of unauthorised acquisition, use, or disposition of the company’s assets that could have a
material effect on the financial statements.
Inherent Limitations of Internal Financial Controls Over Financial Reporting
Because of the inherent limitations of internal financial controls over financial reporting, including the possibility of collusion or
improper management override of controls, material misstatements due to error or fraud may occur and not be detected. Also,
projections of any evaluation of the internal financial controls over financial reporting to future periods are subject to the risk that
the internal financial control over financial reporting may become inadequate because of changes in conditions, or that the degree of
compliance with the policies or procedures may deteriorate.
Opinion
In our opinion, to the best of our information and according to the explanations given to us and based on the consideration of the
reports of the other auditors referred to in the Other Matters paragraph below, the Parent, its subsidiary companies, its joint operations,
its joint ventures and associate companies, which are companies incorporated in India, have, in all material respects, an adequate
internal financial controls system over financial reporting and such internal financial controls over financial reporting were operating
effectively as at March 31, 2017, based on the internal control over financial reporting criteria established by the respective companies
considering the essential components of internal control stated in the Guidance Note.
Other Matters
Our aforesaid report under Section 143(3)(i) of the Act on the adequacy and operating effectiveness of the internal financial controls
over financial reporting in so far as it relates to 1 joint operation, 4 subsidiary companies, and 2 joint venture companies, which are
companies incorporated in India, is based solely on the corresponding reports of the auditors of such companies incorporated in India.
Our aforesaid report under Section 143(3)(i) of the Act on the adequacy and operating effectiveness of the internal financial controls
over financial reporting in so far as it relates to 7 subsidiary companies and 4 associate companies, which are companies incorporated
in India, whose financial statements/information are unaudited and our opinion on the adequacy and operating effectiveness of the
internal financial controls over financial reporting of the Group is not affected as these financial statements/information are not material
to the Group.
Our opinion is not modified in respect of the above matters.
For DELOITTE HASKINS & SELLS LLP For SHARP & TANNAN
Chartered Accountants Chartered Accountants(Firm Registration No. 117366W/W-100018) (Firm Registration No. 109982W)
P. R. RAMESH FIRDOSH D. BUCHIA
(Partner) (Partner)(Membership No. 70928) (Membership No. 38332)
MUMBAI, May 29, 2017
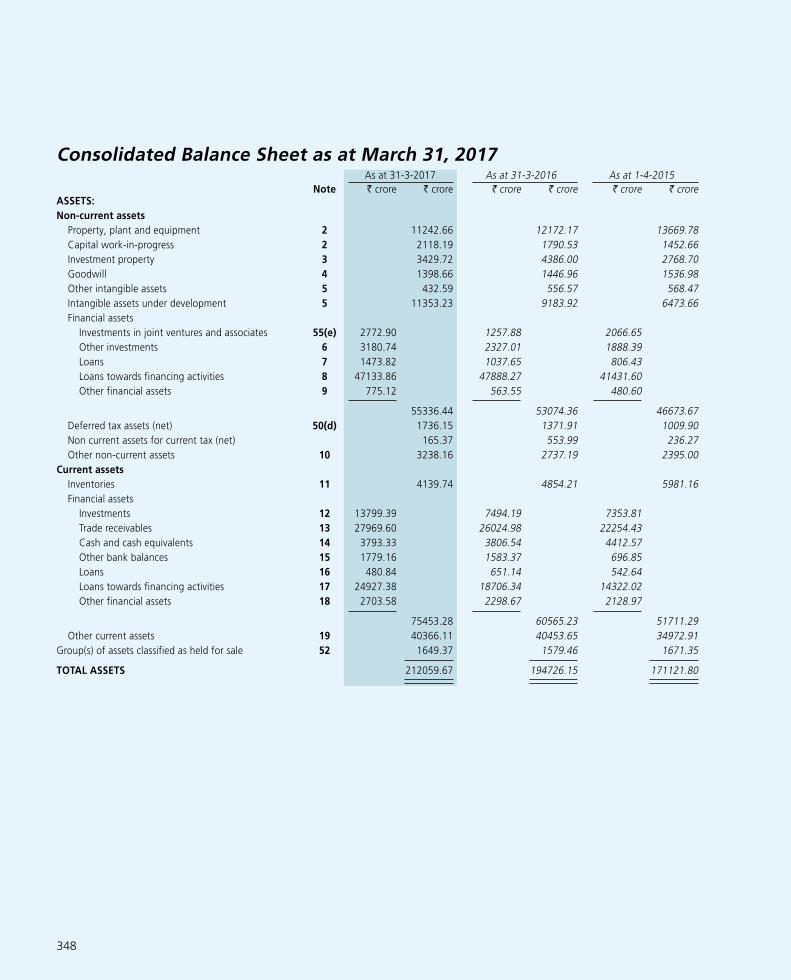
348
Consolidated Balance Sheet as at March 31, 2017As at 31-3-2017 As at 31-3-2016 As at 1-4-2015
Note v crore v crore v crore v crore v crore v croreASSETS:
Non-current assets
Property, plant and equipment 2 11242.66 12172.17 13669.78
Capital work-in-progress 2 2118.19 1790.53 1452.66
Investment property 3 3429.72 4386.00 2768.70
Goodwill 4 1398.66 1446.96 1536.98
Other intangible assets 5 432.59 556.57 568.47
Intangible assets under development 5 11353.23 9183.92 6473.66
Financial assets
Investments in joint ventures and associates 55(e) 2772.90 1257.88 2066.65
Other investments 6 3180.74 2327.01 1888.39
Loans 7 1473.82 1037.65 806.43
Loans towards financing activities 8 47133.86 47888.27 41431.60
Other financial assets 9 775.12 563.55 480.60
55336.44 53074.36 46673.67
Deferred tax assets (net) 50(d) 1736.15 1371.91 1009.90
Non current assets for current tax (net) 165.37 553.99 236.27
Other non-current assets 10 3238.16 2737.19 2395.00
Current assets
Inventories 11 4139.74 4854.21 5981.16
Financial assets
Investments 12 13799.39 7494.19 7353.81
Trade receivables 13 27969.60 26024.98 22254.43
Cash and cash equivalents 14 3793.33 3806.54 4412.57
Other bank balances 15 1779.16 1583.37 696.85
Loans 16 480.84 651.14 542.64
Loans towards financing activities 17 24927.38 18706.34 14322.02
Other financial assets 18 2703.58 2298.67 2128.97
75453.28 60565.23 51711.29
Other current assets 19 40366.11 40453.65 34972.91
Group(s) of assets classified as held for sale 52 1649.37 1579.46 1671.35
TOTAL ASSETS 212059.67 194726.15 171121.80

349
In terms of our report attachedFor DELOITTE HASKINS & SELLS LLPChartered AccountantsFirm’s Registration No.117366W/W-100018 A. M. NAIK
Group Executive Chairman (DIN 00001514)
by the hand of
P. R. RAMESHPartner R. SHANKAR RAMAN M. DAMODARAN M.M.CHITALEMembership No. 70928 Chief Financial Officer &
Whole-time Director (DIN 02106990) (DIN 00101004)
(DIN 00019798) For SHARP & TANNANChartered Accountants SUBODH BHARGAVA SUNITA SHARMA SUSHOBHAN SARKERFirm’s Registration No.109982W (DIN 00035672) (DIN 02949529) (DIN 00088276)by the hand of
FIRDOSH D. BUCHIA N.HARIHARAN VIKRAM SINGH MEHTA SANJEEV AGAPartner Company Secretary (DIN 00041197) (DIN 00022065)Membership No. 038332 M. No. A3471
DirectorsMumbai, May 29, 2017
As at 31-3-2017 As at 31-3-2016 As at 1-4-2015
Note v crore v crore v crore v crore v crore v croreEQUITY AND LIABILITIES:
Equity
Equity share capital 20 186.59 186.30 185.91 Other equity 21 50029.93 43994.06 41022.18
Equity attributable to owners of the Company 50216.52 44180.36 41208.09 Non-controlling interest 3563.60 2892.84 1970.62 Liabilities
Non-current liabilities
Financial liabilities Borrowings 22 67340.58 61223.84 52709.64 Other financial liabilities 23 191.33 141.40 222.12
67531.91 61365.24 52931.76 Provisions 24 526.59 424.66 385.35 Deferred tax liabilities (net) 50(d) 610.95 635.48 659.49 Other non-current liabilities 25 172.14 181.14 211.93 Current liabilities
Financial liabilities Borrowings 26 16556.79 14896.75 15897.14 Current maturities of long term borrowings 27 10078.90 12014.90 8122.87 Trade payables 28 29774.25 27003.56 22056.89 Other financial liabilities 29 5189.05 4322.44 3772.85
61598.99 58237.65 49849.75 Other current liabilities 30 23444.74 24407.89 20804.60 Provisions 31 2658.34 2303.52 1676.85 Current tax liabilities (net) 240.29 83.49 299.55 Liabilities associated with group(s) of assets classified as
held for sale
52
1495.60 13.88 1123.81
TOTAL EQUITY AND LIABILITIES 212059.67 194726.15 171121.80
CONTINGENT LIABILITIES 32
COMMITMENTS (capital and others) 33
NOTES FORMING PART OF THE FINANCIAL
STATEMENTS
1 to 63
Consolidated Balance Sheet as at March 31, 2017 (contd.)

350
Consolidated Statement of Profit and Loss for the year ended March 31, 2017
2016-17 2015-16
Note v crore v crore v crore v croreINCOME:
Revenue from operations 34 110011.00 101975.34
Other income 35 1401.01 904.35
Total income 111412.01 102879.69
EXPENSES:
Manufacturing, construction and operating expenses: 36
Cost of raw materials, components consumed 14320.98 13729.98
Excise duty 699.19 852.86
Construction materials consumed 20732.39 20256.77
Purchase of stock-in-trade 1610.57 1333.44
Stores, spares and tools consumed 2090.42 1834.19
Sub-contracting charges 22556.13 20788.86
Changes in inventories of finished goods, work-in-progress and
stock-in-trade and property development 84.00 (514.86)
Other manufacturing, construction and operating expenses 10583.48 9160.56
Finance cost of financial services business and finance lease activity 5362.09 4967.11
78039.25 72408.91
Employee benefits expense 37 13853.07 13330.84
Sales, administration and other expenses 38 7045.50 5778.52
Finance costs 39 1339.84 1655.06
Depreciation, amortisation, impairment and obsolescence 2369.93 1786.73
102647.59 94960.06
Less: Overheads capitalised 1.51 5.77
Total expenses 102646.08 94954.29
Profit before exceptional items and tax 8765.93 7925.40
Exceptional items 42 121.43 94.22
Profit before tax 8887.36 8019.62
Tax expense:
Current tax 50(a) 2976.31 2817.69
Deferred tax (net) 50(a) (827.76) (380.73)
2148.55 2436.96
Profit after tax 6738.81 5582.66
Less: Additional provision/(reversal) of tax on dividend distributed
by subsidiaries (141.96) 47.80
6880.77 5534.86
Add: Share in profit/(loss) of joint ventures/associates (net) 55(f) (395.27) (990.16)
Profit for the year 6485.50 4544.70
Carried forward 6485.50 4544.70

351
In terms of our report attachedFor DELOITTE HASKINS & SELLS LLPChartered AccountantsFirm’s Registration No.117366W/W-100018 A. M. NAIK
Group Executive Chairman (DIN 00001514)
by the hand of
P. R. RAMESHPartner R. SHANKAR RAMAN M. DAMODARAN M.M.CHITALEMembership No. 70928 Chief Financial Officer &
Whole-time Director (DIN 02106990) (DIN 00101004)
(DIN 00019798) For SHARP & TANNANChartered Accountants SUBODH BHARGAVA SUNITA SHARMA SUSHOBHAN SARKERFirm’s Registration No.109982W (DIN 00035672) (DIN 02949529) (DIN 00088276)by the hand of
FIRDOSH D. BUCHIA N.HARIHARAN VIKRAM SINGH MEHTA SANJEEV AGAPartner Company Secretary (DIN 00041197) (DIN 00022065)Membership No. 038332 M. No. A3471
DirectorsMumbai, May 29, 2017
2016-17 2015-16
Note v crore v crore v crore v croreBrought forward 6485.50 4544.70
Other comprehensive income
A. Items that will not be reclassified to profit or loss:
Remeasurements of the defined benefit plans [net of tax] (25.35) (10.42)
B. Items that will be reclassified to profit or loss:
Debt instruments through other comprehensive income [net of tax] (6.41) (2.59)
Exchange differences in translating the financial statements of
foreign operations [net of tax] (130.83) 68.93
Effective portion of gains and losses on hedging instruments in
a cash flow hedge [net of tax] 382.94 91.78
Cost of hedging reserve [net of tax] (42.57) 11.35
Other comprehensive income for the year [net of tax] 177.78 159.05
Total comprehensive income for the year 6663.28 4703.75
Profit for the year attributable to:
- Owners of the Company 6041.23 4232.88
- Non-controlling interests 444.27 311.82
6485.50 4544.70
Other comprehensive income for the year attributable to:
- Owners of the Company 146.38 155.82
- Non-controlling interests 31.40 3.23
177.78 159.05
Total comprehensive income for the year attributable to:
- Owners of the Company 6187.61 4388.70
- Non-controlling interests 475.67 315.05
6663.28 4703.75
Basic earnings per equity share (v) 49 64.80 45.48
Diluted earnings per equity share (v) 49 64.58 45.27
Face value per equity share (v) 2.00 2.00
NOTES FORMING PART OF THE FINANCIAL STATEMENTS 1 to 63
Consolidated Statement of Profit and Loss for the year ended March 31, 2017 (contd.)

352
Consolidated Statement of Changes in Equity for the year ended March 31, 2017
A. Equity share capital
Particulars
2016-17 2015-16
Number of shares
v crore Number of shares
v crore
Issued, subscribed and fully paid up equity shares outstanding at the
beginning of the year 93,14,78,845 186.30 92,95,62,061 185.91
Add: Shares issued on exercise of employee stock options
during the year 14,86,958 0.29 19,16,784 0.39
Issued, subscribed and fully paid up equity shares outstanding
at the end of the year 93,29,65,803 186.59 93,14,78,845 186.30
B. Other equity
(v crore)
Particulars Equity
component
of foreign
currency
convertible
bonds
Reserves and surplus Items of other comprehensive income Total other
equity
Non-
controlling
interest
Total
Capital
reserve
Securities
premium
account
Employee
share
options
(net)
Statutory
reserves
Retained
earnings
Foreign
currency
transla-
tion
reserve
Hedging
reserve
Debt
instruments
through other
comprehensive
income
Balance as at 1-4-2015 153.20 281.06 7963.16 369.24 1987.37 29703.20 538.23 (51.90) 78.62 41022.18 1970.62 42992.80
Profit for the year (a) – – – – – 4232.88 – – – 4232.88 311.82 4544.70
Other comprehensive income (b) – – – – – (8.86) 71.36 95.91 (2.59) 155.82 3.23 159.05
Total comprehensive income for the year (a+b) – – – – – 4224.02 71.36 95.91 (2.59) 4388.70 315.05 4703.75
Issue of equity shares – – 201.63 – – – – – – 201.63 – 201.63
Share issue expenses – – (0.07) – – – – – – (0.07) – (0.07)
Impact of business combination – (0.66) – – – – – – – (0.66) – (0.66)
Transfer from/(to) retained earnings
during the year – – – (12.35) 671.93 (659.58) – – – – – –
Employee share options (net) – – – (74.67) – – – – – (74.67) (0.69) (75.36)
Dividend paid for the previous year
(including tax on dividend) – – – – – (1805.90) – – – (1805.90) (57.77) (1863.67)
Net gain/loss on transaction with
non-controlling interest – – – – – 262.85 – – – 262.85 (262.85) –
Increase in non-controlling interest
due to dilution/ divestment/
acquisition – – – – – – – – – – 928.48 928.48
Balance as at 31-3-2016 153.20 280.40 8164.72 282.22 2659.30 31724.59 609.59 44.01 76.03 43994.06 2892.84 46886.90

353
Consolidated Statement of Changes in Equity for the year ended March 31, 2017 (contd.)
(v crore)
Particulars Equity
component
of foreign
currency
convertible
bonds
Reserves and surplus Items of other comprehensive income Total other
equity
Non-
controlling
interest
Total
Capital
reserve
Securities
premium
account
Employee
share
options
(net)
Statutory
reserves
Retained
earnings
Foreign
currency
transla-
tion
reserve
Hedging
reserve
Debt
instruments
through other
comprehensive
income
Balance as at 1-4-2016 153.20 280.40 8164.72 282.22 2659.30 31724.59 609.59 44.01 76.03 43994.06 2892.84 46886.90
Profit for the year (c) – – – – – 6041.23 – – – 6041.23 444.27 6485.50
Other comprehensive income (d) – – – – – (20.72) (131.35) 303.51 (5.06) 146.38 31.40 177.78
Total comprehensive income for the year (c+d) – – – – – 6020.51 (131.35) 303.51 (5.06) 6187.61 475.67 6663.28
Issue of equity shares – – 154.18 – – – – – – 154.18 – 154.18
Share issue expenses (0.05) (0.05) (0.05)
Impact of business combination – (0.12) – – – – – – (0.12) – (0.12)
Transfer from/(to) retained earnings
during the year – – – (21.86) 83.00 (61.14) – – – – – –
Employee share options (net) – – – 42.89 – – – – – 42.89 19.96 62.85
Income tax charged against
retained earnings – – – – – (0.30) – – – (0.30) – (0.30)
Dividend paid for the previous year
(including tax on dividend) – – – – – (2070.00) – – – (2070.00) (92.14) (2162.14)
Net gain/loss on transaction with
non-controlling interest – – – – – 1721.66 – – – 1721.66 (1721.66) –
Increase in non-controlling interest
due to dilution/ divestment/
acquisition – – – – – – – – – – 1988.93 1988.93
Balance as at 31-3-2017 153.20 280.28 8318.85 303.25 2742.30 37335.32 478.24 347.52 70.97 50029.93 3563.60 53593.53
In terms of our report attachedFor DELOITTE HASKINS & SELLS LLPChartered AccountantsFirm’s Registration No.117366W/W-100018 A. M. NAIK
Group Executive Chairman
(DIN 00001514)
by the hand of
P. R. RAMESHPartner R. SHANKAR RAMAN M. DAMODARAN M.M.CHITALEMembership No. 70928 Chief Financial Officer &
Whole-time Director (DIN 02106990) (DIN 00101004)
(DIN 00019798) For SHARP & TANNANChartered Accountants SUBODH BHARGAVA SUNITA SHARMA SUSHOBHAN SARKERFirm’s Registration No.109982W (DIN 00035672) (DIN 02949529) (DIN 00088276)by the hand of
FIRDOSH D. BUCHIA N.HARIHARAN VIKRAM SINGH MEHTA SANJEEV AGAPartner Company Secretary (DIN 00041197) (DIN 00022065)Membership No. 038332 M. No. A3471
DirectorsMumbai, May 29, 2017

354
Consolidated Statement of Cash Flows for the year ended March 31, 2017
2016-17 2015-16
v crore v crore
A. Cash flow from operating activities:
Profit before tax (excluding non-controlling interest and exceptional items) 8765.93 7925.40
Adjustments for:
Dividend received (748.63) (196.12)
Depreciation, amortisation, impairment and obsolescence 2369.93 1786.73
Exchange difference on items grouped under financing/investing activities (80.51) 45.56
Effect of exchange rate changes on cash and cash equivalents 34.92 (7.42)
Interest expense 1339.84 1655.06
Interest income (422.62) (426.85)
(Profit)/loss on sale of property, plant and equipment (net) (17.88) (60.55)
(Profit)/loss on sale/fair valuation of investments (net) (34.22) (65.73)
(Profit)/loss on sale of stake in subsidiary and joint venture companies of Developmental Projects and Realty Segments (95.81) (236.53)
Employee stock option-discount forming part of employee benefits expense 88.17 65.33
Operating profit before working capital changes 11199.12 10484.88
Adjustments for:
(Increase)/decrease in trade and other receivables (2078.84) (9449.56)
(Increase)/decrease in inventories 1509.77 216.60
Increase/(decrease) in trade payables and customer advances 4550.32 9308.11
Cash generated from operations before financing activities 15180.37 10560.03
(Increase)/decrease in loans and advances towards financing activities (5743.85) (10584.93)
Cash generated from operations 9436.52 (24.90)
Direct taxes refund/(paid) [net] (3201.67) (3214.69)
Net cash (used in)/from operating activities 6234.85 (3239.59)
B. Cash flow from investing activities:
Purchase of fixed assets (2978.71) (4321.63)
Sale of fixed assets (including advance received) 156.33 198.25
Purchase of non-current investments (1551.99) (575.05)
Sale of non-current investments 67.00 333.08
(Purchase)/sale of current investments (net) (6273.01) (171.25)
Change in other bank balance and cash not available for immediate use (321.17) (909.11)
Investment in joint ventures (2010.36) -
Deposits/ loans made with associates, joint ventures and third parties (net) (212.35) (242.25)
Interest received 408.84 402.31
Dividend received from associates 0.57 16.93
Dividend received from other investments 748.63 196.12
Consideration received on transfer of foundry business unit 83.65 79.70
Consideration received on disposal of subsidiaries (including advance received) 2169.01 410.30
Consideration received on disposal of joint venture – 21.54
Consideration paid on acquisition of subsidiaries (7.07) (32.36)
Cash & cash equivalents discharged pursuant to disposal of subsidiaries/joint ventures (19.61) (33.14)
Net cash (used in)/from investing activities (9740.24) (4626.56)

355
Consolidated Statement of Cash Flows for the year ended March 31, 2017 (contd.)
2016-17 2015-16
v crore v croreC. Cash flow from financing activities:
Proceeds from issue of share capital 53.32 70.19 Proceeds from non-current borrowings 30900.44 30224.75 Repayment of non-current borrowings (27531.88) (19753.06)Proceeds from other borrowings (net) 1704.64 44.07 Payment (to)/from non controling interest (net)- including sale proceeds on divestment of part stake in subsidiary companies 2058.82 970.58 Dividends paid (1701.51) (1512.33)Additional tax on dividend (391.54) (329.91)Interest paid (including cash flows from interest rate swaps) (1565.20) (2461.59)
Net cash (used in)/from financing activities 3527.09 7252.70
Net (decrease)/increase in cash and cash equivalents (A + B + C) 21.70 (613.45)Cash and cash equivalents at beginning of the year 3789.51 4402.96
Cash and cash equivalents at end of the year 3811.21 3789.51
Notes:1. Statement of Cash Flows has been prepared under the indirect method as set out in the Indian Accounting Standard (Ind AS) 7
“Statement of Cash Flows” as specified in the Companies (Indian Accounting Standards) Rules, 2015.
2. Purchase of fixed assets represents additions to property, plant & equipment, investment property and intangible assets adjusted for movement of (a) capital work in progress for property, plant & equipment and investment property and (b) Intangible assets under development during the year.
3. Cash and cash equivalents included in the Statement of Cash Flows comprise the following :
2016-17 2015-16
v crore v crore(a) Cash and cash equivalents disclosed under current assets [Note 14] 3793.33 3806.54 (b) Other bank balances disclosed under current assets [Note 15] 1779.16 1583.37 (c) Cash and cash equivalents disclosed under non-current assets [Note 9] 223.56 98.18
Total Cash and cash equivalents as per Balance Sheet 5796.05 5488.09
Add: (i) Unrealised exchange (gain)/loss on cash and cash equivalents 17.88 (17.03)Less: (ii) Other bank balances disclosed under current assets [Note 15] 1779.16 1583.37 Less: (iii) Cash and cash equivalents disclosed under non-current assets [Note 9] 223.56 98.18
Total Cash and cash equivalents as per Statement of Cash Flows 3811.21 3789.51
4. Previous year’s figures have been regrouped/reclassified wherever applicable.
In terms of our report attachedFor DELOITTE HASKINS & SELLS LLPChartered AccountantsFirm’s Registration No.117366W/W-100018 A. M. NAIK
Group Executive Chairman (DIN 00001514)
by the hand of
P. R. RAMESHPartner R. SHANKAR RAMAN M. DAMODARAN M.M.CHITALEMembership No. 70928 Chief Financial Officer &
Whole-time Director (DIN 02106990) (DIN 00101004)
(DIN 00019798) For SHARP & TANNANChartered Accountants SUBODH BHARGAVA SUNITA SHARMA SUSHOBHAN SARKERFirm’s Registration No.109982W (DIN 00035672) (DIN 02949529) (DIN 00088276)by the hand of
FIRDOSH D. BUCHIA N.HARIHARAN VIKRAM SINGH MEHTA SANJEEV AGAPartner Company Secretary (DIN 00041197) (DIN 00022065)Membership No. 038332 M. No. A3471
DirectorsMumbai, May 29, 2017

356
NOTE [1]
Significant Accounting Policies
(a) Statement of compliance
The Group’s financial statements have been prepared in accordance with the provisions of the Companies Act, 2013 and the Indian Accounting Standards (Ind AS) notified under the Companies (Indian Accounting Standards) Rules, 2015 issued by Ministry of Corporate Affairs in exercise of the powers conferred by section 133 read with sub-section (1) of section 210A of the Companies Act, 1956. In addition, the guidance notes/announcements issued by the Institute of Chartered Accountants of India (ICAI) are
also applied except where compliance with other statutory promulgations require a different treatment. The financials for the year ended March 31, 2017 of the Group are the first financial statements prepared in compliance with Ind AS. The date of transition to Ind AS is April 1, 2015. The financial statements upto the year ended March 31, 2016, were prepared in accordance with the accounting standards notified under the Companies (Accounting Standards) Rules, 2006 ( “I-GAAP”) and other relevant provisions
of the Act. The figures for the year ended March 31, 2016 have now been restated under Ind AS to provide comparability. These financials statements have been approved for issue by the Board of Directors at their meeting held on May 29, 2017.
(b) Basis of accounting
The Group maintains its accounts on accrual basis following historical cost convention, except for certain financial instruments that are measured at fair value in accordance with Ind AS and certain items of property, plant and equipment that were revalued
in earlier year in accordance with the I-GAAP principles. The carrying value of all the items of property, plant and equipment as on the date of transition is considered as the deemed cost.
Fair value measurements under Ind AS are categorised as below based on the degree to which the inputs to the fair value measurements are observable and the significance of the inputs to the fair value measurement in its entirety:
• Level 1 inputs are quoted prices (unadjusted) in active markets for identical assets or liabilities that the Group can access at
measurement date
• Level 2 inputs are inputs, other than quoted prices included in level 1, that are observable for the asset or liability, either
directly or indirectly; and
• Level 3 inputs are unobservable inputs for the valuation of assets or liabilities
(c) Presentation of financial statements
The Balance Sheet and the Statement of Profit and Loss are prepared and presented in the format prescribed in the Schedule III to the Companies Act, 2013 (“the Act”). The Statement of Cash Flows has been prepared and presented as per the requirements
of Ind AS 7 “Statement of Cash Flows”. The disclosure requirements with respect to items in the Balance Sheet and Statement of Profit and Loss, as prescribed in the Schedule III to the Act, are presented by way of notes forming part of the financial statements along with the other notes required to be disclosed under the notified Accounting Standards and the SEBI (Listing Obligations and
Disclosure Requirements) Regulations, 2015.
Amounts in the financial statements are presented in Indian Rupees in crore [1 crore = 10 million] rounded off to two decimal
places as permitted by Schedule III to the Companies Act, 2013. Per share data are presented in Indian Rupees to two decimal places.
(d) Basis of consolidation
(i) The consolidated financial statements incorporate the financial statements of the Parent Company and its subsidiaries. For
this purpose, an entity which is, directly or indirectly, controlled by the Parent Company is treated as subsidiary. The Parent Company together with its subsidiaries constitute the Group. Control exists when the Parent Company, directly or indirectly, has power over the investee, is exposed to variable returns from its involvement with the investee and has the ability to use its power to affect its returns.
(ii) Consolidation of a subsidiary begins when the Parent Company, directly or indirectly, obtains control over the subsidiary and
ceases when the Parent Company, directly or indirectly, loses control of the subsidiary. Income and expenses of a subsidiary acquired or disposed off during the year are included in the consolidated Statement of Profit and Loss from the date the Parent Company, directly or indirectly, gains control until the date when the Parent Company, directly or indirectly, ceases to control the subsidiary.
(iii) The consolidated financial statements of the Group combines financial statements of the Parent Company and its subsidiaries
line-by-line by adding together the like items of assets, liabilities, income and expenses. All intra-group assets, liabilities, income, expenses and unrealised profits/losses on intra-group transactions are eliminated on consolidation. The accounting
Notes forming part of the Consolidated Financial Statements
357
policies of subsidiaries have been harmonised to ensure the consistency with the policies adopted by the Parent Company. The consolidated financial statements have been presented to the extent possible, in the same manner as Parent Company’s standalone financial statements.
Profit or loss and each component of other comprehensive income are attributed to the owners of the Parent Company and to the non-controlling interests and have been shown separately in the financial statements.
(iv) Non-controlling interest represents that part of the total comprehensive income and net assets of subsidiaries attributable to interests which are not owned, directly or indirectly, by the Parent Company.
(v) The gains/losses in respect of part divestment/dilution of stake in subsidiary companies not resulting in ceding of control, are recognised directly in other equity attributable to the owners of the Parent Company.
(vi) The gains/losses in respect of divestment of stake resulting in ceding of control in subsidiary companies are recognised in the Statement of Profit and Loss. The investment representing the interest retained in a former subsidiary, if any, is initially recognised at its fair value with the corresponding effect recognised in the Statement of Profit and Loss as on the date the
control is ceded. Such retained interest is subsequently accounted as an associate or a joint venture or a financial asset.
(e) Investments in joint venture and associates
When the Group has with other parties joint control of the arrangement and rights to the net assets of the joint arrangement, it recognises its interest as joint venture. Joint control exists when the decisions about the relevant activities require unanimous consent of the parties sharing the control. When the Group has significant influence over the other entity, it recognises such
interests as associates. Significant influence is the power to participate in the financial and operating policy decisions of the entity but is not control or joint control over the entity.
The results, assets and liabilities of joint venture and associates are incorporated in the consolidated financial statements using equity method of accounting after making necessary adjustments to achieve uniformity in application of accounting policies, wherever applicable. An investment in associate or joint venture is initially recognised at cost and adjusted thereafter to recognise
the Group’s share of profit or loss and other comprehensive income of the joint venture or associate. Gain or loss in respect of changes in other equity of joint ventures or associates resulting in dilution of stake in the joint ventures and associates is
recognised in the Statement of Profit and Loss. On acquisition of investment in a joint venture or associate, any excess of cost of investment over the fair value of the assets and liabilities of the joint venture, is recognised as goodwill and is included in the carrying value of the investment in the joint venture and associate. The excess of fair value of assets and liabilities over the
investment is recognised directly in equity as capital reserve. The unrealised profits/losses on transactions with joint ventures are eliminated by reducing the carrying amount of investment.
The carrying amount of investment in joint ventures and associates is reduced to recognise impairment, if any, when there is objective evidence of impairment.
When the Group’s share of losses of an associate or a joint venture exceeds the Group’s interest in that associate or joint venture
(which includes any long term interests that, in substance, form part of the Group’s net investment in the associate or joint venture), the Group discontinues recognising its share of further losses. Additional losses are recognised only to the extent that the Group has incurred legal or constructive obligations or made payments on behalf of the associate or joint venture.
(f) Interests in joint operations
When the Group has joint control of the arrangement based on contractually determined right to the assets and obligations for
liabilities, it recognises such interests as joint operations. Joint control exists when the decisions about the relevant activities require unanimous consent of the parties sharing the control. In respect of its interests in joint operations, the Group recognises its share in assets, liabilities, income and expenses line-by-line in the standalone financial statements of the entity which is party to such joint arrangement which then becomes part of the consolidated financial statements of the Group when the financial statements of the Parent Company and its subsidiaries are combined for consolidation. Interests in joint operations are included in the
segments to which they relate.
(g) Goodwill on consolidation
Goodwill on consolidation as on the date of transition represents the excess of cost of acquisition at each point of time of making the investment in the subsidiary over the Group’s share in the net worth of a subsidiary. For this purpose, the Group’s share of net worth is determined on the basis of the latest financial statements, prior to the acquisition, after making necessary adjustments for material events between the date of such financial statements and the date of respective acquisition. Capital reserve on
Notes forming part of the Consolidated Financial Statements (contd.)
NOTE [1] (contd.)

358
consolidation represents excess of the Group’s share in the net worth of a subsidiary over the cost of acquisition at each point of time of making the investment in the subsidiary. Goodwill arising on consolidation is not amortised, however, it is tested for impairment annually. In the event of cessation of operations of a subsidiary, the unimpaired goodwill is written off fully.
Goodwill on consolidation arising on acquisitions on or after the date of transition represents the excess of the cost of acquisition at each point of time of making the investment in the subsidiary, over the Group’s share in the fair value of the net assets of a subsidiary.
Goodwill on consolidation is allocated to cash generating units or group of cash generating units that are expected to benefit from
the synergies of the acquisition.
(h) Operating cycle for current and non-current classification
Operating cycle for the business activities of the Group covers the duration of the specific project/contract/product line/service including the defect liability period, wherever applicable and extends up to the realisation of receivables (including retention monies) within the agreed credit period normally applicable to the respective lines of business.
(i) Revenue recognition
Revenue is recognised based on nature of activity when consideration can be reasonably measured and recovered with reasonable
certainty. Revenue is measured at the fair value of the consideration received or receivable and is reduced for estimated customer returns, rebates and other similar allowances.
(i) Revenue from operations
Revenue includes excise duty and adjustments made towards liquidated damages and price variation wherever applicable. Escalation and other claims, which are not ascertainable/acknowledged by customers are not taken into account.
A. Sale of goods
Revenue from sale of manufactured and traded goods is recognised when the goods are delivered and titles have passed, provided all the following conditions are satisfied:
1. significant risks and rewards of ownership of the goods are transferred to the buyer;
2. the Group retains neither continuing managerial involvement to the degree usually associated with ownership nor
effective control over the good sold;
3. the amount of revenue can be measured reliably;
4. it is probable that the economic benefits associated with the transaction will flow to the Group; and
5. the costs incurred or to be incurred in respect of the transaction can be measured reliably
B. Revenue from construction/project related activity and contracts for supply/commissioning of complex plant and equipment is recognised as follows:
1. Cost plus contracts: Revenue from cost plus contracts is recognised by reference to the recoverable costs incurred during the period plus the margin as agreed with the customer.
2. Fixed price contracts: Contract revenue is recognised only to the extent of cost incurred till such time the outcome of the job cannot be ascertained reliably subject to the condition that it is probable such cost will be recoverable. When the outcome of the contract is ascertained reliably, contract revenue is recognised at cost of work performed on the contract plus proportionate margin, using the percentage of completion method. Percentage of completion is the proportion of cost of work performed to-date, to the total estimated contract costs.
The estimated outcome of a contract is considered reliable when all the following conditions are satisfied:
i. the amount of revenue can be measured reliably;
ii. it is probable that the economic benefits associated with the contract will flow to the Group;
iii. the stage of completion of the contract at the end of the reporting period can be measured reliably; and
iv. the costs incurred or to be incurred in respect of the contract can be measured reliably
Notes forming part of the Consolidated Financial Statements (contd.)
NOTE [1] (contd.)

359
Expected loss, if any, on a contract is recognised as expense in the period in which it is foreseen, irrespective of the stage of completion of the contract.
For contracts where progress billing exceeds the aggregate of contract costs incurred to date plus recognised profits (or
recognised losses as the case may be), the surplus is shown as the amount due to customers. Amounts received before the related work is performed are included in the consolidated Balance Sheet, as a liability towards advance received. Amount billed for work performed but yet to be paid by the customer are disclosed in the consolidated Balance Sheet as trade receivables. The amount of retention money held by the customers is disclosed as part of other current assets and
is reclassified as trade receivables when it becomes due for payment.
C. Revenue from construction/project related activity and contracts executed in joint arrangements under work-sharing
arrangement [being joint operations, in terms of Ind AS 111 “Joint Arrangements”], is recognised on the same basis as adopted in respect of contracts independently executed by the Group.
D. Revenue from property development activity which are in substance similar to delivery of goods is recognised when all
significant risks and rewards of ownership in the land and/or building are transferred to the customer and a reasonable expectation of collection of the sale consideration from the customer exists.
Revenue from those property development activities in the nature of a construction contract is recognised based on the ‘Percentage of completion method’ (POC) when the outcome of the contract can be estimated reliably upon fulfillment of all the following conditions:
1. all critical approvals necessary for commencement of the project have been obtained;
2. contract costs for work performed (excluding cost of land/developmental rights and borrowing cost) constitute at
least 25% of the estimated total contract costs representing a reasonable level of development ;
3. at least 25% of the saleable project area is secured by contracts or agreements with buyers; and
4. at least 10% of the total revenue as per the agreements of sale or any other legally enforceable documents is
realised at the reporting date in respect of each of the contracts and the parties to such contracts can be reasonably expected to comply with the contractual payment terms.
The costs incurred on property development activities are carried as “Inventories” till such time the outcome of the project cannot be estimated reliably and all the aforesaid conditions are fulfilled. When the outcome of the project can be ascertained reliably and all the aforesaid conditions are fulfilled, revenue from property development activity
is recognised at cost incurred plus proportionate margin, using percentage of completion method. Percentage of completion is determined based on the proportion of actual cost incurred to the total estimated cost of the project.
For the purpose of computing percentage of construction, cost of land, developmental rights and borrowing costs are excluded.
Expected loss, if any, on the project is recognised as an expense in the period in which it is foreseen, irrespective of the
stage of completion of the contract.
In the case of the developmental project business and the realty business, revenue includes profit on sale of stake in the subsidiary and/or joint venture companies as the divestments are inherent in the business model.
E. Rendering of services
Revenue from rendering services is recognised when the outcome of a transaction can be estimated reliably by reference
to the stage of completion of the transaction. The outcome of a transaction can be estimated reliably when all the following conditions are satisfied:
1. the amount of revenue can be measured reliably;
2. it is probable that the economic benefits associated with the transaction will flow to the Group;
3. the stage of completion of the transaction at the end of the reporting period can be measured reliably; and
4. the costs incurred or to be incurred in respect of the transaction can be measured reliably
Stage of completion is determined by the proportion of actual costs incurred to date to the estimated total costs of the transaction. Unbilled revenue represents value of services performed in accordance with the contract terms but not billed.
Notes forming part of the Consolidated Financial Statements (contd.)
NOTE [1] (contd.)

360
In respect of information technology (IT) business and technology services business, revenue from contracts awarded on time and material basis is recognised when services are rendered and related costs are incurred. Revenue from fixed price contracts is recognised using the proportionate completion method.
F. Revenue from contracts for rendering of engineering design services and other services which are directly related to the construction of an asset is recognised on similar basis as stated in (i) B above.
G. Income from hire purchase and lease transactions is accounted on accrual basis, pro-rata for the period, at the rates implicit in the transaction. Income from bill discounting, advisory and syndication services and other financing activities
is accounted on accrual basis. Income from interest-bearing assets is recognised on accrual basis over the life of the asset based on the constant effective yield.
H. Revenue on account of construction services rendered in connection with Build-Operate-Transfer (BOT) projects undertaken by the Group is recognised during the period of construction using percentage of completion method. After the completion of construction period, revenue relatable to toll collections of such projects from users of facilities are
accounted when the amount is due and recovery is certain. License fees for way-side amenities are accounted on accrual basis.
I. Commission income is recognised as and when the terms of the contract are fulfilled.
J. Income from investment management fees is recognised in accordance with the contractual terms and the SEBI regulations based on average Assets Under Management (AUM) of mutual fund schemes over the period of the
agreement in terms of which services are performed. Portfolio management fees are recognised in accordance with the related contracts entered with the clients over the period of the agreement. Trusteeship fees are accounted on accrual
basis.
K. Revenue from port operation services is recognised on completion of respective services or as per terms agreed with the port operator, wherever applicable.
L. Revenue from charter hire is recognised based on the terms of the time charter agreement.
M. Revenue from operation and maintenance services of power plant receivable under the Power Purchase Agreement is
recognised on accrual basis.
N. Other operational revenue:
Other operational revenue represents income earned from the activities incidental to the business and is recognised
when the right to receive the income is established as per the terms of the contract.
(ii) Other income
A. Interest income is accrued on a time basis by reference to the principal outstanding and the effective interest rate.
B. Dividend income is accounted in the period in which the right to receive the same is established.
C. Other Government grants, which are revenue in nature and are towards compensation for the qualifying costs, incurred
by the Group, are recognised as income in the Statement of Profit and Loss in the period in which such costs are incurred.
D. Other items of income are accounted as and when the right to receive arises and it is probable that the economic benefits will flow to the group and the amount of income can be measured reliably.
(j) Exceptional items
An item of income or expense which its size, type or incidence requires disclosure in order to improve an understanding of the performance of the Group is treated as an exceptional item and the same is disclosed in the notes to accounts.
(k) Property, plant and equipment (PPE)
PPE is recognised when it is probable that future economic benefits associated with the item will flow to the Group and the cost of the item can be measured reliably. PPE is stated at original cost net of tax/duty credits availed, if any, less accumulated depreciation
and cumulative impairment, if any. PPE acquired on hire purchase basis are recognised at their cash values. Cost includes professional fees related to the acquisition of PPE and, for qualifying assets, borrowing costs capitalised in accordance with the Group’s accounting policy.
Notes forming part of the Consolidated Financial Statements (contd.)
NOTE [1] (contd.)

361
For transition to Ind AS, the group has elected to adopt as deemed cost, the carrying value of PPE measured as per I-GAAP less accumulated depreciation and cumulative impairment on the transition date of April 1, 2015. In respect of revalued assets, the value as determined by valuers as reduced by accumulated depreciation and cumulative impairment is taken as cost on transition
date.
Own manufactured PPE is capitalised at cost including an appropriate share of overheads. Administrative and other general overhead expenses that are specifically attributable to construction or acquisition of PPE or bringing the PPE to working condition are allocated and capitalised as a part of the cost of the PPE.
PPE not ready for the intended use on the date of the Balance Sheet are disclosed as “capital work-in-progress”. (Also refer to policy on leases, borrowing costs, impairment of assets and foreign currency transactions below).
Depreciation is recognised using straight line method so as to write off the cost of the assets (other than freehold land and properties under construction) less their residual values over their useful lives specified in Schedule II to the Companies Act, 2013, or in case of assets where the useful life was determined by technical evaluation, over the useful life so determined. Depreciation
method is reviewed at each financial year end to reflect expected pattern of consumption of the future economic benefits embodied in the asset. The estimated useful life and residual values are also reviewed at each financial year end with the effect of
any change in the estimates of useful life/residual value is accounted on prospective basis.
Where cost of a part of the asset (“asset component”) is significant to total cost of the asset and useful life of that part is different from the useful life of the remaining asset, useful life of that significant part is determined separately and such asset component is
depreciated over its separate useful life.
Depreciation for additions to/deductions from, owned assets is calculated pro rata to the period of use. Extra shift depreciation is
provided on a location basis at rates specified in Schedule II to the Companies Act, 2013.
Depreciation charge for impaired assets is adjusted in future periods in such a manner that the revised carrying amount of the asset is allocated over its remaining useful life.
Assets acquired under finance leases are depreciated on a straight line basis over the lease term. Where there is reasonable certainty that the Group shall obtain ownership of the assets at the end of the lease term, such assets are depreciated based on
the useful life prescribed under Schedule II to the Companies Act, 2013 or based on the useful life adopted by the Group for similar assets.
Freehold land is not depreciated.
(l) Investment property
Properties (including those under construction) held to earn rentals and/or capital appreciation are classified as investment property and are measured and reported at cost, including transaction costs.
For transition to Ind AS, the group has elected to adopt as deemed cost, the carrying value of investment property as per I-GAAP less accumulated depreciation and cumulative impairment on the transition date of April 1, 2015. In respect of revalued assets, the
value as determined by valuers as reduced by accumulated depreciation and cumulative impairment is taken as cost on transition date.
Depreciation is recognised using straight line method so as to write off the cost of the investment property less their residual values over their useful lives specified in Schedule II to the Companies Act, 2013, or in the case of assets where the useful life was determined by technical evaluation, over the useful life so determined. Depreciation method is reviewed at each financial year end
to reflect the expected pattern of consumption of the future benefits embodied in the investment property. The estimated useful life and residual values are also reviewed at each financial year end and the effect of any change in the estimates of useful life/residual value is accounted on prospective basis. Freehold land and properties under construction are not depreciated.
An investment property is derecognised upon disposal or when the investment property is permanently withdrawn from use and no future economic benefits are expected from the disposal. Any gain or loss arising on de-recognition of property is recognised in
the Statement of Profit and Loss in the same period.
(m) Intangible assets
Intangible assets are recognised when it is probable that the future economic benefits that are attributable to the asset will flow to the enterprise and the cost of the asset can be measured reliably. Intangible assets are stated at original cost net of tax/duty credits availed, if any, less accumulated amortisation and cumulative impairment. Administrative and other general overhead
Notes forming part of the Consolidated Financial Statements (contd.)
NOTE [1] (contd.)

362
expenses that are specifically attributable to acquisition of intangible assets are allocated and capitalised as a part of the cost of the intangible assets.
Research and development expenditure on new products:
(i) Expenditure on research is expensed under respective heads of account in the period in which it is incurred.
(ii) Development expenditure on new products is capitalised as intangible asset, if all of the following can be demonstrated:
A. the technical feasibility of completing the intangible asset so that it will be available for use or sale;
B. the Group has intention to complete the intangible asset and use or sell it;
C. the Group has ability to use or sell the intangible asset;
D. the manner in which the probable future economic benefits will be generated including the existence of a market for
output of the intangible asset or intangible asset itself or if it is to be used internally, the usefulness of intangible assets;
E. the availability of adequate technical, financial and other resources to complete the development and to use or sell the intangible asset; and
F. the Group has ability to reliably measure the expenditure attributable to the intangible asset during its development.
Development expenditure that does not meet the above criteria is expensed in the period in which it is incurred.
Intangible assets not ready for the intended use on the date of the Balance Sheet are disclosed as “intangible assets under development”.
Intangible assets are amortised on straight line basis over the estimated useful life. The method of amortisation and useful life are
reviewed at the end of each accounting year with the effect of any changes in the estimate being accounted for on a prospective basis. The estimated useful life for major categories of the intangible assets are as follows:
(i) specialised software: over a period of three to ten years;
(ii) technical know-how: over a period of three to seven years;
(iii) development costs for new products: over a period of five years;
(iv) customer contracts and relationships: over a period of the contract which generally is over seven to ten years;
(v) intangible assets with indefinite useful life that are acquired separately are carried at cost less accumulated impairment losses;
(vi) fare collection rights obtained in consideration for rendering construction services represent the right to collect fare during the concession period in respect of Build-Operate-Transfer (BOT) projects undertaken by the Group. Fare collection rights are capitalised as intangible asset upon completion of the project at the cumulative construction costs including related margins.
Till the completion of the project, the same is recognised as intangible assets under development. Fare collection rights are amortised using the straight line method over the period of concession; and
(vii) exploration and evaluation expenditure incurred for potential mineral reserves is recognised and reported as part of “intangible assets under development” under “intangible assets” when such costs are expected to be either recouped in full through successful exploration and development of the area of interest or alternatively, by its sale; or when exploration
and evaluation activities in the area of interest have not yet reached a stage which permits a reasonable assessment of the existence or otherwise of economically available reserves and active and significant operations in relation to the area are continuing or are planned for the future. Exploration assets are re-assessed on a regular basis and these costs are carried forward provided that at least one of the conditions outlined above is met. All other exploration and evaluation expenditure is recognised as expense in the period in which it is incurred.
Amortisation on impaired assets is provided by adjusting the amortisation charge in the remaining periods so as to allocate the asset’s revised carrying amount over its remaining useful life.
(n) Impairment of assets
As at the end of each accounting year, the Group reviews the carrying amounts of its PPE, investment property and intangible assets to determine whether there is any indication that those assets have suffered an impairment loss. If such indication exists, the
Notes forming part of the Consolidated Financial Statements (contd.)
NOTE [1] (contd.)

363
PPE, investment property and intangible assets are tested for impairment so as to determine the impairment loss, if any. Goodwill and the intangible assets with indefinite life are tested for impairment each year.
Impairment loss is recognised when the carrying amount of an asset exceeds its recoverable amount. Recoverable amount is
determined:
(i) in the case of an individual asset, at the higher of the net selling price and the value in use; and
(ii) in the case of a cash generating unit (the smallest identifiable group of assets that generates independent cash flows), at the higher of the cash generating unit’s net selling price and the value in use.
(The amount of value in use is determined as the present value of estimated future cash flows from the continuing use of an asset and from its disposal at the end of its useful life. For this purpose, the discount rate (pre-tax) is determined based on the weighted
average cost of capital of the company suitably adjusted for risks specified to the estimated cash flows of the asset).
If recoverable amount of an asset (or cash generating unit) is estimated to be less than its carrying amount, such deficit is recognised immediately in the Statement of Profit and Loss as impairment loss and the carrying amount of the asset (or cash
generating unit) is reduced to its recoverable amount. For this purpose, the impairment loss recognised in respect of a cash generating unit is allocated first to reduce the carrying amount of any goodwill allocated to such cash generating unit and then to
reduce the carrying amount of the other assets of the cash generating unit on a pro-rata basis.
When an impairment loss subsequently reverses, the carrying amount of the asset (or cash generating unit), except for allocated goodwill, is increased to the revised estimate of its recoverable amount, but so that the increased carrying amount does not exceed
the carrying amount that would have been determined had no impairment loss is recognised for the asset (or cash generating unit) in prior years. A reversal of an impairment loss (other than impairment loss allocated to goodwill) is recognised immediately in the
Statement of Profit and Loss.
(o) Employee benefits
(i) Short term employee benefits:
Employee benefits such as salaries, wages, short term compensated absences, expected cost of bonus, ex-gratia, and performance linked rewards falling due wholly within twelve months of rendering the service are classified as short term
employee benefits and are expensed in the period in which the employee renders the related service.
(ii) Post-employment benefits:
A. Defined contribution plans: The Group’s superannuation scheme, state governed provident fund scheme, employee state
insurance scheme and employee pension scheme are defined contribution plans. The contribution paid/payable under
the schemes is recognised during the period in which the employee renders the related service.
B. Defined benefit plans: The employees’ gratuity fund schemes and employee provident fund schemes managed by board of trustees established by the company, the post-retirement medical care plan and the Parent Company pension plan represent defined benefit plans. The present value of the obligation under defined benefit plans is determined based on
actuarial valuation using the Projected Unit Credit Method.
The obligation is measured at the present value of the estimated future cash flows using a discount rate based on the market yield on government securities of a maturity period equivalent to the weighted average maturity profile of the defined benefit obligations at the Balance Sheet date.
Remeasurement, comprising actuarial gains and losses, the return on plan assets (excluding amounts included in net interest
on the net defined benefit liability or asset) and any change in the effect of asset ceiling (if applicable) is recognised in other comprehensive income and is reflected in retained earnings and the same is not eligible to be reclassified to profit or loss.
Defined benefit costs comprising current service cost, past service cost and gains or losses on settlements are recognised in the Statement of Profit and Loss as employee benefit expenses. Interest cost implicit in defined benefit employee cost is recognised in the Statement of Profit and Loss under finance cost. Gains or losses on settlement of any defined benefit plan
are recognised when the settlement occurs. Past service cost is recognised as expense at the earlier of the plan amendment or curtailment and when the Group recognises related restructuring costs or termination benefits.
In case of funded plans, the fair value of the plan assets is reduced from the gross obligation under the defined benefit plans to recognise the obligation on a net basis.
Notes forming part of the Consolidated Financial Statements (contd.)
NOTE [1] (contd.)

364
(iii) Long term employee benefits:
The obligation recognised in respect of long term benefits such as long term compensated absences, long service award etc. is measured at present value of estimated future cash flows expected to be made by the Group and is recognised in a similar
manner as in the case of defined benefit plans vide (ii) B above.
Long term employee benefit costs comprising current service cost and gains or losses on curtailments and settlements, remeasurements including actuarial gains and losses are recognised in the Statement of Profit and Loss as employee benefit expenses. Interest cost implicit in long term employee benefit cost is recognised in the Statement of Profit and Loss under
finance cost.
(iv) Termination benefits:
Termination benefits such as compensation under employee separation schemes are recognised as expense when the company’s offer of the termination benefit is accepted or when the Group recognises the related restructuring costs whichever is earlier.
(p) Leases
The determination of whether an agreement is, or contains, a lease is based on the substance of the agreement at the date of
inception. Power generation projects executed under long term Power Purchase Agreements (PPA) with state utilities that are in substance finance leases are classified accordingly.
(i) Finance leases:
A. Leases where the Group has substantially transferred all the risks and rewards of ownership of the related assets are classified as finance leases. Assets under finance lease are capitalised at the commencement of the lease at the lower
of the fair value or the present value of minimum lease payments and a liability is created for an equivalent amount. Each lease rental paid is allocated between the liability and the interest cost, so as to obtain a constant periodic rate of interest on the outstanding liability for each period.
B. Assets given under a finance lease are recognised as a receivable at an amount equal to the net investment in the lease. Lease income is recognised over the period of the lease so as to yield a constant rate of return on the net investment in
the lease.
(ii) Operating leases:
The leases which are not classified as finance lease are operating leases.
A. Lease rentals on assets under operating lease are charged to the Statement of Profit and Loss on a straight line basis
over the term of the relevant lease.
B. Assets leased out under operating leases are continued to be shown under the respective class of assets. Rental income is recognised on a straight line basis over the term of the relevant lease.
(Also refer to policy on depreciation, above)
(q) Financial instruments
Financial assets and/or financial liabilities are recognised when the Group becomes party to a contract embodying the related financial instruments. All financial assets, financial liabilities and financial guarantee contracts are initially measured at transaction values and where such values are different from the fair value, at fair value. Transaction costs that are attributable to the acquisition or issue of financial assets and financial liabilities (other than financial assets and financial liabilities at fair value
through profit or loss) are added to or deducted from, as the case may be, the fair value of such financial assets or liabilities on initial recognition. Transaction costs directly attributable to the acquisition of financial assets or financial liabilities at fair value through profit or loss are recognised immediately in profit or loss.
A financial asset and a financial liability is offset and presented on net basis in the balance sheet when there is a current legally enforceable right to set-off the recognised amounts and it is intended to either settle on net basis or to realise the asset and settle
the liability simultaneously.
Notes forming part of the Consolidated Financial Statements (contd.)
NOTE [1] (contd.)

365
(i) Financial assets
A. All recognised financial assets are subsequently measured in their entirety at either amortised cost or fair value, depending on the classification of the financial assets as follows:
1. Investments in debt instruments that are designated as fair value through profit or loss (FVTPL) - at fair value
2. Other investments in debt instruments – at amortised cost, subject to following conditions:
• The asset is held within a business model whose objective is to hold assets in order to collect contractual cash flows; and
• The contractual terms of instrument give rise on specified dates to cash flows that are solely payments of principal and interest on the principal amount outstanding.
3. Debt instruments that meet the following conditions are subsequently measured at fair value through other comprehensive income [FVTOCI] (unless the same are designated as fair value through profit or loss)
• The asset is held within a business model whose objective is achieved both by collecting contractual cash flows
and selling financial assets; and
• The contractual terms of instrument give rise on specified dates to cash flows that are solely payments of
principal and interest on the principal amount outstanding.
4. Debt instruments at FVTPL is a residual category for debt instruments, if any, and all changes are recognised in profit or loss.
5. Investments in equity instruments are classified as FVTPL, unless the related instruments are not held for trading and the Group irrevocably elects on initial recognition to present subsequent changes in fair value in other
comprehensive income.
6. The group has elected to measure the investments in associates and joint ventures held through unit trusts at FVTPL.
B. For financial assets that are measured at FVTOCI, income by way of interest, dividend and exchange difference, if any, (on debt instrument) is recognised in profit or loss and changes in fair value (other than on account of such income) are
recognised in other comprehensive income and accumulated in other equity. On disposal of debt instruments at FVTOCI, the cumulative gain or loss previously accumulated in other equity is reclassified to profit or loss. In case of equity instruments at FVTOCI, such cumulative gain or loss is not reclassified to profit or loss on disposal of investments.
C. A financial asset is primarily derecognised when:
1. the right to receive cash flows from the asset has expired, or
2. the group has transferred its rights to receive cash flows from the asset or has assumed an obligation to pay the received cash flows in full without material delay to a third party under a pass-through arrangement; and a) the group has transferred substantially all the risks and rewards of the asset, or b) the group has neither transferred nor
retained substantially all the risks and rewards of the asset, but has transferred control of the asset.
On derecognition of a financial asset in its entirety, the difference between the carrying amount measured at the date of derecognition and the consideration received is recognised in profit or loss.
D. Impairment of financial assets: The Group recognises impairment loss on trade receivables using expected credit loss model which involves use of a provision matrix constructed on the basis of historical credit loss experience as permitted
under Ind AS 109.
In respect of financial services business, the Group applies a separate model of the expected credit loss for recognising impairment loss on financial assets measured at amortised cost, debt instruments at FVTOCI, lease receivables, trade receivables and other contractual rights to receive cash or other financial asset, and financial guarantees not designated as at FVTPL as follows:
• Expected credit losses are the weighted average of credit losses with the respective risks of default occurring as the weights. Credit loss is the difference between all contractual cash flows that are due to the Group in accordance with the contract and all the cash flows that the Group expects to receive (i.e. all cash shortfalls), discounted at the original effective interest rate (or credit-adjusted effective interest rate for purchased or originated credit-impaired financial assets). The Group estimates cash flows by considering all contractual terms of the financial instrument (for example, prepayment, extension, call and similar options) through the expected life of that financial instrument.
Notes forming part of the Consolidated Financial Statements (contd.)
NOTE [1] (contd.)

366
• The Group measures the loss allowance for a financial instrument at an amount equal to the lifetime expected credit losses if the credit risk on that financial instrument has increased significantly since initial recognition. If the credit risk on a financial instrument has not increased significantly since initial recognition, the Group measures the loss allowance for that financial instrument at an amount equal to 12-month expected credit losses. 12-month expected credit losses
are portion of the lifetime expected credit losses and represent the lifetime cash shortfalls that will result if default occurs within the 12 months after the reporting date and thus, are not cash shortfalls that are predicted over the next 12 months.
• When making the assessment of whether there has been a significant increase in credit risk since initial recognition,
the Group uses the change in the risk of a default occurring over the expected life of the financial instrument instead of the change in the amount of expected credit losses. To make that assessment, the Group compares the risk of a
default occurring on the financial instrument as at the reporting date with the risk of a default occurring on the financial instrument as at the date of initial recognition and considers reasonable and supportable information, that is available without undue cost or effort, that is indicative of significant increases in credit risk since initial recognition.
(ii) Financial liabilities
A. Financial liabilities, including derivatives and embedded derivatives, which are designated for measurement at FVTPL
are subsequently measured at fair value. Financial guarantee contracts are subsequently measured the amount of impairment loss allowance or the amount recognised at inception net of cumulative amortisation, whichever is higher. All other financial liabilities including loans and borrowings are measured at amortised cost using Effective Interest Rate
(EIR) method.
B. A financial liability is derecognised when the related obligation expires or is discharged or cancelled.
(iii) The Group designates certain hedging instruments such as derivatives, embedded derivatives and in respect of foreign currency risk, certain non-derivatives as either fair value hedges, cash flow hedges, or hedges of net investments in foreign operations. Hedges of foreign exchange risk on firm commitments are accounted as cash flow hedges.
A. Fair value hedges: Changes in fair value of the designated portion of derivatives that qualify as fair value hedges are recognised in profit or loss immediately, together with any changes in the fair value of the hedged asset or liability that
are attributable to the hedged risk. Hedge accounting is discontinued when the hedging instrument expires or is sold, terminated, or exercised, or when it no longer qualifies for hedge accounting. The fair value adjustment to the carrying amount of the hedged item arising from the hedged risk is amortised to profit or loss from that date.
B. Cash flow hedges: In case of transaction related hedges, the effective portion of changes in the fair value of derivatives that are designated and qualify as cash flow hedges is recognised in other comprehensive income and accumulated in
equity as ‘hedging reserve’. The gain or loss relating to the ineffective portion is recognised immediately in profit or loss. Amounts previously recognised in other comprehensive income and accumulated in equity relating to effective portion are reclassified to profit or loss in the period when the hedged item affects profit or loss, in the same head as the hedged item. The effective portion of the hedge is determined at the lower of the cumulative gain or loss on the hedging instrument from inception of the hedge and the cumulative change in the fair value of the hedged item from
the inception of the hedge and the remaining gain or loss on the hedging instrument is treated as ineffective portion.
In case of time period related hedges, the forward element and the spot element of a forward contract is separated and only the change in the value of the spot element of the forward contract is designated as the hedging instrument. Similarly, wherever applicable, the foreign currency basis spread is separated from the financial instrument and is excluded from the designation of that financial instrument as the hedging instrument in case of time period related hedges. The changes in the
fair value of the forward element of the forward contract or the foreign currency basis spread of the financial instrument is accumulated in a separate component of equity as ‘cost of hedging’. The changes in the fair value of such forward element or foreign currency basis spread are reclassified to profit or loss as a reclassification adjustment on a straight line basis over the period of the forward contract or the financial instrument.
Hedge accounting is discontinued when the hedging instrument expires or is sold, terminated, or exercised, or when it no
longer qualifies for hedge accounting. Any gain or loss recognised in other comprehensive income and accumulated in equity at that time remains in equity and is recognised when the forecast transaction is ultimately recognised in profit or loss. When a forecast transaction is no longer expected to occur, the gain or loss accumulated in equity is recognised immediately in profit or loss.
Notes forming part of the Consolidated Financial Statements (contd.)
NOTE [1] (contd.)

367
(iv) Compound financial instruments issued by the Group which can be converted into fixed number of equity shares at the option of the holders irrespective of changes in the fair value of the instrument are accounted by separately recognising the liability and the equity components. The liability component is initially recognised at the fair value of a comparable liability that does not have an equity conversion option. The equity component is initially recognised at the difference between
the fair value of the compound financial instrument as a whole and the fair value of the liability component. The directly attributable transaction costs are allocated to the liability and the equity components in proportion to their initial carrying amounts.
Subsequent to initial recognition, the liability component of the compound financial instrument is measured at amortised
cost using the effective interest method. The equity component of a compound financial instrument is not remeasured subsequently.
(r) Inventories
Inventories are valued after providing for obsolescence, as under:
(i) Raw materials, components, construction materials, stores, spares and loose tools at lower of weighted average cost or net
realisable value. However, these items are considered to be realisable at cost if the finished products in which they will be used, are expected to be sold at or above cost.
(ii) Manufacturing work-in-progress at lower of weighted average cost including related overheads or net realisable value. In some cases, manufacturing work-in-progress are valued at lower of specifically identifiable cost or net realisable value. In the case of qualifying assets, cost also includes applicable borrowing costs vide policy relating to borrowing costs.
(iii) Finished goods and stock-in-trade (in respect of goods acquired for trading) at lower of weighted average cost or net realisable value. Cost includes related overheads and excise duty paid/payable on such goods.
(iv) Completed property/work-in-progress (including land) in respect of property development activity at lower of specifically identifiable cost or net realisable value.
Assessment of net realisable value is made in each subsequent period and when the circumstances that previously caused
inventories to be written-down below cost no longer exist or when there is clear evidence of an increase in net realisable value because of changed economic circumstances, the write-down, if any, in the past period is reversed to that extent of the original
amount written-down so that the resultant carrying amount is the lower of the cost and the revised net realisable value.
(s) Cash and bank balances
Cash and bank balances also include fixed deposits, margin money deposits, earmarked balances with banks and other bank
balances which have restrictions on repatriation. Short term and liquid investments being subject to more than insignificant risk of change in value, are not included as part of cash and cash equivalents.
(t) Securities premium account
(i) Securities premium includes:
A. The difference between the face value of the equity shares and the consideration received in respect of shares issued pursuant to Stock Option Scheme.
B. The fair value of the stock options which are treated as expense, if any, in respect of shares allotted pursuant to Stock
Options Scheme.
(ii) The issue expenses of securities which qualify as equity instruments are written off against securities premium account.
(u) Borrowing Costs
Borrowing costs include interest expense calculated using the effective interest method, finance charges in respect of assets acquired on finance lease and exchange differences arising from foreign currency borrowings, to the extent they are regarded as
an adjustment to interest costs.
Borrowing costs net of any investment income from the temporary investment of related borrowings, that are attributable to the acquisition, construction or production of a qualifying asset are capitalised/inventoried as part of cost of such asset till such time the asset is ready for its intended use or sale. A qualifying asset is an asset that necessarily requires a substantial period of time
to get ready for its intended use or sale. All other borrowing costs are recognised in profit or loss in the period in which they are incurred.
Notes forming part of the Consolidated Financial Statements (contd.)
NOTE [1] (contd.)
368
(v) Share-based payment arrangements
The stock options granted to employees pursuant to the Group’s Stock Options Schemes, are measured at the fair value of the options at the grant date. The fair value of the options is treated as discount and accounted as employee compensation cost over the vesting period on a straight line basis. The amount recognised as expense in each year is arrived at based on the number of
grants expected to vest. If a grant lapses after the vesting period, the cumulative discount recognised as expense in respect of such grant is transferred to the general reserve within equity.
(w) Foreign currencies
(i) The functional currency and presentation currency of the Group is Indian Rupee. Functional currency of the Group and foreign
operations has been determined based on the primary economic environment in which the Group and its foreign operations operate considering the currency in which funds are generated, spent and retained.
(ii) Transactions in currencies other than the Group’s functional currency are recorded on initial recognition using the exchange rate at the transaction date. At each Balance Sheet date, foreign currency monetary items are reported at the prevailing closing spot rate. Non-monetary items that are measured in terms of historical cost in foreign currency are not retranslated.
Exchange differences that arise on settlement of monetary items or on reporting of monetary items at each Balance Sheet date at the closing spot rate are recognised in the Statement of Profit and Loss in the period in which they arise except for:
A. exchange differences on foreign currency borrowings relating to assets under construction for future productive use, which are included in the cost of those assets when they are regarded as an adjustment to interest costs on those foreign currency borrowings;
B. exchange differences on transactions entered into in order to hedge certain foreign currency risks; and
C. exchange differences on monetary items receivable from or payable to a foreign operation for which settlement is
neither planned nor likely to occur (therefore forming part of the net investment in foreign operation), which are recognised initially in other comprehensive income and reclassified from equity to profit or loss on repayment of the monetary items.
(iii) Financial statements of foreign operations whose functional currency is different than Indian Rupees are translated into Indian Rupees as follows:
A. assets and liabilities for each Balance Sheet presented are translated at the closing rate at the date of that Balance Sheet;
B. income and expenses for each income statement are translated at average exchange rates; and
C. all resulting exchange differences are recognised in other comprehensive income and accumulated in equity as foreign
currency translation reserve for subsequent reclassification to profit or loss on disposal of such foreign operations. The portion of foreign currency translation reserve attributed to non-controlling interest is reflected as part of non-controlling
interest.
(x) Accounting and reporting of information for Operating Segments
Operating segments are those components of the business whose operating results are regularly reviewed by the chief operating decision making body in the Group to make decisions for performance assessment and resource allocation. The reporting of segment information is the same as provided to the management for the purpose of the performance assessment and resource
allocation to the segments.
Segment accounting policies are in line with the accounting policies of the Group. In addition, the following specific accounting policies have been followed for segment reporting:
(i) Segment revenue includes sales and other operational revenue directly identifiable with/allocable to the segment including (a) inter segment revenue and (b) profit on sale of stake in the subsidiary and/or joint venture companies under Developmental
projects segment and Realty business grouped under “Others” segment
(ii) Expenses that are directly identifiable with/allocable to segments are considered for determining the segment result. In respect of (a) Financial Services segment and (b) Power Generation projects under Developmental Projects segment which are classified as assets given on finance lease, the interest expenses on borrowings are accounted as segment expenses.
(iii) Most of the centrally incurred costs are allocated to segments mainly on the basis of their respective expected segment
revenue estimated at the beginning of the reported period.
Notes forming part of the Consolidated Financial Statements (contd.)
NOTE [1] (contd.)

369
(iv) Income which relates to the Group as a whole and not allocable to segments is included in “unallocable corporate income”.
(v) Segment result includes margins on inter-segment capital jobs, which are reduced in arriving at the profit before tax of the Group.
(vi) Segment assets and liabilities include those directly identifiable with the respective segments. In respect of (a) Financial
Services segment, and (b) Power Generation projects under Developmental Projects segment which are classified as assets given on finance lease, segment liabilities include borrowings as the interest expenses on borrowings are accounted as segment expenses in respect of the segment and projects. Investment in joint ventures and associates identified with a particular segment are reported as part of the segment assets of those respective segments.
Unallocable corporate assets and liabilities represent the assets and liabilities that relate to the Group as a whole.
(vii) Segment non-cash expenses forming part of segment expenses includes the fair value of the employee stock options which is
accounted as employee compensation cost [see Note 1(v) above] and is allocated to the segment.
(viii) Segment revenue resulting from transactions with other business segments is accounted on the basis of transfer price which are either determined to yield a desired margin or agreed on a negotiated basis
(y) Taxes on income
Tax on income for the current period is determined on the basis of taxable income (or on the basis of book profits wherever
minimum alternate tax is applicable) and tax credits computed in accordance with the provisions of the Income Tax Act 1961, and based on the expected outcome of assessments/appeals.
Dividend distribution tax paid on profits distributed by the subsidiary company during the period is treated as an item of expense
and recognised in the Statement of Profit and Loss. The dividend distribution tax paid in earlier years for which set off is available against the tax liability arising out of the dividend distribution by the Parent Company is recognised as an item of income in the
period in which such set off is availed with corresponding effect in the equity to the extent of such set off. Both the recognition of expense and income as aforesaid are separately disclosed in the Statement of Profit and Loss as provision/reversal of additional tax on dividend distributed by subsidiaries.
Deferred tax is recognised on temporary differences between the carrying amounts of assets and liabilities in the Group’s financial statements and the corresponding tax bases used in computation of taxable profit and quantified using the tax rates and laws
enacted or substantively enacted as on the Balance Sheet date.
Deferred tax liabilities are generally recognised for all taxable temporary differences including the temporary differences associated with investments in subsidiaries and associates, and interests in joint ventures, except where the Group is able to control the
reversal of the temporary difference and it is probable that the temporary difference will not reverse in the foreseeable future.
Dividend distribution tax payable on profits of subsidiary companies which are proposed to be distributed in foreseeable future, is
recognised as deferred tax liability with corresponding effect in the Statement of Profit and Loss in the period in which such profits are proposed to be so distributed. Such liability is reversed in the period in which the profits are distributed by the subsidiary company.
Deferred tax assets are generally recognised for all taxable temporary differences to the extent that is probable that taxable profits will be available against which those deductible temporary differences can be utilised. The carrying amount of deferred tax assets is
reviewed at the end of each reporting period and reduced to the extent that it is no longer probable that sufficient taxable profits will be available to allow all or part of the asset to be recovered.
Deferred tax assets relating to unabsorbed depreciation/business losses/losses under the head “capital gains” are recognised and carried forward to the extent of available taxable temporary differences or where there is convincing other evidence that sufficient future taxable income will be available against which such deferred tax assets can be realised. Deferred tax assets in respect of
unutilised tax credits which mainly relate to minimum alternate tax are recognised to the extent it is probable of such unutilised tax credits will get realised.
The measurement of deferred tax liabilities and assets reflects the tax consequences that would follow from the manner in which the Group expects, at the end of reporting period, to recover or settle the carrying amount of its assets and liabilities.
Transaction or event which is recognised outside profit or loss, either in other comprehensive income or in equity, is recorded along
with the tax as applicable.
Notes forming part of the Consolidated Financial Statements (contd.)
NOTE [1] (contd.)

370
(z) Provisions, contingent liabilities and contingent assets
Provisions are recognised only when:
(i) an entity has a present obligation (legal or constructive) as a result of a past event; and
(ii) it is probable that an outflow of resources embodying economic benefits will be required to settle the obligation; and
(iii) a reliable estimate can be made of the amount of the obligation
Provision is measured using the cash flows estimated to settle the present obligation and when the effect of time value of money is material, the carrying amount of the provision is the present value of those cash flows. Reimbursement expected in respect of expenditure required to settle a provision is recognised only when it is virtually certain that the reimbursement will be received.
Contingent liability is disclosed in case of:
(i) a present obligation arising from past events, when it is not probable that an outflow of resources will be required to settle
the obligation; and
(ii) a present obligation arising from past events, when no reliable estimate is possible.
Contingent assets are disclosed where an inflow of economic benefits is probable. Provisions, contingent liabilities and contingent
assets are reviewed at each Balance Sheet date.
Where the unavoidable costs of meeting the obligations under the contract exceed the economic benefits expected to be received
under such contract, the present obligation under the contract is recognised and measured as a provision.
(aa) Commitments
Commitments are future liabilities for contractual expenditure, classified and disclosed as follows:
a) estimated amount of contracts remaining to be executed on capital account and not provided for;
b) uncalled liability on shares and other investments partly paid;
c) funding related commitment to associate and joint venture companies; and
d) other non-cancellable commitments, if any, to the extent they are considered material and relevant in the opinion of management.
Other commitments related to sales/procurements made in the normal course of business are not disclosed to avoid excessive details.
(ab) Non-current assets held for sale
Non-current assets and disposal groups are classified as held for sale if their carrying amount is intended to be recovered principally through a sale (rather than through continuing use) when the asset (or disposal group) is available for immediate sale in its present condition subject only to terms that are usual and customary for sale of such asset (or disposal group) and the sale is highly probable and is expected to qualify for recognition as a completed sale within one year from the date of classification.
Non-current assets and disposal groups classified as held for sale are measured at lower of their carrying amount and fair value less costs to sell.
(ac) Statement of Cash Flows
Statement of Cash Flows is prepared segregating the cash flows into operating, investing and financing activities. Cash flow from operating activities is reported using indirect method adjusting the net profit for the effects of:
i. changes during the period in inventories and operating receivables and payables transactions of a non-cash nature;
ii. non-cash items such as depreciation, provisions, deferred taxes, unrealised foreign currency gains and losses, and undistributed profits of associates and joint ventures; and
iii. all other items for which the cash effects are investing or financing cash flows.
Cash and cash equivalents (including bank balances) shown in the Statement of Cash Flows exclude items which are not available for general use as on the date of Balance Sheet.
Notes forming part of the Consolidated Financial Statements (contd.)
NOTE [1] (contd.)

371
(ad) Key sources of estimation
The preparation of financial statements in conformity with Ind AS requires that the management of the Group makes estimates and assumptions that affect the reported amounts of income and expenses of the period, the reported balances of assets and liabilities and the disclosures relating to contingent liabilities as of the date of the financial statements. The estimates and
underlying assumptions are reviewed on an ongoing basis. Revisions to accounting estimates include useful lives of property, plant and equipment & intangible assets, allowance for doubtful debts/advances, future obligations in respect of retirement benefit plans, expected cost of completion of contracts, provision for rectification costs, fair value measurement etc. Difference, if any, between the actual results and estimates is recognised in the period in which the results are known.
(ae) First time adoption of Ind AS
The Group has prepared opening balance sheet as per Ind AS as of April 1, 2015 (transition date) by recognising all assets and
liabilities whose recognition is required by Ind AS, derecognising items of assets or liabilities which are not permitted to be recognised by Ind AS, reclassifying items from I-GAAP to Ind AS as required, and applying Ind AS to measure the recognised assets and liabilities. The exemptions availed by the Group are as follows:
(i) The Group has adopted the carrying value determined in accordance with I-GAAP for all of its property plant and equipment and investment property as deemed cost of such assets at the transition date.
(ii) Ind AS 102 “Share-based Payment” has not been applied to equity instruments in share-based payment transactions that vested before April 1,2015.
(iii) The Group has applied the derecognition requirements of financial assets and financial liabilities prospectively for transactions
occurring on or after April 1, 2015.
(iv) The Group has determined the classification of debt instruments in terms of whether they meet the amortised cost criteria or
the FVTOCI criteria based on the facts and circumstances that existed as of the transition date.
(v) The Group has applied the impairment requirements of Ind AS 109 retrospectively; however, as permitted by Ind AS 101, it has used reasonable and supportable information that is available without undue cost or effort to determine the credit risk at
the date that financial instruments were initially recognised in order to compare it with the credit risk at the transition date. Further, as permitted by Ind AS 101, the Group has not undertaken an exhaustive search for information when determining,
at the date of transition to Ind ASs, whether there have been significant increases in credit risk since initial recognition,
(vi) The Group has elected not to apply Ind AS 103 Business Combinations retrospectively to past business combinations that occurred before the transition date.
(vii) The Group has not elected the option to reset the cumulative translation differences on foreign operations that exist to zero as of the transition date.
(viii) The estimates as at April 1, 2015 and at March 31, 2016 are consistent with those made for the same dates in accordance
with the I-GAAP.
Notes forming part of the Consolidated Financial Statements (contd.)
NOTE [1] (contd.)

372
NOTE [2]
Property, plant and equipment and capital work-in-progress
v crore
Class of assets
Cost Depreciation Impairment Book value
As at
1-4-2016
Pursuant to
acquisition
of
subsidiaries Additions
Foreign
currency
fluctuation Deductions
As at
31-3-2017
Up to
31-3-2016
Pursuant to
acquisition
of
subsidiaries
For the
year
Foreign
currency
fluctuation Deductions
Up to
31-3-2017
Up to
31-3-2017
As at
31-3-2017
As at
31-3-2016
Land Freehold 601.85 – 12.15 (1.46) 3.41 609.13 – – – – – – – 609.13 601.79
Taken on lease 468.86 – 2.74 (0.53) 29.72 441.35 11.34 – 9.21 (0.05) 16.69 3.81 – 437.54 465.52
Sub-total - Land 1070.71 – 14.89 (1.99) 33.13 1050.48 11.34 – 9.21 (0.05) 16.69 3.81 – 1046.67 1067.31
Buildings Owned 3592.80 – 164.36 (11.79) 23.92 3721.45 177.11 – 185.84 (0.98) 17.37 344.60 87.25 3289.60 3416.95
Leased out 70.02 – 13.70 – 15.74 67.98 5.30 – 3.82 – 1.01 8.11 – 59.87 63.52
Sub-total - Buildings 3662.82 – 178.06 (11.79) 39.66 3789.43 182.41 – 189.66 (0.98) 18.38 352.71 87.25 3349.47 3480.47
Plant & equipment Owned 6311.04 – 484.39 (22.00) 112.64 6660.79 851.55 – 979.46 (3.22) 80.78 1747.01 15.50 4898.28 5462.26
Leased out 65.25 – – – 23.10 42.15 10.47 – 8.44 – 10.63 8.28 – 33.87 55.10
Sub-total - Plant & equipment
6376.29 – 484.39 (22.00) 135.74 6702.94 862.02 – 987.90 (3.22) 91.41 1755.29 15.50 4932.15 5517.36
Computers Owned 456.58 0.11 132.74 (1.34) 48.97 539.12 155.58 0.09 151.44 (0.15) 48.96 258.00 – 281.12 301.95
Leased out 2.11 – – – 0.24 1.87 0.58 – 0.69 – – 1.27 – 0.60 1.53
Taken on lease 0.04 – – – – 0.04 0.03 – 0.01 – – 0.04 – – 0.01
Sub-total - Computers 458.73 0.11 132.74 (1.34) 49.21 541.03 156.19 0.09 152.14 (0.15) 48.96 259.31 – 281.72 303.49
Office equipment Owned 221.70 0.01 52.88 (0.74) 9.76 264.09 63.18 – 63.17 (0.22) 9.75 116.38 0.01 147.70 152.13
Leased out 1.07 – – – 0.05 1.02 0.26 – 0.36 – 0.05 0.57 – 0.45 0.81
Sub-total - Office equipment 222.77 0.01 52.88 (0.74) 9.81 265.11 63.44 – 63.53 (0.22) 9.80 116.95 0.01 148.15 152.94
Furniture and fixtures Owned 280.11 0.01 40.52 (1.16) 15.05 304.43 47.31 – 52.59 (0.30) 11.26 88.34 0.24 215.85 240.42
Leased out 12.43 – 0.39 – 1.01 11.81 1.59 – 2.20 – 0.30 3.49 – 8.32 16.94
Sub-total - Furniture & fixtures
292.54 0.01 40.91 (1.16) 16.06 316.24 48.90 – 54.79 (0.30) 11.56 91.83 0.24 224.17 257.36
Vehicles Owned 263.52 – 63.80 (1.22) 30.01 296.09 46.40 – 51.83 (0.21) 12.98 85.04 – 211.05 218.32
Leased out 131.18 – 1.83 – 26.81 106.20 27.77 – 19.52 – – 47.29 – 58.91 103.41
Sub-total - Vehicles 394.70 – 65.63 (1.22) 56.82 402.29 74.17 – 71.35 (0.21) 12.98 132.33 – 269.96 321.73
Other assets Owned
Aircraft 92.76 – – – 43.53 49.23 6.67 – 6.67 – 6.52 6.82 – 42.41 86.09
Ships 37.57 – – – 0.32 37.25 4.92 – 4.84 – 0.09 9.67 – 27.58 33.09
Dredged channel and
Breakwater structures 1006.11 – 4.97 – – 1011.08 55.39 – 56.08 – – 111.47 – 899.61 950.72
Leasehold Improvements 42.38 – 4.97 (0.23) 3.12 44.00 19.76 – 6.20 (0.14) 2.59 23.23 – 20.77 1.61
Sub-total - Other assets 1178.82 – 9.94 (0.23) 46.97 1141.56 86.74 – 73.79 (0.14) 9.20 151.19 – 990.37 1071.51
Total 13657.38 0.13 979.44 (40.47) 387.40 14209.08 1485.21 0.09 1602.37 (5.27) 218.98 2863.42 103.00 11242.66 12172.17
Add: Capital work-in-progress 2118.19 1790.53
13360.85 13962.70
Notes forming part of the Consolidated Financial Statements (contd.)

373
v crore
Class of assets
Cost Depreciation Impairment Book value
As at
1-4-2015 Additions
Foreign
currency
fluctuation Deductions
As at
31-3-2016
Up to
31-3-2015
For the
year
Foreign
currency
fluctuation Deductions
Up to
31-3-2016
Up to
31-3-2016
As at
31-3-2016
As at
1-4-2015
Land Freehold 613.41 4.01 0.49 16.12 601.79 – – – – – – 601.79 613.41
Taken on lease 610.47 11.79 0.66 154.05 468.87 – 12.79 – 1.45 11.34 – 457.53 610.47
Sub total - Land 1223.88 15.80 1.15 170.17 1070.66 – 12.79 – 1.45 11.34 – 1059.32 1223.88
Buildings Owned 3374.35 373.76 14.92 166.93 3596.10 – 183.84 – 6.68 177.16 – 3418.94 3374.35
Leased out 36.26 35.60 – 5.10 66.76 – 10.18 – 4.93 5.25 – 61.51 36.26
Sub total - Buildings 3410.61 409.36 14.92 172.03 3662.86 – 194.02 – 11.61 182.41 – 3480.45 3410.61
Plant & equipment Owned 5743.54 1026.74 29.50 486.09 6313.69 – 887.81 – 36.58 851.23 – 5462.46 5743.54
Leased out 70.14 4.88 – 9.13 65.89 – 11.00 – 0.21 10.79 – 55.10 70.14
Sub total - Plant & equipment 5813.68 1031.62 29.50 495.22 6379.58 – 898.81 – 36.79 862.02 – 5517.56 5813.68
Computers Owned 297.46 172.16 0.60 14.36 455.86 0.44 164.80 – 9.66 155.58 – 300.28 297.02
Leased out 0.19 1.92 – – 2.11 – 0.58 – – 0.58 – 1.53 0.19
Taken on lease 0.04 – – – 0.04 – 0.03 – – 0.03 – 0.01 0.04
Sub total - Computers 297.69 174.08 0.60 14.36 458.01 0.44 165.41 – 9.66 156.19 – 301.82 297.25
Office equipment Owned 158.60 73.63 1.13 14.26 219.10 0.02 66.46 (0.01) 3.29 63.18 – 155.92 158.58
Leased out 1.93 – – 0.86 1.07 – 0.45 – 0.19 0.26 – 0.81 1.93
Sub total - Office equipment 160.53 73.63 1.13 15.12 220.17 0.02 66.91 (0.01) 3.48 63.44 – 156.73 160.51
Furniture and fixtures Owned 228.25 62.35 0.83 11.37 280.06 0.02 51.24 – 3.95 47.31 – 232.75 228.23
Leased out 12.72 4.01 – 4.30 12.43 – 1.82 – 0.23 1.59 – 10.84 12.72
Sub total - Furniture & fixtures 240.97 66.36 0.83 15.67 292.49 0.02 53.06 – 4.18 48.90 – 243.59 240.95
Vehicles Owned 194.09 85.89 1.68 18.48 263.18 – 50.65 – 4.25 46.40 – 216.78 194.09
Leased out 137.21 24.89 – 30.92 131.18 – 27.77 – – 27.77 – 103.41 137.21
Sub total - Vehicles 331.30 110.78 1.68 49.40 394.36 – 78.42 – 4.25 74.17 – 320.19 331.30
Other assets Owned
Aircraft 92.76 – – – 92.76 – 6.67 – – 6.67 – 86.09 92.76
Ships 38.01 – – – 38.01 – 4.92 – – 4.92 – 33.09 38.01
Dredged channel and
Breakwater structures 2059.65 0.84 – 1054.38 1006.11 – 79.44 – 24.05 55.39 – 950.72 2059.65
Leasehold Improvements 1.18 42.37 – 1.18 42.37 – 20.94 – 1.18 19.76 – 22.61 1.18
Sub total - Other assets 2191.60 43.21 – 1055.56 1179.25 – 111.97 – 25.23 86.74 – 1092.51 2191.60
Total 13670.26 1924.84 49.81 1987.53 13657.38 0.48 1581.39 (0.01) 96.65 1485.21 – 12172.17 13669.78
Add: Capital work-in-progress 1790.53 1452.66
13962.70 15122.44
Notes:
(a) Carrying value of property, plant and equipment pledged as collateral for liabilities and/or commitments as at March 31, 2017
v1855.94 crore (v 1867.29 crore as at March 31, 2016; v 3354.87 crore as at April 1, 2015)
(b) Carrying value of property, plant and equipment having restriction on title as at March 31, 2017 v 2240.12 crore (v 2086.27 crore
as at March 31, 2016; v 3715.71 crore as at April 1, 2015)
(c) Cost of:
(i) Freehold land includes:
• v 2.30 crore (previous year: v 1.17 crore) for which conveyance is yet to be completed.
Notes forming part of the Consolidated Financial Statements (contd.)
NOTE [2] (contd.)

374
(ii) Leasehold land includes:
• v 258.85 crore (previous year: v 258.85 crore) taken on lease from M/s Tamilnadu Industrial Development Corporation
Limited (TIDCO) on various dates for development of port and shipyard.
• v 0.35 crore (previous year: v 0.35 crore) representing 4.728 hectares of forest land in district Rudryaprayag, State of
Uttarakhand taken on lease for 30 years w.e.f. 10-9-2017.
• v 0.63 crore (previous year: v 0.63 crore) representing 34.341 hectares of forest land in district Rudryaprayag, State of
Uttarakhand taken on lease for 30 years w.e.f. 24-9-2009.
• v 71.45 crore (previous year: v 73.92 crore) added during the year in respect of which lease agreements are yet to be
executed.
(d) Cost of buildings includes ownership accommodation:
(i) • in various co-operative societies, shop-owners’ associations and non-trading corporation: v 88.09 crore (previous year:
v 86.92 crore), including 2550 (previous year: 2570) shares of v 50 each, 232 (previous year: 232) shares of v 100 each
and 1 (previous year: 1) share of v 250.
• in proposed co-operative societies v 27.80 crore (previous year: v 0.53 crore).
• in various co-operative societies and apartments and shop-owners’ associations: v 7.94 crore (previous year: v 14.60
crore), for which share certificate are yet to be issued.
(ii) of v 3.53 crore (previous year: v 3.86 crore) in respect of which the deed of conveyance is yet to be executed.
(iii) of v 8.48 crore (previous year: v 8.48 crore) representing undivided share in a property at a certain location.
(e) Depreciation for the year includes v 25.42 crore (previous year: v 27.58 crore) on account of obsolescence.
(f) Impairment during the year and upto 31-3-2017 is R 111.86 crore out of which R 8.86 crore transferred to held for sale.
(g) Owned assets given on operating lease have been presented separately under respective class of assets as “Leased out” pursuant
to ”Indian Accounting Standard (Ind AS) 17 “Leases”.
(h) Cost as at April 1, 2016 and April 1, 2015 of individual assets has been reclassified, wherever necessary.
(i) Amount transferred from property, plant & equipment to group(s) of assets classified as held for sale: v 70.21 crore (previous year:
v 1573.63 crore)
(j) Range of useful life of property, plant and equipment is as below:
Sr. no.
Class of assetsMinimum useful life
(in years)Maximum useful life
(in years)
1. Leasehold land 15 999
2. Owned buildings 5 61
3. Leased out buildings 10 30
4. Owned plant and equipment 3 35
5. Leased out plant and equipment 9 15
6. Computers 3 7
7. Office equipment 3 30
8. Furniture and fixtures 3 13
9. Owned vehicles 3 15
10. Leased out vehicles 6 6
11. Railway sidings 5 5
12. Aircraft 18 18
13. Ships 14 14
14. Dredged channel 9 50
15. Breakwater structures 50 50
16. Leasehold improvements 2 10
Notes forming part of the Consolidated Financial Statements (contd.)
NOTE [2] (contd.)

375
NOTE [3]
Investment Property
v crore
Class of assets
Cost Depreciation Book Value
As at 1-4-2016
AdditionsForeign
currency fluctuation
Transfer from
inventories and owner-
occupied property
Deductions As at
31-3-2017 Upto
31-3-2016For the year
Foreign currency
fluctuation
Transfer from
inventories and owner-
occupied property
Deductions Up to
31-3-2017 As at
31-3-2017 As at
31-3-2016
Land 58.41 – (0.19) – 18.15 40.07 – – – – – – 40.07 58.41
Buildings 141.85 42.72 – 4.40 56.64 132.33 5.05 6.40 – 0.42 3.00 8.87 123.46 136.80
Total 200.26 42.72 (0.19) 4.40 74.79 172.40 5.05 6.40 – 0.42 3.00 8.87 163.53 195.21
Add: Capital work-in-progress 3266.19 4190.79
3429.72 4386.00
v crore
Class of assets
Cost Depreciation Book Value
As at 1-4-2015
AdditionsForeign
currency fluctuation
Transfer from
inventories and owner-
occupied property
Deductions As at
31-3-2016 Upto
31-3-2015For the year
Foreign currency
fluctuation
Transfer from
inventories and owner-
occupied property
Deductions Up to
31-3-2016 As at
31-3-2016 As at
1-4-2015
Land 73.41 – 0.55 – 15.55 58.41 – – – – – – 58.41 73.41
Buildings 279.98 – – – 138.13 141.85 – 5.14 – – 0.09 5.05 136.80 279.98
Total 353.39 – 0.55 – 153.68 200.26 – 5.14 – – 0.09 5.05 195.21 353.39
Add: Capital work-in-progress 4190.79 2415.31
4386.00 2768.70
Notes:
(a) Carrying value of Investment property pledged as collateral for liabilities and/or commitments and having restriction on title as at
March 31, 2017 v 0.16 crore (v 0.16 crore as at March 31, 2016; v 0.16 crore as at April 1, 2015)
(b) Useful life of building included in investment property: 20 to 60 years
(c) Amount recognised in the Statement of Profit and Loss for investment property:
v crore
Sr. no. Particulars 2016-17 2015-16
1. Rental income derived from investment property 74.82 105.44
2. Direct operating expenses arising from investment property that generated rental
income
2.57 5.57
(d) Fair value of investment property: v 5598.86 crore as at March 31, 2017 (v 6124.48 crore as at March 31, 2016; v 4397.36 crore
as at April 1, 2015).
(e) The fair values of investment property have been determined with the help of internal architectural department and independent
valuer on a case to case basis. Fair value of property that are evaluated by independent valuer is amounted to v 4106.49 crore
(v 3569.51 crore as at March 31, 2016; v 2428.42 crore as at April 1, 2015). Valuation is based on government rates, market
research, marked trend and comparable values as considered appropriate.
(f) Impairment during the year and upto 31-3-2017 is R 403.71 crore out of which R 270.22 crore pertained to assets disposed off.
Notes forming part of the Consolidated Financial Statements (contd.)

376
NOTE [4]
Goodwill
v crore
Class of assets
Cost Amortisation Impairment Book value
As at
1-4-2016 Additions*
Foreign
currency
fluctuation Deductions
As at
31-3-2017
Up to
31-3-2016
For the
year
Foreign
currency
fluctuation Deductions
Up to
31-3-2017
Up to
31-3-2017
As at
31-3-2017
As at
31-3-2016
Goodwill on consolidation 1495.06 2.83 (44.61) 6.52 1446.76 – – – – – 48.10 # 1398.66 1446.96
Previous year 1585.08 16.48 4.95 111.45 1495.06 – – – – – 48.10 1446.96 1536.98
# Impairment upto 31-3-2017 v 48.10 crore, during the year v Nil. * Refer Note 51(c)
NOTE [5]
Other Intangible assets and intangible assets under development
v crore
Class of assets
Cost Amortisation Book value
As at
1-4-2016
Pursuant to
acquisition
of
subsidiaries Additions
Foreign
currency
fluctuation Deductions
As at
31-3-2017
Up to
31-3-2016
Pursuant to
acquisition
of
subsidiaries For the year
Foreign
currency
fluctuation Deductions
Up to
31-3-2017
As at
31-3-2017
As at
31-3-2016
Specialised softwares 1069.50 0.01 68.94 (16.50) 133.65 988.30 721.74 – 157.69 (11.60) 132.29 735.54 252.76 347.76
Technical know-how 46.22 – 20.93 (0.06) 2.18 64.91 29.40 – 8.19 (0.06) 2.18 35.35 29.56 16.82
New product design and development 164.78 – 7.86 (7.83) – 164.81 48.91 – 27.72 (3.31) – 73.32 91.49 115.87
Customer contracts and relationship 137.57 – 0.29 (6.13) – 131.73 61.45 – 15.01 (3.51) – 72.95 58.78 76.12
Total 1418.07 0.01 98.02 (30.52) 135.83 1349.75 861.50 – 208.61 (18.48) 134.47 917.16 432.59 556.57
Add: Intangible assets under development 11353.23 9183.92
11785.82 9740.49
v crore
Class of assets
Cost Amortisation Book value
As at
1-4-2015
Pursuant to
acquisition
of
subsidiaries Additions
Foreign
currency
fluctuation Deductions
As at
31-3-2016
Up to
1-4-2015
Pursuant to
acquisition
of
subsidiaries For the year
Foreign
currency
fluctuation Deductions
Up to
31-3-2016
As at
31-3-2016
As at
1-4-2015
Specialised softwares 963.43 – 97.96 13.76 5.65 1069.50 557.10 – 160.71 7.47 3.54 721.74 347.76 406.33
Technical know-how 42.18 – 3.94 0.10 – 46.22 23.30 – 6.00 0.10 – 29.40 16.82 18.88
New product design and development 86.60 – 77.89 0.74 0.45 164.78 30.24 – 18.84 0.23 0.40 48.91 115.87 56.36
Customer contracts and relationship 131.24 – – 6.33 – 137.57 44.34 – 14.85 2.26 – 61.45 76.12 86.90
Total 1223.45 – 179.79 20.93 6.10 1418.07 654.98 – 200.40 10.06 3.94 861.50 556.57 568.47
Add: Intangible assets under development 9183.92 6473.66
9740.49 7042.13
Addition to other intangible assets include internally developed: v 34.99 crore (previous year: v 102.50 crore)
Notes:
(a) Borrowing cost capitalised in accordance with Indian Accounting Standard (Ind AS) 23 “Borrowing Costs” is as follows:
v crore
Class of assets 2016-17 2015-16
Buildings (owned) 3.63 3.13
Investment Property 137.01 285.09
Capital work-in-progress (PPE) 92.82 414.92
Intangible assets under development 784.79 507.46
Total 1018.25 1210.60
(b) The average capitalization rate for borrowing cost is 10.26%. (previous year: 9.42%)
Notes forming part of the Consolidated Financial Statements (contd.)

377
NOTE [6]
Financial assets: Other Investments - non-current
Particulars As at 31-3-2017 As at 31-3-2016 As at 1-4-2015
v crore v crore v crore
Equity instruments 600.03 482.53 348.79
Preference shares 70.88 157.62 172.36
Government or trust securities – 213.98 179.97
Debentures or bonds 1875.64 1229.82 941.54
Mutual funds 17.06 13.77 1.69
Security receipts 505.27 196.37 218.15
Units of fund 111.86 32.92 25.89
3180.74 2327.01 1888.39
NOTE [7]
Financial assets: Loans - non-current
Particulars As at 31-3-2017 As at 31-3-2016 As at 1-4-2015
v crore v crore v crore v crore v crore v crore
Unsecured security deposits, considered good 156.93 205.03 210.01
Unsecured security deposits, doubtful: 0.45 0.45 0.45
Less: Provision for doubtful security deposits 0.45 0.45 0.45
– – –
Secured long term loans to related parties [KMPs] – – 0.01
Unsecured long term loans to related parties:
Associates companies:
Advances 18.40 18.79 17.73
18.40 18.79 17.73
Joint Ventures:
Inter-corporate deposits 1167.22 779.72 572.71
Amount receivable 130.41 32.79 –
1297.63 812.51 572.71
Other secured loans, considered good:
Loans against mortgage of house property 0.74 1.24 2.36
Other inter-corporate deposits – – 3.00
0.74 1.24 5.36
Other unsecured loans, considered good:
Advance recoverable in cash 0.12 0.08 0.61
Other loans unsecured, doubtful:
Doubtful other loans and advances 2.29 3.19 5.29
Less: Provision for doubtful advances 2.29 3.19 5.29
– – –
1473.82 1037.65 806.43
Notes forming part of the Consolidated Financial Statements (contd.)

378
NOTE [8]
Financial assets: Loans towards financing activities - non-current
Particulars As at 31-3-2017 As at 31-3-2016 As at 1-4-2015
v crore v crore v crore v crore v crore v crore
Secured loans:
Considered good:
Term loans 30984.17 31672.86 27650.61
Finance lease 44.36 32.46 68.31
Debentures 4044.53 4112.53 2697.50
Considered doubtful:
Term loans 2488.74 1264.32 1163.76
37561.80 37082.17 31580.18
Less: Allowance for expected credit losses 2488.74 1264.32 1163.76
35073.06 35817.85 30416.42
Unsecured loans:
Considered good:
Term loans 2125.74 2096.48 1382.01
Finance lease 9229.02 9512.46 9339.95
Debentures 706.04 461.48 293.22
Considered doubtful:
Term loans – 10.36 13.55
12060.80 12080.78 11028.73
Less: Allowance for expected credit losses – 10.36 13.55
12060.80 12070.42 11015.18
47133.86 47888.27 41431.60
NOTE [9]
Other financial assets - non-current
Particulars As at 31-3-2017 As at 31-3-2016 As at 1-4-2015
v crore v crore v crore
Cash and bank balances not available for
immediate use 223.56 98.18 75.59
Fixed deposits with banks
(maturity more than 12 months) 1.68 5.33 2.88
Forward contract receivables 494.58 411.39 378.15
Embedded derivative receivables 10.74 4.81 6.39
Other receivables 44.56 43.84 17.59
775.12 563.55 480.60
Notes forming part of the Consolidated Financial Statements (contd.)

379
NOTE [10]
Other non-current assets
Particulars As at 31-3-2017 As at 31-3-2016 As at 1-4-2015
v crore v crore v crore v crore v crore v crore
Capital advances:
Secured 26.47 30.53 30.89
Unsecured 146.42 217.54 265.20
172.89 248.07 296.09
Advance recoverable other than in cash 3065.27 2489.12 2098.91
3238.16 2737.19 2395.00
NOTE [11]
Inventories (at cost or net realisable value whichever is lower)
Particulars As at 31-3-2017 As at 31-3-2016 As at 1-4-2015
v crore v crore v crore
Raw materials [includes goods-in-transit v 38.52 crore (as at 31-3-2016: v 45.88 crore, as at 1-4-2015: v 42.58 crore)] 576.51 842.45 998.81
Components [includes goods-in-transit v 23.72 crore (as at 31-3-2016: v 14.68 crore, as at 1-4-2015: v 24.00 crore)] 518.24 527.53 588.15
Construction materials [includes goods-in-transit v 55.70 crore (as at 31-3-2016: v 113.43 crore, as at 1-4-2015: v 75.60 crore)] 164.03 261.58 265.93
Manufacturing work-in-progress 828.36 886.41 1098.15
Finished goods 340.82 284.99 403.10
Stock-in-trade (in respect of goods acquired for trading) [includes goods-in-transit v 18.77 crore (as at 31-3-2016: v 34.82 crore, as at 1-4-2015: v 36.02 crore)] 188.59 179.99 178.02
Stores and spares [includes goods-in-transit v 5.09 crore (as at 31-3-2016: v 3.05 crore, as at 1-4-2015: v 7.56 crore)] 248.34 363.70 305.60
Loose tools [includes goods-in-transit v 0.09 crore (as at 31-3-2016: v 0.04 crore, as at 1-4-2015: v 0.05 crore)] 15.09 18.35 14.20
Property development projects (including land) 1259.76 1489.21 2129.20
4139.74 4854.21 5981.16
Note: During the year R 746.21 crore (previous year: R 41.80 crore) was recognised as expense towards write-down of inventory.
Notes forming part of the Consolidated Financial Statements (contd.)

380
NOTE [12]
Financial Assets: Investments - current
Particulars As at 31-3-2017 As at 31-3-2016 As at 1-4-2015
v crore v crore v crore
Equity shares 199.17 43.30 51.15
Government and trust securities 780.10 1078.36 1511.23
Debentures and bonds 2592.27 1506.31 1370.71
Mutual funds 10227.85 4847.73 4347.17
Preference shares – – 50.36
Other investments – 18.49 23.19
13799.39 7494.19 7353.81
NOTE [13]
Financial assets - current: Trade receivables
Particulars As at 31-3-2017 As at 31-3-2016 As at 1-4-2015
v crore v crore v crore v crore v crore v crore
Secured, considered good 17.84 4.84 8.46
Unsecured:
Considered good 27951.76 26020.14 22245.97
Considered doubtful 2465.29 1961.09 1311.52
30417.05 27981.23 23557.49
Less: Allowance for doubtful debts 2465.29 1961.09 1311.52
27951.76 26020.14 22245.97
27969.60 26024.98 22254.43
NOTE [14]
Financial assets - Cash and cash equivalents
Particulars As at 31-3-2017 As at 31-3-2016 As at 1-4-2015
v crore v crore v crore
Balance with banks 2905.51 2942.75 3339.18
Cheques and drafts on hand 571.85 543.40 271.16
Cash on hand 64.48 35.09 113.10
Fixed deposits with banks (maturity less than 3 months) 251.49 285.30 689.13
3793.33 3806.54 4412.57
Notes forming part of the Consolidated Financial Statements (contd.)

381
NOTE [15]
Financial assets - current: Other bank balances
Particulars As at 31-3-2017 As at 31-3-2016 As at 1-4-2015
v crore v crore v crore
Fixed deposits with banks 1557.59 1328.46 435.77
Earmarked balances with banks - unclaimed dividend 46.92 39.39 33.59
Earmarked balances with banks-others – 17.40 10.59
Cash and bank balances not available for immediate
use including margin money deposits 174.65 198.12 216.90
1779.16 1583.37 696.85
NOTE [16]
Financial assets: Loans - current
Particulars As at 31-3-2017 As at 31-3-2016 As at 1-4-2015
v crore v crore v crore v crore v crore v crore
Unsecured security deposits, considered good 462.01 469.31 428.01
Unsecured security deposits, doubtful 3.74 3.44 5.70
Less: Provision for doubtful security deposits 3.74 3.44 5.70
– – –
Unsecured long term loans to related parties:
Associates companies:
Advances – – 3.68
– – 3.68
Joint Ventures:
Inter-corporate deposits 18.20 105.04 39.51
18.20 105.04 39.51
Other secured loans, considered good:
Loans against mortgage of house property 0.31 0.85 0.89
Other inter-corporate deposits – 75.62 70.00
0.31 76.47 70.89
Other unsecured loans, considered good:
Others 0.32 0.32 0.55
480.84 651.14 542.64
Notes forming part of the Consolidated Financial Statements (contd.)

382
NOTE [17]
Financial assets - current: Loans towards financing activities
Particulars As at 31-3-2017 As at 31-3-2016 As at 1-4-2015
v crore v crore v crore v crore v crore v crore
Secured loans:
Considered good:
Term loans 18212.95 13736.23 10678.00
Finance lease 25.85 46.30 65.00
Debentures 1052.12 176.80 96.03
Considered doubtful:
Term loans 0.14 86.74 5.95
19291.06 14046.07 10844.98
Less: Allowance for expected credit losses 0.14 86.74 5.95
19290.92 13959.33 10839.03
Unsecured loans:
Considered good:
Term loans 5325.67 4424.99 3222.72
Finance lease 303.81 303.79 220.27
Debentures 6.98 18.23 40.00
5636.46 4747.01 3482.99
24927.38 18706.34 14322.02
NOTE [18]
Other current financial assets
Particulars As at 31-3-2017 As at 31-3-2016 As at 1-4-2015
v crore v crore v crore v crore v crore v crore
Inter-corporate deposits - unsecured 20.01 – –
Advances to related parties:
Associate companies 7.87 7.78 21.02
Joint venture companies 129.37 102.50 74.35
137.24 110.28 95.37
Advances recoverable in cash 2348.04 2018.62 1916.58
Premium receivable on financial guarantee contracts 1.06 0.43 0.43
Embedded derivative receivables 197.23 144.41 61.44
Doubtful advances:
Deferred credit sale of ships 26.97 27.55 25.99
Other loan and advances 170.78 177.01 179.01
197.75 204.56 205.00
Less: Allowance for doubtful loan and advances 197.75 204.56 205.00
– – –
Billed interest and other receivable – 24.93 55.15
2703.58 2298.67 2128.97
Notes forming part of the Consolidated Financial Statements (contd.)
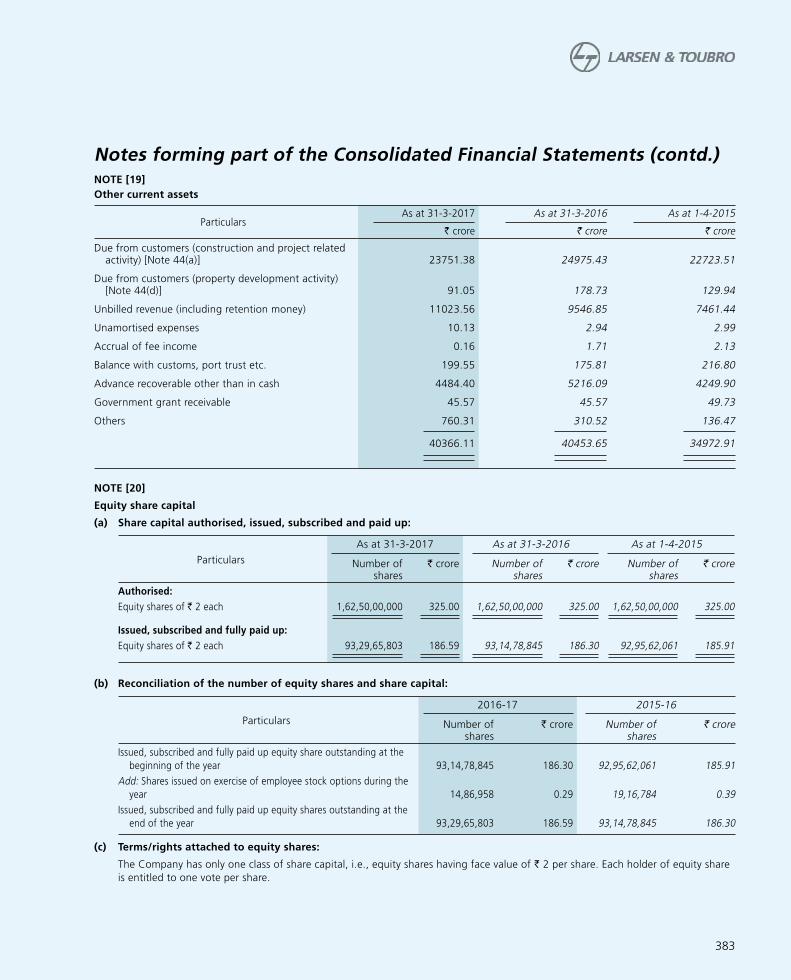
383
NOTE [19]
Other current assets
Particulars As at 31-3-2017 As at 31-3-2016 As at 1-4-2015
v crore v crore v crore
Due from customers (construction and project related activity) [Note 44(a)] 23751.38 24975.43 22723.51
Due from customers (property development activity) [Note 44(d)] 91.05 178.73 129.94
Unbilled revenue (including retention money) 11023.56 9546.85 7461.44
Unamortised expenses 10.13 2.94 2.99
Accrual of fee income 0.16 1.71 2.13
Balance with customs, port trust etc. 199.55 175.81 216.80
Advance recoverable other than in cash 4484.40 5216.09 4249.90
Government grant receivable 45.57 45.57 49.73
Others 760.31 310.52 136.47
40366.11 40453.65 34972.91
NOTE [20]
Equity share capital
(a) Share capital authorised, issued, subscribed and paid up:
Particulars
As at 31-3-2017 As at 31-3-2016 As at 1-4-2015
Number of shares
v crore Number of shares
v crore Number of shares
v crore
Authorised:
Equity shares of v 2 each 1,62,50,00,000 325.00 1,62,50,00,000 325.00 1,62,50,00,000 325.00
Issued, subscribed and fully paid up:
Equity shares of v 2 each 93,29,65,803 186.59 93,14,78,845 186.30 92,95,62,061 185.91
(b) Reconciliation of the number of equity shares and share capital:
Particulars
2016-17 2015-16
Number of shares
v crore Number of shares
v crore
Issued, subscribed and fully paid up equity share outstanding at the
beginning of the year 93,14,78,845 186.30 92,95,62,061 185.91
Add: Shares issued on exercise of employee stock options during the
year 14,86,958 0.29 19,16,784 0.39
Issued, subscribed and fully paid up equity shares outstanding at the
end of the year 93,29,65,803 186.59 93,14,78,845 186.30
(c) Terms/rights attached to equity shares:
The Company has only one class of share capital, i.e., equity shares having face value of v 2 per share. Each holder of equity share
is entitled to one vote per share.
Notes forming part of the Consolidated Financial Statements (contd.)

384
(d) Shareholder holding more than 5% of equity shares as at the end of the year:
Name of the shareholder
As at 31-3-2017 As at 31-3-2016 As at 1-4-2015
Number of shares
Shareholding %
Number of shares
Shareholding %
Number of shares
Shareholding %
Life Insurance Corporation of India 14,64,24,938 15.69 14,64,19,088 15.72 15,55,22,285 16.73
L&T Employees Welfare
Foundation 11,47,52,281 12.30 11,47,52,281 12.32 11,16,06,174 12.01
Administrator of the
Specified Undertaking of
the Unit Trust of India 6,11,02,860 6.55 7,59,26,462 8.15 7,59,25,962 8.17
(e) Shares reserved for issue under options outstanding as at the end of the year on un-issued share capital:
Particulars
As at 31-3-2017 As at 31-3-2016 As at 1-4-2015
Number of equity shares
to be issued as fully paid
v crore(at face value)
Number of equity shares
to be issued as fully paid
v crore(at face value)
Number of equity shares
to be issued as fully paid
v crore(at face value)
Employee stock options granted and outstanding # 42,47,360 0.85 * 57,93,042 1.16 * 77,08,842 1.54 *
0.675% 5 years & 1 day
US$ denominated foreign
currency convertible bonds
(FCCB) 63,46,986 1.27 ** 63,46,986 1.27 ** 63,46,986 1.27 **
* The equity shares will be issued at a premium of v 146.71 crore (previous year: v 203.97 crore)
** The equity shares will be issued at a premium of v 1215.13 crore (previous year: v 1215.13 crore) on the exercise of options
by the bond holders
# Note 20(h) for terms of employee stock option schemes
(f) The aggregate number of equity shares allotted as fully paid up by way of bonus shares in immediately preceding five years ended
March 31, 2017 are 30,82,94,576 (previous period of five years ended March 31, 2016: 30,82,94,576 shares)
(g) The aggregate number of equity shares issued pursuant to contract, without payment being received in cash in immediately
preceding last five years ended on March 31, 2017 – Nil (previous period of five years ended March 31, 2016: Nil)
(h) Stock option schemes of Parent Company
(i) Terms:
• The grant of options to the employees under the stock option schemes is on the basis of their performance and other
eligibility criteria. The options are vested equally over a period of 4 years [5 years in the case of series 2006(A)], subject
to the discretion of the management and fulfillment of certain conditions.
• Options can be exercised anytime within a period of 7 years from the date of grant and would be settled by way of issue
of equity shares. Management has discretion to modify the exercise period.
(ii) The details of the grants under the aforesaid schemes under various series are summarized below:
Sr.
no.Series reference
2000 2002 (A) 2002 (B) 2003 ( A) 2003(B) 2006 2006(A)
2016-17 2015-16 2016-17 2015-16 2016-17 2015-16 2016-17 2015-16 2016-17 2015-16 2016-17 2015-16 2016-17 2015-16
1 Grant price - (v) 2.30 2.30 2.30 2.30 2.30 2.30 11.70 11.70 11.70 11.70 400.70 400.70 400.70 400.70
2 Grant dates 1-6-2000 19-4-2002 19-4-2002 23-5-2003 onwards 23-5-2003 onwards 1-9-2006 onwards 1-7-2007 onwards
3 Vesting commences on 1-6-2001 19-4-2003 19-4-2003 23-5-2004 onwards 23-5-2004 onwards 1-9-2007 onwards 1-7-2008 onwards
4 Options granted and outstanding
at the beginning of the year 25,200 25,200 32,250 32,250 59,550 59,550 47,178 47,178 5,26,919 5,85,284 2,57,366 3,04,656 48,44,579 66,54,724
5 Options lapsed during the year – – – – – – – – 41,662 40,611 35,747 11,270 4,54,865 4,42,400
6 Options granted during the year – – – – – – – – 89,100 1,50,400 – – 3,84,450 3,44,865
Notes forming part of the Consolidated Financial Statements (contd.)

385
Sr.
no.Series reference
2000 2002 (A) 2002 (B) 2003 ( A) 2003(B) 2006 2006(A)
2016-17 2015-16 2016-17 2015-16 2016-17 2015-16 2016-17 2015-16 2016-17 2015-16 2016-17 2015-16 2016-17 2015-16
7 Options exercised during
the year 12,000 – – – – – – – 1,47,226 1,68,154 45,035 36,020 12,82,697 17,12,610
8 Options granted and outstanding
at the end of the year 13,200 25,200 32,250 32,250 59,550 59,550 47,178 47,178 4,27,131 5,26,919 1,76,584 2,57,366 34,91,467 48,44,579
Of which
Options vested 13,200 25,200 32,250 32,250 59,550 59,550 47,178 47,178 75,692 96,458 1,76,584 2,57,366 17,46,787 23,34,008
Options yet to vest – – – – – – – – 3,51,439 4,30,461 – – 17,44,680 25,10,571
9 Weighted average remaining
contractual life of options (in
years) Nil Nil Nil Nil Nil Nil Nil Nil 4.98 5.18 Nil Nil 3.48 3.61
(iii) The number and weighted average exercise price of stock options are as follows:
Particulars
2016-17 2015-16
No. of stock options
Weighted average
exercise price(v)
No. of stock options
Weighted average
exercise price(v)
(A) Options granted and outstanding at the beginning of the year 57,93,042 354.10 77,08,842 362.74
(B) Options granted during the year 4,73,550 327.51 4,95,265 282.57
(C) Options allotted during the year 14,86,958 358.97 19,16,784 366.57
(D) Options lapsed during the year 5,32,274 370.25 4,94,281 368.74
(E) Options granted and outstanding at the end of the year 42,47,360 347.41 57,93,042 354.10
(F) Options exercisable at the end of the year out of (E) supra 21,51,241 359.04 28,52,010 364.76
(iv) Weighted average share price at the date of exercise for stock options exercised during the year is v1386.19 (previous year:
v 1543.13) per share.
(v) In respect of stock options granted pursuant to the Company’s stock options schemes, the fair value of the options is treated
as discount and accounted as employee compensation over the vesting period.
(vi) Weighted average fair values of options granted during the year is v 1056.73 (previous year: v 965.39) per option
(vii) The fair value has been calculated using the Black-Scholes Option Pricing Model and the significant assumptions and inputs to
estimate the fair value of options granted during the year are as follows:
Sr. no.
Particulars 2016-17 2015-16
(A) Weighted average risk-free interest rate 6.72% 7.66%
(B) Weighted average expected life of options 4.08 years 3.86 years
(C) Weighted average expected volatility 30.79% 30.52%
(D) Weighted average expected dividends over the life of the option v 74.52 per option v 62.69 per option
(E) Weighted average share price v 1355.66 per option v 1211.45 per option
(F) Weighted average exercise price v 327.51 per share v 282.57 per share
(G) Method used to determine expected volatility Expected volatility is based on the historical
volatility of the Company’s share price applicable
to the total expected life of each option.
(viii) The balance in share options (net) account as on March 31, 2017 is v 177.25 crore (previous year: v 242.23 crore), including
v 117.36 crore (previous year: v 155.87 crore) for which the options have been vested to employees as on March 31, 2017.
(i) During the year ended March 31, 2017, the Company paid the final dividend of v 18.25 per equity share for the year ended March 31, 2016.
Notes forming part of the Consolidated Financial Statements (contd.)
NOTE [20] (contd.)

386
The Board of Directors has recommended for approval of shareholders, the issue of bonus equity shares in the ratio of 1:2 (one bonus equity share of R 2 each for every 2 equity shares of R 2 each held). On May 29, 2017, the Board of Directors has recommended the final dividend of v 21.00 per equity share on the pre-bonus share capital for the year ended March 31, 2017 subject to approval from shareholders. On approval, the total dividend payment based on number of shares outstanding as on March 31, 2017 is expected to be v 1959.23 crore and the payment of dividend distribution tax is expected to be v 398.85 crore.
(j) Capital Management
The Group continues its policy of a conservative capital structure which has ensured that it retains the highest credit rating even amidst an adverse economic environment. Low gearing levels also equip the Group with the ability to navigate business stresses on one hand and raise growth capital on the other. This policy also provides flexibility of fund raising options for future, which is especially important in times of global economic volatility. The gross debt equity ratio is 1.75:1 (as at 31-3-2016: 1.87:1 and as at 1-4-2015: 1.78:1).
(k) Stock ownership scheme of subsidiary companies:
(i) Larsen & Toubro Infotech Limited
Employee Stock Ownership Scheme (‘ESOS Plan’)
(A) The grant of options to the employees under ESOS Plan is on the basis of their performance and other eligibility criteria.
Sr. no.
ESOP Series
ESOP scheme 2000 I,II & III
ESOP scheme 2000 IV - XXI
U.S. Stock Option Sub-plan 2006
ESOP scheme 2015
2016-17 2015-16 2016-17 2015-16 2016-17 2015-16 2016-17
i Grant Price v 5 v 5 v 2 v 2 USD 2.4 USD 2.4 v 1
ii Grant Dates 1 April 2001 onwards 1 October 2001 onwards
15 March 2007 onwards
10 June 2016
onwards
iii Vesting commences on 1 April 2002 onwards 1 October 2002 onwards
15 March 2008 onwards
10 June 2017
onwards
iv Options granted and outstanding at the beginning of the year 82,660 19,65,015 23,50,106 93,67,335 1,43,650 4,50,500 –
v Options reinstated during the year – 3,500 – 4,54,580 – – –
vi Options granted during the year – – – – – – 36,58,000
vii Options allotted during the year 11,830 18,51,855 7,25,445 64,07,483 17,650 3,06,850 –
viii Options lapsed/cancelled during the year 34,110 34,000 1,73,936 10,64,326 79,000 – 61,700
ix Options granted and outstanding at the end of the year 36,720 82,660 14,50,725 23,50,106 47,000 1,43,650 35,96,300
x Options vested at the end of the year out of (ix) 36,720 82,660 2,23,760 3,40,666 47,000 1,43,650 –
xi Options unvested at the end of the year out of (ix) – – 12,26,965 20,09,440 – – 35,96,300
xii Weighted average remaining contractual life of options (in years) – – 1.7 2.7 – – 6.2
The number and weighted average exercise price of stock options are as follows:
Sr. no.
Particulars
2016-17 2015-16
No. of stock options
Weighted average
exercise price
No. of stock options
Weighted average
exercise price
i Options granted and outstanding at the beginning of the year
25,76,416 11.14 1,14,76,000 8.70
ii Options reinstated during the year – – 4,58,080 2.02
iii Options granted during the year 35,96,300 1.00 – –
iv Options allotted during the year 7,54,925 5.64 29,16,181 8.46
v Options lapsed/cancelled during the year 3,48,746 36.92 64,41,483 2.09
vi Options granted and outstanding at the end of the year
51,30,745 2.73 25,76,416 11.14
vii Options vested at the end of the year out of (vi) 3,07,480 25.84 5,66,976 43.51
Notes forming part of the Consolidated Financial Statements (contd.)
NOTE [20] (contd.)

387
(B) The aggregate number of equity shares allotted as fully paid up by way of bonus shares in immediately preceding five
years ended 31-3-2017 are Nil (previous period of five years ended 31-3-2016 - Nil)
(C) The aggregate number of equity shares issued pursuant to contract, without payment being received in cash in
immediately preceding five years ended 31-3-2017 – Nil (previous period of five years ended 31-3-2016 - Nil)
(D) Weighted average share price at the date of exercise for stock options exercised during the year is v 621 per share.
(E) Weighted average fair value of options granted during the year is v 407.39.
(F) The fair value has been calculated using the Black-Scholes Option Pricing model and significant assumptions and inputs
to estimate the fair value options granted during the year are as follows:
Sr. no. Particulars 2016-17
i Weighted average risk-free interest rate 7.10%
ii Weighted average expected life of options 3 years
iii Weighted average expected volatility 19.23%
iv Weighted average expected dividends over the life of option v 115.56
v Weighted average share price v 407.74
vi Weighted average exercise price v 1
vii Method used to determine expected volatility The expected volatility has been calculated
entirely based on historic volatility IT Index, as
historical data of the Company is not available
being an unlisted company.
(ii) L& T Technology Services Limited
(A) Employee stock option plan (ESOP)
The establishment of the ESOP scheme, 2016 was done pursuant to the resolutions passed by the Board and the Shareholders on January 21, 2016 for issue of options to eligible employees which may result in issue of not more than 60,00,000 equity shares. In terms of the ESOP Scheme, 2016, the Company can grant options aggregating to not more than 8.0% of the paid up equity share capital of the Company as on April 1, 2016. The eligible employees include permanent employees (including executive directors and non-executive directors, but excluding the independent directors) of the Company, its subsidiaries, or holding company. However, unless otherwise decided by the Board, in the event the subsidiaries or the holding company have implemented a stock option scheme, the employees of such entities will not be eligible for grant of options under the ESOP Scheme, 2016. Further, the employees (i) holding 10.0% of the outstanding share capital of the Company at any time after the commencement of the ESOP Scheme, 2016, or (ii) who are promoters or persons belonging to promoter group, or directors, who either by themselves or through their relatives or any body corporate, directly or indirectly, hold more than 10.0% of the outstanding equity shares of the Company, will not be eligible for grant of options under the ESOP Scheme, 2016
The objective of the ESOP Scheme, 2016 is to reward those employees who contribute significantly to the Company’s profitability and shareholder’s value as well as encourage improvement in performance and retention of talent.
The vesting of options granted under the ESOP Scheme, 2016 will commence one year after the date of grant of options at the rate of 20.0% of options granted each year, or at such other rates as may be fixed by the Board and may extend up to five years from the date of grant of options, unless otherwise varied in accordance with the employee stock option rules to be framed under the ESOP Scheme, 2016. The exercise period for the options granted under the ESOP Scheme, 2016 would be seven years from the date of grant of options or six years from the date of first vesting or three years from the date of retirement/death, whichever is earlier, subject to any change as may be approved by the Board. The exercise price may be decided by the Board, in such manner, during such period, in one or more tranches and on such terms and conditions as it may deem fit, provided that the exercise price per option shall not be less than the par value of the equity share of our Company and shall not be more than the market price as defined in the SEBI ESOP Regulations and shall be subject to compliance with accounting policies under the ESOP Regulations. The number of shares to be allotted on exercise of options should not exceed the total number of unexercised vested options that may be exercised by the employee.
Further, on resignation / termination of the eligible employees, only the vested options would be exercisable. All other grants if unvested for any reason whatsoever shall be deemed lapsed. Such eligible employee is required to exercise the options within a period of 90 days from the last date of employment or such other period as may be decided by the Board at the time of such separation. In the event an eligible employee retires or is permanently incapacitated, all unvested options will vest in the said employee immediately. The eligible employee has to exercise options within a period of three years from the date of retirement or the date of permanent incapacitation, as the case may be, or such
Notes forming part of the Consolidated Financial Statements (contd.)
NOTE [20] (contd.)

388
other period as may be decided by the Board. In case of voluntary or pre-mature retirement, the eligible employee will exercise only the vested options within 180 days from the last date of employment. All other unvested options will lapse. However, the Board will have the discretion to vest the unvested options in deserving cases and where the employee has crossed the age of 55 years. The retiring age for non-executive directors shall be 75 years or as may be decided by Board and on attainment of which, all the unvested options of the non-executive directors shall be vested with them immediately. In event of death of the eligible employee, unvested options shall be vested immediately in the nominees or legal heirs, as the case may be, and in the event of death of any of the nominees, his share shall vest in the surviving
nominees or legal heirs, pro-rata
Particulars
31-03-2017
Average exercise
price per share
option (v)
Number of options
Opening balance – –
Granted during the year 2.00 41,45,000
Exercised during the year – –
Lapsed during the year – 1,65,000
Forfeited during the year – –
Closing balance – 39,80,000
Vested and exercisable – –
No options expired during the periods covered in the above table
Shares options outstanding at the end of the year have the following expiry date and exercise prices.
Grant date Expiry date Exercise price
(v)
Share options
31-03-2017
28-07-2016 27-07-2023 2.00 20,00,000
27-08-2016 26-08-2023 2.00 19,80,000
Total 39,80,000
Options granted on July 28, 2016 includes 15,00,000 and 5,00,000 options allotted to non-executive directors and key
managerial personnel respectively.
Options granted on August 28, 2016 includes 50,000 options allotted to key managerial personnel.
Weighted average remaining contractual life of options outstanding at the end of period is 2.32 years
(B) Fair value of options granted:
The fair value at grant date of options granted during the year ended 31-03-2017 was v 281.00 (31-03-2016 - v Nil).
The fair value of grant date is determined using the Black-Scholes Model which takes into account the exercise price,
term of option, share price at grant date and expected price volatility of the underlying share, the expected dividend
yield and the risk free interest rate for the term of the option.
The model inputs for options granted during the year ended 31-03-2017 included:
Sr. No. Particulars 2016-17
i Weighted average exercise price* v 2.00
ii Grant date 28-07-2016 and 27-08-2016
iii Expiry date 27-07-2023 and 26-08-2023
iv Weighted average share price at grant date # v 281.00
v Weighted average expected price volatility of company’s share 25.17%
vi Weighted average expected dividend yield over life of option 18.5%
vii Weighted average risk-free interest 6.95%
viii Method used to determine expected volatility The expected price volatility is based on the
historic volatility (based on the remaining life of
the options), adjusted for any expected changes to
future volatility due to publicly available information.
* The first vesting is due on 27-07-2017.
# As the Company was not listed on the date of grant, price at grant date has been taken as per the valuation done by a
category 1 merchant banker.
Notes forming part of the Consolidated Financial Statements (contd.)
NOTE [20] (contd.)

389
(iii) L&T Finance Holdings Limited
(A) The subsidiary has formulated Employee Stock Option Schemes 2010 (ESOP Scheme-2010), 2010-A (ESOP Scheme 2010-
A) and 2013 (ESOP Scheme 2013). The grant of options to the employee under the Stock Options scheme is on the basis
of their performance and other eligibility criteria. The options are vested over a period of 4 years in ratio of 15%, 20%,
30% and 35% respectively from the date of grant, subject to the discretion of the management and fulfilment of certain
conditions. Options can be exercised within a period of 7 years from the date of grant for schemes 2010 and 2010A.
The options granted under scheme 2013 can be exercised within period of 8 years from the date of grant and would be
settled by way of equity. Management has discretion to modify the exercise period.
(B) The details of the grants are summarised below:
Sr.
no. Series referenceScheme 2010 Scheme 2013
2016-17 2015-16 2016-17 2015-16
1 Grant Price (v) 44.20 Market Price
2 Options granted and outstanding at the beginning
of the year 61,08,998 68,02,519 2,35,50,000 2,63,50,000
3 Options granted during the year 6,50,000 9,00,000 1,16,40,000 –
4 Options cancelled/ lapsed during the year 21,36,393 3,17,841 1,08,77,500 28,00,000
5 Options exercised and shares allotted during the year 18,03,810 12,75,680 5,19,500 –
6 Options granted and outstanding at the end of the
year 28,18,795 61,08,998 2,37,93,000 2,35,50,000
of which
Options vested 15,76,795 40,95,548 23,90,500 –
Options yet to vest 12,42,000 20,13,450 2,14,02,500 2,35,50,000
7 Weighted average remaining contractual life of
options (in years) 5.05 5.40 6.29 6.56
(C) Weighted average fair values of options granted during the year is v 27.24 (previous year: v 32.02) per options.
(D) The fair value has been calculated using the Black-Scholes Option Pricing Model and the significant assumptions and
inputs to estimate the fair value of options granted during the year are as follows:
Sr.
no.Particulars 2016-17 2015-16
a) Weighted average risk-free interest rate 7.49% 7.52%
b) Weighted average expected life of options 3.98 years 3.68 years
c) Weighted average expected volatility 32.53% 31.78%
d) Weighted average expected dividends v 3.19 per option v 2.94 per option
e) Weighted average share price v 75.53 per option v 65.73 per option
f) Weighted average exercise price v 73.70 per option v 44.20 per option
g) Method used to determine expected volatility Expected volatility is based on the
historical volatility of the Company’s
shares price applicable to the expected
life of each option.
Notes forming part of the Consolidated Financial Statements (contd.)
NOTE [20] (contd.)

390
NOTE [21]
Other equity
Particulars As at 31-3-2017 As at 31-3-2016 As at 1-4-2015
v crore v crore v crore v crore v crore v crore
Equity component of foreign currency convertible
bonds [Note 63(J)]
153.20 153.20 153.20
Capital reserve [Note 1(g)]
Capital reserve 10.52 10.52 10.52
Capital reserve on consolidation 269.76 269.88 270.54
280.28 280.40 281.06
Securities premium account [Note 1(t)] 8318.85 8164.72 7963.16
Employee share options (net) [Note 1(v)]
Employee share options outstanding 595.25 437.03 571.77
Deferred employee compensation expense (292.00) (154.81) (202.53)
303.25 282.22 369.24
Statutory reserves
Debenture redemption reserve ^ 1025.44 1119.98 852.20
Reserve u/s 45 IC of the Rerserve Bank of India
Act, 1934 1222.89 1142.69 863.28
Reserve u/s 29C of National Housing Bank Act, 1987 32.00 32.00 20.39
Reserve u/s 36(1)(viii) of Income Tax Act, 1961 461.97 364.63 251.50
2742.30 2659.30 1987.37
Retained earnings 37335.32 31724.59 29703.20
Foreign currency translation reserve [Note 1(w)(iii)] 478.24 609.59 538.23
Hedging reserve [Note 1(q)]
Cash flow hedging reserve 405.32 59.24 (25.96)
Cost of hedging reserve (57.80) (15.23) (25.94)
347.52 44.01 (51.90)
Debt instruments through other comprehensive
income [Note 1(q)] 70.97 76.03 78.62
50029.93 43994.06 41022.18
^ Debenture redemption reserve (DRR): The Group has issued redeemable non-convertible debentures and created DRR in terms of the
Companies (Share capital and Debenture) Rules, 2014 (as amended). A company is required to maintain a DRR of 25% of the value
of debentures issued, either by a public issue or on a private placement basis (excluding private placement by non-banking finance
companies). The amounts credited to the DRR may not be utilised except to redeem debenture.
Notes forming part of the Consolidated Financial Statements (contd.)

391
NOTE [22]
Financial liabilities: Borrowings - non-current
Particulars
As at 31-3-2017 As at 31-3-2016 As at 1-4-2015
Secured Unsecured Total Secured Unsecured Total Secured Unsecured Total
v crore v crore v crore v crore v crore v crore v crore v crore v crore
Redeemable non-convertible fixed rate
debentures 19633.76 9776.15 29409.91 15746.68 9685.53 25432.21 15288.02 8407.72 23695.74
Redeemable non-convertible floating rate
debentures 275.00 – 275.00 219.28 – 219.28 203.26 – 203.26
Redeemable non-convertible inflation indexed
debentures – 113.52 113.52 – 110.32 110.32 – 111.30 111.30
Preference shares – 1147.02 1147.02 – 1312.99 1312.99 – 1456.98 1456.98
0.675% Foreign currency convertible bonds – 1201.78 1201.78 – 1190.86 1190.86 – 1089.81 1089.81
Term loans from banks 22412.79 12741.60 35154.39 20553.17 12157.94 32711.11 16461.58 9404.05 25865.63
Term loans from others – 38.63 38.63 0.02 38.14 38.16 0.03 34.24 34.27
Loans from financial institutions – – – 2.56 – 2.56 6.75 – 6.75
Finance lease obligation [Note 48(b)(i)(B)] – 0.25 0.25 – 0.23 0.23 – 39.48 39.48
Sales tax deferment loan – 0.08 0.08 – 0.28 0.28 – 0.62 0.62
Perpetual debts – – – – 205.84 205.84 – 205.80 205.80
42321.55 25019.03 67340.58 36521.71 24702.13 61223.84 31959.64 20750.00 52709.64
Loans guaranteed by directors v Nil (previous year: v Nil)
NOTE [23]
Other financial liabilities - non-current
Particulars As at 31-3-2017 As at 31-3-2016 As at 1-4-2015
v crore v crore v crore
Forward contract payables 38.39 47.81 100.72
Embedded derivative payables 32.48 4.85 53.99
Due to others 120.46 88.74 67.41
191.33 141.40 222.12
NOTE [24]
Provisions - non-current
Particulars As at 31-3-2017 As at 31-3-2016 As at 1-4-2015
v crore v crore v crore
Employee pension scheme [Note 45(b)(i)] 294.74 231.38 208.00
Post-retirement medical benefit plan [Note 45(b)(i)] 221.19 176.24 166.49
Provision for interest rate guarantee (Provident fund) – 0.61 8.88
Provision for employee benefits-Others 9.20 16.43 1.98
Other provisions [Note 53] 1.46 – –
526.59 424.66 385.35
Notes forming part of the Consolidated Financial Statements (contd.)

392
NOTE [25]
Other non-current Liabilities
Particulars As at 31-3-2017 As at 31-3-2016 As at 1-4-2015
v crore v crore v crore
Deferred income on loan processing/ assignment 44.70 47.11 39.13
Other payables 127.44 134.03 172.80
172.14 181.14 211.93
NOTE [26]
Financial liabilities: Borrowings - current
Particulars
As at 31-3-2017 As at 31-3-2016 As at 1-4-2015
Secured Unsecured Total Secured Unsecured Total Secured Unsecured Total
v crore v crore v crore v crore v crore v crore v crore v crore v crore
Loans repayable on demand 1736.72 65.50 1802.22 1590.31 176.63 1766.94 1605.01 234.95 1839.96
Short term loan and advances from banks 365.83 1965.74 2331.57 732.77 4547.72 5280.49 1212.27 3605.83 4818.10
Short term unsecured loan from others – 429.05 429.05 – – – – – –
Short term unsecured fixed rate debentures – – – – – – – 526.17 526.17
Loans from related parties – – – – 30.23 30.23 – 37.97 37.97
Commercial Paper – 11993.95 11993.95 – 7819.09 7819.09 – 8674.94 8674.94
2102.55 14454.24 16556.79 2323.08 12573.67 14896.75 2817.28 13079.86 15897.14
Loans guaranteed by directors v Nil (previous year: v Nil)
NOTE [27]
Financial liabilities: Current maturities of long term borrowings
Particulars
As at 31-3-2017 As at 31-3-2016 As at 1-4-2015
Secured Unsecured Total Secured Unsecured Total Secured Unsecured Total
v crore v crore v crore v crore v crore v crore v crore v crore v crore
Redeemable non-convertible fixed rate
debentures 5181.37 2217.74 7399.11 5554.61 1940.83 7495.44 2727.71 647.60 3375.31
Redeemable non-convertible floating rate
debentures – – – 109.04 – 109.04 0.54 – 0.54
Preference shares – 178.82 178.82 – – – – – –
Term loans from banks 993.20 1506.34 2499.54 3565.33 840.36 4405.69 4677.74 51.86 4729.60
Term loans from others – – – – – – 1.45 3.26 4.71
Loans from financial institutions 0.63 – 0.63 4.28 – 4.28 12.10 – 12.10
Finance lease obligation [Note 48(b)(i)(B)] – 0.60 0.60 – 0.11 0.11 – 0.16 0.16
Sales tax deferment loan – 0.20 0.20 – 0.34 0.34 – 0.45 0.45
6175.20 3903.70 10078.90 9233.26 2781.64 12014.90 7419.54 703.33 8122.87
Loans guaranteed by directors v Nil (previous year: v Nil)
Notes forming part of the Consolidated Financial Statements (contd.)

393
NOTE [28]
Financial liabilities - current: Trade payables
Particulars As at 31-3-2017 As at 31-3-2016 As at 1-4-2015
v crore v crore v crore v crore v crore v crore
Acceptances 390.20 756.59 1170.96
Due to related parties:
Associate companies 18.41 17.05 80.88
Joint venture companies 1929.05 1723.21 1427.30
1947.46 1740.26 1508.18
Micro and small enterprises 142.00 151.92 140.95
Due to others 27294.59 24354.79 19236.80
29774.25 27003.56 22056.89
NOTE [29]
Other financial liabilities - current
Particulars As at 31-3-2017 As at 31-3-2016 As at 1-4-2015
v crore v crore v crore
Unclaimed dividend 46.61 39.33 33.59
Unclaimed interest on debentures 10.87 17.22 10.31
Financial guarantee contracts 1.55 1.19 1.22
Embedded derivative payables 184.70 181.06 68.83
Due to others* 4945.32 4083.64 3658.90
5189.05 4322.44 3772.85
* Due to others include due to directors v 55.58 crore (as at 31-3-2016: v 51.30 crore; as at 1-4-2015 v 53.83 crore)
NOTE [30]
Other current liabilities
Particulars As at 31-3-2017 As at 31-3-2016 As at 1-4-2015
v crore v crore v crore
Due to customers (construction related activity) 6163.28 5661.02 4425.28
Due to customers (property development projects) 525.44 768.53 637.65
Advances from customers 13944.29 14946.19 13084.65
Other payables 2811.73 3032.15 2657.02
23444.74 24407.89 20804.60
Notes forming part of the Consolidated Financial Statements (contd.)

394
NOTE [31]
Current liabilities: Provisions
Particulars As at 31-3-2017 As at 31-3-2016 As at 1-4-2015
v crore v crore v crore v crore v crore v crore
Provision for employee benefits:
Gratuity [Note 45(b)(i)] 191.31 147.74 130.14
Compensated absences 999.95 918.28 848.48
Employee pension scheme [Note 45(b)(i)] 22.67 56.17 13.47
Post-retirement medical benefits plan [Note 45(b)(i)] 13.36 17.07 14.59
Others 4.09 5.00 0.48
1231.38 1144.26 1007.16
Others :
Additional tax on dividend 18.94 22.42 12.75
Reserve for unexpired risks – 222.42 155.64
Other provisions [Note 53] 1408.02 914.42 501.30
1426.96 1159.26 669.69
2658.34 2303.52 1676.85
NOTE [32]
Contingent Liabilities
Particulars As at 31-3-2017 As at 31-3-2016 As at 1-4-2015
v crore v crore v crore
(a) Claims against the Group not acknowledged as debts 4359.98 4008.18 1596.37
(b) Sales tax liability that may arise in respect of matters in appeal 239.66 263.64 185.37
(c) Excise duty / service tax / custom duty / entry tax / stamp duty /
municipal cess liability that may arise, including those in respect of
matters in appeal / challenged by the Group in Writ 265.37 243.90 222.44
(d) Income tax liability that may arise in respect of which the Group is
in appeal 753.91 725.91 1215.92
(e) Guarantees and letter of credit and letter of comfort given 1416.72 1268.64 1297.00
(f) Contingent liabilities incurred in relation to interests in joint
operations 7018.24 4170.76 3248.49
(g) Contingent liabilities in respect of liabilities of other joint operators
of joint operations 6230.96 8006.19 10840.81
(h) Share in contingent liabilities of joint operations for which the
Group is contingently liable 53.24 58.18 80.13
Notes:
(i) The Group expects reimbursements of v 34.01 crore (previous year: v 27.09 crore) in respect of the above contingent liabilities.
(ii) It is not practicable to estimate the timing of cash outflows, if any, in respect of matters at (a) to (d) above pending resolution
of the arbitration/appellate proceedings. Further, the liability mentioned in (a) to (d) above excludes interest and penalty in cases
where the Group has determined that the possibility of such levy is remote.
(iii) In respect of matters at (f) to (h), the cash outflows, if any, could generally occur upto completion of projects undertaken by the
respective joint operations.
(iv) Particulars of share in contingent liabilities of joint ventures and associates are given in Note 55 (g).
Notes forming part of the Consolidated Financial Statements (contd.)

395
NOTE [33]
Commitments:
Particulars As at 31-3-2017 As at 31-3-2016 As at 1-4-2015
v crore v crore v crore
(a) Estimated amount of contracts remaining to be executed on capital
account (net of advances). 4287.99 4441.55 8718.29
(b) Funding committed by way of equity/loans to joint venture
companies – 404.64 1443.41
(c) Share in capital commitments of joint operations – 2.61 159.34
Particulars of share in capital commitments of joint ventures and associates are given in Note 55 (g).
NOTE [34]
Revenue from operations
Particulars 2016-17 2015-16
v crore v crore v crore v crore
Sales and service:
Construction and project related activity [Note 44(a)] 74504.71 68838.65
Manufacturing and trading activity 9083.68 9915.25
Engineering and service fees 3239.35 3046.77
Software development products and services 6336.81 5694.92
Income from financing activity 9064.39 8208.30
Property development activity [Note 44(d)] 2272.71 1444.81
Servicing fees 825.71 888.52
Commission 163.89 157.65
Income from port services – 88.54
Charter hire income 1.66 3.67
Investment/portfolio management and trusteeship fees 451.69 340.43
Fees for operation and maintenance of power plant 2216.31 1960.36
Premium earned (net) from insurance business 174.73 297.83
108335.64 100885.70
Other operational income:
Income from hire of plant and equipment 19.64 27.34
Lease rentals 70.89 200.67
Property maintenance recoveries – 14.23
Facility management income – 34.14
Premium earned (net) on related forward exchange contracts 254.56 192.88
Profit on sale of subsidiaries/associate of realty business 95.81 236.53
Technical fees – 0.22
Miscellaneous income 1234.46 383.63
1675.36 1089.64
110011.00 101975.34
Notes forming part of the Consolidated Financial Statements (contd.)

396
NOTE [35]
Other income
Particulars 2016-17 2015-16
v crore v crore v crore v crore
Interest income:
Interest income on long term investments 22.19 44.97
Interest income on current investments 205.77 199.36
Interest income on others:
Joint venture & associate companies 82.12 62.85
Others 112.54 119.67
422.62 426.85
Dividend income:
Trade investments 1.64 2.43
Others 82.45 79.52
84.09 81.95
From current investments 664.54 114.17
748.63 196.12
Net gain/(loss) on sale or fair valuation of investments 34.22 65.73
Net gain/(loss) on sale of property, plant and equipment 17.88 60.55
Lease rentals 7.73 9.75
Miscellaneous income (net of expenses) 169.93 145.35
1401.01 904.35
NOTE [36]
Manufacturing, construction and operating expenses
Particulars 2016-17 2015-16
v crore v crore v crore v crore
Materials consumed:
Raw materials and components 14425.96 13816.10
Less: Scrap sales 104.98 86.12
14320.98 13729.98Excise duty 699.19 852.86 Construction materials consumed 20732.39 20256.77 Purchase of stock-in-trade 1610.57 1349.93Value of stock-in-trade transferred on sale of business – (16.49)
1610.57 1333.44Stores, spares and tools consumed 2090.42 1834.19 Sub-contracting charges 22556.13 20788.86 Change in inventories of finished goods, work-in-progress,
stock-in-trade and property development: Closing stock: Finished goods 340.82 284.99 Stock-in-trade 188.59 179.99 Work-in-progress 4385.19 4570.76 Cost of built up space and property development land: Work-in-progress 1259.39 1191.81 Completed property – – Property development land – 293.63
6173.99 6521.18
Carried forward 6173.99 62009.68 6521.18 58796.10
Notes forming part of the Consolidated Financial Statements (contd.)

397
Particulars 2016-17 2015-16
v crore v crore v crore v crore
Brought forward 6173.99 62009.68 6521.18 58796.10
Less: Opening stock:
Finished goods 284.99 403.10
Stock-in-trade 179.99 178.02
Work-in-progress 4570.76 4523.29
Cost of built up space and property development land:
Work-in-progress 1197.58 1900.34
Completed property – 91.81
Property development land 293.63 234.26
6526.95 7330.82
352.96 809.64
Value of inventory transferred on sale of business (268.96) –
Internal capitalisation of property development land – (1324.50)
84.00 (514.86)
Other manufacturing, construction and operating expenses:
Excise duty 19.28 (1.40)
Power and fuel 1309.05 1116.02
Royalty and technical know-how fees 16.44 17.66
Packing and forwarding 383.45 364.81
Hire charges-plant and equipment and others 1375.15 998.79
Bank guarantee charges 176.80 155.60
Insurance claim incurred (net) 152.01 218.96
Engineering, professional, technical and consultancy fees 1176.73 1145.35
Insurance 227.25 205.52
Rent 492.58 502.75
Rates and taxes 405.05 333.68
Travelling and conveyance 1016.00 1053.88
Repairs to plant and equipment 92.39 80.22
Repairs to buildings 25.42 20.12
General repairs and maintenance 377.86 311.76
Port operation expenses – 12.62
Miscellaneous expenses 3338.02 2624.22
10583.48 9160.56
Finance cost of financial services business and finance lease activity:
Interest and other financing charges 5362.09 4967.11
5362.09 4967.11
78039.25 72408.91
Notes forming part of the Consolidated Financial Statements (contd.)
NOTE [36]
Manufacturing, construction and operating expenses (contd.)

398
NOTE [37]
Employee benefits expense
Particulars 2016-17 2015-16
v crore v crore v crore v crore
Salaries, wages and bonus 12479.83 11882.28
Contribution to and provision for:
Provident fund and pension fund 212.31 214.97
Superannuation/employee pension schemes 36.54 87.02
Gratuity funds [Note 45(b)(ii)] 131.78 119.84
380.63 421.83
Expenses on employee stock options scheme 88.17 67.55
Employee medical & other insurance premium expenses 170.88 140.44
Staff welfare expenses 1013.50 980.87
Recoveries on account of deputation charges (279.94) (162.13)
13853.07 13330.84
NOTE [38]
Sales, administration and other expenses
Particulars 2016-17 2015-16
v crore v crore v crore v crore
Power and fuel 114.14 127.43
Packing and forwarding 157.97 185.36
Insurance 75.63 79.90
Rent 496.13 513.75
Rates and taxes 166.34 148.43
Travelling and conveyance 623.48 613.81
Repairs to buildings 20.66 21.50
General repairs and maintenance 440.20 403.43
Professional fees 568.76 572.00
Directors’ fees 3.60 2.85
Telephone, postage and telegrams 201.19 211.33
Advertising and publicity 196.82 186.41
Stationery and printing 64.63 72.40
Commission:
Distributors and agents 286.64 232.75
Others 6.49 6.07
293.13 238.82
Bank charges 128.45 120.91
Discount on sales 0.51 -
Miscellaneous expenses 721.44 672.28
Bad debts and advances written off 458.55 274.56
Less: Allowances for doubtful debts and advances written back 82.24 15.55
376.31 259.01
Carried forward 4649.39 4429.62
Notes forming part of the Consolidated Financial Statements (contd.)

399
Particulars 2016-17 2015-16
v crore v crore v crore v crore
Brought forward 4649.39 4429.62
Receivable discounting charges -non recourse 50.90 12.63
Allowances for doubtful debts and loans and advances (net) 2075.54 1093.34
Provision/(reversal) for foreseeable losses on construction contracts (8.91) 76.48
Exchange (gain)/loss [net] 50.65 95.05
Other provisions 227.93 71.40
7045.50 5778.52
NOTE [39]
Finance costs
Particulars2016-17 2015-16
v crore v crore
Interest expenses 1271.63 1500.26
Other borrowing costs 2.58 6.64
Exchange loss (attributable to finance costs) 65.63 148.16
1339.84 1655.06
NOTE [40]
The list of subsidiaries, associates, joint ventures and joint operations in the consolidated financial statements are as under:
As at 31-3-2017 As at 31-3-2016 As at 1-4-2015
Sr. no.
Name of subsidiary company Principal place of business
Proportion of ownership
interest (%)
Proportion of voting power
held (%)
Proportion of ownership interest (%)
Proportion of voting power
held (%)
Proportion of ownership interest (%)
Proportion of voting power
held (%)
Indian Subsidiaries
1 L&T Cutting Tools Limited India 100.00 100.00 100.00 100.00 100.00 100.00
2 Bhilai Power Supply Company Limited India 99.90 99.90 99.90 99.90 99.90 99.90
3 Spectrum Infotech Private Limited India 100.00 100.00 100.00 100.00 100.00 100.00
4 L&T-Valdel Engineering Limited$$ India – – 100.00 100.00 100.00 100.00
5 L&T Shipbuilding Limited India 97.00 97.00 97.00 97.00 97.00 97.00
6 L&T Electricals and Automation Limited India 100.00 100.00 100.00 100.00 100.00 100.00
7 Hi-Tech Rock Products & Aggregates Limited India 100.00 100.00 100.00 100.00 100.00 100.00
8 L&T Seawoods Limited India 100.00 100.00 100.00 100.00 100.00 100.00
9 Kesun Iron and Steel Company Private
Limited
India
95.00 95.00 95.00 95.00 95.00 95.00
10 L&T Infocity Limited India – – – – 89.00 89.00
11 L&T Hitech City Limited India – – – – 65.86 65.86
12 Hyderabad International Trade Expositions
Limited
India
– – – – 51.72 51.72
Notes forming part of the Consolidated Financial Statements (contd.)
NOTE [38]
Sales, administration and other expenses (contd.)

400
As at 31-3-2017 As at 31-3-2016 As at 1-4-2015
Sr. no.
Name of subsidiary company Principal place of business
Proportion of ownership
interest (%)
Proportion of voting power
held (%)
Proportion of ownership interest (%)
Proportion of voting power
held (%)
Proportion of ownership interest (%)
Proportion of voting power
held (%)
13 EWAC Alloys Limited India 100.00 100.00 100.00 100.00 100.00 100.00
14 L&T Geostructure LLP India 74.00 74.00 74.00 74.00 74.00 74.00
15 L&T Valves Limited India 100.00 100.00 100.00 100.00 100.00 100.00
16 L&T Realty Limited India 100.00 100.00 100.00 100.00 100.00 100.00
17 L&T Asian Realty Project LLP India 100.00 100.00 100.00 100.00 50.00 50.00
18 L&T Parel Project LLP India 100.00 100.00 100.00 100.00 100.00 100.00
19 Chennai Vision Developers Private Limited India 100.00 100.00 100.00 100.00 100.00 100.00
20 L&T South City Projects Limited$ India – – 51.00 51.00 51.00 51.00
21 L&T Vision Ventures Limited India 68.00 68.00 68.00 68.00 68.00 68.00
22 L&T Power Limited India 99.99 99.99 99.99 99.99 99.99 99.99
23 CSJ Infrastructure Private Limited India – – – – 100.00 100.00
24 L&T Cassidian Limited India 74.00 74.00 74.00 74.00 74.00 74.00
25 Consumer Financial Services Limited$$$ India – – 66.71 66.71 72.95 72.95
26 L&T General Insurance Company Limited* India – – 100.00 100.00 100.00 100.00
27 L&T Aviation Services Private Limited India 100.00 100.00 100.00 100.00 100.00 100.00
28 Larsen & Toubro Infotech Limited India 84.28 84.28 94.96 94.96 100.00 100.00
29 GDA Technologies Limited @ India – – 94.96 94.96 100.00 100.00
30 L&T Finance Holdings Limited India 66.62 66.62 66.71 66.71 72.95 72.95
31 L&T Housing Finance Limited India 66.62 66.62 66.71 66.71 72.95 72.95
32 L&T Infra Investment Partners # India 36.55 36.55 36.69 36.69 40.45 40.45
33 L&T Finance Limited (formerly known as
Family Credit Limited)
India
66.62 66.62 66.71 66.71 72.95 72.95
34 L&T Finance Limited ~ India – – 66.71 66.71 72.95 72.95
35 L&T Capital Markets Limited India 66.62 66.62 66.71 66.71 72.95 72.95
36 L&T Investment Management Limited India 66.62 66.62 66.71 66.71 72.95 72.95
37 L&T Mutual Fund Trustee Limited India 66.62 66.62 66.71 66.71 72.95 72.95
38 L&T FinCorp Limited ~ India – – 66.71 66.71 72.95 72.95
39 L&T Infrastructure Finance Company Limited India 66.62 66.62 66.71 66.71 72.95 72.95
40 L&T Infra Debt Fund Limited India 66.62 66.62 66.71 66.71 72.95 72.95
41 L&T Infra Investment Partners Advisory
Private Limited
India
66.62 66.62 66.71 66.71 72.95 72.95
42 L&T Infra Investment Partners Trustee
Private Limited
India
66.62 66.62 66.71 66.71 72.95 72.95
43 L&T Financial Consultants Limited (formerly
known as L&T Vrindavan Properties
Limited)
India
66.62 66.62 66.71 66.71 72.95 72.95
44 L&T Access Distribution Services Limited India 66.62 66.62 66.71 66.71 72.95 72.95
Notes forming part of the Consolidated Financial Statements (contd.)
NOTE [40] (contd.)

401
As at 31-3-2017 As at 31-3-2016 As at 1-4-2015
Sr. no.
Name of subsidiary company Principal place of business
Proportion of ownership
interest (%)
Proportion of voting power
held (%)
Proportion of ownership interest (%)
Proportion of voting power
held (%)
Proportion of ownership interest (%)
Proportion of voting power
held (%)
45 Mudit Cement Private Limited India 66.62 66.62 66.71 66.71 72.95 72.95
46 L&T Capital Company Limited India 100.00 100.00 100.00 100.00 100.00 100.00
47 L&T Trustee Company Private Limited India 100.00 100.00 100.00 100.00 100.00 100.00
48 L&T Power Development Limited India 100.00 100.00 100.00 100.00 100.00 100.00
49 L&T Uttaranchal Hydropower Limited India 100.00 100.00 100.00 100.00 100.00 100.00
50 L&T Arunachal Hydropower Limited India 100.00 100.00 100.00 100.00 100.00 100.00
51 L&T Himachal Hydropower Limited India 100.00 100.00 100.00 100.00 100.00 100.00
52 Nabha Power Limited India 100.00 100.00 100.00 100.00 100.00 100.00
53 L&T Metro Rail (Hyderabad) Limited India 100.00 100.00 97.48 97.48 97.48 97.48
54 L&T Technology Services Limited India 89.77 89.77 100.00 100.00 100.00 100.00
55 L&T Construction Equipment Limited India 100.00 100.00 100.00 100.00 100.00 100.00
56 L&T Infrastructure Engineering Limited India 100.00 100.00 100.00 100.00 100.00 100.00
57 L&T Thales Technology Services Private
Limited
India
66.43 66.43 74.00 74.00 74.00 74.00
58 L&T Hydrocarbon Engineering Limited India 100.00 100.00 100.00 100.00 100.00 100.00
59 Sahibganj Ganges Bridge-Company Private
Limited^
India
100.00 100.00 – – – –
60 Seawoods Retail Private Limited^^ India 100.00 100.00 – – – –
61 Seawoods Realty Private Limited^^^ India 100.00 100.00 – – – –
62 Marine Infrastructure Developer Private
Limited
India
97.00 97.00 100.00 100.00 – –
63 AugmentIQ Data Sciences Private Limited## India 84.28 84.28 – – – –
64 L&T Infra Contractors Private Limited### India 100.00 100.00 – – – –
65 L&T Natural Resources Limited India – – – – 100.00 100.00
66 L&T Solar Limited India – – – – 100.00 100.00
67 L&T PowerGen Limited India – – – – 100.00 100.00
* The Group has sold its stake on September 9, 2016
@ The company is merged with Larsen & Toubro Infotech Limited w.e.f. April 1, 2016
$ The Group has sold its stake on March 20, 2017
$$ The company is merged with L&T Hydrocarbon Engineering Limited w.e.f. April 1, 2016
$$$ The company is merged with L&T Housing Finance Limited w.e.f. April 1, 2015
~ The company is merged with Family Credit Limited (subsequently renamed as L&T Finance Limited) w.e.f. April 1, 2016
^ The company is incorporated on July 14, 2016
^^ The company is incorporated on September 2, 2016
^^^ The company is incorporated on October 23, 2016
# The Fund is incorporated on August 22, 2013. The Group has control over its relevant activities.
## The Group acquired stake on November 30, 2016
### The Company is incorporated on March 17, 2017
Notes forming part of the Consolidated Financial Statements (contd.)
NOTE [40] (contd.)

402
As at 31-3-2017 As at 31-3-2016 As at 1-4-2015
Sr. no.
Name of subsidiary company Principal place of business
Proportion of ownership
Interest (%)
Proportion of voting power
held (%)
Proportion of ownership Interest (%)
Proportion of voting power
held (%)
Proportion of ownership Interest (%)
Proportion of voting power
held (%)
Foreign Subsidiaries
1 Larsen & Toubro LLC USA 100.00 100.00 100.00 100.00 100.00 100.00
2 Larsen & Toubro Infotech GmbH Germany 84.28 84.28 94.96 94.96 100.00 100.00
3 Larsen & Toubro Infotech Canada Limited Canada 84.28 84.28 94.96 94.96 100.00 100.00
4 Larsen & Toubro Infotech LLC USA 84.28 84.28 94.96 94.96 100.00 100.00
5 L&T Infotech Financial Services Technologies
Inc.
Canada
84.28 84.28 94.96 94.96 100.00 100.00
6 Larsen & Toubro Infotech South Africa (PTY)
Limited
South Africa
63.12 63.12 71.12 71.12 74.90 74.90
7 L&T Information Technology Services
(Shanghai) Co., Ltd.
China
84.28 84.28 94.96 94.96 100.00 100.00
8 L&T Realty FZE UAE 100.00 100.00 100.00 100.00 100.00 100.00
9 Larsen & Toubro International FZE UAE 100.00 100.00 100.00 100.00 100.00 100.00
10 Larsen & Toubro Hydrocarbon International
Limited LLC
Kingdom of
Saudi Arabia 100.00 100.00 100.00 100.00 100.00 100.00
11 Thalest Limited UK 100.00 100.00 100.00 100.00 100.00 100.00
12 Servowatch Systems Limited UK 100.00 100.00 100.00 100.00 100.00 100.00
13 Larsen & Toubro (Oman) LLC Sultanate of
Oman 65.00 65.00 65.00 65.00 65.00 65.00
14 L&T Modular Fabrication Yard LLC Sultanate of
Oman 65.00 65.00 65.00 65.00 65.00 65.00
15 Larsen & Toubro (East Asia) SDN. BHD Malaysia 30.00 100.00 30.00 100.00 30.00 100.00
16 Larsen & Toubro Qatar LLC Qatar 49.00 100.00 49.00 100.00 49.00 100.00
17 L&T Overseas Projects Nigeria Limited Nigeria 100.00 100.00 100.00 100.00 100.00 100.00
18 PT Larsen & Toubro Hydrocarbon
Engineering Indonesia
Indonesia
95.00 95.00 95.00 95.00 95.00 95.00
19 L&T Electricals & Automation Saudi Arabia
Company Limited LLC
Kingdom of
Saudi Arabia 100.00 100.00 100.00 100.00 75.00 75.00
20 Larsen & Toubro Kuwait Construction
General Contracting Company WLL
Kuwait
49.00 75.00 49.00 75.00 49.00 75.00
21 Larsen & Toubro Readymix & Asphalt
Concrete Industries LLC
UAE
49.00 100.00 49.00 100.00 49.00 100.00
22 Larsen & Toubro (Saudi Arabia) LLC Kingdom of
Saudi Arabia 100.00 100.00 100.00 100.00 100.00 100.00
23 Larsen Toubro Arabia LLC Kingdom of
Saudi Arabia 75.00 75.00 75.00 75.00 75.00 75.00
24 Larsen & Toubro ATCO Saudia LLC Kingdom of
Saudi Arabia 75.00 75.00 75.00 75.00 75.00 75.00
25 Tamco Switchgear (Malaysia) SDN. BHD. Malaysia 100.00 100.00 100.00 100.00 100.00 100.00
26 Henikwon Corporation SDN. BHD. Malaysia 100.00 100.00 100.00 100.00 100.00 100.00
27 Larsen & Toubro Consultoria E Projeto Ltda Brazil – – – – 100.00 100.00
28 Larsen & Toubro (Qingdao) Rubber
Machinery Company Limited
Peoples
Republic of
China – – – – 100.00 100.00
29 Tamco Electrical Industries Australia Pty
Limited
Australia
100.00 100.00 100.00 100.00 100.00 100.00
30 PT Tamco Indonesia Indonesia 100.00 100.00 100.00 100.00 100.00 100.00
31 Larsen & Toubro Heavy Engineering LLC Sultanate of
Oman 70.00 70.00 70.00 70.00 70.00 70.00
32 L&T Electrical & Automation FZE UAE 100.00 100.00 100.00 100.00 100.00 100.00
33 Kana Controls General Trading &
Contracting Company WLL
Kuwait
49.00 100.00 49.00 100.00 49.00 100.00
Notes forming part of the Consolidated Financial Statements (contd.)
NOTE [40] (contd.)

403
As at 31-3-2017 As at 31-3-2016 As at 1-4-2015
Sr. no.
Name of subsidiary company Principal place of business
Proportion of ownership
Interest (%)
Proportion of voting power
held (%)
Proportion of ownership Interest (%)
Proportion of voting power
held (%)
Proportion of ownership Interest (%)
Proportion of voting power
held (%)
34 Larsen & Toubro T&D SA (Proprietary)
Limited
South Africa
72.50 72.50 72.50 72.50 72.50 72.50
35 L&T Technology Services LLC USA 89.77 89.77 100.00 100.00 100.00 100.00
36 Larsen & Toubro Infotech Austria GmbH Austria 84.28 84.28 94.96 94.96 – –
37 L&T Global Holdings Limited UAE 100.00 100.00 100.00 100.00 – –
38 L&T Information Technology Spain SL Spain 84.28 84.28 94.96 94.96 – –
As at 31-3-2017 As at 31-3-2016 As at 1-4-2015
Sr. no.
Name of associate company Principal place of business
Proportion of ownership
Interest (%)
Proportion of voting power
held (%)
Proportion of ownership Interest (%)
Proportion of voting power
held (%)
Proportion of ownership Interest (%)
Proportion of voting power
held (%)
1 L&T-Chiyoda Limited India 50.00 50.00 50.00 50.00 50.00 50.00
2 Gujarat Leather Industries Limited@ India 50.00 50.00 50.00 50.00 50.00 50.00
3 Larsen & Toubro Qatar & HBK Contracting
LLC
Qatar
50.00 50.00 50.00 50.00 50.00 50.00
4 L&T Camp Facilities LLC UAE 49.00 49.00 49.00 49.00 49.00 49.00
5 Feedback Infra Private Limited India 15.42 15.42 15.74 15.74 16.89 16.89
6 International Seaports (Haldia) Private
Limited
India
21.74 21.74 21.74 21.74 21.74 21.74
7 Vizag IT Park Limited India – – – – 23.14 23.14
8 Salzer Electronics Limited India – – – – 26.06 26.06
9 JSK Electricals Private Limited India – – – – 26.00 26.00
10 Rishi Consfab Private Limited India – – – – 26.00 26.00
11 Magtorq Private Limited India 42.85 42.85 42.85 42.85 42.85 42.85
12 Grameen Capital India Limited^ India 23.84 23.84 23.87 23.87 – –
13 Ardom Telecom Private Limited^^ India 8.08 8.08 8.11 8.11 8.94 8.94
14 KMC Infratech Road Holdings Limited^^^ India 0.09 0.09 0.09 0.09 – –
@ The company is under liquidation
The associate company operates under severe long term restrictions that significantly impair its ability to transfer funds to the company and hence the same
has not been considered for consolidation.
^^ The Company has become associate on January 3, 2015. Investment in the associate is measured at fair value through profit or loss.
^^^ The Company has become associate on September 30, 2015. Investment in the associate is measured at fair value through profit or loss.
As at 31-3-2017 As at 31-3-2016 As at 1-4-2015
Sr. no.
Name of joint venture Principal place of business
Proportion of ownership
interest (%)
Proportion of ownership
interest (%)
Proportion of ownership
interest (%)
1 Larsen & Toubro Electromech LLC Sultanate of
Oman 65.00 65.00 65.00
2 L&T Infrastructure Development Projects Lanka (Private) Limited* Sri Lanka – 93.44 93.47
3 L&T IDPL Trustee Manager Pte. Ltd. Singapore 97.45 97.45 97.45
4 L&T Chennai–Tada Tollway Limited India 97.45 97.45 97.45
5 L&T BPP Tollway Limited India 97.45 97.45 97.45
6 L&T Rajkot-Vadinar Tollway Limited India 97.45 97.45 97.45
7 L&T Deccan Tollways Limited India 97.45 97.45 97.45
8 L&T Samakhiali Gandhidham Tollway Limited India 97.45 97.45 97.45
9 Kudgi Transmission Limited India 97.45 97.45 97.45
10 L&T Sambalpur-Rourkela Tollway limited India 97.45 97.45 97.45
11 L&T Infrastructure Development Projects Limited India 97.45 97.45 97.45
12 Panipat Elevated Corridor Limited (formerly known as L&T Panipat
Elevated Corridor Limited)
India
97.45 97.45 97.45
Notes forming part of the Consolidated Financial Statements (contd.)
NOTE [40] (contd.)

404
As at 31-3-2017 As at 31-3-2016 As at 1-4-2015
Sr. no.
Name of joint venture Principal place of business
Proportion of ownership
interest (%)
Proportion of ownership
interest (%)
Proportion of ownership
interest (%)
13 Krishnagiri Thopur Toll Road Limited (formerly known as L&T Krishnagiri
Thopur Toll Road Limited)
India
97.45 97.45 97.45
14 Western Andhra Tollways Limited (formerly known as L&T Western Andhra
Tollways Limited)
India
97.45 97.45 97.45
15 Vadodara Bharuch Tollway Limited (formerly known as L&T Vadodara
Bharuch Tollway Limited)
India
97.45 97.45 97.45
16 L&T Transportation Infrastructure Limited India 98.12 98.12 98.12
17 L&T Western India Tollbridge Limited India 97.45 97.45 97.45
18 L&T Interstate Road Corridor Limited India 97.45 97.45 97.45
19 L&T Port Kachchigarh Limited India 97.45 97.45 97.45
20 Ahmedabad-Maliya Tollway Limited (formerly known as L&T Ahmedabad-
Maliya Tollway Limited)
India
97.45 97.45 97.45
21 L&T Halol-Shamlaji Tollway Limited India 47.75 97.45 97.45
22 L&T Krishnagiri Walajahpet Tollway Limited India 97.45 97.45 97.45
23 Devihalli Hassan Tollway Limited (formerly known as L&T Devihalli Hassan
Tollway Limited)
India
97.45 97.45 97.45
24 L&T Howden Private Limited India 50.10 50.10 50.10
25 L&T Sapura Shipping Private Limited India 60.00 60.00 60.00
26 L&T Sapura Offshore Private Limited India 60.00 60.00 60.00
27 L&T-Gulf Private Limited India 50.00 50.00 50.00
28 L&T-MHPS Boilers Private Limited India 51.00 51.00 51.00
29 L&T-MHPS Turbine Generators Private Limited India 51.00 51.00 51.00
30 Raykal Aluminium Company Private Limited India 75.50 75.50 75.50
31 L&T Special Steels and Heavy Forgings Private Limited India 74.00 74.00 74.00
32 PNG Tollway Limited India 72.11 72.11 72.77
33 L&T Kobelco Machinery Private Limited India 51.00 51.00 51.00
34 L&T-Sargent & Lundy Limited India 50.00 50.00 50.00
35 Indiran Engineering Projects and Systems Kish PJSC Iran 50.00 50.00 50.00
* The group has sold its stake on May 6, 2016
As at 31-3-2017 As at 31-3-2016 As at 1-4-2015
Sr. no.
Name of joint operation (with specific ownership interest in the arrangement)
Principal place of business
Proportion of ownership
interest (%)
Proportion of ownership
interest (%)
Proportion of ownership
interest (%)
1 L&T-AM Tapovan Joint Venture India 65.00 65.00 65.00
2 International Metro Civil Contractors Joint Venture India 26.00 26.00 26.00
3 Desbuild-L&T Joint Venture India 49.00 49.00 49.00
4 HCC-L&T Purulia Joint Venture India 43.00 43.00 43.00
5 Metro Tunneling Group India 26.00 26.00 26.00
6 L&T-Hochtief Seabird Joint Venture India 90.00 90.00 90.00
7 L&T-Shanghai Urban Construction (Group) Corporation Joint Venture India 51.00 51.00 51.00
8 Metro Tunneling Chennai - L&T Shanghai Urban Construction (Group) Corporation Joint Venture India 75.00 75.00 75.00
9 Metro Tunneling Delhi - L&T Shanghai Urban Construction (Group) Corporation Joint Venture India 100.00 # 60.00
10 Larsen & Toubro Limited - Shapoorji Pallonji & Co. Limited Joint Venture India 50.00 50.00 50.00
11 L&T-Shanghai Urban Construction (Group) Corporation Joint Venture CC27
Delhi India 100.00 # 68.00
12 a) Larsen & Toubro Limited - Scomi Engineering BHD. Consortium-Residual Joint Works Joint Venture India 60.00 60.00 60.00
12 b) Larsen & Toubro Limited - Scomi Engineering BHD. Consortium-O&M Joint Venture India 50.00 50.00 50.00
Notes forming part of the Consolidated Financial Statements (contd.)
NOTE [40] (contd.)

405
Notes forming part of the Consolidated Financial Statements (contd.)
NOTE [40] (contd.)
As at 31-3-2017 As at 31-3-2016 As at 1-4-2015
Sr. no.
Name of joint operation (with specific ownership interest in the arrangement)
Principal place of business
Proportion of ownership
interest (%)
Proportion of ownership
interest (%)
Proportion of ownership
interest (%)
13 Larsen & Toubro Limited and NCC Limited Joint Venture India 55.00 55.00 55.00
14 L&T-Eastern Joint Venture@ UAE 65.00 65.00 65.00
15 Civil Works Joint Venture Kingdom of Saudi Arabia 29.00 29.00 29.00
16 Aktor-Larsen & Toubro-Yapi Merkezi-stfa-Al Jaber Engineering Joint Venture Qatar 22.00 22.00 22.00
17 L&T-Delma Mafraq Joint Venture UAE 60.00 60.00 60.00
18 L&T-AL-Sraiya LRDP 6 Joint Venture Qatar 75.00 75.00 –
19 DAEWOO and L&T Joint Venture India 50.00 50.00 –
20 PESB and Larsen & Toubro Joint Venture Malaysia 82.30 82.30 –
21 Besix - Larsen & Toubro Joint Venture^ UAE 50.00 – –
22 Al Balagh Trading & Contracting Co. W.L.L.-L&T Joint Venture^^ Qatar 80.00 – –
23 LTH Milcom Private Limited India 56.67 56.67 –
24 Mumbai Metro Rail Corporation Limited^^^ India 100.00 – –
25 Bauer-L&T Geo Joint Venture India 50.00 50.00 –
26 EMAS Saudi Arabia Ltd$$ Kindgom of Saudi Arabia 50.00 – –
27 Larsen & Toubro Ltd - Passavant Energy & Environment JV$ India 50.00 – –
@ The joint operation is in process of liquidation
^ The joint operation has been entered on December 5, 2015 (started Operation in FY 2016-17)
^^ The joint operation has been entered on May 25, 2016 (started Operation in FY 2016-17)
^^^ The joint operation has been entered on February 25, 2015
$ The joint operation has been entered on October 12, 2016
$$ The joint operation has been entered on January 23, 2015
# On scope of respective activities under the contract as mutually agreed between joint operators
Sr. no.
Name of joint operation (with specific proportion of activity carried out through the arrangement) Principal place of business
1 L&T Sojitz Consortium India
2 L&T-KBL (UJV) Hyderabad India
3 L&T-KBL-MAYTAS Joint Venture India
4 Larsen and Toubro Limited & Bharat Rail Automation Pvt. Ltd. Joint Venture (Package II) India
5 Larsen and Toubro Limited & Bharat Rail Automation Pvt. Ltd. Joint Venture (Package III) India
6 IIS - L&T Consortium India
7 L&T and Scomi Engineering BHD. Joint Venture India
8 Consortium of L&T Hydrocarbon Engineering Limited & Toyo Engineering Company India
9 Consortium of L&T Hydrocarbon Engineering Limited and Pipavav Defence & Offshore Engineering Company India
10 PES Engg P. ltd.-L&T Consortium India
11 L&T Galfar Consortium India
12 L&T Oman-L&T consortium India
13 Sojitz Corporation-L&T Consortium India
14 Sojitz Corporation-Gayathri Projects Ltd.-L&T Consortium India
15 Instalaciones Inabensa S.A.-L&T Consortium India
16 Scomi Engineering Bhd.-L&T Consortium India
17 Consortium of M/s. J. Ray McDermott Sdn. Bhd. and M/s. L&T Hydrocarbon Engineering Limited India
18 Consortium of L&T Hydrocarbon Engineering Limited and EMAS AMC Pte. Ltd. Kingdom of Saudi Arabia
NOTE [41]
The components of other equity shown in the Consolidated Balance Sheet include the Group’s share in the respective reserves of
subsidiaries. Reserve attributable to non-controlling interest is reported separately in the consolidated Balance Sheet. Retained earnings
comprise Group’s share in general reserve and balance of Profit and Loss.

406
NOTE [42]
Exceptional items include [Note 1(j)]:
(a) Profit on divestment of the Group’s stake in a subsidiary company (L&T General Insurance Company Limited) v 402.43 crore.
(b) Impairment of investment in a joint venture company (Infrastructure Development Projects Limited) v 281.00 crore.
(c) Exceptional items for the previous year ended March 31, 2016 included profit on divestment of group’s stake in an associate
company (Salzer Electronics Limited) v 45.70 crore and profit on sale of Foundry Business Unit v 48.52 crore.
NOTE [43]
The expenditure on research and development activities recognised as expense in the Statement of Profit and Loss is v 177.88 crore
(previous year: v 187.90 crore). Further, the Group has incurred capital expenditure on research and development activities as follows:
(a) on Property, Plant and Equipment: v 9.75 crore (previous year: v 5.68 crore)
(b) on intangible assets being expenditure on new product development: v 43.01 crore (previous year: v 48.19 crore)
(c) on other intangible assets: v 3.20 crore (previous year: v 6.80 crore)
NOTE [44]
(a) Disclosures pursuant to Indian Accounting Standard (Ind AS) 11 “Construction Contracts”:
v crore
Sr. no.
Particulars 2016-17 2015-16 As at 1-4-2015
i) Contract revenue recognised for the financial year [Note 34] 74504.71 68838.65 NA
ii) Aggregate amount of contract costs incurred and recognised profits(less
recognised losses*) as at the end of the financial year for all contracts in
progress as at that date 265885.96 250082.50 218581.76
iii) Amount of customer advances outstanding for contracts in progress as at the
end of the financial year 13267.98 13789.93 11866.39
iv) Retention amount by customers for contracts in progress as at the end of the
financial year 8277.30 7527.55 6370.36
* Includes provision for foreseeable loss 247.41 257.02 179.58
(b) The Group has revised certain estimates used in determining the cost of completion of projects, as a part of periodic review of
estimates. As a result, the revenue and profit before tax for the year increased by v 168.17 crore (previous year: v 395.73 crore).
(c) The Group has undertaken project for construction, operation and maintenance of the Metro Rail System on Design-Build-
Finance-Operate-Transfer (DBFOT) basis as per the concession agreement with the government authorities. Under the agreement,
the concession period for fare collection is 35 years (extendable by another 25 years at the option of the concessionaire, upon
satisfaction of key performance indicators by the concessionaire under the concession agreement). Under the agreement, the
fare can be revised on the basis of variation in wholesale price index effective from 1st of April every year. At the end of the said
concession period, the entire facilities would be transferred to the concerned government authorities. The Group expects to receive
viability gap funding of v 1458 crore from the grantor for the project. The Group also expects to receive property development
rights in respect of transit-oriented development. The arrangement has been classified as intangible assets.
(d) Disclosures pursuant to Guidance Note on Accounting for Real Estate Transactions issued by the Institute of Chartered Accountants
of India:
v crore
Sr. no.
Particulars 2016-17 2015-16 As at 1-4-2015
i) Amount of project revenue recognised for the financial year [Note 34] 2272.71 1444.81 NA
ii) Aggregate amount of costs incurred and profits recognised (less recognised
losses) as at the end of the financial year 4507.66 3837.17 2480.15
iii) Amount of advances received 65.54 60.27 60.01
iv) Amount of work-in-progress and the value of inventories [Note 11]* 1259.76 1489.21 2224.29
v) Excess of revenue recognised over actual bills raised (unbilled revenue) [Note 19] 91.05 178.73 129.94
* Inventories amounting to R 95.09 crore as at 1-4-2015 is classifed under group(s) of assets classifed as held for sale [Note 52]
Notes forming part of the Consolidated Financial Statements (contd.)

407
Notes forming part of the Consolidated Financial Statements (contd.)
NOTE [45]
Disclosure pursuant to Indian Accounting Standard (Ind AS) 19 “Employee Benefits” [Note 1(o)]
(a) Defined contribution plans: Amount of v 180.27 crore (previous year v 166.35 crore) is recognised as an expense. Out of above,
v 178.66 crore (previous year: v 165.14 crore) is included in “employee benefits expense” [Note 37] in the Statement of Profit and
Loss and v 1.61 crore (previous year: v 1.21 crore) has been capitalised.
(b) Defined benefit plans:
(i) The amounts recognised in Balance Sheet are as follows:
v crore
Particulars
Gratuity plan Post-retirement medical
benefit plan
Pension plan Trust-managed provident
fund plan
As at
31-3-2017
As at
31-3-2016
As at
1-4-2015
As at
31-3-2017
As at
31-3-2016
As at
1-4-2015
As at
31-3-2017
As at
31-3-2016
As at
1-4-2015
As at
31-3-2017
As at
31-3-2016
As at
1-4-2015
Present value of defined benefit
obligation
A) – Wholly funded 640.87 601.75 582.29 – – – – – – 3315.73 3023.97 2751.57
– Wholly unfunded 194.66 147.74 130.14 234.55 193.31 181.08 317.41 287.55 221.47 2.59 12.19 30.83
835.53 749.49 712.43 234.55 193.31 181.08 317.41 287.55 221.47 3318.32 3036.16 2782.40
Less: Fair value of plan assets 615.72 559.86 507.64 – – – – – – 3348.38 3041.76 2763.21
Add: Amount not recognised as an
asset [limit in para 64(b)] 4.80 4.76 3.90 – – – – – – – – –
Amount to be recognised as liability
or (asset) 224.61 194.39 208.69 234.55 193.31 181.08 317.41 287.55 221.47 (30.06) (5.60) 19.19
B) Amounts reflected in the Balance Sheet
Liabilities 232.28 201.98 219.53 234.55 193.31 181.08 317.41 287.55 221.47 31.84 27.90 36.29
Assets (7.67) (7.59) (10.84) – – – – – – (15.94) (7.36) (9.05)
Net liability/(asset) 224.61 194.39 208.69 234.55 193.31 181.08 317.41 287.55 221.47 15.90 20.54 27.24
Net liability/(asset) - current # 224.61 194.39 208.69 13.36 17.07 14.59 22.67 56.17 13.47 15.90 19.93 18.36
Net liability/(asset) - Non-current – – – 221.19 176.24 166.49 294.74 231.38 208.00 – 0.61 8.88
# Liability for unfunded gratuity with respect to group(s) of assets classified as held for sale is included thereunder
(ii) The amounts recognised in Statement of Profit and Loss are as follows:
v crore
Particulars
Gratuity plan Post-retirement medical benefit plan
Pension plan Trust-managed provident fund plan
2016-17 2015-16 2016-17 2015-16 2016-17 2015-16 2016-17 2015-16
1 Current service cost 127.65 120.61 16.47 12.26 2.48 3.39 122.34 $ 127.89 $
2 Interest cost 44.23 42.37 14.59 13.77 21.47 16.76 259.47 233.26
3 Interest income on plan assets (40.51) (45.35) – – – – (259.47) (233.26)
4 Remeasurement - Actuarial losses/(gains) -
Difference between actual return on plan
assets and interest income (47.34) (2.75) – – – – (18.79) (19.64)
5 Remeasurement - Actuarial losses/(gains) - Others 35.88 9.29 19.11 (6.51) 23.64 12.01 (9.87) (17.91)
6 Past service cost – – – 0.97 – 49.58 – –
7 Actuarial gain/(loss) not recognised in books – – – – – – 28.66 37.55
8 Adjustment for earlier years 0.27 1.49 – – – – – (0.01)
9 Remeasurement - Effect of the limit in para 64(b) (0.39) 2.06 – – – – – –
10 Translation adjustments 0.91 (0.35) – – – – – –
11 Amount capitalised out of the above (0.46) (0.85) (0.01) (0.01) – – – –
Total (1 to 11) 120.24 126.52 50.16 20.48 47.59 81.74 122.34 127.88

408
Notes forming part of the Consolidated Financial Statements (contd.)
v crore
Particulars
Gratuity plan Post-retirement medical benefit plan
Pension plan Trust-managed provident fund plan
2016-17 2015-16 2016-17 2015-16 2016-17 2015-16 2016-17 2015-16
I Amount included in “employee benefits
expense” 131.78 119.84 18.44 14.94 2.48 52.97 122.34 136.27
II Amount included as part of “finance cost” 0.31 (1.92) 12.61 12.05 21.47 16.76 – (8.39)
III Amount included as part of “other comprehensive
income” (11.85) 8.60 19.11 (6.51) 23.64 12.01 – –
Total (I+II+III) 120.24 126.52 50.16 20.48 47.59 81.74 122.34 127.88
Actual return on plan assets 87.85 48.10 – – – – 278.26 252.90
(iii) The changes in the present value of defined benefit obligation representing reconciliation of opening and closing balances
thereof are as follows:
v crore
Particulars
Gratuity plan Post-retirement medical benefit plan
Pension plan Trust-managed provident fund plan
As at
31-3-2017
As at
31-3-2016
As at
31-3-2017
As at
31-3-2016
As at
31-3-2017
As at
31-3-2016
As at
31-3-2017
As at
31-3-2016
Opening balance of the present value of defined benefit obligation 749.49 712.43 193.31 181.08 287.55 221.47 3036.16 2782.40
Add: Current service cost 127.65 120.61 16.47 12.26 2.48 3.39 122.34 $ 127.89 $
Add: Interest cost 44.23 42.37 14.59 13.77 21.47 16.76 259.47 233.26
Add: Contribution by plan participants
i) Employer – – – – – – – –
ii) Employee – – – – – – 298.11 306.84
iii) Transfer-in/(out) – – – – – – – –
Add/(less): Remeasurement - Actuarial losses/(gains)
i) Actuarial (gains)/losses arising from
changes in demographic assumptions 0.15 (0.08) 0.08 – – – – (0.00)
ii) Actuarial (gains)/losses arising from
changes in financial assumptions 26.79 0.40 24.41 1.42 16.80 1.01 (9.87) (17.91)
iii) Actuarial (gains)/losses arising from
changes in experience adjustments 8.94 8.97 (5.38) (7.93) 6.84 11.00 – –
Less: Benefits paid (127.70) (140.08) (8.93) (8.26) (17.73) (15.66) (388.56) (391.47)
Add: Past service cost – – – 0.97 – 49.58 0.01 –
Add: Liabilities assumed on transfer of employees – (0.99) – – – – 0.66 (4.10)
Add: Business combination/acquisition (1.89) – – – – – – –
Add: Adjustment for earlier years 0.38 1.02 – – – – – (0.75)
Add/(less): Translation adjustments 7.49 4.84 – – – – – –
Closing balance of the present value of defined benefit
obligation 835.53 749.49 234.55 193.31 317.41 287.55 3318.32 3036.16
NOTE [45] (contd.)

409
Notes forming part of the Consolidated Financial Statements (contd.)
(iv) Changes in the fair value of plan assets representing reconciliation of the opening and closing balances thereof are as follows:
v crore
Particulars
Gratuity plan Trust-managed provident fund plan
As at 31-3-2017
As at 31-3-2016
As at 31-3-2017
As at 31-3-2016
Opening balance of the fair value of the plan assets 559.86 507.64 3041.76 2763.21
Add: Interest Income on plan assets* 40.51 45.35 259.47 233.26
Add/(less): Remeasurement - Actuarial gains/(losses) – – – –
Add/(less): Actuarial gains/(losses) - Difference between
actual return on plan assets and interest income 47.34 2.75 18.79 19.64
Add/(Less): Actuarial gains/(losses) - Others – – 0.00 (0.00)
Add: Contribution by the employer 95.58 143.41 120.37 121.07
Add/(less): Transfer in/(out) – – – –
Add: Contribution by plan participants – – 294.32 301.41
Add: Liabilities assumed on transfer of employees – – 4.76 13.60
Add: Business combination/disposal (net) – (0.20) (2.03) (0.80)
Less: Benefits paid (127.70) (140.08) (388.56) (391.47)
Add: Adjustment for earlier years 0.13 0.97 (0.50) (18.16)
Less: Settlements – 0.02 – –
Closing balance of the plan assets 615.72 559.86 3348.38 3041.76
Notes: The fair value of the plan assets under the trust managed provident fund plan has been determined at amounts based
on their value at the time of redemption, assuming a constant rate of return to maturity.
* Basis used to determine interest income on plan assets:
The Trust formed by the Parent Company and a few subsidiaries manage the investments of provident funds and gratuity
fund. Interest income on plan assets is determined by multiplying the fair value of the plan assets by the discount rate
stated in (g) (i) below both determined at the start of the annual reporting period.
The Group expects to fund v 37.48 crore (previous year: v 54.70 crore) towards its gratuity plan and v 140.68 crore
(previous year: v 145.15 crore) towards its trust-managed provident fund plan during the year 2017-18.
$ Employer’s contribution to provident fund.
(v) The fair value of major categories of plan assets are as follows:
v crore
Particulars
Gratuity plan
Quoted Unquoted Total Quoted Unquoted Total Quoted Unquoted Total
As at
31-3-2017
As at
31-3-2017
As at
31-3-2017
As at
31-3-2016
As at
31-3-2016
As at
31-3-2016
As at
1-4-2015
As at
1-4-2015
As at
1-4-2015
Cash and cash equivalents – 4.76 4.76 0.10 1.50 1.60 0.09 1.36 1.45
Equity instruments 10.97 0.65 11.62 5.51 0.30 5.81 5.00 0.28 5.28
Debt instruments - Corporate bonds 0.07 160.39 160.46 0.03 138.59 138.62 0.03 125.67 125.70
Debt instruments - Central Government
bonds 108.50 40.85 149.35 101.52 36.21 137.73 92.06 32.83 124.89
Debt instruments - State Government
bonds 97.71 5.49 103.20 83.34 5.09 88.43 75.57 4.62 80.19
NOTE [45] (contd.)

410
Notes forming part of the Consolidated Financial Statements (contd.)
v crore
Particulars
Gratuity plan
Quoted Unquoted Total Quoted Unquoted Total Quoted Unquoted Total
As at
31-3-2017
As at
31-3-2017
As at
31-3-2017
As at
31-3-2016
As at
31-3-2016
As at
31-3-2016
As at
1-4-2015
As at
1-4-2015
As at
1-4-2015
Debt instruments - Public Sector Unit
bonds 2.34 53.99 56.33 3.91 65.46 69.37 3.55 59.35 62.90
Mutual funds - Equity 0.21 47.31 47.52 – 40.63 40.63 – 36.84 36.84
Mutual funds - Debt – 0.37 0.37 – 0.37 0.37 – 0.33 0.33
Mutual funds - Others – 0.07 0.07 – 0.04 0.04 – 0.04 0.04
Special deposit scheme 0.77 55.38 56.15 0.70 50.82 51.52 0.62 46.08 46.70
Fixed deposits – 0.86 0.86 – 0.91 0.91 – 0.82 0.82
Others – 25.03 25.03 – 24.83 24.83 – 22.50 22.50
Closing balance of the plan assets 220.57 395.15 615.72 195.11 364.75 559.86 176.92 330.72 507.64
v crore
Particulars
Trust-managed provident fund plan
Quoted Unquoted Total Quoted Unquoted Total Quoted Unquoted Total
As at
31-3-2017
As at
31-3-2017
As at
31-3-2017
As at
31-3-2016
As at
31-3-2016
As at
31-3-2016
As at
1-4-2015
As at
1-4-2015
As at
1-4-2015
Cash and cash equivalents – 12.53 12.53 – 9.76 9.76 – 12.31 12.31
Equity instruments – – – – – – – – –
Debt instruments - Corporate bonds 353.45 113.96 467.41 146.93 116.00 262.93 59.84 136.17 196.01
Debt instruments - Central Government
bonds 659.29 – 659.29 739.23 – 739.23 656.12 – 656.12
Debt instruments - State Government
bonds 688.71 – 688.71 472.41 – 472.41 406.36 – 406.36
Debt instruments - Public Sector Unit
bonds 408.53 648.03 1056.56 406.54 742.08 1148.62 351.42 771.98 1123.40
Mutual funds - Equity 12.82 67.41 80.23 0.81 20.04 20.85 – 1.89 1.89
Mutual funds - Debt – 4.11 4.11 – 17.87 17.87 – – –
Mutual funds - Others – – – – – – – – –
Special deposit scheme – 268.34 268.34 – 270.94 270.94 – 271.71 271.71
Fixed deposits – – – – – – – – –
Others – 111.20 111.20 – 99.15 99.15 – 95.41 95.41
Closing balance of the plan assets 2122.80 1225.58 3348.38 1765.92 1275.84 3041.76 1473.74 1289.47 2763.21
(vi) The Average duration of the Defined Benefit Plan Obligation at the end of the reporting period is as follows:
Plans As at 31-3-2017 As at 31-3-2016 As at 1-4-2015
1. Gratuity 7.54 7.18 7.06
2. Post-retirement medical benefit plan 17.48 16.55 18.55
3. Pension plan 8.06 8.07 9.60
NOTE [45] (contd.)

411
(vii) Principal actuarial assumptions at the Balance Sheet date (expressed as weighted average) :
As at
31-3-2017
As at
31-3-2016
As at
1-4-2015
(A) Discount rate:
(a) Gratuity plan 7.10% 7.80% 7.84%
(b) Pension plan 7.10% 7.80% 7.84%
(c) Post-retirement medical benefit plan 7.10% 7.80% 7.84%
(B) Annual increase in healthcare costs (see note below) 5.00% 5.00% 5.00%
(C) Salary Growth rate:
(a) Gratuity plan 5.00% 5.00% 5.00%
(b) Pension plan 6.00% 6.00% 6.00%
(D) Attrition Rate:
(a) For post-retirement medical benefit plan & pension plan, the attrition rate varies from 2% to 8% (previous year:
2% to 8%) for various age groups.
(b) For gratuity plan the attrition rate varies from 1% to 6% (previous year: 1% to 6%) for various age groups.
(E) The estimates of future salary increases, considered in actuarial valuation, take into account inflation, seniority,
promotion and other relevant factors, such as supply and demand the employment market.
(F) The interest payment obligation of trust-managed provident fund is assumed to be adequately covered by the interest
income on long term investments of the fund. Any shortfall in the interest income over the interest obligation is
recognised immediately in the Statement of Profit and Loss as actuarial losses.
(G) The obligation of the Group under the post-retirement medical benefit plan is limited to the overall ceiling limits. At
present, healthcare cost, as indicated in the principal actuarial assumption given above, has been assumed to increase at
5% p.a.
(H) A one percentage point change in actuarial assumptions would have the following effects on defined benefit obligation:
v crore
ParticularsEffect of 1% increase Effect of 1% decrease
31-Mar-17 31-Mar-16 31-Mar-17 31-Mar-16
Gratuity
Impact of change in salary growth rate 51.69 43.51 (39.68) (31.46)
Impact of change in discount rate (44.36) (37.56) 45.65 35.83
Post-retirement medical benefit plan
Impact of change in health care cost 27.53 24.69 (21.99) (19.75)
Impact of change in discount rate (36.17) (27.93) 46.02 34.87
Pension plan
Impact of change in discount rate (26.07) (21.80) 26.68 25.26
(viii) Characteristics of defined benefit plans and associated risks:
(A) Gratuity plan:
The Parent Company operates gratuity plan through a trust wherein every employee is entitled to the benefit equivalent
to fifteen days salary last drawn for each completed year of service. The same is payable on termination of service or
retirement whichever is earlier. The benefit vests after five years of continuous service. The company’s scheme is more
favourable as compared to the obligation under The Payment of Gratuity Act, 1972.
The defined benefit plans for gratuity of the Parent Company and material domestic subsidiary companies are
administered by separate gratuity funds that is legally separate from the Parent Company and the material domestic
subsidiary companies. The trustees nominated by the group are responsible for the administration of the plan. There
Notes forming part of the Consolidated Financial Statements (contd.)
NOTE [45] (contd.)

412
are no minimum funding requirements of these plans. The funding of these plans is based on gratuity fund’s actuarial
measurement framework set out in the funding policies of the plan. These actuarial measurements are similar compared
to the assumptions set out in (g) supra. An insignificant portion of the gratuity plan of the group attributable to
subsidiary companies is administered by the respective subsidiary companies and is funded through insurer managed
funds. A small part of the gratuity plan, which is not material, is unfunded and managed within the group. Employees
do not contribute to any of these plans.
(B) Post-retirement medical care plan:
The Post-retirement medical benefit plan provides for reimbursement of health care costs to certain categories of
employees post their retirement. The reimbursement is subject to an overall ceiling sanctioned based on cadre of the
employee at the time of retirement. The plan is unfunded. Employees do not contribute to the plan.
(C) Pension plan:
In addition to contribution to state-managed pension plan (EPS scheme), the Group operates a post retirement pension
scheme, which is discretionary in nature for certain cadres of employees. The quantum of pension depends on the cadre
of the employee at the time of retirement. The plan is unfunded. Employees do not contribute to the plan.
(D) Trust managed provident fund plan:
The Parent Company and a few subsidiaries manage provident fund plan through a provident fund trust for its
employees which is permitted under the Employee Provident Fund and Miscellaneous Provisions Act, 1952. The plan
mandates contribution by employer at a fixed percentage of employee’s salary. Employees also contribute to the plan at
a fixed percentage of their salary as a minimum contribution and additional sums at their discretion. The plan guarantees
interest at the rate notified by the provident fund authority. The contribution by employer and employee together with
interest are payable at the time of separation from service or retirement whichever is earlier. The benefit under this plan
vests immediately on rendering of service.
The interest payment obligation of trust-managed provident fund is assumed to be adequately covered by the interest
income on long term investments of the fund. Any shortfall in the interest income over the interest obligation is
recognised immediately in the Statement of Profit and Loss as actuarial loss. Any loss/gain arising out of the investment
risk and actuarial risk associated with the plan is also recognised as expense or income in the period in which such loss/
gain occurs.
All the above defined benefit plans expose the Group to general actuarial risks such as interest rate risk and market
(investment) risk.
NOTE [46]
Disclosure pursuant to Indian Accounting Standard (Ind AS) 108 ‘’Operating Segments’’
(a) Information about reportable segments
v crore
Particulars2016-17 2015-16
External Inter-segment Total External Inter-segment Total
Revenue
Infrastructure 52923.08 997.73 53920.81 48967.13 1591.21 50558.34
Power 6938.56 0.23 6938.79 6424.50 2.30 6426.80
Heavy Engineering 3149.15 297.79 3446.94 3082.75 173.12 3255.87
Electrical & Automation 4968.56 398.71 5367.27 4940.68 460.62 5401.30
Hydrocarbon 9602.50 25.84 9628.34 8548.65 69.60 8618.25
IT & Technology Services 9731.29 156.25 9887.54 8855.03 159.56 9014.59
Financial Services 8545.17 0.12 8545.29 7693.92 1.08 7695.00
Developmental Projects 4027.78 339.50 4367.28 4336.36 283.66 4620.02
Others 10124.91 737.52 10862.43 9126.32 594.10 9720.42
Elimination – (2953.69) (2953.69) – (3335.25) (3335.25)
Total 110011.00 – 110011.00 101975.34 – 101975.34
Notes forming part of the Consolidated Financial Statements (contd.)
NOTE [45] (contd.)

413
v crore
Particulars2016-17 2015-16
External Inter-segment Total External Inter-segment Total
Segment result [Profit/(Loss) before interest and tax]
Infrastructure 4722.54 4990.54
Power 201.18 112.84
Heavy Engineering 498.57 (97.47)
Electrical & Automation 549.89 433.06
Hydrocarbon 508.42 (95.28)
IT & Technology Services 1825.53 1584.32
Financial Services 786.44 1304.26
Developmental Projects 32.01 238.56
Others 414.69 989.49
Total 9539.27 9460.32
Less: Inter segment margins on capital jobs (28.14) (62.15)
Less: Interest expenses (1339.84) (1655.06)
Add: Unallocated corporate income net of expenditure 716.07 276.51
Profit before tax 8887.36 8019.62
Provision for current tax (2976.31) (2817.69)
Provision for deferred tax 827.76 380.73
Profit after tax 6738.81 5582.66
Additional provision/(reversal) of tax on dividend
distributed by subsidiaries 141.96 (47.80)
Share in profit/(loss) of joint venture/associate companies
(net) (395.27) (990.16)
Adjustments for non-controlling interest in subsidiaries (444.27) (311.82)
Net profit after tax, non-controlling interest and share in profit/(loss) of joint ventures/associates 6041.23 4232.88
v crore
Segment assets Segment liabilities
Other information As at As at As at As at As at As at
31-3-2017 31-3-2016 1-4-2015 31-3-2017 31-3-2016 1-4-2015
Infrastructure 50020.69 46687.58 38505.15 33912.75 30239.78 25646.78
Power 6847.03 7964.47 6577.07 6362.49 7382.07 6118.86
Heavy Engineering 5112.41 5449.93 5424.71 3815.67 3788.95 2769.97
Electrical & Automation 4364.25 4472.16 4714.69 1935.65 1774.34 1932.70
Hydrocarbon 6728.63 6143.98 6005.52 5589.70 4567.99 4290.42
IT & Technology Services 6085.75 4306.78 4310.12 1813.49 1606.85 1307.62
Financial Services 71841.82 64212.75 52645.83 64341.27 56955.10 46316.32
Developmental Projects 28240.72 25315.31 22778.97 8931.32 8548.13 8373.32
Others 18459.26 19361.19 19969.41 6844.74 6879.62 5921.02
Segment Total 197700.56 183914.15 160931.47 133547.08 121742.83 102677.01
Corporate unallocated assets/liabilities 15849.36 12664.22 12367.74 26222.72 27762.34 27443.49
Inter-segment assets/liabilities (1490.25) (1852.22) (2177.41) (1490.25) (1852.22) (2177.41)
Consolidated total assets/liabilities 212059.67 194726.15 171121.80 158279.55 147652.95 127943.09
Notes forming part of the Consolidated Financial Statements (contd.)
NOTE [46] (contd.)

414
v crore
Other information
Depreciation, amortisation,
impairment & obsolescence
included in segment expenses
Other non-cash expenses
included in segment expenses
2016-17 2015-16 2016-17 2015-16
Infrastructure 650.53 487.89 19.81 22.09
Power 44.40 58.31 1.99 3.23
Heavy Engineering 116.69 118.90 2.49 3.31
Electrical & Automation 151.10 146.08 3.83 4.87
Hydrocarbon 148.87 147.67 7.97 5.00
IT & Technology Services 236.81 232.07 13.46 (13.90)
Financial Services 78.00 114.20 4.79 15.99
Developmental Projects 58.07 58.05 – –
Others 665.00 299.95 4.62 5.73
Segment Total 2149.47 1663.12 58.96 46.32
Corporate unallocated 220.46 123.61 29.21 21.23
Consolidated total 2369.93 1786.73 88.17 67.55
Note: Impairment loss included in other segment is v 412.57 crore (previous year: v Nil) and in Corporate unallocated is v 103 crore
(previous year: v Nil).
v crore
Other information
Interest income
included in segment
result
Interest expense
included in segment
expense
Profit/(loss) of
joint ventures and
associates accounted
applying equity
method included in
segment result
2016-17 2015-16 2016-17 2015-16 2016-17 2015-16
Infrastructure 25.96 30.36 – – 1.25 4.08
Power 0.00 0.14 – – 122.32 67.94
Heavy Engineering 0.27 0.43 – – (186.81) (209.15)
Electrical & Automation 6.71 3.44 – – – 2.49
Hydrocarbon 45.09 7.09 – – 6.19 (39.84)
IT & Technology Services 4.62 7.51 – – – –
Financial Services 89.11 72.61 4777.91 4339.01 6.14 0.96
Developmental Projects 0.03 4.89 647.60 662.97 (344.65) (818.73)
Others 31.56 28.46 – – 0.29 2.09
Segment Total 203.35 154.93 5425.51 5001.98 (395.27) (990.16)
Corporate unallocated 527.66 504.64 – – – –
Inter-segment (308.39) (232.72) (63.42) (34.87) – –
Consolidated total 422.62 426.85 5362.09 4967.11 (395.27) (990.16)
Notes forming part of the Consolidated Financial Statements (contd.)
NOTE [46] (contd.)

415
v crore
Other information
Additions to non-current
assets
Investment in joint ventures and
associates accounted applying equity
method included in segment assets
2016-17 2015-16 As at 31-3-2017
As at 31-3-2016
As at 1-4-2015
Infrastructure 616.27 1224.56 3.04 2.11 (0.01)
Power 100.17 449.81 595.57 488.42 420.11
Heavy Engineering 96.87 237.65 5.87 5.87 5.79
Electrical & Automation 176.94 333.77 – (0.00) 29.08
Hydrocarbon 111.93 48.14 334.43 320.68 284.19
IT & Technology Services 158.31 311.36 – – –
Financial Services 441.11 568.71 50.55 44.96 38.56
Developmental Projects 2549.73 3027.70 1764.72 378.58 1269.05
Others 652.84 2507.76 18.72 17.26 19.88
Segment total 4904.17 8709.46 2772.90 1257.88 2066.65
Unallocable 579.24 149.50 – – –
Inter-segment (217.31) (515.70) – – –
Consolidated total 5266.10 8343.26 2772.90 1257.88 2066.65
(b) Geographical Information
v crore
Other informationRevenues
2016-17 2015-16
India (a) 72357.51 69362.16
Foreign countries (b):
United States of America 6580.12 5929.70
Kingdom of Saudi Arabia 7059.39 4660.31
Sultanate of Oman 5583.41 5319.09
United Arab Emirates 3354.10 2814.36
Kuwait 2968.44 1771.07
Qatar 4950.40 4561.38
Other countries 7157.63 7557.27
Total Foreign countries (b) 37653.49 32613.18
Total (a+b) 110011.00 101975.34
v crore
Non-current Assets
Other information As at As at As at
31-3-2017 31-3-2016 1-4-2015
India 31842.67 30923.77 27556.15
Foreign countries 1535.91 1903.56 1545.37
Total 33378.58 32827.33 29101.52
(c) Revenue contributed by any single customer in any of the operating segments, whether reportable or otherwise, does not exceed
ten percent of the group’s total revenue.
(d) The group’s reportable segments are organized based on the nature of products and services offered by these segments.
Notes forming part of the Consolidated Financial Statements (contd.)
NOTE [46] (contd.)

416
(e) Segment reporting: basis of identifying operating segments, reportable segments and definition of each reportable segment:
(i) Basis of identifying Operating segments:
Operating segments are identified as those components of the groups (a) that engage in business activities to earn revenues
and incur expenses (including transactions with any of the group’s other components); (b) whose operating results are
regularly reviewed by the group’s executive management committee (EMC) to make decisions about resource allocation and
performance assessment; and (c) for which discrete financial information is available.
The group has eight reportable segments as described under “segment composition” below which are the group’s
independent businesses. The nature of products and services offered by these businesses are different and are managed
separately given the different sets of technology and competency requirements. In arriving at the reportable segment, the
six operating segments have been aggregated and reported as “infrastructure segment” as these operating segments have
similar economic characteristics in terms of long term average gross margins, nature of the products and services, type of
customers, methods used to distribute the products and services and the nature of regulatory environment applicable to
them.
(ii) Reportable segments
An operating segment is classified as Reportable segment if reported revenue (including inter-segment revenue) or absolute
amount of result or assets exceed 10% or more of the combined total of all the operating segments.
(iii) Performance of a segment is measured based on segment profit (before interest and tax), as included in the internal
management reports that are reviewed by the group’s EMC. The performance of financial services segment and finance lease
activities of power development segment are measured based on segment profit (before tax) after deducting the interest
expense.
(iv) Segment composition
• Infrastructure segment comprises engineering and construction of building and factories, transportation
infrastructure, heavy civil infrastructure, power transmission & distribution, water and effluent treatment and smart
world & communication projects.
• Power segment comprises turnkey solutions for Coal-based and Gas-based thermal power plants including power
generation equipment with associated systems and / or balance-of-plant packages.
• Heavy Engineering segment comprises manufacture and supply of custom designed, engineered critical equipment &
systems to core sector industries like Fertiliser, Refinery, Petrochemical, Chemical, Oil & Gas, Thermal & Nuclear Power,
Aerospace and Defence.
• Electrical & Automation segment comprises manufacture and sale of low and medium voltage switchgear
components, custom built low and medium voltage switchboards, electronic energy meters/protection (relays) systems,
control & automation products.
• Hydrocarbon segment comprises complete EPC solutions for the global Oil & Gas Industry from front-end design
through detailed engineering, modular fabrication, procurement, project management, construction, installation and
commissioning.
• IT & Technology Services segment comprises information technology and integrated engineering services.
• Financial Services segment comprises retail and corporate finance, housing finance, infrastructure finance, general
insurance (up to the date of sale), asset management of mutual fund schemes and related advisory services.
• Developmental projects segment comprises development, operation and maintenance of basic infrastructure projects,
toll collection, power development, development and operation of port facilities and providing related advisory services.
• Others segment includes metallurgical & material handling systems, realty, shipbuilding, manufacture and sale of
industrial valves, welding and cutting equipment, manufacture, marketing and servicing of construction equipment
and parts thereof, marketing and servicing of mining machinery and parts thereof, manufacture and sale of rubber
processing machinery & castings (upto the date of sale), mining and aviation. None of the businesses reported as part of
others segment meet any of the quantitative thresholds for determining reportable segments for the year ended March
31, 2017.
Notes forming part of the Consolidated Financial Statements (contd.)
NOTE [46] (contd.)

417
NOTE [47]
Disclosure of related parties/related party transactions pursuant to Indian Accounting Standard (Ind AS) 24 ‘’Related Party Disclosures’’:
(a) Names of the related parties with whom transactions were carried out during the year and description of relationship:
Associate companies:
1 L&T-Chiyoda Limited 2 Feedback Infra Private Limited
3 L&T Camp Facilities LLC 4 JSK Electricals Private Limited *
5 Magtorq Private Limited 6 Larsen and Toubro Qatar & HBK Contracting LLC
7 Rishi Consfab Private Limited** 8 Salzer Electronics Limited***
9 International Seaports (Haldia) Private Limited 10 Vizag IT Park Limited#
* The Group has sold its stake on March 29, 2016. ** The Group has sold its stake on December 21, 2015.
*** The Group has sold its stake in July and August 2015. # The Group has sold its stake on March 31, 2016.
Joint ventures:
1 L&T Special Steels & Heavy Forgings Private Limited 2 L&T-Sargent & Lundy Limited
3 L&T Howden Private Limited 4 L&T-MHPS Boilers Private Limited
5 L&T-MHPS Turbine Generators Private Limited 6 L&T Kobelco Machinery Private Limited
7 L&T Infrastructure Development Projects Limited 8 L&T Samakhiali Gandhidham Tollway Limited
9 L&T Deccan Tollways Limited 10 L&T Krishnagiri Walajahpet Tollway Limited
11 L&T IDPL Trustee Managers Pte. Ltd. 12 L&T BPP Tollway Limited
13 Larsen and Toubro Electromech LLC 14 L&T-Gulf Private Limited
15 Raykal Aluminium Company Private Limited 16 L&T Sapura Shipping Private Limited
17 L&T Sapura Offshore Private Limited 18 Panipat Elevated Corridor Limited
19 Krishnagiri Thopur Toll Road Limited 20 Western Andhra Tollways Limited
21 Vadodara Bharuch Tollway Limited 22 L&T Interstate Road Corridor Limited
23 L&T Transportation Infrastructure Limited 24 Devihalli Hassan Tollway Limited
25 L&T Halol Shamlaji Tollway Limited 26 Ahmedabad-Maliya Tollway Limited
27 Kudgi Transmission Limited 28 L&T Sambalpur-Rourkela Tollway Limited
29 PNG Tollway Limited 30 L&T Rajkot-Vadinar Tollway Limited
31 L&T Chennai-Tada Tollway Limited 32 Indiran Engineering Projects and System Kish PJSC
33 L&T Western India Tollbridge Limited 34 L&T Port Kachchigarh Limited
Key management personnel & their relatives:
(a) Executive Directors
1 Mr. A.M. Naik (Group Executive Chairman) 2 Mr. K. Venkataramanan (CEO & Managing Director) $
Ms. Jyothi Venkataramanan (wife)
3 Mr. M. V. Kotwal (Whole-time Director) $$ 4 Mr. R. Shankar Raman (CFO & Whole-time Director)
5 Mr. S.N.Subrahmanyan (Whole-time Director) 6 Mr. Shailendra Roy (Whole-time Director )
7 Mr. D. K. Sen (Whole-time Director) # 8 Mr. M. V. Satish (Whole-time Director) ##
(b) Independent/Non-executive Directors
1 Mr. M. M. Chitale 2 Mr. M. Damodaran3 Mr. Vikram Singh Mehta 4 Mr. Sushobhan Sarker5 Mr. Adil Zainulbhai 6 Mr. Subodh Bhargava7 Mr. Thomas Mathew T. @ 8 Ms. Naina Lal Kidwai @@9 Mr. Akhilesh Krishna Gupta 10 Mr. Swapan Dasgupta @@@
11 Ms. Sunita Sharma ~ 12 Mr. Bahram Vakil *13 Mr. Ajay Shankar ** 14 Mr. Subramanian Sarma ***15 Mr. Sanjeev Aga ^ 16 Mr. Narayanan Kumar ^^
$ Retired on September 30, 2015 $$ Retired on August 26, 2015 #Appointed w.e.f. October 1, 2015 ##Appointed w.e.f. January 29, 2016
@ Appointed w.e.f. April 3, 2015 @@ Appointed w.e.f. March 1, 2016 @@@ Appointed w.e.f. April 1, 2015 and separated w.e.f. May 15, 2016
* Separated w.e.f. August 1, 2016 ** Appointed w.e.f. May 30, 2015 *** Appointed w.e.f. August 19, 2015 ^ Appointed w.e.f. May 25, 2016
^^ Appointed w.e.f. May 27, 2016 ~ Appointed w.e.f. April 1, 2015
Provident Fund Trusts:
1 The Larsen & Toubro Officers & Supervisory Staff Provident Fund 2 The Larsen & Toubro Limited Provident Fund of 1952
3 The Larsen & Toubro Limited Provident Fund 4 L&T Kansbahal Staff & Workmen Provident Fund
5 L&T Kansbahal Officers & Supervisory Provident Fund 6 L&T Construction Equipment Provident Fund Trust
7 L&T Valves Employees Provident Fund
Notes forming part of the Consolidated Financial Statements (contd.)

418
Gratuity Trusts:
1 Laresen & Toubro Officers & Supervisors Gratuity Fund 2 Larsen & Toubro Gratuity Fund
3 Larsen and Toubro Technology Services Ltd Eggas 4 L&T Shipbuilding Limited Employees Group Assurance
Scheme5 Nabha Power Limited Employees’ Group Gratuity
Assurance Scheme
(b) Disclosure of related party transactions:
v crore
2016-17 2015-16
Sr. no.
Nature of transaction/relationship/major partiesAmount Amounts for
major partiesAmount Amounts for
major parties
(i) Purchase of goods & services (including commission paid) Joint ventures, including: 2360.29 2222.85
L&T-MHPS Boilers Private Limited 1675.16 1256.68 L&T-MHPS Turbine Generators Private Limited 530.79 536.02 Larsen and Toubro Electromech LLC – 304.92 Associates, including: 60.78 96.57 L&T-Chiyoda Limited 52.29 16.96 JSK Electricals Private Limited – 27.99 Salzer Electronics Limited – 37.33 Magtorq Private Limited 10.16
Total 2421.07 2319.42
(ii) Sale of goods/contract revenue & services Joint ventures, including: 1108.19 1317.94
L&T Infrastructure Development Projects Limited 544.28 653.99 L&T Deccan Tollways Limited 394.35 533.50 L&T-MHPS Boilers Private Limited 157.14 Associate : 0.42 – L&T-Chiyoda Limited 0.42 –
Total 1108.61 1317.94
(iii) Purchase/lease of property, plant and equipment Joint venture: 0.02 0.04
L&T Infrastructure Development Projects Limited 0.02 0.04
Total 0.02 0.04
(iv) Sale of Property, plant and equipment Joint ventures, including: – 0.50 L&T-MHPS Turbine Generators Private Limited – 0.26 L&T Special Steels and Heavy Forgings Private Limited – 0.19 L&T Howden Private Limited – 0.05 Associate : – 0.01 L&T-Chiyoda Limited – 0.01 Key management personnel – 9.29 Mr. K. Venkataramanan $ – 8.85 Mr. M. V. Kotwal $$ – 0.44
Total – 9.80
(v) Investments including subscription to equity and preference shares (including application money)
Joint ventures, including: (0.25) 1.09
L&T-MHPS Boilers Private Limited (0.03) –
L&T-MHPS Turbine Generators Private Limited (0.22) 1.09
Total (0.25) 1.09
Notes forming part of the Consolidated Financial Statements (contd.)
NOTE [47] (contd.)

419
v crore
2016-17 2015-16
Sr. no.
Nature of transaction/relationship/major partiesAmount Amounts for
major partiesAmount Amounts for
major parties
(vi) Purchase of investments from
Joint venture: 2041.57 –
L&T Infrastructure Development Projects Limited 2041.57 –
Total 2041.57 –
(vii) Sale of investments to
Joint venture: – 21.54
L&T Infrastructure Development Projects Limited – 21.54
Total – 21.54
(viii) Charges paid for miscellaneous services
Joint ventures, including: 6.41 10.46
L&T-Gulf Private Limited 2.47 2.67
L&T-Sargent & Lundy Limited 3.62 7.07
Associates, including: 6.42 6.53
L&T-Chiyoda Limited 6.06 6.53
Total 12.83 16.99
(ix) Rent paid, including lease rentals under leasing/hire purchase
arrangements
Joint venture: – 0.01
L&T Infrastructure Development Projects Limited – 0.01
Key management personnel – 0.01
Mr. K. Venkataramanan $ & Ms. Jyothi Venkataramanan – 0.01
Total – 0.02
(x)(a) Charges incurred for deputation of employees from related parties
Joint venture: – 2.41
L&T Infrastructure Development Projects Limited – 2.41
Total – 2.41
(x)(b) Charges recovered for deputation of employees to related parties
Joint ventures, including: 9.59 9.16
L&T Sapura Shipping Private Limited 5.60 6.70
L&T Special Steels and Heavy Forgings Private Limited 1.87
Associate: 18.01 18.72
L&T-Chiyoda Limited 18.01 18.72
Total 27.60 27.88
(xi) Dividend received
Joint venture: – 13.75
L&T-Sargent & Lundy Limited – 13.75
Associates, including: 0.57 5.63
International Seaports (Haldia) Private Limited – 2.46
Vizag IT Park Limited – 2.22
Feedback Infra Private Limited 0.57 0.57
Total 0.57 19.38
Notes forming part of the Consolidated Financial Statements (contd.)
NOTE [47] (contd.)

420
v crore
2016-17 2015-16
Sr. no.
Nature of transaction/relationship/major partiesAmount Amounts for
major partiesAmount Amounts for
major parties
(xii) Commission received, including those under agency arrangements
Joint venture: 0.65 2.64
L&T Kobelco Machinery Private Limited 0.65 2.64
Total 0.65 2.64
(xiii) Rent received, overheads recovered and miscellaneous income Joint ventures, including: 94.83 93.66 L&T-MHPS Boilers Private Limited 35.50 23.50 L&T-Sargent & Lundy Limited 17.70 17.67 L&T-MHPS Turbine Generators Private Limited 9.64 10.32 L&T Special Steels and Heavy Forgings Private Limited 10.02 Larsen and Toubro Electromech LLC 9.83 Associate: 5.23 3.85 L&T-Chiyoda Limited 5.23 3.85 Key management personnel: 0.07 – Mr. D. K. Sen # 0.07 –
Total 100.13 97.51
(xiv) Interest paid to
Joint venture: – 3.89
L&T Infrastructure Development Projects Limited – 3.89
Total – 3.89
(xv) Interest Received from
Joint ventures, including: 82.48 58.04
L&T Special Steels and Heavy Forgings Private Limited 78.98 52.58
Associate: 0.20 0.19
L&T Camp Facilities LLC 0.20 0.19
Total 82.68 58.23
(xvi) Contribution to post-employment benefit plan(a) Transaction with trust managed provident fund(i) Towards Employer’s contribution 113.35 109.73
The Larsen & Toubro Officers & Supervisory Staff Provident Fund
101.00 97.10
Total 113.35 109.73
(ii) Towards advance contribution – 0.43
The Larsen & Toubro Limited Provident Fund – 0.43
Total – 0.43
(iii) Subscription or purchase by the fund of the debt securities issued by the company – 25.00
The Larsen & Toubro Officers & Supervisory Staff Provident Fund
– 25.00
Total – 25.00
(b) Transaction with approved gratuity fund(i) Towards Employer’s contribution 35.61 72.42
Larsen & Toubro Officers & Supervisors Gratuity Fund 23.59 47.73 Larsen & Toubro Gratuity Fund 6.26 12.00 Larsen and Toubro Technology Services Limited Eggas 5.15 11.80
Total 35.61 72.42
Notes forming part of the Consolidated Financial Statements (contd.)
NOTE [47] (contd.)

421
v crore
2016-17 2015-16
Sr. no.
Nature of transaction/relationship/major partiesAmount Amounts for
major partiesAmount Amounts for
major parties
(ii) Towards advance contribution – 60.00
Larsen & Toubro Officers & Supervisors Gratuity Fund – 48.15
Larsen & Toubro Gratuity Fund – 11.85
Total – – 60.00
“Major parties” denote entities accounting for 10% or more of the aggregate for that category of transaction during respective
period.
(xvii) Compensation paid to key management personnel (KMP):
v crore
KMP
2016-17 2015-16
Short term employee
benefits
Post-employment
benefits
Other long term
benefitsTotal
Short term employee
benefits
Post-employment
benefits
Other long term benefit
Share-based payment
Total
Mr. A.M. Naik 21.86 5.83 32.21* 59.90 21.57 5.76 – – 27.33
Mr. K. Venkataramanan $ – – – – 4.74 22.43 13.53 – 40.70
Mr. M.V. Kotwal $$ – – – – 3.35 15.35 7.89 – 26.59
Mr. S. N. Subrahmanyan 13.26 3.51 – 16.77 11.53 3.06 – – 14.59
Mr. R. Shankar Raman 9.00 2.38 – 11.38 8.28 2.19 – – 10.47
Mr. Shailendra Roy 8.13 1.93 – 10.06 6.43 1.47 – – 7.90
Mr. D. K. Sen # 6.20 1.57 – 7.77 2.60 0.69 – – 3.29
Mr. M. V. Satish ## 5.96 1.44 – 7.40 0.93 0.24 – – 1.17
Mr. Subramanian Sarma (Non-Executive Director)
15.39 – – 15.39 4.86 – – 10.35** 15.21
Other Non-Executive Directors 4.37 – – 4.37 4.06 – – – 4.06
Total 84.17 16.66 32.21 133.04 68.35 51.19 21.42 10.35 151.31
$ Retired on September 30, 2015 $$ Retired on August 26, 2015 # Appointed w.e.f. October 1, 2015 ## Appointed w.e.f. January 29, 2016
* Represents encashment of past service accumulated leave
** Represents fair value of employee stock options granted during 2015-16 to be vested over a period of time.
(c) Amount due to/from related parties (including commitments):
v crore
As at 31-3-2017 As at 31-3-2016 As at 1-4-2015
Sr. no. Category of balance/relationship/major parties
Amount Amounts for major
parties
Amounts for major
parties
Amounts for major
parties
Amounts for major
parties
Amounts for major
parties
(i) Accounts receivable
Joint ventures, including: 410.81 554.78 439.07
L&T-MHPS Boilers Private Limited 65.64 102.76 77.32
L&T Infrastructure Development Projects
Limited 78.42 129.61 111.62
L&T Samakhiali Gandhidham Tollway
Limited 43.30 58.20 89.13
L&T Deccan Tollways Limited 125.63 139.21 90.97
L&T Krishnagiri Walajahpet Tollway
Limited 44.68
Associate: – 0.01 –
L&T-Chiyoda Limited – 0.01 –
Total 410.81 554.79 439.07
Notes forming part of the Consolidated Financial Statements (contd.)
NOTE [47] (contd.)

422
v crore
As at 31-3-2017 As at 31-3-2016 As at 1-4-2015
Sr. no. Category of balance/relationship/major parties
Amount Amounts for major
parties
Amounts for major
parties
Amounts for major
parties
Amounts for major
parties
Amounts for major
parties
(ii) Accounts payable, including other liabilities
Joint ventures, including: 1930.01 1726.56 1477.02
L&T-MHPS Boilers Private Limited 1171.96 1042.26 830.70
L&T-MHPS Turbine Generators Private
Limited 611.61 560.50 547.27
Associates, including: 14.91 15.19 31.70
L&T-Chiyoda Limited 11.40 6.42 8.19
Salzer Electronics Limited – – 18.54
Magtorq Private Limited 2.65 7.79
Total 1944.92 1741.75 1508.72
(iii) Loans and advances recoverable (including loans
and advances towards financing activities)
Joint ventures, including: 1731.17 1726.09 1734.43
L&T Special Steels and Heavy Forgings
Private Limited 1185.55 877.65 564.77
L&T-MHPS Boilers Private Limited 215.18 431.85 606.29
L&T-MHPS Turbine Generators Private
Limited 210.22 282.66 421.59
Associates, including: 27.24 26.96 24.62
L&T-Chiyoda Limited 7.87 7.78 6.71
L&T Camp Facilities LLC 18.97 19.18 17.92
Key management personnel: – – 0.01
Mr. K Venkataramanan$ &
Ms. Jyothi Venkataramanan – – 0.01
Total 1758.41 1753.05 1759.06
(iv) Advances received in the capacity of supplier of
goods/services classified as “advances from
customers” in the Balance Sheet
Joint ventures, including: 23.21 119.27 228.89
L&T Infrastructure Development Projects
Limited 68.84 122.24
L&T Deccan Tollways Limited 36.97 96.03
L&T-MHPS Boilers Private Limited 21.54 13.46 –
Total 23.21 119.27 228.89
Notes forming part of the Consolidated Financial Statements (contd.)
NOTE [47] (contd.)
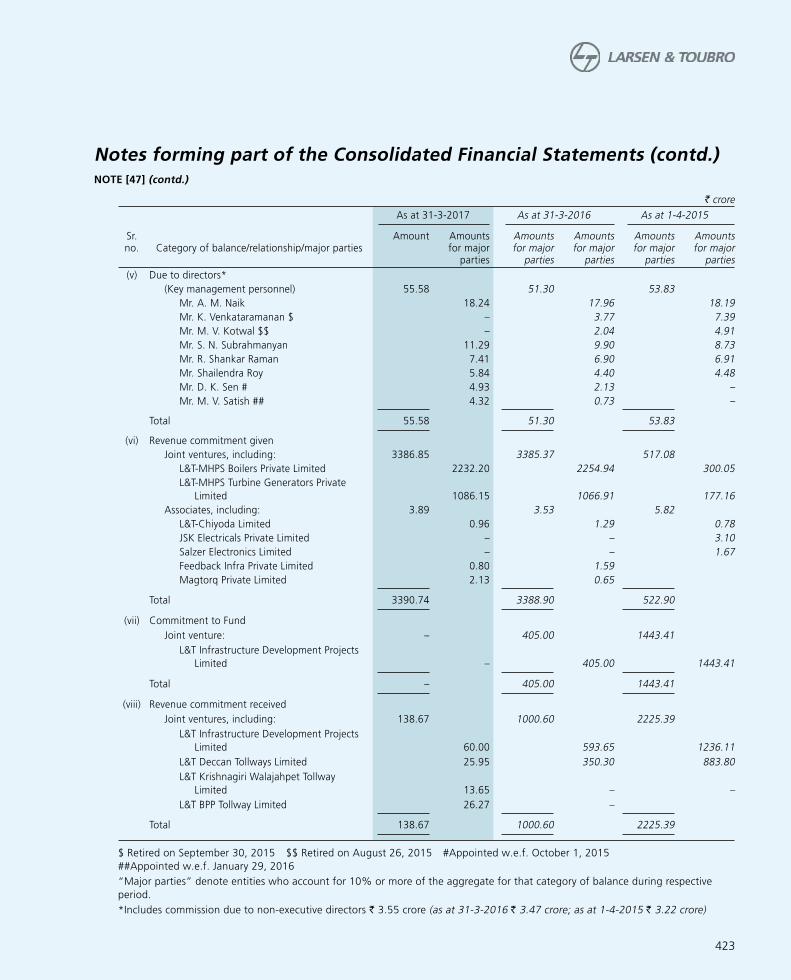
423
v crore
As at 31-3-2017 As at 31-3-2016 As at 1-4-2015
Sr. no. Category of balance/relationship/major parties
Amount Amounts for major
parties
Amounts for major
parties
Amounts for major
parties
Amounts for major
parties
Amounts for major
parties
(v) Due to directors*
(Key management personnel) 55.58 51.30 53.83
Mr. A. M. Naik 18.24 17.96 18.19
Mr. K. Venkataramanan $ – 3.77 7.39
Mr. M. V. Kotwal $$ – 2.04 4.91
Mr. S. N. Subrahmanyan 11.29 9.90 8.73
Mr. R. Shankar Raman 7.41 6.90 6.91
Mr. Shailendra Roy 5.84 4.40 4.48
Mr. D. K. Sen # 4.93 2.13 –
Mr. M. V. Satish ## 4.32 0.73 –
Total 55.58 51.30 53.83
(vi) Revenue commitment given
Joint ventures, including: 3386.85 3385.37 517.08
L&T-MHPS Boilers Private Limited 2232.20 2254.94 300.05
L&T-MHPS Turbine Generators Private
Limited 1086.15 1066.91 177.16
Associates, including: 3.89 3.53 5.82
L&T-Chiyoda Limited 0.96 1.29 0.78
JSK Electricals Private Limited – – 3.10
Salzer Electronics Limited – – 1.67
Feedback Infra Private Limited 0.80 1.59
Magtorq Private Limited 2.13 0.65
Total 3390.74 3388.90 522.90
(vii) Commitment to Fund
Joint venture: – 405.00 1443.41
L&T Infrastructure Development Projects
Limited – 405.00 1443.41
Total – 405.00 1443.41
(viii) Revenue commitment received
Joint ventures, including: 138.67 1000.60 2225.39
L&T Infrastructure Development Projects
Limited 60.00 593.65 1236.11
L&T Deccan Tollways Limited 25.95 350.30 883.80
L&T Krishnagiri Walajahpet Tollway
Limited 13.65 – –
L&T BPP Tollway Limited 26.27 –
Total 138.67 1000.60 2225.39
$ Retired on September 30, 2015 $$ Retired on August 26, 2015 #Appointed w.e.f. October 1, 2015
##Appointed w.e.f. January 29, 2016
“Major parties” denote entities who account for 10% or more of the aggregate for that category of balance during respective
period.
*Includes commission due to non-executive directors R 3.55 crore (as at 31-3-2016 R 3.47 crore; as at 1-4-2015 R 3.22 crore)
Notes forming part of the Consolidated Financial Statements (contd.)
NOTE [47] (contd.)

424
NOTE [48]
Disclosure in respect of Leases pursuant to Indian Accounting Standard (Ind AS) 17 ‘’Leases’’:
(a) Where the Group is a Lessor:
(i) Finance leases:
Assets given under leases mainly include power plant where the Group has agreed to manufacture/construct an asset and
convey, in substance, a right to the beneficiary to use the asset over a major part of its economic life, for a pre-determined
consideration.
The total gross investment in these leases and the present value of minimum lease payments receivable are as under:
v crore
Sr.
no.Particulars
Minimum Lease Payments Present value of minimum lease
payments
As at
31-3-2017
As at
31-3-2016
As at
1-4-2015
As at
31-3-2017
As at
31-3-2016
As at
1-4-2015
1. Receivable not later than 1 year 1493.73 1553.53 1508.37 309.72 332.12 280.26
2. Receivable later than 1 year and not later than 5 years 5194.38 6644.52 6994.47 771.25 923.29 1108.00
3. Receivable later than 5 years 19641.82 19696.09 19855.00 8143.14 8318.78 7904.34
Gross investment in lease (1+2+3) 26329.93 27894.14 28357.84 9224.11 9574.19 9292.60
Less: Unearned finance income 17105.82 18319.95 19065.24
Present value of minimum lease payments receivable 9224.11 9574.19 9292.60
(ii) Operating leases:
The Group has given certain assets under non-cancellable operating lease, the future minimum lease payments receivable in
respect of which are as follows:
v crore
Sr. no.
ParticularsAs at
31-3-2017
As at
31-3-2016
As at
1-4-2015
1. Receivable not later than 1 year 82.73 136.08 177.76
2. Receivable later than 1 year and not later than 5 years 74.47 212.16 208.92
3. Receivable later than 5 years 1.45 9.68 27.31
Total 158.65 357.92 413.99
(b) Where the Group is a Lessee:
(i) Finance leases:
A. Assets acquired on finance lease comprises of motor vehicles and land. The motor vehicles leases have a primary period,
which is fixed and non-cancellable. The Group has an option to renew the lease for a secondary period. The agreements
provide for revision of lease rentals in the event of changes in (a) taxes, if any, leviable on the lease rentals (b) rates of
depreciation under the Income tax Act, 1961 and (c) change in the lessor’s cost of borrowings. There are no exceptional/
restrictive covenants in the lease agreements.
B. The minimum lease rentals and the present value thereof in respect of assets acquired under finance leases are as
follows:
v crore
Sr.
no.Particulars
Minimum lease payments Present value of minimum lease
payments
As at
31-3-2017
As at
31-3-2016
As at
1-4-2015
As at
31-3-2017
As at
31-3-2016
As at
1-4-2015
1. Payable not later than 1 year 0.67 0.13 1.76 0.60 0.11 –
2. Payable later than 1 year and not
later than 5 years 0.22 0.21 6.71 0.19 0.17 –
3. Payable later than 5 years 0.13 0.15 95.88 0.06 0.06 39.64
Total (1+2+3 ) 1.02 0.49 104.35 0.85 0.34 39.64
Less: Future finance charges 0.17 0.15 64.71
Present value of minimum lease
payments 0.85 0.34 39.64
Notes forming part of the Consolidated Financial Statements (contd.)

425
C. Contingent Rent recognised in the Statement of Profit and Loss: v Nil (previous year v Nil)
(ii) Operating leases:
A. The Group has taken various commercial premises and plant and equipment under cancellable operating leases.
B. [a] The Group has taken certain assets on non-cancellable operating leases, the future minimum lease payments in
respect of which are as follows:
v crore
Sr.
no.Particulars
Minimum lease payments
As at
31-3-2017
As at
31-3-2016
As at
1-4-2015
1. Payable not later than 1 year 226.14 219.71 125.82
2. Payable later than 1 year and not later than 5 years 695.13 815.52 374.21
3. Payable later than 5 years 290.58 351.54 358.82
Total 1211.85 1386.77 858.85
[b] The lease agreements provide for an option to the Group to renew the lease period at the end of the non-
cancellable period. There are no exceptional / restrictive covenants in the lease agreements.
C. Lease rental expense in respect of operating leases: v 475.34 crore (previous year: v 448.35 crore)
D. Contingent rent recognised in the Statement of Profit and Loss: v Nil (previous year: v Nil)
NOTE [49]
Basic and Diluted Earnings per share [EPS] computed in accordance with Indian Accounting Standard (Ind AS) 33 “Earnings per Share’’:
Particulars 2016-17 2015-16
Basic EPS
Profit after tax as per accounts (v crore) A 6041.23 4232.88
Weighted average number of equity shares outstanding B 93,23,49,030 93,07,61,648
Basic EPS (v) A/B 64.80 45.48
Diluted EPS
Profit after tax as per accounts (v crore) A 6041.23 4232.88
Weighted average number of equity shares outstanding B 93,23,49,030 93,07,61,648
Add: Weighted average number of potential equity shares on account of employee stock options C 31,60,400 43,02,265
Weighted average number of equity shares outstanding for diluted EPS D=B+C 93,55,09,430 93,50,63,913
Diluted EPS (v) A/D 64.58 45.27
Face value per share (v) 2.00 2.00
The following potential equity shares are anti-dilutive and are therefore excluded from the weighted average number of equity shares
for the purpose of diluted earning per share
Particulars 2016-17 2015-16
Weighted average number of potential equity shares on account of conversion of foreign currency convertible bonds 63,46,986 63,46,986
Note: On May 29, 2017, the Board of Directors has recommended for the approval of shareholders, the issue of bonus equity shares in
the ratio 1:2 (one bonus equity share of v 2 each for every two equity shares of v 2 each held). The effect of the said bonus issue will be
given in the year 2017-18 post approval by shareholders.
Notes forming part of the Consolidated Financial Statements (contd.)
NOTE [48] (contd.)

426
NOTE [50]
Disclosure pursuant to Ind AS 12 “Income Taxes”
(a) Major components of tax expense/(income):
v crore
Sr.
no. Particulars
2016-17 2015-16
Consolidated Statement of Profit and Loss:
(a) Profit and Loss section:
(i) Current Income tax :
Current income tax expense 2975.63 2780.73
Tax expense of prior periods 0.68 36.96
2976.31 2817.69
(ii) Deferred Tax:
Tax expense on origination and reversal of temporary differences (767.50) (377.75)
Effect of previously unrecognised tax losses and tax offsets used to reduce tax expense (60.26) (2.98)
(827.76) (380.73)
Income tax expense reported in the consolidated Statement of Profit and Loss [(i)+(ii)] 2148.55 2436.96
(b) Other Comprehensive Income (OCI) section:
(i) Items not to be reclassified to profit or loss in subsequent periods:
Current tax expense/(income):
On remeasurement of defined benefit plans (5.95) (3.64)
(5.95) (3.64)
(ii) Items to be reclassified to profit or loss in subsequent periods:
(A) Current tax expense/(income):
Forward covers settled, retained in hedging reserve (22.79) 75.05
(22.79) 75.05
(B) Deferred tax expense/(income):
Net gain/(loss) on cost of hedging reserve (23.14) 6.00
On Mark-to-Market (MTM) of cash flow hedges 265.41 8.55
On gain/(loss) on fair value of debt securities 1.09 (1.29)
On foreign currency translation (2.29) 2.20
241.07 15.46
Income tax expense reported in the other comprehensive income [(i)+(ii)] 212.33 86.87
(c) Retained earnings:
Current income tax (135.15) –
Deferred tax 134.85 –
Income tax expense reported in retained earnings (0.30) –
Notes forming part of the Consolidated Financial Statements (contd.)

427
(b) Reconciliation of Income tax expense and accounting profit multiplied by domestic tax rate applicable in India:
v crore
Sr. no. Particulars 2016-17 2015-16
(a) Profit before tax 8887.36 8019.62
(b) Corporate tax rate as per Income tax Act, 1961 34.61% 34.61%
(c) Tax on accounting profit (c)=(a)*(b) 3075.74 2775.43
(d) (i) Tax on Income exempt from tax:
(A) Dividend income and interest on tax free bonds (244.71) (43.32)
(B) Long term capital gains exempt from tax (3.27) (48.83)
(ii) Tax on expense not tax deductible:
(A) Corporate Social Responsibility (CSR) expenses 42.37 46.97
(B) Expenses in relation to exempt income 20.51 50.75
(C) Tax on employee perquisites borne by the Group 3.38 2.67
(iii) Weighted deduction on R&D expenditure and deduction u/s 80IA (377.63) (278.96)
(iv) Tax effect on impairment losses recognised and on which deferred tax asset
(DTA) is not recognised 97.25 –
(v) Effect of previously unrecognised tax losses used to reduce tax expense (153.54) (103.22)
(vi) Tax effect of losses of current year on which no deferred tax benefit is recognised 398.43 440.91
(vii) Effect of tax paid on foreign source income which is exempt from tax in India u/s
10AA (198.61) (231.88)
(viii) Effect of tax benefit on business combination under common control (228.69) –
(ix) Tax effect on various other Items (282.68) (173.56)
Total effect of tax adjustments [(i) to (ix)] (927.19) (338.47)
(e) Tax expense recognised during the year (e)=(c)+(d) 2148.55 2436.96
(f) Effective tax Rate (f)=(e)/(a) 24.18% 30.39%
(c) (i) Unused tax losses and unused tax credits for which no deferred tax asset is recognised in Balance Sheet
ParticularsAs at 31-3-2017 As at 31-3-2016 As at 1-4-2015
v crore Expiry year v crore Expiry year v crore Expiry year
Tax losses (revenue loss on which no tax asset is created)
- Amount of losses having expiry 3235.46 AY 2017-38 2824.45 AY 2017-37 2122.59 AY 2017-36
- Amount of losses having no expiry 513.33 – 336.96 – 133.78 –
Tax losses (capital loss on which no tax asset is created)
2931.96 AY 2022-26 1411.15 AY 2020-25 249.46 AY 2020-24
Unused tax credits [Minimum Alternate Tax (MAT) credit not recognised]
145.40 AY 2029-33 150.62 AY 2024-27 51.26 AY 2024-26
Total 6826.15 4723.18 2557.09
(ii) Unrecognised deductible temporary differences for which no deferred tax asset is recognised in Balance Sheet
v crore
Sr. no.
ParticularsAs at 31-3-2017 As at 31-3-2016 As at 1-4-2015
(a) Deductible temporary differences towards provision for diminution in value of investments on which DTA not created
350.47 69.47 46.04
(b) Temporary differences arising out of revaluation of tax base of assets (on account of indexation benefit)
2164.85 1920.13 1680.94
Total 2515.32 1989.60 1726.98
Notes forming part of the Consolidated Financial Statements (contd.)
NOTE [50] (contd.)

428
(d) (i) Major components of Deferred Tax Liabilities and Deferred Tax Assets:
v crore
Particulars
Deferred
tax
liabilities/
(assets)
as at
31-3-2016
Charge/
(credit) to
Statement
of Profit
and Loss
Charge/
(credit) to
Retained
Earnings
MAT credit
utilised
Effect
due to
acquisition/
disposal
Charge/(credit)
to other
comprehensive
income
Exchange
Difference
Deferred
tax
liabilities/
(assets)
as at
31-3-2017
Deferred tax liabilities:
- Difference between book and tax
depreciation 1105.00 (315.85) – – 1.48 – – 790.63
- Disputed statutory liabilities paid and
claimed as deduction for tax purposes but
not debited to Statement of Profit and Loss 116.03 36.05 – – 0.01 – – 152.09
- Gain on Derivative Transactions to be offered
for tax purposes in the year of transfer/
settlement 6.17 4.78 – – – 34.41 – 45.36
- Other items giving rise to temporary
differences 400.19 (134.96) – – (0.01) – (1.10) 264.12
Deferred tax liabilities: 1627.39 (409.98) – – 1.48 34.41 (1.10) 1252.20
Offsetting of deferred tax liabilities with
deferred tax(assets) (991.91) (641.25)
Net Deferred tax liabilities 635.48 610.95
Deferred tax (assets):
- Provision for doubtful debts, advances and
non-performing assets debited to Statement
of Profit and Loss (1037.33) (537.95) – – – – – (1575.28)
- Unpaid statutory liabilities (215.72) (20.93) – – 0.01 – – (236.64)
- Unabsorbed depreciation (412.78) 258.50 – – 3.69 – – (150.59)
- Carried forward tax losses (323.30) 199.64 – – – – – (123.66)
- Utilised MAT credit (382.57) (300.01) – 14.61 8.96 – – (659.01)
- Loss on derivative transactions to be claimed
for tax purposes in the year of transfer/
settlement (133.56) (53.90) – – 207.86 – 20.40
- Difference between book and tax
depreciation (88.03) 55.88 – – – – – (32.15)
- Other items giving rise to temporary
differences 229.47 (19.01) 134.85 – 36.85 (1.20) (1.43) 379.53
Deferred tax (assets): (2363.82) (417.78) 134.85 14.61 49.51 206.66 (1.43) (2377.40)
Offsetting of deferred tax (assets) with deferred
tax liabilities 991.91 641.25
Net Deferred tax (assets) (1371.91) (1736.15)
Net deferred tax liability/(assets) (736.43) (827.76) 134.85 14.61 50.99 241.07 (2.53) (1125.20)
Notes forming part of the Consolidated Financial Statements (contd.)
NOTE [50] (contd.)

429
(ii) Major components of Deferred Tax Liabilities and Deferred Tax Assets:
v crore
Particulars
Deferred tax
liabilities/
(assets) as at
1-4-2015
Charge/(credit)
to Statement of
Profit and Loss
MAT credit
utilised
Effect due to
acquisition/
disposal/Held
for sale
Charge/
(credit) to other
comprehensive
income
Exchange
Difference
Deferred tax
liabilities/
(assets) as at
31-3-2016
Deferred tax liabilities:
- Difference between book and tax
depreciation 807.55 323.32 – (25.87) – – 1105.00
- Disputed statutory liabilities paid and
claimed as deduction for tax purposes
but not debited to Statement of Profit
and Loss 102.11 13.92 – – – – 116.03
- Gain on Derivative Transactions to be
offered for tax purposes in the year of
transfer/settlement 23.50 (5.53) – – (11.80) – 6.17
- Other items giving rise to temporary
differences 432.06 (41.52) – 0.01 – 9.64 400.19
Deferred tax liabilities: 1365.22 290.19 – (25.86) (11.80) 9.64 1627.39
Offsetting of deferred tax liabilities with
deferred tax(assets) (705.73) (991.91)
Net Deferred tax liabilities 659.49 635.48
Deferred tax (assets):
- Provision for doubtful debts, advances
and non-performing assets debited to
Statement of Profit and Loss (822.47) (214.86) – – – – (1037.33)
- Unpaid statutory liabilities (190.24) (25.48) – – – – (215.72)
- Unabsorbed depreciation (57.52) (346.63) – (8.63) – – (412.78)
- Carried forward tax losses (401.36) 78.06 – – – – (323.30)
- Unutilised MAT credit (201.23) (184.97) 3.42 0.21 – – (382.57)
- Loss on derivative transactions to be
claimed for tax purposes in the year of
transfer/settlement (173.08) 13.17 – – 26.35 – (133.56)
- Difference between book and tax
depreciation (85.28) (13.12) – 10.37 – – (88.03)
- Other items giving rise to temporary
differences 215.55 22.91 – 1.54 0.91 (11.44) 229.47
Deferred tax (assets): (1715.63) (670.92) 3.42 3.49 27.26 (11.44) (2363.82)
Offsetting of deferred tax (assets) with
deferred tax liabilities 705.73 991.91
Net Deferred tax (assets) (1009.90) (1371.91)
Net deferred tax liability/(assets) (350.41) (380.73) 3.42 (22.37) 15.46 (1.80) (736.43)
Notes forming part of the Consolidated Financial Statements (contd.)
NOTE [50] (contd.)

430
NOTE [51]
Disclosures pursuant to Indian Accounting Standard (Ind AS) 103 “Business Combinations”:
(a) On November 30, 2016, the Group acquired 100% stake in AugmentIQ Data Sciences Private Limited, a software development
company in India.
(b) Assets acquired and liabilities recognised on the date of acquisition:
v crore
Non-Current Assets 4.34
Current Assets
Short term loans 1.02
Trade receivables 2.48 3.50
Current Liabilities
Trade Payables (0.34)
Other current liabilities (2.29)
Deferred tax liability on acquisition (1.48) (4.11)
Net Assets 3.73
(c) Calculation of goodwill:
v crore
Purchase consideration paid 7.07
Less: Fair value of net assets acquired 3.73
Goodwill 3.34
Goodwill (Group’s share) 2.83
NOTE [52]
Disclosures pursuant to Indian Accounting Standard (Ind AS) 105 “Non-current assets held for sale and discontinued operations”:
(a) The Group has following non-current assets/disposal group recognised as held for sale as at March 31, 2017:
Assets/Disposal Group Reportable Segment
Port operation (Marine Infrastructure Developer Private Limited) Developmental Projects
Ready Mix Concrete unit (Larsen & Toubro Readymix & Asphalt Concrete Industries LLC) Infrastructure
Non-current assets at Talegaon (L&T Cutting Tools Limited) Others
Non-current Assets (L&T Aviation Services Private Limited) Others
Non-current Assets (L&T Financial Consultants Limited) Financial Services
The Group has following non-current assets/disposal group recognised as held for sale as at March 31, 2016:
Assets/Disposal Group Reportable Segment
Port operation (L&T Shipbuilding Limited) Developmental Projects
Non-current assets at Talegaon (L&T Cutting Tools Limited) Others
Land at Vizag (L&T Realty Limited) Others
The Group has following non-current assets/disposal group recognised as held for sale as at April 1, 2015:
Assets/Disposal Group Reportable Segment
Non-current assets at Talegaon (L&T Cutting Tools Limited) Others
Foundry business (Casting manufacturing unit) Others
Net assets at Chandigarh (CSJ Infrastructure Private Limited) Others
Notes forming part of the Consolidated Financial Statements (contd.)

431
(b) The Group has identified the above as held for sale to optimise the capital allocation and focus on core business. The sale is
envisaged through transfer of title deeds for identified assets held for sale and in case of disposal group, through business transfer
agreement/divestment of stake in the subsidiary company. The proposed sale are expected to be completed within 1 year from the
respective reporting dates.
(c) The details of assets/ disposal group classified as held for sale and liabilities associated thereto are as under:
v crore
ParticularsAs at
31-3-2017
As at
31-3-2016
As at
1-4-2015
Group(s) of assets classified as held for sale
Property, plant and equipment 1589.23 1573.97 448.65
Capital work-in-progress – – 309.17
Investment property – – 688.70
Other intangible assets 1.35 2.11 0.22
Tax assets (net) – – 25.26
Inventories 2.29 1.32 117.51
Trade receivable 12.85 2.06 44.23
Cash and cash equivalents 0.74 – 21.43
Other assets 42.91 – 16.18
Total 1649.37 1579.46 1671.35
Liabilities associated with group(s) of assets classified as held for sale
Borrowings 21.00 – 1002.14
Trade payables 19.87 – 34.33
Provisions 4.32 1.03 0.46
Tax liabilities (Net) 0.33 – 1.11
Other liabilities 1450.08 12.85 85.77
Total 1495.60 13.88 1123.81
NOTE [53]
Disclosures pursuant to Indian Accounting Standard (Ind AS) 37 “Provisions, Contingent Liabilities and Contingent Assets”:
(a) Movement in provisions:
v crore
Sr.
No. Particulars
Class of provisions
Product
warranties
Expected tax
liability in
respect of
indirect taxes
Litigation
related
obligations
Contractual
rectification
cost-
construction
contracts
Provision
towards
constructive
obligation
Others** Total
1 Balance as at 1-4-2016 38.61 156.60 8.69 160.84 507.76 41.92 914.42
2 Additional provision during the year 19.05 59.30 – 272.72 255.47* 30.83 637.37
3 Provision used/reversed during the year # (12.44) (6.04) – (114.15) – (10.50) (143.13)
4 Translation adjustments (0.10) – – 0.01 – – (0.09)
5 Additional provision for unwinding of interest
and change in discount rate 0.45 – 0.45 0.01 – – 0.91
6 Balance as at 31-3-2017 (1+2+3+4+5) 45.57 209.86 9.14 319.43 763.23 62.25 1409.48
# includes provision used during the year R 8.67 crore
* includes R 55.32 crore on account of non-controlling interest and R 200.15 crore on account of share in loss of joint ventures
** includes liquidated damages/backwork charges adjusted against revenue/manufacturing, construction and operating expenses during the year.
Notes forming part of the Consolidated Financial Statements (contd.)
NOTE [52] (contd.)

432
(b) Nature of provisions:
(i) Product warranties: The Group gives warranties on certain products and services, undertaking to repair or replace the items
that fail to perform satisfactorily during the warranty period. Provision made as at March 31, 2017 represents the amount
of the expected cost of meeting such obligations of rectification/replacement. The timing of the outflows is expected to be
within a period of five years from the date of Balance Sheet.
(ii) Expected tax liability in respect of indirect taxes represents mainly the differential sales tax liability on account of non-
collection of declaration forms for the period prior to five years.
(iii) Provision for litigation related obligations represents liabilities that are expected to materialise in respect of matters in appeal.
(iv) Contractual rectification cost represents the estimated cost the Group is likely to incur during defect liability period as per the
contract obligations in respect of completed construction contracts accounted under Indian Accounting Standard (Ind AS) 11
“Construction Contracts”.
(v) Constructive obligation represents losses absorbed by the group for share of joint venturer/ non-controlling interests in joint
ventures/ subsidiaries and own share of losses over and above the investments.
(vi) Liquidated damages represent the estimated cost the Group is likely to incur due to delay in delivery of products as per its
contract obligations and accrued on the basis of advice from distributors/customers.
(c) Disclosure in respect of contingent liabilities is given in Note 32.
NOTE [54]
Disclosure pursuant to Indian Accounting Standard (Ind AS) 112 “Disclosure of Interest in other entities”
(a) The Group, based on shareholders’ agreements and other relevant documents, has assessed that though the Group has voting
power in excess of 50% in the companies listed below, it does not have unilateral control over their relevant activities (e.g.
operating and financial decision making). Accordingly, these companies have been classified as joint ventures.
1 L&T Special Steels & Heavy Forgings Private Limited 2 L&T-Gulf Private Limited
3 L&T Sapura Shipping Private Limited 4 L&T Sapura Offshore Private Limited
5 Larsen & Toubro Electromech LLC 6 L&T-Sargent & Lundy Limited
7 L&T Howden Private Limited 8 L&T-MHPS Boilers Private Limited
9 L&T-MHPS Turbine Generators Private Limited 10 L&T Kobelco Machinery Private Limited
11 L&T Infrastructure Development Projects Limited 12 Ahmedabad-Maliya Tollway Limited
13 L&T Halol-Shamlaji Tollway Limited* 14 L&T Rajkot-Vadinar Tollway Limited
15 PNG Tollway Limited 16 L&T Chennai-Tada Tollway Limited
17 L&T Port Kachchigarh Limited 18 L&T Samakhiali Gandhidham Tollway Limited
19 Panipat Elevated Corridor Limited 20 Krishnagiri Thopur Toll Road Limited
21 Vadodara Bharuch Tollway Limited 22 L&T Transportation Infrastructure Limited
23 L&T Western India Tollbridge Limited 24 L&T Interstate Road Corridor Limited
25 L&T Krishnagiri Walajahpet Tollway Limited 26 Devihalli Hassan Tollway Limited
27 L&T BPP Tollway Limited 28 Western Andhra Tollways Limited
29 L&T Deccan Tollways Limited 30 Kudgi Transmission Limited
31 L&T Sambhalpur-Rourkela Tollway limited 32 L&T IDPL Trustee Manager Pte. Ltd.
33 L&T Infrastructure Development Projects Lanka (Private) Limited 34 Raykal Aluminium Company Private Limited
* Effective holding 47.75% (31-3-2016: 97.45%, 1-4-2015: 97.45%)
Notes forming part of the Consolidated Financial Statements (contd.)
NOTE [53] (contd.)

433
(b) Change in the Group’s ownership interest in a subsidiary (without ceding control)
(i) On account of divestment of part stake
During the year 2016-17, the Group has sold 10.30% stake in Larsen & Toubro Infotech Limited and 10.23% stake in L&T
Technology Services Limited. The proceeds on disposal of v 2069.84 crore were received as sale consideration. An amount
of v 360.50 crore (being the proportionate share of the carrying amount of the net assets of Larsen & Toubro Infotech
Limited and L&T Technology Services Limited) has been transferred to non-controlling interest. Further, v 1709.34 crore being
difference between the consideration received and the increase in the non-controlling interest has been credited to other
equity.
During the year 2015-16, the Group has sold 4.97% stake in L&T Finance Holdings Limited. The proceeds on disposal of
v 595.37 crore were received as sale consideration. An amount of v 331.49 crore (being the proportionate share of the
carrying amount of the net assets of L&T Finance Holdings Limited) has been transferred to non-controlling interest. Further,
v 263.88 crore being the difference between the consideration received and the increase in the non-controlling interest has
been credited to other equity.
(ii) On account of dilution
During the year 2016-17, the Group’s continuing interest has been reduced on account of dilution due to exercise of ESOP
by 0.09% and 0.38% in L&T Finance Holdings Limited and in Larsen & Toubro Infotech Limited respectively. The proceeds on
dilution of v 11.93 crore were received as share issue consideration. An amount of v 21.77 crore (being the proportionate
share of the carrying amount of the net assets of L&T Finance Holdings Limited and in Larsen & Toubro Infotech Limited) has
been transferred to non-controlling interest. Further, v 9.84 crore being the difference between the increase in the non-
controlling interest and the consideration received has been debited to other equity.
During the year 2015-16, the Group’s continuing interest has been reduced on account of dilution due to exercise of
ESOP by 5.04% in Larsen & Toubro Infotech Limited and by 1.27% in L&T Finance Holdings Limited due to exercise of
ESOP and preferential allotment of equity shares. The proceeds on dilution of v 248.16 crore were received. An amount
of v 274.09 crore (being the proportionate share of the carrying amount of the net assets of Larsen & Toubro Infotech
Limited and L&T Finance Holdings Limited) has been transferred to non-controlling interests. Further, v 25.93 crore being
the difference between the increase in the non-controlling interest and the consideration received has been debited to other
equity.
(iii) The effect of divestment with ceding of control in subsidiaries during the period is as under:
v crore
Sr.
no.Name of company
Effect on consolidated
profit/(loss) after non-
controlling interest
Line item in Statement of
Profit and Loss in which the
gain/(loss) is recognised2016-17 2015-16
1 L&T General Insurance Company Limited 402.43 – Exceptional Items
2 L&T South City Projects Limited 95.81 – Revenue from operations
3 CSJ Infrastructure Private Limited – 133.43 Revenue from operations
4 L&T Infocity Limited – 78.45 Revenue from operations
5 L&T Hitech City Limited – 22.97 Revenue from operations
6 Hyderabad International Trade Expositions Limited – 0.86 Revenue from operations
Total 498.24 235.71
Notes forming part of the Consolidated Financial Statements (contd.)
NOTE [54] (contd.)

434
(c) Disclosure of subsidiaries having material non-controlling interest:
(i) Summarised Statement of Profit and Loss
v crore
Particulars
L&T Finance Limited (formerly
known as Family Credit
Limited)
L&T Finance Limited*
2016-17 2015-16 2016-17 2015-16
Revenue 4042.46 773.35 – 2394.10
Profit/(loss) for the year (37.13) 91.08 – 239.84
Other comprehensive income 4.50 (0.07) – (0.65)
Total comprehensive income (32.63) 91.01 – 239.19
Profit/(loss) allocated to non-controlling interest 196.60 28.58 – 79.37
Dividend to non-controlling interest – – – –
* The Company is merged with Family Credit Limited (subsequently renamed as L&T Finance Limited)
v crore
Particulars
L&T Infrastructure
Finance Company
Limited
L&T Finance Holdings
Limited
Larsen and Toubro
Infotech Limited
2016-17 2015-16 2016-17 2015-16 2016-17 2015-16
Revenue 2695.39 2461.36 60.82 47.25 6329.75 5699.70
Profit/(loss) for the year 53.64 428.47 120.37 213.33 937.56 856.17
Other comprehensive income (1.17) 0.03 (0.14) (4.88) 215.95 (46.03)
Total comprehensive income 52.47 428.50 120.23 208.45 1153.51 810.14
Profit/(loss) allocated to non-controlling
interest
12.10 137.30 (13.94) (21.51) 119.71 11.09
Dividend to non-controlling interest – – 46.75 37.26 20.57 20.25
(ii) Summarised Balance Sheet
v crore
Particulars
L&T Finance Limited (formerly
known as Family Credit Limited)
L&T Finance Limited*
As at
31-3-2017
As at
31-3-2016
As at
1-4-2015
As at
31-3-2017
As at
31-3-2016
As at
1-4-2015
Current assets (a) 16255.81 2503.86 1859.57 – 6721.62 7035.84
Current liabilities (b) 13500.70 1858.40 1719.85 – 6610.94 6000.21
Net current assets (c)=(a) - (b) 2755.11 645.46 139.72 – 110.68 1035.63
Non-current assets (d) 19567.33 2830.63 1872.16 – 8456.81 8900.32
Non-current liabilities (e) 15535.18 2865.67 1492.76 – 6409.66 7662.07
Net non-current assets (f)=(d) - (e) 4032.15 (35.04) 379.40 – 2047.15 1238.25
Net assets (g)=(c) + (f) 6787.26 610.42 519.12 – 2157.83 2273.88
Accumulated non-controlling interest 687.71 119.22 72.20 – 329.63 249.13
* The Company is merged with Family Credit Limited (subsequently renamed as L&T Finance Limited)
Notes forming part of the Consolidated Financial Statements (contd.)
NOTE [54] (contd.)

435
v crore
Particulars
L&T Infrastructure Finance Company
Limited
L&T Finance Holdings Limited
As at
31-3-2017
As at
31-3-2016
As at
1-4-2015
As at
31-3-2017
As at
31-3-2016
As at
1-4-2015
Current assets (a) 9862.51 7186.43 4204.18 945.90 750.25 763.46
Current liabilities (b) 3640.53 4924.46 3824.72 1230.79 626.13 565.35
Net current assets (c)=(a) - (b) 6221.98 2261.97 379.46 (284.89) 124.12 198.11
Non-current assets (d) 15151.81 17252.66 16662.92 5469.31 5235.60 4863.64
Non-current liabilities (e) 18199.52 16508.97 14547.54 1028.15 1204.01 1352.16
Net non-current assets (f)=(d) - (e) (3047.71) 743.69 2115.38 4441.16 4031.59 3511.48
Net assets (g)=(c) + (f) 3174.27 3005.66 2494.84 4156.27 4155.71 3709.59
Accumulated non-controlling interest 470.24 514.88 296.49 1453.64 1430.90 999.34
v crore
Particulars
Larsen and Toubro Infotech Limited
As at
31-3-2017
As at
31-3-2016
As at
1-4-2015
Current assets (a) 3073.18 1814.45 1702.53
Current liabilities (b) 1206.89 960.59 901.97
Net current assets (c)=(a) - (b) 1866.29 853.86 800.56
Non-current assets (d) 1128.04 1122.70 1095.28
Non-current liabilities (e) 17.44 12.43 24.26
Net non-current assets (f)=(d) - (e) 1110.60 1110.27 1071.02
Net assets (g)=(c) + (f) 2976.89 1964.13 1871.58
Accumulated non-controlling interest 467.97 99.87 –
(iii) Summarised cash flows
v crore
Particulars
L&T Finance Limited (formerly
known as Family Credit
Limited)
L&T Finance Limited*
2016-17 2015-16 2016-17 2015-16
Cash flows from operating activities (2479.31) (1520.67) – 1275.59
Cash flows from investing activities (2508.89) 128.88 – (47.32)
Cash flows from financing activities 5085.55 1411.41 – (1204.17)
Net increase/(decrease) in cash and cash equivalents 97.35 19.62 – 24.10
* The Company is merged with Family Credit Limited (subsequently renamed as L&T Finance Limited)
Notes forming part of the Consolidated Financial Statements (contd.)
NOTE [54] (contd.)

436
v crore
Particulars
L&T Infrastructure
Finance Company
Limited
L&T Finance Holdings
Limited
Larsen and Toubro
Infotech Limited
2016-17 2015-16 2016-17 2015-16 2016-17 2015-16
Cash flows from operating activities (315.99) (2434.40) (126.13) 456.28 1249.72 765.24
Cash flows from investing activities (209.83) (375.11) (56.02) (400.16) (927.63) 34.24
Cash flows from financing activities 587.03 2605.91 144.09 (46.96) (246.16) (816.86)
Net increase/(decrease) in cash and cash
equivalents
61.21 (203.60) (38.06) 9.16 75.93 (17.38)
NOTE [55]
Disclosures pursuant to Indian Accounting Standard (Ind AS) 112 “Disclosure of Interest in other entities” :- Joint Ventures and
Associates
(a) Summarised Balance Sheet for material joint ventures:
v crore
Particulars
L&T-MHPS Boilers Private Limited Larsen and Toubro Electromech
LLC
L&T Special Steels and Heavy
Forgings Private Limited
L&T Infrastructure Development
Projects Limited (consolidated)
As at
31-3-2017
As at31-3-2016
As at1-4-2015
As at
31-3-2017
As at31-3-2016
As at1-4-2015
As at
31-3-2017
As at31-3-2016
As at1-4-2015
As at
31-3-2017
As at31-3-2016
As at1-4-2015
Current assets
Cash and cash equivalents 296.56 371.81 431.93 23.09 6.90 31.71 0.52 0.68 1.12 2931.86 137.29 179.62
Other assets 2991.04 2552.08 2098.72 147.16 137.29 180.39 166.53 162.94 175.92 2860.97 625.54 770.21
Total current assets 3287.60 2923.89 2530.65 170.25 144.19 212.10 167.05 163.62 177.04 5792.83 762.83 949.83
Total non-current assets 535.02 473.04 460.69 30.48 40.50 72.27 1384.95 1441.82 1493.38 17343.46 20553.94 17244.52
Current liabilities
Financial liabilities (excluding
trade payables) 420.41 419.88 250.79 135.02 119.06 116.25 1414.31 1090.96 754.40 3090.61 713.77 966.72
Other liabilities (including
trade payables) 2351.47 1969.79 1732.75 203.96 192.00 229.08 57.34 37.97 55.41 1206.16 951.31 1123.00
Total current liabilities 2771.88 2389.67 1983.54 338.98 311.06 345.33 1471.65 1128.93 809.81 4296.77 1665.08 2089.72
Non-current liabilities
Financial liabilities (excluding
trade payables) 120.86 258.85 429.55 – – – 703.80 843.02 941.16 16897.96 17552.15 13222.47
Other liabilities (including
trade payables) – 17.26 47.03 – – – 17.64 18.18 18.75 433.72 484.64 369.92
Total non-current liabilities 120.86 276.11 476.58 – – – 721.44 861.20 959.91 17331.68 18036.79 13592.39
Non-controlling interest – – – – – – – – – 151.94 (11.56) 15.00
Net assets 929.88 731.16 531.22 (138.25) (126.37) (60.96) (641.09) (384.69) (99.30) 1355.90 1626.46 2497.24
Notes forming part of the Consolidated Financial Statements (contd.)
NOTE [54] (contd.)

437
(b) Reconciliation of carrying amounts of material joint ventures:
v crore
Particulars
L&T-MHPS Boilers Private Limited Larsen and Toubro Electromech
LLC
L&T Special Steels and Heavy
Forgings Private Limited
L&T Infrastructure Development
Projects Limited (consolidated)
As at
31-3-2017
As at31-3-2016
As at1-4-2015
As at
31-3-2017
As at31-3-2016
As at1-4-2015
As at
31-3-2017
As at31-3-2016
As at1-4-2015
As at
31-3-2017
As at31-3-2016
As at1-4-2015
Opening net assets 731.16 531.22 * (126.37) (60.96) * (384.69) (99.30) * 1626.46 2497.24 *
Profit for the year 221.28 199.01 * (15.02) (61.01) * (254.65) (284.91) * (506.38) (867.23) *
Adjustment in opening
retained earnings due to
stake dilution – – * – – * – – * 223.03 – *
Other comprehensive income (22.51) 0.93 * 3.14 (4.40) * (1.75) (0.48) * (0.10) (1.06) *
Dividends paid – – * – – * – – * – – *
Equity component of other
financial instruments (0.05) – * – – * – – * – – *
Other Adjustments – – * – – * – – * 12.89 (2.49) *
Closing net assets 929.88 731.16 531.22 (138.25) (126.37) (60.96) (641.09) (384.69) (99.30) 1355.90 1626.46 2497.24
Group's share in % 51.00% 51.00% 51.00% 65.00% 65.00% 65.00% 74.00% 74.00% 74.00% 97.45% 97.45% 97.45%
Group's share 474.24 372.89 270.92 (89.86) (82.14) (39.63) (474.41) (284.67) (73.48) 1321.32 1584.99 2433.56
Investment in subsidiary out
of above – – – – – – – – – – (2010.36) (1961.58)
Goodwill – – – – – – – – – 393.87 600.41 600.41
Parent investment in Group – – – – – – – – – 33.30 33.30 54.85
Other adjusments – – (0.27) 89.86 82.14 39.63 474.41 284.67 73.48 16.24 170.24 141.81
Carrying amount 474.24 372.89 270.65 – – – – – – 1764.73 378.58 1269.05
* indicates disclosures not applicable.
(c) Summarised Statement of Profit and Loss of material Joint Ventures:
v crore
Particulars
L&T-MHPS Boilers Private Limited Larsen and Toubro Electromech
LLC
L&T Special Steels and Heavy
Forgings Private Limited
L&T Infrastructure Development
Projects Limited (consolidated)
2016-17 2015-16 2016-17 2015-16 2016-17 2015-16 2016-17 2015-16
Revenue 2490.66 1721.39 221.61 353.39 129.96 102.43 2687.03 3244.48
Interest Income 27.57 41.42 – – 0.12 0.12 0.55 5.62
Depreciation and amortisation (55.82) (53.22) (14.62) (23.28) (51.10) (51.39) (356.59) (478.43)
Interest expense (28.71) (46.24) (3.28) (3.70) (171.58) (153.28) (1389.94) (1527.59)
Income tax (110.85) (74.62) (1.76) 0.85 – – 55.44 (5.30)
Profit from continuing operations 221.28 199.01 (15.02) (61.01) (254.65) (284.91) (506.38) (867.23)
Profit for the year 221.28 199.01 (15.02) (61.01) (254.65) (284.91) (506.38) (867.23)
Other comprehensive income (22.51) 0.93 3.14 (4.40) (1.75) (0.48) (0.10) (1.06)
Total comprehensive income 198.77 199.94 (11.88) (65.41) (256.40) (285.39) (506.48) (868.29)
Notes forming part of the Consolidated Financial Statements (contd.)
NOTE [55] (contd.)

438
(d) Financial Information in respect of individually immaterial joint ventures/associates:
v crore
ParticularsAs at
31-3-2017
As at
31-3-2016
As at
1-4-2015
Aggregate carrying amount of investments in individually immaterial joint venture/
associates
533.93 506.41 526.95
Aggregate amounts of the Group’s share of:
Profit/(loss) for the year 35.58 (22.52) *
Other comprehensive income for the year 1.74 21.11 *
Total comprehensive income for the year 37.32 (1.41) *
* indicates disclosures not applicable.
(e) Carrying amount of investments in joint ventures/associates:
v crore
ParticularsAs at
31-3-2017
As at
31-3-2016
As at
1-4-2015
Non-material associates 104.00 93.81 128.95
Non-material joint ventures 429.93 412.60 398.00
Sub-total 533.93 506.41 526.95
Material joint ventures 2238.97 751.47 1539.70
Total 2772.90 1257.88 2066.65
(f) Share in profits/(loss) of joint ventures/associates (net):
v crore
Particulars 2016-17 2015-16
Non-material associates 11.34 (2.28)
Non-material joint ventures 25.98 0.87
Sub-total 37.32 (1.41)
Material joint ventures (432.59) (988.75)
Total (395.27) (990.16)
(g) Commitments and contingent liabilities in respect of joint ventures/associates:
v crore
ParticularsAs at
31-3-2017
As at
31-3-2016
As at
1-4-2015
Commitments-joint ventures:
Commitments to provide funding for joint venture’s capital commitments, if
called 3472.09 4040.73 13121.59
Contingent liabilities-associates:
Share of contingent liabilities incurred jointly with other investors of the
associates 0.07 0.02 –
Contingent liabilities-joint ventures:
Share of joint ventures’ contingent liabilities in respect of a legal claim lodged
against the entity 169.57 162.39 44.68
Notes forming part of the Consolidated Financial Statements (contd.)
NOTE [55] (contd.)
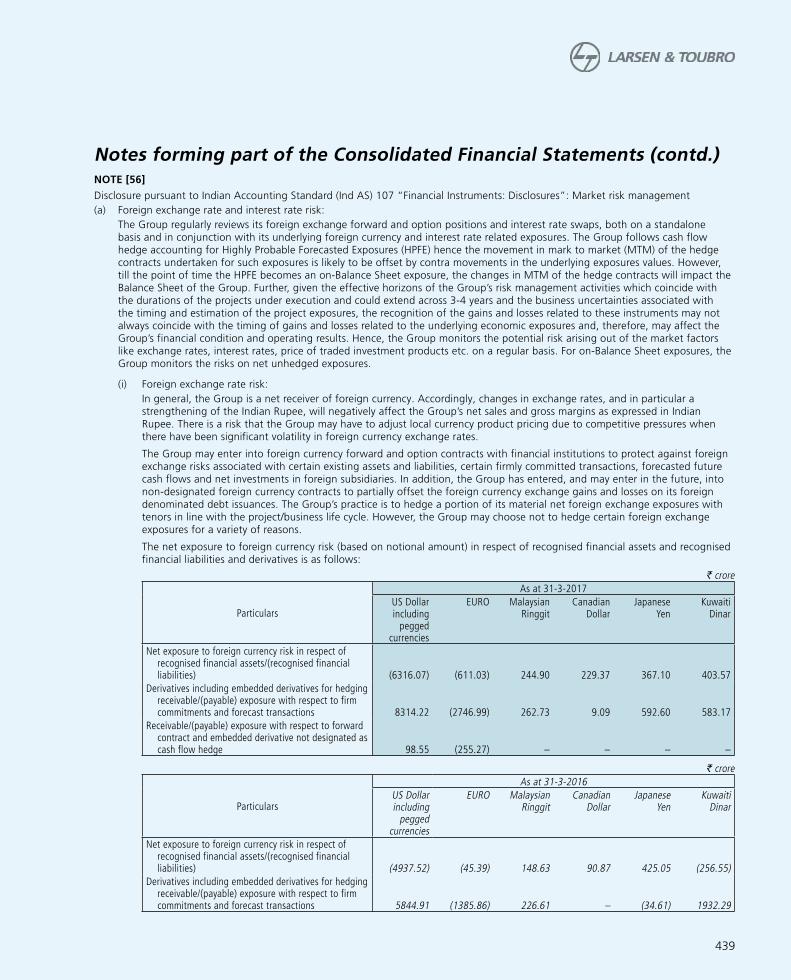
439
NOTE [56]
Disclosure pursuant to Indian Accounting Standard (Ind AS) 107 “Financial Instruments: Disclosures”: Market risk management
(a) Foreign exchange rate and interest rate risk:
The Group regularly reviews its foreign exchange forward and option positions and interest rate swaps, both on a standalone basis and in conjunction with its underlying foreign currency and interest rate related exposures. The Group follows cash flow hedge accounting for Highly Probable Forecasted Exposures (HPFE) hence the movement in mark to market (MTM) of the hedge contracts undertaken for such exposures is likely to be offset by contra movements in the underlying exposures values. However, till the point of time the HPFE becomes an on-Balance Sheet exposure, the changes in MTM of the hedge contracts will impact the Balance Sheet of the Group. Further, given the effective horizons of the Group’s risk management activities which coincide with the durations of the projects under execution and could extend across 3-4 years and the business uncertainties associated with the timing and estimation of the project exposures, the recognition of the gains and losses related to these instruments may not always coincide with the timing of gains and losses related to the underlying economic exposures and, therefore, may affect the Group’s financial condition and operating results. Hence, the Group monitors the potential risk arising out of the market factors like exchange rates, interest rates, price of traded investment products etc. on a regular basis. For on-Balance Sheet exposures, the Group monitors the risks on net unhedged exposures.
(i) Foreign exchange rate risk:
In general, the Group is a net receiver of foreign currency. Accordingly, changes in exchange rates, and in particular a strengthening of the Indian Rupee, will negatively affect the Group’s net sales and gross margins as expressed in Indian Rupee. There is a risk that the Group may have to adjust local currency product pricing due to competitive pressures when there have been significant volatility in foreign currency exchange rates.
The Group may enter into foreign currency forward and option contracts with financial institutions to protect against foreign exchange risks associated with certain existing assets and liabilities, certain firmly committed transactions, forecasted future cash flows and net investments in foreign subsidiaries. In addition, the Group has entered, and may enter in the future, into non-designated foreign currency contracts to partially offset the foreign currency exchange gains and losses on its foreign denominated debt issuances. The Group’s practice is to hedge a portion of its material net foreign exchange exposures with tenors in line with the project/business life cycle. However, the Group may choose not to hedge certain foreign exchange exposures for a variety of reasons.
The net exposure to foreign currency risk (based on notional amount) in respect of recognised financial assets and recognised financial liabilities and derivatives is as follows:
v crore
Particulars
As at 31-3-2017
US Dollar
including
pegged
currencies
EURO Malaysian
Ringgit
Canadian
Dollar
Japanese
Yen
Kuwaiti
Dinar
Net exposure to foreign currency risk in respect of
recognised financial assets/(recognised financial
liabilities) (6316.07) (611.03) 244.90 229.37 367.10 403.57
Derivatives including embedded derivatives for hedging
receivable/(payable) exposure with respect to firm
commitments and forecast transactions 8314.22 (2746.99) 262.73 9.09 592.60 583.17
Receivable/(payable) exposure with respect to forward
contract and embedded derivative not designated as
cash flow hedge 98.55 (255.27) – – – –
v crore
Particulars
As at 31-3-2016
US Dollar
including
pegged
currencies
EURO Malaysian
Ringgit
Canadian
Dollar
Japanese
Yen
Kuwaiti
Dinar
Net exposure to foreign currency risk in respect of
recognised financial assets/(recognised financial
liabilities) (4937.52) (45.39) 148.63 90.87 425.05 (256.55)
Derivatives including embedded derivatives for hedging
receivable/(payable) exposure with respect to firm
commitments and forecast transactions 5844.91 (1385.86) 226.61 – (34.61) 1932.29
Notes forming part of the Consolidated Financial Statements (contd.)

440
v crore
Particulars
As at 31-3-2016
US Dollar
including
pegged
currencies
EURO Malaysian
Ringgit
Canadian
Dollar
Japanese
Yen
Kuwaiti
Dinar
Receivable/(payable) exposure with respect to forward
contract and embedded derivative not designated as
cash flow hedge (87.60) (145.92) – – – –
v crore
Particulars
As at 1-4-2015
US Dollar
including
pegged
currencies
EURO Malaysian
Ringgit
Canadian
Dollar
Japanese
Yen
Kuwaiti
Dinar
Net exposure to foreign currency risk in respect of
recognised financial assets/(recognised financial
liabilities) (2030.94) (46.19) (81.87) 83.24 533.08 (1.64)
Derivatives including embedded derivatives for hedging
receivable/(payable) exposure with respect to firm
commitments and forecast transactions 5208.01 (1498.86) – – 93.91 1111.30
Receivable/(payable) exposure with respect to forward
contract and embedded derivative not designated as
cash flow hedge 73.13 (368.96) – – – –
To provide a meaningful assessment of the foreign currency risk associated with the Group’s foreign currency derivative
positions against off-balance sheet exposures and unhedged portion of on-Balance Sheet financial assets and liabilities,
the Group uses a multi-currency correlated value-at-risk (“VAR”) model. The VAR model uses a Monte Carlo simulation
to generate thousands of random market price paths for foreign currencies against Indian Rupee taking into account the
correlations between them. The VAR is the expected loss in value of the exposures due to overnight movement in spot
exchange rates, at 95% confidence interval. The VAR model is not intended to represent actual losses but is used as a risk
estimation tool. The model assumes normal market conditions and is a historical best fit model. Because the Group uses
foreign currency instruments for hedging purposes, the loss in fair value incurred on those instruments are generally offset
by increase in the fair value of the underlying exposures for on-Balance Sheet exposures. The overnight VAR for the Group at
95% confidence level is v 122.21 crore as at March 31, 2017 and v 74.33 crore as at March 31, 2016.
Actual future gains and losses associated with the Group’s investment portfolio and derivative positions may differ materially
from the sensitivity analysis performed as at March 31, 2017 due to the inherent limitations associated with predicting the
timing and amount of changes in foreign currency exchange rates and the Group’s actual exposures and position.
(ii) Interest rate risk:
The Group’s exposure to changes in interest rates relates primarily to the Group’s outstanding floating rate debt and lending.
The Group’s outstanding debt in local currency is a combination of fixed rate and floating rate. For the portion of local
currency debt on fixed rate basis, there is no interest rate risk. For the portion of local currency debt on floating rate basis,
there is a natural hedge with receivables in respect of financial services business. There is a portion of debt that is linked
to international interest rate benchmarks like LIBOR. The Group also hedges a portion of these risks by way of derivatives
instruments like interest rate swaps and currency swaps.
The exposure of the Group’s borrowing to interest rate changes at the end of the reporting period are as follows:
v crore
ParticularsAs at
31-3-2017
As at
31-3-2016
As at
1-4-2015
Floating rate borrowings 37911.59 39177.71 31391.95
Notes forming part of the Consolidated Financial Statements (contd.)
NOTE [56] (contd.)

441
A hypothetical 25 basis point shift in respective currency LIBOR on the unhedged loans would result in a corresponding
increase/decrease in interest cost for the Group on a yearly basis.
v crore
Particulars
Impact on profit and loss after
tax
Impact on equity
2016-17 2015-16 At at
31-3-2017
At at
31-3-2016
Indian Rupee
Interest rates -increase by 0.25% in INR interest rate* 51.57 43.52 51.57 43.52
Interest rates -decrease by 0.25% in INR interest rate* (51.57) (43.52) (51.57) (43.52)
US Dollar
Interest rates -increase by 0.25% in USD interest rate* (12.47) (15.42) (12.47) (15.42)
Interest rates -decrease by 0.25% in USD interest rate* 12.47 15.42 12.47 15.42
* Holding all other variables constant
(b) Liquidity risk management:
The Group manages liquidity risk by maintaining sufficient cash and marketable securities and by having access to funding through
an adequate amount of committed credit lines. Given the need to fund diverse businesses, the Group maintains flexibility in
funding by maintaining availability under committed credit lines to meet obligations when due. Management regularly monitors
the position of cash and cash equivalents vis-à-vis projections. Assessment of maturity profiles of financial assets and financial
liabilities including debt financing plans and maintenance of Balance Sheet liquidity ratios are considered while reviewing the
liquidity position.
The Group’s investment policy and strategy are focused on preservation of capital and supporting the Group’s liquidity
requirements. The Group uses a combination of internal and external management to execute its investment strategy and achieve
its investment objectives. The Group typically invests in money market funds, large debt funds, Government of India securities,
equity and equity marketable securities and other highly rated securities under a limits framework which governs the credit
exposure to any one issuer as defined in its investment policy. The policy requires investments generally to be investment grade,
with the primary objective of minimising the potential risk of principal loss. To provide a meaningful assessment of the price risk
associated with the Group’s investment portfolio, the Group performed a sensitivity analysis to determine the impact of change in
prices of the securities that would have on the value of the investment portfolio assuming a 0.25% movement in debt funds and
debt securities and a 5% movement in the NAV of the equity and equity marketable securities. Based on the investment position
a hypothetical 0.25% change in the fair market value of debt securities would result in a value change of +/- v 7.33 crore as at
March 31, 2017 and +/- v 15.52 crore as at March 31, 2016. A 5% change in the equity funds NAV would result in a value change
of +/- v 18.71 crore as at March 31, 2017 and +/- v 5.48 crore as at March 31, 2016 respectively. The investments in money
market funds are for the purpose of liquidity management only and are held only overnight and hence not subject to any material
price risk.
(c) Credit risk management:
(i) Financial services business
Financial services business has a risk management framework that monitors and ensures that the business lines operate within
the defined risk appetite and risk tolerance levels as defined by the senior management. Risk Management function is closely
involved in management and control of credit risk, portfolio monitoring, market risks including liquidity risk and operational
risks. The credit risk function independently evaluates proposals based on well-established sector specific internal frameworks,
in order to identify, mitigate and allocate risks as well as to enable risk-based pricing of assets. Regulatory and process risks
are identified, mitigated and managed by a separate group. Risk management policies are made under the guidance of Risk
Management Committee and are approved by Board of Directors.
(ii) Other than financial services business
The Group’s customer profile include public sector enterprises, state owned companies and large private corporates.
Accordingly, the Group’s customer credit risk is low. The Group’s average project execution cycle is around 24 to 36 months.
General payment terms include mobilisation advance, monthly progress payments with a credit period ranging from 45 to 90
days and certain retention money to be released at the end of the project. In some cases retentions are substituted with bank/
corporate guarantees. The Group has a detailed review mechanism of overdue customer receivables at various levels within
organisation to ensure proper attention and focus for realisation.
Notes forming part of the Consolidated Financial Statements (contd.)
NOTE [56] (contd.)

442
(iii) Reconciliation of loss allowance provision for financial services business - Loans:
v crore
Particulars
Loss allowance
measured at
12-month ECL
Loss allowance measured at lifetime ECL
Financial assets for which
credit risk has increased
significantly and credit not
impaired
Financial assets for which
credit risk has increased
significantly and credit
impaired
Loss allowance as on 1-4-2015 259.40 450.58 472.19
Provision on new financial assets 176.20 24.56 12.67
Transferred to and from 12-month ECL to
lifetime ECL 37.00 (55.94) 18.94
Higher/(lower) provision on existing
financial assets (212.60) 37.18 147.38
Loss allowance as on 31-3-2016 260.00 456.38 651.18
Provision on new financial assets 151.89 5.14 27.08
Transferred to and from 12-month ECL to
lifetime ECL 76.18 (112.09) 35.91
Higher/(lower) provision on existing
financial assets (145.03) 161.78 920.45
Loss allowance as on 31-3-2017 343.04 511.21 1634.62
(iv) Amounts written off:
v crore
Particulars 2016-17 2015-16
Amount of financial assets written off during the period but still enforceable 44.50 104.33
(v) Reconciliation of allowance for doubtful debts on trade receivables (other than financial services business):
v crore
Particulars 2016-17 2015-16
Opening balance 1961.09 1311.52
Changes in loss allowance (Provision for doubtful debts):
Loss allowance based on ECL 335.38 353.25
Additional provision 306.43 327.38
Write off as bad debts (137.61) (31.06)
Closing balance [reported under Note 13] 2465.29 1961.09
Notes forming part of the Consolidated Financial Statements (contd.)
NOTE [56] (contd.)

443
NOTE [57]
Other disclosure pursuant to Indian Accounting Standard (Ind AS) 107 “Financial Instruments: Disclosures”:
(a) Category-wise classification for applicable financial assets:
v crore
Sr.
no.Particulars
As at
31-3-2017
As at
31-3-2016
As at
1-4-2015
I. Measured at fair value through Profit or Loss (FVTPL):
(i) Investment in equity instruments 799.20 525.83 399.94
(ii) Investment in preference shares 70.88 157.62 222.72
(iii) Investment in mutual funds and units of fund 10356.77 4894.42 4374.75
(iv) Investment in debentures and bonds 1133.34 1098.62 759.81
(v) Derivative instruments not designated as cash flow hedges 62.33 43.02 44.88
(vi) Embedded derivatives not designated as cash flow hedges 204.76 140.71 63.56
(vii) Investment in security receipts 505.27 196.37 218.15
(viii) Others – 18.49 23.19
Sub-total (I) 13132.55 7075.08 6107.00
II. Measured at amortised cost:
(i) Loans 53304.05 53075.39 45282.61
(ii) Investment in debentures and bonds 431.14 466.25 426.43
(iii) Trade receivables 27969.60 26024.98 22254.43
(iv) Advances recoverable in cash 643.09 740.40 833.08
(v) Cash and bank balances 5797.73 5493.42 5187.89
(vi) Other receivables 967.78 1029.53 682.13
Sub-total (II) 89113.39 86829.97 74666.57
III. Measured at fair value through Other Comprehensive Income (FVTOCI):
(i) Investment in government securities, debentures and bonds 3683.53 2463.60 2817.21
(ii) Loans 11203.09 5372.28 2155.17
(iii) Derivative instruments designated as cash flow hedges 1283.09 737.20 874.96
(iv) Embedded Derivative instruments designated as cash flow hedges 3.21 8.51 4.27
Sub-total (III) 16172.92 8581.59 5851.61
Total (I+II+III) 118418.86 102486.64 86625.18
(b) Category-wise classification for applicable financial liabilities:
v crore
Sr.
no.Particulars
As at
31-3-2017
As at
31-3-2016
As at
1-4-2015
I. Measured at fair value through Profit or Loss (FVTPL):
(i) Derivative instruments not designated as cash flow hedges 22.73 27.00 48.47
(ii) Embedded derivatives not designated as cash flow hedges 133.20 150.01 44.19
Sub-total (I) 155.93 177.01 92.66
II. Measured at amortised cost:
(i) Borrowings 93975.42 88135.15 76690.01
(ii) Trade payables 29774.25 27003.56 22056.89
(iii) Others 4655.79 4000.87 3252.29
Sub-total (II) 128405.46 119139.58 101999.19
III. Derivative instruments (including embedded derivatives) through Other
Comprehensive Income:
(i) Derivative instruments designated as cash flow hedges 479.71 245.98 566.39
(ii) Embedded derivatives designated as cash flow hedges 83.98 35.90 78.64
Sub-total (III) 563.69 281.88 645.03
IV. Financial guarantee contracts 2.20 2.50 2.29
Total (I+II+III+IV) 129127.28 119600.97 102739.17
Notes forming part of the Consolidated Financial Statements (contd.)

444
(c) Items of income, expenses, gains or losses related to financial instruments:
v crore
Sr.
No.Particulars
2016-17 2015-16
I. Net gains/(losses) on financial assets and financial liabilities measured at fair value through
Profit or Loss and amortised cost:
A. Mandatorily measured at fair value through Profit or Loss:
(i) Gains/(losses) on fair valuation or sale of investment (81.96) (71.83)
(ii) Gains/(losses) on fair valuation or settlement of forward contracts not designated as cash
flow hedges 77.33 (1.78)
(iii) Gains/(losses) on fair valuation or settlement of embedded derivative contracts not
designated as cash flow hedges (36.27) (3.20)
Sub-total (A) (40.90) (76.81)
B. Financial assets measured at amortised cost:
(i) Exchange difference gains/(losses) on revaluation or settlement of items denominated in
foreign currency (trade receivables, loans given etc.) (291.96) 336.66
(ii) (Allowance)/reversal for ECL during the year (1509.17) (472.97)
(iii) Provision for doubtful debts (other than ECL)[net] (287.61) (320.89)
(iv) Bad debts written off [net] (376.31) (259.01)
Sub-total (B) (2465.05) (716.21)
C. Financial liabilities measured at amortised cost:
(i) Exchange difference gains/(losses) on revaluation or settlement of items denominated in
foreign currency (trade payables, borrowing availed etc.) 276.69 (906.59)
(ii) Unclaimed credit balances written back 132.89 60.67
Sub-total (C) 409.58 (845.92)
Total [I] = (A+B+C) (2096.37) (1638.94)
II. Net gains/(losses) on financial assets and financial liabilities measured at fair value through
Other Comprehensive Income:
A. Financial assets measured at fair value through Other Comprehensive Income:
(i) Gains recognised in Other Comprehensive Income:
1. Gains/(losses) on fair valuation or sale of government securities, bonds, debentures etc. 107.67 (29.81)
2. Gains/(losses) on fair valuation or settlement of forward contracts designated as cash
flow hedges 348.54 94.54
3. Gains/(losses) on fair valuation or settlement of embedded derivative contracts
designated as cash flow hedges (90.05) 14.40
Sub-total (i) 366.16 79.13
Less:
(ii) Gains reclassified to Profit or Loss from Other Comprehensive Income:
1. On government securities, bonds, debentures etc. upon sale 112.99 (27.28)
2. On forward contracts upon hedged future cash flows affecting the Profit or Loss or
related assets or liabilities (39.86) 554.54
3. On embedded derivative contracts upon hedged future cash flows affecting the Profit
or Loss or related assets or liabilities (37.64) (38.88)
Sub-total (ii) 35.49 488.73
Net gains recognised in Other Comprehensive Income [II]=[(i)-(ii)] 330.67 (409.60)
B. Allowance/(reversal) for ECL recognised during the year in the Statement of Profit and Loss (50.45) (18.04)
Total [II] = (A+B) 280.22 (427.64)
Notes forming part of the Consolidated Financial Statements (contd.)
NOTE [57] (contd.)

445
v crore
Sr.
No.Particulars
2016-17 2015-16
III. Interest and Other income/expense:
A. Dividend Income:
(i) Dividend income from investments measured at FVTPL 748.63 196.12
B. Interest Income:
(i) Financial assets measured at amortised cost 7126.62 6908.92
(ii) Financial assets measured at fair value through Other Comprehensive Income 834.75 403.04
(iii) Financial assets measured at fair value through Profit or Loss 118.15 1.59
Sub-total (B) 8079.52 7313.55
C. Interest expense:
(i) Financial liabilities measured at fair value through Other Comprehensive Income (401.21) (528.20)
(ii) Financial liabilities measured at amortised cost (6209.77) (5997.66)
(iii) Financial liabilities measured at fair value through Profit or Loss 5.69 (27.85)
Sub-total (C) (6605.29) (6553.71)
D. Fee income:
Financial assets that are not at fair value through profit or loss 227.87 86.02
Total [III] =(A+B+C+D) 2450.73 1041.98
(d) Fair value of financial assets and financial liabilities measured at amortised cost:
v crore
Particulars Note
As at 31-3-2017 As at 31-3-2016 As at 1-4-2015
Carrying
amount
Fair value Carrying
amount
Fair value Carrying
amount
Fair value
Financial assets (financial services
business):
Loans 7,8,16,17 35005.10 35121.54 37640.72 38324.20 31908.34 31894.22
Debentures and bonds 6,12 431.14 426.44 466.25 471.72 426.43 432.46
Total 35436.24 35547.98 38106.97 38795.92 32334.77 32326.68
Financial liabilities:
Borrowings 22,26,27 37013.30 37952.80 33466.61 34268.95 28304.58 29036.22
Total 37013.30 37952.80 33466.61 34268.95 28304.58 29036.22
Note: The carrying amounts of trade and other receivables, cash and cash equivalents, trade and other payables are considered to
be the same as their fair values due to their short term nature. The carrying amounts of loans given and borrowings taken for short
term or at floating rate of interest are considered to be close to the fair value.
Notes forming part of the Consolidated Financial Statements (contd.)
NOTE [57] (contd.)

446
(e) Disclosure pursuant to Ind AS 113 “Fair Value Measurement” - Fair value hierarchy of financial assets and financial liabilities
measured at amortised cost:
v crore
As at 31-3-2017 Level 1 Level 2 Level 3 Total Valuation technique for
level 3 items
Financial assets (financial services business):
Loans – 19768.98 15352.56 35121.54 Discounted cash flow
Debentures and bonds – 86.26 340.18 426.44 Discounted cash flow
Total – 19855.24 15692.74 35547.98
Financial liabilities:
Borrowings 817.04 13927.43 23208.33 37952.80 Discounted cash flow
Total 817.04 13927.43 23208.33 37952.80
v crore
As at 31-3-2016Level 1 Level 2 Level 3 Total Valuation technique for
level 3 items
Financial assets (financial services business):
Loans – 21026.90 17297.30 38324.20 Discounted cash flow
Debentures and bonds – 330.36 141.36 471.72 Discounted cash flow
Total – 21357.26 17438.66 38795.92
Financial liabilities:
Borrowings 774.09 15029.71 18465.15 34268.95 Discounted cash flow
Total 774.09 15029.71 18465.15 34268.95
v crore
As at 1-4-2015Level 1 Level 2 Level 3 Total Valuation technique for
level 3 items
Financial assets (financial services business):
Loans – 16445.61 15448.61 31894.22 Discounted cash flow
Debentures and bonds – 330.93 101.53 432.46 Discounted cash flow
Total – 16776.54 15550.14 32326.68
Financial liabilities:
Borrowings – 13325.27 15710.95 29036.22 Discounted cash flow
Total – 13325.27 15710.95 29036.22
Valuation technique Level 2: Future cash flows discounted using G-sec/LIBOR rates plus corporate spread.
Notes forming part of the Consolidated Financial Statements (contd.)
NOTE [57] (contd.)

447
(f) Fair value hierarchy of financial assets and financial liabilities at fair value:
v crore
ParticularsNote As at 31-3-2017 As at 31-3-2016 As at 1-4-2015
Level 1 Level 2 Level 3 Total Level 1 Level 2 Level 3 Total Level 1 Level 2 Level 3 Total
Financial assets:
Investments at FVTPL:
(i) Equity shares 6, 12 48.00 – 751.20 799.20 27.20 – 498.63 525.83 148.07 – 251.87 399.94
(ii) Preference shares 6, 12 – – 70.88 70.88 – – 157.62 157.62 – – 222.72 222.72
(iii) Mutual fund 6, 12 10244.91 – – 10244.91 4861.49 – – 4861.49 4348.86 – – 4348.86
(iv) Debt instruments viz.
government securities, bonds
and debentures
6, 7,
12 202.33 35.66 895.35 1133.34 300.14 – 798.48 1098.62 164.20 – 595.61 759.81
(v) Derivative instruments not
designated as cash flow
hedges 9,18 – 62.33 – 62.33 – 43.02 – 43.02 – 44.88 – 44.88
(vi) Embedded derivative
instruments not designated as
cash flow hedges 9,18 – 204.76 – 204.76 – 140.71 – 140.71 – 63.56 – 63.56
(vii) Other investments – – 617.13 617.13 – 18.49 229.30 247.79 – 23.19 244.04 267.23
Investments at FVTOCI
(i) Debt instruments viz.
government securities, bonds
and debentures
6, 7,
12 1772.82 614.25 1296.46 3683.53 1847.26 556.65 59.69 2463.60 2336.19 451.54 29.48 2817.21
(ii) Loans (financial services
business)
8,17 – – 11203.09 11203.09 – – 5372.28 5372.28 – – 2155.17 2155.17
(iii) Derivative financial
instruments designated as
cash flow hedges 9,18 – 1283.09 – 1283.09 – 737.20 – 737.20 – 874.96 – 874.96
(iv) Embedded derivative financial
instruments designated as
cash flow hedges 9,18 – 3.21 – 3.21 – 8.51 – 8.51 – 4.27 – 4.27
Total 12268.06 2203.30 14834.11 29305.47 7036.09 1504.58 7116.00 15656.67 6997.32 1462.40 3498.89 11958.61
Notes forming part of the Consolidated Financial Statements (contd.)
NOTE [57] (contd.)

448
v crore
ParticularsNote As at 31-3-2017 As at 31-3-2016 As at 1-4-2015
Level 1 Level 2 Level 3 Total Level 1 Level 2 Level 3 Total Level 1 Level 2 Level 3 Total
Financial Liabilities:
Financial liabilities at FVTPL:
(i) Designated as at FVTPL:
(a) Derivative instruments
not designated as cash
flow hedges 23,29 – 22.73 – 22.73 – 27.00 – 27.00 – 48.47 – 48.47
(b) Embedded derivative
instruments not
designated as cash flow
hedges 23,29 – 133.20 – 133.20 – 150.01 – 150.01 – 44.19 – 44.19
(ii) Designated as at FVTOCI:
(a) Derivative financial
instruments designated
as cash flow hedges 23,29 – 479.71 – 479.71 – 245.98 – 245.98 – 566.39 – 566.39
(b) Embedded derivative
financial instruments
designated as cash flow
hedges 23,29 – 83.98 – 83.98 – 35.90 – 35.90 – 78.64 – 78.64
Total – 719.62 – 719.62 – 458.89 – 458.89 – 737.69 – 737.69
Valuation technique and key inputs used to determine fair value:
A. Level 1: Mutual funds, bonds, debentures and government securities - Quoted price in the active market
B. Level 2: (a) Derivative instruments – Present value technique using forward exchange rates at the end of reporting period.
(b) Preference shares – Future cash flows are discounted using G-sec rates as at reporting date.
(g) Movement of items measured using unobservable inputs (Level 3):
v crore
Particulars Equity shares Preference
shares
Debt
instruments
Loans Other
investments
Total
Balance as at 1-4-2015 251.87 222.72 625.09 2155.17 244.04 3498.89
Addition during the year 237.06 – 139.84 5372.28 7.10 5756.28
Disposal during the year – (56.03) (3.02) (2155.17) (8.52) (2222.74)
Gains/(losses) recognised in Profit or Loss 9.70 (9.07) 96.26 – (13.32) 83.57
Balance as at 31-3-2016 498.63 157.62 858.17 5372.28 229.30 7116.00
Addition during the year 253.52 6.02 1243.42 11203.09 411.19 13117.24
Disposal during the year – (62.50) (14.84) (5372.28) (7.74) (5457.36)
Gains/(losses) recognised in Profit or Loss (0.95) (30.26) 105.06 – (15.62) 58.23
Balance as at 31-3-2017 751.20 70.88 2191.81 11203.09 617.13 14834.11
Notes forming part of the Consolidated Financial Statements (contd.)
NOTE [57] (contd.)

449
(h) Sensitivity disclosure for level 3 fair value measurements
Particulars
Fair value as at
Significant unobservable
inputsSensitivity
As at
31-3-2017
As at
31-3-2016
As at
1-4-2015
v crore
Equity shares 695.26 442.69 195.93 Risk spread 2017: Increase/decrease of 5% in the fair value would result in impact
on profit or loss by v 19.45 crore
2016: Increase/decrease in the fair value by 5% would result in impact
on profit or loss by v 11.46 crore
55.94 55.94 55.94 1. Lease realisation: Net
realisation per month
v 30 per sq/ft.
2. Capitalisation rate 12%
1% change in net realisation would result in +/- v 0.38 crore
25 bps change in capitalisation rate would result in +/- v 0.78 crore
Preference
shares
70.88 157.62 222.72 Expected yield 2017: Increase/decrease in the fair value by 5% would result in impact
on profit or loss by v 3.27 crore
2016: Increase/decrease in the fair value by 5% would result in impact
on profit or loss by v 6.10 crore
Debt
instruments
2191.81 858.17 625.09 Expected yield 2017: Increase/decrease in the fair value by 0.25% would result in
impact on profit or loss or other comprehensive income by v 3.16 crore
2016: Increase/decrease in the fair value by 0.25% would result in
impact on profit or loss or other comprehensive income by v 1.02 crore
Loans 11203.09 5372.28 2155.17 Expected yield 2017: Increase/decrease in the fair value by 0.25% would result in
impact on profit or loss or other comprehensive income by v 18.31 crore
2016: Increase/decrease in the fair value by 0.25% would result in
impact on profit or loss or other comprehensive income by v 8.78 crore
Other
investments
617.13 229.30 244.04 Expected yield 2017: Increase/decrease in the fair value by 5% would result in impact
on profit or loss by v 20.18 crore
2016: Increase/decrease in the fair value by 5% would result in impact
on profit or loss by v 7.50 crore
(i) Maturity profile of financial liabilities based on undiscounted cash flows:
v crore
Particulars
Note As at 31-3-2017 As at 31-3-2016 As at 1-4-2015
Within
twelve
months
After
twelve
months
Total
Within
twelve
months
After
twelve
months
Total
Within
twelve
months
After
twelve
months
Total
A. Non-derivative liabilities:
Borrowings 22,26,27 27468.89 79646.18 107115.07 29685.56 71843.94 101529.50 25812.61 61251.44 87064.05
Trade payables 28 28320.55 1453.70 29774.25 25976.39 1027.17 27003.56 20783.40 1273.49 22056.89
Other financial liabilities 23,29 4443.36 164.83 4608.19 3780.71 141.22 3921.93 3082.89 100.85 3183.74
Total 60232.80 81264.71 141497.51 59442.66 73012.33 132454.99 49678.90 62625.78 112304.68
B. Derivative liabilities:
Forward contracts 23,29 465.43 47.72 513.15 235.06 45.57 280.63 517.95 105.68 623.63
Embedded derivatives 23,29 193.81 36.44 230.25 202.27 4.85 207.12 70.43 57.82 128.25
Total 659.24 84.16 743.40 437.33 50.42 487.75 588.38 163.50 751.88
Notes forming part of the Consolidated Financial Statements (contd.)
NOTE [57] (contd.)

450
(j) Details of outstanding hedge instruments for which hedge accounting is followed:
(i) Outstanding currency exchange rate hedge instruments:
(A) Forward covers taken to hedge exchange rate risk and accounted as cash flow hedge:
Particulars
As at 31-3-2017 As at 31-3-2016 As at 1-4-2015
Nominal
amount
(v crore)
Average
rate
(v)
Within
twelve
months
(v crore)
After
twelve
months
(v crore)
Nominal
amount
(v crore)
Average
rate
(v)
Within
twelve
months
(v crore)
After
twelve
months
(v crore)
Nominal
amount
(v crore)
Average
rate
(v)
Within
twelve
months
(v crore)
After
twelve
months
(v crore)
(a) Receivable hedges
US Dollar 14220.82 70.13 8870.40 5350.42 7682.19 69.43 5703.82 1978.37 55943.00 65.03 53288.42 2654.58
EURO 1228.18 83.72 793.73 434.45 1194.71 85.75 652.24 542.47 1569.81 84.31 727.36 842.45
Malaysian Ringgit 331.20 14.86 331.20 – 258.49 18.57 45.24 213.25 – – – –
Saudi Riyal – – – – 63.65 18.34 63.65 – 42.94 17.14 42.94 –
Omani Riyal 324.75 172.04 309.74 15.01 44.67 176.63 44.67 – 65.82 137.55 65.82 –
Arab Emirates Dirham 1229.22 17.59 1029.47 199.75 1097.11 18.83 955.63 141.48 1149.04 17.78 1010.21 138.83
Canadian Dollar 34.97 52.43 34.97 – 20.03 57.22 20.03 – 42.80 53.49 42.80 –
British Pound 70.50 90.97 70.50 – 41.77 109.93 41.77 – 61.05 103.65 61.05 –
Japanese Yen 845.50 0.66 467.82 377.68 262.44 0.64 159.10 103.34 207.39 0.70 0.16 207.23
Kuwaiti Dinar 1424.98 224.64 1401.83 23.15 2036.88 231.00 1358.86 678.02 1814.41 215.75 1013.61 800.80
Qatari Riyal 1184.17 15.58 1061.92 122.25 1681.41 19.07 1317.65 363.76 1477.36 17.78 1314.38 162.98
Bahraini Dinar – – – – 18.98 158.12 18.98 – – – – –
Australian Dollar 40.62 50.78 40.62 – – – – – 15.39 51.29 15.39 –
South African Rand 139.95 5.13 79.93 60.02 51.23 5.34 51.23 – 21.83 5.46 21.83 –
Danish Krone – – – – 26.64 10.66 26.64 – – – – –
Norwegian Krone – – – – 27.75 9.25 27.75 – 49.69 9.74 49.69 –
Swedish Krona – – – – 24.88 8.58 24.88 – 57.04 9.01 57.04 –
(b) Payable hedges
US Dollar 9852.03 63.29 8526.57 1325.46 13648.27 67.84 8028.44 5619.83 9929.87 63.47 5245.15 4684.72
EURO 4030.51 72.09 3883.73 146.78 2577.88 74.64 2474.52 103.36 3050.85 75.09 2917.37 133.48
Saudi Riyal – – – – 71.76 18.17 71.76 – – – – –
Arab Emirates Dirham 7.24 18.11 7.24 – 7.33 18.20 7.33 – – – – –
British Pound 23.18 84.46 23.18 – 105.45 102.86 103.90 1.55 41.15 100.70 35.72 5.43
Japanese Yen 1150.03 0.72 845.92 304.11 1426.34 0.67 1078.63 347.71 932.23 0.74 404.80 527.43
Kuwaiti Dinar 786.31 220.22 786.31 – 352.56 225.37 352.56 – 249.56 216.15 249.56 –
Qatari Riyal – – – – 244.46 18.57 244.46 – 175.69 17.22 175.69 –
Swiss Franc 279.05 67.45 279.05 – 321.50 73.94 241.64 79.86 222.22 68.60 222.22 –
Chinese Yuan 63.51 9.63 63.51 – 104.77 10.70 104.77 – 2.21 10.06 2.21 –
Norwegian Krone 9.56 8.80 6.10 3.46 – – – – – – – –
Notes forming part of the Consolidated Financial Statements (contd.)
NOTE [57] (contd.)

451
(B) Options taken to hedge exchange rate risk and accounted as cash flow hedge:
Particulars
As at 31-3-2017 As at 31-3-2016 As at 1-4-2015
Nominal
amount
(v crore)
Average
rate
(v)
Within
twelve
months
(v crore)
After
twelve
months
(v crore)
Nominal
amount
(v crore)
Average
rate
(v)
Within
twelve
months
(v crore)
After
twelve
months
(v crore)
Nominal
amount
(v crore)
Average
rate
(v)
Within
twelve
months
(v crore)
After
twelve
months
(v crore)
Receivable hedges
US Dollar 138.13 64.85 138.13 – 285.36 66.26 144.23 141.13 522.78 63.00 375.41 147.37
(C) Forward covers taken to hedge exchange rate risk and accounted as net investment hedge:
Particulars
As at 31-3-2017 As at 31-3-2016 As at 1-4-2015
Nominal
amount
(v crore)
Average
rate
(v)
Within
twelve
months
(v crore)
After
twelve
months
(v crore)
Nominal
amount
(v crore)
Average
rate
(v)
Within
twelve
months
(v crore)
After
twelve
months
(v crore)
Nominal
amount
(v crore)
Average
rate
(v)
Within
twelve
months
(v crore)
After
twelve
months
(v crore)
Receivable hedges
Saudi Riyal 785.74 19.44 27.79 757.95 584.21 20.81 – 584.21 366.36 19.54 366.36 –
(ii) Outstanding interest rate hedge instruments:
Interest rate swaps taken to hedge interest rate risk and accounted as cash flow hedge:
Particulars
As at 31-3-2017 As at 31-3-2016 As at 1-4-2015
Nominal
amount
(v crore)
Average
rate
(%)
Within
twelve
months
(v crore)
After
twelve
months
(v crore)
Nominal
amount
(v crore)
Average
rate
(%)
Within
twelve
months
(v crore)
After
twelve
months
(v crore)
Nominal
amount
(v crore)
Average
rate
(%)
Within
twelve
months
(v crore)
After
twelve
months
(v crore)
Floating interest rate
borrowings 2038.16 7.88 1107.11 931.05 2297.29 8.13 241.95 2055.34 2122.56 8.05 159.84 1962.72
(iii) Outstanding commodity price hedge instruments:
Commodity forward Contract:
Particulars
As at 31-3-2017 As at 31-3-2016 As at 1-4-2015
Nominal
amount
(v crore)
Average
rate
(v)
Within
twelve
months
(v crore)
After
twelve
months
(v crore)
Nominal
amount
(v crore)
Average
rate
(v)
Within
twelve
months
(v crore)
After
twelve
months
(v crore)
Nominal
amount
(v crore)
Average
rate
(v)
Within
twelve
months
(v crore)
After
twelve
months
(v crore)
Silver (Kg) – – – – – – – – 13.45 37373.00 13.45 –
Copper (Tn) 106.78 353806.93 106.78 – 387.10 317449.73 387.10 – 238.62 372551.79 238.62 –
Aluminium (Tn) 27.96 119901.16 27.96 – 164.86 108788.39 164.86 – 147.74 117011.72 147.74 –
Iron Ore (Tn) 71.66 3592.00 43.19 28.47 41.84 3053.00 23.38 18.46 – – – –
Coking Coal (Tn) 50.41 11494.00 42.07 8.34 16.86 5526.00 16.86 – – – – –
Zinc (Tn) 9.53 17753.00 9.53 – 46.56 121345.00 46.56 – 17.15 135003.00 17.15 –
Lead (Tn) 0.23 150777.00 0.23 – 13.16 121104.00 13.16 – 10.65 112455.00 10.65 –
Notes forming part of the Consolidated Financial Statements (contd.)
NOTE [57] (contd.)

452
(k) Carrying amounts of hedge instruments for which hedge accounting is followed:
(A) Cash flow hedge:
v crore
Particulars
As at 31-3-2017 As at 31-3-2016 As at 1-4-2015
Currency
exposure
Interest rate
exposure
Commodity
price
exposure
Currency
exposure
Interest rate
exposure
Commodity
price
exposure
Currency
exposure
Interest rate
exposure
Commodity
price
exposure
(i) Forward contracts
Current:
Asset - Other financial assets 636.15 (0.34) 29.03 309.95 0.07 4.11 467.64 0.06 6.55
Liability - Other financial liabilities 479.68 – (4.66) 232.54 – 0.06 501.35 – 3.54
Non-current:
Asset - Other financial assets 325.86 (0.17) 3.34 71.91 0.29 – 174.29 0.28 –
Liability - Other financial liabilities 63.21 – 1.39 37.16 – – 119.85 – –
(ii) Swap contracts
Current:
Asset - Other financial assets 127.37 (1.38) – 8.79 – – 1.77 – –
Liability - Other financial liabilities 20.60 – – 0.58 – – 2.12 – –
Non-current:
Asset - Other financial assets 116.91 (15.69) – 326.00 (2.73) – 167.74 22.49 –
Liability - Other financial liabilities – – – – – – (6.70) 10.23 –
(iii) Option contracts
Current:
Asset - Other financial assets – – – 8.11 – – 9.24 – –
Liability - Other financial liabilities 3.47 – – 11.54 – – 14.64 – –
Non-current:
Asset - Other financial assets – – – – – – – – –
Liability - Other financial liabilities – – – – – – – – –
(B) Net Investment hedge:
v crore
Particulars
As at 31-3-2017 As at 31-3-2016 As at 1-4-2015
Currency
exposure
Interest rate
exposure
Commodity
price
exposure
Currency
exposure
Interest rate
exposure
Commodity
price
exposure
Currency
exposure
Interest rate
exposure
Commodity
price
exposure
(i) Forward contracts
Current:
Asset - Other financial assets 1.47 – – – – – 29.17 – –
Non-current:
Asset - Other financial assets 63.75 – – 15.22 – – – – –
Notes forming part of the Consolidated Financial Statements (contd.)
NOTE [57] (contd.)

453
(l) Breakup of cash flow hedging reserve and cost of hedging reserve:
v crore
Particulars
As at 31-3-2017 As at 31-3-2016 As at 1-4-2015
Cash flow
hedging
reserve
Cost of
hedging
reserve
Cash flow
hedging
reserve
Cost of
hedging
reserve
Cash flow
hedging
reserve
Cost of
hedging
reserve
Balance towards continuing hedges 347.80 (57.80) 73.76 (15.23) 49.87 (25.94)
Balance for which hedge accounting discontinued 57.52 – (14.52) – (75.83) –
(m) Reclassification of hedging reserve and cost of hedging reserve to Profit or Loss:
v crore
Particulars 2016-17 2015-16
Future cash flows are no longer expected to occur:
Revenue from operations 73.42 50.80
Sales, administration and other expenses (10.47) 41.50
Other Income – (0.21)
Hedged expected future cash flows affecting profit or loss:
Progress Billing 214.06 (64.24)
Revenue from operations 168.63 84.21
Manufacturing, construction and operating expenses (269.54) (132.87)
Finance costs (405.82) (516.38)
Sales, administration and other expenses (34.78) 460.62
(n) Movement of hedging reserve and cost of hedging reserve:
v crore
Hedging reserve 2016-17 2015-16
Opening balance 59.24 (25.96)
Changes in the spot element of the forward contracts which is designated as hedging
instruments for time period related hedges
(207.83) 366.02
Changes in fair value of forward contracts designated as hedging instruments 676.73 73.74
Changes in intrinsic value of option contracts (0.07) (0.13)
Changes in fair value of swaps 50.92 (1.88)
Amount reclassified to Profit or Loss 177.52 (290.67)
Amount included in non-financial asset/liabilities (108.57) 21.72
Tax related to above (242.62) (83.60)
Closing balance 405.32 59.24
v crore
Cost of hedging reserve 2016-17 2015-16
Opening balance (15.23) (25.94)
Changes in the forward element of the forward contracts where changes in spot element of
forward contract is designated as hedging instruments for time period related hedges
(261.26) (328.81)
Amount reclassified to Profit or Loss 195.55 345.52
Tax related to above 23.14 (6.00)
Closing balance (57.80) (15.23)
Notes forming part of the Consolidated Financial Statements (contd.)
NOTE [57] (contd.)

454
NOTE [58]
Value of financial assets and inventories pledged as collateral for liabilities and/or commitments and/or contingent liabilities:
v crore
Particulars As at 31-3-2017 As at 31-3-2016 As at 1-4-2015
Current:
Investments 1400.63 – –
Inventories and trade receivables 10411.16 10168.56 9190.94
Cash and cash equivalents 319.97 124.16 197.79
Loans 2663.91 4991.62 3566.65
Other assets 345.54 175.96 206.45
Total inventories and current financial assets pledged as security 15141.21 15460.30 13161.83
Non-current:
Loans 33713.37 29094.68 27335.67
Total non-current financial assets pledged as security 33713.37 29094.68 27335.67
NOTE [59]
Disclosure on Specified Bank Notes (SBN) pursuant to MCA notification no. 308(E) dated March 30, 2017:
v crore
ParticularsSBNs Other denomination
notes
Total
Closing cash in hand as on November 8, 2016 68.43 9.74 78.17
(+) Permitted receipts * 41.72 383.73 425.45
(-) Permitted payments 0.03 21.77 21.80
(-) Amount deposited in Banks * 110.12 360.58 470.70
Closing cash in hand as on December 30, 2016 – 11.12 11.12
* includes amounts directly deposited by the borrowers into the bank accounts.
The Group’s Financial Services segment has subsidiaries engaged in the lending business offering a wide range of products such as micro finance, tractor loans, two-wheeler loans, mortgage lending products and other rural lending products to a large number of customers. The operations of these subsidiaries are geographically wide-spread with significant volume of transactions including cash collections. The above information covers cash received at the offices of these subsidiaries as well as direct deposits in the Group’s bank accounts by the borrowers of these subsidiaries and is based on information and records available with the Group.
The Group took steps not to accept Specified Bank Notes at its offices after November 8, 2016. Amounts directly deposited into the Group’s bank accounts by borrowers of these subsidiaries have been classified as “Permitted receipts” and where details of
denomination were not available, the same have been shown as “Other denomination notes”.
NOTE [60]
Additional information pursuant to Schedule III to the Companies Act, 2013 for the year ended 31-3-2017:
Name of the entity
Net Assets, i.e., total
assets minus total
liabilities
Share in profit or (loss) Share in other
comprehensive income
Share in total
comprehensive income
As % of
consolidated
net assets
Amount
(v crore)
As % of
consolidated
profit or loss
Amount
(v crore)
As % of
consolidated
other
comprehensive
income
Amount
(v crore)
As % of
consolidated
total
comprehensive
income
Amount
(v crore)
Parent Company
Larsen and Toubro Limited 91.63% 46012.74 90.28% 5453.74 107.49% 157.35 90.68% 5611.09
Indian Subsidiaries
Infrastructure:
Hi-Tech Rock Products & Aggregates
Limited 0.02% 9.21 0.08% 4.89 – – 0.08% 4.89
L&T Geostructure LLP 0.06% 32.11 0.52% 31.39 (0.05%) (0.08) 0.51% 31.31
L&T Infrastructure Engineering Limited 0.08% 39.00 0.12% 7.34 (0.12%) (0.18) 0.12% 7.16
Notes forming part of the Consolidated Financial Statements (contd.)

455
Name of the entity
Net Assets, i.e., total
assets minus total
liabilities
Share in profit or (loss) Share in other
comprehensive income
Share in total
comprehensive income
As % of
consolidated
net assets
Amount
(v crore)
As % of
consolidated
profit or loss
Amount
(v crore)
As % of
consolidated
other
comprehensive
income
Amount
(v crore)
As % of
consolidated
total
comprehensive
income
Amount
(v crore)
Heavy Engineering:
L&T Cassidian Limited 0.00% 0.03 – – – – – –
Spectrum Infotech Private Limited 0.03% 16.53 (0.01%) (0.86) (0.01%) (0.02) (0.01%) (0.88)
Hydrocarbon:
L&T Hydrocarbon Engineering Limited 3.08% 1545.66 7.22% 436.30 (45.51%) (66.62) 5.97% 369.68
IT & Technology Services:
Larsen & Toubro Infotech Limited 5.93% 2976.88 15.52% 937.56 147.53% 215.95 18.64% 1153.51
L&T Technology Services Limited 3.05% 1531.52 7.43% 449.01 56.55% 82.78 8.59% 531.79
L&T Thales Technology Services Private
Limited 0.00% (2.72) 0.01% 0.56 (0.01%) (0.02) 0.01% 0.54
AugmentIQ Data Sciences Private Limited 0.00% 1.09 0.00% 0.16 – – 0.00% 0.16
Financial Services:
L&T Finance Limited (formerly known as
Family Credit Limited) 13.52% 6787.26 (0.61%) (37.13) 2.23% 3.26 (0.55%) (33.87)
L&T Access Distribution Services Limited 0.01% 3.17 (0.02%) (0.94) – – (0.02%) (0.94)
L&T Capital Markets Limited 0.03% 15.58 0.10% 5.78 0.15% 0.22 0.10% 6.00
L&T Finance Holdings Limited 8.28% 4156.28 1.99% 120.37 (0.10%) (0.14) 1.94% 120.23
L&T Housing Finance Limited 1.60% 805.30 1.98% 119.58 0.30% 0.44 1.94% 120.02
L&T Infra Debt Fund Limited 1.44% 720.67 1.48% 89.37 (0.01%) (0.01) 1.44% 89.36
L&T Infra Investment Partners Advisory
Private Limited 0.03% 13.06 0.08% 4.87 – – 0.08% 4.87
L&T Infra Investment Partners Trustee
Private Limited 0.00% 0.05 – – – – – –
L&T Infrastructure Finance Company
Limited 6.32% 3174.27 0.89% 53.64 (0.80%) (1.17) 0.85% 52.47
L&T Investment Management Limited 1.02% 512.27 (0.09%) (5.33) (0.10%) (0.15) (0.09%) (5.48)
L&T Mutual Fund Trustee Limited 0.00% 1.59 0.00% 0.02 – – 0.00% 0.02
L&T Trustee Company Private Limited 0.00% (0.01) – – – – – –
L&T Financial Consultants Limited
(formerly known as L&T Vrindavan
Properties Limited) 0.21% 106.47 0.28% 16.67 (0.01%) (0.01) 0.27% 16.66
Mudit Cement Private Limited (0.03%) (13.64) (0.09%) (5.49) – – (0.09%) (5.49)
L&T General Insurance Company Limited (0.13%) (64.15) (1.06%) (64.15) – – (1.04%) (64.15)
L&T Infra Investment Partners 1.18% 592.46 0.88% 53.13 – – 0.86% 53.13
Developmental Projects:
L&T Metro Rail (Hyderabad) Limited 4.06% 2037.69 0.05% 2.82 (17.71%) (25.92) (0.37%) (23.10)
Sahibganj Ganges Bridge-Company
Private Limited – – 0.00% (0.01) – – 0.00% (0.01)
Marine Infrastructure Developer Private
Limited 0.80% 402.75 0.04% 2.64 0.08% 0.11 0.04% 2.75
Notes forming part of the Consolidated Financial Statements (contd.)
NOTE [60] (contd.)

456
Name of the entity
Net Assets, i.e., total
assets minus total
liabilities
Share in profit or (loss) Share in other
comprehensive income
Share in total
comprehensive income
As % of
consolidated
net assets
Amount
(v crore)
As % of
consolidated
profit or loss
Amount
(v crore)
As % of
consolidated
other
comprehensive
income
Amount
(v crore)
As % of
consolidated
total
comprehensive
income
Amount
(v crore)
Power Development:
L&T Arunachal Hydropower Limited 0.08% 40.48 – – – – – –
L&T Himachal Hydropower Limited 0.39% 197.85 – – – – – –
L&T Power Development Limited 6.20% 3115.87 0.00% 0.19 – – 0.00% 0.19
L&T Uttaranchal Hydropower Limited 1.72% 863.29 – – – – – –
Nabha Power Limited 5.77% 2898.75 (0.43%) (26.11) 0.47% 0.69 (0.41%) (25.42)
Realty:
Chennai Vision Developers Private Limited – – 0.00% 0.01 – – 0.00% 0.01
L&T Asian Realty Project LLP 1.68% 842.19 (0.01%) (0.37) – – 0.00% (0.37)
L&T Parel Project LLP 0.13% 64.40 1.36% 81.94 – – 1.32% 81.94
L&T Realty Limited 2.12% 1065.96 5.28% 318.69 – – 5.15% 318.69
L&T Seawoods Limited 6.39% 3210.94 0.53% 32.13 0.01% 0.02 0.52% 32.15
L&T South City Projects Limited 0.07% 33.13 0.55% 33.13 – – 0.54% 33.13
L&T Vision Ventures Limited (0.01%) (4.62) 0.00% (0.02) – – 0.00% (0.02)
Seawoods Realty Private Limited – – 0.00% (0.01) – – 0.00% (0.01)
Seawoods Retail Private Limited – – 0.00% (0.01) – – 0.00% (0.01)
Valves, Welding Equipment, Construction Equipment and Others:
L&T Construction Equipment Limited 0.46% 230.14 (0.11%) (6.87) 0.24% 0.35 (0.11%) (6.52)
L&T Cutting Tools Limited 0.08% 42.40 0.27% 16.12 0.08% 0.11 0.26% 16.23
L&T Valves Limited 1.20% 603.58 1.99% 120.54 1.52% 2.23 1.98% 122.77
EWAC Alloys Limited 0.19% 95.69 0.58% 34.98 (0.03%) (0.04) 0.56% 34.94
Shipbuilding:
L&T Shipbuilding Limited (1.65%) (829.40) (5.77%) (348.34) (10.94%) (16.01) (5.89%) (364.35)
Others:
Bhilai Power Supply Company Limited 0.00% 0.05 – – – – – –
L&T Electricals and Automation Limited 0.01% 6.54 (0.01%) (0.89) – – (0.01%) (0.89)
L&T Power Limited 0.01% 4.84 0.00% 0.20 – – 0.00% 0.20
Kesun Iron and Steel Company Private
Limited 0.00% (0.26) 0.00% (0.01) – – 0.00% (0.01)
L&T Aviation Services Private Limited 0.07% 36.39 (0.12%) (6.99) (0.08%) (0.11) (0.11%) (7.10)
L&T Capital Company Limited 0.02% 10.05 0.04% 2.35 (0.01%) (0.01) 0.04% 2.34
L&T Infra Contractors Private Limited – – – – – – – –
Foreign Subsidiaries
Infrastructure:
Larsen & Toubro (Oman) LLC 0.74% 373.93 1.62% 97.95 (18.80%) (27.52) 1.14% 70.43
Larsen & Toubro Qatar LLC 0.00% 0.55 0.00% 0.29 (0.01%) (0.01) 0.00% 0.28
Larsen & Toubro (Saudi Arabia) LLC 0.75% 377.63 6.50% 392.80 2.99% 4.37 6.42% 397.17
Larsen & Toubro T&D SA (Proprietary)
Limited 0.01% 2.62 0.00% 0.14 0.13% 0.19 0.01% 0.33
Notes forming part of the Consolidated Financial Statements (contd.)
NOTE [60] (contd.)

457
Name of the entity
Net Assets, i.e., total
assets minus total
liabilities
Share in profit or (loss) Share in other
comprehensive income
Share in total
comprehensive income
As % of
consolidated
net assets
Amount
(v crore)
As % of
consolidated
profit or loss
Amount
(v crore)
As % of
consolidated
other
comprehensive
income
Amount
(v crore)
As % of
consolidated
total
comprehensive
income
Amount
(v crore)
Larsen & Toubro Readymix & Asphalt
Concrete Industries LLC 0.04% 17.71 (0.15%) (9.24) (0.01%) (0.02) (0.15%) (9.26)
Heavy Engineering:
Larsen & Toubro Heavy Engineering LLC (0.10%) (51.69) (0.68%) (41.27) 2.67% 3.91 (0.60%) (37.36)
Hydrocarbon:
Larsen & Toubro Hydrocarbon
International Limited LLC 0.00% (1.06) (0.01%) (0.86) 0.02% 0.03 (0.01%) (0.83)
L&T Modular Fabrication Yard LLC (0.13%) (67.11) (0.23%) (14.09) 1.82% 2.67 (0.18%) (11.42)
L&T Overseas Projects Nigeria Limited 0.00% 0.01 0.00% (0.02) (0.01%) (0.02) 0.00% (0.04)
Larsen Toubro Arabia LLC (0.83%) (415.38) (4.17%) (251.62) 7.78% 11.39 (3.88%) (240.23)
Larsen & Toubro ATCO Saudia LLC (0.88%) (444.69) 0.32% 19.69 1.46% 2.13 0.35% 21.82
Larsen & Toubro Kuwait Construction
General Contracting Company WLL (0.02%) (9.89) (0.04%) (2.34) 0.22% 0.32 (0.03%) (2.02)
PT Larsen & Toubro Hydrocarbon
Engineering Indonesia – – – – – – – –
IT & Technology Services:
L&T Information Technology Services
(Shanghai) Co., Ltd. 0.00% (0.12) (0.01%) (0.63) – – (0.01%) (0.63)
L&T Infotech Financial Services
Technologies Inc. 0.68% 339.39 0.65% 39.46 (15.12%) (22.13) 0.28% 17.33
Larsen & Toubro Infotech Canada Limited 0.01% 7.25 0.04% 2.74 (0.31%) (0.46) 0.04% 2.28
Larsen & Toubro Infotech LLC 0.02% 11.45 0.01% 0.45 (0.36%) (0.52) 0.00% (0.07)
Larsen & Toubro Infotech South Africa
(PTY) Limited 0.01% 2.80 0.01% 0.77 0.14% 0.20 0.02% 0.97
Larsen & Toubro Infotech GmbH 0.06% 27.93 0.04% 2.16 (1.81%) (2.65) (0.01%) (0.49)
Larsen & Toubro Infotech Austria GmbH 0.00% 0.49 0.00% 0.31 (0.03%) (0.04) 0.00% 0.27
L&T Information Technology Spain SL 0.00% 1.74 0.03% 1.55 (0.08%) (0.12) 0.02% 1.43
Larsen & Toubro LLC 0.00% 2.40 0.00% 0.02 (0.03%) (0.05) 0.00% (0.03)
L&T Technology Services LLC (0.09%) (45.03) (0.40%) (24.20) 0.88% 1.29 (0.37%) (22.91)
Realty:
L&T Realty FZE 0.02% 9.90 0.01% 0.57 (0.15%) (0.22) 0.01% 0.35
Electrical & Automation:
Henikwon Corporation SDN. BHD. (0.02%) (9.25) (0.01%) (0.40) 0.33% 0.48 0.00% 0.08
Kana Controls General Trading &
Contracting Company WLL 0.00% (1.06) 0.00% 0.23 0.04% 0.06 0.00% 0.29
L&T Electrical & Automation FZE 0.23% 114.74 (0.34%) (20.68) (1.44%) (2.11) (0.37%) (22.79)
L&T Electricals & Automation Saudi
Arabia Company Limited LLC (0.01%) (4.43) (0.15%) (9.16) 1.80% 2.64 (0.11%) (6.52)
PT Tamco Indonesia (0.07%) (33.86) (0.03%) (1.76) (0.92%) (1.35) (0.05%) (3.11)
Servowatch Systems Limited (0.04%) (18.63) (0.24%) (14.73) 3.55% 5.20 (0.15%) (9.53)
Notes forming part of the Consolidated Financial Statements (contd.)
NOTE [60] (contd.)

458
Name of the entity
Net Assets, i.e., total
assets minus total
liabilities
Share in profit or (loss) Share in other
comprehensive income
Share in total
comprehensive income
As % of
consolidated
net assets
Amount
(v crore)
As % of
consolidated
profit or loss
Amount
(v crore)
As % of
consolidated
other
comprehensive
income
Amount
(v crore)
As % of
consolidated
total
comprehensive
income
Amount
(v crore)
Tamco Electrical Industries Australia Pty
Limited 0.02% 11.33 (0.03%) (1.83) (3.63%) (5.32) (0.12%) (7.15)
Tamco Switchgear (Malaysia) SDN. BHD. 1.03% 516.95 1.01% 61.15 (78.94%) (115.55) (0.88%) (54.40)
Thalest Limited 0.01% 7.19 0.01% 0.33 (0.69%) (1.01) (0.01%) (0.68)
Others:
Larsen & Toubro (East Asia) SDN. BHD. 0.00% 0.21 0.00% (0.12) (0.20%) (0.30) (0.01%) (0.42)
Larsen & Toubro International FZE 1.63% 816.39 (0.33%) (19.82) 1.35% 1.98 (0.29%) (17.84)
L&T Global Holdings Limited 0.03% 16.10 (0.60%) (36.42) (0.08%) (0.11) (0.59%) (36.53)
Total Subsidiaries 39485.15 2644.27 53.02 2697.29
Non-controlling interest in all subsidiaries (7.10%) (3563.60) (7.35%) (444.27) (21.45%) (31.40) (7.69%) (475.67)
Indian Associates
L&T-Chiyoda Limited 0.09% 44.54 0.06% 3.90 (0.15%) (0.22) 0.06% 3.68
Gujarat Leather Industries Limited – – – – – – – –
Feedback Infra Private Limited 0.09% 44.55 0.10% 6.14 0.01% 0.02 0.10% 6.16
Magtorq Private Limited 0.01% 5.87 0.00% 0.06 0.00% – 0.00% 0.06
Grameen Capital India Limited 0.01% 6.00 – – – – – –
Foreign Associates
Larsen & Toubro Qatar & HBK Contracting
LLC – – 0.00% 0.25 (0.01%) (0.01) 0.00% 0.24
L&T Camp Facilities LLC 0.01% 3.04 0.02% 1.00 0.01% 0.02 0.02% 1.02
Total Associates 104.00 11.35 (0.19) 11.16
Jointly Operations - Indian Operations
Bauer-L&T Geo Joint Venture 0.00% 0.23 0.00% 0.08 – – 0.00% 0.08
Indian Joint Ventures
Power:
L&T-MHPS Boilers Private Limited 0.94% 474.23 1.87% 112.85 (7.84%) (11.48) 1.64% 101.37
L&T-MHPS Turbine Generators Private
Limited 0.13% 64.59 (0.02%) (1.25) (2.53%) (3.70) (0.08%) (4.95)
L&T Howden Private Limited 0.06% 29.09 0.15% 9.33 (0.05%) (0.08) 0.15% 9.25
L&T-Sargent & Lundy Limited 0.06% 27.66 0.02% 1.39 0.23% 0.33 0.03% 1.72
Heavy Engineering:
L&T Special Steels and Heavy Forgings
Private Limited – – (3.09%) (186.87) (0.89%) (1.30) (3.04%) (188.17)
Hydrocarbon:
L&T Sapura Offshore Private Limited 0.00% 0.39 0.00% (0.13) – – 0.00% (0.13)
L&T Sapura Shipping Private Limited 0.55% 277.68 0.25% 15.33 (4.20%) (6.15) 0.15% 9.18
L&T-Gulf Private Limited 0.02% 11.77 0.02% 1.04 – – 0.02% 1.04
Developmental Projects:
L&T Infrastructure Development Projects
Limited (Consolidated) 3.51% 1764.74 (5.71%) (344.66) (0.10%) (0.14) (5.57%) (344.80)
Notes forming part of the Consolidated Financial Statements (contd.)
NOTE [60] (contd.)

459
Name of the entity
Net Assets, i.e., total
assets minus total
liabilities
Share in profit or (loss) Share in other
comprehensive income
Share in total
comprehensive income
As % of
consolidated
net assets
Amount
(v crore)
As % of
consolidated
profit or loss
Amount
(v crore)
As % of
consolidated
other
comprehensive
income
Amount
(v crore)
As % of
consolidated
total
comprehensive
income
Amount
(v crore)
Valves, Welding Equipment, Construction Equipment and Others:
L&T Kobelco Machinery Private Limited 0.04% 18.43 0.01% 0.32 0.80% 1.17 0.02% 1.49
Others:
Raykal Aluminium Company Private
Limited 0.00% 0.28 0.00% (0.03) – – 0.00% (0.03)
Foreign Joint Ventures
Hydrocarbon:
Larsen & Toubro Electromech LLC – – (0.23%) (13.92) 0.85% 1.25 (0.20%) (12.67)
Indiran Engineering Projects and Systems
Kish PJSC 0.00% 0.04 0.00% (0.02) (0.01%) (0.01) 0.00% (0.03)
Total Joint Ventures 2668.90 (406.62) (20.11) (426.73)
CFS Adjustment and elimination (68.67%) (34490.90) (20.15%) (1217.32) (8.39%) (12.29) (19.87%) (1229.61)
Total 50216.52 6041.23 146.38 6187.61
NOTE [61]
Disclosure pursuant to Indian Accounting Standard (Ind AS) 1 ”Presentation of financial statements“:
(a) Current assets expected to be recovered within twelve months and after twelve months from the reporting date:
v crore
Sr.
no.Particulars Note
As at 31-3-2017 As at 31-3-2016 As at 1-4-2015
Within
twelve
months
After
twelve
months
Total Within
twelve
months
After
twelve
months
Total Within
twelve
months
After
twelve
months
Total
1. Inventories 11 4046.19 93.55 4139.74 4602.22 251.99 4854.21 5715.37 265.79 5981.16
2. Trade receivables 13 27477.41 492.19 27969.60 25447.06 577.92 26024.98 21259.27 995.16 22254.43
3. Loans - current 16 473.01 7.83 480.84 645.84 5.30 651.14 532.76 9.88 542.64
4. Other financial assets 18 2598.78 104.80 2703.58 2192.38 106.29 2298.67 2018.89 110.08 2128.97
5. Other current assets 19 30326.18 10039.93 40366.11 29478.50 10975.15 40453.65 25220.53 9752.38 34972.91
(b) Current liabilities expected to be settled within twelve months and after twelve months from the reporting date:
v crore
Sr.
no.Particulars Note
As at 31-3-2017 As at 31-3-2016 As at 1-4-2015
Within
twelve
months
After
twelve
months
Total Within
twelve
months
After
twelve
months
Total Within
twelve
months
After
twelve
months
Total
1. Trade payables 28 28334.89 1439.36 29774.25 26068.22 935.34 27003.56 20793.38 1263.51 22056.89
2. Other financial liabilities 29 5138.28 50.77 5189.05 4280.95 41.49 4322.44 3738.89 33.96 3772.85
3. Other current liabilities 30 16909.28 6535.46 23444.74 18177.14 6230.75 24407.89 14201.95 6602.65 20804.60
4. Provisions 31 2466.09 192.25 2658.34 2159.85 143.67 2303.52 1571.46 105.39 1676.85
NOTE [62]
There are no amounts due and outstanding to be credited to Investor Education & Protection Fund as at March 31, 2017.
Notes forming part of the Consolidated Financial Statements (contd.)
NOTE [60] (contd.)

460
NOTE [63]
Disclosure pursuant to Indian Accounting Standard (Ind AS) 101 “First time adoption of Indian Accounting Standards”
(a) Effect of Ind AS adoption on Balance Sheet as at April 1, 2015:
Particulars
Note I-GAAP Ind AS Adjustments Ind AS
v crore v crore v crore v crore v crore v crore
ASSETS:
Non-current assets
Property, plant and equipment A,B,C,D 18785.51 (5115.73) 13669.78
Capital work-in-progress A,B,C,D 4902.72 (3450.06) 1452.66
Investment property B – 2768.70 2768.70
Goodwill A,Q 2215.00 (678.02) 1536.98
Other intangible assets A,C 13712.54 (13144.07) 568.47
Intangible assets under development A 10055.35 (3581.69) 6473.66
Financial assets
Investments in joint ventures and
associates A 147.76 1918.89 2066.65
Other investments A,E,S 1513.75 374.64 1888.39
Loans A,F 238.52 567.91 806.43
Loans towards financing activities A,H 42036.39 (604.79) 41431.60
Other financial assets A,H,M 564.42 (83.82) 480.60
44500.84 2172.83 46673.67
Deferred tax assets (net) A,G 936.40 73.50 1009.90
Non current assets for current tax
(net) A,C 261.17 (24.90) 236.27
Other non-current assets A,D,S 2477.65 (82.65) 2395.00
Current assets
Inventories A,C,D 6508.40 (527.24) 5981.16
Financial assets
Investments A,E 8000.79 (646.98) 7353.81
Trade receivables A,C,H 22872.22 (617.79) 22254.43
Cash and cash equivalents A,C 4773.34 (360.77) 4412.57
Other bank balances A 1052.97 (356.12) 696.85
Loans A,C,F 511.09 31.55 542.64
Loans towards financing activities A,H 14353.86 (31.84) 14322.02
Other financial assets A,C,H 2381.72 (252.75) 2128.97
53945.99 (2234.70) 51711.29
Other current assets A, C, H,
M, T
35352.96 (380.05) 34972.91
Group(s) of assets classified as held for
sale C 39.39 1631.96 1671.35
TOTAL ASSETS 193693.92 (22572.12) 171121.80
Notes forming part of the Consolidated Financial Statements (contd.)

461
Particulars
Note I-GAAP Ind AS Adjustments Ind AS
v crore v crore v crore v crore v crore v crore
EQUITY AND LIABILITIES:
Equity
Equity share capital 185.91 – 185.91
Other equity 40723.16 299.02 41022.18
Equity attributable to owners of the
Company 40909.07 299.02 41208.09
Non controlling interest A,P,T 4998.62 (3028.00) 1970.62
Liabilities
Non-current liabilities
Financial liabilities
Borrowings A,C,D,J,P 69402.47 (16692.83) 52709.64
Other financial liabilities A,F,M 446.90 (224.78) 222.12
69849.37 (16917.61) 52931.76
Provisions A,N 575.05 (189.70) 385.35
Deferred tax liabilities A,C,G,O,T 539.56 119.93 659.49
Other non current Liabilities A,D,F 163.80 48.13 211.93
Current liabilities
Financial liabilities
Borrowings A,C,D 16543.83 (646.69) 15897.14
Current maturities of long term
borrowings A,C,D 9112.17 (989.30) 8122.87
Trade payables A,C,N,S 21752.42 304.47 22056.89
Other financial liabilities A,C,K,M 4030.35 (257.50) 3772.85
51438.77 (1589.02) 49849.75
Other current liabilities A,C,M 21609.62 (805.02) 20804.60
Provisions A,C,L,N 3349.22 (1672.37) 1676.85
Current tax liabilities (net) A 260.84 38.71 299.55
Liabilities associated with group(s) of
assets classified as held for sale C – 1123.81 1123.81
TOTAL EQUITY AND LIABILITIES 193693.92 (22572.12) 171121.80
Notes forming part of the Consolidated Financial Statements (contd.)
NOTE [63] (contd.)

462
(b) Statement of reconciliation of equity under Ind AS and equity reported under I-GAAP as at April 1, 2015:
Sr.
no.Particulars Note
v crore
Equity as per I-GAAP 40909.07
I Provision for expected credit loss H (1121.12)
II Provision for employee benefits based on constructive obligations K (450.87)
III Gain on fair valuation of investments E 555.71
IV Increase in borrowing cost pursuant to application of effective interest rate method D (122.67)
V Increase in borrowing cost due to initial fair valuation of long term financial liabilities D (75.82)
VI Equity component of other financial instruments (Foreign Currency Convertible Bonds) J 153.20
VII Reversal of dividend & dividend distribution tax L 1803.63
VIII Others A, D, F, H,
I, M, N, Q
(68.75)
IX Deferred and current taxes A,G,V (146.36)
X Additional Tax on dividend distributed by subsidiaries T (227.93)
Equity as per Ind AS (attributable to owners of the Company) 41208.09
(c) Effect of Ind AS adoption on Balance Sheet as at March 31, 2016:
Particulars Note I-GAAP Ind AS Adjustments Ind AS
v crore v crore v crore v crore v crore v crore
ASSETS:
Non-current assets
Property, plant and equipment A,B,C,D 17359.98 (5187.81) 12172.17
Capital work-in-progress A,B,D 6211.01 (4420.48) 1790.53
Investment property B – 4386.00 4386.00
Goodwill A,Q 2171.67 (724.71) 1446.96
Other intangible assets A,C,D 23724.84 (23168.27) 556.57
Intangible assets under development A,D 11278.92 (2095.00) 9183.92
Financial assets
Investments in joint ventures and
associates A 109.94 1147.94 1257.88
Other investments A,E,S 1880.14 446.87 2327.01
Loans A,F 219.33 818.32 1037.65
Loans towards financing activities A,H 48449.21 (560.94) 47888.27
Other financial assets A,M 610.37 (46.82) 563.55
51268.99 1805.37 53074.36
Deferred tax assets (net) A,G 1195.13 176.78 1371.91
Non current assets for current tax (net) A 604.50 (50.51) 553.99
Other non-current assets A,D,S 2842.74 (105.55) 2737.19
Notes forming part of the Consolidated Financial Statements (contd.)
NOTE [63] (contd.)

463
Particulars Note I-GAAP Ind AS Adjustments Ind AS
v crore v crore v crore v crore v crore v crore
Current assets
Inventories A,B,C,D 5361.99 (507.78) 4854.21
Financial assets
Investments A,C,E 8179.48 (685.29) 7494.19
Trade receivables A,C,H 27009.30 (984.32) 26024.98
Cash and cash equivalents A,S 4083.44 (276.90) 3806.54
Other bank balances A 1880.00 (296.63) 1583.37
Loans A,F 547.64 103.50 651.14
Loans towards financing activities A,H 18519.12 187.22 18706.34
Other financial assets A,H 2587.37 (288.70) 2298.67
62806.35 (2241.12) 60565.23
Other current assets A,H,M,T 41946.59 (1492.94) 40453.65
Group(s) of assets classified as held for
sale C 25.03 1554.43 1579.46
TOTAL ASSETS 226797.74 (32071.59) 194726.15
EQUITY AND LIABILITIES:
Equity
Equity share capital 186.30 – 186.30
Other equity 43805.43 188.63 43994.06
Equity attributable to owners of the
Company 43991.73 188.63 44180.36
Non-controlling interest A,P,T 6768.78 (3875.94) 2892.84
Liabilities
Non-current liabilities
Financial liabilities
Borrowings A,D,J,P 85671.99 (24448.15) 61223.84
Other financial liabilities A,F,M 384.95 (243.55) 141.40
86056.94 (24691.70) 61365.24
Provisions A,N 797.18 (372.52) 424.66
Deferred tax liabilities (net) A,G,O,T 411.15 224.33 635.48
Other non-current liabilities A,D,F 156.18 24.96 181.14
Notes forming part of the Consolidated Financial Statements (contd.)
NOTE [63] (contd.)

464
Particulars Note I-GAAP Ind AS Adjustments Ind AS
v crore v crore v crore v crore v crore v crore
Current liabilities
Financial liabilities
Borrowings A,D 15573.12 (676.37) 14896.75
Current maturities of long term
borrowings A,D 13307.03 (1292.13) 12014.90
Trade payables A,N,S 26202.74 800.82 27003.56
Other financial liabilities A,C,K,M 4397.36 (74.92) 4322.44
59480.25 (1242.60) 58237.65
Other current liabilities A,M 25337.63 (929.74) 24407.89
Provisions A,C,L,N 3706.75 (1403.23) 2303.52
Current tax liabilities (net) A 91.15 (7.66) 83.49
Liabilities associated with group(s) of
assets classified as held for sale C – 13.88 13.88
TOTAL EQUITY AND LIABILITIES 226797.74 (32071.59) 194726.15
(d) Statement of reconciliation of equity under Ind AS and equity reported under I-GAAP as at March 31, 2016:
Sr.
No.Particulars Note
v crore
Equity as per I-GAAP 43991.73
I Provision for expected credit loss H (1107.29)
II Provision for employee benefits based on constructive obligations K (488.31)
III Gain on fair valuation of investments E 404.94
IV Increase in borrowing cost pursuant to application of effective interest rate method D (182.30)
V Increase in borrowing cost due to initial fair valuation of long term financial liabilities D (380.56)
VI Equity component of other financial instruments (Foreign Currency Convertible Bonds) J 153.20
VII Reversal of dividend & dividend distribution tax L 2039.53
VIII Others A, D, F, H,
I, M, N, Q
145.19
IX Deferred and current taxes A,G,V (121.67)
X Additional tax on dividend distributed by subsidiaries T (274.10)
Equity as per Ind AS (attributable to owners of the Company) 44180.36
Notes forming part of the Consolidated Financial Statements (contd.)
NOTE [63] (contd.)

465
(e) Effect of Ind AS adoption on the Statement of Profit and Loss for the year ended March 31, 2016:
Particulars Note I-GAAP Ind AS Adjustments Ind AS
v crore v crore v crore v crore v crore v crore
INCOME:
Revenue from operations A,M,R 103522.24 (1546.90) 101975.34
Other income A,E 1183.03 (278.68) 904.35
Total Income 104705.27 (1825.58) 102879.69
EXPENSES:
Manufacturing, construction and
operating expenses:
A,R
Cost of raw materials, components consumed 13546.91 183.07 13729.98
Excise duty 890.55 (37.69) 852.86
Construction materials consumed 20036.82 219.95 20256.77
Purchase of stock-in-trade 1333.44 – 1333.44
Stores, spares and tools consumed 1935.55 (101.36) 1834.19
Sub-contracting charges 19565.57 1223.29 20788.86
Changes in inventories of finished goods, work-in-progress, stock-in-trade and property development 862.98 (1377.84) (514.86)
Other manufacturing, construction and operating expenses 8224.79 935.77 9160.56
Finance cost of financial services business and finance lease activity 4828.91 138.20 4967.11
71225.52 1183.39 72408.91
Employee benefits expense A, I, K,
N, O
13816.16 (485.32) 13330.84
Sales, administration and other expenses A,H 6146.67 (368.15) 5778.52
Finance costs A,D 3041.22 (1386.16) 1655.06
Depreciation, amortisation, impairment
and obsolescence
A
2755.99 (969.26) 1786.73
96985.56 (2025.50) 94960.06
Less: Overheads capitalised A 8.84 (3.07) 5.77
Total expenses 96976.72 (2022.43) 94954.29
Profit before exceptional items and tax 7728.55 196.85 7925.40
Exceptional items U 358.10 (263.88) 94.22
Profit before tax 8086.65 (67.03) 8019.62
Tax expense:
Current tax A,V 2764.19 53.50 2817.69
Deferred tax A,G,T,V (215.71) (165.02) (380.73)
2548.48 (111.52) 2436.96
Profit after tax 5538.17 44.49 5582.66
Carried forward 5538.17 44.49 5582.66
Notes forming part of the Consolidated Financial Statements (contd.)
NOTE [63] (contd.)

466
Particulars Note I-GAAP Ind AS Adjustments Ind AS
v crore v crore v crore v crore v crore v crore
Brought forward 5538.17 44.49 5582.66
Less: Additional provision/(reversal) of tax
on dividend distributed by subsidiaries
T
0.18 47.62 47.80
5537.99 (3.13) 5534.86
Add: Share in profit/(loss) of joint ventures
and associates (net)
A
(2.51) (987.65) (990.16)
Profit for the year 5535.48 (990.78) 4544.70
Other comprehensive income [net of tax] E, G,
M, O
– 159.05 159.05
Total comprehensive income for the year 5535.48 (831.73) 4703.75
Profit for the year attributable to:
- Owners of the Company 5090.53 (857.65) 4232.88
- Non-controlling interests A 444.95 (133.13) 311.82
5535.48 (990.78) 4544.70
Other comprehensive income for the year
attributable to :
- Owners of the Company – 155.82 155.82
- Non-controlling interests – 3.23 3.23
– 159.05 159.05
Total comprehensive income for the year
attributable to:
- Owners of the Company 5090.53 (701.83) 4388.70
- Non-controlling interests 444.95 (129.90) 315.05
5535.48 (831.73) 4703.75
(f) Statement of reconciliation of total comprehensive income for the year ended March 31, 2016:
Sr.
no.Particulars Note
v crore
Net profit after tax as per I-GAAP 5090.53
I Impact of provision for expected credit loss H 13.83
II Gain/(loss) on divestment of stake in subsidiary U (263.88)
III Provision for employee benefits based on constructive obligations K (37.44)
IV Impact of fair valuation of investments E (147.22)
V Increase in borrowing cost pursuant to application of effective interest rate method D (88.42)
VI Reclassification of net actuarial gain on employee defined benefit obligations to other
comprehensive income
O 13.88
VII Increase in borrowing cost due to initial fair valuation of long term financial liabilities D (304.74)
IX Others A,F,I,M,Q 10.70
X Deferred and current taxes A,G,V (8.17)
XI Additional tax on dividend distributed by subsidiaries T (46.19)
Net profit after tax as per Ind AS 4232.88
XII Other comprehensive income (net of tax) [attributable to owners of the Company] E,G,M,O 155.82
Total comprehensive income as per Ind AS (attributable to owners of the Company) 4388.70
Notes forming part of the Consolidated Financial Statements (contd.)
NOTE [63] (contd.)

467
(g) Effect of Ind AS adoption on Statement of Cash Flow for the year ended March 31, 2016:
v crore
ParticularsNote I-GAAP Ind AS
Adjustments
Ind AS
Net Cash flows from operating activities A (3233.91) (5.68) (3239.59)
Net Cash flows from investing activities A (4964.54) 337.98 (4626.56)
Net Cash flows from financing activities A 7488.47 (235.77) 7252.70
Net increase/(decrease) in cash and cash equivalents (709.98) 96.53 (613.45)
Cash and cash equivalents as at April 1, 2015 4763.73 (360.77) 4402.96
Cash and cash equivalents as at March 31, 2016 4053.75 (264.24) 3789.51
Notes:
A. Some of the entities have been classified as joint ventures under Ind AS 111 based on the nature of the control exercised by the
Parent Company. Accordingly, the share in net profit/loss of joint ventures is recognised in the consolidated Statement of Profit
and Loss and share in the net assets is included under investment in joint ventures/associates in the consolidated Balance Sheet as
per equity method. Under I-GAAP, the financials of these entities were consolidated line by line.
B. Pursuant to Ind AS requirements, investment property is presented separately. Under I-GAAP the same was presented as part
of tangible assets. Tangible assets have been now divided into two categories under Ind AS viz property plant & equipment and
Investment Property.
C. In accordance with Ind AS 105, group(s) of assets classified as held for sale and liabilities associated with such group(s) is presented
separately. Under I-GAAP there was no such requirement.
D. Under Ind AS 23, borrowing cost is calculated following effective interest rate (EIR) method as described under Ind AS 109. Under
I-GAAP borrowing cost was computed by applying the coupon rate to the principal amount for the period with consequential
impact in the asset items where borrowing cost is capitalised / inventorised. Borrowings are recognised at fair value at the
inception and subsequently at amortised cost with interest recognised based on EIR method.
E. Investments except investments in group companies have been fair valued in accordance with Ind AS 109. Other investments are
fair valued through profit and loss. Under I-GAAP the current investments were carried at cost net of diminution in their value as
on the Balance Sheet date. The long term investments were carried at cost net of diminution, other than temporary in nature, if
any.
F. Under Ind AS financial assets and liabilities are measured at fair value at the inception and subsequently at amortised cost or at fair
value based on their classification. Under I-GAAP the financial assets and liabilities were measured at cost net of allowance.
G. Deferred tax under Ind AS has been recognised for temporary differences between tax base and the book base of the relevant
assets and liabilities. Under I-GAAP the deferred tax was accounted based on timing differences impacting the profit or loss for the
period.
H. The provision is made against trade receivables/loans based on “expected credit loss” model as per Ind AS 109. Under I-GAAP the
provision was made when the receivable/loan turned doubtful/non performing asset based on the assessment on case to case basis
and applicable regulations.
I. ESOP charge is accounted using fair value method. Under I-GAAP, ESOP charge was calculated based on intrinsic value method.
J. Pursuant to Ind AS 32, Foreign Currency Convertible Bonds (FCCB) issued by the Parent Company is split into equity and liability
component and presented accordingly. The measurement of liability component is done at fair value at the inception and
subsequently at amortised cost. Under I-GAAP, FCCB was accounted at cost and presented as borrowing.
K. Provision is made under Ind AS towards constructive obligations of the Group related to payment of performance linked rewards
to the employees and tax on ESOP benefits, wherever applicable. Under I-GAAP the cost was recognised on actual payments.
L. Under Ind AS, the final dividend including related tax is recognised in the period in which the obligation to pay is established on its
approval, post reporting of financial statements. Under I-GAAP, a provision was required to be made in the financial statements for
the proposed final dividend in the period to which the liability related.
Notes forming part of the Consolidated Financial Statements (contd.)
NOTE [63] (contd.)

468
M. Change in fair value of derivative instrument taken to hedge off-balance sheet item is accounted in the hedge reserve. Under
I-GAAP the premium on these derivative instrument was recognised on accrual basis in the Statement of Profit and Loss under the
respective line items to which the hedges related.
N. Past service cost arising out of modifications in the post-retirement benefits is recognised in the Statement of Profit and Loss
pursuant to Ind AS 19. Under I-GAAP the past service was amortised over a period.
O. Actuarial gains and losses pertaining to defined benefit obligations and re-measurement pertaining to return on plan assets are
recognised in OCI in accordance with Ind AS 19 and are not reclassified to the Statement of Profit and Loss. Further, there are
certain other items (as presented in OCI) that are accounted in OCI and subsequently reclassified to Profit and Loss in accordance
with Ind AS requirements.
P. Preference Share Capital has been classified as financial liability as per Ind AS 32. The preference shares issued outside the group,
were recognised as minority interests under I-GAAP. The minority interest is called non-controlling interest under Ind AS.
Q. Goodwill attributable to Cash Generating Units (CGUs) disposed of has been written down as per Ind AS 36. Under I-GAAP the
same was measured at the portfolio level and was not being written down for disposal of CGUs within the overall portfolio.
R. Additional construction services revenue recognised for service concession arrangement as per Ind AS 11 for Design-Build-Finance-
Operate-Transfer (DBFOT) contracts with corresponding recognition of construction cost.
S. Impact of consolidation of a Trust Fund as per Ind AS 110.
T. With respect of clarification dated May 15, 2017 issued by Ind AS Transition Facilitation Group, deferred tax liability has been
provided by Parent Company if it is probable that the accumulated undistributed profits will be distributed in foreseeable future
from subsidiary company.
U. Part stake divestment in a subsidiary which does not result in ceding of control, is accounted as transaction between Parent
Company and the non-controlling interest under Ind AS. Accordingly the gain or loss on part stake sale is recognised directly under
equity and not accounted through the Statement of Profit and Loss.
V. As per Ind AS 12, unused tax credits like MAT Credit entitlement is considered as Deferred Tax.
W. The previous year I-GAAP figures have been reclassified/regrouped to make them comparable with Ind AS presentation.
Notes forming part of the Consolidated Financial Statements (contd.)
NOTE [63] (contd.)

Technology Leadership
Strength for Peace
Regd. Offi ce: Larsen & Toubro Limited, L&T House, N. M. Marg, Ballard Estate, Mumbai - 400 001, INDIA CIN: L99999MH1946PLC004768
Technology I Engineering I Projects Construction I Manufacturing
L&T partners the nation, industry and people to build a newer, brighter future. In critical sectors, such as defence, we provide
the technology as well as the engineering and construction expertise to transform vision into reality.
www.Larsentoubro.com

470
NOTES

471
Statement containing salient features of the financial statements of
subsidiaries/associate companies/joint venturesPart A: “Subsidiaries” [as per Section 2(87) of the Companies Act, 2013] v crore
Sr. No. 1 2 3 4 5 6 7 8 Sr. no.
Particulars L&T Cutting Tools
Limited
Bhilai Power Supply
Company Limited
Spectrum Infotech Private Limited
LTH Milcom Private Limited
L&T Shipbuilding
Limited
L&T Electricals
and Automation
Limited
Hi-Tech Rock
Products & Aggregates
Limited
L&T Seawoods
Limited
Financial year ending on 31-Mar-17 31-Mar-17 31-Mar-17 31-Mar-17 31-Mar-17 31-Mar-17 31-Mar-17 31-Mar-17Currency – – – – – – – – Exchange rate on the last day of financial year
– – – – – – – –
Date of Acquisition 18-Sep-52 11-Jul-95 23-Jun-95 17-Aug-15 13-Nov-07 12-Dec-07 01-Jan-08 13-Mar-081 Share capital (including share application
money pending allotment) 6.80 0.05 0.44 0.20 444.00 7.44 0.05 1999.55
2 Other equity/Reserves and surplus (as applicable)
35.60 – 16.09 (0.11) (1273.40) (0.90) 9.16 1211.39
3 Liabilities 31.91 8.81 14.37 0.02 4077.29 0.70 59.61 212.48
4 Total equity and liabilities 74.31 8.86 30.90 0.11 3247.89 7.24 68.82 3423.42
5 Total assets 74.31 8.86 30.90 0.11 3247.89 7.24 68.82 3423.42
6 Investments 9.86 – 2.51 – 10.44 – – 556.18
7 Turnover 167.93 – 16.20 – 621.05 – 169.73 1170.22
8 Profit before taxation 25.02 – (1.05) (0.02) (349.69) (0.89) 7.65 40.92
9 Provision for taxation 8.90 – (0.19) – (1.35) – 2.76 8.79
10 Profit after taxation 16.12 – (0.86) (0.02) (348.34) (0.89) 4.89 32.13
11 Interim dividend - equity (8.16) – – – – – – –
12 Interim dividend - preference – – – – – – – –
13 Proposed dividend - equity – – – – – – – –
14 Proposed dividend - preference – – – – – – – –
15 % of share holding 100.00 99.90 100.00 – 97.00 100.00 100.00 100.00
Sr. No. 9 10 11 12 13 14 15 16
Sr. no.
Particulars Kesun Iron and Steel Company
Private Limited
EWAC Alloys
Limited
L&T Valves Limited
L&T Realty Limited
Chennai Vision
Developers Private Limited
L&T Vision Ventures
Limited
L&T Power Limited
L&T Cassidian
Limited
Financial year ending on 31-Mar-17 31-Mar-17 31-Mar-17 31-Mar-17 31-Mar-17 31-Mar-17 31-Mar-17 31-Mar-17
Currency – – – – – – – –
Exchange rate on the last day of financial year
– – – – – – – –
Date of Acquisition 16-Jan-09 04-Apr-62 23-Nov-61 30-Nov-07 14-Aug-08 22-Dec-06 09-Mar-06 15-Apr-11
1 Share capital (including share application money pending allotment)
0.01 8.29 18.00 47.16 0.01 0.05 0.05 0.05
2 Other equity/Reserves and surplus (as applicable)
(0.27) 87.39 585.58 1018.80 (0.01) (4.67) 4.79 (0.02)
3 Liabilities 0.28 60.82 939.86 31.51 0.01 10.86 0.09 0.00
4 Total equity and liabilities 0.02 156.50 1543.44 1097.47 0.01 6.24 4.93 0.03
5 Total assets 0.02 156.50 1543.44 1097.47 0.01 6.24 4.93 0.03
6 Investments – 2.50 21.83 868.60 – – 4.84 –
7 Turnover – 210.38 1503.19 313.68 – – – –
8 Profit before taxation (0.01) 52.34 187.48 259.17 0.01 (0.02) 0.20 (0.00)
9 Provision for taxation – 17.36 66.94 (59.52) – – – –
10 Profit after taxation (0.01) 34.98 120.54 318.69 0.01 (0.02) 0.20 (0.00)
11 Interim dividend - equity – (28.20) (27.00) – – – – –
12 Interim dividend - preference – – – – – – – –
13 Proposed dividend - equity – – – – – – – –
14 Proposed dividend - preference – – – – – – – –
15 % of share holding 95.00 100.00 100.00 100.00 100.00 68.00 99.99 74.00

472
Sr. No. 17 18 19 20 21 22 23 24 Sr. no.
Particulars L&T Aviation Services Private Limited
Larsen & Toubro
Infotech Limited
L&T Finance Holdings
Limited *$
L&T Housing Finance
Limited $
L&T Finance Limited$ (formerly known as
Family Credit Limited)
L&T Capital Markets Limited
L&T Investment
Management Limited $
L&T Mutual Fund Trustee
Limited
Financial year ending on 31-Mar-17 31-Mar-17 31-Mar-17 31-Mar-17 31-Mar-17 31-Mar-17 31-Mar-17 31-Mar-17Currency – – – – – – – – Exchange rate on the last day of financial year
– – – – – – – –
Date of Acquisition 06-Nov-09 23-Dec-96 01-May-08 31-Aug-94 22-Nov-94 07-Feb-13 25-Apr-96 30-Apr-961 Share capital (including share application
money pending allotment) 45.60 17.07 3087.19 129.65 1440.05 49.75 251.82 0.15
2 Other equity/Reserves and surplus (as applicable)
(9.21) 2959.83 2236.54 675.63 5439.34 (34.17) 212.81 1.44
3 Liabilities 52.56 1236.00 1054.03 8010.96 29097.44 11.07 53.17 0.05 4 Total equity and liabilities 88.95 4212.90 6377.76 8816.25 35976.83 26.65 517.80 1.64 5 Total assets 88.95 4212.90 6377.76 8816.25 35976.83 26.65 517.80 1.64 6 Investments – 1231.03 5644.17 435.50 3096.97 5.12 109.37 1.33 7 Turnover 25.36 6182.90 277.58 948.42 4082.05 49.66 345.94 0.05 8 Profit before taxation (9.70) 1184.16 245.11 210.21 28.42 4.32 (25.81) 0.01 9 Provision for taxation (2.71) 246.60 (3.55) 73.80 12.38 (1.46) – (0.01)10 Profit after taxation (6.99) 937.56 248.66 136.41 16.04 5.78 (25.81) 0.02 11 Interim dividend - equity – (160.96) – – (140.33) – – – 12 Interim dividend - preference – – – – – – – – 13 Proposed dividend - equity – – (140.33) – – – – – 14 Proposed dividend - preference – – – – – – – – 15 % of share holding 100.00 84.28 66.62 66.62 66.62 66.62 66.62 66.62
Sr. No. 25 26 27 28 29 30 31 32 Sr. no.
Particulars L&T Infrastructure
Finance Company Limited$
L&T Infra Debt Fund
Limited$
L&T Infra Investment
Partners Advisory
Private Limited
L&T Infra Investment
Partners Trustee Private Limited
L&T Financial Consultants
Limited (formerly
known as L&T Vrindavan Properties
Limited)
L&T Access Distribution
Services Limited
Mudit Cement Private Limited
L&T Capital Company
Limited
Financial year ending on 31-Mar-17 31-Mar-17 31-Mar-17 31-Mar-17 31-Mar-17 31-Mar-17 31-Mar-17 31-Mar-17Currency – – – – – – – – Exchange rate on the last day of financial year
– – – – – – – –
Date of Acquisition 18-Apr-06 19-Mar-13 30-May-11 12-Aug-11 16-Jun-11 29-Nov-11 01-Nov-90 06-Apr-001 Share capital (including share application
money pending allotment) 892.09 575.97 5.00 0.10 18.75 21.35 2.10 0.05
2 Other equity/Reserves and surplus (as applicable)
1988.76 232.95 8.05 (0.05) 87.71 (18.18) (15.74) 10.00
3 Liabilities 21983.82 3404.19 2.15 0.03 406.88 0.05 53.11 6.81 4 Total equity and liabilities 24864.67 4213.11 15.20 0.08 513.34 3.22 39.48 16.86 5 Total assets 24864.67 4213.11 15.20 0.08 513.34 3.22 39.48 16.86 6 Investments 2502.84 – 13.35 0.07 4.26 0.75 – 7.74 7 Turnover 2648.06 302.99 11.88 0.03 45.49 (0.04) – 2.17 8 Profit before taxation 18.92 94.11 7.54 0.00 (8.17) (0.90) (4.81) 3.04 9 Provision for taxation (23.29) – 2.67 0.00 (24.84) 0.04 0.68 0.69 10 Profit after taxation 42.21 94.11 4.87 0.00 16.67 (0.94) (5.49) 2.35 11 Interim dividend - equity (86.00) – – – – – – – 12 Interim dividend - preference – – – – – – – – 13 Proposed dividend - equity – – – – – – – – 14 Proposed dividend - preference – – – – – – – – 15 % of share holding 66.62 66.62 66.62 66.62 66.62 66.62 66.62 100.00
Note: * Share capital (including share application money pending allotment) includes money received against share warrants. $ Reporting as per the Companies (Accounting Standards) Rules 2006 (I-GAAP)
Statement containing salient features of the financial statements of
subsidiaries/associate companies/joint venturesPart A: “Subsidiaries” [as per Section 2(87) of the Companies Act, 2013] (contd.) v crore

473
Sr. No. 33 34 35 36 37 38 39 40 Sr. no.
Particulars L&T Trustee Company
Private Limited
L&T Power Development
Limited
L&T Uttaranchal
Hydropower Limited
L&T Arunachal
Hydropower Limited
L&T Himachal Hydropower
Limited
Nabha Power Limited
L&T Metro Rail
(Hyderabad) Limited
L&T Technology
Services Limited
Financial year ending on 31-Mar-17 31-Mar-17 31-Mar-17 31-Mar-17 31-Mar-17 31-Mar-17 31-Mar-17 31-Mar-17Currency – – – – – – – – Exchange rate on the last day of financial year
– – – – – – – –
Date of Acquisition 09-Jul-09 12-Sep-07 13-Nov-06 24-Jun-10 22-Jun-10 09-Apr-07 24-Aug-10 14-Jun-121 Share capital (including share application
money pending allotment) 0.01 3112.70 161.05 40.28 198.13 2325.00 2068.55 20.34
2 Other equity/Reserves and surplus (as applicable)
(0.02) 3.17 702.24 0.20 (0.27) 573.75 (30.85) 1511.19
3 Liabilities 0.01 2.09 28.83 0.15 0.87 8040.91 9817.11 538.67
4 Total equity and liabilities 0.00 3117.96 892.12 40.63 198.73 10939.66 11854.81 2070.20
5 Total assets 0.00 3117.96 892.12 40.63 198.73 10939.66 11854.81 2070.20
6 Investments – 3109.31 1.49 0.03 – – 239.02 198.76
7 Turnover – 8.40 – – – 3518.36 1562.94 3112.54
8 Profit before taxation (0.00) 0.29 0.04 (0.00) (0.00) 7.30 3.54 599.64
9 Provision for taxation – 0.10 0.04 0.00 0.00 33.41 0.72 150.63
10 Profit after taxation (0.00) 0.19 (0.00) (0.00) (0.00) (26.11) 2.82 449.01
11 Interim dividend - equity – – – – – – – (80.85)
12 Interim dividend - preference – – – – – – – (9.66)
13 Proposed dividend - equity – – – – – – – –
14 Proposed dividend - preference – – – – – – – –
15 % of share holding 100.00 100.00 100.00 100.00 100.00 100.00 100.00 89.77
Sr. No. 41 42 43 44 45 46 47 48
Sr. no.
Particulars L&T Construction
Equipment Limited
L&T Infrastructure
Engineering Limited
L&T Thales Technology
Services Private Limited
Sahibganj Ganges Bridge-
Company Private Limited
Seawoods Retail Private
Limited
Seawoods Realty Private
Limited
L&T Hydrocarbon Engineering
Limited
Marine Infrastructure
Developer Private Limited
Financial year ending on 31-Mar-17 31-Mar-17 31-Mar-17 31-Mar-17 31-Mar-17 31-Mar-17 31-Mar-17 31-Mar-17
Currency – – – – – – – –
Exchange rate on the last day of financial year
– – – – – – – –
Date of Acquisition 29-Jul-97 09-Feb-98 04-Apr-06 14-Jul-16 02-Sep-16 23-Aug-16 02-Apr-09 22-Jan-16
1 Share capital (including share application money pending allotment)
120.00 3.60 2.05 0.01 0.01 0.01 1000.05 400.00
2 Other equity/Reserves and surplus (as applicable)
110.14 35.40 (4.77) (0.01) (0.01) (0.01) 545.62 2.76
3 Liabilities 351.80 26.61 39.16 0.01 0.01 0.01 4931.25 1541.15
4 Total equity and liabilities 581.94 65.61 36.44 0.01 0.01 0.01 6476.92 1943.91
5 Total assets 581.94 65.61 36.44 0.01 0.01 0.01 6476.92 1943.91
6 Investments 8.96 – 1.94 – – – 1568.86 –
7 Turnover 521.74 56.65 61.53 – – – 8786.61 98.64
8 Profit before taxation (5.16) 7.61 0.48 (0.01) (0.01) (0.01) 703.36 (35.92)
9 Provision for taxation 1.71 0.27 (0.08) – – – 267.04 (38.56)
10 Profit after taxation (6.87) 7.34 0.56 (0.01) (0.01) (0.01) 436.32 2.64
11 Interim dividend - equity – – – – – – – –
12 Interim dividend - preference – – – – – – – –
13 Proposed dividend - equity – – – – – – – –
14 Proposed dividend - preference – – – – – – – –
15 % of share holding 100.00 100.00 66.43 100.00 100.00 100.00 100.00 97.00
Statement containing salient features of the financial statements of
subsidiaries/associate companies/joint venturesPart A: “Subsidiaries” [as per Section 2(87) of the Companies Act, 2013] (contd.) v crore

474
Sr. No. 49 50 51 52 53 54 55 56 Sr. no.
Particulars AugmentIQ Data Sciences
Private Limited
Larsen & Toubro LLC
Larsen & Toubro
Infotech, GmbH
Larsen & Toubro
Infotech Canada Limited
Larsen & Toubro
Infotech LLC
L&T Infotech Financial Services
Technologies Inc.
Larsen & Toubro
Infotech South Africa
(PTY) Limited
L&T Information Technology
Services (Shanghai)
Co., Ltd. Financial year ending on 31-Mar-17 31-Mar-17 31-Mar-17 31-Mar-17 31-Mar-17 31-Mar-17 31-Mar-17 31-Dec-16Currency – USD EURO CAD USD CAD ZAR CNY Exchange rate on the last day of financial year
– 64.85 69.29 48.59 64.85 48.59 4.85 9.78
Date of Acquisition 27-Nov-12 02-Jan-01 14-Jun-99 25-Apr-00 21-Jul-09 01-Jan-11 25-Jul-12 28-Jun-131 Share capital (including share application
money pending allotment) 1.10 0.34 0.17 0.00 – 303.70 0.22 1.05
2 Other equity/Reserves and surplus (as applicable)
(0.01) 2.06 27.75 7.25 11.45 35.69 2.58 (1.27)
3 Liabilities 3.93 0.92 17.40 7.90 0.56 54.94 8.42 1.99
4 Total equity and liabilities 5.02 3.31 45.32 15.15 12.01 394.33 11.22 1.77
5 Total assets 5.02 3.31 45.32 15.15 12.01 394.33 11.22 1.77
6 Investments – – – – – – – –
7 Turnover 4.91 3.32 92.12 88.94 9.35 258.97 30.83 1.83
8 Profit before taxation (0.28) 0.04 3.73 3.62 0.45 54.81 1.09 (0.44)
9 Provision for taxation (0.09) 0.02 1.58 0.89 – 15.43 0.32 –
10 Profit after taxation (0.19) 0.02 2.15 2.73 0.45 39.38 0.77 (0.44)
11 Interim dividend - equity – – – (5.10) – (8.80) – –
12 Interim dividend - preference – – – – – – – –
13 Proposed dividend - equity – – – – – – – –
14 Proposed dividend - preference – – – – – – – –
15 % of share holding 84.28 100.00 84.28 84.28 84.28 84.28 63.12 84.28
Sr. No. 57 58 59 60 61 62 63 64 Sr. no.
Particulars L&T Realty FZE
Larsen & Toubro
International FZE
Larsen & Toubro
Hydrocarbon International
Limited LLC
Thalest Limited
Servowatch Systems Limited
L&T Modular Fabrication
Yard LLC
Larsen & Toubro (East
Asia) SDN.BHD
Larsen & Toubro Qatar
LLC
Financial year ending on 31-Mar-17 31-Mar-17 31-Dec-16 31-Mar-17 31-Mar-17 31-Dec-16 31-Mar-15 31-Dec-16Currency AED USD SAR GBP GBP OMR MYR QAR Exchange rate on the last day of financial year
17.66 64.85 18.11 80.90 80.90 176.43 16.88 18.65
Date of Acquisition 27-Jan-08 25-Sep-01 17-Jun-13 21-Feb-75 28-Aug-87 05-Jul-06 13-Jun-96 31-Mar-041 Share capital (including share application
money pending allotment) 15.89 1779.16 0.91 1.08 20.63 50.89 1.27 0.37
2 Other equity/Reserves and surplus (as applicable)
(5.84) (312.12) (1.31) 6.11 (39.26) (59.89) (0.64) 0.24
3 Liabilities 0.08 123.93 6.03 – 50.39 278.11 4.91 0.89
4 Total equity and liabilities 10.14 1590.97 5.63 7.19 31.76 269.11 5.54 1.50
5 Total assets 10.14 1590.97 5.63 7.19 31.76 269.11 5.54 1.50
6 Investments – 664.48 – – – – – 0.70
7 Turnover – 12.13 – – 35.81 455.97 2.31 –
8 Profit before taxation 0.12 (33.56) (0.35) 0.27 (14.73) 6.70 (0.39) (0.08)
9 Provision for taxation – – – (0.06) – – – –
10 Profit after taxation 0.12 (33.56) (0.35) 0.33 (14.73) 6.70 (0.39) (0.08)
11 Interim dividend - equity – – – – – – – –
12 Interim dividend - preference – – – – – – – –
13 Proposed dividend - equity – – – – – – – –
14 Proposed dividend - preference – – – – – – – –
15 % of share holding 100.00 100.00 100.00 100.00 100.00 65.00 30.00 49.00
Statement containing salient features of the financial statements of
subsidiaries/associate companies/joint venturesPart A: “Subsidiaries” [as per Section 2(87) of the Companies Act, 2013] (contd.) v crore

475
Sr. No. 65 66 67 68 69 70 71 72 Sr. no.
Particulars L&T Overseas Projects
Nigeria Limited
L&T Electricals & Automation
Saudi Arabia Company
Limited LLC
Larsen & Toubro Kuwait
Construction General
Contracting Company, W.L.L
Larsen & Toubro
Readymix & Asphalt Concrete
Industries LLC
Larsen & Toubro (Saudi
Arabia) LLC
Larsen Toubro Arabia LLC
Larsen & Toubro ATCO
Saudia LLC
Tamco Switchgear
(Malaysia) Sdn. Bhd.
Financial year ending on 31-Dec-16 31-Mar-17 31-Dec-16 31-Mar-17 31-Dec-16 31-Dec-16 31-Dec-16 31-Mar-17Currency NGN SAR KWD AED SAR SAR SAR MYR Exchange rate on the last day of financial year
0.22 17.29 221.87 17.66 18.11 18.11 18.11 14.65
Date of Acquisition 15-Jul-04 22-Aug-06 29-Nov-06 27-Jun-06 22-Jun-99 01-Jul-12 08-Jul-07 29-May-071 Share capital (including share application
money pending allotment) 0.22 31.13 44.37 1.77 26.04 18.11 1.81 146.53
2 Other equity/Reserves and surplus (as applicable)
(0.19) (34.02) (45.13) 15.97 191.37 (347.54) (466.91) 390.13
3 Liabilities 0.02 122.15 27.10 28.52 1670.14 686.11 633.82 258.82
4 Total equity and liabilities 0.05 119.26 26.34 46.26 1887.55 356.68 168.72 795.48
5 Total assets 0.05 119.26 26.34 46.26 1887.55 356.68 168.72 795.48
6 Investments – – – – – – – –
7 Turnover – 62.47 – 94.77 2626.72 619.70 35.25 742.61
8 Profit before taxation – (8.70) (0.49) (9.40) 380.73 (271.02) (17.63) 72.24
9 Provision for taxation – – – – 42.10 – – 10.49
10 Profit after taxation – (8.70) (0.49) (9.40) 338.63 (271.02) (17.63) 61.75
11 Interim dividend - equity – – – – – – – –
12 Interim dividend - preference – – – – – – – –
13 Proposed dividend - equity – – – – – – – –
14 Proposed dividend - preference – – – – – – – –
15 % of share holding 100.00 100.00 49.00 49.00 100.00 75.00 75.00 100.00
Sr. No. 73 74 75 76 77 78 79 80
Sr. no.
Particulars Henikwon Corporation
Sdn. Bhd.
Tamco Electrical
Industries Australia Pty
Ltd.
PT Tamco Indonesia
Larsen & Toubro Heavy
Engineering LLC
L&T Electrical & Automation
FZE
Kana Controls General
Trading & Contracting
Company W.L.L
Larsen & Toubro T&D SA
(Proprietary) Limited
L&T Technology
Services LLC
Financial year ending on 31-Mar-17 31-Mar-17 31-Dec-16 31-Dec-16 31-Mar-17 31-Mar-17 31-Mar-17 31-Mar-17
Currency MYR AUD IDR OMR AED KWD ZAR USD
Exchange rate on the last day of financial year
14.65 49.58 0.01 176.43 17.66 212.80 4.85 64.85
Date of Acquisition 18-May-87 15-Apr-83 27-Mar-92 07-Apr-08 04-Apr-08 10-Sep-13 06-Sep-10 26-Jun-14
1 Share capital (including share application money pending allotment)
9.45 81.67 13.32 99.95 1.77 2.13 3.64 0.06
2 Other equity/Reserves and surplus (as applicable)
(18.65) (70.34) (51.56) (7.36) 116.76 (3.03) (1.02) (45.10)
3 Liabilities 21.75 8.04 104.55 266.70 219.76 22.36 0.28 132.74
4 Total equity and liabilities 12.55 19.37 66.31 359.29 338.29 21.46 2.90 87.70
5 Total assets 12.55 19.37 66.31 359.29 338.29 21.46 2.90 87.70
6 Investments – – – – – – – –
7 Turnover 28.17 14.75 47.80 217.29 277.07 43.35 – 159.94
8 Profit before taxation (0.74) (1.83) (7.58) (19.05) (22.02) 0.35 0.14 (20.59)
9 Provision for taxation – – – 1.88 – – – 3.61
10 Profit after taxation (0.74) (1.83) (7.58) (20.93) (22.02) 0.35 0.14 (24.20)
11 Interim dividend - equity – – – – – – – –
12 Interim dividend - preference – – – – – – – –
13 Proposed dividend - equity – – – – – – – –
14 Proposed dividend - preference – – – – – – – –
15 % of share holding 100.00 100.00 100.00 70.00 100.00 49.00 72.50 89.77
Statement containing salient features of the financial statements of
subsidiaries/associate companies/joint venturesPart A: “Subsidiaries” [as per Section 2(87) of the Companies Act, 2013] (contd.) v crore

476
Sr. No. 81 82 83 84 85 86 87 88 Sr. no.
Particulars L&T Infotech Austria GMBH
LLC
L&T Global Holdings
Limited
L&T Information Technology
Spain SL
Larsen & Toubro
(Oman) LLC
L&T-Sargent and Lundy Limited #
L&T-Gulf Private
Limited #
L&T-MHPS Boilers Private
Limited #
L&T-MHPS Turbine
Generators Private
Limited # Financial year ending on 31-Mar-17 31-Mar-17 31-Mar-17 31-Dec-16 31-Mar-17 31-Mar-17 31-Mar-17 31-Mar-17Currency EURO USD EURO OMR – – – – Exchange rate on the last day of financial year
69.29 64.85 69.29 176.43 – – – –
Date of Acquisition 18-Jun-15 24-Feb-16 01-Feb-16 29-Jan-94 05-May-95 11-Jan-08 09-Oct-06 27-Dec-061 Share capital (including share application
money pending allotment) 0.24 51.88 0.35 25.71 5.57 8.00 234.10 710.60
2 Other equity/Reserves and surplus (as applicable)
0.24 (35.78) 1.39 269.63 49.79 15.55 695.78 (527.74)
3 Liabilities 0.37 1812.59 21.32 3317.60 35.62 8.29 2892.74 2403.46
4 Total equity and liabilities 0.85 1828.69 23.06 3612.94 90.98 31.84 3822.62 2586.32
5 Total assets 0.85 1828.69 23.06 3612.94 90.98 31.84 3822.62 2586.32
6 Investments 0.00 1112.32 – – 37.78 0.70 687.37 39.10
7 Turnover 6.07 – 65.78 3704.49 112.51 20.61 2490.66 910.26
8 Profit before taxation 0.39 (36.42) 2.06 15.23 3.83 3.48 332.13 19.51
9 Provision for taxation 0.08 – 0.51 0.01 1.05 1.40 110.85 25.45
10 Profit after taxation 0.31 (36.42) 1.55 15.22 2.78 2.08 221.28 (5.94)
11 Interim dividend - equity – – – – – – – –
12 Interim dividend - preference – – – – – – – –
13 Proposed dividend - equity – – – – – – – –
14 Proposed dividend - preference – – – – – – – –
15 % of share holding 84.28 100.00 84.28 65.00 50.0001 50.0002 51.00 51.00
Sr. No. 89 90 91 92 93 94 95 96 Sr. no.
Particulars Raykal Aluminium
Company Private
Limited #
L&T Special Steels and
Heavy Forgings
Private Limited #
L&T Howden Private
Limited #
L&T Sapura Offshore
Private Limited #
L&T Kobelco Machinery
Private Limited #
Larsen and Toubro
Electromech LLC #
L&T Sapura Shipping
Private Limited #
L&T Infrastructure Development
Projects Limited #$
Financial year ending on 31-Mar-17 31-Mar-17 31-Mar-17 31-Mar-17 31-Mar-17 31-Dec-16 31-Mar-17 31-Mar-17Currency – – – – – OMR – – Exchange rate on the last day of financial year
– – – – – 176.43 – –
Date of Acquisition 23-Feb-99 01-Jul-09 17-Jun-10 02-Sep-10 25-Nov-10 01-Jan-05 02-Sep-10 26-Feb-011 Share capital (including share application
money pending allotment) 0.05 566.60 30.00 0.01 50.00 5.29 158.85 2321.06
2 Other equity/Reserves and surplus (as applicable)
0.33 (1207.69) 28.07 0.64 (13.86) (12.65) 303.88 2443.73
3 Liabilities 0.59 2193.08 136.53 9.94 59.72 224.35 394.60 1045.10
4 Total equity and liabilities 0.97 1551.99 194.60 10.59 95.86 216.99 857.33 5809.89
5 Total assets 0.97 1551.99 194.60 10.59 95.86 216.99 857.33 5809.89
6 Investments – – – – – – – 3371.70
7 Turnover – 129.96 157.10 – 44.10 142.49 138.77 571.20
8 Profit before taxation (0.03) (254.65) 30.52 0.07 0.32 (50.62) 26.13 (284.83)
9 Provision for taxation – – 11.89 0.29 (0.31) 1.83 0.58 (62.61)
10 Profit after taxation (0.03) (254.65) 18.63 (0.22) 0.63 (52.45) 25.55 (222.22)
11 Interim dividend - equity – – – – – – – –
12 Interim dividend - preference – – – – – – – –
13 Proposed dividend - equity – – – – – – – –
14 Proposed dividend - preference – – – – – – – –
15 % of share holding 75.50 74.00 50.10 60.00 51.00 65.00 60.00 97.45
Note: # Refer Note 54(a). $ Reporting as per the Companies (Accounting Standards) Rules 2006 (I-GAAP)
Statement containing salient features of the financial statements of
subsidiaries/associate companies/joint venturesPart A: “Subsidiaries” [as per Section 2(87) of the Companies Act, 2013] (contd.) v crore

477
Sr. No. 97 98 99 100 101 102 103 104 Sr. no.
Particulars Panipat Elevated Corridor
Limited #
Krishnagiri Thopur
Toll Road Limited #
Western Andhra
Tollways Limited #
Vadodara Bharuch Tollway
Limited #
L&T Interstate
Road Corridor Limited #
L&T Western India
Tollbridge Limited #
L&T Transportation Infrastructure
Limited #
L&T Krishnagiri Walajahpet
Tollway Limited #
Financial year ending on 31-Mar-17 31-Mar-17 31-Mar-17 31-Mar-17 31-Mar-17 31-Mar-17 31-Mar-17 31-Mar-17Currency – – – – – – – – Exchange rate on the last day of financial year
– – – – – – – –
Date of Acquisition 21-Jul-05 02-Nov-05 02-Nov-05 23-Dec-05 02-Feb-06 20-May-99 24-Sep-97 23-Apr-101 Share capital (including share application
money pending allotment) 84.30 78.75 56.50 43.50 57.16 13.95 41.40 90.00
2 Other equity/Reserves and surplus (as applicable)
(323.52) (156.13) (84.59) (304.91) 47.59 19.71 143.28 13.16
3 Liabilities 497.97 502.40 254.84 1051.78 329.16 70.84 69.57 999.85
4 Total equity and liabilities 258.75 425.02 226.75 790.37 433.91 104.50 254.25 1103.01
5 Total assets 258.75 425.02 226.75 790.37 433.91 104.50 254.25 1103.01
6 Investments – 35.41 41.21 187.92 123.68 – 156.08 1.24
7 Turnover 58.45 132.90 66.69 265.86 48.05 – 25.08 133.54
8 Profit before taxation (37.84) 21.06 10.02 22.31 12.60 1.25 14.17 (25.07)
9 Provision for taxation – 0.65 0.19 4.60 3.93 0.38 (12.92) 0.27
10 Profit after taxation (37.84) 20.41 9.83 17.71 8.67 0.87 27.09 (25.34)
11 Interim dividend - equity – – – – – – – –
12 Interim dividend - preference – – – – – – – –
13 Proposed dividend - equity – – – – – – – –
14 Proposed dividend - preference – – – – – – – –
15 % of share holding 97.45 97.45 97.45 97.45 97.45 97.45 98.12 97.45
Sr. No. 105 106 107 108 109 110 111 112 Sr. no.
Particulars Devihalli Hassan Tollway
Limited #
L&T Halol Shamlaji Tollway
Limited #
Ahmedabad-Maliya
Tollway Limited #
L&T Port Kachchigarh
Limited #
L&T BPP Tollway
Limited #
L&T Samakhiali
Gandhidham Tollway
Limited #
L&T Deccan Tollways
Limited #
Kudgi Transmission
Limited #
Financial year ending on 31-Mar-17 31-Mar-17 31-Mar-17 31-Mar-17 31-Mar-17 31-Mar-17 31-Mar-17 31-Mar-17Currency – – – – – – – –
Exchange rate on the last day of financial year
– – – – – – – –
Date of Acquisition 27-Apr-10 09-Sep-08 09-Sep-08 30-Apr-08 25-May-11 05-Feb-10 20-Dec-11 30-Aug-131 Share capital (including share application
money pending allotment) 90.00 796.34 149.00 4.16 247.20 80.54 218.84 192.60
2 Other equity/Reserves and surplus (as applicable)
(25.97) (317.27) (44.95) (4.62) (246.54) (75.60) (2.52) 78.03
3 Liabilities 307.31 702.77 1256.19 5.46 4742.95 1672.31 886.70 2699.67
4 Total equity and liabilities 371.34 1181.84 1360.24 5.00 4743.61 1677.25 1103.02 2970.30
5 Total assets 371.34 1181.84 1360.24 5.00 4743.61 1677.25 1103.02 2970.30
6 Investments 2.37 – – – 46.55 – 2.25 –
7 Turnover 50.64 74.01 177.01 – 307.46 158.25 292.16 271.72
8 Profit before taxation (3.52) (189.56) (51.48) (0.02) (291.19) (107.05) (0.33) 29.95
9 Provision for taxation – – – – – – – 8.92
10 Profit after taxation (3.52) (189.56) (51.48) (0.02) (291.19) (107.05) (0.33) 21.03
11 Interim dividend - equity – – – – – – – –
12 Interim dividend - preference – – – – – – – –
13 Proposed dividend - equity – – – – – – – –
14 Proposed dividend - preference – – – – – – – –
15 % of share holding 97.45 47.75 97.45 97.45 97.45 97.45 97.45 97.45
Note: # Refer Note 54(a).
Statement containing salient features of the financial statements of
subsidiaries/associate companies/joint venturesPart A: “Subsidiaries” [as per Section 2(87) of the Companies Act, 2013] (contd.) v crore

478
Sr. No. 113 114 115 116 117
Sr. no.
Particulars L&T Sambalpur - Rourkela
Tollway Limited #
L&T IDPL Trustee
Manager Pte. Ltd. #
PNG Tollway
Limited #
L&T Rajkot-Vadinar Tollway
Limited #
L&T Chennai -
Tada Tollway Limited #
Financial year ending on 31-Mar-17 31-Mar-17 31-Mar-17 31-Mar-17 31-Mar-17
Currency – SGD – – –
Exchange rate on the last day of financial year – 46.41 – – –
Date of Acquisition 18-Oct-13 30-Sep-13 16-Feb-09 08-Sep-08 24-Mar-08
1 Share capital (including share application money pending allotment) 290.03 6.10 169.10 110.00 42.00
2 Other equity/Reserves and surplus (as applicable) (2.97) (5.42) (455.67) (122.56) (5.06)
3 Liabilities 850.71 0.06 1473.96 980.61 382.75
4 Total equity and liabilities 1137.77 0.74 1187.39 968.05 419.69
5 Total assets 1137.77 0.74 1187.39 968.05 419.69
6 Investments 22.82 – – – –
7 Turnover 545.31 – – 93.45 –
8 Profit before taxation (0.53) (0.16) (220.52) (58.02) (4.86)
9 Provision for taxation – – – – –
10 Profit after taxation (0.53) (0.16) (220.52) (58.02) (4.86)
11 Interim dividend - equity – – – – –
12 Interim dividend - preference – – – – –
13 Proposed dividend - equity – – – – –
14 Proposed dividend - preference – – – – –
15 % of share holding 97.45 97.45 72.11 97.45 97.45
Note: # Refer Note 54(a).
Statement containing salient features of the financial statements of
subsidiaries/associate companies/joint venturesPart A: “Subsidiaries” [as per Section 2(87) of the Companies Act, 2013] (contd.) v crore

479
Statement containing salient features of the financial statements of
subsidiaries/associate companies/joint ventures
Part B:” Associates/Joint ventures” [as per Section 2(6) of the Companies Act, 2013]
Sr
No.
Sr. No. 1 2 3 4 5
Particulars Feedback Infra
Private Limited
L&T- Chiyoda
Limited
International
Seaports
(Haldia)
Private Limited
L&T Camp
Facilities LLC
L&T Qatar
& HBK
Contracting
LLC
1 Latest audited Balance Sheet Date 31-Mar-17 31-Mar-17 31-Mar-16 31-Dec-16 31-Dec-16
2 Shares of Associate/Joint Ventures held by the
company at the year end
Number 37,90,000 45,00,000 98,30,000 2,450 100
Amount of Investment in Associates/Joint Venture
(v crore)
37.90 4.50 9.83 4.33 0.18
Total No of shares 1,63,61,704 90,00,000 4,40,58,020 5,000 200
Extent of Holding % 15.42% 50.00% 21.74% 49.00% 50.00%
3 Description of how there is significant influence Refer Note 1
4 Reason why the associate/joint venture is not
consolidated
5 Net worth attributable to Shareholding as per latest
audited Balance Sheet (v crore) 15.65 43.85 14.32 3.04 (3.51)
6 Profit / (Loss) for the year (v crore)
Considered in Consolidation 24.54 7.79 3.34 2.46 0.02
Not Considered in Consolidation – – – – –

480
Statement containing salient features of the financial statements of
subsidiaries/associate companies/joint venturesPart B:” Associates/Joint ventures” [as per Section 2(6) of the Companies Act, 2013] (contd.)
Sr
No.
Sr. No. 6 7 8 9
Particulars Magtorq
Private Limited
Indiran
Engineering
Projects and
Systems Kish
PJSC
Grameen
Capital India
Limited
Gujarat
Leather
Industries
Limited
1 Latest audited Balance Sheet Date 31-Mar-17 31-Mar-17 31-Mar-15
2 Shares of Associate/Joint Ventures held by the company at the year end
Number 9,000 875 21,26,000 7,35,000
Amount of Investment in Associates/Joint Venture (v crore) 4.42 0.39 2.13 0.56
Total No of shares 21,003 1,750 81,77,887 Refer Note 4
Extent of Holding % 42.85% 50.00% 23.84% 50.00%
3 Description of how there is significant influence Refer Note 1
4 Reason why the associate/joint venture is not consolidated Refer Note 2 Refer Note 3 Refer Note 4
5 Net worth attributable to Shareholding as per latest audited Balance
Sheet (v crore)
4.58 (0.14) – –
6 Profit / (Loss) for the year (v crore)
Considered in Consolidation 0.14 (0.04) – –
Not Considered in Consolidation – – (0.26) –
Notes:
1. Significant influence is demonstrated by holding 20% or more of the voting power of the investee.
2. The Incorporated joint venture is not required to be audited as per regulatory laws in Iran. Hence the management certified accounts have been considered
for consolidation.
3. There is restriction on transferring the resources to the share holder and hence the same has not been considered for consolidation
4. The associate company is under liquidation process and investment is fully provided in the accounts.
A. M. NAIK
Group Executive Chairman (DIN 00001514)
R. SHANKAR RAMAN M. DAMODARAN M.M.CHITALEChief Financial Officer & Whole -time Director
(DIN 02106990) (DIN 00101004)
(DIN 00019798)
SUBODH BHARGAVA SUNITA SHARMA SUSHOBHAN SARKER(DIN 00035672) (DIN 02949529) (DIN 00088276)
N.HARIHARAN VIKRAM SINGH MEHTA SANJEEV AGACompany Secretary (DIN 00041197) (DIN 00022065)M. No. A3471
DirectorsMumbai, May 29, 2017

481
PROXY FORM
[Pursuant to Section 105(6) of the Companies Act, 2013 and rule 19(3) of the Companies (Management and Administration) Rules 2014]
LARSEN & TOUBRO LIMITEDCIN : L99999MH1946PLC004768
Regd. Office : L&T House, Ballard Estate, Mumbai 400 001.Tel. No.: (022) 6752 5656, Fax No.: (022) 6752 5893
Email: [email protected], Website: www.Larsentoubro.com
Name of the member(s)
Registered Address
Email ID
Folio No./Client ID DP ID
I/We, being the holder(s) of ___________ shares of LARSEN & TOUBRO LIMITED, hereby appoint:
1) of having e-mail id or failing him
2) of having e-mail id or failing him
3) of having e-mail id
and whose signature(s) are appended below as my/our proxy to attend and vote (on a poll) for me/us and on my/our behalf at the Seventy Second Annual General Meeting of the Company, to be held at St. Andrews Auditorium, St. Dominic Road, Bandra (West), Mumbai - 400050 on Tuesday, August 22, 2017 at 3.00 P.M. and at any adjournment thereof in respect of such resolutions as are indicated below:
** I wish my above Proxy to vote in the manner as indicated in the box below:
Item No. Resolutions For Against
1 Adoption of audited financial statements for the year ended March 31, 2017 and the Reports of the Board
of Directors and Auditors thereon and the audited consolidated financial statements of the Company and the
reports of the auditors thereon for the year ended March 31, 2017.
2 Dividend on equity shares for the financial year 2016-17.
3 Appoint Mr. Sushobhan Sarker (DIN: 00088276) as a Director liable to retire by rotation.
4 Appoint Mr. Shailendra Roy (DIN: 02144836) as a Director liable to retire by rotation.
5 Appoint Mr. R. Shankar Raman (DIN: 00019798) as a Director liable to retire by rotation.
6 Re-appoint Mr. Subodh Bhargava (DIN: 00035672) as an Independent Director.
7 Appoint Mr. S.N. Subrahmanyan (DIN: 02255382) as the Chief Executive Officer and Managing Director of the
Company.
8 Appoint Mr. Jayant Damodar Patil (DIN: 01252184) as a Director liable to retire by rotation.
9 Appoint Mr. Arvind Gupta (DIN: 00090360) as a Director liable to retire by rotation.
10 Appoint Mr. Jayant Damodar Patil (DIN: 01252184) as a Whole-time Director of the Company.
11 Raise funds through issue of convertible bonds and/or equity shares through depository receipts and including
by way of Qualified Institution Placement (‘QIP’), to Qualified Institutional Buyers (‘QIB’) for an amount not
exceeding v 4000 Crore or US $ 600 million, whichever is higher.

482
Item No. Resolutions For Against
12 Issue listed/unlisted secured/unsecured redeemable non-convertible debentures, in one or more series/tranches/
currencies, aggregating up to v 6000 crore.
13 Ratification of appointment of M/s. Deloitte Haskins & Sells LLP as Statutory Auditors of the Company.
14 Ratification of remuneration payable to M/s R. Nanabhoy & Co. Cost Accountants (Regn. No. 00010) for the
financial year 2017-18.
Signed this ........................ day of ............... 2017 Signature of shareholder : ..........................................
Signature of proxy holder(s)
Note:
(1) This form of proxy in order to be effective should be duly completed and deposited at the Registered Office of the Company
not less than 48 hours before the commencement of the meeting.
(2) A Proxy need not be a member of the Company.
(3) A person can act as a proxy on behalf of members not exceeding fifty and holding in the aggregate not more than 10% of the total share
capital of the Company carrying voting rights. A member holding more than 10% of the total share capital of the Company carrying
voting rights may appoint a single person as proxy and such person shall not act as a proxy for any other person or shareholder.
**(4) This is only optional. Please put a ‘X’ in the appropriate column against the resolutions indicated in the Box. If you leave the ‘For’ or
‘Against’ column blank against any or all the resolutions, your Proxy will be entitled to vote in the manner as he/she thinks appropriate.
(5) Appointing a proxy does not prevent a member from attending the meeting in person if he/she so wishes.
(6) In the case of jointholders, the signature of any one holder will be sufficient, but names of all the jointholders should be stated.
Affix a
1 Rupee
Revenue
Stamp

483
LARSEN & TOUBRO LIMITEDCIN : L99999MH1946PLC004768
Regd. Office : L&T House, Ballard Estate, Mumbai 400 001.Tel. No.: (022) 6752 5656, Fax No.: (022) 6752 5893
Email: [email protected], Website: www.larsentoubro.com
Shareholder’s Satisfaction Survey Form – 2017
Dear Shareholders,
It has been our constant endeavor to provide best of the services to our valuable shareholders and maintain highest level of Corporate Governance in this Company. In order to further improve shareholder service standards, we seek your inputs through this survey.
We would be grateful, if you could spare your valuable time to fill the questionnaire given below and send it back to us at the Registered Office address mentioned above so that we will be able to implement corrective actions as a requirement of ISO 9001: 2015 standard. Alternatively, a softcopy of the questionnaire can be downloaded from the Investors section on our website www.Larsentoubro.com. The duly filled in questionnaire can be sent by e-mail to [email protected].
Thank You,
N. Hariharan
Company SecretaryM. No. A3471
Name & Address of the ________________________________________________________________________
Shareholder ________________________________________________________________________
________________________________________________________________________
Folio No. / DP ID / Client ID ________________________________________________________________________
Kindly put a tick in relevant columns below.
ATTRIBUTES Please indicate your satisfaction level
Delighted Satisfi ed Dissatisfi ed
Transfer/Transmission/Demat/Remat of Shares
Issue of Duplicate Share Certifi cates
Issue of shares – on demerger/bonus – 2004, 2006, 2008, 2013 & 2017

484
ATTRIBUTES Please indicate your satisfaction level
Delighted Satisfi ed Dissatisfi ed
Issue of duplicate dividend warrants
Dividend through ECS/ Warrants/ Demand Drafts
Responses to queries/complaints
Interaction with Company/ R&T Agent personnel
Presentation of information on Company’s website
Quality and Contents of Annual Report 2016-17
Please give your overall rating of our investor service (1 to 5 where 1 = highly dissatisfi ed and 5 = highly statisfi ed)
Did you fi nd the e-mail id [email protected] for redressal of Investors’ Grievances useful?
YES / NO
Give details of outstanding grievances, if any
Any suggestions ?
Date :
____________________ Signature
Disclaimer: L&T will keep the information provided by you as confi dential and it will not be used in any way that is detrimental to you.

AWARDS & RECOGNITION
Every year, L&T and its people receive a number of national and international awards that
acknowledge its varied accomplishments. Presented by the media, industry associations,
independent bodies and academia, they honour the Company’s contribution in various spheres
of business, technology, fi nancial performance, growth and environmental protection.
For details of recent awards, please visit www.Larsentoubro.com

CBMC/07/2017/RDPPrinted by Burda Druck India Pvt. Ltd.