agarose gel electrophoresis.ppt
DESCRIPTION
ppt presentation about agarose electrophoresisTRANSCRIPT

Agarose Gel Agarose Gel ElectrophoresisElectrophoresis
Agarose Gel ElectrophoresisAgarose Gel Electrophoresis
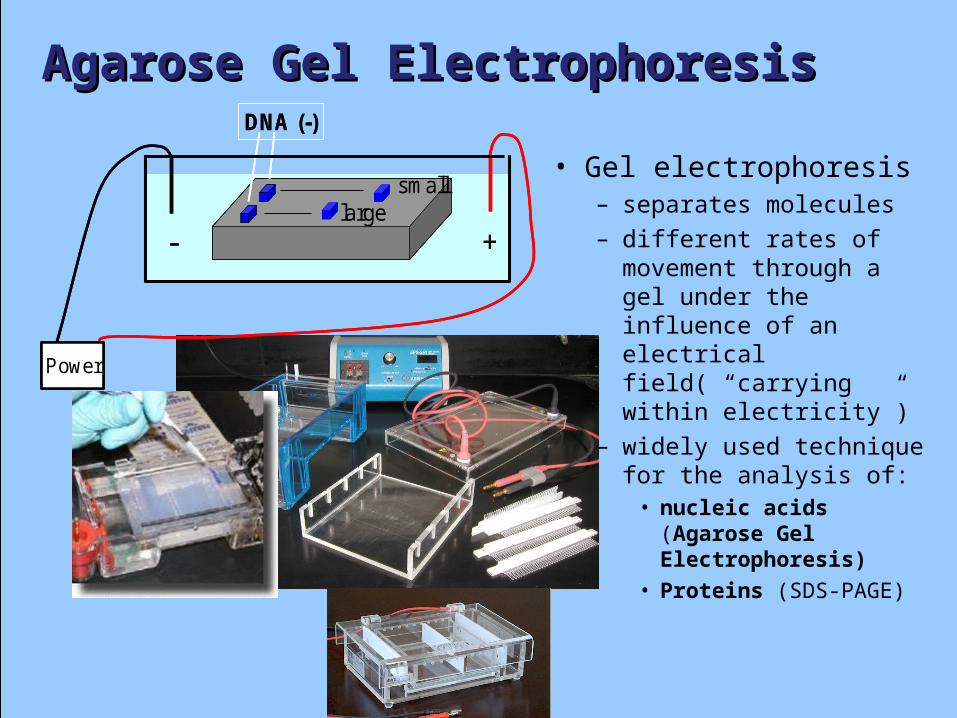
• Gel electrophoresis– separates molecules – different rates of
movement through a gel under the influence of an electrical field( “carrying within electricity”)
– widely used technique for the analysis of:
• nucleic acids (Agarose Gel Electrophoresis)
• Proteins (SDS-PAGE)
+-
Power
+-
Power
DNA (-)DNA (-)
smalllarge

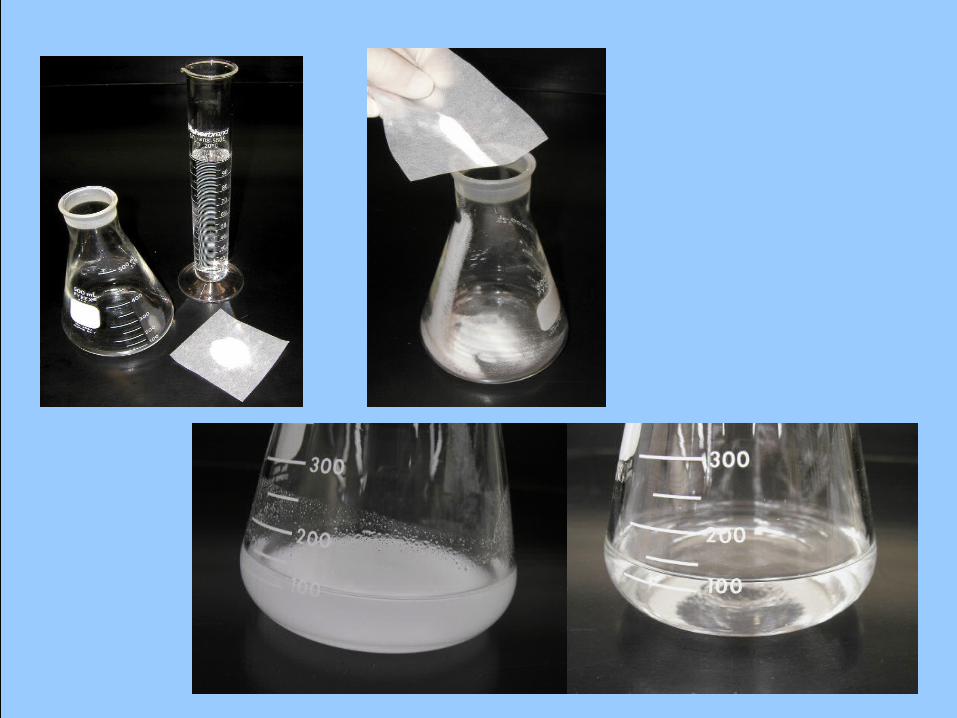
Agarose GelAgarose Gel
• Agarose is a linear polymer derived from red seaweed.
• Malasian word: “agar-agar”.
• Pores = sieve• Increasing agarose
concentration:– decreases pore size– limits the size range of
molecules that can be separated.
Agarose
D-galactose 3,6-anhydroL-galactose
1% agarose 2% agarose
Scanning Electron Micrograph
of Agarose Gel (1×1 µm)

buffer
Cathode(negative)
Anode(positive)
wells
DNA

Sample Preparation and Sample Preparation and LoadingLoading6X Loading Buffer:
Bromophenol Blue (tracking dye) Glycerol/ Glucose/ Sucrose (increase sample density)

DNA MigrationDNA Migration
• Size– migration rate of DNA fragment and logarithm of its
size (in basepairs): linear relationship (inverse)– Larger molecules move more slowly because of more
friction
• Electrical field strength• Buffer (TAE, TBE)• Agarose Gel Concentration• Sample loading
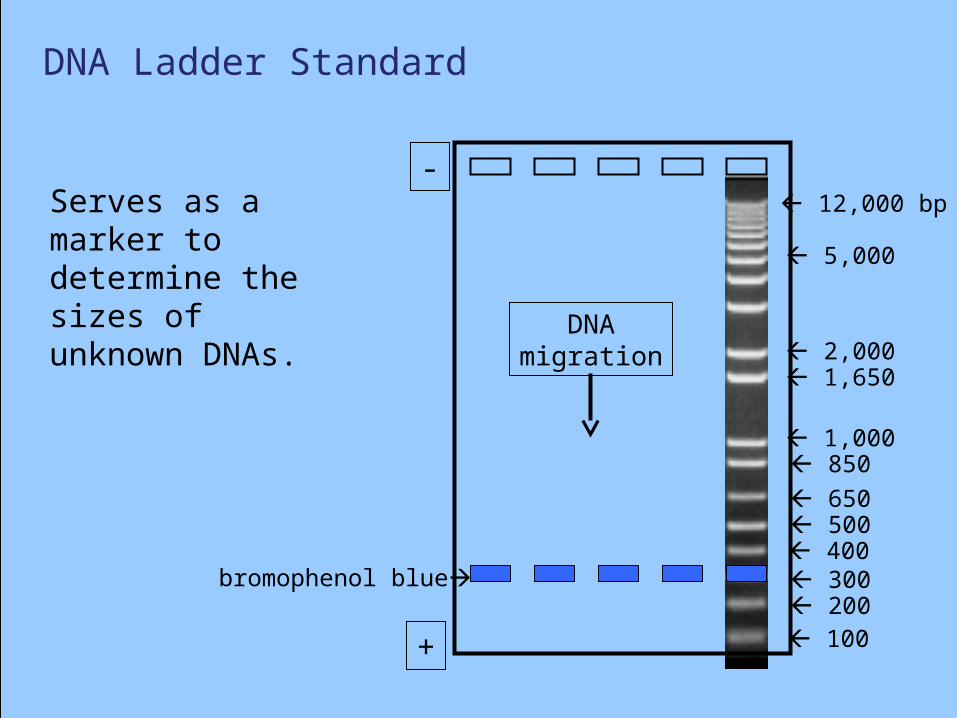
DNA Ladder Standard
Serves as a marker to determine the sizes of unknown DNAs.
100 200 300
1,650
1,000
500
850
650
400
12,000 bp
5,000
2,000
-
+
DNAmigration
bromophenol blue

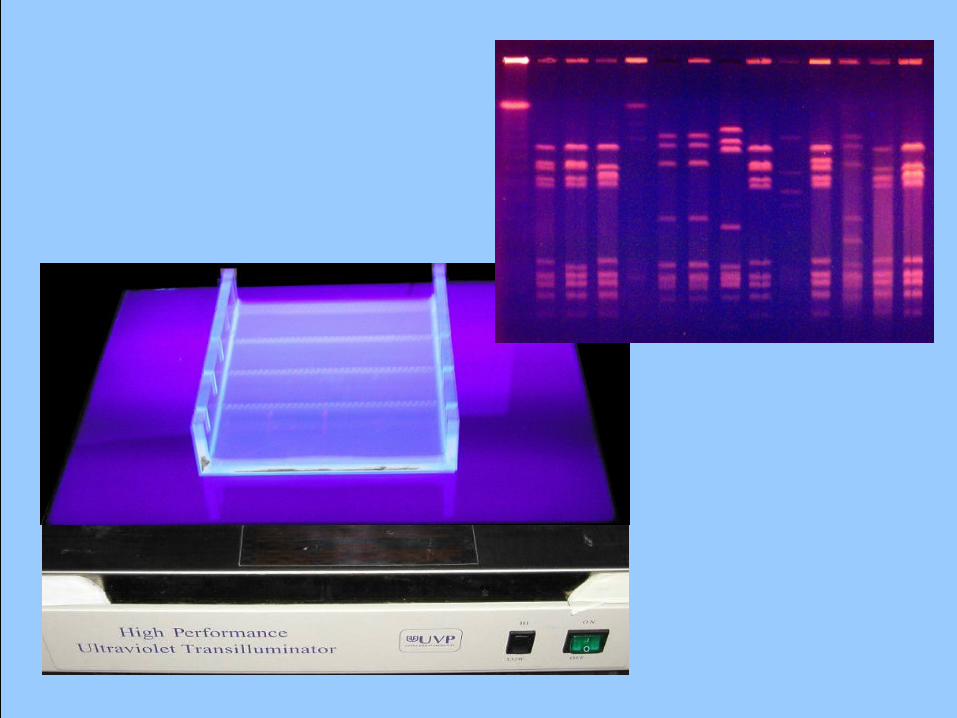
Visualization
• Ethidium bromide– binds to DNA and fluoresces
under UV light– can be added to the gel and/or
running buffer before electrophoresis or used as developing solution after electrophoresis
– CAUTION: Powerful mutagen and moderately toxic
– Decontamination • Lunn and Sansone Method : + 20
mL 5% hydrophosphorous acid and 12 mL 0. 5 M sodium Nitrate for every 100 mL EtBr (20 hrs)
• Armour method: Bleach (2-3 days)
• Charcoal Filtration
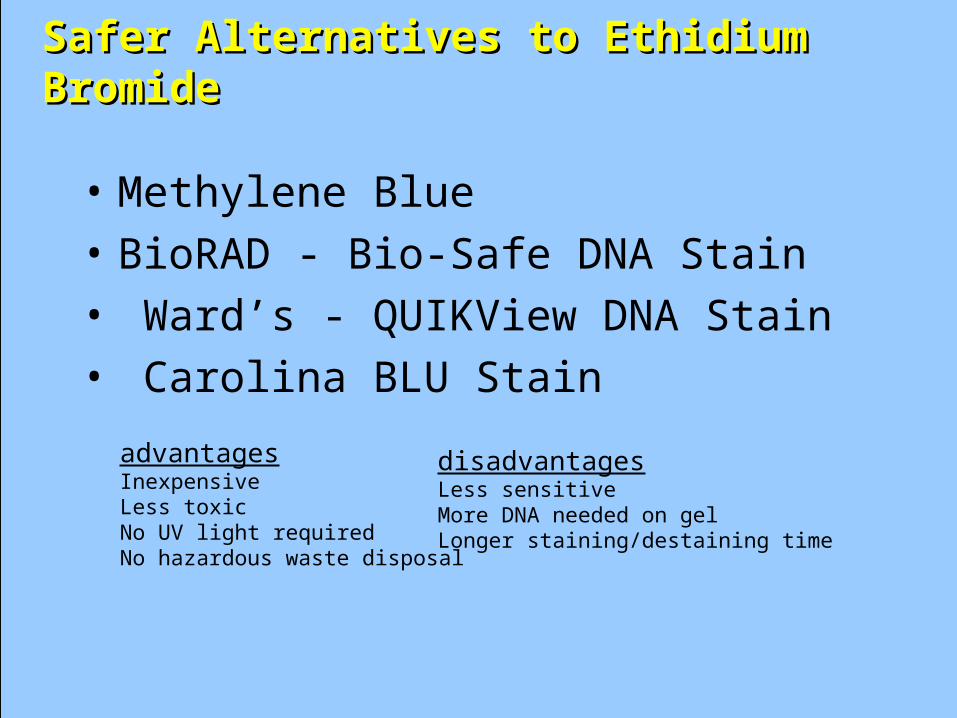
advantagesInexpensiveLess toxicNo UV light requiredNo hazardous waste disposal
disadvantagesLess sensitiveMore DNA needed on gelLonger staining/destaining time
Safer Alternatives to Ethidium Safer Alternatives to Ethidium BromideBromide
• Methylene Blue
• BioRAD - Bio-Safe DNA Stain
• Ward’s - QUIKView DNA Stain
• Carolina BLU Stain

Visualizing the DNA (QuikVIEW stain)Visualizing the DNA (QuikVIEW stain)
250
1,500 1,000
500 750
2,000 bp
DNA ladder
PCRProduct
wells
+ - - - - + + - - + - +
Samples # 1, 6, 7, 10 & 12 were positive for Wolbachia DNA

Distance migrated
base
pai
rs
Determining sample sizeDetermining sample size
• DNA migration rate and logarithm of its size (in basepairs): inverse linear relationship
DNA ladder

Distance migrated
base
pai
rs
x bp
DNA ladder
sample

ResultsResults

wells
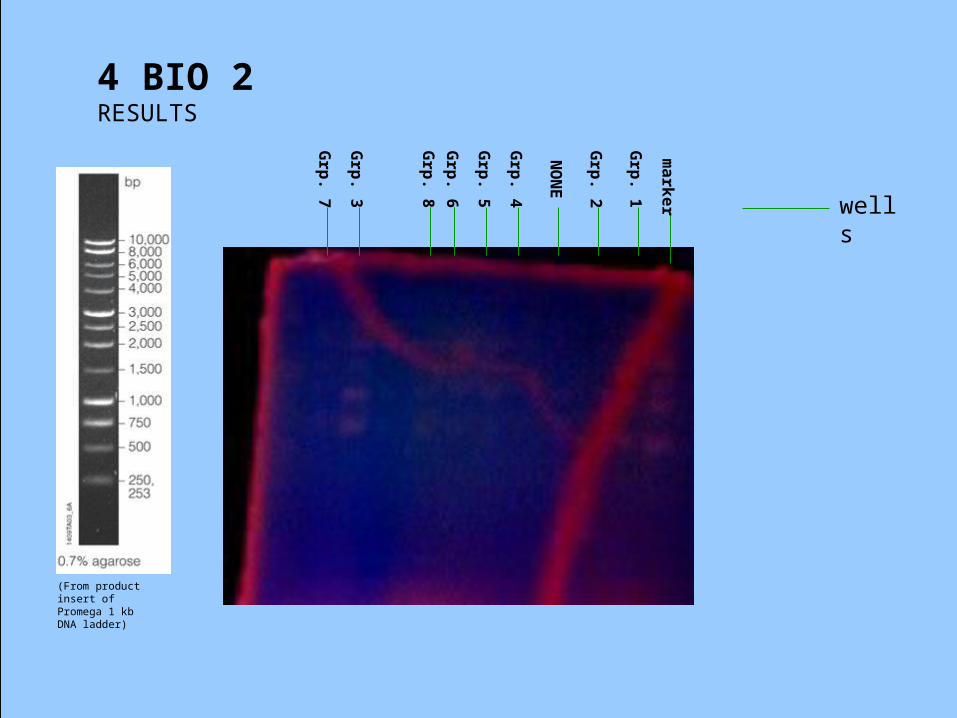
10,000 bp
8,000
6,000 5,000 4,000
3,000 2,500
2,000
1,500
1,000
750
ma
rke
r
Grp
. 1
Grp
. 2
Grp
. 3
Grp
. 4
Grp
. 5
Grp
. 6
Grp
. 7
(From product insert of Promega 1 kb DNA ladder)
4 BIO 4 RESULTS

wells
Grp
. 8
Grp
. 6
Grp
. 5
Grp
. 4
Grp
. 2
Grp
. 1
(From product insert of Promega 1 kb DNA ladder)
4 BIO 3 RESULTS m
ark
er
Grp
. 7
Grp
. 3

wells
ma
rke
r
Grp
. 1
Grp
. 2
Grp
. 3
Grp
. 4
Grp
. 5
Grp
. 6
Grp
. 7
(From product insert of Promega 1 kb DNA ladder)
4 BIO 5 RESULTS
SA
MP
LE
1
SA
MP
LE
2
SA
MP
LE
3
wells
(From product insert of Promega 1 kb DNA ladder)
4 BIO 2 RESULTS
Grp
. 7
Grp
. 6
Grp
. 5
Grp
. 4
Grp
. 2
Grp
. 1
ma
rke
r
Grp
. 3
NO
NE
Grp
. 8

wells
10,000 bp
8,000
6,000 5,000 4,000
3,000 2,500
2,000
1,500
1,000
750
ma
rke
r
Grp
. 1
Grp
. 2
Grp
. 3
Grp
. 4
Grp
. 5
Grp
. 6
Grp
. 7
(From product insert of Promega 1 kb DNA ladder)
4 BIO 6 RESULTS