age-, body size- and gender-specific reference values for...
TRANSCRIPT

Age-, Body Size- and Gender-specific Reference Values for Right
Ventricular Volumes and Ejection Fraction by Three-dimensional
Echocardiography: A Multicenter Echocardiographic Study in 507 Healthy
Volunteers
Maffessanti et al: RV Reference Values by 3D Echocardiography
Francesco Maffessanti, PhD1*; Denisa Muraru, MD2*; Roberta Esposito, MD3; Paola Gripari,
MD1; Davide Ermacora, MD2; Ciro Santoro, MD3; Gloria Tamborini, MD1; Maurizio
Galderisi, MD3; Mauro Pepi, MD1; Luigi P. Badano, MD2
*Francesco Maffessanti and Denisa Muraru contributed equally to the study
1Centro Cardiologico Monzino IRCCS, Milan, Italy
2Department of Cardiac, Thoracic and Vascular Sciences, University of Padua, Padua, Italy
3Cardioangiology with CCU, Department of Translational Medical Sciences, Federico II
University Hospital, Naples, Italy
Correspondence to Francesco Maffessanti, PhD Centro Cardiologico Monzino, IRCCS Via Parea, 4 20138 Milan, Italy Phone: +39 02 5800 2011 Fax: +39 02 5800 2287 Email: [email protected] DOI: 10.1161/CIRCIMAGING.113.000706
Journal Subject Code: [31] Echocardiography
tttttttooooooo thththththththe e e e e ee stststststststudududududududyyyyyyy
Cardiac, Thoracic and Vascular Sciences, University of Padua, P
y with CCU, Department of Translational Medical Sciences, Fed
gicicicicicooooo MoMoMoMoMonznznznznzininininino IRCCS, Milan, Ittttalalalalalyyy
Caaaaardrdrdrdrdiaiaiaiaiac,c,c,c,c, TTTTThohoohohorarararr cicicicic c cc c c annnnnd d ddd VaVaVaVaVascscscscsculululululararararar SSSSSciciiiienenenenncececececes,s,s,s,s, UUUUUnininininiveveveveversrsrsrr ititititty y y yy ofofofoff PPPPadadadadaduauauaaua, ,, PPP
y with CCCCCCUCUCUCUC ,,,,, DeDeDeDeDepapaapaartrtrtrtrtmemememeentnnnn ooooof f ff f TrTrTrTrTranananananslslslslslatataaa ioioooonananananallll MeMeMeMeMedididididicacacacacal ll l l ScScScScScieieieieiencncncncnces, Fed
by guest on April 30, 2018
http://circimaging.ahajournals.org/
Dow
nloaded from
by guest on April 30, 2018
http://circimaging.ahajournals.org/
Dow
nloaded from
by guest on April 30, 2018
http://circimaging.ahajournals.org/
Dow
nloaded from
by guest on April 30, 2018
http://circimaging.ahajournals.org/
Dow
nloaded from
by guest on April 30, 2018
http://circimaging.ahajournals.org/
Dow
nloaded from
by guest on April 30, 2018
http://circimaging.ahajournals.org/
Dow
nloaded from
by guest on April 30, 2018
http://circimaging.ahajournals.org/
Dow
nloaded from
by guest on April 30, 2018
http://circimaging.ahajournals.org/
Dow
nloaded from
by guest on April 30, 2018
http://circimaging.ahajournals.org/
Dow
nloaded from
by guest on April 30, 2018
http://circimaging.ahajournals.org/
Dow
nloaded from

2
List of Abbreviations
2D = Two-dimensional
3D = Three-dimensional
3DE = Three-dimensional echocardiography
BMI = Body mass index
BSA = Body surface area
CMR = Cardiac magnetic resonance
EF = Ejection fraction
EDV = End-diastolic volume
ESV = End-systolic volume
FAC = Fractional area change
LV = Left ventricular
RV = Right ventricular
SV = Stroke volume
TAPSE = Tricuspid annular plane systolic excursion
g
c
r
u
g
ccucucculllal r
riculllllararararar
umeme
by guest on April 30, 2018
http://circimaging.ahajournals.org/
Dow
nloaded from

3
Abstract
Background—Right ventricular (RV) volumes and ejection fraction (EF) vary significantly
with demographic and anthropometric factors, and are associated with poor prognosis in
several cardiovascular diseases. This multicenter study was designed to: a) establish the
reference values for RV volumes and EF using transthoracic 3D echocardiography (3DE); b)
investigate the influence of age, gender and body-size on RV anatomy; c) develop normative
equations.
Methods and Results—RV volumes (end-diastolic, EDV; end-systolic, ESV), stroke volume
(SV) and EF were measured by 3DE in 540 healthy adult volunteers, prospectively enrolled,
evenly distributed across age and gender. The relation of age, gender and body size
parameters were investigated using bivariate and multiple linear regression. Analysis was
feasible in 507 (94%) subjects (260 women, age 45±16 years, range 18-90). Age, gender,
height and weight significantly influenced RV volumes and EF. Gender effect was significant
(p<0.01), with RV volumes larger and EF smaller in men than in women. Older age was
associated with lower volumes (EDV, -5ml/decade; ESV, -3ml/decade; EF, -2ml/decade),
and higher EF (+1%/decade). Inclusion of body size parameters in the statistical models
resulted in improved overall explained variance for volumes (EDV, R2=0.43; ESV, R2=0.35;
SV, R2=0.30), while EF was unaffected. Ratiometric and allometric indexing for age, gender
and body size resulted in no significant residual correlation between RV measures and height
or weight.
Conclusions—The presented normative ranges and equations could help standardize the 3DE
assessment of RV volumes and function in clinical practice, considering the effects of age,
gender and body size.
Key Words: three-dimensional echocardiography; reference values; allometric equations;
right ventricular volumes; right ventricular ejection fraction
agagagagagagage,e,e,e,e,e,e, gggggggenenenenenenendededededededer r r rr r r ananananananan
near rererererereregrgrgrgrgrgrgresesesesesesessisisisisisisiononononononon Ag g p g
(
ht significantly influenced RV volumes and EF. Gender effect w
RV volumes la er and EF smaller in men than in women. O
g g p g
(99999444%4 ) subjbjbjbjbjececectststsst (((((262626262600000 wowowowowomememen,, age 455555±1±1±1±1±166666 yeyeeararrrs,s,s, rrrrrananananangeeeee 11118-8-88--9090909090))).))
ht siiiiigngngngnnifififififiiciii antltltly yy iini flff uenced RRRRRVVVV V volllumes and dddd EFEFEFEFEF. GGGenddddder effffffffecttt w
RRRVVV ovoluluumemememmes s s s lalalalaargrgrgr erererr aaandndndndnd EEEEEF F F FF smsmsmsms alalaallleleleer r r r inininnn mmmmenenen ttthahahahah n n n n inininini wwwwwomomomomenen. OO
by guest on April 30, 2018
http://circimaging.ahajournals.org/
Dow
nloaded from

4
Right ventricular (RV) volumes and ejection fraction (EF) are important determinants of
survival in patients with myocardial infarction,1 systolic heart failure,2-4 congenital heart
disease,5 and pulmonary arterial hypertension.6
Cardiac magnetic resonance (CMR) is the current gold standard for quantitation of RV
geometry and function, but its widespread use is limited by costs, time-consumption and
contraindications, resulting unsuitable for patient screening or monitoring on large scale.
One of the major breakthroughs of transthoracic three-dimensional echocardiography
(3DE) is the ability to measure RV volumes and EF, otherwise not feasible by standard 2D
echocardiography.7 However, recent recommendations for RV quantitation8 indicated that
limited normative data is currently available for 3DE and, despite significant differences by
age and gender for RV geometry and function were identified by CMR,9 no reliable age- or
gender-specific reference values can be recommended at present for 3DE. Paralleling the
findings obtained with CMR,9 we hypothesized that RV volumes and EF measured by 3DE
would vary according to age, gender and body size in healthy subjects. Accordingly, this
study was designed to:
1) identify 3DE reference values for RV volumes and EF from a large population-based
sample of healthy volunteers with a wide age range, prospectively studied in 3 centers, using
the same study protocol and different 3DE scanners;
2) analyze the relationship of RV parameters with age, gender and body size;
3) study intra-observer and inter-center reproducibility of RV volumes and EF;
4) develop normative equations for RV volumes and EF and validate them using similar
normative equations obtained by CMR.9
Methods
Healthy volunteers were prospectively enrolled in 3 Italian tertiary centers (C1, C2, C3)
having a large expertise in 3DE for RV quantification (>400 studies/year/center for both
pipipipipipipitetetetetetete sssssssigigigigigigignininininininififififififificacacacacacacantntntntntntnt ddddddd
by CCCCCCCMRMRMRMRMRMRMR 9999999 nnnnnnnooooooo rrerrr lg y y ,
r a
d s
ordi to e, ender and body size in healthy subjects. Acco
g y y ,
reeeeefefefef rence vavavavv luuuesesesses cccccananananan bbbbbeee ee rererecoommmmmenenendedededededd ddd atat pprereeeesentntntntnt fffffororororor 33333DEDEDEDEDE. . Pa
d wiiiiithththhh CCCCCMRMRMR,,,,999 we hyhyhyhyypothesiiziii deddd ttthhhahh t RVRVRVRVRV vollllumes a dndddd EEEF FFF meas
orordidingng tttoooo agagagage,e,e,e, gggenenenndeded r r r r ananand d ddd bobobobob dydydydydy ssssizizizize ee ininin hhhheaeaeaaaltltltltthyhyhyhyhy ssssububububjejejejectctctctss. AAAccccoo
by guest on April 30, 2018
http://circimaging.ahajournals.org/
Dow
nloaded from

5
clinical and research purposes). Participating centers were asked to provide samples with a
fairly uniform distribution among genders and age (from 18 to 90 years). Subjects from one
participating center have been included in a previous publication.10
Population
Subjects were prospectively recruited among hospital employees, fellows in training, their
relatives and people screened for driving or working license. Criteria for recruitment
included: age 18 years, no history or symptoms of cardiovascular or lung disease, no
cardiovascular risk factors (i.e. arterial systemic hypertension, smoking, diabetes,
dyslipidemia), no ongoing or previous cardio- or vaso-active treatment, normal ECG and
physical examination. Risk factors were assessed from the medical files, when available
(lipid and glucose levels, history of diabetes and/or dyslipidemia), from subject self-reporting
(smoking habit, history of blood pressure levels and metabolic risk factors when otherwise
not available) and from physical assessment immediately preceding the echocardiographic
examination (blood pressure, weight and height). Exclusion criteria included: tricuspid
regurgitation more than mild, poor apical acoustic window, professional sport activity,
pregnancy, obesity (body mass index, BMI 30 kg/m2), no knowledge of serum lipid or
glucose levels at any time. Written consent was obtained from each participant. The study
protocol was approved by the institutional review board of each center.
Anthropometric measurements
Height and weight were measured before the echocardiographic study using calibrated
stadiometer and scale. Body surface area (BSA) was calculated using the DuBois formula,11
while BMI as the individual's body weight divided by the square of height.
Two-dimensional echocardiography
A complete standard M-mode, 2D and Doppler examination was performed to rule out any
silent abnormality. Peak velocity of tricuspid regurgitation signal and right atrial pressure,
mememememememedididididididicacacacacacacalllllll fififififififileleleleleleles,s,s,s,s,s,s, wwwwwwwhhhhhhh
a) frfrfrfrfrfrfromomomomomomom sssssssubububububububjejejejejejejectcctctctcct s, y y p ), j
history of blood pressure levels and metabolic risk factors h
nd from physical assessment immediately preceding the echoc
o d
, y y p ), j
hhhihh ssts ory offff bbbbblololoododododod ppppprererereressssssuuuruu eee leveveels aaanddddd mmmmmetetetee abababololllliicicii risisisisiskkk kk fafafafafactctctctc orororrorsss wwwhww
nd fffffrorororoommm mm phhhhyssyyy icii lall assessment t iimii medidididd tttatt lelllly precediniiii g thhhe echhhoc
o dod pprerereessssssssurururu e,e,e,e, wwweieieeie ghghghgg t t t t ananannnd d dd heheheheeigigigigghthththt).).))) EEEEExcxcxcxclulusisisisisionononon ccccriririr teteteteteririririia a a a iin lcl dud
by guest on April 30, 2018
http://circimaging.ahajournals.org/
Dow
nloaded from
6
estimated from the dimensions and respiratory changes of inferior vena cava, were used to
calculate systolic pulmonary artery pressure.8 RV size was assessed by measuring end-
diastolic and end-systolic RV areas, and RV function was assessed by fractional area change
(FAC) and M-mode derived tricuspid annular plane systolic excursion (TAPSE).8 Left
ventricular (LV) volumes and EF were calculated using the biplane disc summation
method.12
Three-dimensional echocardiography
Acquisition. At the end of the 2D examination, an apical 3D dataset of the RV was obtained
using two commercially-available ultrasound systems: Vivid E9 with 4V probe (BT 11, GE
Vingmed, Horten, N), and Philips IE33 with X3-1 probe (Philips Medical Systems, Andover,
MA). RV full-volume datasets were obtained from 4 or 7 consecutive beats for an adequate
temporal resolution (26-40 volumes/second). Acquisitions were performed using second-
harmonic imaging, with adjustments in frequency, gain, contrast, depth, sector size and
respiratory maneuvers to optimize the visualization of the RV, particularly at the level of
anterior wall and outflow tract (Figure 1). Each acquisition was verified to rule out stitching
artifacts or incomplete RV visualization, and additional recordings were performed when
necessary.
Analysis. Offline analyses of 3D datasets were carried out by a single experienced
investigator in each center using a commercially-available 3DE software package (TomTec
4D-RV Analysis, Unterschleissheim, D) according to a standardized method (Supplemental
Methods). This vendor-independent software has been validated against CMR and its
workflow has been extensively described elsewhere.13-15 RV volumes were semi-
automatically computed throughout the entire cardiac cycle, from which end-diastolic (EDV)
and end-systolic (ESV) volumes were obtained, and stroke-volume (SV) and EF were
calculated (Figure 1).
pspspspspspsps MMMMMMMedededededededicicicicicicicalalalalalalal SSSSSSSysysysysysysystetetetetetetemmmmmmm
secutititititititiveveveveveveve bbbbbbbeaeaeaeaeaeaeatststststststs ffffffforooo
i u
n c
e t
ioooonn n (26-400000 vvooloo umumumumumeseseseses/s/s/s/s/secececececononond)d)d))). AAccquiuiuiuiui isisisiitititititiononoo sss weweweww reeee ppppperrrrrfofofofoformrmrmrmmededededed u
ng, wiwiwiwiwithththhh adjdjdjdjjusu ttmt entstttt in ffrfff equency, gggaiiiiin, conttrt ast,tttt dddddepththhthh, sec
eeuvererss tototoo ooooptptptptp imimimimmizizzize e e e ththeeee viviiiisususussualalalaalizizizzzaaaatititionononon ooooof f ff thththhe e e RVRVRVRV, , ,, papapapap rtrtrtrtrticicicicculululu ararlly aattt
by guest on April 30, 2018
http://circimaging.ahajournals.org/
Dow
nloaded from

7
Statistical analysis
Normality distribution of continuous variables was assessed using the Kolmogorov-Smirnov
test. Data are presented as mean ± standard deviation, evaluated across age decades. Values
obtained in women and men were compared using unpaired t-test (Aim #1).
The relationship of RV measurements with age and anthropometric data was characterized
using bivariate and multivariate linear regressions (Aim #2). Multivariate analysis was
performed introducing different sets of predictors: model AGr included age and gender;
model AGBr, age, gender and BSA; model AGHWr considered age, gender, height and
weight. The latter model, considering height and weight separately, avoided the assumptions
proper of BSA, while allowing to account for differences in body size.9
The intra-observer and inter-center reproducibility were evaluated using Pearson’s
correlation coefficient, Bland-Altman analysis and coefficient of variation (Aim #3). To
assess intra-observer reproducibility, the main investigator of each center repeated the
analysis in a randomly chosen subset of 15 RV datasets, at least 1 month after the first
analysis. To assess the inter-center reproducibility, 30 RV datasets from one center have been
delivered to the other two centers and analyzed independently by the same three
investigators. Preliminary results revealed significant inter-center variability due to
systematic biases in RV volume measurements. Inter-center variability was significantly
reduced when a standardized method defined by joint consensus was used to re-analyze the
same 30 RV datasets (Supplemental Methods). As a consequence, all the datasets were
analyzed applying the jointly agreed standardized method and the obtained results have been
used for further analyses.
Normative equations for RV parameters were obtained using linear regression, after log-
transforming dependent and independent variables, to allow allometric scaling of RV
volumes and function (Aim #4).16 Gender was included as a dummy variable in the model,
yyyyyyy sssssssizizizizizzize.e.e.e.e.e.e.9
e evavavavavavavalululululululuatatatatatatatededededededed uuuuuuusissss np y
f A
erver reproducibility, the main investigator of each center
ndomly chosen subset of 15 RV datasets, at least 1 month a
p y
fiiiiiciciciient, Blaalaaandndnd-A-A-A-A-Altltltltltmamamamaman anananaa aaalyssiis aandndnddd coeoeoeoeoefffffff icccieieentntntnn ooooof f fff vavavavavaririririr atataa ioioioioionnnnn (A
erver r rreproddducu ibibbibbilii ity,yy,yy the m iaiin iiinii ve tttsttiigi atttttor of ff eachhhh centett r
dndomomlly cccchohohoh seseseen n n n sususuubsbsb etetetet ooof f f f f 151515155 RRRRV V V dadadaatatatatatasesesesetststst , atatatat lllleaeaeaeaststst 1111 mmmmononthth aa
by guest on April 30, 2018
http://circimaging.ahajournals.org/
Dow
nloaded from

8
resulting in different intercepts for women and men. To validate the 3DE normative
equations, a split and sample approach was used (Supplemental Methods). A comparison
between the derived normative equations and those obtained in a similar population using
CMR,9 has been carried out applying the two sets of equations to our population. The
difference between the two predicted values was investigated as a function of the mean
expected value.
Bivariate linear regression was applied to study the residual correlation between indexed
RV volumes and body size parameters. RV indexes were defined as each RV volume divided
by BMI, BSA or by the patient-specific expected value when applying the multivariate
models. Indexes were obtained both via ratiometric and allometric approaches. Ratiometric
scaling approaches divide the variable of interest by a linear combination of body size
predictors (models AGr, AGBr, and AGHWr). Allometric indexing was obtained by dividing
each RV measurement by age raised to the power of the coefficient of log-transformed age,
by BSA raised to the power of log-transformed BSA, and by the exponential of the gender-
specific intercept (model AGBa).
Statistical analysis was performed using SPSS 17.0 (SPSS, Inc, Chicago, IL).
Results
A total of 585 volunteers fulfilled the inclusion criteria of this study. Of these, 45 (8%)
individuals were excluded from 3DE analysis because of poor apical acoustic window during
2D examination. Therefore, 540 subjects (240 enrolled at C1, 87 at C2, and 213 at C3) were
enrolled. Analysis of 3D RV volumes and EF was feasible in 507 out of the 540 enrolled
healthy volunteers. The overall feasibility of 3DE was similar among centers: 94% for C1,
93% for C2, and 93% for C3.
Clinical, echocardiographic and demographic characteristics of the study population are
summarized in Table 1. All parameters were normally distributed. The age of the study
etetetetetetetririririririr ccccccc apapapapapapapprprprprprprproaoaoaoaoaoaoachchchchchchcheseseseseseses
ar comomomomomomombibibibibibibinananananananatititititititionononoononony
ls AGr, AGBr, and AGHWr). Allometric indexing was obtain
e n
o o
y
llsll AAGr, AGAGGGGBrBrBrr,,, ananananand dd dd AGAGAGAGAGHWHWHWHH r))r))). Alllomemmmemetrrrrriciicii iindndn eexexe inng g g gg waaaaasssss obobobobobtatatatataininininine
emenenennnttttt bbybbb agegeggg r iaiised dddd tttott thehhh power offff f thththththe co fefffffifififf iicientt ttt of lllog t-ttran
oo ttthhe ppowowowowerererer oooof f f f lolollog-g-g-gg trtrtranananansfsfffforororoo memememm d d ddd BSBSBSSA,A,A, aaaaandndnndd bbbbby y y yy ththththhe e e e exexexexxpopopopoponenenene tntntiiall o
by guest on April 30, 2018
http://circimaging.ahajournals.org/
Dow
nloaded from

9
cohort ranged between 18 and 90 years. Women were slightly prevalent (51%). At least 37
subjects per age decade were included in the study (mean 85±27 subjects/age decade),
similarly distributed among decades (p=0.13). All anthropometric measurements were greater
in men than in women. Male gender was associated with larger LV volumes and RV areas,
and lower LV EF and RV FAC, while TAPSE, heart rate and RV systolic pressure were
similar in men and women (Table 1).
3D RV Volumes and Function. Reference values of 3D RV measurements, for the whole
study population and separately for each gender and age decade group, are shown in Table 2.
As expected, gender effect was significant in all age groups, with RV volumes larger in men
than in women. Overall, RV EF was lower in men than in women, even if this difference was
not significant in all age groups. Figure 2 depicts the values of RV EDV and ESV indexed to
BSA, showing that the significant differences between men and women persist even after
adjusting for body size.
Relationship with age, gender and body size. Results of the bivariate correlations between
RV measurements, age, and body size parameters (i.e. height, weight, BMI and BSA) are
listed in Table 3. RV volumes showed a progressive reduction with age, and positive
correlation with body size. Conversely, RV EF increased with age, and was inversely related
to body size. Among body size measurements, BMI showed the weakest correlation with RV
volumes, and no correlation with EF. For this reason, BSA was preferred to BMI in
multivariate analysis. Heart rate was inversely correlated with RV volumes (EDV, r=-0.16;
ESV, r=-0.17) and SV (r=-0.09), whereas it was directly correlated with EF (r=0.13).
Age and gender were independently associated with RV volumes and function (Table 4,
Model AGr). Specifically, there was an expected age-related decrement of 5 ml/decade for
EDV, 3 ml/decade for ESV and 2 ml/decade for SV Moreover, aging was associated with a
small ( 1%/decade), but significant increase in RV EF.
enenenenenenen,,,,,,, evevevevevevevenenenenenenen iiiiiiif f f f f f f thththththththisisisisisisis ddddddd
RV EEEEEEEDVDVDVDVDVDVDV aaaaaaandndndndndndnd EEEEEEESg g p g p
hat the significant differences between men and women persi
d
t t
g g p g p
hhhahh tt tt the signgngngnnifififficiciciicananananantt ttt dididididiffffffffffeeeree enenenceesss beetwtwtwwweeeeee nnn nn memeen anananaa d d dd d wowowowowomemememem n n nn pepepepeperrsrrr i
dy siizizii eeee.e
ttthhh agagee, gggggenenenendededeer r r r ananannddddd bobobobodydydydydy ssssizizizizze.e.e.e. RRResesesesululullltstststss ooof f f ththhhhe e e e bibibibibivavavaariririr atatatata e e e e cocococ rrrr lel tatat
by guest on April 30, 2018
http://circimaging.ahajournals.org/
Dow
nloaded from
10
The inclusion of BSA (Table 4, Model AGBr) improved the overall variance in RV
volumes explained by the model (up to 40% for the EDV). BSA was associated with EDV,
ESV and SV, with an expected increase of 5 ml, 2 ml and 3 ml respectively per each 0.1
m2 of BSA increase. The effects of age and gender persisted in Model AGBr, with
coefficients similar to those derived in Model AGr. Conversely, no significant improvement
was observed when including BSA in the regression model for RV EF.
Including height and weight separately in the model (Table 4, Model AGHWr) instead of
combining them in BSA (Table 4, Model AGBr), did not lead to significant improvements of
model R2. AGHWr and AGBr models resulted in similar values in terms of constant and age
and gender coefficients. For this reason, and also to avoid the possible issue of collinearity,
multivariate regressions on log-log transformed variables were performed using BSA, and not
height and weight separately.
Normative equations for 3DE RV volume and EF. Derived normative equations for 3DE
RV volumes, SV and EF are reported in Table 4. Contrary to general assumptions about
scaling effects, Table 5 shows that 3D RV volumes, SV and EF maintain significant residual
correlations with both height and weight, even after indexing to BSA or BMI. Ratiometric
scaling for RV parameters adjusted for age and BSA (AGBr), or age, height and weight
(AGHWr) resulted in RV volumes and EF values independent of body size. Similarly,
allometric scaling for normative equation (Table 4, Model ABa) resulted in negligible
residual correlations with height and weight.
Comparison with CMR-derived normative equations. Comparison with normative
equations derived from CMR9 applied to our study population, showed lower predicted RV
volumes and EF calculated using 3DE vs. CMR normative equations (Figure 3). The
differences between the CMR- and 3DE-predicted volumes showed a strong positive
correlation with their average. For every 10 mL increase of average 3DE and CMR RV
popopopopopopossssssssssssssibibibibibibiblelelelelelele iiiiiiissssssssssssssueueueueueueue ooooooofffffff
perfooooooormrmrmrmrmrmrmededededededed uuuuuuusisisisisisisinngngngngngn Bg g p g
h
a t
V and EF are re rted in Table 4. Contrar to eneral ass m
g g p g
httt t sses paratelylylylyly...
ationnnsssss fofffof r 3D3D33DEEE RRVRVRV volummee ana d ddd EFEFEFEFEF. DDDDDeriviiii dedddd normatttitt ve equat
VVV aa dnd EEEEFFFF ararara e e e e rererepopopopop rtrtrtrr ededededed iin n n nn TaTaTaTaablblblblb eee 4.4.4.4 CCCCConononono trtrtrt arararrry y y y y totototo gggggenenennnererereralalalal aassss mum
by guest on April 30, 2018
http://circimaging.ahajournals.org/
Dow
nloaded from

11
volumes, there was an increase in the inter-modality difference of approximately 6 ml, 4 ml
and 5 ml, for EDV, ESV and SV, respectively (Figure 4). Conversely, the inter-modality
difference of expected EF showed no correlation with the average expected value, resulting in
a bias of 6.7% at Bland-Altman analysis (Figure 4, bottom panels).
Reproducibility. Intra-observer and inter-center reproducibility for RV volumes values are
summarized in Table 6. Intra-observer analysis showed good to excellent reproducibility (R2
ranges from 0.76 to 0.94, coefficient of variation between 2.0 and 8.6%), with negligible bias
and narrow limits of agreement (4.3 ml for ESV at C1, 11.5 for EDV at C3). Inter-center
measurements showed higher variability than intra-observer (R2 between 0.43 and 0.87,
coefficient of variation between 6.8 and 15.2%), with no significant biases (absolute values
between 2 and 9 ml) and acceptable limits of agreement between repeated measurements,
ranging between 13 and 33 ml.
Discussion
This is the first prospective multi-center study providing reference values for 3D RV volumes
and EF, separately for age and gender. To foster the clinical application of 3DE in individual
patients, a set of normative equations for RV volumes and EF was derived from this large
cohort of healthy adults, taking into account demographic and anthropometric parameters.
The main findings of this study can be summarized as follows: 1) the normal ranges of
absolute and BSA-indexed values of RV volumes and EF measured using 3DE are now
available separately for gender and age decades; 2) demographic and anthropometric
parameters were strong independent predictors of 3DE RV volumes at multivariate analysis;
3) RV EF showed a weak correlation with age and gender, and no correlation with body size;
4) normative allometric equations for 3D RV volumes and EF have been developed,
effectively indexing RV parameters for body size; 5) a strong agreement between 3DE and
CMR predicted normative values was found; 6) individual reference values for RV size and
fifififififificacacacacacacantntntntntntnt bbbbbbbiaiaiaiaiaiaiasesesesesesesesssssss (a(a(a(a(a(a(abbbbbbb
weennnnnnn rrrrrrrepepepepepepepeaeaeaeaeaeaeateteteteteteteddddddd mmmm) p g p
os ctive multi-center study rovidi reference values for D
) p g p
13131331 and 333 mlmmmm .
DiDiDiDiD scscscussiiiion
rrosospepe tctctivivivvve e e e mumumumultltllti-i-cecececentntntnn erererer sstututututudydydydydy ppppprororor vivivvividididingngngngng rrrefefee ererererenenenencececee vvvvalalala ueueueueu s s s s fforr 3D3D3D
by guest on April 30, 2018
http://circimaging.ahajournals.org/
Dow
nloaded from

12
function parameters calculated using 3DE normative equations were systematically lower
than those calculated using CMR normative equations.
Quantitation of RV size and function with conventional echocardiography is challenging,
due to the anterior position of the RV in the chest, its complex asymmetric geometry and
highly trabeculated endocardial border, impossibility to simultaneously visualize both inflow
and outflow tracts and lack of realistic geometric models for volume calculation.17 3DE has
been demonstrated to have a good accuracy in measuring RV volumes compared to CMR.18
This, in conjunction with the availability of specifically designed software not requiring a
priori modeling or geometric assumptions,19 made 3DE a feasible, fast and accurate technique
for RV assessment in different clinical settings.13,20-22
Several biological processes and anatomic structures, including cardiovascular structural
and functional variables, scale with anthropometric and demographic data.23 However, while
scaling is commonly performed in pediatric medicine, allowing to eliminate the possible
confounding effect of the rapid somatic growth process, the practice of indexing is less used
in adult clinical cardiology.16 The goal of scaling cardiac structure is to eliminate, or at least
substantially decrease, the overlap between normal and abnormal ranges that could be
influenced by body size. In the present study, besides providing normative values of RV
volumes and ejection fraction stratified for gender and age, we also derived different models
and normative equations to index RV values according to demographic and anthropometric
parameters. Independently of the adopted model, aging was associated with a decrease of 5
ml/decade for EDV, 3ml/decade for ESV, and 2 ml/decade for SV. Conversely, EF increased
by 1%/decade. Body size was also significantly related with RV volumes. For every 0.1 m2
increase in BSA, there was an increase of 6 ml, 2 ml and 3 ml in RV EDV, ESV and SV,
respectively. Height and weight were also positively associated with RV volumes. However,
dingggggg cacacacacacacardrdrdrdrdrdrdioioioioioioiovavavavavavavascscscsscscs ug p , g
a o
m
e
g p , g
arrrrriaaables, scccalalalaa e ee wiwiwiwiwiththththth aaanaa thththththrooopppomemm trriccc aaaaandndndndnd dddddemmmogggggraaphphphphphiiicii dddddatatatata a.a.aa 2323232323 HHHHHo
monllllly y ppperffformem dd ddd in pppediatrtttt iiciii medidididid ciiiiine, allllllloll wiiing ttttto elimii iniiii ttate
e tctct ooff ththe e e ee rarararapipipipipid d ddd sososomamamamm titiiicccc grgrgrgrgrowowowwwththththh ppppprrrocococo esesessss,s,s,s,s, tttthehe ppppprarararactctctc iciciicceeeee ofofofoff iiii dndeexiin
by guest on April 30, 2018
http://circimaging.ahajournals.org/
Dow
nloaded from

13
their inclusion in the statistical model separately, and not merged into BSA, did not increase
the predictive power of the model.
We also demonstrated the importance of gender in all RV parameters: RV volumes were
larger and EF lower in men than in women. Albeit these dissimilarities can be partially
explained by different biometric characteristics between women and men, gender was a
significant determinant of RV size even after scaling for anthropometric variables.
From an empirical point of view, adequate model fitting should result in negligible
residual association between the values indexed by body size (e.g. BSA) and the independent
variables, specifically height and weight.24 Our results showed a residual correlation with
height and weight after ratiometric indexing (Table 5) suggesting that the assumption of
linearity between 3DE RV volumes and BSA is not completely satisfied, even after adjusting
for age and gender. Furthermore, indexing RV ESV to Model AGBr overcompensated the
association with anthropometric measures. Conversely, applying the allometric scaling led to
the calculation of RV volumes which were independent of age and body size. These findings
imply that simply indexing by BSA may be suboptimal, and the use of an exponential
allometric model could be more appropriate to scale RV volumes and SV. Alternatively,
ratiometric scaling for the Model AGHWr, considering height and weight separately and not
in fixed proportion as in BSA calculated by Du Bois and Du Bois formula,11 resulted in RV
volumes independent of body size. In addition, the appropriateness of normalization achieved
via scaling ratiometrically to BSA may be questionable from a theoretical point of view.
Indeed, the theory of similarity states that relative geometries determine in part the
relationships between body size variables. As RV volume is proportional to a length measure
raised to the third power, and BSA is proportional to a length raised to the second power, the
scaling relationship is dimensionally not consistent. Thus, indexing to BSA, despite widely
esesesesessstititititititingngngngngngng tttttthahahahahahahat t ttt tt thththththththe e e e e e e aaaaaaa
satisissssssfififififififiededededededed evevevevevevevenenenenenenen ap y ,
der. Furthermore, indexing RV ESV to Model AGBr overc m
f RV volumes which were ind endent of e and body size. T
p y ,
ddddderrr. Furtheeeermrmrmrr ooroo e,e,e,ee, iiiiindndndndndexexexexexinininggg RVRVRVRR EEESVVVVV tooooo MoMoMoMM dededededel AGAGAGAGAGBrBrBrBrBr oooveveveevercrcrccrcoomooo
anthrhrhrhrhropopopoo om ttetriiric measures. CCCCoC nverselllyll , apapa pllll iyiingggg thehh allllll om ttetriiic
ff RRRVVV vovovoolulululuumememem ssss whwhwhwhwhicicici hh wewewew rerereee iiindndndndn epepepeppenenenndedededentntntntnt ooof f ff agagagggeeee anananand d d dd bobobob dydydydydy ssiizee. TTT
by guest on April 30, 2018
http://circimaging.ahajournals.org/
Dow
nloaded from

14
used in clinical practice in all cardiac imaging modalities, may be suboptimal in certain
circumstances.16
The observed association between RV size, demographic and anthropometric parameters
has been previously reported in other studies, both using echocardiography and other imaging
modalities. In a large series of subjects with normal echocardiographic findings, D’Oronzio et
al.25 concluded that gender and BSA are important determinants of 2D echocardiographic RV
dimensions, and proposed to use gender-specific RV measures indexed to BSA for the
assessment of RV in the clinical routine. Of note, D’Oronzio et al reported only a weak
inverse association between aging and RV area, which may be due to the lower accuracy of
2D echocardiography in comparison with 3DE in assessing RV size.26
Our study corroborate and extend the results of Tamborini et al.10 to a larger population,
investigating the demographic and anthropometric determinants of RV morphology and
function in a multi-center setting. This is an important step towards the definition of clinically
applicable reference ranges. Indeed, systematic biases among laboratories have been reported
for left ventricular assessment by 3DE,24,27,28 and similar biases affecting RV measurements
could not be excluded a priori. In this view, a multi-center design is crucial for identifying
reliable normative values.
Nowadays, CMR is considered the gold standard for the assessment of RV volumes and
function, and different studies have reported RV reference values for this modality.29,30 Our
findings confirm previous studies reporting a slight systematic underestimation of RV
volumes by 3DE in comparison with CMR.26,31. The potential source of bias has been
documented in both in vivo and in vitro studies.18,32 Despite the bias in absolute values, the
role of aging, gender and anthropometric variables as determinants of RV size and function
demonstrated by Maceira et al.29 using steady-state free precession CMR are in complete
agreement with our findings. The comparison of normative non-linear equations obtained in
sssssssizizizizizizize.e.e.e.e.e.e.26
et allllll 10101010101010 tttttttooooooo aaaaaaa lalalalalalalargrgrgrrgrgr eg
e demographic and anthropometric determinants of RV mor
lti-center setting. This is an important step towards the definiti n
nce ran s. Indeed, s tematic biases amo laboratories have b
g
e ddded mograpapappphihihic ccc ananananand d ddd annnnnthththththrororopoomemmetrrriccccc dddddeteteteteterrmimim nanananaannntsssss ofofofofof RRRRRVVVVV momomommor
lti-ceentntntnn er s ttettititingn . Thhhhhiiiisi iiiiis an iiiiimportttanttttt stettt p totttt wa ddrds thththththe defififiniiiiititition
nncece rranangegegegees.s.s.s. IIIndndndnddeeeeeed,d,d,d, sssysysysysy tetetemamamamam titititt c c c c bibibibib asasasaseseses aaaaamomomomongngnggg llllabababababororororatatatttororororo ieieieiees s s s hha eve bb
by guest on April 30, 2018
http://circimaging.ahajournals.org/
Dow
nloaded from

15
our study with those presented by Kawut et al.9 obtained in a similar number of subjects,
represents an even more interesting parallelism between 3DE and CMR in the setting of RV
evaluation. Indeed (as depicted in Figure 4) normative surfaces of the present study obtained
applying the derived normative equations show similar behaviors, with exponential positive
influence of both BSA and age on RV EDV, ESV and SV. Also, from the comparison of
these two models we demonstrated that the bias between the predicted normal values by 3DE
and CMR is not constant, but has a rather strong positive linear correlation with the average
expected RV volume. Normative surfaces of RV EF were very similar, with a significant and
constant underestimation of 3DE versus CMR (approximately 7%), with narrow limits of
agreement.
From a clinical standpoint, the reliability of a quantitative method is more important that
its accuracy in comparison with the reference value obtained using a universally-accepted
“gold-standard”. Accordingly, for patient follow-up most clinicians would prefer to use a
precise method with a reproducible bias, despite less accurate, instead of using a highly
accurate method affected by large random error.33 For the first time, we evaluated the inter-
center reproducibility of 3DE RV volumes using different echocardiographic equipment and
the same post-processing software. Inter-institutional variability constitutes a serious threat
for measurement reproducibility and it is potentially the most serious source of bias in a
multicenter study. In agreement with previous study,34 we demonstrated that the definition of
a standardized method by joint consensus significantly improved the inter-center agreement.
We demonstrated that RV 3DE measurements are fairly robust and reproducible. However,
the limits of agreements of measurements among different centers were still relatively high
and, apart the described standardization of the image acquisition and post-processing steps,
further technological advances towards a fully-automated quantitation of cardiac chamber
volumes would be desirable to further improve the robustness of 3DE.
methhododododododod iiiiiiisssssss momomomomomomorerererererere imp , y q
comparison with the reference value obtained using a unive
r
with a re oducible bias, despite less accurate, instead of us
p , y q
cooooommpm arisonnnnn wwwitititii h h h hh thththththe eeee rererereefefefefeferererencceee vavaaluuuuueeeee obobobobobtaainnnededddd usisisisisinnngnn aaaaa uuuuninininin veveveveverrsrr
Acccorororoo ddiddd nglylylyyy, ,, ffof r papapapp tititititient ffofff lllllllllow-up most clililliiniiicians wo lulllld ddd pr
witithh aa rererereprprprprododododo ucucucu ibibbbblelee bbbbiaiai s,s,s,s,s, dddddesesesese pipipipipitetetee lllesesessss s s ss acacaca cucucuuurarararatetetete, ,,,, ininininststststs eaeaeaead d dd fof us
by guest on April 30, 2018
http://circimaging.ahajournals.org/
Dow
nloaded from

16
Clinical implications
Currently, echocardiographic assessment of RV size and systolic function is performed using
different methods, including qualitative eye-balling, M-mode, 2D and Doppler-derived
measurements.8 3DE is currently gaining popularity, as a more accurate and reproducible
technique for RV evaluation in various conditions. The availability of reference values
obtained in a large population of healthy subjects is an important step towards the inclusion
of 3DE in everyday clinical practice. In addition, this study confirmed the relationship of RV
volumes and function with demographic and anthropometric parameters, as it was described
by CMR,9 increasing the confidence in 3DE. The use of normative equations for indexing RV
absolute measurements would allow a better discrimination of abnormal RV size, reducing
the confounding effect of age and biometric factors. This may have a considerable impact on
an early clinical diagnosis and on research studies in diseases associated with subtle RV
abnormalities.
The multi-center design of this study highlighted the importance of applying a
standardized analysis protocol for 3DE RV assessment, with obvious benefits on serial
follow-up evaluation and on inter-center communicability. In addition, the inclusion of multi-
vendor 3D acquisitions analyzed with the only software commercially available for RV 3DE
analysis ensures a widespread applicability of the proposed normative equations.
Limitations
The generalizability of our results may be limited by the homogeneity of our study cohort
with respect to race and ethnicity.35 Furthermore, reference values in our elderly cohort ( 70
years) should be considered cautiously, given the small size of this age group.
The use of newest 3DE transducers (X5, Philips Medical Systems, Andover, MA) with
better penetration and image resolution and those with single-beat full-volume acquisition
capability might have increased the feasibility of the 3DE analyses. However, higher
f f ff abababababababnononononononormrmrmrmrmrmrmalalalalalalal RRRRRRRVVVVVVV sssssss
haveeee aaaaaaa cccccconononononononsisisissisisidedededededederrrrarabg y
diagnosis and on research studies in diseases associated w t
nter design of this stud highlighted the im rtance of
g y
didiiiagnosis ss ananandd ddd ononononon rrrrressssseeeaee rcrcrch hh studdiiiesssss ininininin dddddiiseaeeaseseseseesss asasasasassooooociciciciciatatatatedededede wwwwwit
tntnterer ddesesesesigigigign n n n ofofoof ttthihih sss stststudududuudy y y yy hihihihhighghghghghliliil ghghghghhtetetetet d d dd thththththeeee imimimimmpopopopoportrtrtrtanananancece ooff
by guest on April 30, 2018
http://circimaging.ahajournals.org/
Dow
nloaded from

17
penetration and image quality are more important when scanning real patients than
volunteers. In addition, single-beat full-volume acquisitions have either low temporal and
limited spatial resolution that may impair the accuracy of volume and ejection fraction
measurements.36
The absence of a comparison with a reference standard, such as CMR, could be regarded
as a limitation of this study. However, several studies comparing 3DE and CMR to assess RV
volumes and EF have documented the accuracy of 3DE and consistently reported smaller
volumes by 3DE than by CMR in normal subject, as well as in a variety of cardiac diseases.18
There is now enough evidence that the two techniques are different and that specific
references values are needed for each of them. Furthermore, the analysis algorithm used in
this study has been extensively validated against CMR.14,26,31,32 Moreover, limited availability
and costs of CMR, as well as ethical reasons prevented its use for studying healthy subjects
having no clinical indication for CMR examination. The inclusion of weight as a predictor
may be questionable as it may change rapidly in adults. However, the exclusion of
overweight subjects could have prevented this confounding factor.
Finally, despite subjects fulfilled all the inclusion criteria as healthy adults, we cannot
exclude the possibility of subclinical coronary artery disease, particularly in older subjects.
Conclusion
Reference values and normative equations for RV volumes and function obtained using 3DE
have been reported for the first time in a large multicenter population of healthy adults,
investigating the influence of demographic and anthropometric parameters. These results are
of significant clinical and research utility for the interpretation of 3D studies and for the
inclusion of this technique in everyday clinical practice.
hhhhhhhe e e e eee anananananananalalalalalalalysysysysysysysisisisisisisis aaaaaaalglglglglglglgororororororor
Morrrrrrreoeoeoeoeoeoeoveveveveveveverrrrrrr lllllllimimimimimimimitititititii ey g ,
R, as well as ethical reasons prevented its use for studying hea
a a
nable as it ma chan r idly in adults. However, the
y g ,
RRRRR, as well llll aaas eeeethththhthicicicicicalalalalal rrrreaeaeaeaeasososons pppreevvventntntntntededededed itstts useseeee fororororr stuuuuudydydydydyininininnggg g hhhehh a
al iiiiindndndndndicicicicication foffof r CMMMMMRRRR R examiniii atttiiion. TTTTThehhhh iiiiinclull iision offf ff weiigiii hthththh a
nanablblee asasasas iiit t t mamamam y y y y y chchchhhananana gegegegege rrrrapapapapapididididdlylylylyly iiin n n nn adadaddululllltstststs.... HoHoHoHowewewewewevevevever,r,r,r ttthhe
by guest on April 30, 2018
http://circimaging.ahajournals.org/
Dow
nloaded from

18
Disclosures
Denisa Muraru was supported by a scientific grant awarded by the European Association of
Echocardiography. Luigi P. Badano and Denisa Muraru have received equipment grants and
speakers’ honoraria from GE Vingmed. Luigi P. Badano is on the speaker’s bureau of GE
Vingmed.
References
1. Larose E, Ganz P, Reynolds G, Dorbala S, Di Carli M, Brown KA, Kwong RY. Right Ventricular Dysfunction Assessed by Cardiovascular Magnetic Resonance Imaging Predicts Poor Prognosis Late After Myocardial Infarction. J Am Coll Cardiol. 2007;49:855-862.
2. Bourantas CV, Loh HP, Bragadeesh T, Rigby AS, Lukaschuk EI, Garg S, Tweddel AC, Alamgir FM, Nikitin NP, Clark AL, Cleland JG. Relationship between right ventricular volumes measured by cardiac magnetic resonance imaging and prognosis in patients with chronic heart failure. Eur J Heart Fail. 2011;13:52-60.
3. Juillière Y, Barbier G, Feldmann L, Grentzinger A, Danchin N, Cherrier F. Additional predictive value of both left and right ventricular ejection fractions on long-term survival in idiopathic dilated cardiomyopathy. Eur Heart J. 1997;18:276-280.
4. Meyer P, Filippatos GS, Ahmed MI, Iskandrian AE, Bittner V, Perry GJ, White M, Aban IB, Mujib M, Dell’Italia L, Ahmed A. Effects of Right Ventricular Ejection Fraction on Outcomes in Chronic Systolic Heart Failure. Circulation. 2010;121:252-258.
5. Knauth AL, Gauvreau K, Powell AJ, Landzberg MJ, Walsh EP, Lock JE, Del Nido PJ, Geva T. Ventricular size and function assessed by cardiac MRI predict major adverse clinical outcomes late after tetralogy of Fallot repair. Heart. 2008;94:211-216.
6. Wolferen SA Van, Marcus JT, Boonstra A, Marques KMJ, Bronzwaer JGF, Spreeuwenberg MD, Postmus PE, Vonk-Noordegraaf A. Prognostic value of right ventricular mass, volume, and function in idiopathic pulmonary arterial hypertension. Eur Heart J. 2007;28:1250-1257.
7. Lang RM, Badano LP, Tsang W, Adams DH, Agricola E, Buck T, Faletra FF, Franke A, Hung J, Perez de Isla L, Kamp O, Kasprzak JD, Lancellotti P, Marwick TH, McCulloch ML, Monaghan MJ, Nihoyannopoulos P, Pandian NG, Pellikka PA, Pepi M, Roberson DA, Shernan SK, Shirali GS, Sugeng L, Ten Cate FJ, Vannan MA, Zamorano JL, Zoghbi WA. Recommendations for Image Acquisition and Display Using Three-Dimensional Echocardiography. Eur Heart J Cardiovasc Imaging. 2012;13:1-46.
8. Rudski LG, Lai WW, Afilalo J, Hua L, Handschumacher MD, Chandrasekaran K, Solomon SD, Louie EK, Schiller NB. Guidelines for the echocardiographic assessment of the right heart in adults: a report from the American Society of Echocardiography endorsed by the European Association of Echocardiography, a registered branch of the European Society of Cardiology, and the Canadian Society of Echocardiography. J Am Soc Echocardiogr. 2010;23:685-713.
, g ,,aaaaaaatititititititionononononononshshshshshshshipipipipipipip bbbbbbbetetetetetetetweweweweweweweeeeeeeeanceee iiiiiiimamamamagigigigiiiingngngngngngng aaaaaaandnnndndndn011 11111113333333 52525252525252 66666660000000with chronic heart failure. Eur J Heart Fail. 2011;13:52 60.
Y, Barbier G, Feldmann L, Grentzinger A, Danchin N, Cherrier Fg
n 2F WM En 0
with chronic heart failure. Eur J Heart Fail. 2011;13:52 60. Y, BBBBBaaraa biererererr GGGG,,,, Feldmann L, Grentzzinnnger A, DDDDDanchhhhhin N,,, Cherrier F
vvvvaala ue of boboooththth llllefefeffeft tttt ananananand riririririghhhttt vennntrricucuculalalalalar ejejejejejecctttionnnn ffraaaaacctccc iooooonsnsnsnsns oonnn n lololololongn idididididioioioioiopap thththththicicicic dddilatatated cccccararararardididididiommmmyoyoyoyoyopapapapp thththy.y.y.y.. EuEuEuEuEur r HeHeeearrtt JJJ. 1919191919977777;1;1;1;; 88:277666-2JJFilippatos GSSSSS,,,,, Ahmemememeeddddd MI, , IIskakkk nddddrian AAAE,E,EE, BBittnnnnereee V,, Perry GJ, WMujib M, Deeeeellllllllll’I’I’I’I’Itatatatatalililililiaa a L,LLLL AAAAAhmhmhmhmhmededededed A.AAAA EEEEEffffff ecccctstststss ooooof ffff RiRiRiRiRighghghghhtt tt VVVeVV ntricular En OOOutcomomomomomeseseses iiiiin nn n n ChChChhhrororororonininiic cc c c SySySySySystststststolololololicicicicic HHHHHeaeaeee rtrtrttt FFFFFaiaiaiiailululurerererere.... CiCiCiCiCircrcrcrcrculululululatatatatatioioioioion. 202020101010
by guest on April 30, 2018
http://circimaging.ahajournals.org/
Dow
nloaded from

19
9. Kawut SM, Lima JAC, Barr RG, Chahal H, Jain A, Tandri H, Praestgaard A, Bagiella E, Kizer JR, Craig W, Kronmal RA, Bluemke DA. Sex and race differences in right Ventricular structure and function. Circulation. 2011;123:2542:2551.
10. Tamborini G, Marsan NA, Gripari P, Maffessanti F, Brusoni D, Muratori M, Caiani EG, Fiorentini C. Reference values for right ventricular volumes and ejection fraction with real-time three-dimensional echocardiography: evaluation in a large series of normal subjects. J Am Soc Echocardiogr. 2010;23:109-115.
11. Du Bois D, Du Bois E. Clinical calorimetry: X, a formula to estimate the approximate surface area if height and weight be known. Arch Intern Med. 1916;17:863-871.
12. Lang RM, Bierig M, Devereux RM, Flachskampf F, Foster E, Pellikka PA, Picard MH, Roman MJ, Seward J, Shanewise JS, Solomon SD, Spencer KT, Sutton MSJ, Stewart WJ. Recommendations for chamber quantification. J Am Soc Echocardiogr. 2005;18:1440-1463.
13. Leibundgut G, Rohner A, Grize L, Bernheim A, Kessel-schaefer A, Bremerich J, Zellweger M, Buser P, Handke M. Dynamic assessment of right ventricular volumes and function by real-time three-dimensional echocardiography: a comparison study with magnetic resonance imaging in 100 adult patients. J Am Soc Echocardiogr. 2010;23:116-126.
14. Niemann PS, Pinho L, Balbach T, Galuschky C, Blankenhagen M, Silberbach M, Broberg C, Jerosch-Herold M, Sahn DJ. Anatomically oriented right ventricular volume measurements with dynamic three-dimensional echocardiography validated by 3-Tesla magnetic resonance imaging. J Am Coll Cardiol. 2007;50:1668-76.
15. van der Zwaan HB, Helbing WA, Mcghie JS, Geleijnse ML, Luijnenburg SE, Roos-Hesselink JW, Meijboom FJ. Clinical value of real-time three-dimensional echocardiography for right ventricular quantification in congenital heart disease: validation with cardiac magnetic resonance imaging. J Am Soc Echocardiogr. 2010;23:134-140.
16. Dewey FE, Rosenthal D, Murphy DJ, Froelicher VF, Euan AA. Contemporary reviews in cardiovascular medicine does size matter? Clinical applications of scaling cardiac size and function for body size. Circulation. 2008;117:2279-2287.
17. Badano LP, Ginghina C, Easaw J, Muraru D, Grillo MT, Lancellotti P, Pinamonti B, Coghlan G, Marra MP, Popescu BA, De Vita S. Right ventricle in pulmonary arterial hypertension: haemodynamics, structural changes, imaging, and proposal of a study protocol aimed to assess remodelling and treatment effects. Eur J Echocardiogr. 2010;11:27-37.
18. Shimada YJ, Shiota M, Siegel RJ, Shiota T. Accuracy of right ventricular volumes and function determined by three-dimensional echocardiography in comparison with magnetic resonance imaging: a meta-analysis study. J Am Soc Echocardiogr. 2010;23:943-953.
19. Mor-Avi V, Sugeng L, Lindner JR. Imaging the forgotten chamber: is the devil in the boundary? J Am Soc Echocardiogr. 2010;23:141-143.
20. De Castro S, Cavarretta E, Milan A, Caselli S, Di Angelantonio E, Carmine DV, Lucchetti D, Patel A, Kuvin J, Pandian NG. Usefulness of tricuspid annular velocity in identifying global RV dysfunction in patients with primary pulmonary hypertension: a comparison with 3D echo-derived right ventricular ejection fraction. Echocardiography. 2008;25:289-293.
21. Fusini L, Tamborini G, Gripari P, Maffessanti F, Mazzanti V, Muratori M, Salvi L, Sisillo E, Caiani EG, Alamanni F, Fiorentini C, Pepi M. Feasibility of intraoperative three-dimensional transesophageal echocardiography in the evaluation of right
hhhhhhhagagagagagagagenenenenenenen MMMMMMM, , , , , ,, SiSiSiSiSiSiSilblblblblblblberererererererbbbbbbbienteteteteteeed dddddd riririririririghghghghghghghttt tttt veveveveeveventntntntntntntrrchocccccccararararararardididididididiogogogogogogogrararararararaphphphphphphphyyy g p y
a 6waan HB, Helbing WA, Mcghie JS, Geleijnse ML, Luijnenburg
ao
o3
E Rosenthal D Murphy DJ Froelicher VF Euan AA Contempo
y g p yagngngngngneeetete iic rrrrreeese onononono ance imaging. J Ammm CCColl Cardddddiol. 222022 07;50:1668-76wawawaww aana HB, HHHHHelelelbbibbb ngngngngng WWWWWA,A,A,A,A, MMMMMcccghihihihh e JSJSS, GeGeGeGeGeleleleleleijjjjjnsnsse MLMLMLMML,, LuLuLuLuLuijijijijijnenenenen nbnbnbnbn urururururgggJWJWJWJWJW,, Meijijijijijbooomomom FJ.... CCCCClininininin cacaal vavaaluee offfff rrrrreaaall-tiimmme tthhhreeeeeeeeee-dimmmmmennsiononna
ograpapppphyhyhyhyhy for rigigigighththt ventttriiciii ullllar quantititiififififiicatitititiion iiiin congenitititittal hhhhhea ttrt ddddwith cardiaccccc mamamamamagngngngngneteteticicicicic rrrrresesesesesonononononananananancececcec iiiiimamamamamagiiingngngngng.... JJ J JJ AmAmAmAAm SSSSSococoococ Echocardio333444-141414000.
EEE RRRosososenenenthththalalal DDD MuMuMurprprphyhyhy DDDJJJ FFFrororoelelelicicicheheherrr VFVFVF EuEuEuananan AAAAAA CCCononontetetempmpmpooo
by guest on April 30, 2018
http://circimaging.ahajournals.org/
Dow
nloaded from
20
ventricular volumes and function in patients undergoing cardiac surgery. J Am Soc Echocardiogr. 2011; 24:868-877.
22. Grewal J, Majdalany D, Syed I, Pellikka P, Warnes CA. Three-dimensional echocardiographic assessment of right ventricular volume and function in adult patients with congenital heart disease: comparison with magnetic resonance imaging. JAm Soc Echocardiogr. 2010; 23:127-133.
23. Sluysmans T, Colan SD. Theoretical and empirical derivation of cardiovascular allometric relationships in children. J Appl Physiol. 2005;99:445-457.
24. Mawad W, Drolet C, Dahdah N, Dallaire F. A review and critique of the statistical methods used to generate reference values in pediatric echocardiography. J Am Soc Echocardiogr. 2012;26:29-37.
25. D’Oronzio U, Senn O, Biaggi P, Gruner C, Jenni R, Tanner FC, Greutmann M. Right heart assessment by echocardiography: gender and body size matters. J Am Soc Echocardiogr. 2012;25:1-8.
26. Gopal AS, Chukwu EO, Iwuchukwu CJ, Katz AS, Toole RS, Schapiro W, Reichek N. Normal values of right ventricular size and function by real-time 3-dimensional echocardiography: comparison with cardiac magnetic resonance imaging. J Am Soc Echocardiogr. 2007;20:445-455.
27. Lipshultz SE, Easley KA, Orav EJ, Kaplan S, Starc TJ, Bricker JT, Lai WW, Moodie DS, Sopko G, Schluchter MD, Colan SD. Reliability of multicenter pediatric chocardiographic measurements of left ventricular structure and function: the prospective P2C2 HIV study. Circulation. 2001;104:310-316.
28. Mor-Avi V, Jenkins C, Kuhl HP, Nesser HJ, Marwick T, Franke A, Ebner C, Freed BH, Steringer-Mascherbauer R, Pollard H, Weinert L, Niel J, Sugeng L, Lang RM. Real-time 3-dimensional echocardiographic quantification of left ventricular volumes. J Am Coll Cardiol Img. 2008;1:413-423.
29. Maceira AM, Prasad SK, Khan M, Pennell DJ. Reference right ventricular systolic and diastolic function normalized to age , gender and body surface area from steady-state free precession cardiovascular magnetic resonance. Eur Heart J. 2006;27:2879-2888.
30. Tandri H, Daya SK, Nasir K, Bomma C, Lima JAC, Calkins H, Bluemke DA. Normal reference values for the adult right ventricle by magnetic resonance imaging. Am J Cardiol. 2006; 98:1660-1664.
31. Kjaergaard J, Petersen CL, Kjaer A, Schaadt BK, Oh JK, Hassager C. Evaluation of right ventricular volume and function by 2D and 3D echocardiography compared to MRI. Eur J Echocardiogr. 2006;7:430-438.
32. Sugeng L, Mor-Avi V, Weinert L, Niel J, Ebner C, Steringer-Mascherbauer R, Bartolles R, Baumann R, Schummers G, Lang RM, Nesser H-J. Multimodality comparison of quantitative volumetric analysis of the right ventricle. J Am Coll Cardiol Img. 2010; 3:10-18.
33. Marwick TH. Consistency of myocardial deformation imaging between vendors. Eur J Echocardiogr. 2010;11:414-416.
34. Beerbaum P, Barth P, Kropf S, Sarikouch S, Kelter-Kloepping A, Franke D, Gutberlet M, Kuehne T. Cardiac function by MRI in congenital heart disease: impact of consensus training on interinstitutional variance. J Magn Reson Imaging. 2009;30:956-966.
35. Willis J, Augustine D, Shah R, Stevens C, Easaw J. Right ventricular normal measurements: time to index? J Am Soc Echocardiogr. 2012;25:1259-1267.
36. Macron L, Lim P, Bensaid A, Nahum J, Dussault C, Mitchell-Heggs L, Dubois-Randé JL, Deux JF, Gueret P. Single-beat versus multibeat real-time 3D echocardiography for
rrrrrrricicicicicicickekekekekekeker r r r r rr JTJTJTJTJTJTJT,,,,,,, LaLaLaLaLaLaLaiiiiiii WWWWWWWmultiiiiiiicececececececentntntntntntntererererererer pppppppededededededediaiaiaiaiaiaiatttttture anananannananddddddd fufufufufufufuncncncncncncnctititititititiononononoono :g p
vV, Jenkins C, Kuhl HP, Nesser HJ, Marwick T, Franke A, Ebnernger-Mascherbauer R, Pollard H, Weinert L, Niel J, Sugeng L, L
AM, Prasad SK, Khan M, Pennell DJ. Reference right ventricularunction normalized to age gender and body surface area from sr
g pve PPPPP22222CCCCC22222 HHHHHIVVVVV study. Circulation. 20202022 01;104:3333310111 -3333316. VVVVV, JJJeJ nkins C,CCCC KKKKKuhuhuhuhuhlll ll HPHPHPHPHP,,,, NeNeNeNN ssssererr HJ,J,, MMMMMaraaararwwwiwiw ckckck TTTTT, FFFrananananankekekekeke AAAAA, EbEbEbEbEbnenenennerngegegegeger-rrrr Mascscccscheheerbauauauerrrr RRRRR, PoPoPoPoPolllaaardd d HHH, WWWeieieieieinenenerrt LL,,,,, Niieeel JJJJJ, Suuugegegegg ngng LL, L3-dididididimemememm nsioii naal lll echocardiographihihiiic quantttttififffific ttatttioii n offfff llllleffffft ve ttnttriiiicuCardiol Imggggg... 20202020200808080808;1;1;11:4:4:4:4:41313131313-4-4-4-4-42323232323. .. ..
AAAMMM, PPPrarasasasasad d dd SKSKSKK, ,,,, KhKhKhKKhanananaa MMMM, PePePePeP nnnnnnnnnelelelele llll DJDJDJDJ.. ReReReRRefefefeerererencncncncn e e e ririririr ghghghghght t t tt veveveventntntn iriccullarruuuncncnctititiononon nnnororormamamalililizezezeddd tototo aaagegege gggenenendedederrr aaandndnd bbbodododyyy sususurfrfrfacacaceee ararareaeaea fffrororommm sssrrr
by guest on April 30, 2018
http://circimaging.ahajournals.org/
Dow
nloaded from

21
assessing left ventricular volumes and ejection fraction: a comparison study with cardiac magnetic resonance. Circ Cardiovasc Imaging. 2010;3:450-455.
by guest on April 30, 2018
http://circimaging.ahajournals.org/
Dow
nloaded from

22
Table 1. Clinical, echocardiographic and demographic characteristics of study population
All (n=507)
Women (n=260)
Men (n=247)
p-value
Age (years) 45±16 47±16 43±16 <0.01
Height (cm) 170±9 164±6 177±7 <0.01
Weight (kg) 69±12 61±9 77±10 <0.01
BMI (kg/m2) 23.8±3.3 23.0±3.4 24.7±3.0 <0.01
BSA (m2) 1.79±0.19 1.66±0.12 1.93±0.14 <0.01
Systolic blood pressure (mmHg) 121±15 117±14 125±14 <0.01
Diastolic blood pressure (mmHg) 73±10 71±10 75±9 <0.01
Heart rate (bpm) 68±11 69±11 67±11 0.02
RV systolic pressure (mmHg) 24.5±5.4 24.7±5.3 24.2±5.6 0.37
TAPSE (mm) 24.7±3.0 24.5±2.8 24.9±3.2 0.22
RV ED Area (cm2) 18.0±4.2 15.7±2.8 20.8±3.9 <0.01
RV ES Area (cm2) 9.2±2.6 7.9±1.8 10.8±2.6 <0.01
RV FAC (%) 49±8 50±7 48±8 <0.01
LV EDV (ml) 95±20 83±13 108±18 <0.01
LV ESV (ml) 36±11 30±8 42±11 <0.01
LV EF (%) 63±7 64±7 62±7 <0.01
Values reported as mean ± standard deviation.
p-value refers to unpaired Student’s t-test, Women vs Men.
RV systolic pressure gradient was feasible in 373 (74%) subjects.
Abbreviations: bpm, beats per minute; BMI, body mass index; BSA, body surface area; EDA, end-diastolic area; ESA, end-systolic area; EDV, end-diastolic volume; EF, ejection fraction; ESV, end-systolic volume; FAC, fractional area change; LV, left ventricular; RV, right ventricular; TAPSE, tricuspid annulus peak systolic excursion.
67676767676767±1±1±1±11111111111
24242424242424.2.2.2.2222±5±5±5±5±5±5±5.6.6.6.66.66
m
m
242424242 .7.77.7±3±3±3±3.0.00.0 222224.4444 5±5±5±5±5±2.2.2.2 888 2424242424.99.99±3±3±3±3±3.2.2.2.22
m22222))))) 181111 .00000±4±4±4±4±4.2.2.2.2.2 1515151515.7.7.7.7.7±2±2±2±2± .8.8.8.88 2020202020.8.8.8±3±3±3±3±3.9.9.9
m2) ) 9.9999 2±2±2±2±2±22.222 6 6666 77.7 9±9±9±99±1.1111 8888 10.8±2.6
by guest on April 30, 2018
http://circimaging.ahajournals.org/
Dow
nloaded from

23
Table 2. Normal ranges for 3D echocardiographic RV EDV, ESV and EF by gender and age decade.
Unless otherwise stated, all Women vs Men comparisons are significant (p<0.01)
RV EDV (ml) RV ESV (ml)
Age (years) n (Women,Men) All Women Men All Women Men
<30 114 (46,68) 105 (69,183) 88 (66,136) 122 (80,189) 46 (18,88)
35 (14,71) 51 (30,94)
30-39 98 (50,48) 92 (64,147) 85 (63,117) 114 (72,153) 36 (18,67)
31 (17,52) 45 (25,66)
40-49 98 (53,45) 90 (63,132) 82 (64,106) 101 (75,137) 35 (16,54)
30 (15,44) 40 (23,62)
50-59 91 (49,42) 90 (62,138) 79 (62,117) 101 (72,138) 33 (18,62)
29 (18,46) 37 (22,63)
60-69 69 (39,30) 85 (47,139) 79 (43,100) 98 (76,149) 32 (14,61)
30 (13,40) 37 (20,68)
70 37 (23,14) 77 (50, 125) 70 (51,86) 98 (64,129) 23 (11,53)
20 (12,32) 34 (18,54)
All 507 (260,247) 91 (61,150) 81 (58,120) 107 (74,163) 35 (16,72)
30 (15,52) 44 (22,80)
RV SV (ml) RV EF (%)
Age (years) n (Women,Men) All Women Men All Women Men
<30 114 (46,68) 63 (41,95) 56 (42,77) 69 (41,101) 58 (42,75)
60 (45,80) 56 (42,68)
30-39 98 (50,48) 60 (36, 93) 56 (38,72) 68(37,97) 61 (48,76)
63 (52,77) 60 (48,72)
40-49 98 (53,45) 56 (37,82) 51 (39,71) 63 (39,86) 63 (51,79)
65 (50,79) 61 (51,75)
50-59 91 (49,42) 56 (35,78) 50 (35,68) 63 (44,84) 62 (46,75)
62 (47,76) 62 (45,73), p=0.51
60-69 69 (39,30) 52 (28,85) 49 (25,61) 64 (48,88) 61 (50,79)
61 (53,75) 63 (50,78), p=0.75
70 37 (23,14) 54 (31,77) 49 (31,64) 61 (45,79) 68 (56,81)
71 (60,81) 65 (56,75)
32222222 (14,61616161616161)))))))
30303030303030 (((((((13131313131313 44,4,44,44
3
5
77 (50000, 12121212125)55)5) 777770 0 000 (5(5(5(5(51,1,1,11,8686868686))) 98999 (6664,111112929292929) ) ) )) 233333(1111,5535 )
2020202020 (((((1212121212,3
91 (61,1500000) ))) 818181811 (((((5858585858,1,,1,12020202020) )))) 101010101 777 7 (7(7(7(7(74,4,4,4,4,1611 3)3)33)) 3535353535 (1(1(1( 6,66,6 7272727272))
30 (15,5
by guest on April 30, 2018
http://circimaging.ahajournals.org/
Dow
nloaded from

24
All 507 (260,247) 57 (36,87) 52 (35,72) 66 (40,91) 62 (47,77)
63 (49,79) 60 (45,75)
Data expressed median (5th, 95th percentile).
p-value refers to unpaired Student’s t-test, Women vs Men.
Abbreviations: EDV, end-diastolic volume; EF, ejection fraction; ESV, end-systolic volume; RV, right ventricular; SV, stroke volume.
by guest on April 30, 2018
http://circimaging.ahajournals.org/
Dow
nloaded from

25
Table 3. Pearson correlation coefficients of 3D right ventricular parameters with age and body size
parameters
RV EDV RV ESV RV SV RV EF
Age -0.36* -0.37* -0.25* 0.24*
Height 0.54* 0.46* 0.49* -0.20*
Weight 0.47* 0.38* 0.44* -0.16*
BMI 0.17* 0.13* 0.17* -0.05
BSA 0.55* 0.45* 0.50* -0.19*
*: correlation is significant at the 0.01 level (two-tailed t test)
Abbreviations: BMI, body mass index; BSA, body surface area; EDV, end-diastolic volume; EF, ejection fraction; ESV, end-systolic volume; RV, right ventricular; SV, stroke volume. e.
by guest on April 30, 2018
http://circimaging.ahajournals.org/
Dow
nloaded from

Table 4. Results of the multivariate linear regression for right ventricular measurements, adjusted for gender, and age (Model AGr, ratiometric), age and BSA
(Model AGBr, ratiometric, or Model AGBa, allometric), age, height and weight (Model AGHWr, ratiometric). Data presented as model coefficient ( ), 95%
confidence interval (CI), and Pearson’s correlation coefficient (r2)
RV EDV (ml) RV ESV (ml) RV SV (mL) RV EF (%)
(95% CI) r2 (95% CI) r2 (95% CI) r2 (95% CI) r2
Model AGr 0.34 0.29 0.22 0.10
Constant 108.2 (101.6, 114.7)* 46.6 (42.6, 50.6)* 61.6 (57.6, 65.5)* 58.0 (55.6, 60.4)*
Gender 25.9 (21.9, 30.0)* 13.3 (10.8, 15.7)* 12.7 (10.2, 15.1)* -3.4 (-4.9, -1.9)*
Age (years) -0.53 (-0.66, -0.40)* -0.34 (-0.41, -0.26)* -0.19 (-0.27, -0.12)* 0.12 (0.08, 0.17)*
Model AGBr 0.42 0.34 0.30 0.10
Constant 15.7 (-9.6, 41.0) 7.1 (-8.9, 23.2) 8.6 (-6.8, 23.9) 62.0 (52.0, 71.9)*
Gender 11.4 (5.9, 17.0)* 7.3 (3.7, 10.8)* 4.2 (0.8, 7.6)* -2.9 (-5.1, -0.7)*
Age (years) -0.55 (-0.67, -0.43)* -0.35 (-0.43, -0.27)* -0.20 (-0.27, -0.12)* 0.13 (0.08, 0.18)*
BSA (m2) 56.2 (41.5, 70.9)* 24.2 (14.9, 33.5)* 32.0 (23.1, 40.9)* -2.5 (-8.3, 3.2)
Model AGHWr 0.42 0.34 0.30 0.10
Constant -15.5 (-66.8, 35.9) -0.2 (-32.8, 32.4) -15.2 (-46.4, 15.9) 55.8 (35.7, 76.0)*
Gender 11.2 (5.4, 16.9)* 7.4 (3.7, 11.0)* 3.8 (0.3, 7.3)* -3.2 (-5.4, -0.9)*
Age (years) -0.53 (-0.66, -0.40)* -0.35 (-0.43, -0.27)* -0.18 (-0.26, -0.10)* 0.13 (0.08, 0.18)*
Height (cm) 0.55 (0.23, 0.88)* 0.19 (0.01, 0.40)* 0.36 (0.16, 0.55)* 0.03 (-0.10, 0.16)
11111112.2.22222 7 7 77777 (1(1(1(1(1(1(10.0.0.0.0.0.0.2,2,2,2,2,2,2,
, -0.34 (((-0.41, -0 22.226)66 * -0.19 (-0.27,
0.444442 2222 00000.3.3.3.3344444
77777.1111 ((((( 888-88 999.99,,, 2323232323 22.222)))) 8.6 (-(( 6.8,,,
by guest on April 30, 2018
http://circimaging.ahajournals.org/
Dow
nloaded from
27
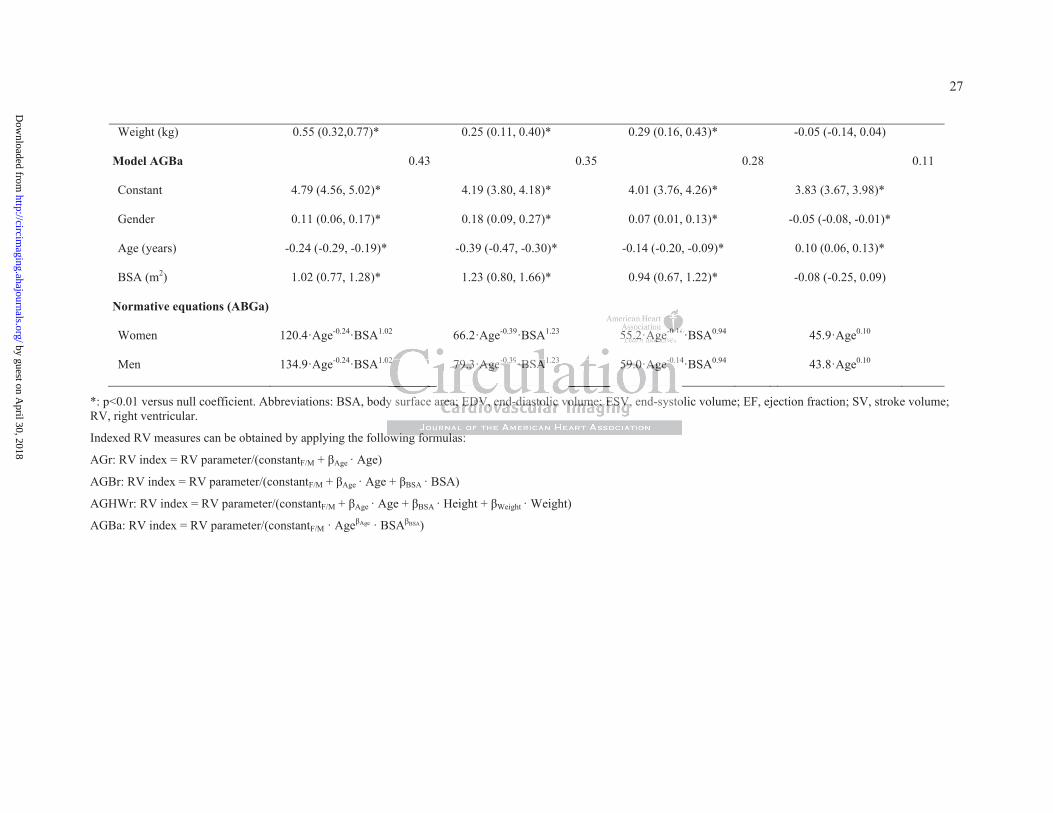
Weight (kg) 0.55 (0.32,0.77)* 0.25 (0.11, 0.40)* 0.29 (0.16, 0.43)* -0.05 (-0.14, 0.04)
Model AGBa 0.43 0.35 0.28 0.11
Constant 4.79 (4.56, 5.02)* 4.19 (3.80, 4.18)* 4.01 (3.76, 4.26)* 3.83 (3.67, 3.98)*
Gender 0.11 (0.06, 0.17)* 0.18 (0.09, 0.27)* 0.07 (0.01, 0.13)* -0.05 (-0.08, -0.01)*
Age (years) -0.24 (-0.29, -0.19)* -0.39 (-0.47, -0.30)* -0.14 (-0.20, -0.09)* 0.10 (0.06, 0.13)*
BSA (m2) 1.02 (0.77, 1.28)* 1.23 (0.80, 1.66)* 0.94 (0.67, 1.22)* -0.08 (-0.25, 0.09)
Normative equations (ABGa)
Women 120.4·Age-0.24·BSA1.02 66.2·Age-0.39·BSA1.23 55.2·Age-0.14·BSA0.94 45.9·Age0.10
Men 134.9·Age-0.24·BSA1.02 79.3·Age-0.39·BSA1.23 59.0·Age-0.14·BSA0.94 43.8·Age0.10
*: p<0.01 versus null coefficient. Abbreviations: BSA, body surface area; EDV, end-diastolic volume; ESV, end-systolic volume; EF, ejection fraction; SV, stroke volume; RV, right ventricular.
Indexed RV measures can be obtained by applying the following formulas:
AGr: RV index = RV parameter/(constantF/M + Age · Age)
AGBr: RV index = RV parameter/(constantF/M + Age · Age + BSA · BSA)
AGHWr: RV index = RV parameter/(constantF/M + Age · Age + BSA · Height + Weight · Weight)
AGBa: RV index = RV parameter/(constantF/M · Age Age · BSA BSA)
55555555.2.2.2.2.2.2·A·AAAAAAgegegegegegege-0-0-0-0.-0.-0.-0 141411111
0 4
y surface area ED end-diastolic volum ESV end- sto
owing formulas:
02222 7979797979.3.3.3.33·A·A·A·A·Agegegegege-0.39·B·BBBSAAA1.23 5959595959.0.0.0.0.0·AA·A·AAgegegegege-0.14
y surface arrrrreaeaeaeaea; ; ; ; EDEDEDEDEDV,V,V,V,V, eeeendnddndnd-dddddiaiaiaiaiaststststs olololloliciciccic vvvolololololumumumumume;e;e;e;e; EEEEESVSVSVSVSV, end-systo
owiiing ffform llulas:
by guest on April 30, 2018
http://circimaging.ahajournals.org/
Dow
nloaded from
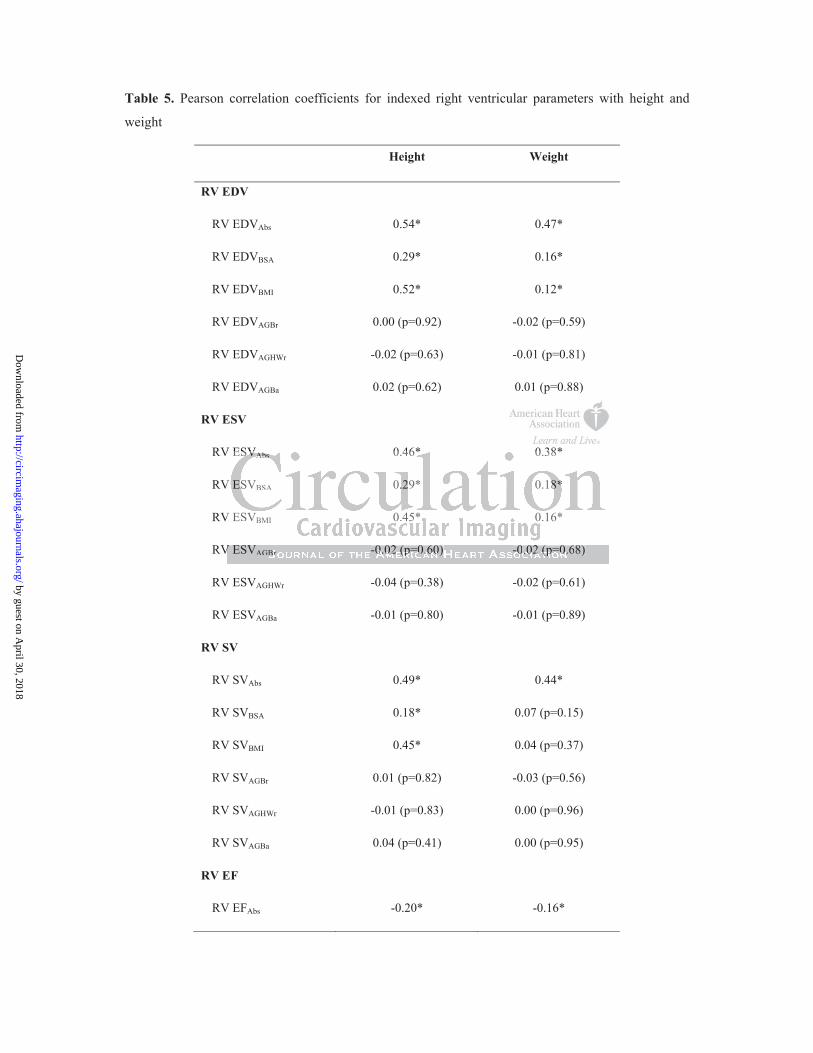
Table 5. Pearson correlation coefficients for indexed right ventricular parameters with height and
weight
Height Weight
RV EDV
RV EDVAbs 0.54* 0.47*
RV EDVBSA 0.29* 0.16*
RV EDVBMI 0.52* 0.12*
RV EDVAGBr 0.00 (p=0.92) -0.02 (p=0.59)
RV EDVAGHWr -0.02 (p=0.63) -0.01 (p=0.81)
RV EDVAGBa 0.02 (p=0.62) 0.01 (p=0.88)
RV ESV
RV ESVAbs 0.46* 0.38*
RV ESVBSA 0.29* 0.18*
RV ESVBMI 0.45* 0.16*
RV ESVAGBr -0.02 (p=0.60) -0.02 (p=0.68)
RV ESVAGHWr -0.04 (p=0.38) -0.02 (p=0.61)
RV ESVAGBa -0.01 (p=0.80) -0.01 (p=0.89)
RV SV
RV SVAbs 0.49* 0.44*
RV SVBSA 0.18* 0.07 (p=0.15)
RV SVBMI 0.45* 0.04 (p=0.37)
RV SVAGBr 0.01 (p=0.82) -0.03 (p=0.56)
RV SVAGHWr -0.01 (p=0.83) 0.00 (p=0.96)
RV SVAGBa 0.04 (p=0.41) 0.00 (p=0.95)
RV EF
RV EFAbs -0.20* -0.16*
V ESV 0 46* 0 38*
V
V
V
V ESVSVSVSVS AbsAbsAbsAbsAbs 0.46* 0.38*
V ESVBSA 0.2.229* 0.18*8*8*8*8*
V ESVBMI 0.45* 0.16*
VV EESSVSVAGBBrr -0-0-000.0.0.022222 (p(p(p(p(p=0=0=00.6.6.6.6.60)0)0)00 -0-0-000.0.0.00.02222 (p(p(pp(p=0=0=000.6.6.6. 8)8)8)
by guest on April 30, 2018
http://circimaging.ahajournals.org/
Dow
nloaded from

29
Abbreviations: Abs, absolute value; BMI, body mass index; BSA, body surface area; AGBa, adjusted for age and BSA (allometric); AGBr, adjusted for age, gender and BSA (ratiometric); AGHWr, adjusted for age, gender, height and weight (ratiometric); EDV, end-diastolic volume; EF, ejection fraction; ESV, end-systolic volume; RV, right ventricular, SV, stroke volume.
*: correlation is significant at the 0.01 level (2-tailed t-test).
RV EFBSA -0.59* -0.63*
RV EFBMI -0.17* -0.63*
RV EFAGBr 0.02 (p=0.70) -0.01 (p=0.83)
RV EFAGHWr 0.00 (p=0.95) 0.00 (p=0.99)
RV EFAGBa 0.03 (p=0.52) -0.01 (p=0.84)
by guest on April 30, 2018
http://circimaging.ahajournals.org/
Dow
nloaded from

30
Table 6. Results of reproducibility analysis, evaluated using Pearson correlation coefficient (r2),
Bland-Altman analysis (BA) and coefficient of variation (CV) between repeated measurements
End-Diastolic Volume End-Systolic Volume
r2 BA (ml) CV (%) r2 BA (ml) CV (%)
Intra-operator C1 0.94 0.6±5.1 2.0 0.92 0.7±4.3 5.5
C2 0.96 0.4±5.8 3.8 0.91 1.2±5.2 6.8
C3 0.91 0.3±11.5 4.6 0.76 1.5±8.5 8.6
Inter-center C1vsC2 0.58 -9±33 12.1 0.60 -3±13 12.3
C1vsC3 0.87 -3±15 6.8 0.63 -5±13 15.2
C2vsC3 0.58 6±33 12.1 0.43 -2±17 14.1
Values expressed as bias±1.96 standard deviation.
Abbreviations: BA, Bland-Altman analysis; CV, coefficient of variation.
Bland-Altman analysis; CV, coefficient of variation.Blaaandndndndnd-A-A-A-A-Altltltlltmamamamaman n nn n analysis; CV, coefficiennnnnt t tt t ofoooo variation.
by guest on April 30, 2018
http://circimaging.ahajournals.org/
Dow
nloaded from

31
Figure Legends
Figure 1. Example of the three-dimensional reconstruction of the right ventricle: the 3D
dataset acquired from an apical view, specifically adapted to better visualize the right
ventricle, as seen in a cut-plane mimicking a 4-chamber view (A) and in a multi-planar short
axis view, useful to confirm the inclusion of the endocardial borders (B); the rough model
obtained immediately after manual initialization of the endocardial wall projected on the
sagittal, 4-chamber and coronal views (C), and the obtained 3D model of the right ventricle,
depicted in its systolic configuration together with the end-diastolic wireframe model and the
volume curve (D).
Figure 2. Right ventricular (RV) end-diastolic (EDVi, left panel) and end-systolic (ESVi,
right panel) volume indexed to body surface area (BSA); values are shown as mean±SD,
separately for women and men. The numbers indicate the number of patients in each age
decade (women, men).
Figure 3. Comparison between predicted values obtained by applying to our study population
the normative equations derived using 3D echocardiography and those obtained, in the same
population, by applying normative equations by Kawut et al.9 derived using cardiovascular
magnetic resonance (gray surface). Scatter plot (bottom) represents the difference between
the predicted values ( CMR-3DE) as a function of the average predicted value. From top to
bottom, left to right: right ventricular end-diastolic (EDV), end-systolic (ESV) and stroke
(SV) volumes, and ejection fraction (EF). Pearson correlation coefficient (R2) between
EDVCMR-3DE and EDVavg.
y
ume indexed to body surface area (BSA); values are shown a
omen and men. The numbers indicate the number of atients
vvvveene tricularararrr (RVRVRVRVRV)) ))) enenenenend-d-d-d-d-dididididiasasastooliilic (E(EEDVDVDVDVDViiiii, leeftftft ppppanananelelelelel) ) ) )) ananananand dddd enenennend-d-d-d-d-ssysss
ume inininininddeddd xeddd tott bbbodddddy yy y surffffface area (((((BSBSBSBSBSAA)AAA ; valllues are shohhhh wn a
omomenen aandndndndn mmmmenenenen. ThThThTT e e e nununun mbmbmbmmbererererrssss inininini didididdicacacaaatetetetee ttthehehh nnnnumumumumbebebebeb r r r ofofofoff pppp tatatiie tntntss
by guest on April 30, 2018
http://circimaging.ahajournals.org/
Dow
nloaded from
32
Figure 4. Comparison between predicted values obtained by applying to our study population
the normative equations derived using 3D echocardiography (red surface) and those obtained,
in the same population, by applying normative equations by Kawut et al.9 derived using
cardiovascular magnetic resonance (gray surface). Normative surfaces are shown as a
function of body surface area (BSA) and age, separately for women and men.
by guest on April 30, 2018
http://circimaging.ahajournals.org/
Dow
nloaded from

by guest on April 30, 2018
http://circimaging.ahajournals.org/
Dow
nloaded from

Figure 2
<30 30-39 40-49 50-59 60-69 0
20
40
60
80
100
<30 30-39 40-49 50-59 60-69 0
10
20
30
40
50 RV EDVi RV ESVi
Age (years) Age (years)
Volu
me/
BSA
(ml/m
2 )
Volu
me/
BSA
(ml/m
2 )
Women Men
114 (46,68) 98
(50,48) 98
(53,45) 91
(49,42) 69 (39,30)
(23,14)
e
303000
eee/////BBBBBSSSSS
AAAAA (((((mmmmm
l
by guest on April 30, 2018
http://circimaging.ahajournals.org/
Dow
nloaded from
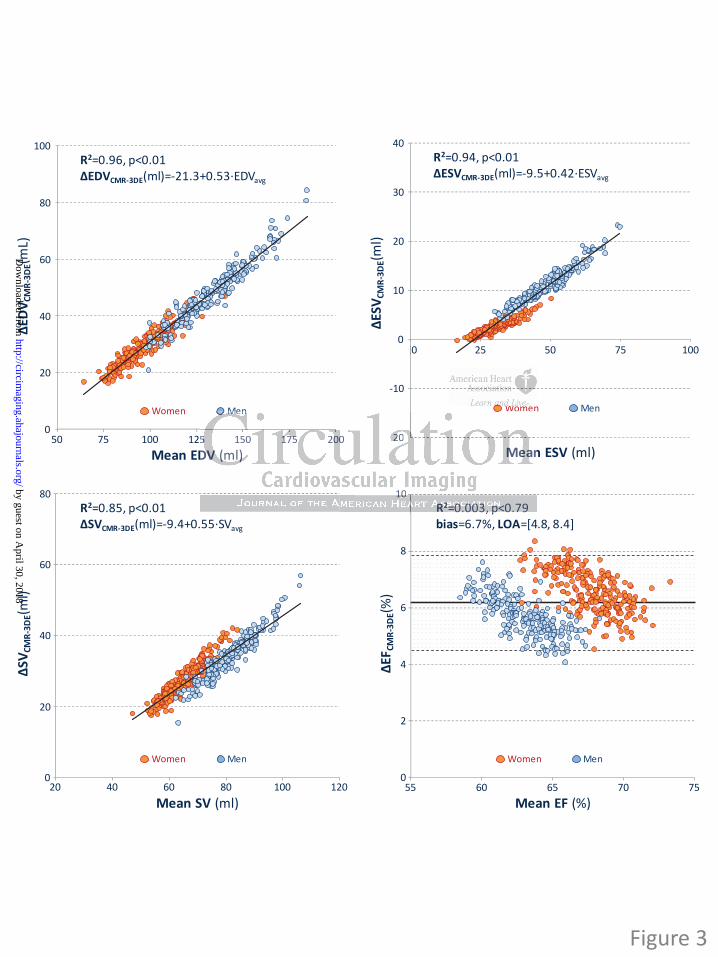
500
Mean EDV (ml)
EDV C
MR-
3DE(m
L)
Women Men
75 100 125 150 175 200
20
40
60
80
100R2=0.96, p<0.01
CMR-3DE(ml)=-21.3+0.53·EDVavg
0 25 50 75 100
-20Mean ESV (ml)
ESV C
MR-
3DE(m
l)
Women Men
-10
10
20
30
40R2=0.94, p<0.01
CMR-3DE(ml)=-9.5+0.42·ESVavg
025 50 75 1000
0
Mean SV (ml)
SVCM
R-3D
E(ml)
Women Men
20
40
60
80R2=0.85, p<0.01
CMR-3DE(ml)=-9.4+0.55·SVavg
40 60 80 12020 100 550
Mean EF (%)
EFCM
R-3D
E(%)
Women Men
60 65 70 75
2
4
6
8
10R2=0.003, p<0.79bias=6.7%, LOA=[4.8, 8.4]
Figure 3
WWWWWW
D
Men
5n
o e
, p
DVDVDVDVDV (m(m((m(ml)l))l)l)
MenMenMenMenn
55 150 111117575757575 20000 -----222022MeMeMeaaan
1010RRRRR22222=00=0=00.0.0.000030300303,,, p<p<p<p<0.0.0.797979
by guest on April 30, 2018
http://circimaging.ahajournals.org/
Dow
nloaded from

Women Men
7060
5040
3020
50
75
100
125
150
175
200
225
250
1.9
RV E
DV (m
l)
Age (years)1.8
BSA (ml/m2)1.7
1.61.5
7060
5040
3020
50
75
100
125
150
175
200
225
250
2.1
RV E
DV (m
l)
Age (years)2.0
BSA (ml/m2)1.9
1.81.7
Women Men
7060
5040
3020
0
25
50
75
100
1.9
RV E
SV (m
l)
Age (years)1.8
BSA (ml/m2)1.7
1.61.5
7060
5040
3020
0
25
10
75
100
2.1
RV E
SV (m
l)
Age (years)2.0
BSA (ml/m2)1.9
1.81.7
Women
7060
5040
3020
0
25
50
75
150
1.9
RV S
V (m
l)
Age (years)1.8
BSA (ml/m2)1.7
1.61.5
125
100
Men
1.970
6050
4030
20
0
25
10
75
150
2.1
RV S
V (m
l)
Age (years)2.0
BSA (ml/m2)1.9
1.81.7
125
100
Women Men
7060
5040
3020
50
60
70
80
100
1.9
RV E
F (%
)
Age (years)1.8
BSA (ml/m2)1.7
1.61.5
7060
5040
3020
50
60
70
80
100
2.1
RV E
F (%
)
Age (years)2.0
BSA (ml/m2)1.9
1.81.7
90 90
Figure 4
90030
020
1.91.8
BSABSASABSABSA (( l(ml( /m/m/m/m/m222)1.7
1.61.5
660050
004040300
2000AAgegegegege (yyeyyy arsarsaa ) BSABSBSBSBS
1.91.8888
1.7
Womennnnn MMMeMM n by guest on April 30, 2018
http://circimaging.ahajournals.org/
Dow
nloaded from

Santoro, Gloria Tamborini, Maurizio Galderisi, Mauro Pepi and Luigi P. BadanoFrancesco Maffessanti, Denisa Muraru, Roberta Esposito, Paola Gripari, Davide Ermacora, Ciro
Study in 507 Healthy VolunteersEjection Fraction by Three-dimensional Echocardiography: A Multicenter Echocardiographic
Age-, Body Size- and Gender-specific Reference Values for Right Ventricular Volumes and
Print ISSN: 1941-9651. Online ISSN: 1942-0080 Copyright © 2013 American Heart Association, Inc. All rights reserved.
TX 75231is published by the American Heart Association, 7272 Greenville Avenue, Dallas,Circulation: Cardiovascular Imaging
published online June 27, 2013;Circ Cardiovasc Imaging.
http://circimaging.ahajournals.org/content/early/2013/06/27/CIRCIMAGING.113.000706World Wide Web at:
The online version of this article, along with updated information and services, is located on the
http://circimaging.ahajournals.org/content/suppl/2013/06/27/CIRCIMAGING.113.000706.DC1Data Supplement (unedited) at:
http://circimaging.ahajournals.org//subscriptions/
is online at: Circulation: Cardiovascular Imaging Information about subscribing to Subscriptions:
http://www.lww.com/reprints Information about reprints can be found online at: Reprints:
document. Permissions and Rights Question and Answer this process is available in the
located, click Request Permissions in the middle column of the Web page under Services. Further information aboutnot the Editorial Office. Once the online version of the published article for which permission is being requested is
can be obtained via RightsLink, a service of the Copyright Clearance Center,Circulation: Cardiovascular Imaging Requests for permissions to reproduce figures, tables, or portions of articles originally published inPermissions:
by guest on April 30, 2018
http://circimaging.ahajournals.org/
Dow
nloaded from

S1
SUPPLEMENTAL MATERIAL
Supplemental Methods
Reproducibility and quality control
An investigator meeting was hold to perform a joint 3DE analysis on random RV datasets, aiming at
identifying the potential sources of bias, leading to weak inter-center reproducibility, and to harmonize
the methodological workflow among the three involved institutes. Several methodological details were
agreed as in the following:
- selection of end-diastolic and end-systolic frames to be carried out manually;
- software sensitivity for automated identification of endocardial surface to be kept constant (low -
25%);
- endocardium should be positioned 1-2 mm outside the visible interface, in order to include trabeculae,
papillary muscles and moderator band in the RV cavity;
- special attention should be paid at the position of tricuspid leaflet hinges by observing the cine RV
images in the 4-chamber and coronal views, in order to accurately capture the RV longitudinal
shortening;
- to not extend the manually-traced RV outflow tract by interpolation beyond the visible endocardium
(i.e. outside the acquired volume);
- manual editing should be avoided whenever possible; re-initialization of RV endocardial contour and
subsequent automated processing should be performed instead.
The results of inter-center reproducibility analysis, before and after the harmonization of the
methodological workflow, are shown in Table S1.

S2
Statistical Analysis
Inter-center differences in subject characteristics were assessed using independent samples Kruskal-
Wallis test (Table S2).
Sensitivity analysis for normative equations was performed using a split and sample approach: after
random sub-sampling, the dataset was split into training and validation data subsets; model was fit on
the training data and the normality cut-off, determined as the lower/upper normality values (5th
/95th
percentile) in the training data, was applied to the validation subset. A prevalence of abnormal RV of
approximately 5% was considered as adequate fit. Split and sample analysis has been repeated 10 times
and the results are listed in Supplemental Tables S3, S4, S5 and S6.

S3
Supplemental Tables
Table S1. Comparison between inter-center reproducibility before and after investigator meeting and
agreement on a workflow of analysis, evaluated using Pearson correlation coefficient (r2) and Bland-Altman
analysis between repeated measurements.
EDV (ml) ESV (ml)
Inter-center reproducibility C1vsC2 -11±27 (0.76) -9±16 (0.70)
(before workflow agreement) C1vsC3 -2±37 (0.37) -1±16 (0.38)
C2vsC3 9±41 (0.44) 9±21 (0.43)
Inter-center reproducibility C1vsC2 -9±33 (0.58) -3±13 (0.60)
(after workflow agreement) C1vsC3 -3±15 (0.87) -5±13 (0.63)
C2vsC3 6±33 (0.58) -2±17 (0.43)
Values expressed as bias±1.96 SD (r2).
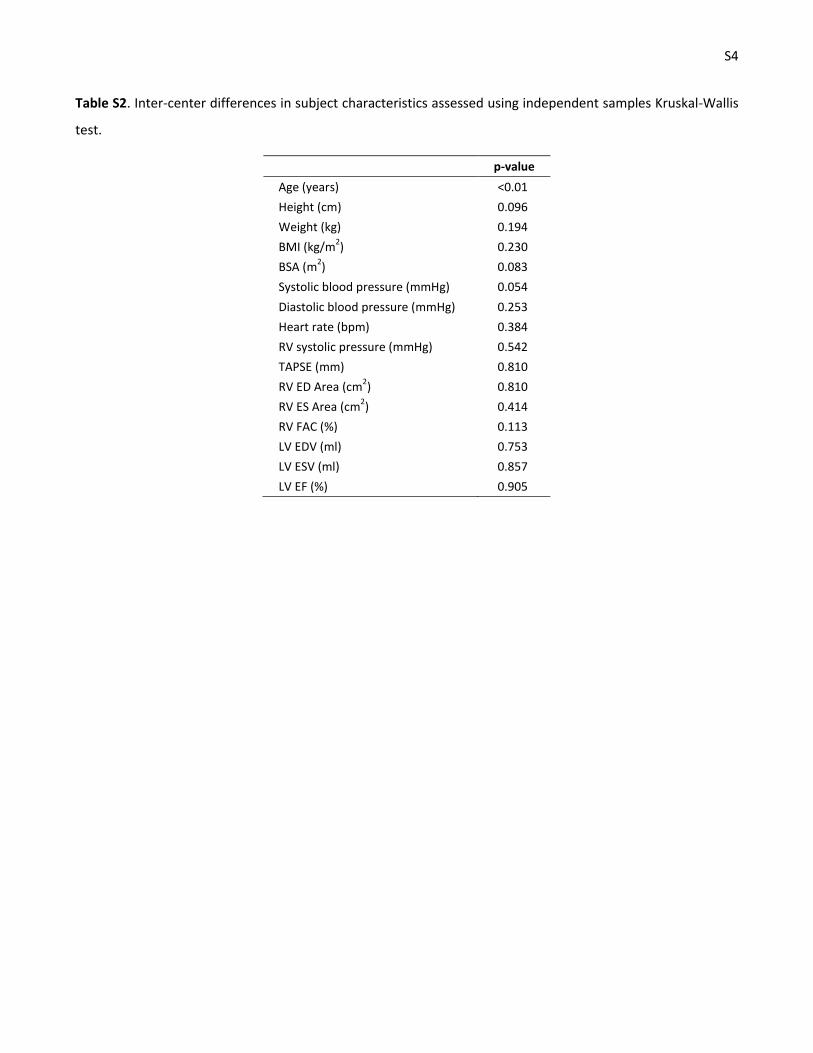
S4
Table S2. Inter-center differences in subject characteristics assessed using independent samples Kruskal-Wallis
test.
p-value
Age (years) <0.01
Height (cm) 0.096
Weight (kg) 0.194
BMI (kg/m2) 0.230
BSA (m2) 0.083
Systolic blood pressure (mmHg) 0.054
Diastolic blood pressure (mmHg) 0.253
Heart rate (bpm) 0.384
RV systolic pressure (mmHg) 0.542
TAPSE (mm) 0.810
RV ED Area (cm2) 0.810
RV ES Area (cm2) 0.414
RV FAC (%) 0.113
LV EDV (ml) 0.753
LV ESV (ml) 0.857
LV EF (%) 0.905

S5
Table S3. Split and sample (10 repetitions) sensitivity analysis for the end-diastolic volume normative equation.
n Constant Gender Age BSA Prevalence (%)
244 4.75 (4.40, 5.10) 0.10 (0.03, 0.18) -0.23 (-0.31, -0.16) 1.06 (0.70, 1.42) 6.6
231 4.70 (4.39, 5.01) 0.12 (0.05, 0.20) -0.19 (-0.26, -0.12) 0.85 (0.47, 1.23) 5.0
245 4.79 (4.46, 5.12) 0.13 (0.06, 0.21) -0.22 (-0.30, -0.15) 0.89 (0.53, 1.26) 5.3
241 4.98 (4.66, 5.30) 0.20 (0.12, 0.28) -0.25 (-0.32, -0.17) 0.63 (0.25, 1.00) 5.4
234 4.72 (4.36, 5.08) 0.12 (0.03, 0.20) -0.23 (-0.31, -0.16) 1.12 (0.73, 1.51) 5.6
242 4.71 (4.39, 5.02) 0.08 (0.01, 0.15) -0.24 (-0.31, -0.17) 1.19 (0.83, 1.55) 4.1
259 4.91 (4.56, 5.26) 0.11 (0.03, 0.19) -0.29 (-0.36, -0.21) 1.13 (0.77, 1.48) 4.6
246 4.76 (4.45, 5.08) 0.15 (0.07, 0.23) -0.23 (-0.30, -0.71) 1.02 (0.67, 1.38) 2.8
249 4.58 (4.25, 4.91) 0.04 (-0.03, 0.12) -0.22 (-0.29, -0.15) 1.35 (0.99, 1.70) 5.2
248 4.87 (4.52, 5.21) 0.15 (0.07, 0.24) -0.24 (-0.31, -0.16) 0.84 (0.47, 1.22) 4.8
Data presented as coefficient/exponent (95% confidence interval).

S6
Table S4. Split and sample (10 repetitions) sensitivity analysis for the end-systolic normative equation.
n Constant Gender Age BSA Prevalence (%)
244 4.11 (3.56, 4.66) 0.13 (0.01, 0.25) -0.34 (-0.46, -0.22) 1.17 (0.60, 1.74) 4.1
231 3.92 (3.36, 4.48) 0.16 (0.02, 0.30) -0.33 (-0.45, -0.20) 1.32 (0.65, 2.00) 4.8
245 4.21 (3.67, 4.75) 0.17 (0.05, 0.29) -0.37 (-0.49, -0.25) 1.08 (0.49, 1.66) 4.3
241 4.47 (3.96, 4.98) 0.28 (0.16, 0.41) -0.40 (-0.51, -0.28) 0.72 (0.12, 1.31) 5.8
234 4.23 (3.64, 4.83) 0.20 (0.07, 0.34) -0.38 (-0.51, -0.26) 1.15 (0.52, 1.78) 6.0
242 4.18 (3.63, 4.72) 0.11 (-0.01, 0.24) -0.41 (-0.53, -0.29) 1.46 (0.85, 2.07) 4.1
259 4.52 (3.97, 5.07) 0.21 (0.09, 0.33) -0.45 (-0.57, -0.33) 1.08 (0.52, 1.65) 3.1
246 4.13 (3.59, 4.67) 0.23 (0.09, 0.36) -0.37 (-0.49, -0.25) 1.20 (0.60, 1.81) 4.4
249 3.88 (3.30, 4.47) 0.09 (-0.04, 0.23) -0.36 (-0.48, -0.23) 1.68 (1.06, 2.30) 4.8
248 4.19 (3.63, 4.75) 0.26 (0.13, 0.40) -0.36 (-0.48, -0.23) 0.98 (0.36, 1.59) 4.8
Data presented as coefficient/exponent (95% confidence interval).

S7
Table S5. Split and sample (10 repetitions) sensitivity analysis for the stroke volume normative equation.
n Constant Gender Age BSA Prevalence (%)
244 4.03 (3.65, 4.41) 0.08 (0.00, 0.16) -0.71 (-0.25, -0.09) 1.03 (0.64, 1.42) 3.3
231 4.04 (3.70, 4.37) 0.09 (0.01, 0.18) -0.10 (-0.18, -0.03) 0.62 (0.22, 1.02) 3.9
245 4.04 (3.68, 4.39) 0.10 (0.02, 0.18) -0.14 (-0.22, -0.06) 0.84 (0.45, 1.23) 4.1
241 4.17 (3.61, 4.53) 0.14 (0.05, 0.23) -0.16 (-0.24, -0.07) 0.64 (0.21, 1.06) 7.9
234 3.83 (3.45, 4.21) 0.06 (-0.03, 0.14) -0.13 (-0.21, -0.05) 1.17 (0.76, 1.57) 3.4
242 3.88 (3.55, 4.21) 0.05 (-0.02, 0.13) -0.13 (-0.20, -0.05) 1.08 (0.71, 1.45) 3.3
259 3.99 (3.62, 4.36) 0.05 (-0.03, 0.13) -0.18 (-0.26, -0.10) 1.19 (0.81, 1.57) 5.4
246 4.03 (3.68, 4.38) 0.11 (0.02, 0.19) -0.15 (-0.23, -0.08) 0.96 (0.57, 1.35) 3.3
249 3.84 (3.50, 4.18) 0.01 (-0.07, 0.09) -0.12 (-0.20, -0.05) 1.18 (0.82, 1.54) 4.0
248 4.14 (3.76, 4.52) 0.08 (-0.01, 0.17) -0.16 (-0.24, -0.08) 0.81 (0.39, 1.22) 6.5
Data presented as coefficient/exponent (95% confidence interval).

S8
Table S6. Split and sample (10 repetitions) sensitivity analysis for the ejection fraction normative equation.
n Constant Gender Age BSA Prevalence (%)
244 3.88 (3.66, 4.10) -0.03 (-0.07, 0.02) 0.07 (0.02, 0.11) -0.03 (-0.25, 0.20) 4.9
231 3.95 (3.72, 4.17) -0.03 (-0.09, 0.02) 0.09 (0.04, 0.14) -0.23 (-0.50, 0.04) 5.2
245 3.85 (3.64, 4.06) -0.03 (-0.08, 0.02) 0.08 (0.04, 0.13) -0.05 (-0.28, 0.18) 4.4
241 3.79 (3.58, 4.00) -0.06 (-0.11, -0.01) 0.09 (0.04, 0.14) -0.01 (-0.24, 0.25) 4.6
234 3.71 (3.49, 3.94) -0.06 (-0.11, -0.01) 0.11 (0.06, 0.15) 0.05 (-0.19, 0.28) 3.4
242 3.78 (3.57, 3.99) -0.02 (-0.07, 0.02) 0.11 (0.06, 0.16) -0.11 (-0.35, 0.13) 5.0
259 3.69 (3.47, 3.91) -0.06 (-0.11, -0.01) 0.11 (/0.06, 0.16) 0.06 (-0.16, 0.29) 3.5
246 3.87 (3.65, 4.09) -0.05 (-0.10, 0.01) 0.08 (0.03, 0.13) -0.06 (-0.31, 0.18) 4.5
249 3.86 (3.63, 4.09) -0.03 (-0.08, 0.02) 0.10 (0.05, 0.15) -0.16 (-0.40, 0.08) 6.0
248 3.88 (3.65, 4.11) -0.07 (-0.13, 0.13) 0.08 (0.03, 0.13) -0.04 (-0.29, 0.21) 4.4
Data presented as coefficient/exponent (95% confidence interval).