age-friendly oxford community needs assessment - sc home · apply for membership in the aarp...
TRANSCRIPT

Age-Friendly Oxford
Community Needs Assessment:
Report to the Age-Friendly Oxford
Leadership Advisory Group
April 2019
Meghan A. Young
Usha Dhakal
Valerie Kessler
Suzanne R. Kunkel

100 Bishop Circle, Upham Hall 396, Oxford, OH 45056 MiamiOH.edu/ScrippsAging.org │ 513.529.2914 │ [email protected]

ACKNOWLEDGMENTS
Extensive community involvement is essential to a successful needs assessment. We’re
thankful we had the opportunity to collaborate with the City of Oxford, Oxford VillAGE
Network, and Oxford Seniors, Inc. on this community needs assessment.
Many thanks to Scripps Gerontology Center office staff members Becky Thompson,
Lisa Grant, Maureen Cunningham, and Tonya Barger, who helped with printing,
addressing, and sending surveys, as well as other tasks when needed. Former Miami
University graduate assistants Amanda Horne and Diane Berish were instrumental in
moving the project along, distributing the surveys, and collecting data. Dr. Kate de
Mederios and her First-Year Research Experience class contributed valuable insights
based on their interviews with community members and observations about the livability
of Oxford for people of all ages.
Finally, thank you to members of the Age-Friendly Oxford Leadership Advisory Group
(LAG) who are dedicated to making Oxford a place for people of all ages to live and
thrive. Ann Garrison Whelpton and Jessie Leek, the co-coordinators of the Oxford
VillAGE Network and the Age-Friendly Oxford Initiative, are the driving forces behind
this movement. We appreciated their insight throughout this process.
We would also like to thank Oxford Mayor Kate Rousmaniere, Oxford City Manager
Doug Elliott, Miami University Dean and Associate Provost Jim Oris, and Associate
Director, AARP Ohio Nicole Ware for their support and commitment to this project.
Meghan A. Young, MGS
Usha Dhakal, MGS Student
Valerie Kessler, MGS Student
Suzanne R. Kunkel, PhD
April 2019

To download or print additional copies of this report go to:
Scripps.MiamiOH.edu/publications

TABLE OF CONTENTS
List of Tables .................................................................................................................... i
List of Figures .................................................................................................................. iii
Executive Summary ........................................................................................................ 1
Key Findings for Domains of Livability ......................................................................... 1
Background on the Age-Friendly Movement ................................................................... 3
Methodology .................................................................................................................... 4
Recruiting Respondents .............................................................................................. 4
Structure of Mailed Survey .......................................................................................... 5
Understanding Gaps .................................................................................................... 5
Description of Respondents ............................................................................................ 8
Expectations about Moving ........................................................................................ 10
Livability Ratings ........................................................................................................ 13
Overall Mean Percent Gap Score .............................................................................. 13
Findings by Domain....................................................................................................... 14
Housing ..................................................................................................................... 14
Transportation & Streets ............................................................................................ 18
Health & Wellness ..................................................................................................... 21
Communications and Community Information ........................................................... 24
Social Participation, Inclusion, & Educational Opportunities ...................................... 27
Job Opportunities....................................................................................................... 31
Outdoor Spaces & Buildings ...................................................................................... 33
Volunteering & Civic Engagement ............................................................................. 35
Conclusion .................................................................................................................... 37
Appendix A .................................................................................................................... 38
Sample Questions Contributing to Gap Analysis ....................................................... 38
Appendix B .................................................................................................................... 39
Additional Demographic Tables ................................................................................. 39

Appendix C .................................................................................................................... 41
Additional tables for Social Participation, Inclusion, & Educational Opportunities ..... 41
Appendix D .................................................................................................................... 44
Additional Tables for Communications ...................................................................... 44
Endnotes ....................................................................................................................... 45

Age-Friendly Oxford Needs Assessment: Findings Report i
Scripps Gerontology Center April 2019
LIST OF TABLES
Table 1. Explanation of a Gap Score............................................................................... 7
Table 2. Respondents Residency Characteristics ........................................................... 8
Table 3. Demographic Characteristics of Respondents .................................................. 9
Table 4. Respondent Ratings of Oxford as a Place to Live as People Age ................... 10
Table 5. Importance of Remaining in Oxford ................................................................. 11
Table 6. Respondent Likelihood of Moving to a Different Home ................................... 11
Table 7. Most Important Areas for Oxford to Address According to Respondents ........ 13
Table 8. Mean Percent Gap Score for Each Domain .................................................... 14
Table 9. Living Arrangements, Types of Homes, and Home Modification Needs of
Respondents ...................................................................................................... 15
Table 10. Respondents Method of Transportation around Oxford ................................ 18
Table 11. Respondents Self-Rated Health .................................................................... 21
Table 12. Frequency of Physical Exercise .................................................................... 21
Table 13. Resources Respondents Would Use for Information about Services for Older
Adults ................................................................................................................. 24
Table 14. Communication and Community Information................................................. 26
Table 15. Frequency of Interaction with Family and/or Friends ..................................... 27
Table 16. Location of Continuing Education Classes/Workshops ................................. 28
Table 17. Oxford as a Retirement Destination .............................................................. 28
Table 18. Respondents Current Employment Status .................................................... 31
Table 19. Frequency of Volunteering in the Oxford Area .............................................. 35
Table 20. Relationships between Caregivers and Care Recipients ............................... 39
Table 21. People Living in the Same Household ........................................................... 39
Table 22. Presence of Chronic Disease/Disability that Restricts Full Participation in
Various Activities ................................................................................................ 40
Table 23. Availability of Health Care Coverage ............................................................. 40
Table 24. Frequency of Shopping and/or Dining Uptown .............................................. 41
Table 25. Frequency of Shopping and/or Dining in Oxford besides Uptown ................. 41
Table 26. Amount of Shopping Done Online or Outside of Oxford ................................ 42

Age-Friendly Oxford Needs Assessment: Findings Report ii
Scripps Gerontology Center April 2019
Table 27. Selected Reasons for Shopping Outside of Oxford ....................................... 42
Table 28. Opinions on Accessibility for Oxford’s Shopping and Dining Locations ......... 43
Table 29. Accessibility Limitations of Oxford’s Businesses ........................................... 43
Table 30. Use of Social Media Platforms ...................................................................... 44

Age-Friendly Oxford Needs Assessment: Findings Report iii
Scripps Gerontology Center April 2019
LIST OF FIGURES
Figure 1. Sample Timeline and Methodology .................................................................. 5
Figure 2. Factors that Impact the Decision to Move ...................................................... 12
Figure 3. Gap Analysis for Housing Domain Items ........................................................ 17
Figure 4. Gap Analysis for Transportation and Streets Domain Items .......................... 20
Figure 5. Gap Analysis for Health and Wellness Domain Items .................................... 23
Figure 6. Gap Analysis for Social Participation, Inclusion, and Educational Opportunities
Domain Items ..................................................................................................... 30
Figure 7. Gap Analysis for Job Opportunities Domain Items ......................................... 32
Figure 8. Gap Analysis for Outdoor Spaces and Buildings Domain Items..................... 34
Figure 9. Gap Analysis for Volunteering and Civic Engagement Domain Items ............ 36
Figure 10. Example of Importance and Availability Question Format ............................ 38

Age-Friendly Oxford Needs Assessment: Findings Report 1
Scripps Gerontology Center April 2019
EXECUTIVE SUMMARY
In November 2017, Oxford, Ohio formally joined the AARP Network of Age-Friendly
States and Communities, a national network committed to the design and
implementation of community-level actions to enhanced age-friendliness. After the first
formal step of acceptance into the AARP Network of Age-Friendly States and
Communities, the second step—community needs assessment—began. The needs
assessment focused on eight major domains of livability developed by the World Health
Organization (WHO)1 and utilized by many of the towns, cities, and counties in the
AARP Network: transportation, housing, social participation, outdoor spaces, health and
wellness, volunteering and civic engagement, employment opportunities, and
communication.2
A randomly selected sample of Oxford and Oxford Township residents age 50 and older
provided valuable information about elements of an age-friendly community. Their
responses allowed us to quantify the extent to which there is alignment between what
services and amenities are important and what is available. When gaps between
importance and availability were revealed, we distinguished two different kinds of gap:
“important, but not available,” and “important, but I’m not sure if Oxford has it.” We
assumed that this distinction will be valuable as the leadership advisory group for the
Age-Friendly Oxford Initiative begins its deliberations about priorities and possible
solutions. Respondents who do not know whether the community has a desired feature
may not have had the occasion to need or to seek out that particular amenity, or they
may not know where to find the information. Possible responses to these gaps are likely
to be significantly different from the potential solutions for gaps that exist because our
community lacks an important service or amenity.
KEY FINDINGS FOR DOMAINS OF LIVABILITY
When survey respondents were asked to choose the three most important areas for
Oxford to address in its age-friendly planning, housing emerged as the top priority.
Accessible and affordable homes, and affordable housing dedicated to older adults are
significant gaps in Oxford.
Transportation and streets was identified by respondents as the second most
important priority area and ranked highly among the domains on which Oxford residents
perceive a gap between importance and known availability. High proportions of
respondents identified gaps related to accessible, convenient, reliable, and affordable
public transportation.
Respondents identified health and wellness as the third highest priority for the Oxford
community. There is good alignment between importance and availability of some

Age-Friendly Oxford Needs Assessment: Findings Report 2
Scripps Gerontology Center April 2019
health and wellness services. For example, health and wellness programming, high-
quality hospitals, respectful and helpful hospital/clinic staff, and variety of health care
professionals were identified as important and available by more than 70% of survey
respondents. On the other hand, information about health and supportive services and
the availability and affordability of well-trained home care providers were almost
unanimously identified as important, but more than half of survey respondents did not
know if these services were available.
Communications and community information was also ranked highly as an area of
priority. Due to the structure of the questions in that section of the survey, a gap score
could not be calculated. However, respondents’ provided insights about the information
sources that they currently utilize and the importance of access to various
communication channels. Technology and the Internet were frequently mentioned, but
respondents also acknowledged that not everyone owns a computer or uses social
media.
Social participation, inclusion, and educational opportunities are another important
dimension of age-friendly communities. Oxford residents see a strong alignment
between the importance and availability of social opportunities such as continuing
education, cultural activities, activities for older adults specifically, and activities for
people of all ages. Some concerns were expressed about the availability of information
about social activities, and the affordability of activities.
A subset of survey respondents (those currently employed or seeking employment)
provided their perspective about job opportunities. A range of flexible job
opportunities, job training, and jobs that are adapted to meet needs of workers with
disabilities were all rated as important by more than 80% of respondents. For all three of
these items, the majority of respondents did not know if Oxford had these features.
Respondents identified fewer gaps related to Oxford’s outdoor spaces and buildings.
More than half saw no gap between the importance and availability of well-maintained
and safe parks, benches in parks, and bike paths.
Having opportunities for volunteering and civic engagement was rated as important
by a majority of respondents, and there was little gap on the range of volunteer activities
available. There was a significant “don’t know if we have it” gap on the availability of
information about, and transportation to, volunteer opportunities.
The next step in Oxford’s journey to status as an age-friendly community will be taken
by the Age-Friendly Oxford Leadership Advisory Group as they create an action plan.
The findings from this survey will provide a foundation for their efforts to establish
priorities, set goals, and decide action steps.

Age-Friendly Oxford Needs Assessment: Findings Report 3
Scripps Gerontology Center April 2019
BACKGROUND ON THE AGE-FRIENDLY MOVEMENT
As part of their commitment to the full inclusion of older adults in an increasingly aging
world, the World Health Organization (WHO) established the Global Network of Age-
Friendly Cities and Communities in 2010.3 AARP became the United States affiliate of
this network in April 2012 as the AARP Network of Age-Friendly Communities,4
supporting cities and communities in their efforts to become “age-friendly.” The 8
Domains of Livability5 framework provides communities with a tool to use in order to
assess community needs and to develop a plan to create an environment that is livable
and accessible for people of all ages.
Building on grass-roots momentum to enhance the age-friendliness of Oxford that has
been growing since 2013, the Oxford VillAGE Network (OVN), an information and
advocacy network for older adults and their families living in the Oxford area, partnered
with the city of Oxford and Oxford Seniors, Inc. (the local senior center that provides
activities and services for individuals 50 years and older living in the Oxford area) to
apply for membership in the AARP Network. Oxford was welcomed as the 192nd
member of the AARP network in November 2017. Application and acceptance into
AARP’s Network was the first step in a five-step process.
The second step was to conduct a community needs assessment to understand issues
and priorities in the community; the results of the needs assessment are intended to
guide the development of an action plan to identify highest priorities and solutions to
address them. The focus of the needs assessment was to understand the perceived
gaps between the importance and availability of amenities and services related to The 8
Domains of Livability.6
1. Outdoor Spaces and Buildings
2. Transportation
3. Housing
4. Social Participation
5. Respect and Social Inclusion
6. Civic Participation and Employment
7. Communication and Information
8. Community and Health Services
Scripps Gerontology Center joined community partners (OVN, City of Oxford, Oxford
Seniors) in the Age-Friendly Oxford Initiative, providing leadership for the needs
assessment process. This study was a collaborative effort among Scripps Gerontology
Center at Miami University, whose mission is to do work that makes a positive

Age-Friendly Oxford Needs Assessment: Findings Report 4
Scripps Gerontology Center April 2019
difference in the lives of aging individuals, Oxford Seniors, Inc., members of the OVN,
and the Age-Friendly Oxford Initiative Leadership Advisory Group.
METHODOLOGY
The AARP Community Survey Questionnaire7 was adapted to address some of the
unique characteristics of living in Oxford, particularly since it is a college town. This
report focuses on the findings from the random sample survey. In addition to the survey
findings, this report highlights selected observations and conclusions from a report
developed by a First-Year Research Experience (FYRE) class at Miami University led
by Dr. Kate de Medeiros.8 The FYRE class conducted qualitative interviews with 20
participants in Oxford and completed an accessibility review of the physical
environment. The participants mentioned in the FYRE report included Miami University
students, Oxford residents, people who worked in or visited Oxford, and first
responders. The combination of qualitative and quantitative findings will give the Age-
Friendly Leadership Advisory Group confidence to create their action plan and make
effective changes in the Oxford community.
RECRUITING RESPONDENTS
During the summer of 2018, a sample of Oxford area residents was randomly selected
from an age-stratified Butler County Voter Registration list. A total of 5,241 Oxford
residents (50 years and older) were registered to vote through the Butler County Board
of Elections as of December 2017. These registered voters were divided into four age
groups (50 - 59, 60 - 69, 70 - 79, and 80 years and older) and 175 residents were
randomly selected from each of the four groups for a total of 700 older adults. Assuming
a response rate between 40 - 50%, 700 is the starting sample size deemed necessary
to achieve an analytical sample size of 300. Figure 1 describes the construction of the
final sample.

Age-Friendly Oxford Needs Assessment: Findings Report 5
Scripps Gerontology Center April 2019
Figure 1. Sample Timeline and Methodology
Figure 1. Sample Timeline and Methodology
STRUCTURE OF MAILED SURVEY
The survey was divided into sections based on the domains of livability and
characteristics of living in Oxford. The survey sections included:
1. Housing
2. Outdoor Spaces and Buildings
3. Transportation and Streets
4. Health and Wellness
5. Social Participation, Inclusion, and Educational Opportunities
6. Volunteering and Civic Engagement
7. Job Opportunities
8. Communications
9. Community Information
10. Demographic Information
UNDERSTANDING GAPS
The ultimate goal of the survey was to understand gaps in service provision among
each of the domains in Oxford. Two questions were asked to respondents regarding the
importance and availability of services in Oxford. The questions were asked in seven

Age-Friendly Oxford Needs Assessment: Findings Report 6
Scripps Gerontology Center April 2019
sections of the survey. See Appendix A for an example of the questions as they
appeared on the survey. Below are the questions and the response categories:
● How important do you think it is to have ……… in the Oxford area?
○ 1 Not at all important
○ 2
○ 3 Neutral
○ 4
○ 5 Extremely important
● Does the Oxford area have ………?
○ Yes
○ No
○ Not sure
Gap scores on each item were created by comparing importance and availability
questions. Two types of gaps were calculated: a gap due to the unavailability of an
important service or amenity, and a gap due to the respondent not knowing if Oxford
has a service or amenity they identified as important. Table 1 explains the numerical
values assigned to each type of gap.

Age-Friendly Oxford Needs Assessment: Findings Report 7
Scripps Gerontology Center April 2019
Table 1. Explanation of a Gap Score
Table 1. Explanation of a Gap Score
Gap Score Meaning
0 Not important
OR
Important and Oxford already has it
1 Important, but not sure if Oxford has it
2 Important, but Oxford doesn’t have it
After calculating the individual gap scores for each item for each respondent, we then
created a mean gap score for each domain. The individual mean gap scores were
turned into a percentage that shows the average percent of items in a particular domain
that were perceived as gaps. The mean gap scores only included the number of
questions that a respondent answered, which is also known as non-missing responses.
The percentage for the mean gap score was calculated as follows:
X 100 Number of non-missing perceived gaps in a domain
Number of non-missing items in the domain

Age-Friendly Oxford Needs Assessment: Findings Report 8
Scripps Gerontology Center April 2019
DESCRIPTION OF RESPONDENTS
This survey collected information from individuals 50 years and older living in the City of
Oxford and Oxford Township. The majority of respondents have lived in Oxford for at
least five years; almost 70% have lived in the Oxford area for 25 years or more. Nearly
all respondents live in Oxford year-round, and reside mostly outside the Mile Square
(the mile around the center of the city) but within the city limits. Table 2 provides
additional details about the residency characteristics of the survey respondents.
Table 2. Respondents Residency Characteristics
Table 2. Respondents Residency Characteristics
How long have you lived in the Oxford area?
Less than 5 years 6.9%
At least 5 years but fewer than 15 years 8.2%
At least 15 years but fewer than 25 years 16.4%
At least 25 years but fewer than 35 years 16.1%
At least 35 years but fewer than 45 years 15.1%
45 years or more 37.3%
Which of the following describes how you reside in Oxford?
Year round, do not reside anywhere outside of Oxford 92.3%
Seasonally, reside outside of Oxford on a regular basis 7.7%
Where in the Oxford area do you reside?
Within the Mile Square (mile around center of town) 9.1%
Outside the Mile Square but still within city limits 61.8%
In Oxford Township but outside city limits 28.4%
Other 0.7%

Age-Friendly Oxford Needs Assessment: Findings Report 9
Scripps Gerontology Center April 2019
Table 3 provides an overview of the demographic characteristics of the respondents.
The average age of respondents was 69.3 years old, ranging from 51 to 99 years old.
Slightly less than two-thirds of the respondents were female. The majority of the
respondents were married and identified as White. Almost half of the respondents said
they have a graduate or professional degree. Compared to Oxford data from the U.S.
Census and American Community Survey (ACS), the highly educated population was
over-represented in the sample.9, 10 Income representativeness was difficult to assess
due to 20% of respondents not answering the question about their earnings.
Furthermore, there is no income information specific to this age group from the U.S.
Census or ACS. The age, gender, and race/ethnicity distribution of the sample were
representative. Non-representativeness on education and income may be partly due to
the use of a voter registration list which typically underrepresent some demographic
categories.
Table 3. Demographic Characteristics of Respondents
Table 3. Demographic Characteristics of Respondents
Age
50 - 59 years old 18.8%
60 - 69 years old 34.5%
70 - 79 years old 31.8%
80+ years old 14.9%
Gender
Male 37.7%
Female 62.3%
Marital Status
Married 74.7%
Not married, never married, or divorced 13.4%
Widowed 11.9%
Race/Ethnicity
White/Caucasian 92.8%
Black/African American 2.5%
Other 4.7%

Age-Friendly Oxford Needs Assessment: Findings Report 10
Scripps Gerontology Center April 2019
Highest Level of Education Completed
High school graduate or less 10.5%
Some post-high school education to 2-year college 15.0%
4-year college degree 19.0%
Post graduate study (no degree) 7.5%
Graduate or professional degree 48.0%
Annual Household Income
Less than $50,000 17.6%
$50,000 - $99,000 27.8%
$100,000 or more 32.9%
No response 21.7%
EXPECTATIONS ABOUT MOVING
We asked respondents about their perceptions of growing older in Oxford, and whether
or not they had considered moving to another location. The overwhelming majority of
respondents (88.2%) rated Oxford a good, very good, or excellent place to live as
people age. The majority (77.4%) also reported that it was somewhat or extremely
important that they remain in Oxford as they age.
Table 4. Respondent Ratings of Oxford as a Place to Live as People Age
Table 4. Respondent Ratings of Oxford as a Place to Live as People Age
How would you rate the Oxford area as a place for people to live as they age?
Excellent 18.0%
Very good 44.0%
Good 26.2%
Fair 9.5%
Poor 2.1%
Age-Friendly Oxford Needs Assessment: Findings Report 11
Scripps Gerontology Center April 2019
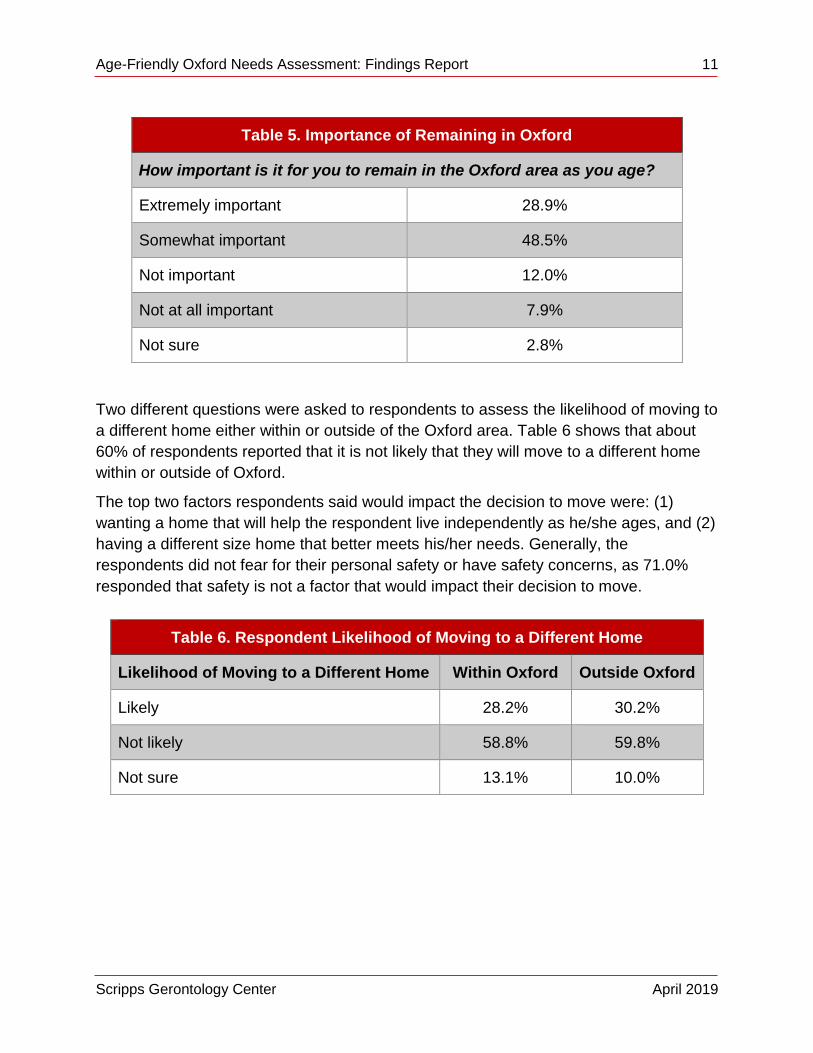
Table 5. Importance of Remaining in Oxford
Table 5. Importance of Remaining in Oxford
How important is it for you to remain in the Oxford area as you age?
Extremely important 28.9%
Somewhat important 48.5%
Not important 12.0%
Not at all important 7.9%
Not sure 2.8%
Two different questions were asked to respondents to assess the likelihood of moving to
a different home either within or outside of the Oxford area. Table 6 shows that about
60% of respondents reported that it is not likely that they will move to a different home
within or outside of Oxford.
The top two factors respondents said would impact the decision to move were: (1)
wanting a home that will help the respondent live independently as he/she ages, and (2)
having a different size home that better meets his/her needs. Generally, the
respondents did not fear for their personal safety or have safety concerns, as 71.0%
responded that safety is not a factor that would impact their decision to move.
Table 6. Respondent Likelihood of Moving to a Different Home
Table 6. Respondent Likelihood of Moving to a Different Home
Likelihood of Moving to a Different Home Within Oxford Outside Oxford
Likely 28.2% 30.2%
Not likely 58.8% 59.8%
Not sure 13.1% 10.0%

Age-Friendly Oxford Needs Assessment: Findings Report 12
Scripps Gerontology Center April 2019
Figure 2. Factors that Impact the Decision to Move
20.6%
25.3%
26.9%
27.4%
32.7%
40.0%
46.5%
71.1%
74.0%
71.0%
58.6%
59.9%
55.6%
54.3%
46.3%
44.7%
25.3%
19.4%
8.5%
16.1%
13.3%
17.0%
13.0%
13.8%
8.8%
3.6%
6.6%
0% 10% 20% 30% 40% 50% 60% 70% 80% 90% 100%
Fearing for my personal safety or having security concerns
Maintaining my current home will be too expensive
Wanting an area that has a lower cost of living
Wanting to live in a different climate
Wanting to live in an area that has better health care facilities
Needing more access to public transportation
Wanting to be closer to family
Having a different size home that better meets my needs
Wanting a home that will help me live independently as I age
Figure 2. Factors that Impact the Decision to Move
Yes No Not sure

Age-Friendly Oxford Needs Assessment: Findings Report 13
Scripps Gerontology Center April 2019
LIVABILITY RATINGS
To get a general sense of community opinion about the domains of livability,
respondents were asked, “If you could only pick three areas, please check the top three
areas that are most important for Oxford to address,” followed by a list of the eight
domains. Table 7 presents the respondents’ choices for this question. The three
domains most commonly identified as priorities by respondents were Housing (65.0%),
Transportation and Streets (55.6%), and Health and Wellness (51.6%).
Table 7. Most Important Areas for Oxford to Address According to Respondents
Table 7. Most Important Areas for Oxford to Address According to Respondents
Housing 65.0%
Transportation & Streets 55.6%
Health & Wellness 51.6%
Communication 30.3%
Social Participation, Inclusion, & Educational Opportunities 27.4%
Job Opportunities 17.0%
Outdoor Spaces & Buildings 14.4%
Volunteering & Civic Engagement Opportunities 12.3%
Other 10.8%
OVERALL MEAN PERCENT GAP SCORE
Table 8 presents the mean percent gap score of seven domains to provide a
comparative sense of the needs identified by the community. As noted in the
methodology section, the mean percent gap score provides the average percentage of
items within a domain that are perceived as gaps. Job Opportunities is unique in this
comparison of domains because only those employed or looking for work were asked to
respond to the gap analysis questions. Communications and Community Information
was among the top four items Oxford should address according to respondents;
however a gap score could not be calculated due to the structure of the questions asked
in that section.

Age-Friendly Oxford Needs Assessment: Findings Report 14
Scripps Gerontology Center April 2019
Table 8. Mean Percent Gap Score for Each Domain
Table 8. Mean Percent Gap Score for Each Domain
Domain (# of survey items related to the domain) N Mean Percent
Job Opportunities (3) 112 81.3%
Volunteering & Civic Engagement (5) 272 57.3%
Transportation & Streets (14) 286 50.6%
Housing (6) 290 47.7%
Health & Wellness (15) 283 46.2%
Outdoor Spaces & Buildings (7) 286 43.5%
Social Participation, Inclusion, & Educational Opportunities (10)
283 28.7%
FINDINGS BY DOMAIN
The prioritization and overall gap scores for each domain provide a useful starting point
for the community action plan. The following analysis of specific features within each
domain adds depth to that overview.
HOUSING
When respondents were asked to select three domains Oxford should address, housing
was the most frequent answer. Table 9 describes respondent living arrangements,
types of homes, and whether they anticipate that home modifications will be necessary
in order to remain in their home as they age. The majority of survey respondents own
their homes and live in a single family style home. A good proportion of people do not
anticipate needing to make modifications to their home as they age, while 35%
anticipate that they will need to make minor modifications.

Age-Friendly Oxford Needs Assessment: Findings Report 15
Scripps Gerontology Center April 2019
Table 9. Living Arrangements, Types of Homes, and Home Modification Needs of Respondents
Table 9. Living Arrangements, Types of Homes, and Home Modification Needs of Respondents
Do you own, rent, or have some other type of living arrangement for your home in the Oxford area?
Own 89.0%
Rent 6.5%
Other 4.5%
What type of home is your home in the Oxford area?
Single family home 87.1%
Other 12.9%
Do you think you will need to make modifications to your home so you can stay there as you age?
Yes, major modifications 5.5%
Yes, minor modifications 35.2%
No 41.0%
Not sure 18.3%
Note. “Other” types of homes include: mobile home, townhome/duplex, apartment, and condominium/co-
op.
Figure 3 provides the information on each item gap in the housing domain. More than
60% of respondents saw a gap regarding affordable and accessible housing, but the
type of gap varied. For example, 32% of respondents said that affordable housing
dedicated to older adults was important but Oxford doesn’t have it, while 48% of
respondents said that accessible homes with universal design features are important
but they’re not sure if Oxford has them.
At the end of each section, respondents were invited to include anything else they found
important about housing. There were 35 respondents who choose to answer this
question. The most prominent themes in the open-ended responses from the housing
domain were affordability, need for specialized housing for older adults, and an
overabundance of student rentals. The theme of affordability included concerns about

Age-Friendly Oxford Needs Assessment: Findings Report 16
Scripps Gerontology Center April 2019
renting and buying properties as well as taxes being too high. This theme was reiterated
in the FYRE class report.
The next theme, lack of specialized housing for older adults, goes hand-in-hand with the
final theme of perceived overabundance of student rentals. Comments from survey
respondents showed that older adults feel they don’t have any reasonably priced, well-
kept, non-student rental properties in which to reside. One respondent shared, “Too
many homes turned into student rentals...[We] want quiet, low traffic and considerate,
respectful neighbors.” Specialized housing for older adults, also echoed in the FYRE
report, would allow for easier community interaction. Survey respondents stated it would
be important for this housing to be located near shopping and doctors. A few
respondents commented about not being able to live in the Mile Square, near most
shopping and dining. This concern was related to mobility impairments, such as not
being able to drive, and a lack of adequate public transportation for older adults.

Age-Friendly Oxford Needs Assessment: Findings Report 17
Scripps Gerontology Center April 2019
Figure 3. Gap Analysis for Housing Domain Items
25.4%
32.2%
38.0%
69.0%
69.0%
82.1%
36.2%
20.1%
32.4%
3.8%
6.4%
6.4%
38.3%
47.7%
29.7%
27.2%
24.6%
11.4%
Affordable housing options for adults of varying income levels
Accessible homes with universal design features
Affordable housing dedicated to older adults
Home repair contractors who do quality work
Affordable seasonal services such as lawn work or snow removal
Well-maintained homes and properties
Figure 3. Gap Analysis for Housing Domain Items
No perceived gap (not important OR important and Oxford has it)
Perceived gap: it is important but Oxford doesn't have it
Perceived gap: it is important but I don't know if Oxford has it

Age-Friendly Oxford Needs Assessment: Findings Report 18
Scripps Gerontology Center April 2019
TRANSPORTATION & STREETS
To provide context for the information about Oxford’s age-friendliness on transportation,
it is useful to know that most survey respondents drive themselves around Oxford, and
a high percentage walk (see Table 10).
Transportation was the second domain most frequently chosen by respondents as a top
priority and had one of the highest average gap scores, with lack of alignment between
importance and known availability for 50% of the specific transportation services or
amenities. Figure 3 shows the gaps on each transportation item. More than 70% of
respondents saw a gap on three items related to transportation, but the type of the gap
varied. For example, nearly 40% of respondents said that accessible and convenient
public transportation was important but Oxford doesn’t have it, while 47% of
respondents said that reliable public transportation is important but they’re not sure if
Oxford has it (see Figure 3).
Table 10. Respondents Method of Transportation around Oxford
Table 10. Respondents Method of Transportation around Oxford
Types of Transportation Yes (%)
Drive myself 95.1
Walk 64.3
Have others drive me 25.8
Ride a bike 22.2
Use a special transportation service 8.9
Take a taxi/cab 3.5
Use public transportation 2.0
Use Uber or Lyft 1.6
Note. Respondents could check all that apply.
At the end of each section, respondents were invited to include anything else they found
important about transportation. There were 53 respondents who chose to answer this
question. The most prominent themes included issues with pedestrians, general safety
concerns, street surfaces, public transportation, parking, and accessibility. Pedestrian
issues were commonly mentioned concerns. One respondent noted, “Students behave
as if cars don’t exist.”

Age-Friendly Oxford Needs Assessment: Findings Report 19
Scripps Gerontology Center April 2019
Another concern was with general safety issues, which included lighting (having well-lit
intersections and neighborhoods), longer crosswalk times and clearly marked
crosswalks, trimming trees around road signs, and comments on poor design/walkability
of commercial areas. Other comments addressed potholes not being taken care of, and
lack of public transportation to places outside of Oxford. One respondent noted “Need
public transport to Cincinnati, train services too and train stops in town to bigger cities.”
Parking concerns revolved around not enough parking and not enough accessible
parking. Accessibility was also mentioned in regard to transportation for people with
disabilities. One respondent noted, “Not having handicapped accessible transportation
after 3 pm on weekdays and not at all on weekends makes me feel trapped and unable
to be a real part of Oxford.” Some suggestions from these responses included having
automatic countdown timers for all crosswalks and incentivizing public transportation
over cars.

Age-Friendly Oxford Needs Assessment: Findings Report 20
Scripps Gerontology Center April 2019
Figure 4. Gap Analysis for Transportation and Streets Domain Items
26.2%
26.7%
27.8%
31.0%
31.3%
53.0%
53.7%
54.0%
56.5%
58.4%
63.3%
63.9%
65.8%
85.7%
27.2%
26.7%
39.8%
16.7%
18.9%
9.3%
34.2%
7.7%
25.1%
20.4%
18.7%
17.8%
23.1%
8.6%
46.6%
46.6%
32.4%
52.3%
49.8%
37.7%
12.1%
38.2%
18.5%
21.2%
18.0%
18.2%
11.2%
5.7%
Reliable public transportation
Affordable public transportation
Accessible and convenient public transportation
Well-maintained public transportation vehicles
Safe public transportation stops or areas
Special transportation services for older adults
Public parking lots, spaces, and areas to park
Driver education/refresher courses
Streets and intersections that are safe for all users
Affordable public parking
Pedestrian crossings with countdown timers and auditory signals
Enforced speed limits
Well-maintained streets
Easy to read traffic signs
Figure 4. Gap Analysis for Transportation and Streets Domain Items
No perceived gap (not important OR important and Oxford has it)
Perceived gap: it is important but Oxford doesn't have it
Perceived gap: it is important but I don't know if Oxford has it

Age-Friendly Oxford Needs Assessment: Findings Report 21
Scripps Gerontology Center April 2019
HEALTH & WELLNESS
Health and Wellness was the third domain most frequently chosen by respondents as a
top priority for Oxford to address. Overall, the respondents rated their health as good,
very good, or excellent (see Table 11) and reported that they frequently engage in
physical exercise (see Table 12).
Table 11. Respondents Self-Rated Health
Table 11. Respondents Self-Rated Health
In general, when compared to most people your age, how would you rate your health?
Excellent 27.5%
Very good 46.1%
Good 17.9%
Fair/poor 8.6%
Table 12. Frequency of Physical Exercise
Table 12. Frequency of Physical Exercise
How often do you engage in some form of physical exercise (such as walking, biking, yoga, etc.)?
Everyday 38.5%
Several times a week, but not everyday 43.1%
About once a week 9.7%
Less than once a week but more than never 4.1%
Never 4.5%
More than 70% of respondents identified a gap in affordable, high-quality home care,
and the gaps were due to respondents’ uncertainty of whether Oxford has a service. For
example, nearly 77% of respondents said that affordable home health care providers
are important but they weren’t sure if Oxford has them (see Figure 5).
Respondents were invited to comment about anything else they found to be important
about health and wellness. There were 38 respondents who choose to answer this

Age-Friendly Oxford Needs Assessment: Findings Report 22
Scripps Gerontology Center April 2019
question. The most prominent theme was a need for better health and home care
services, which included wanting more options than are currently available. Comments
included a shortage of home health care workers, limited availability of medical
specialists, and the need for more providers who accept Medicaid and Medicare,
especially with regard to mental health services. Several respondents mentioned they
travel to Cincinnati for physician appointments and that finding transportation is difficult.
The need for specialists in Oxford and mixed reviews about quality of care were also
described in the FYRE class report.
Another theme from the survey respondents was affordable health services and fitness
programs. One respondent commented, “The city has fitness activities, but [I] can’t
afford them.” A few respondents were concerned with having a larger range of options
for fitness activities, such as different days and times for individuals who are still
working.
Finally, respondents were concerned with healthcare employees’ ability to understand
and work with older adults. Individuals interviewed for the FYRE report spoke about the
need for a geriatrician in Oxford who understands the specific concerns and needs of
older adults.

Age-Friendly Oxford Needs Assessment: Findings Report 23
Scripps Gerontology Center April 2019
Figure 5. Gap Analysis for Health and Wellness Domain Items
82.2%
78.2%
73.4%
72.4%
70.2%
66.3%
64.5%
59.9%
52.8%
46.6%
45.7%
32.6%
27.0%
23.7%
13.5%
2.1%
7.6%
8.9%
1.4%
10.6%
10.9%
6.1%
5.4%
4.6%
5.0%
5.8%
12.9%
10.6%
7.4%
9.6%
15.7%
14.2%
17.7%
26.2%
19.3%
22.8%
29.4%
34.8%
42.6%
48.4%
48.6%
54.5%
62.4%
68.9%
76.9%
Respectful and helpful hospital/clinic staff
Conveniently located emergency care centers
High-quality hospital and health care facilities
Health and wellness programs
A variety of health care professionals
Medical specialists
Fitness activities geared towards older adults
Conveniently located health and social services
Healthcare professionals who speak different languages
A service that helps seniors find and access health and supportive services
Easily understandable and helpful hospital or clinic answering services
Easy to find information on local health and supportive services
Home care services including health, personal care, and housekeeping
Well-trained home health care providers
Affordable home health care providers
Figure 5. Gap Analysis for Health and Wellness Domain Items
No perceived gap (not important OR important and Oxford has it)
Perceived gap: it is important but Oxford doesn't have it
Perceived gap: it is important but I don't know if Oxford has it

Age-Friendly Oxford Needs Assessment: Findings Report 24
Scripps Gerontology Center April 2019
COMMUNICATIONS AND COMMUNITY INFORMATION
Gathering community information and communication was also a frequently selected
domain that respondents thought was important for the Oxford area to address. The
most common ways respondents reported gathering information about the Oxford
community is through word of mouth (82.1%), newspapers (50.2%), Facebook (24.9%),
faith-based organizations (24.7%), and Oxford Seniors (22.5%). Because a variety of
information is shared online, it was also important to understand how often the
respondents use the Internet. About 80% of the respondents reported that they use the
Internet at least once or more a day to pay bills, check email, get news, or buy products.
In the responses to open-ended questions in other domains, respondents noted specific
areas where they would like more communication and information. For information or
resources specifically for older adults, most respondents reported that they would turn
to a family member or friend. Oxford Seniors was also reported as a highly-used
resource for information about services for older adults (see Table 13).
Table 13. Resources Respondents Would Use for Information about Services for Older Adults
Table 13. Resources Respondents Would Use for Information about Services for Older Adults
Would you turn to the following resources if you, a family member, or friend needed information about services for older adults?
Yes
Family or friends 93.2%
Oxford Senior Center 83.6%
My doctor or other health care professional 80.6%
Internet 73.3%
Lane Public Library 57.6%
Faith-based organizations, such as churches or synagogues 49.8%
Phone book 49.3%
Council on Aging of Southwestern Ohio (COA) 38.9%
Local non-profit organizations, such as LifeSpan, Family Resource Center
37.5%
AARP 36.2%
Local government offices, such as the Department of Health 28.0% Note. Respondents could check all that apply.

Age-Friendly Oxford Needs Assessment: Findings Report 25
Scripps Gerontology Center April 2019
Due to the structure of the questions in the communications and community information
section of the survey, a gap score could not be calculated. Table 14 shows
respondents’ responses to the importance of various community information sources.
When asked about important community information sources, more than 50% of the
respondents said that all the items listed were important to them. These sources
included access to information via posters, computers, Wi-Fi, and by telephone.
Respondents were asked open-ended questions to capture anything else they found
important about communications and community information. There were 38 responses
written about communication, and 21 about community information. The highest priority
was access to community information through different channels. Technology and the
Internet were common themes in responses. Respondents suggested city-wide Wi-Fi
and improved high speed internet services in the Oxford area, but also acknowledged
that not everyone owns a computer or uses social media. One respondent said, “People
who used the Oxford Press for years, and don’t use social media, find it very difficult to
get news about what’s going on [in Oxford].” Some respondents were willing to learn
how to use computers and smartphones, and stated they would participate in trainings.
One respondent mentioned the intergenerational opportunity this presents by saying, “I
would like to be more computer savvy. Perhaps this would be a way for baby boomers
and millennials to bond, be authentic, and learn from each other.” However, most
respondents mentioned the importance of having a local newspaper. One respondent
wrote, “We need a comprehensive communication strategy to replace (or vastly
enhance) the current version of the Oxford Press.”

Age-Friendly Oxford Needs Assessment: Findings Report 26
Scripps Gerontology Center April 2019
Table 14. Communication and Community Information
Table 14. Communication and Community Information
How important do you think it is to have the following in the Oxford area?
Important Neutral Not Important
Access to community information in one central source
80.3% 16.9% 2.8%
Free access to computers and the Internet in public places such as the library, senior centers, or government buildings
79.4% 17.0% 3.6%
Signs and posters that are publicly displayed and easy to read
75.9% 20.9% 3.2%
Community information that is delivered in person to people who may have difficulty or not be able to leave their home
71.5% 23.7% 4.8%
Free access to Wi-Fi via hotspots or free neighborhood networks
71.1% 23.1% 5.8%
An automated community information source that is easy to understand like a toll-free telephone number
62.9% 30.2% 6.9%
Community information that is available in a number of different languages
50.4% 38.0% 11.6%

Age-Friendly Oxford Needs Assessment: Findings Report 27
Scripps Gerontology Center April 2019
SOCIAL PARTICIPATION, INCLUSION, & EDUCATIONAL
OPPORTUNITIES
Respondents were asked a variety of questions in this section, addressing items such
as interaction with friends and family, shopping habits, and the locations where they
attend education classes or workshops. When asked about social interaction, the vast
majority of respondents reported that they interact with family or friends several times a
week or more (See Table 15).
Table 15. Frequency of Interaction with Family and/or Friends
Table 15. Frequency of Interaction with Family and/or Friends
How frequently do you interact with your family, friends, or neighbors in the Oxford area?
More than once a day 49.1%
About once a day 20.1%
Several times a week 22.5%
Once a week or less 8.3%
Over 50% of the respondents said they do half or more of their shopping outside of
Oxford or online. The most common reason most people selected as to why they shop
outside of Oxford is because they are unable to find what they need in Oxford (86.1%).
Some respondents also provided other reasons for shopping outside of Oxford, which
included: affordability, more options, and convenience of shopping online (see Appendix
C).
One factor that may be important to people who are retired includes the availability of
continuing education classes and workshops. Many of the respondents reported that
they participate in continuing education classes at Miami University. Although not
specifically an option, some respondents wrote in the Institute for Learning in
Retirement as an “Other” response, which is housed at Miami University (See Table
16).

Age-Friendly Oxford Needs Assessment: Findings Report 28
Scripps Gerontology Center April 2019
Table 16. Location of Continuing Education Classes/Workshops
Table 16. Location of Continuing Education Classes/Workshops
If anywhere, where do you typically go for continuing education or self-improvement classes/workshops in the Oxford area?
I do NOT participate in any continuing education/self- improvement classes 37.5%
Miami University 41.8%
Oxford Community Arts Center (OCAC) 21.8%
Faith community 18.7%
Oxford Senior Center 15.1%
Online programs 12.7%
Local organizations or businesses 11.6%
Oxford Parks and Recreation 10.5%
Other 8.1%
Offerings through work 6.7%
More than 45% of respondents identified a gap in publicized and affordable activities,
primarily due to not knowing if they are available. For example, 39% of respondents
said that activities that are affordable to all residents are important but they’re not sure if
Oxford has them. However, conveniently located entertainment venues had the largest
gap based on importance and lack of availability. See Figure 7 for more information.
When respondents were asked if they would recommend Oxford as a retirement
destination, most said yes (See Table 17).
Table 17. Oxford as a Retirement Destination
Table 17. Oxford as a Retirement Destination
Would you recommend the Oxford area as a retirement destination?
Yes 63.4%
Not sure 21.9%
No 14.7%

Age-Friendly Oxford Needs Assessment: Findings Report 29
Scripps Gerontology Center April 2019
Respondents were invited to comment about anything else they found to be important
about social participation, inclusion, and educational opportunities. There were 52
respondents who choose to answer this question. Three prominent themes were
wanting a movie theatre, more restaurant options, and easily accessible information
about upcoming events. Several respondents were upset that the previous movie
theatre closed and would like to see a new one open. One respondent noted, “Oxford
needs a movie theatre showing first run movies and matinees for older people who can’t
drive at night.”
The second theme was a desire for more restaurant options. Some comments
mentioned that current restaurants cater to students, and few are adult and family-
friendly or appropriate places to take their guests. For example, some respondents
reported that when family visits from out of town, they feel the need to go outside of
Oxford for dinner.
Finally, easily accessible information for upcoming events was mentioned as a concern.
Respondents stated that there is no longer a local newspaper or radio station from
which to get information. One respondent commented,
There are no longer radio stations or newspapers - how are [we]
supposed to stay informed and connected without them? Much emphasis
on digital mediums that require smartphones. There is not a clear ‘main
source’ for local information, news and civic going ons.

Age-Friendly Oxford Needs Assessment: Findings Report 30
Scripps Gerontology Center April 2019
Figure 6. Gap Analysis for Social Participation, Inclusion, and Educational Opportunities Domain Items
87.7%
77.1%
73.4%
65.3%
64.2%
54.1%
52.5%
51.6%
43.6%
35.6%
2.2%
3.6%
7.2%
7.9%
10.8%
11.0%
36.6%
10.0%
17.0%
29.1%
10.1%
19.4%
19.4%
26.7%
25.1%
34.9%
10.9%
38.4%
39.4%
35.3%
Continuing education classes
Social clubs (such as a book club)
A variety of various cultural activities
Activities involving people of all ages
Activities specifically geared to older adults
Local schools that involve older adults in events and activities
Conveniently located entertainment venues
Activities that offer senior discounts
Activities that are affordable to all residents
Accurate and widely publicized information about social activities
Figure 6. Gap Analysis for Social Participation, Inclusion, and Educational Opportunities Domain Items
No perceived gap (not important OR important and Oxford has it)
Perceived gap: it is important but Oxford doesn't have it
Perceived gap: it is important but I don't know if Oxford has it

Age-Friendly Oxford Needs Assessment: Findings Report 31
Scripps Gerontology Center April 2019
JOB OPPORTUNITIES
More than half of survey respondents indicated that they are retired and not working,
and nearly a fourth of the respondents indicated that they are employed full-time (see
Table 18).
Table 18. Respondents Current Employment Status
Table 18. Respondents Current Employment Status
Which of the following best describes your current employment status?
Self-employed, part-time 6.4%
Self-employed, full-time 2.9%
Employed, part-time 8.9%
Employed, full-time 22.8%
Unemployed, but looking for work 0.4%
Retired, not working at all 56.9%
Not in paid labor force for other reasons 1.8%
The gap analysis questions asked in the job opportunities domain were only asked to
individuals who said they were employed or looking for work. The mean percentage gap
score was 81.3%. Almost 80% of respondents said that there was a gap for all three
items asked in the domain, but the gaps were because respondents were unsure if
Oxford offered the services. For example, nearly 65% of respondents said jobs that are
adapted to meet the needs of people with disabilities are important, but they’re not sure
if Oxford has them (See Figure 7).

Age-Friendly Oxford Needs Assessment: Findings Report 32
Scripps Gerontology Center April 2019
Figure 7. Gap Analysis for Job Opportunities Domain Items
20.5%
18.6%
16.8%
27.7%
16.8%
20.4%
51.8%
64.6%
62.8%
A range of flexible job opportunities
Job training opportunities for older adults who want to learn new job skills
Jobs that are adapted to meet the needs of people with disabilities
Figure 7. Gap Analysis for Job Opportunities Domain Items
No perceived gap (not important OR important and Oxford has it)
Perceived gap: it is important but Oxford doesn't have it
Perceived gap: it is important but I don't know if Oxford has it

Age-Friendly Oxford Needs Assessment: Findings Report 33
Scripps Gerontology Center April 2019
OUTDOOR SPACES & BUILDINGS
Overall, respondents did not identify many gaps for items in the outdoor spaces and
buildings domain. Among the items in outdoor spaces and buildings with a perceived
gap of at least 50%, most respondents said that well-maintained, accessible public
restrooms, and neighborhood watch programs are important but they’re not sure if
Oxford has them. See Figure 8 for more information.
Respondents were invited to comment about anything else they found to be important
regarding outdoor spaces and buildings. There were 49 respondents who chose to
answer this question. Three prominent themes from this domain were safety concerns,
additional recreational areas, and general maintenance of outdoor areas. With regard to
safety, respondents were concerned about not having enough lighting at night, having
well-paved sidewalks, safe intersection crossings, and safe pathways to walk to work
and around neighborhoods. These concerns echoed the concerns mentioned in the
transportation and streets domain.
Comments showed a desire for more recreational areas, such as parks, bike paths, and
walking paths, to be added around Oxford. Some of these comments also asked for
shaded picnic areas and benches.
Comments regarding general maintenance of outdoor areas were aimed at keeping up
with landscaping (mowing grass, cutting weeds, preventing overgrown lawns),
maintaining sidewalks (cracks in sidewalks), and keeping Oxford clear of trash. Other
concerns included issues with parking (mainly at Miami University), no public restrooms
uptown, building accessibility (such as automatic doors), and not wanting to increase
taxes to fix these issues.

Age-Friendly Oxford Needs Assessment: Findings Report 34
Scripps Gerontology Center April 2019
Figure 8. Gap Analysis for Outdoor Spaces and Buildings Domain Items
22.5%
46.7%
51.8%
58.8%
68.4%
68.9%
77.1%
27.9%
13.0%
28.3%
20.8%
8.0%
16.9%
20.8%
49.6%
40.2%
19.9%
20.4%
23.6%
14.3%
2.1%
Well-maintained public restrooms that are accessible
Neighborhood watch programs
Sidewalks that are in good condition, accessible, and safe
Public parks with enough benches
Well-maintained and accessible public buildings and community facilities
Separate pathways for bicyclists
Well-maintained and safe parks within walking distance of my home
Figure 8. Gap Analysis for Outdoor Spaces and Buildings Domain Items
No perceived gap (not important OR important and Oxford has it)
Perceived gap: it is important but Oxford doesn't have it
Perceived gap: it is important but I don't know if Oxford has it

Age-Friendly Oxford Needs Assessment: Findings Report 35
Scripps Gerontology Center April 2019
VOLUNTEERING & CIVIC ENGAGEMENT
Among all the domains (excluding job opportunities), volunteering and civic engagement
had the largest gap. Just over 60% of respondents reported that they volunteer at
organizations in the Oxford area (See Table 19). Table 19. Frequency of Volunteering in the Oxford Area
Table 19. Frequency of Volunteering in the Oxford Area
How often do you volunteer at organizations in the Oxford area?
More than once a week 11.8%
Once a week 11.8%
At least once a month 16.8%
Less than monthly 21.4%
Never 38.2%
Among the items in the volunteering and civic engagement domain, more than 70% of
respondents identified a gap in transportation to and from volunteer activities and easy
to locate information about volunteer activities, but these gaps were because
respondents were unsure if such activities were available in Oxford. For example, 59%
of respondents said that transportation to and from volunteer activities for those who
need it was important but they’re not sure if Oxford has it. See Figure 9 for more
information.
Respondents were invited to include anything else they found to be important about
volunteering and civic engagement. There were 18 participants who choose to respond
to this question. The two main themes from these comments were better
communication about available opportunities and a desire for intergenerational
volunteering. One respondent noted, “Poor communications and access to information
for population segments that are not tech savvy.” The desire to see information in other
forms besides the Internet was echoed by respondents in other domains as well and
indicates this may be a common concern for older adults in Oxford.
Regarding intergenerational opportunities, one respondent suggested opportunities for
seniors to volunteer in the schools. Another commented, “Need to require schools and
the college to be involved in activities helping seniors at home, picking up litter, animal
welfare, etc.” The connection between the university and Oxford community could
certainly facilitate opportunities to promote and engage individuals in intergenerational
volunteering.

Age-Friendly Oxford Needs Assessment: Findings Report 36
Scripps Gerontology Center April 2019
Figure 9. Gap Analysis for Volunteering and Civic Engagement Domain Items
68.0%
45.1%
43.5%
29.1%
26.4%
3.2%
4.3%
9.4%
20.9%
14.3%
28.8%
50.5%
47.1%
50.0%
59.3%
A range of volunteer activities
Volunteer training opportunities
Opportunities for older adults to participate in decision-making bodies
Easy to find information about local volunteer opportunities
Transportation to and from volunteer activities for those who need it
Figure 9. Gap Analysis for Volunteering and Civic Engagement Domain Items
No perceived gap (not important OR important and Oxford has it)
Perceived gap: it is important but Oxford doesn't have it
Perceived gap: it is important but I don't know if Oxford has it

Age-Friendly Oxford Needs Assessment: Findings Report 37
Scripps Gerontology Center April 2019
CONCLUSION
The top three areas respondents identified as the most important for Oxford to address
were housing, transportation and streets, and health and wellness. These domains also
had large gap scores. Communications was identified as an important issue that
respondents would like to see addressed in the community and was mentioned several
times in open-ended responses throughout the domains.
At the end of the survey, respondents were offered an opportunity to share final
thoughts about growing older in Oxford. Sixty-nine respondents chose to provide an
answer. A majority of the comments were similar to those shared in each domain and
included topics such as affordable housing, public transportation, parking, availability of
health specialists in Oxford, and healthy aging. Some respondents also mentioned the
availability of intergenerational opportunities throughout the community and wanted to
see uptown as a place for all ages to use. One respondent said,
…supporting schools & opportunities for young people is an equal priority
to providing for older people & older population is growing. Look for
opportunities to support both with volunteer ‘grandparents’ in schools, pre-
schools in nursing homes or [other] care areas, etc. Some communities
have found great value in these blended priority programs…
More on-going connections between the Oxford community and Miami University could
assist in creating even more opportunities for intergenerational activities.
Although challenges and problems were presented, most respondents seemed to agree
that Oxford is a good place to live and grow older. The results from this community
needs assessment will assist the Age-Friendly Oxford Initiative Leadership Advisory
Group in creating their action plan - the next phase of the age-friendly process.

Age-Friendly Oxford Needs Assessment: Findings Report 38
Scripps Gerontology Center April 2019
APPENDIX A
SAMPLE QUESTIONS CONTRIBUTING TO GAP ANALYSIS
Figure 10. Example of Importance and Availability Question Format
Figure 10. Example of Importance and Availability Question Format

Age-Friendly Oxford Needs Assessment: Findings Report 39
Scripps Gerontology Center April 2019
APPENDIX B
ADDITIONAL DEMOGRAPHIC TABLES
Table 20. Relationships between Caregivers and Care Recipients
Table 20. Relationships between Caregivers and Care Recipients
Are you providing care to any of the following people? Yes
Spouse/partner 14.9%
Child/children under 18 6.2%
Child/children 18 or older 7.8%
Grandchildren under 18 7.1%
Grandchildren 18 or older 1.2%
Parents 10.2%
Other adult relative or friend 18 or older 5.6%
Note. Respondents could check all that apply.
Table 21. People Living in the Same Household
Table 21. People Living in the Same Household
Do you have any of the following people living in your household? Yes
Spouse/partner 74.2%
Child/children under 18 6.4%
Child/children 18 or older 11.6%
Grandchildren under 18 2.5%
Grandchildren 18 or older 0.8%
Parents 2.5%
Other adult relative or friend 18 or older 2.1%
Note. Respondents could check all that apply.

Age-Friendly Oxford Needs Assessment: Findings Report 40
Scripps Gerontology Center April 2019
Table 22. Presence of Chronic Disease/Disability that Restricts Full Participation in Various Activities
Table 22. Presence of Chronic Disease/Disability that Restricts Full Participation in Various Activities
Do you or your spouse/partner have a disability or chronic disease that keeps you or him/her from fully participating in work, school, housework, or other activities?
Yes
Yes, myself 14.8%
Yes, my spouse/partner 8.7%
Yes, both me and my spouse/partner 4.3%
No 69.7%
Prefer not to answer 2.5%
Table 23. Availability of Health Care Coverage
Table 23. Availability of Health Care Coverage
Do you have any of the following kinds of health care coverage? Yes
Insurance through a current or former employer of me or my spouse 74.4%
Insurance purchased directly from an insurance company (not through employer)
32.8%
Medicare (for people 65 and older or people with certain health disabilities) 70.5%
Medicaid or government assistance plan for those with low incomes or a disability
5.0%
Veterans Administration or other military health care 4.5%
Any other health care insurance coverage 15.5%
Note. Respondents could check all that apply.

Age-Friendly Oxford Needs Assessment: Findings Report 41
Scripps Gerontology Center April 2019
APPENDIX C
ADDITIONAL TABLES FOR SOCIAL PARTICIPATION, INCLUSION, &
EDUCATIONAL OPPORTUNITIES
Table 24. Frequency of Shopping and/or Dining Uptown
Table 24. Frequency of Shopping and/or Dining Uptown
On average, how often do you go uptown for shopping or dining?
Several times a week 21.4%
Once a week 18.7%
Once every 2 or 3 weeks 17.3%
Once a month 12.8%
Less than monthly 21.8%
Never 8.0%
Table 25. Frequency of Shopping and/or Dining in Oxford besides Uptown
Table 25. Frequency of Shopping and/or Dining in Oxford besides Uptown
On average, how often do you go to places in Oxford besides uptown for shopping or dining?
Once a day or more 12.9%
Several times a week 44.1%
Once a week 24.7%
Less than once a week 18.4%

Age-Friendly Oxford Needs Assessment: Findings Report 42
Scripps Gerontology Center April 2019
Table 26. Amount of Shopping Done Online or Outside of Oxford
Table 26. Amount of Shopping Done Online or Outside of Oxford
On average, about how much of your shopping do you do outside of Oxford or online?
Half or more 56.5%
Less than half 36.6%
None 6.9%
Table 27. Selected Reasons for Shopping Outside of Oxford
Table 27. Selected Reasons for Shopping Outside of Oxford
On average, when you choose to shop outside Oxford (including online), what are the reasons?
Not being able to find what I need in Oxford 86.1%
The stores present in Oxford 40.1%
A preference for online shopping 26.8%
Accessibility of the shops 24.7%
Other 16.1%
A preference for shopping outside of Oxford for no reason specific to Oxford 9.8%
Note. Respondents could check all that apply.

Age-Friendly Oxford Needs Assessment: Findings Report 43
Scripps Gerontology Center April 2019
Table 28. Opinions on Accessibility for Oxford’s Shopping and Dining Locations
Table 28. Opinions on Accessibility for Oxford’s Shopping and Dining Locations
In general, do you feel as if Oxford shopping and dining locations are accessible to people with disabilities?
Yes 22.4%
No 10.3%
Partly 35.9%
Not sure 31.4%
Table 29. Accessibility Limitations of Oxford’s Businesses
Table 29. Accessibility Limitations of Oxford’s Businesses
Does the accessibility of the businesses in Oxford limit your usage of them?
Yes 13.2%
No 68.1%
Partly 12.5%
Not sure 6.3%

Age-Friendly Oxford Needs Assessment: Findings Report 44
Scripps Gerontology Center April 2019
APPENDIX D
ADDITIONAL TABLES FOR COMMUNICATIONS
Table 30. Use of Social Media Platforms
Table 30. Use of Social Media Platforms
What social media platforms do you use regularly?
Facebook 56.1%
Twitter 6.1%
Instagram 9.7%
LinkedIn 8.6%
None 36.0%
Other 6.5%
Note. Respondents could check all that apply.

Age-Friendly Oxford Needs Assessment: Findings Report 45
Scripps Gerontology Center April 2019
ENDNOTES
1 World Health Organization. (n.d.). Age-friendly cities and communities. Retrieved from https://www.who.int/ageing/projects/age-friendly-cities-communities/en/
2 AARP (n.d.). The 8 Domains of Livability: An introduction. Retrieved from https://www.aarp.org/livable-communities/network-age-friendly-communities/info-2016/8-domains-of-livability-introduction.html
3 World Health Organization. (2018). The Global Network for Age-friendly Cities and Communities: Looking back over the last decade, looking forward to the next. Retrieved from https://www.who.int/ageing/publications/gnafcc-report-2018/en/
4 World Health Organization. (n.d.). AARP Network of Age-Friendly Communities. Retrieved from https://extranet.who.int/agefriendlyworld/network/aarp-network-of-age-friendly-communities-2/
5 See 2.
6 AARP. (n.d.). AARP Network of Age-Friendly States and Communities. Retrieved from: https://www.aarp.org/livable-communities/network-age-friendly-communities/info-2015/8-domains-of-livability-resources.html
7 AARP. (2015). AARP Community Survey Questionnaire. Retrieved from https://www.aarp.org/content/dam/aarp/livable-communities/livable-documents/documents-2016/Questionnaire-AARP-Survey-of-Community-Residents-123115.pdf
8 Arnell, B., Baker, C., Bennington, B., Davidson-Bey, A., Hall, B., Heath, S., Pryor, T., Vaswani, S., Woodford, C., Graham, K., Roy, S., & de Medeiros, K. (2018). Age-Friendly Oxford: A qualitative study conducted by the Miami University First Year Research Experience (FYRE) class of 2017-18. Oxford, OH: Scripps Gerontology Center, Miami University.
9 United States Census Bureau. (2017-2017). American Fact Finder: Community facts. Retrieved from https://factfinder.census.gov/faces/nav/jsf/pages/community_facts.xhtml
10 United States Census Bureau. (2010-2017). QuickFacts: Oxford city, Ohio. Retrieved from https://www.census.gov/quickfacts/fact/table/ oxfordcityohio,US/PST045217