ageas - full year 2016 results
TRANSCRIPT

Periodical Financial Information
FY 2016RESULTS

Table of contents Slides used during analyst call 2
Segment information 18
Equity / Solvency 49
Investment portfolio 58
Legal Settlement 63
General Information 68

Main messagesGood operating performance across most segments - negative exceptionals in UK
3Periodic financial Information I FY 16 results I 15 February 2017
*Consolidated entities only
Insurance
performance
Group result
Balance sheet
Gross dividend
Fortis settlement
Insurance net profit of EUR 821 mio (+9%) – Q4 at EUR 18 mio
Inflow @ 100% of EUR 31.7 bn (+6%) – Q4 at EUR 7.0 bn
Life Guaranteed margin at 93 bps* (vs.90 bps) – Q4 at 80 bps
Group combined ratio at 98.7%* (vs.96.9%) – Q4 at EUR 103.7%
Life Technical Liabilities at EUR 74.5 bn* (+1% vs. YE 2015)
Group net profit of EUR 127 mio – Q4 profit of EUR 9 mio
General Account net loss of EUR 694 mio as result of provision for
Fortis settlement – Q4 loss of EUR 8 mio
Shareholders’ equity at EUR 9.7 bn or EUR 47.03 per share
UG/L at EUR 2.5 bn or EUR 12.03 per share
Insurance Solvency IIageas at 182%, Group ratio at 195%
Total Liquid Assets General Account at EUR 1.9 bn (vs.EUR 1.6 bn)
Proposal of 2.10 EUR/share – incl. 0.40 EUR related to cap gain HK
Hearing Amsterdam Court on 24 March 2017
Judgment on binding character expected by mid 2017

199
573
505
182
118755
821
FY 15 FY 16
cap gain AICA Life Non-Life
In EUR mio In EUR bn
Non-Life combined ratio incl. 4.9 pp terrorism, weather & UK one-offs
Inflows*: strong Life growth in Asia & BelgiumIn EUR bn
Total Insurance: HeadlinesGood operating performance across most segments – UK result including one-off items
4Periodic financial Information I FY 16 results I 15 February 2017
Operating margin Guaranteed up on cap gains on Real Estate in BE
Operating margin Unit-Linked down on divestment HK
In bps avg technical liabilities In bps avg technical liabilities
* incl. non-consolidated partnerships @ 100%
In % NEP
Net result: Q4 including EUR 137 mioexceptionals in UK & Asia
Life Technical liabilities up – impact sale Hong Kong EUR 3.2 bn
147
81
(5)(63)
142
18
Q4 15 Q4 16
23.5 25.4
6.36.3
29.831.7
FY 15 FY 16
Life Non-Life
5.6 5.5
1.5 1.5
7.0 7.0
Q4 15 Q4 16
96.9 98.7
FY 15 FY 16
102.1 103.7
Q4 15 Q4 16
90 93
FY 15 FY 16
119
80
Q4 15 Q4 16
3625
FY 15 FY 16
35 36
Q4 15 Q4 16
74.1 75.3 74.5
61.166.4 69.5
135.2141.6 144.0
FY 15 9M 16 FY 16
conso non-conso

10/03/2010 I page 5
Overview of net realised capital gains* on investmentsSupport of cap gains substantially lower in Asia
5Periodic financial Information I FY 16 results I 15 February 2017
* Net capital gains include capital gains, impairment & related changes in profit sharing, net of tax & @ ageas’s part –
CEU JV’s not included
EUR mio FY 15 FY 16 Q4 15 Q4 16
Life 75 76 41 (4) Comparable impact on FY basis
Non-Life (1) 9 (4) (3) cap gains on RE in H1 2016
Total Belgium 75 85 37 (7) impairments in Q4 2016
Non-Life 9 10 2 0
Total UK 9 10 2 0
Life (7) (4) (4) 1
Non-Life 1 1 0 0 Downward equity movements
Total CEU (6) (4) (4) 2
Life 107 (8) 37 (19) Exceptionally high level of
Non-Life (1) 3 0 cap gains in 2015
Total Asia 107 (5) 37 (19) Equity impairments in Q4 2016
Life 175 64 73 (22)
Non-Life 9 22 (2) (2)
Total Ageas 183 86 71 (24)

456
188
391
197
(313)
188
624
270
654
309
737
329
755
338
821
423
2010 2011 2012 2013 2014 2015 2016 2017
6Periodic financial Information I FY 16 results I 15 February 2017
Proposed gross cash dividend of EUR 2.10 / share EUR 0.4/share related to sale Hong Kong – total 3.7 bn returned to shareholders since 2009
* calculation based on day before dividend declaration
** 45% pay-out ratio on insurance net result excluding UK exceptionals
Dividend distributed duringbased on
Net result of the year before
**
since '09
gross dividend / share 0.80 0.80 0.80 1.20 1.40 1.55 1.65 1.70 9.90
additional dividend / share 0.40 0.40
pay-out ratio 41% 50% - 43% 47% 45% 45% 52%
dividend yield* 2.9% 3.7% 4.7% 4.6% 4.4% 5.0% 4.9% 5.3%
Paid dividend 188 197 188 270 309 329 338 423 2,242
Share buy-back executed 230 160 144 209 250 244 40 1,277
Capital reduction 223 223
Total returned to shareholders 188 427 348 637 518 579 582 463 3,743

Belgium268
Belgium168
Belgium294
Belgium333
UK 23
UK 82
UK 64
UK 50
UK 47
CEU 7
CEU 36
CEU150
CEU 53 CEU 19
Asia 12
Asia 52
Asia106 Asia 43
Asia89
42
438
488
440
487
2012 2013 2014 2015 2016
7
Disciplined cash upstream from operating companiesConsistent average upstream of ≈ EUR 450 mio per annum since Vision 2015
Belgium main contributor of cash
Upstream covering dividend & holding costs on FY basis
On top of these amounts ≈ EUR 430 mio upstream linked
to capital optimization in 2013 & 2014
In EUR mio
Biggest part
of upstream
done in H1
Italy 10
9
Malaysia17
Thailand11
China61
Upstream duringbased on net result of the year before
Periodic financial Information I FY 16 results I 15 February 2017
Luxembourg
* internal loan granted
*
*

3.8 4.2
1.91.9
5.76.1
FY 15 FY 16
Life Non-Life
9955
21
26
120
82
Q4 15 Q4 16
In bps avg technical liabilities In bps avg technical liabilitiesIn % NEP
8Periodic financial Information I FY 16 results I 15 February 2017
In EUR mio In EUR bn In EUR bn
281 288
103 102
384 391
FY 15 FY 16
Life Non-Life
1.1 1.0
0.4 0.4
1.5 1.5
Q4 15 Q4 16
56.3 59.8 59.0
FY 15 9M 16 FY 16
86 86
FY 15 FY 16
94.7 96.0
FY 15 FY 16
96.2 92.8
Q4 15 Q4 16
27
64
Q4 15 Q4 16
32 31
FY 15 FY 16
131
70
Q4 15 Q4 16
Belgium : HeadlinesNet profit up despite adverse impact terrorism & weather events
Net result slightly up - Q4 lower on less realised capital gains
Inflows: growth driven by Life short term investment products - levelled off in Q4
Life Technical liabilities up 5%
Non-Life combined ratio 93.9% when excluding terrorism - excellent in Q4
Operating margin Guaranteed: cap gains spread differently over quarters
Operating margin Unit-Linked almost stable
102.1 106.0
FY 15 FY 16
In EUR mio
9Periodic financial Information I FY 16 results I 15 February 2017
In % of NEPIn EUR bn
* incl. non-consolidated partnerships @ 100%
30
(56)
FY 15 FY 16
(35)
(110)
Q4 15 Q4 16
112.9
126.3
Q4 15 Q4 16
2.5 2.2
FY 15 FY 16
0.60.5
Q4 15 Q4 16
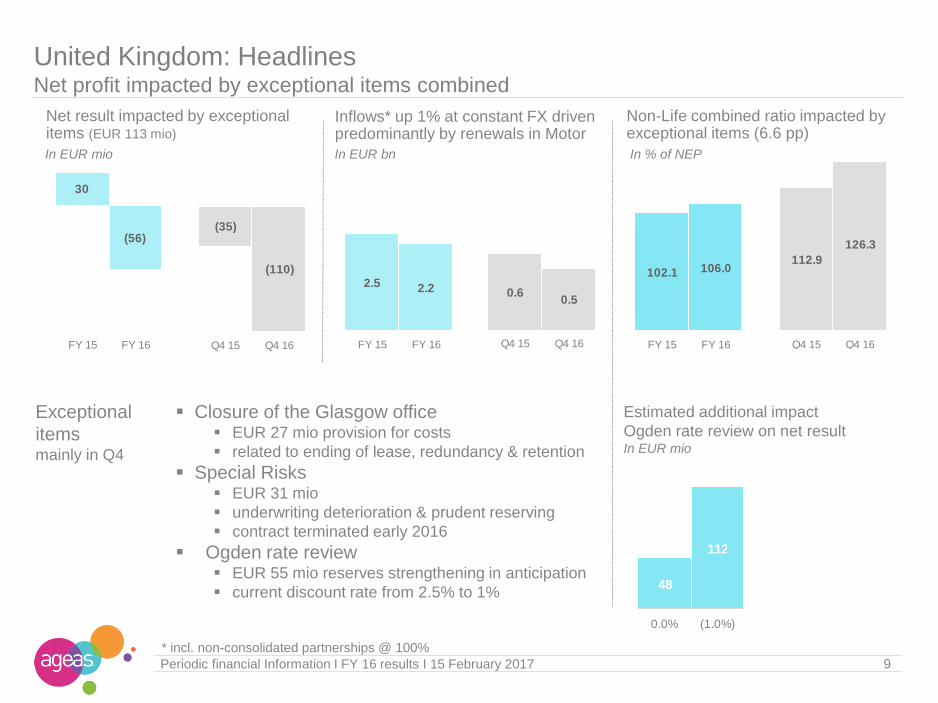
United Kingdom: HeadlinesNet profit impacted by exceptional items combined
Net result impacted by exceptional items (EUR 113 mio)
Inflows* up 1% at constant FX driven predominantly by renewals in Motor
Non-Life combined ratio impacted byexceptional items (6.6 pp)
Estimated additional impact
Ogden rate review on net resultIn EUR mio
Closure of the Glasgow office EUR 27 mio provision for costs
related to ending of lease, redundancy & retention
Special Risks EUR 31 mio
underwriting deterioration & prudent reserving
contract terminated early 2016
Ogden rate review EUR 55 mio reserves strengthening in anticipation
current discount rate from 2.5% to 1%
Exceptional
itemsmainly in Q4
48
112
0.0% (1.0%)

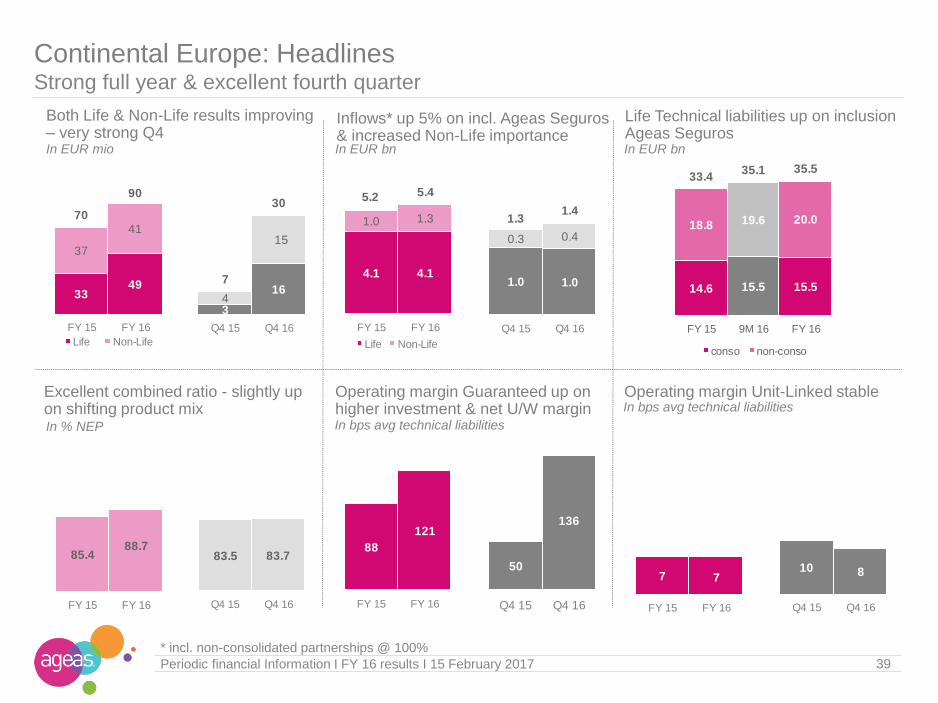
Both Life & Non-Life results improving – very strong Q4In EUR mio In EUR bn
Excellent combined ratio - slightly up on shifting product mix
Inflows* up 5% on incl. Ageas Seguros& increased Non-Life importance
In EUR bn
Continental Europe: Headlines Strong full year & excellent fourth quarter
Operating margin Guaranteed up on higher investment & net U/W margin
10Periodic financial Information I FY 16 results I 15 February 2017
Life Technical liabilities up on inclusion Ageas Seguros
Operating margin Unit-Linked stable
In % NEP
* incl. non-consolidated partnerships @ 100%
3349
37
4170
90
FY 15 FY 16
Life Non-Life
3
164
15
7
30
Q4 15 Q4 16
4.1 4.1
1.0 1.3
5.2 5.4
FY 15 FY 16
Life Non-Life
1.0 1.0
0.3 0.4
1.31.4
Q4 15 Q4 16
14.6 15.5 15.5
18.8 19.6 20.0
33.435.1 35.5
FY 15 9M 16 FY 16
conso non-conso
85.488.7
FY 15 FY 16
83.5 83.7
Q4 15 Q4 16
88
121
FY 15 FY 16
50
136
Q4 15 Q4 16
7 7
FY 15 FY 16
10 8
Q4 15 Q4 16
In bps avg technical liabilities
In bps avg technical liabilities
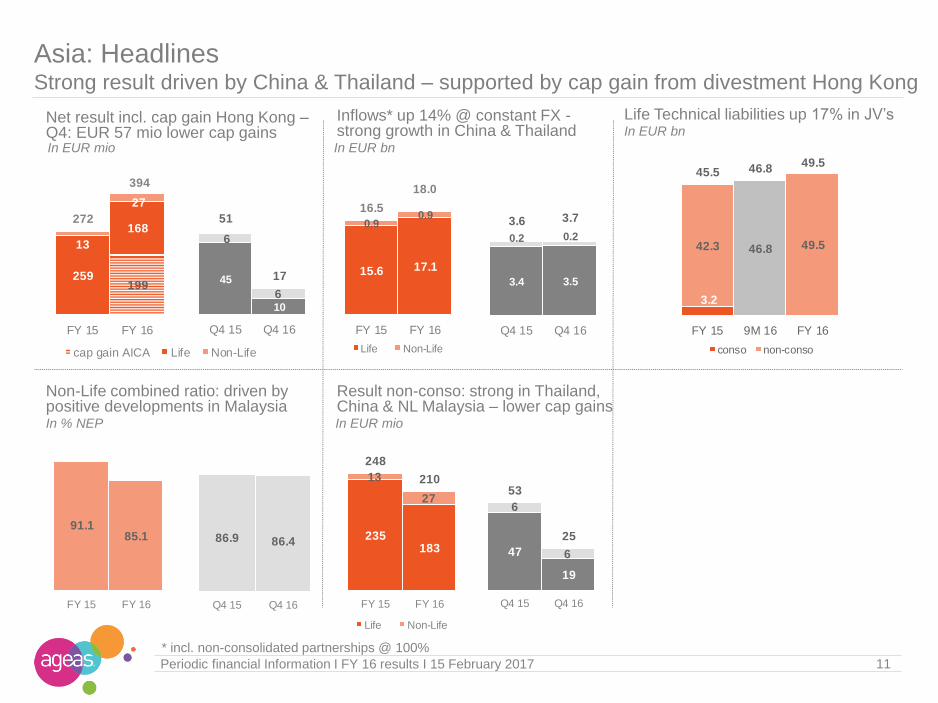
Net result incl. cap gain Hong Kong –Q4: EUR 57 mio lower cap gainsIn EUR mio In EUR bn
Non-Life combined ratio: driven by positive developments in Malaysia
Inflows* up 14% @ constant FX -strong growth in China & Thailand
Life Technical liabilities up 17% in JV’sIn EUR bn
Asia: Headlines Strong result driven by China & Thailand – supported by cap gain from divestment Hong Kong
11Periodic financial Information I FY 16 results I 15 February 2017
In EUR mio
Result non-conso: strong in Thailand, China & NL Malaysia – lower cap gains
In % NEP
* incl. non-consolidated partnerships @ 100%
199259
168
13
27
272
394
FY 15 FY 16
cap gain AICA Life Non-Life
15.6 17.1
0.90.9
16.5
18.0
FY 15 FY 16
Life Non-Life
3.4 3.5
0.2 0.2
3.6 3.7
Q4 15 Q4 16
45
10
6
6
51
17
Q4 15 Q4 16
3.2
42.3 46.8 49.5
45.5 46.849.5
FY 15 9M 16 FY 16
conso non-conso
235183
13
27
248
210
FY 15 FY 16
Life Non-Life
86.9 86.4
Q4 15 Q4 16
91.185.1
FY 15 FY 16
47
19
6
6
53
25
Q4 15 Q4 16

In EUR mio
12Periodic financial Information I FY 16 results I 15 February 2017
In % NEPIn EUR mio
Intreas: HeadlinesInternal Non-Life reinsurance company established in July 2015
Net result Inflows Combined ratio
0 0
3
FY 15 FY 16
0 (1)
Q4 15 Q4 16
41
FY 15 FY 16
9
Q4 15 Q4 16
86.1
FY 15 FY 16
334.4
Q4 15 Q4 16
0 0 0

Result Q4 lower on revaluation RPN(i)In EUR mio
Accounting value of remaining legacies
General Account: Headlines Impacted by cap gain on sale of Hong Kong, Fortis settlement & revaluation RPN(i) liability
13Periodic financial Information I FY 16 results I 15 February 2017
Total liquid assets up on sale HK –EUR 0.8 bn ring-fenced for settlement
In EUR mioImpact on P&L from RPN(i) Staff & Operating expenses up on one-
offs (legal settlement & HR related)
In EUR mio In EUR bn
In EUR mio
In EUR mio
Accounting value on AG Insurance put option: up driven by higher multiples
15
(694)
FY 15 FY 16
29
(8)
Q4 15 Q4 16
1.3
1.8 1.8
0.3
0.2 0.21.6
2.0 1.9
FY 15 9M 16 FY 16
net cash liquid assets
(402)(295) (275)
41 41 42
(133)
(1,019) (1,024)
FY 15 9M 16 FY 16
RPN(i) RPI Settlement
(1,064) (1,083)(1,266)
FY 15 9M 16 FY 16
1732
53
63
70
95
FY 15 FY 16
Staff & Intercompany Operating
4 9
15 14
1923
Q4 15 Q4 16
65 83
FY 15 FY 16
43
20
Q4 15 Q4 16

14Periodic financial Information I FY 16 results I 15 February 2017
Shareholders’ equity at EUR 9.7 bn - UG/L of EUR 12.03/shareDown on legal settlement, financial market, put option & return to shareholders
In EUR mio
7,0956,554
2,952
2,498
1,330
604
821
(694)(484)
(338) (244)(289)
(430)(57) (4)
EUR 53.59 EUR 47.03
11,376
9,656
FY 15 ResultInsurance
ResultGen Acc
ChangeUG/L
Dividend TreasuryShares
Reval AGput option
Forex IAS 19 Other FY 16
InsuranceUCG/L Insurance
UCG/L
Shareholders’
equity per
segment
Shareholders’
equity per share
FY 15 FY 16 FY 15 FY 16
Belgium 4,932 ► 4,683 Asia 3,009 ► 2,004
UK 1,129 ► 911 Reinsurance 104
Continental Europe 977 ► 1,350 Insurance 10,047 ► 9,052
General Account 1,330 ► 604

2.9 2.8
0.8 0.7 0.7 0.90.3 0.0
(0.3) (0.3)
4.4 4.2
0.0 0.1
4.4 4.2
0.71.6
6.9 6.9
1.10.8 0.9 1.2
0.60.1 (1.5)(1.5)
8.07.6
1.4
0.7
9.4
8.3
1.8
4.3
FY 15 FY 16 FY 15 FY 16 FY 15 FY 16 FY 15 FY 16 FY 15 FY 16 FY 15 FY 16 FY 15 FY 16 FY 15 FY 16 FY 15 FY 16 FY 15 FY 16
15Periodic financial Information I FY 16 results I 15 February 2017
Solvency IIageasImpact from exceptional items in UK compensated by Belgium & CEU
Solvency IIageas
in %
In EUR bn
Own Funds
SCR
Non EU
Non-controlled
participations*
Insurance ratio remains stable
Group ratio influenced by legal settlement & increasing put option liability
Expected dividend deducted
242% 244% 130% 120% 131% 127% 179% - - 278% 182% 182% 212% 195% 253% 264%
Belgium UK CEU Asia Reins. Diversification Insurance GA Group
Non-transferable
* Based on local solvency requirements

1. 2016 was remarkable & good year for Ageas &
last week’s news on UK did not change that
2. Settlement agreement big milestone
3. Further structural improvement of earnings in most segments
4. Proposed gross dividend as a sign of comfort with respect to
the financial health of Ageas


Table of contents Slides used during analyst call 2
Segment information 18
Equity / Solvency 49
Investment portfolio 58
Legal Settlement 63
General Information 68

Non-Life combined ratio – 4.9 pp exceptional items
Solvency II ageas – comfortably above 175%
Ambition 2018 targetsReaching 4 targets out of 6
19Periodic financial Information I FY 16 results I 15 February 2017
Operating margin Guaranteed above target range
Operating margin Unit-Linked far below target range
* Calculated on insurance net result excluding UK exceptionals – 52% pay-out ratio on total Insurance result
ROE – ROE excl Hong Kong @ 9.6% Proposed gross dividend in line with promised pay-out ratio*
11% 12%
11% - 13%
2015 2016 target
96.9 98.7
97 %
2015 2016 target
90 93
85 - 90 bps
2015 2016 target
45% 45%
40% - 50%
2015 2016 target
3625
40 - 45 bps
2015 2016 target
182% 181%
175%
2015 2016 target

Periodic financial Information I FY 16 results I 15 February 2017 20
Key financials
In EUR mio FY 15 FY 16 Q4 15 Q4 16
Gross inflows 29,792 31,654 6% 7,023 6,962 (1%)
Net result Insurance 755 821 9% 142 18 (87%)
By segment: - Belgium 384 391 2% 120 82 (32%)
- UK 30 (56) (290%) (35) (110) 213%
- Continental Europe 70 90 28% 7 30 330%
- Asia 272 394 45% 50 17 (67%)
- Reinsurance 0 3 0 (1)By type: - Life 573 704 23% 147 81 (45%)
- Non-Life 182 118 (36%) (5) (63) 1164%
Net result General Account 15 (694) 29 (8) (129%)
Net result Ageas 770 127 171 9 (95%)
Earnings per share (in EUR) 3.57 0.61
Life Operating Margin Guaranteed (in bps) 90 93 119 80
Life Operating Margin Unit-Linked (in bps) 36 25 35 36
Combined ratio (in %) 96.9 98.7 102.1 103.7
FY 15 FY 16
Shareholders' equity 11,376 9,656 (15%)
Net equity per share (in EUR) 53.59 47.03
Insurance ROE excl.UG/L 11.0% 12.0%
Insurance Solvency IIageas ratio 182% 182%
For a definition see Lexicon in annex to the press release

199
573
505
182
118755
821
FY 15 FY 16
cap gain AICA Life Non-Life
In EUR mio In EUR bn
Non-Life combined ratio incl. 4.9 pp terrorism, weather & UK one-offs
Inflows*: strong Life growth in Asia & BelgiumIn EUR bn
Total Insurance: HeadlinesGood operating performance across most segments – UK result including one-off items
21Periodic financial Information I FY 16 results I 15 February 2017
Operating margin Guaranteed up on cap gains on Real Estate in BE
Operating margin Unit-Linked down on divestment HK
In bps avg technical liabilities In bps avg technical liabilities
* incl. non-consolidated partnerships @ 100%
In % NEP
Net result: Q4 including EUR 137 mioexceptionals in UK & Asia
Life Technical liabilities up – impact sale Hong Kong EUR 3.2 bn
147
81
(5)(63)
142
18
Q4 15 Q4 16
23.5 25.4
6.36.3
29.831.7
FY 15 FY 16
Life Non-Life
5.6 5.5
1.5 1.5
7.0 7.0
Q4 15 Q4 16
96.9 98.7
FY 15 FY 16
102.1 103.7
Q4 15 Q4 16
90 93
FY 15 FY 16
119
80
Q4 15 Q4 16
3625
FY 15 FY 16
35 36
Q4 15 Q4 16
74.1 75.3 74.5
61.166.4 69.5
135.2141.6 144.0
FY 15 9M 16 FY 16
conso non-conso

Inflows @ 100% Growth driven by Asian & Belgian Life & inclusion Ageas Seguros – 4% negative FX
22Periodic financial Information I FY 16 results I 15 February 2017
EUR mio FY 15 FY 16 FY 15 FY 16 FY 15 FY 16
Belgium 75% 3,799 4,182 10% 1,881 1,883 0% 5,679 6,065 7%
United Kingdom - 2,457 2,203 (10%) 2,457 2,203 (10%)
Consolidated entities 100% - 1,905 1,720 (10%) 1,905 1,720 (10%)
Non-consolidated JV's 552 483 (12%) 552 483 (12%)0 0
Continental Europe 4,109 4,122 0% 1,048 1,307 25% 5,157 5,429 5%
Consolidated entities 2,013 1,903 (5%) 512 740 44% 2,526 2,643 5%
Portugal 51% - 100% 1,533 1,497 (2%) 293 513 75% 1,826 2,010 10%
France 100% 480 406 (15%) 480 406 (15%)
Italy 50% 219 227 3% 219 227 3%
Non-consolidated JV's 2,096 2,219 6% 536 567 6% 2,632 2,786 6%
Turkey 36% 536 567 6% 536 567 6%
Luxembourg 33% 2,096 2,219 6% 2,096 2,219 6%
Asia 15,585 17,064 9% 913 893 (2%) 16,498 17,957 9%
Consolidated entities 100% 557 183 (67%) 557 183 (67%)
Non-consolidated JV's 15,028 16,881 12% 913 893 (2%) 15,941 17,774 11%
Malaysia 31% 571 587 3% 615 575 (7%) 1,186 1,162 (2%)
Thailand 31%-15% 2,311 2,485 8% 298 318 7% 2,609 2,803 7%
China 25% 11,966 13,611 14% 11,966 13,611 14%
Philippines 50% 0 5 0 5 Vietnam 32% 0 0 0 0 India 26% 180 193 7% 180 193 7%
Insurance Ageas 23,493 25,368 8% 6,299 6,286 (0%) 29,792 31,654 6%#DIV/0! ###### ######
Consolidated entities 6,369 6,269 (2%) 4,298 4,342 1% 10,667 10,611 (1%)
Non-consolidated JV's 17,124 19,100 12% 2,001 1,943 (3%) 19,125 21,043 10%
Reinsurance 0 41 0 41
Life Non-Life Total

Inflows @ Ageas’s partStrong growth in Asian JV’s & Guaranteed Life in Belgium
In EUR mio
23Periodic financial Information I FY 16 results I 15 February 2017
2,849 3,137 1,961 1,953
4,474 4,574
9,283 9,663
0
1,410 1,412
2,181 1,962
596 831
235 225
4,422 4,430
7%
(10%)
9%
2%
3%
4,259 4,549
2,556 2,783
4,708 4,799
13,705 14,093
0 41
FY 15 FY 16 FY 15 FY 16 FY 15 FY 16 FY 15 FY 16 FY 15 FY 16 FY 15 FY 16
Up 7% @ constant FX
UK up 2% @ constant FX - Asia: up 7% @ constant FX
Belgium: sales Savings products up in H1 – growth stopped in Q4
CEU: Ageas Seguros contributing
EUR 89 mio in Life / EUR 191 mio in Non-Life
Non-Life
Life
Belgium UK CEU Asia Insurance Reins.

Insurance net resultHit by one-off charges in UK
24Periodic financial Information I FY 16 results I 15 February 2017
BE: Solid Life & Non-Life performance - net cap gains up EUR 10 mio, mainly RE – EUR 47 mio negative from terrorism & weather
UK: EUR 113 mio one-off charges for restructuring & reserves strengthening
CEU: Good operating performance - transformation plan Seguros on track
Asia: Improved performance mainly in China & Thailand - Hong Kong& equity impairments vs. exceptional investment result in 2015
Non-Life
Life
Belgium UK CEU Asia Reins. Insurance
In EUR mio
281 288
33 49
259
367
573
704 103 102
3741
13
27
182
118
384 391
30 (56)
70 90
272
394
0 3
755
821
FY 15 FY 16 FY 15 FY 16 FY 15 FY 16 FY 15 FY 16 FY 15 FY 16 FY 15 FY 16

25Periodic financial Information I FY 16 results I 15 February 2017
Insurance Combined ratio Combined ratio hit by terrorism, weather & reserves strengthening in UK
Combined ratio
Brussels terrorism events impacting for 0.9 pp -
mainly in Other lines and Accident & Health
Weather events in Belgium & UK increasing COR
with 1.7 pp (vs. 1.8 pp in 2015)
Provision strengthening for Special Risks & Ogden
in UK impacting for 2.3 pp
Q4 Combined ratio
Increase on one-off charges in UK (8.2 pp)
somewhat mitigated by excellent combined ratio in
BE (92.8%) & CEU (83.7%)
Claims ratio
CY claims ratio at 69.4% (vs. 68.1%) – 3.9 pp
impact from exceptional items
PY claims ratio flattening out over the year – 1 pp
impact Ogden
Expense ratio
Down on commissions in UK
Net earned premium (In EUR mio)
In % Net earned premium
73.2 69.0 68.1 64.3 64.4 62.2 64.6 68.2 69.4
32.831.1 31.0 34.0 35.2
34.7 34.133.9 34.3
106.0100.1 99.1 98.3 99.6
96.9 98.7102.1 103.7
(3.7) (3.5) (3.1) (3.8) (4.0) (5.9) (4.8) (3.5)(0.8)
2010 2011 2012 2013 2014 2015 2016 Q4 15 Q4 16
claims ratio expense ratio PY claims ratio
2,858 3,507 4,178 3,749 3,843 4,038 4,112 1,027 1,034

42.9
67.2 66.5 62.471.2
57.9 60.4
41.2
44.8 44.9 45.5
50.6
46.4 44.4
84.1
112.0 111.4 107.9
121.8
104.3 104.8
2010 2011 2012 2013 2014 2015 2016
75.061.9 55.6 51.5 51.5 50.4 50.5
43.2
41.541.6 44.0 44.6 41.6 42.7
118.2
103.497.2 95.5 96.1 92.0 93.2
2010 2011 2012 2013 2014 2015 2016
74.3 71.9 70.5 70.0 67.3 65.4 67.5
24.8 25.0 25.5 25.6 27.0 28.3 27.2
99.1 96.9 96.0 95.6 94.3 93.7 94.7
2010 2011 2012 2013 2014 2015 2016
78.4 72.0 73.6 69.8 69.6 69.1 72.6
29.025.3 25.4 29.3 29.7 30.5 29.8
107.497.3 99.0 99.1 99.3 99.6 102.4
2010 2011 2012 2013 2014 2015 2016
Insurance Combined ratio per product lineExceptional items impacting COR
26Periodic financial Information I FY 16 results I 15 February 2017
NEP 714 736 763 813 813 811 838 NEP 1,134 1,571 2,058 1,557 1,616 1,724 1,790
NEP 750 892 1,007 986 1,029 1,078 1,067 NEP 261 308 349 394 385 424 418
Motor: improvement in CEU – 3.0 pp Ogden in UKAccident & Health: 2.0 pp terrorism (Worker’s Comp.)
Other: 4.0 pp terrorism BE & 9.4 pp impact UKHousehold: 6.8 pp impact weather events in BE & UK
In bps Avg techn. liabilities
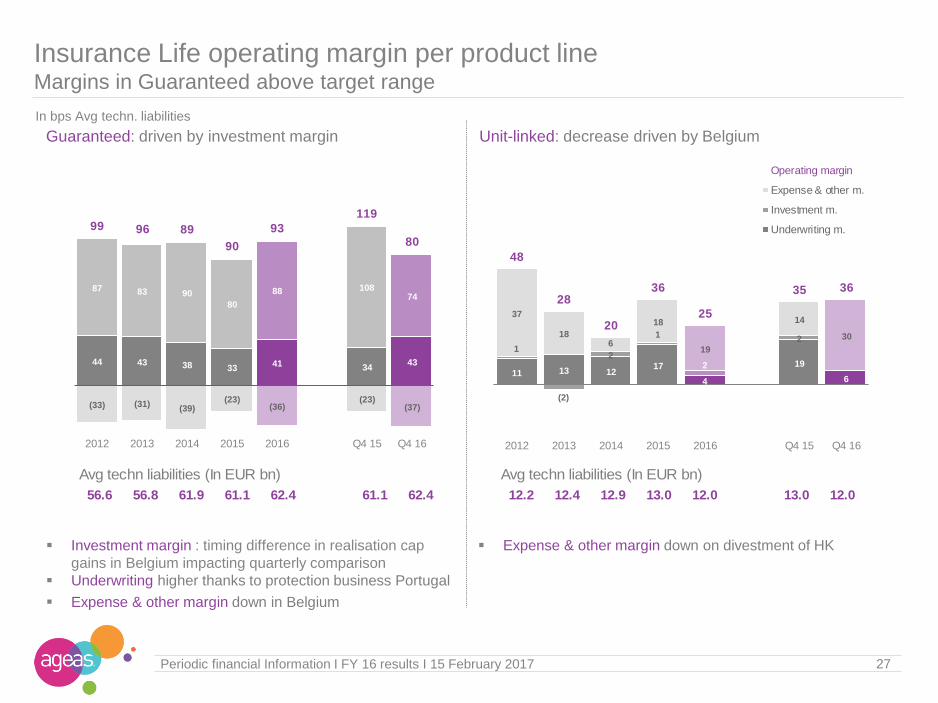
Insurance Life operating margin per product lineMargins in Guaranteed above target range
Guaranteed: driven by investment margin Unit-linked: decrease driven by Belgium
Expense & other margin down on divestment of HK Investment margin : timing difference in realisation cap
gains in Belgium impacting quarterly comparison
Underwriting higher thanks to protection business Portugal
Expense & other margin down in Belgium
27Periodic financial Information I FY 16 results I 15 February 2017
Avg techn liabilities (In EUR bn)
56.6 56.8 61.9 61.1 62.4 61.1 62.4
Avg techn liabilities (In EUR bn)
12.2 12.4 12.9 13.0 12.0 13.0 12.0
44 43 38 3341 34
43
87 83 90
80
88 10874
(33) (31)(39)
(23)(36)
(23)(37)
99 96 89
90
93
119
80
2012 2013 2014 2015 2016 Q4 15 Q4 16
11 13 1217
4
19
6
1
(2)
2
1
2
2
37
186
18
19
14
30
48
28
20
36
25
35 36
2012 2013 2014 2015 2016 Q4 15 Q4 16
Operating margin
Expense & other m.
Investment m.
Underwriting m.

3.8 4.2
1.91.9
5.76.1
FY 15 FY 16
Life Non-Life
9955
21
26
120
82
Q4 15 Q4 16
In bps avg technical liabilities In bps avg technical liabilitiesIn % NEP
28Periodic financial Information I FY 16 results I 15 February 2017
In EUR mio In EUR bn In EUR bn
281 288
103 102
384 391
FY 15 FY 16
Life Non-Life
1.1 1.0
0.4 0.4
1.5 1.5
Q4 15 Q4 16
56.3 59.8 59.0
FY 15 9M 16 FY 16
86 86
FY 15 FY 16
94.7 96.0
FY 15 FY 16
96.2 92.8
Q4 15 Q4 16
27
64
Q4 15 Q4 16
32 31
FY 15 FY 16
131
70
Q4 15 Q4 16
Belgium : HeadlinesNet profit up despite adverse impact terrorism & weather events
Net result slightly up - Q4 lower on less realised capital gains
Inflows: growth driven by Life short term investment products - levelled off in Q4
Life Technical liabilities up 5%
Non-Life combined ratio 93.9% when excluding terrorism - excellent in Q4
Operating margin Guaranteed: cap gains spread differently over quarters
Operating margin Unit-Linked almost stable

491 479
576 578
625 633
189 194
1,881 1,883
FY 15 FY 16
3,3083,779
491
404
+10%
3,7994,182
FY 15 FY 16
Life In EUR mio
Non-Life In EUR mio
29Periodic financial Information I FY 16 results I 15 February 2017
Unit-Linked
Guaranteed
Other
Household
Accident & Health
Motor
Belgium: Inflows@ 100%Guaranteed Individual Life: Strong growth driven by Life investment products
Guaranteed
Strong growth (+14%) attributable to short term investment products
thanks to attractive guarantee in comparison with alternative savings
products available in the market & despite three consecutive lowering
of guaranteed rate (1% 0.75% 0.50% 0.25 – last lowering as
from 1 November 2017))
Growth slowed down in Q4
Group Life Inflows remained stable at EUR 1.1 billion
Unit-linked
Further decrease in Individual Unit-linked (-18%) due to a lower
appetite for open funds
Technical liabilities
Up 5% vs. FY 15 to EUR 59.0 bn mainly as a consequence of lower
interest rates compared to last year
Up 2.4% when excluding shadow accounting
Household, Motor, Other stable
Accident & Health
Pruning actions in Workers’ Compensation drive inflows slightly lower

30Periodic financial Information I FY 16 results I 15 February 2017
Net earned premium (in EUR mio)
In % Net earned premium
Belgium: Combined ratio Solid operating performance with excellent Q4 combined ratio at 92.8%
Combined ratio
Impacted by
terrorism events of 22 March 2016 (2.1 pp)
adverse weather events (3.2 pp)
Q4 Combined ratio
Excellent ratio driven by solid performance of several
product lines
Claims ratio
CY ratio (66.5% vs. 64.1%) - strongly impacted by
terrorism & adverse weather events. Barring this
impact, CY claims ratio would be lower than last year
@ 61.2%.
PY ratio: in line with last year after several years of
improving reserving adequacy– high level of H1 PY
flattened over the year
Expense ratio flat
68.7 64.3 62.7 63.2 63.556.9 58.3 58.0 56.2
36.436.8 36.8 36.7 37.7
37.8 37.7 38.236.6
105.1101.1 99.5 99.9 101.2
94.7 96.0 96.292.8
(6.6) (7.3) (4.5) (3.6) (3.4)(7.2) (8.2)
(2.8)(5.7)
2010 2011 2012 2013 2014 2015 2016 Q4 15 Q4 16
claims ratio expense ratio PY claims ratio
1,541 1,601 1,698 1,785 1,815 1,832 1,836 459 462

31Periodic financial Information I FY 16 results I 15 February 2017
Belgium: Combined ratio per product lineStrong impact of the terrorism & adverse weather events
Accident & Health: strong result, despite impact terrorism
(3.5 pp - mostly in Workers’ Comp.)
Motor: somewhat higher frequency & average claims cost
Household: 9.9 pp impact terrorism & weather – good Q4 Other: 8.8 pp terrorism impact - mostly on TPL
75.8 73.8 73.0 73.7 70.1 70.4 70.0
21.9 23.8 24.0 23.8 25.4 27.6 27.6
97.7 97.6 97.0 97.5 95.5 98.0 97.6
2010 2011 2012 2013 2014 2015 2016
NEP 451 451 480 507 504 484 472 NEP 498 525 540 552 562 568 570
71.058.9 64.7 64.7 62.6 56.2 59.7
35.7
35.335.8 36.3 37.2
36.4 36.4
106.7
94.2100.5 101.0 99.8
92.6 96.1
2010 2011 2012 2013 2014 2015 2016
NEP 463 484 530 564 579 595 605
75.663.0
50.5 51.4 51.7 43.9 47.8
47.1
46.9
46.2 45.6 45.745.2 44.8
122.7
109.9
96.7 97.0 97.489.1 92.6
2010 2011 2012 2013 2014 2015 2016
10.4
58.2 65.9 66.187.5
65.8 58.350.9
49.548.1 47.2
47.6
45.044.6
61.3
107.7114.0 113.3
135.1
110.8102.9
2010 2011 2012 2013 2014 2015 2016
NEP 129 142 149 162 170 185 190

32Periodic financial Information I FY 16 results I 15 February 2017
Belgium Life operating margin per product line
Guaranteed: operating margin reaching target
Operating result at EUR 418 mio, up from EUR 413 mio
Investment margin higher cap gains in RE, especially in H1
Sum of underwriting and expense & other margin relatively
stable
Unit-linked: stable
Operating result down from EUR 20 mio to EUR 19 mio –
Q4 driven by improving risk & expense result
In bps Avg techn. liabilities
4 4
(2)
1 0 0 17
4438
32 31 3124
47
4741
30 32 31
27
64
2012 2013 2014 2015 2016 Q4 15 Q4 16
Operating margin
Investment m.
Expense & other m.
Underwriting m.
32 32 30 25 29
3
30
93 88 9588
91127 72
(29) (31) (38)(27) (34)
(21)(32)
96 89 8786
86131
70
2012 2013 2014 2015 2016 Q4 15 Q4 16
Avg techn liabilities (In EUR bn)
5.3 5.5 5.8 6.0 6.1 6.0 6.1
Avg techn liabilities (In EUR bn)
47.4 47.6 51.8 50.3 52.9 50.3 52.9

33
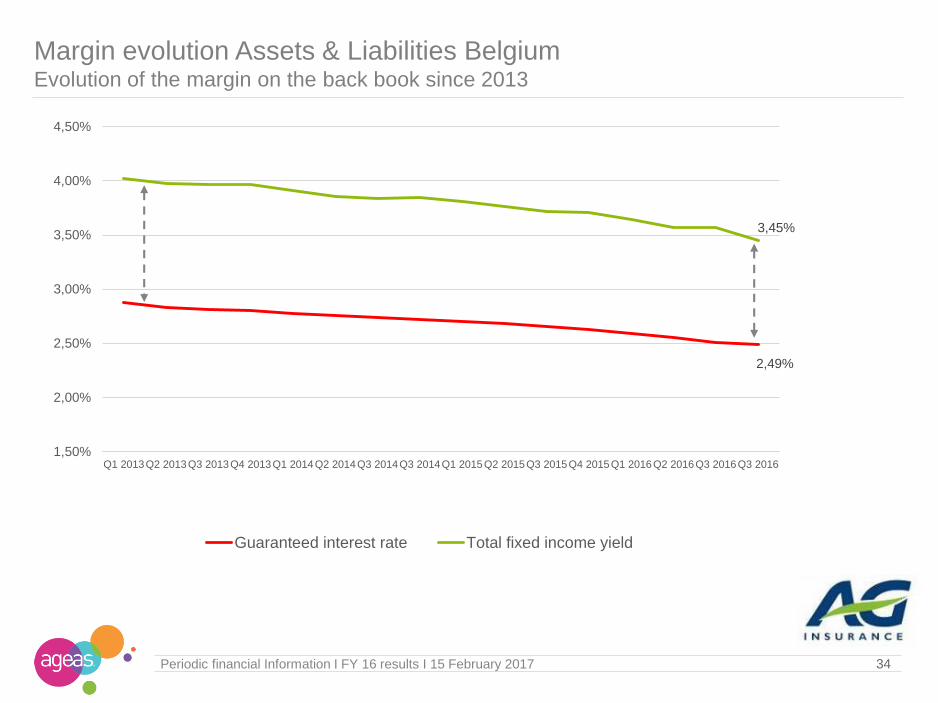
Margin evolution Assets & Liabilities BelgiumYield & guaranteed rate on back book down at the same pace
Life
Back book
FY 13 FY 14 FY 15 FY 16
Guaranteed interest rate 2.80% 2.71% 2.63% 2.49%
Fixed income yield 3.97% 3.84% 3.71% 3.45%*
Liabilities Guaranteed(EUR bn) 47.6 51.8 50.3 52.9
FY 14 FY 15 FY 16
Fixed income yield 2.89% 2.11% 1.71%
Reinvested amount (EUR bn) 4.6 4.2 4.5
New money
Life & Non-Life
Periodic financial Information I FY 16 results I 15 February 2017
* Total fixed income yield figure are as at end of August 2016
Newly invested money mostly corporate bonds, government related loans, mortgages &
infrastructure loans
>95% investment grade quality
Guaranteed retail Life:
Yield lowered from 1% to 0.75% as from 1 April 2016
Yield lowered to 0.5% as from 1 August 2016
Yield further lowered to 0.25% as from 1 November 2016
34
Margin evolution Assets & Liabilities BelgiumEvolution of the margin on the back book since 2013
Periodic financial Information I FY 16 results I 15 February 2017
2,49%
3,45%
1,50%
2,00%
2,50%
3,00%
3,50%
4,00%
4,50%
Q1 2013Q2 2013Q3 2013Q4 2013Q1 2014Q2 2014Q3 2014Q3 2014Q1 2015Q2 2015Q3 2015Q4 2015Q1 2016Q2 2016Q3 2016Q3 2016
Guaranteed interest rate Total fixed income yield

102.1 106.0
FY 15 FY 16
In EUR mio
35Periodic financial Information I FY 16 results I 15 February 2017
In % of NEPIn EUR bn
* incl. non-consolidated partnerships @ 100%
30
(56)
FY 15 FY 16
(35)
(110)
Q4 15 Q4 16
112.9
126.3
Q4 15 Q4 16
2.5 2.2
FY 15 FY 16
0.60.5
Q4 15 Q4 16
United Kingdom: HeadlinesNet profit impacted by exceptional items combined
Net result impacted by exceptional items (EUR 113 mio)
Inflows* up 1% at constant FX driven predominantly by renewals in Motor
Non-Life combined ratio impacted byexceptional items (6.6 pp)
Estimated additional impact
Ogden rate review on net resultIn EUR mio
Closure of the Glasgow office EUR 27 mio provision for costs
related to ending of lease, redundancy & retention
Special Risks EUR 31 mio
underwriting deterioration & prudent reserving
contract terminated early 2016
Ogden rate review EUR 55 mio reserves strengthening in anticipation
current discount rate from 2.5% to 1%
Exceptional
itemsmainly in Q4
48
112
0.0% (1.0%)

36Periodic financial Information I FY 16 results I 15 February 2017
* incl. non-consolidated partnerships @ 100%
Non-LifeIn EUR mio
Other
Household
Accident & Health
Motor
United Kingdom: Inflows@ 100%Inflows down 10%, impacted by adverse FX - up 1.2% at constant FX
Non-Life
Up 1.2% @ constant FX, with growth in all products except
Accident & Health
Motor up 4% @ constant FX driven by volume growth and
strong retention in H2’16 in a hardening market
Household up 4% @ constant FX as a result of the positive
impact of new deals announced earlier in the year
Other lines up 3% @ constant FX reflecting the contribution
of new commercial insurance schemes achieved this year
Accident & Health down 42% @ constant FX due to the loss
of 2 schemes71 37
1,6451,493
499
452
242
221
-10%2,457
2,203
FY 15 FY 16

37Periodic financial Information I FY 16 results I 15 February 2017
Net earned premium (In EUR mio)
Restatement for deconsolidation of Tesco Underwriting since 2013. 2015 figures restated for consolidation Non-Life & Other
In % Net earned premium
United Kingdom: Combined ratio COR impacted by reserves strengthening
Combined ratio
Impact adverse evolution Other lines (Special risks -
2.5 pp), Ogden impact (3.4 pp) & June weather (0.8
pp) vs. flood impact in 2015 (4.2 pp)
Combined ratio Tesco Underwriting 104.2% (vs.
104.4%) including 6 pp Ogden
Q4 Combined ratio
Q4’16 impacted by Special risks (8.2 pp), Ogden
reserving (14.1 pp) & higher average costs of large
Motor claims vs. Q4 ’15 hit by floods (16.6 pp) &
benefiting from very low quarterly expense ratio
Claims ratio
CY ratio (74.8% vs. 73.7%) – 4.0 pp impact
exceptional items
PY ratio: lower releases Other lines & Ogden in Motor
(2.6 pp)
Expense ratio
Expense ratio lower driven by efficiencies, reduced
marketing spend & 2016 bonus provision release
81.574.6 73.3
65.6 66.3 69.374.5
83.494.3
28.0
25.3 26.532.2 33.5
32.831.5
29.5
32.0109.5
99.9 99.8 97.8 99.8 102.1106.0
112.9
126.3
(1.1)0.1
(2.1) (4.0) (4.6) (4.4)(0.3)
(2.1)
11.0
2010 2011 2012 2013 2014 2015 2016 Q4 15 Q4 16
claims ratio expense ratio PY claims ratio
948 1,524 2,083 1,562 1,613 1,751 1,598 450 382

38Periodic financial Information I FY 16 results I 15 February 2017
Restatement for deconsolidation of Tesco Underwriting since 2013. 2015 figures restated for consolidation Non-Life & Other
United Kingdom: Combined ratio per product line
Accident & Health driven by lower volumes & higher CY Motor: Ogden provisioning 5.3 pp
Other: Special Risks deterioration & provisioning 21.1 pp
97.987.7
78.1 76.266.0
55.8 58.4
24.0
23.228.2 34.3
38.743.3 40.9
121.9110.9
106.3 110.5104.7
99.1 99.3
2010 2011 2012 2013 2014 2015 2016
82.9 79.2 77.2 71.9 74.6 75.8 81.2
23.319.5 21.3 25.0 25.1 27.2
25.6
106.298.7 98.5 96.9 99.7 103.0 106.8
2010 2011 2012 2013 2014 2015 2016
77.461.4 62.3
51.4 51.062.2 57.6
38.2
35.3 36.742.4 43.3
37.3 40.6
115.6
96.7 99.093.8 94.3
99.5 98.2
2010 2011 2012 2013 2014 2015 2016
75.1 71.6 67.7 59.8 56.0 55.373.7
30.4 39.3 42.144.4 54.3 48.6
44.9
105.5110.9 109.8
104.2110.3
103.9
118.6
2010 2011 2012 2013 2014 2015 2016
NEP 58 65 57 79 71 72 39 NEP 532 949 1,420 907 958 1,062 1,014
NEP 248 366 434 374 399 413 361 NEP 110 143 173 202 185 204 185
Household: Favourable weather vs. 2015, offset by escape of water & fire
Both Life & Non-Life results improving – very strong Q4In EUR mio In EUR bn
Excellent combined ratio - slightly up on shifting product mix
Inflows* up 5% on incl. Ageas Seguros& increased Non-Life importance
In EUR bn
Continental Europe: Headlines Strong full year & excellent fourth quarter
Operating margin Guaranteed up on higher investment & net U/W margin
39Periodic financial Information I FY 16 results I 15 February 2017
Life Technical liabilities up on inclusion Ageas Seguros
Operating margin Unit-Linked stable
In % NEP
* incl. non-consolidated partnerships @ 100%
3349
37
4170
90
FY 15 FY 16
Life Non-Life
3
164
15
7
30
Q4 15 Q4 16
4.1 4.1
1.0 1.3
5.2 5.4
FY 15 FY 16
Life Non-Life
1.0 1.0
0.3 0.4
1.31.4
Q4 15 Q4 16
14.6 15.5 15.5
18.8 19.6 20.0
33.435.1 35.5
FY 15 9M 16 FY 16
conso non-conso
85.488.7
FY 15 FY 16
83.5 83.7
Q4 15 Q4 16
88
121
FY 15 FY 16
50
136
Q4 15 Q4 16
7 7
FY 15 FY 16
10 8
Q4 15 Q4 16
In bps avg technical liabilities
In bps avg technical liabilities

2,085 2,282
2,024 1,840
+0%
4,109 4,122
FY 15 FY 16
348 417
289
473221
276191
141
+25%
1,048
1,307
FY 15 FY 16
Life In EUR mio
Non-Life In EUR mio
Continental Europe: Inflows @ 100%Higher sales in Non-Life & stable in Life
40Periodic financial Information I FY 16 results I 15 February 2017
Unit-Linked
Guaranteed
Other
Household
Accident & Health
Motor
* incl. non-consolidated partnerships @ 100%
Life
Inflows, including non-controlling interests @ 100% & Ageas Seguros,
remained stable
Consolidated inflows down 5%
Portugal: down 2% in a market decreasing by more than 25%. As
anticipated lower guaranteed sales due to continued low interest rate
environment, partially offset by a boost in Unit-Linked & inclusion of
Ageas Seguros (EUR 89 mio)
France: down 15% due to decision to sell less guaranteed business
& last year’s level of single premium being exceptionally high
Luxembourg: up 6% benefiting from strong sales to High-Net-Worth
customers
Technical liabilities
Consolidated at EUR 15.5 bn, up 6% - increase mainly related to
inclusion of Ageas Seguros
Including non-consolidated JVs @ 100%: at EUR 35.5 bn, up 6%
Non-Life
Inflows consolidated entities up 44% driven by an excellent performance
in Portugal strongly outperforming the market & inclusion of Ageas
Seguros (EUR 191 mio)
Turkey up 17% @ constant FX – strong growth in Motor (both Own
Damage & Third Partly Liability)

41Periodic financial Information I FY 16 results I 15 February 2017
Continental Europe: Combined ratio Excellent combined ratio well below group target
Net earned premium (In EUR mio)
* Scope: only consolidated companies
In % Net earned premium*
71.0 66.4 63.6 63.7 61.355.9 58.6
49.8 51.0
30.330.3
29.8 30.0 30.8
29.530.1
33.7 32.7
101.396.7
93.4 93.7 92.185.4
88.783.5 83.7
1.9(2.0) (2.5) (4.0) (4.3) (6.5) (6.5)
(12.1) (13.0)2010 2011 2012 2013 2014 2015 2016 Q4 15 Q4 16
claims ratio expense ratio PY claims ratio
Combined ratio
Reflecting continued excellent operating
performance with steady improvement in combined
ratio since 2010
Slight increase vs. 2015 due to inclusion Ageas
Seguros that is already showing an encouraging
improvement although still in the middle of a
transformation plan
Combined ratio Turkey at 98.1% (vs. 109.7%) with
results improving in all major product lines
Q4 combined ratio
Slight increase in claims ratio fully compensated by
lower expenses
Claims ratio
CY ratio at 65.1% (vs 62.4%) increase related to
Ageas Seguros
PY ratio stable
Expense ratio
Expense ratio increase in Italy related to business
development & inclusion of Ageas Seguros
369 382 397 403 415 454 664 118 189

Continental Europe: Combined ratio per product lineContinued good claims experience in all product lines
Motor: driven by positive run-off in ItalyAccident & Health: increase related to Workers’ Comp
Household: very strong ratio despite events in Portugal
(fire & storms)
Other: very good claims ratio partly thanks to higher run-off
42Periodic financial Information I FY 16 results I 15 February 2017
64.2 63.5 63.3 59.7 61.9 58.8 64.9
31.6 27.8 28.226.6 26.7 25.2
25.1
95.891.3 91.5
86.3 88.684.0
90.0
2010 2011 2012 2013 2014 2015 2016
90.571.8 69.8
79.360.1
71.5 65.5
27.0
29.2 28.129.2
31.6
32.332.5
117.5
101.0 97.9108.5
91.7
103.898.0
2010 2011 2012 2013 2014 2015 2016
53.5 53.7 51.8 53.5 54.036.1 42.3
27.7 34.2 33.538.8 40.3
35.938.0
81.287.9 85.3
92.3 94.3
72.080.3
2010 2011 2012 2013 2014 2015 2016
73.394.5
62.8 59.672.3
31.712.1
39.0
50.0
43.3 43.7
45.1
40.8
41.3
112.3
144.5
106.1
103.3117.4
72.5
53.4
2010 2011 2012 2013 2014 2015 2016
NEP 205 220 226 227 238 255 328 NEP 104 97 99 99 96 94 202
NEP 39 42 44 48 51 70 91 NEP 21 23 28 29 30 35 43

Continental Europe Life operating margin per product lineHigher in Guaranteed & stable in Unit-Linked
Guaranteed: increased due to higher investment & U/W
margin
Unit-linked: stable
43Periodic financial Information I FY 16 results I 15 February 2017
Expense & other margin remained stable compared to LY Investment margin increasing in both France & Portugal
Underwriting margin higher thanks to overall strong claims
performance in Portugal & inclusion of Ageas Seguros
Expenses & other margin improved due to higher technical
liabilities
In bps Avg techn. liabilities
118 106 95 100 110
10
118
6968 77 59
76
25
89
(85) (83)(102)
(71) (65) (77) (71)
10291 70
88
121
50
136
2012 2013 2014 2015 2016 Q4 15 Q4 16
2 11 2
3(5)
4151
94 5
5 12
1
(5)
1 22
1
44
47
107 7
108
2012 2013 2014 2015 2016 Q4 15 Q4 16
Operating margin
Investment m.
Expense & other m.
Underwriting m.
Avg techn liabilities (In EUR bn)
7.8 7.7 8.3 8.5 9.6 8.5 9.6
Avg techn liabilities (In EUR bn)
6.4 6.3 6.2 6.1 5.9 6.1 5.9

Net result incl. cap gain Hong Kong –Q4: EUR 52 mio lower cap gainsIn EUR mio In EUR bn
Non-Life combined ratio: driven by positive developments in Malaysia
Inflows* up 14% @ constant FX -strong growth in China & Thailand
Life Technical liabilities up 17% in JV’sIn EUR bn
Asia: Headlines Strong result driven by China & Thailand – supported by cap gain from divestment Hong Kong
44Periodic financial Information I FY 16 results I 15 February 2017
In EUR mio
Result non-conso: strong in Thailand, China & NL Malaysia – lower cap gains
In % NEP
* incl. non-consolidated partnerships @ 100%
199259
168
13
27
272
394
FY 15 FY 16
cap gain AICA Life Non-Life
15.6 17.1
0.90.9
16.5
18.0
FY 15 FY 16
Life Non-Life
3.4 3.5
0.2 0.2
3.6 3.7
Q4 15 Q4 16
45
10
6
6
51
17
Q4 15 Q4 16
3.2
42.3 46.8 49.5
45.5 46.849.5
FY 15 9M 16 FY 16
conso non-conso
235183
13
27
248
210
FY 15 FY 16
Life Non-Life
86.9 86.4
Q4 15 Q4 16
91.185.1
FY 15 FY 16
47
19
6
6
53
25
Q4 15 Q4 16

Life
Non-Life
Asia: Inflow @ 100%Strong growth in new business & renewals especially in China & Thailand
45Periodic financial Information I FY 16 results I 15 February 2017
15,26716,896
318
168
+9%
15,58517,064
FY 15 FY 16
420 410
108 108
96 106
289 269
-2%
913 893
FY 15 FY 16
Unit-Linked
Guaranteed
Other
Household
Accident & Health
Motor
In EUR mio
In EUR mio
Life
New business premiums up 16% @ constant FX with EUR 3.8 bn single
premium (+7%) & EUR 3.9 bn regular premium (+25%)
Renewal premiums up to EUR 9.5 bn (+15% @ constant FX) benefiting from
prior year strong sales & continued good persistency
China +20% @ constant FX - new business premium up 23% with successful
sales campaigns & increased number of agents (254K). Persistency ratio
remains strong.
Malaysia +9% @ constant FX – change in product mix towards regular premium
& good persistency has increased renewal – high sales of endowment products
Thailand +10% @ constant FX - good persistency resulted in higher renewal
India +12% @ constant FX - good performance in Banca regular premium –
positive impact of demonetization cannot be excluded
Philippines reported good progress in Mortgage Reducing Term Assurance
(MRTA) products
Hong Kong inflow until May 12th (closing of sale) amounted to EUR 183 mio
Vietnam: license obtained
Non-Life
Malaysia -1% @ constant FX - mainly impacted by slowdown economy
Thailand +10% @ constant FX - mainly driven by Motor & Personal Accident

Result Q4 lower on revaluation RPN(i)In EUR mio
Accounting value of remaining legacies
General Account: Headlines Impacted by cap gain on sale of Hong Kong, Fortis settlement & revaluation RPN(i) liability
46Periodic financial Information I FY 16 results I 15 February 2017
Total liquid assets up on sale HK –EUR 0.8 bn ring-fenced for settlement
In EUR mioImpact on P&L from RPN(i) Staff & Operating expenses up on one-
offs (legal settlement & HR related)
In EUR mio In EUR bn
In EUR mio
In EUR mio
Accounting value on AG Insurance put option: up driven by higher multiples
15
(694)
FY 15 FY 16
29
(8)
Q4 15 Q4 16
1.3
1.8 1.8
0.3
0.2 0.21.6
2.0 1.9
FY 15 9M 16 FY 16
net cash liquid assets
(402)(295) (275)
41 41 42
(133)
(1,019) (1,024)
FY 15 9M 16 FY 16
RPN(i) RPI Settlement
(1,064) (1,083)(1,266)
FY 15 9M 16 FY 16
1732
53
63
70
95
FY 15 FY 16
Staff & Intercompany Operating
4 9
15 14
1923
Q4 15 Q4 16
65 83
FY 15 FY 16
43
20
Q4 15 Q4 16

47Periodic financial Information I FY 16 results I 15 February 2017
Total liquid assets General AccountProceeds sale Hong Kong, SBB, legal settlement & investments in Europe & Asia
In EUR mio
Proceeds of sale Hong Kong activities received on 12/05/16
Upstream from operating companies compensate for dividend & holding costs
2015 Share buy-back completed dd. 05/08/16 – Another EUR 40 mio cash-out
related to 2016 SBB dd. 12/02/17
Cash-out in Asia & Europe related to various investments in developing business
EUR 0.8 bn ring-fenced for legal settlement
1,604 1,943
(339)
(244)
(250)(84)
(379)
(44) (110)
1,221
513
20
35
FY 15 sale HK Upstream Dividend Sharebuy-back
Legalsettlement
Asia Europe CASHES Regional& HQ
expenses
Other FY 16
EUR 0.8 bn ring-fenced
for legal settlement

48Periodic financial Information I FY 16 results I 15 February 2017
Main characteristics Hybrids Leverage optimized at holding level & at AG Insurance
In EUR mio Ageas
AgeasfinluxFresh
Ageas HybridFinancingHybrone
Fixed-to-Floating Rate
Callable
Fixed Rate Reset Perpetual
Subordinated Loans
Fixed Rate Reset Dated
Subordinated Notes
CASHES
% 3m EUR + 135 bps 5.125% 5.25% 6.75% 3.5% 3m EUR +200 bps
Amountoutstanding
1,250 95 450 550 USD 400 948
ISIN XS0147484074 XS0257650019 BE6261254013 BE6251340780 BE6277215545 BE0933899800
Call dateUndated,
strike 315.0 mandatory 472.5
Jun 16Step up to 3M
Euribor +200 bps
Jun 24Step up to 3M
Euribor +413 bps
Mar 19 Step up to 6yr USD
swap + 533 bps
June 2027Step up after 12 years of 100bps
Undated, strike 239.4,
mandatory 359.1
OtherOn lent to AG
Insurance
Subscribed byAgeas & BNP Paribas Fortis
Public issue Public issue
Coupon served by FBB, trigger ACSM
linked to Ageas dividend
Market Price (31/12/16)
48.58 114.73 106.00 96.92 66.40
Fortis Bank (now BNP PF)
AG Insurance (Belgium)
Called
20/06/16

Table of contents Slides used during analyst call 2
Segment information 18
Equity / Solvency 49
Investment portfolio 58
Legal Settlement 63
General Information 68

50Periodic financial Information I FY 16 results I 15 February 2017
Shareholders’ equity at EUR 9.7 bn - UG/L of EUR 12.03/shareDown on legal settlement, financial market, put option & return to shareholders
In EUR mio
7,0956,554
2,952
2,498
1,330
604
821
(694)(484)
(338) (244)(289)
(430)(57) (4)
EUR 53.59 EUR 47.03
11,376
9,656
FY 15 ResultInsurance
ResultGen Acc
ChangeUG/L
Dividend TreasuryShares
Reval AGput option
Forex IAS 19 Other FY 16
InsuranceUCG/L Insurance
UCG/L
Shareholders’
equity per
segment
Shareholders’
equity per share
FY 15 FY 16 FY 15 FY 16
Belgium 4,932 ► 4,683 Asia 3,009 ► 2,004
UK 1,129 ► 911 Reinsurance 104
Continental Europe 977 ► 1,350 Insurance 10,047 ► 9,052
General Account 1,330 ► 604

51
Tangible net equityHigh quality capital structure
10/03/2010 I page 51
EUR bn FY 15 FY 16
IFRS Shareholders' Equity 11.4 9.7
Unrealised gains real estate 0.5 0.5
Goodwill (0.8) (0.7)
VOBA (Value of Business Acquired) (0.3) (0.1)
DAC (Deferred Acquisition Cost) (0.9) (0.5)
Other (0.4) (0.4)
Goodwill, DAC, VOBA related to N-C interests 0.4 0.4
25% tax adjustment DAC, VOBA & Other 0.3 0.2
IFRS Tangible net equity 10.2 9.0
IFRS Tangible net equity/ IFRS Shareholder's Equity 90% 93%
Periodic financial Information I FY 16 results I 15 February 2017

2.9 2.8
0.8 0.7 0.7 0.90.3 0.0
(0.3) (0.3)
4.4 4.2
0.0 0.1
4.4 4.2
0.71.6
6.9 6.9
1.10.8 0.9 1.2
0.60.1 (1.5)(1.5)
8.07.6
1.4
0.7
9.4
8.3
1.8
4.3
FY 15 FY 16 FY 15 FY 16 FY 15 FY 16 FY 15 FY 16 FY 15 FY 16 FY 15 FY 16 FY 15 FY 16 FY 15 FY 16 FY 15 FY 16 FY 15 FY 16
Periodic financial Information I FY 16 results I 15 February 2017
Solvency IIageasImpact from exceptional items in UK compensated by Belgium & CEU
Solvency IIageas
in %
In EUR bn
Own Funds
SCR
Non EU
Non-controlled
participations*
52
Insurance ratio remains stable
Group ratio influenced by legal settlement & increasing put option liability
Expected dividend deducted
242% 244% 130% 120% 131% 127% 179% - - 278% 182% 182% 212% 195% 253% 264%
Belgium UK CEU Asia Reins. Diversification Insurance GA Group
Non-transferable
* Based on local solvency requirements

53
Ageas Group Solvency IIageasMain elements driving movement in Solvency ratio
Periodic financial Information I FY 16 results I 15 February 2017
Impact on
Solvency IIageas*
FY ’15 FY ’16
212% 195%
9M ’16 FY ’16
199% 195%
Model refinements
Mainly implementation internal model Real
Estate +13 pp +0 pp
Capital movements
Hong Kong , Portugal, investments in Asia,
SBB & Hybrone +9 pp -1 pp
UK exceptionals -3 pp -3 pp
Legal settlement -20 pp +0 pp
Expected dividend -10 pp -1 pp
Reval put option -5 pp -4 pp
Market movements & other -1 pp +5 pp
* Estimated impact of the movement, including secondary impact, diversification & non-transferable

54
Ageas Insurance Solvency sensitivitiesProviding more granularity on spread sensitivity to allow more accurate assessment
Periodic financial Information I FY 16 results I 15 February 2017
As per 31/12/’15Based on Solvency IIageas
SCR OF Solvency
Base caseBefore stress – excl. Hong Kong
4,132 7,494 181%
Yield curveDown 1% (floor 0%, UFR 4.2%)
4,539 7,337 162%
UFRDown to 3.7%
4,148 7,440 179%
EquityDown 30%
3,938 6,961 177%
PropertyDown 20%
3,946 7,013 178%
SpreadSpreads on corporate & government bonds up 50 bps
4,256 6,971 164%
Corporate spread*Spreads on corporate bonds up 50 bps
4,002 7,533 188%
Sovereign spread*Spread on government bonds up 50 bps
4,423 6,959 157%
* Corporate & Sovereign spread sensitivities based on detailed calculation of 100 bps movement impact – linear approach
leading to conservative estimation of impact

Periodic financial Information I FY 16 results I 15 February 2017
Insurance SCRageas per risk typeMarket risk main factor in SCR – Decrease of SCR related to Belgium & Hong Kong
Market risk down on implementation
internal model RE in pillar II – look
through on own funds & SCR
55
In EUR bn
( 1.6 ) ( 1.5 )
( 0.6 ) ( 0.5 )
( 1.1 ) ( 1.0 )
4.7 4.3
0.3 0.3
0.8 0.6
0.4 0.4
0.8 0.8
0.7 0.7
4.4 4.2
2015 2016
Non Diversifiable
Non-life UW
Health UW
Life UW
Counterparty Default
Market
Loss-Absorption Deferred Taxes
Loss-Absorption Techn. Liab.
Diversification
Diversification
Loss-Absorption Deferred Taxes
Life UW down on sale HK

Periodic financial Information I FY 16 results I 15 February 2017
Solvency PIM – as reported to the regulatorInsurance ratio down on market movements
Solvency II PIM
in %
In EUR bn
Own Funds
SCR
Non EU
Non-controlled
participations*
56
3.03.4
0.9 0.7 0.6 0.80.4 0.0 (0.3) (0.3)
4.5 4.6
0.0 0.1
4.6 4.6
0.71.6
6.9 6.8
1.10.8 0.9
1.7
0.60.1 (1.5)
(1.6)
8.17.7
1.4
0.5
9.4
8.2
1.8
4.3
FY 15 FY 16 FY 15 FY 16 FY 15 FY 16 FY 15 FY 16 FY 15 FY 16 FY 15 FY 16 FY 15 FY 16 FY 15 FY 16 FY 15 FY 16 FY 15 FY 16
234% 201% 124% 114% 148% 211% 158% - - 259% 178% 169% 206% 177% 253% 264%
Belgium UK CEU Asia Reins. Diversification Insurance GA Group
Non-transferable
BE: mainly yield impact increasing SCR – internal model RE not implemented in PIM UK: impact from Q4 negative exceptionals CEU: approval transitional measures in Portugal (Q3) & France (Q4)
* Based on local solvency requirements

Periodic financial Information I FY 16 results I 15 February 2017
Tiering of Group PIM own funds High quality of own funds
57
Tier 1:
Equity down on legal settlement,
return to shareholders & financial
markets
In EUR bn
6.9
5.8
1.8
1.4
0.5
0.9
0.2
0.1
9.4
8.2
FY 15 FY 16
Tier 3
Tier 2
Tier 1 restricted
Tier 1
Tier 1 restricted:
Hybrone repaid & limit to 20% of
total Tier 1
Tier 2 : up on overflow from Tier 1

Table of contents Slides used during analyst call 2
Segment information 18
Equity / Solvency 49
Investment portfolio 58
Legal Settlement 63
General Information 68

59Periodic financial Information I FY 16 results I 15 February 2017
In EUR bn
* All assets at fair value except the ‘Held to Maturity’ assets & loans which are valued at amortized costs
Asset mix
Changed scope with divestment Hong Kong (-EUR 2.4 bn) &
acquisition Ageas Seguros (+EUR 1.4 bn) in H1 16
Combined negative impact of scope change compensated by
increased market value bonds because of lower interest rates
Loans & equities increased at the expense of corporate bonds
Gross unrealized gains/losses on Available for Sale
Total portfolio: up to EUR 8.3 bn (vs. EUR 7.6 bn); up in fixed
income
Fixed income: at EUR 7.7 bn (vs. EUR 7.1 bn FY 15)
Sovereigns at EUR 5.8 bn (vs. EUR 5.5 bn)
Corporates at EUR 1.8 bn (vs. EUR 1.6 bn)
Equities: stable at EUR 0.6 bn
Gross UG/L on Real Estate: stable at EUR 1.5 bn - not
reflected in shareholders’ equity
EUR 2.4 bn unrealized gains/losses on Held to Maturity (vs. EUR 2 bn) - not reflected in shareholders’ equity
Investment portfolio Investment portfolio up on unrealized gains on bonds & investment in loans and equities
Sovereign bonds 36.4
Sovereign bonds 37.9
Corporate bonds 25.9
Corporate bonds 24.1
Structured0.2
Structured0.1
Loans7.3
Loans8.7
Equities 3.9Equities 4.4
Real Estate5.4
Real Estate5.3
Cash 2.4Cash 2.2
81.5 82.7
FY 15 FY 16

Increase driven by lower i-rates
Gross UG/L at EUR 5.8 bn (vs. EUR 5.5 bn)
94% investment grade; 86% rated A or higher
Belgium Duration gap close to zero – matched portfolio
Belgium18.2
Belgium19.0
France 6.0France 6.3
Austria 2.8Austria 2.9
Portugal 2.1Portugal 2.4Italy 1.6
Italy 1.5Spain, 0.8Spain, 1.5
Germany 1.3
Germany 1.2Ireland 0.7
Ireland 0.7Other 3.0Other 2.4
36.437.8
FY 15 FY 16
In EUR bn
Sovereign bond portfolio*
Sovereign & Corporate bond portfolioValue fixed income portfolio driven by evolution unrealized gains & divestment Hong Kong
60Periodic financial Information I FY 16 results I 15 February 2017
Gross UG/L at EUR 1.8 bn (vs. EUR 1.6 bn)
Decrease mainly due to divestment of Hong Kong with
investments predominantly in corporate bonds
Credit quality remains very good with 93% investment
grade; 58% rated A or higher
Corporate bond portfolio*
Banking 4.6 Banking 3.8
Other financials 1.7
Other financials 1.9
Non Financials
13.6
Non Financials
13.5
Government related 6.0
Government related 4.9
25.924.1
FY 15 FY 16
* All assets at fair value except the ‘Held to Maturity’ assets & loans which are valued at amortized costs
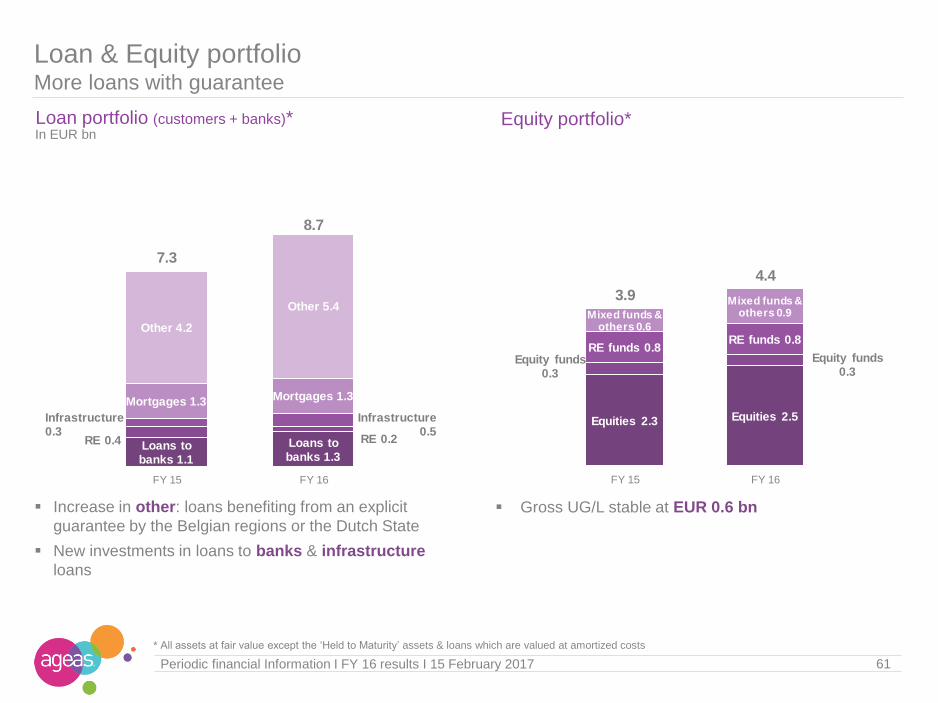
Loan portfolio (customers + banks)*
Loan & Equity portfolioMore loans with guarantee
Loans to banks 1.1
Loans to banks 1.3
RE 0.4 RE 0.2
Infrastructure0.3
Infrastructure0.5
Mortgages 1.3 Mortgages 1.3
Other 4.2
Other 5.4
7.3
8.7
FY 15 FY 16
Increase in other: loans benefiting from an explicit
guarantee by the Belgian regions or the Dutch State
New investments in loans to banks & infrastructure
loans
61Periodic financial Information I FY 16 results I 15 February 2017
Equity portfolio*
Gross UG/L stable at EUR 0.6 bn
Equities 2.3 Equities 2.5
Equity funds0.3
Equity funds0.3
RE funds 0.8RE funds 0.8
Mixed funds & others 0.6
Mixed funds & others 0.9
3.9
4.4
FY 15 FY 16
* All assets at fair value except the ‘Held to Maturity’ assets & loans which are valued at amortized costs
In EUR bn
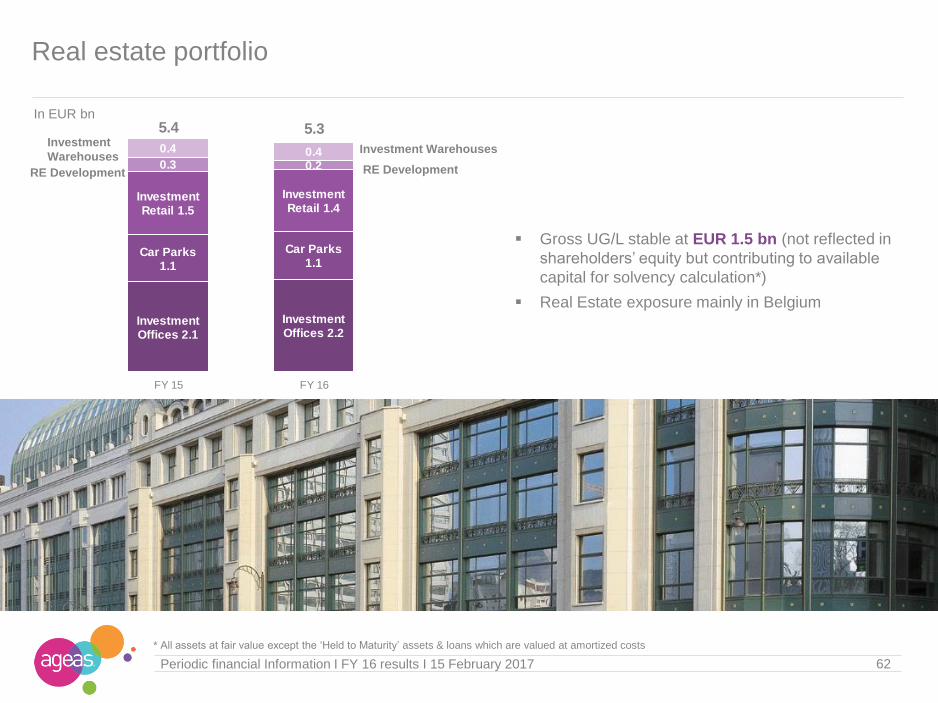
62Periodic financial Information I FY 16 results I 15 February 2017
Real estate portfolio
10/03/2010
Gross UG/L stable at EUR 1.5 bn (not reflected in
shareholders’ equity but contributing to available
capital for solvency calculation*)
Real Estate exposure mainly in BelgiumInvestment Offices 2.1
Investment Offices 2.2
Car Parks1.1
Car Parks1.1
Investment Retail 1.5
Investment Retail 1.4
0.3 0.2
0.4 0.4
5.4 5.3
FY 15 FY 16
Investment Warehouses
RE Development
Investment
Warehouses
RE Development
In EUR bn
* All assets at fair value except the ‘Held to Maturity’ assets & loans which are valued at amortized costs

Table of contents Slides used during analyst call 2
Segment information 18
Equity / Solvency 49
Investment portfolio 58
Legal Settlement 63
General Information 68

64Periodic financial Information I FY 16 results I 15 February 2017
Progress in solving legal legaciesSettlement between Ageas & claimants organisations
Ageas pays EUR 1,204 mio compensation - Cash impact of EUR 1,021 mio
P&L impact of EUR 889 mio in Q1 2016
No recognition of any wrongdoing by Ageas
Commitment by eligible shareholders to abandon any ongoing civil proceeding &
not to start any legal proceeding related to the events
Intervention of Amsterdam Court declaring settlement binding
First distribution of compensation not before 18 months after announcement
Filing done 23/05/2016
Additional support received since announcement
Hearing scheduled on 24/03/2017
First cash-out of EUR 250 mio over 2016
Judgment on binding character expected by mid 2017
More details on compensation per share & calculation aid available on
www.Forsettlement
Announcement
14/03/2016
Based on WCAM
Current status
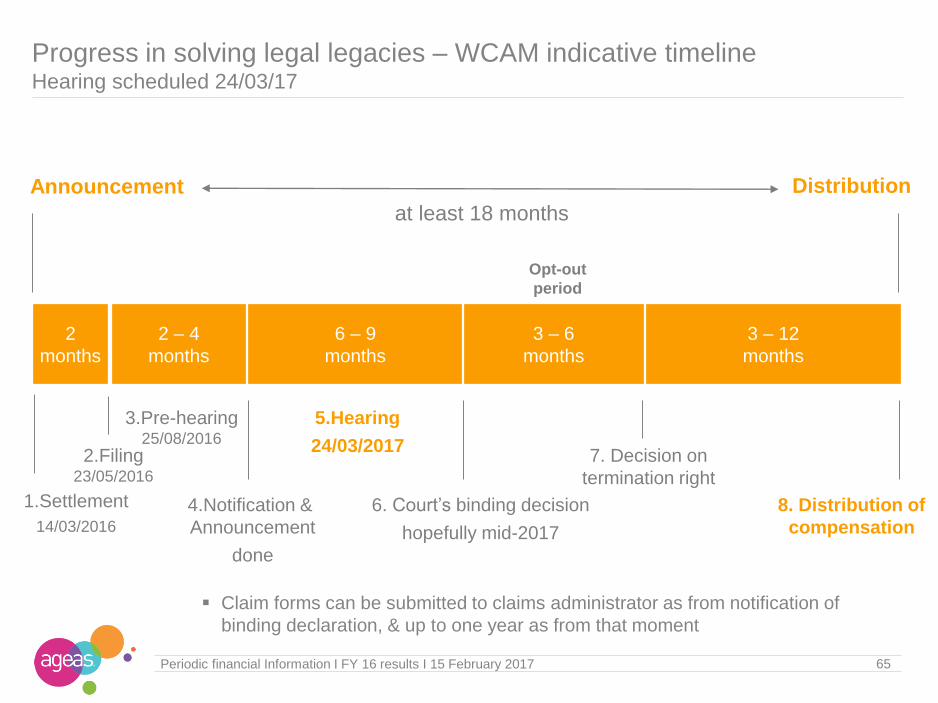
2 – 4
months
6 – 9
months
3 – 6
months
3 – 12
months
2.Filing 23/05/2016
4.Notification &
Announcement
done
3.Pre-hearing25/08/2016
5.Hearing
24/03/2017
6. Court’s binding decision
hopefully mid-2017
Opt-out
period
2
months
1.Settlement
14/03/2016
8. Distribution of
compensation
Announcement Distribution
65Periodic financial Information I FY 16 results I 15 February 2017
at least 18 months
7. Decision on
termination right
Progress in solving legal legacies – WCAM indicative timelineHearing scheduled 24/03/17
Claim forms can be submitted to claims administrator as from notification of
binding declaration, & up to one year as from that moment

66Periodic financial Information I FY 16 results I 15 February 2017
21 September 2007 7 November 2007 cob Communication on subprime exposure, organisation of capital increase for ABN AMRO
acquisition - period linked to AFM II fine
13 May 2008 25 June 2008 cob Communication on solvency after full integration of ABN AMRO – period linked to AFM I fine
29 September 2008 3 October 2008 cob Communication on the deal with the Benelux governments – period linked to FortisEffect case
The various litigation procedures
Main allegations
Judgments rendered so far
Open of
business
Close of
business
(cob) 28/02/07 14/10/08
21/09/07 07/11/07 13/05/08 25/06/08 29/09/08 03/10/081 2
3
4
5
6
7
8
Eligible period
3 reference
periods
Reference
periods
based on
Progress in solving legal legaciesPeriods involved
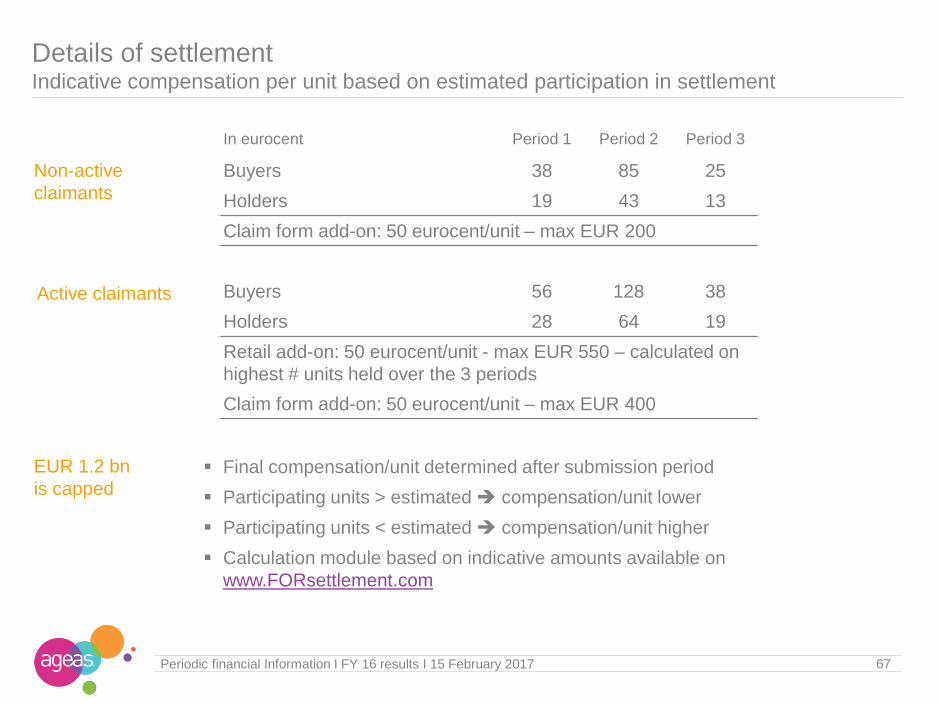
Final compensation/unit determined after submission period
Participating units > estimated compensation/unit lower
Participating units < estimated compensation/unit higher
Calculation module based on indicative amounts available on
www.FORsettlement.com
67Periodic financial Information I FY 16 results I 15 February 2017
Details of settlementIndicative compensation per unit based on estimated participation in settlement
In eurocent Period 1 Period 2 Period 3
Buyers 38 85 25
Holders 19 43 13
Claim form add-on: 50 eurocent/unit – max EUR 200
Buyers 56 128 38
Holders 28 64 19
Retail add-on: 50 eurocent/unit - max EUR 550 – calculated on
highest # units held over the 3 periods
Claim form add-on: 50 eurocent/unit – max EUR 400
Active claimants
Non-active
claimants
EUR 1.2 bn
is capped

Table of contents Slides used during analyst call 2
Segment information 18
Equity / Solvency 49
Investment portfolio 58
Legal Settlement 63
General Information 68

situation 31/12/2015 situation 31/12/2016 situation 11/02/2017
223,778,433 216,570,471 216,570,471
16,086,350 15,143,439 16,138,953
7,207,962 7,170,522 8,166,036
3,968,254 3,968,254 3,968,254
266,230 45,804 45,804
4,643,904 3,958,859 3,958,859
207,692,083 201,427,032 200,431,518
69Periodic financial Information I FY 16 results I 15 February 2017
Total number of outstanding shares7.2 mio shares cancelled in April – 8.1 mio shares bought back since
Total Issued Shares
Shares not entitled to dividend nore voting rights
1. TREASURY SHARES Share buy-back
FRESH
Other treasury shares
2. CASHES
Shares entitled to dividend & voting rights
CASHES deal
with BNP
SBB &
cancellation
cancellation

70Periodic financial Information I FY 16 results I 15 February 2017
Shareholders structureAgeas above 5% threshold following SBB
Based on number of shares as at 10 February 2016
Ageas5.6%
Ping An
BlackRock, Inc.
Schroders
Franklin Mutual Advisers Identified retail
investors19%
Identified institutional investors
47%Other
investors9%
Based upon press release 14 November 2016
Based upon the number of shares mentioned in the notification received 6 May 2013
Based upon the number of shares mentioned in the notification received 17 March 2014
Based upon the number of shares mentioned in the notification received 14 December 2015
Based upon the number of shares mentioned in the notification received 14 July 2015
Estimate by
Estimate by
Ageas
Ping An
BlackRock, Inc.
Schroders
Franklin Mutual Advisers
Identified retail investors
Identified institutional investors

71Periodic financial Information I FY 16 results I 15 February 2017
Financial calendar 2016 - 2017
15 February
FY 2016 results
10 May
3M 2017 results
17 May
Ordinary & Extraordinary
shareholders’ meeting Brussels
29 May
Ex-dividend date
7 April
Annual report 2016
31 May
Payment 2016 dividend
9 August
6M 2017 results
8 November
9M 2017 results
10 August
6M 2016 results
16 November
9M 2016 results
26 September
Investor Dinner
6 June
Investor Day

72Periodic financial Information I FY 16 results I 15 February 2017
RatingImproved rating for operating entities & holding
S&P MOODY'S FITCH
Operating AG Insurance (Belgium) A / stable A2 / stable* A+ / stable
entities Last change 06/11/15 17/03/16 09/12/16
unsollicited
Ageas Insurance Limited A / stable A+ / stable
Last change 06/11/15 23/11/16
Muang Thai Life BBB+ / stable A- / stable
Last change 29/12/10 27/07/16
Etiqa Insurance Berhad (Malaysia) BBB+ / stable
Last change 27/07/16
Intreas A / stable
Last change 11/11/16
Holding ageas SA/NV BBB / stable Baa3 / positive* A / stable
Last change 15/03/16 30/11/16 09/12/16
unsollicited
* Ageas has requested in early 2009 that this rating should be withdrawn. Ageas no longer participates in Moody's credit rating process.
Ageas does not provide, for purposes of Moody's rating, access to the books, records and other relevant internal documents of these rated entities.

73Periodic financial Information I FY 16 results I 15 February 2017
Certain of the statements contained herein are statements of
future expectations and other forward-looking statements that are based on management's current views and assumptions and involve
known and unknown risks and uncertainties that could cause actual results, performance or events to differ materially from those expressed
or implied in such statements. Future actual results, performance or events may differ materially from those in such statements due to,
without limitation, (i) general economic conditions, including in particular economic conditions in Ageas’s core markets, (ii) performance of
financial markets, (iii) the frequency and severity of insured loss events, (iv) mortality and morbidity levels and trends, (v) persistency levels,
(vi) interest rate levels, (vii) currency exchange rates, (viii) increasing levels of competition, (ix) changes in laws and regulations, including
monetary convergence and the Economic and Monetary Union, (x) changes in the policies of central banks and/or foreign governments and
(xi) general competitive factors, in each case on a global, regional and/or national basis. In addition, the financial information contained in
this presentation, including the pro forma information contained herein, is unaudited and is provided for illustrative purposes only. It does not
purport to be indicative of what the actual results of operations or financial condition of Ageas and its subsidiaries would have been had
these events occurred or transactions been consummated on or as of the dates indicated, nor does it purport to be indicative of the results of
operations or financial condition that may be achieved in the future.
Investor Relations
Tel:
E-mail:
Website:
+ 32 2 557 57 34
www.ageas.com