aged care in australia: past present and futurenatsem.canberra.edu.au/storage/brown - aged care -...
TRANSCRIPT

Aged Care in Australia: Past Present and Future
Ageing and Well-Being in Indonesia and Australia: Experiences of Two Neighbouring Countries
NATSEM Workshop Series
Laurie Brown, Binod Nepal and Linc Thurecht
11 September 2012
Overview
● Structural ageing of the population in Australia and the region
● Emergence of aged care in Australia
● Current models of aged care
● Projections of aged care need
2

Population ageing – a global phenomenon
3
Source: United Nations Word Population Prospect 2011 Revision

Asia is ageing
4
Source: United Nations World Population Prospect 2011 Revision

Australia is ageing
5
Source: United Nations World Population Prospect 2011 Revision

Share of older population aged 65+ different speeds of ageing
6
0%
5%
10%
15%
20%
25%
30%
35%
40%
195
0
195
5
196
0
196
5
197
0
197
5
198
0
198
5
199
0
199
5
200
0
200
5
201
0
201
5
202
0
202
5
203
0
203
5
204
0
204
5
205
0
Australia China India Indonesia Japan
Data source: United Nations World Population Prospect 2011 Revision

History of Australian Government support of
the aged
7
Health Community Services
Veterans Affairs
1921 Health
1939 Social Services
1972 Social Security
1984 Community Services
1987 Community Services &
Health
1991 Health, Housing &
Community Services
1993 Health, Housing, Local
Govt & Community
Services1994 Human Services & Health
1996 Health & Family Services
1998 Health & Ageing Family & Community Services
2001 Health & Aged Care
2004 Human Services
2006 Family, Community Services
& Indigenous Affairs
2008 Family, Housing,
Community Services &
Indigenous Affairs
COMMONWEALTH DEPARTMENTS
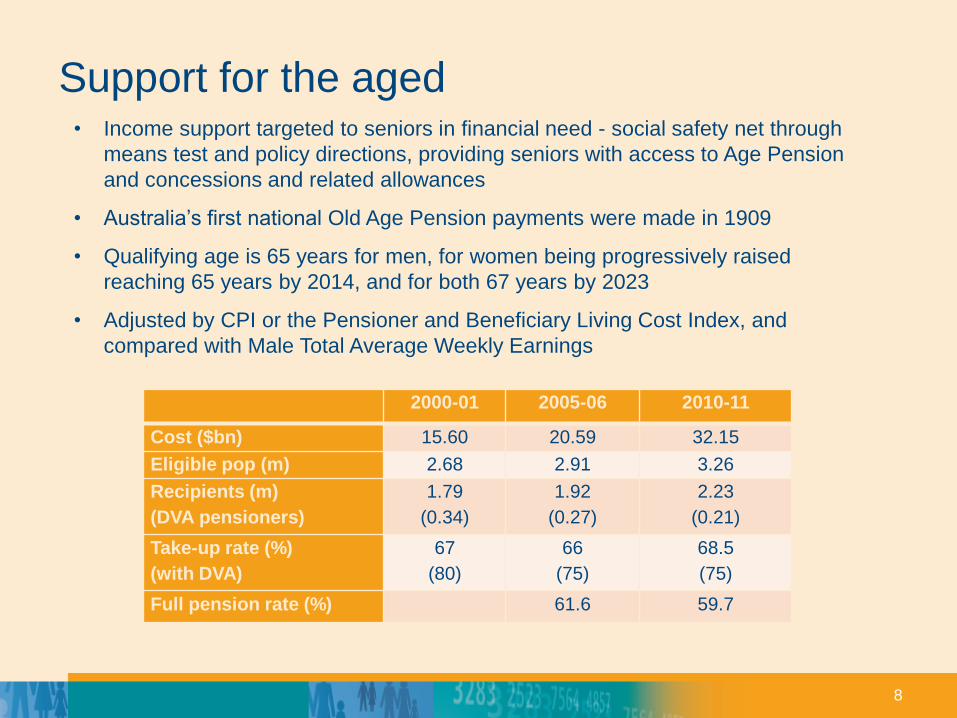
Support for the aged
8
2000-01 2005-06 2010-11
Cost ($bn) 15.60 20.59 32.15
Eligible pop (m) 2.68 2.91 3.26
Recipients (m)
(DVA pensioners)
1.79
(0.34)
1.92
(0.27)
2.23
(0.21)
Take-up rate (%)
(with DVA)
67
(80)
66
(75)
68.5
(75)
Full pension rate (%) 61.6 59.7
• Income support targeted to seniors in financial need - social safety net through
means test and policy directions, providing seniors with access to Age Pension
and concessions and related allowances
• Australia’s first national Old Age Pension payments were made in 1909
• Qualifying age is 65 years for men, for women being progressively raised
reaching 65 years by 2014, and for both 67 years by 2023
• Adjusted by CPI or the Pensioner and Beneficiary Living Cost Index, and
compared with Male Total Average Weekly Earnings

History of aged care
● Australia’s formal aged care system has evolved in an ad hoc way
● Australian Government involvement initially as a funder of maintenance
subsidies for pensioners in Benevolent Asylums (1909 to 1963) (payments
provided as a substitute for the Age Pension)
● As the costs of aged care outgrew the level of the age pension, the
Government became involved in funding aged care
● Involvement in the capital funding of aged care first occurred through a
housing initiative under the Aged Persons Homes Act 1954 and, in
funding care, the introduction of nursing home benefits in 1963
● Various reforms undertaken in the 1980s (home and community care) and
1990s (intensive care services at home and residential aged care)
● Reform ongoing reflecting Intersection of pension (income support),
housing and health care policies
● In 2010-11, total Commonwealth expenditure on the health and welfare
needs of older people = approx $60.2 billion (4.3% of GDP), with 53% of
spending on Age Pension and 19% on aged care
9
Current aged care system provides
● Assistance with everyday living activities:
● Cleaning, shopping, meals, transportation, social participation
● Help with personal care/self-care:
● Bathing, dressing, eating, toileting
● Health care:
● Medical, nursing, physiotherapy, dietetics, dentistry
● Accommodation
10
Aged care providers /settings
● Informal, unpaid:
● Partners, family, friends and neighbours
● Formal, government-subsidised aged care services:
● Community/home
– HACC/VHC (862,500 persons received HACC services in 2008-09)
– CACPs, EACH and EACHD
● Residential:
– Low level
– High level
● Respite support for carers
11

Prevalence of severe and profound disability,
Australia, 2003 and 2009
12
Data source: 2003 and 2009 SDACs
0%
10%
20%
30%
40%
50%
60%
70%
65-69 70-74 75-79 80-84 85+ 65-69 70-74 75-79 80-84 85+
Male Female
2009 2003
13
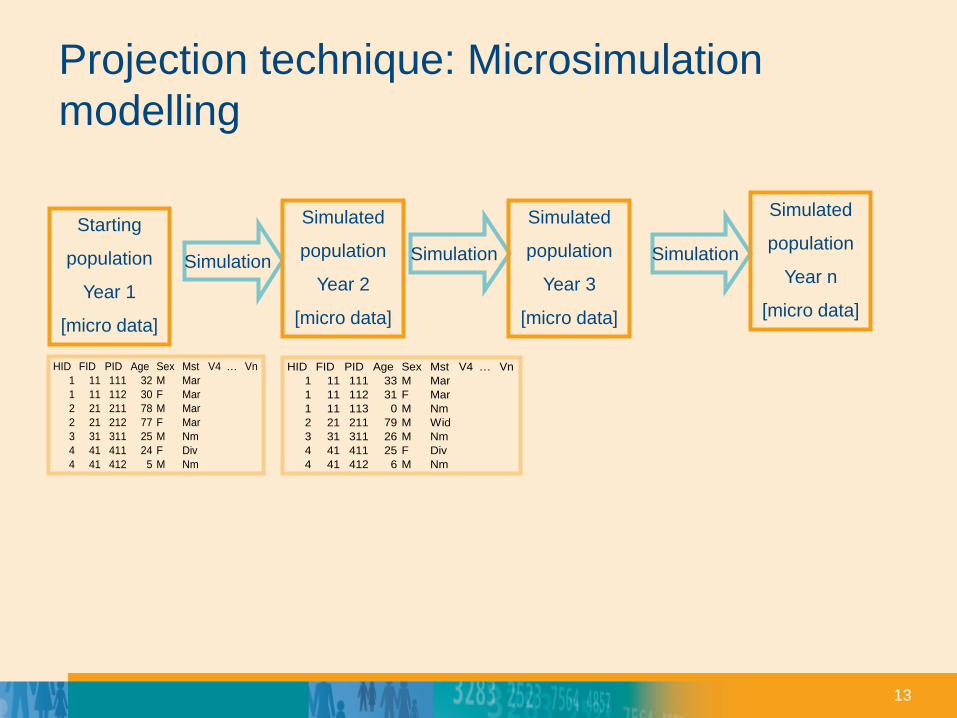
Projection technique: Microsimulation
modelling
Starting
population
Year 1
[micro data]
Simulation Simulation Simulation
Simulated
population
Year 2
[micro data]
Simulated
population
Year 3
[micro data]
Simulated
population
Year n
[micro data]
HID FID PID Age Sex Mst V4 … Vn
1 11 111 32 M Mar
1 11 112 30 F Mar
2 21 211 78 M Mar
2 21 212 77 F Mar
3 31 311 25 M Nm
4 41 411 24 F Div
4 41 412 5 M Nm
HID FID PID Age Sex Mst V4 … Vn
1 11 111 33 M Mar
1 11 112 31 F Mar
1 11 113 0 M Nm
2 21 211 79 M Wid
3 31 311 26 M Nm
4 41 411 25 F Div
4 41 412 6 M Nm

14
Labour Force
Household Assets & Debt
Earnings
Social Security and Taxation
Education & Training
Household formation & movement
Disability Aged Care
Other income
Housing
New Year
Demographics Health
APPSIM modules and processing cycle

Aged Care Module
15
Impute Disability
Status
NoYes
Yes
Is Assistance
Needed?
Person Enters
Aged Care Module
(Age 65+)
No
Seek Formal
Care? (Filter)
Community Care
Adequate?
Impute Whether
Informal Care Is
Being Received
HighHigh LowLow
Level of
Community Care
Needed?
Level of
Residential Care
Needed?
Available?Available?Available? Available?
Met
NeedUnmet
Need
Met
Need
Unmet
Need
Met
Need
Unmet
Need
Met
Need
Unmet
Need
Yes No YesYes No Yes No
Yes
No
No
This is
modified to
conduct policy
experiments

Projected share of older population and
dependency ratios
16
Potential support ratio = Number of people aged 15-64 per person aged 65+
Elderly dependency ratio = Number of people aged 65 per 100 working age people
Youth dependency ratio = Number of people aged 15-64 per 100 working age people
0
5
10
15
20
25
30
35
2006
2011
2016
2021
2026
2031
Elderly dependency Youth dependency Potential support ratio
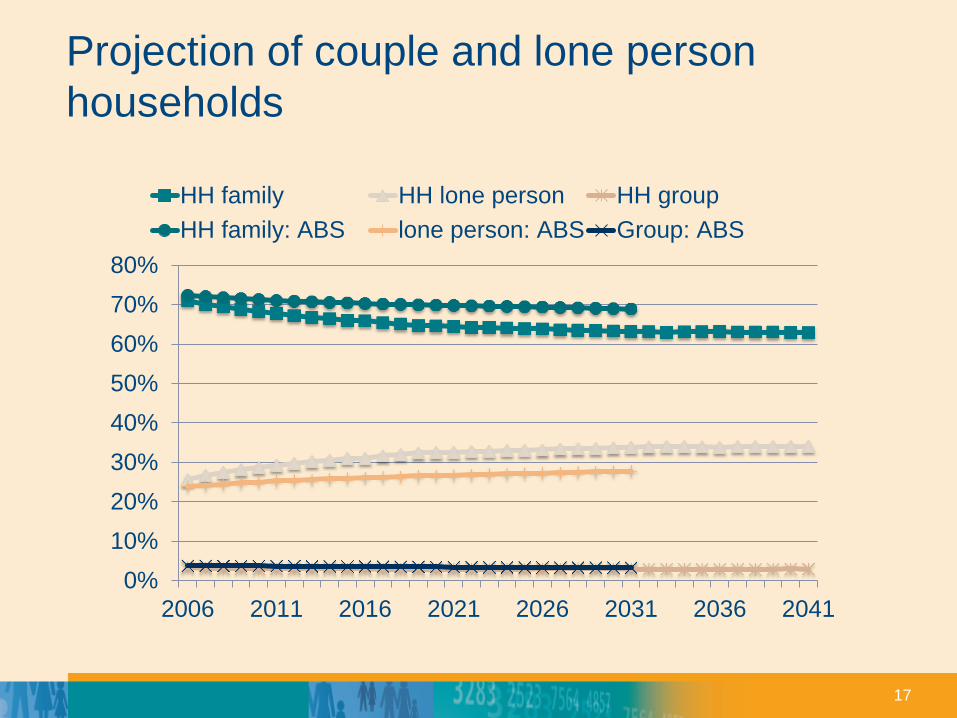
Projection of couple and lone person
households
17
0%
10%
20%
30%
40%
50%
60%
70%
80%
2006 2011 2016 2021 2026 2031 2036 2041
HH family HH lone person HH group
HH family: ABS lone person: ABS Group: ABS

Projection of lone persons 65+ by disability
level assuming 2009 prevalence continues
18
0
100,000
200,000
300,000
400,000
500,000
600,000
700,000
800,000
900,000
2006
2011
2016
2021
2026
2031
2036
2041
Mild
Moderate
Severe
Profound

Scenarios
● 2009 prevalence of severe and profound disability continues
● 1% annual decrease in severe and profound disability
● 2% annual decrease in severe and profound disability
Assumption about formal care need: it is assumed that persons with mild or
moderate disability who expressed need for assistance but receiving informal
care from spouse/partner would not see formal care
19
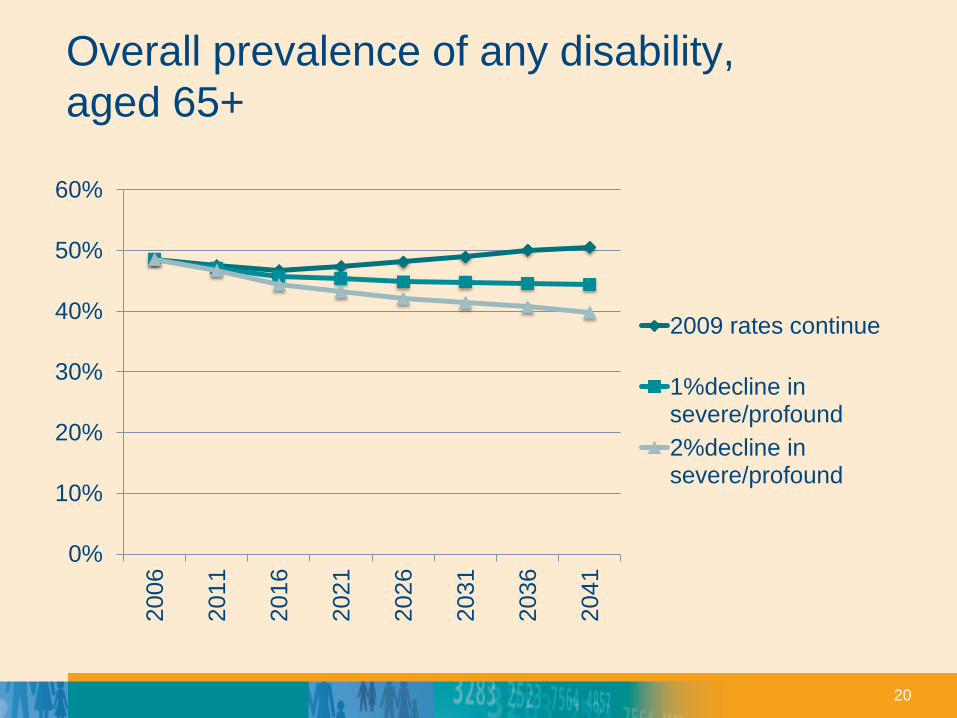
Overall prevalence of any disability,
aged 65+
20
0%
10%
20%
30%
40%
50%
60%
2006
2011
2016
2021
2026
20
31
2036
2041
2009 rates continue
1%decline insevere/profound
2%decline insevere/profound

Overall prevalence of severe/profound
disability, aged 65+
21
0%
5%
10%
15%
20%
25%
2006
2011
2016
20
21
2026
2031
2036
2041
2009 rates continue
1%decline insevere/profound
2%decline insevere/profound

Projected number of 65+ with a disability
22
0
500,000
1,000,000
1,500,000
2,000,000
2,500,000
3,000,000
3,500,000
4,000,000
2006
2011
2016
20
21
2026
2031
2036
2041
2009 rates continue
1%decline insevere/profound
2%decline insevere/profound

Projected number of 65+ with
severe/profound disability
23
0
200,000
400,000
600,000
800,000
1,000,000
1,200,000
1,400,000
1,600,000
2006
2011
2016
2021
2026
2031
2036
2041
2009 ratescontinue
1%decline insevere/profound
2%decline insevere/profound

Projected change in need for care, aged
65+, compared to the baseline
24
-30%
-25%
-20%
-15%
-10%
-5%
0%
2006 2011 2016 2021 2026 2031 2036 2041
1%decline insevere/profound
2%decline insevere/profound

Projected change in need for high care,
aged 65+, compared to the baseline
25
-50%
-45%
-40%
-35%
-30%
-25%
-20%
-15%
-10%
-5%
0%
2006 2011 2016 2021 2026 2031 2036 2041
1%decline insevere/profound
2%decline insevere/profound

Concluding remarks
● Aged care in Australia has undergone various transformations in response to changing demographic and economic circumstances
● Population ageing and rising number of lone persons mean an increasing need for aged care in the future
● Reducing severe forms of disability will substantially mitigate the need for aged care
● Supply side has not been considered in this presentation and so the issues of unmet need would require further analysis
26

Thank you Contact for further information: Binod Nepal ([email protected]) Tel: 02 6201 5922 Laurie Brown ([email protected]) Tel: 02 6201 2751
www.natsem.canberra.edu.au