ageing on commercial automotive catalysts, a structure ... · ageing on commercial automotive...
TRANSCRIPT

Nélida Sofia Tavares Furtado
Licenciatura em Ciências da Engenharia Química e Bioquímica
Ageing on commercial automotive catalysts, a structure reactivity study
Dissertação para obtenção do Grau de Mestre em Engenharia Química e Bioquímica
Orientador: Patrick da Costa, Professor, UPMC. Co-orientador: Mário Eusébio, Professor Auxiliar, FCT.
Júri:
Presidente: Professora Doutora Maria Dionísio Andrade
Arguente: Professora Doutora Isabel Fonseca
Vogal: Professor Doutor Mário Eusébio
Novembro 2014

Page II
Ageing on commercial automotive catalysts, a structure reactivity study
Ageing on commercial automotive catalysts, a structure reactivity study
Copyright © Nélida Sofia Tavares Furtado, Faculdade de Ciências e Tecnologia, Universidade
Nova de Lisboa.
A Faculdade de Ciências e Tecnologia e a Universidade Nova de Lisboa têm o direito, perpétuo
e sem limites geográficos, de arquivar e publicar esta dissertação através de exemplares
impressos reproduzidos em papel ou de forma digital, ou por qualquer outro meio conhecido ou
que venha a ser inventado, e de a divulgar através de repositórios científicos e de admitir a sua
cópia e distribuição com objectivos educacionais ou de investigação, não comerciais, desde
que seja dado crédito ao autor e editor.

Page III
Ageing on commercial automotive catalysts, a structure reactivity study
Dedico esta tese à minha família,
em especial às mulheres de força e coragem que a constituem,
aos meus amigos e a ti Milo.

Page IV
Ageing on commercial automotive catalysts, a structure reactivity study

Page V
Ageing on commercial automotive catalysts, a structure reactivity study
Abstract
Increasingly stringed regulations for diesel engine emissions have a significant impact on the
required efficiency of DOC. Lowered DOC oxidation efficiency due to thermal aging effects
influences the efficiency of the exhaust aftertreatment systems downstream of the DOC. In this
work carried out in the Jean Le Rond d’Alembert Institute the effect of hydrothermal aging on
the reactivity and structure of a commercial DOC was investigated. The characterization of the
catalytic performance was carried out on a synthetic gas bench using carrots catalyst under
conditions close to the realistic conditions i.e. using a synthetic gas mixture, representative of
the exhaust gases from diesel engines. Different structural characterization techniques were
performed: textural and morphological proprieties were analyzed by BET and TEM, the
characterization of the presented crystallographic phases was performed by DRX and the
determination of the number of reducible species was possible by TPR. TEM results shown, an
increase of the metal particle size with the aging caused by the agglomeration of metal
particles, revealing the presence of metal sintering. DRX results also suggest the presence of
support sintering. Furthermore, DRX and BET results unexpectedly reveal that the most drastic
aging conditions used actually activated the catalyst surface. As expected, the aging affected
negatively the catalyst performance on the oxidation of methane and CO, however an
improvement of the NO oxidation performance with the aging was observed. Nevertheless, for
the aging conditions used, catalytic activity results show that the influence of aging in DOC
performance was not significant, and therefore, more drastic aging conditions must be used.
Keywords: diesel exhaust oxidation catalyst; hydrothermal aging; synthetic gas bench;
structure characterization; methane oxidation

Page VI
Ageing on commercial automotive catalysts, a structure reactivity study

Page VII
Ageing on commercial automotive catalysts, a structure reactivity study
Resumo
Regulamentações cada vez mais rígidas para as emissões de motores a diesel tem um
impacto significativo na eficiência exigida ao DOC. A baixa eficiência de oxidação
do DOC devido ao envelhecimento térmico influencia a eficiência dos restantes componentes
do sistema de tratamento de gases à jusante do DOC. Neste trabalho, realizado no instituto
Jean Le Rond d’Alembert o efeito do envelhecimento hidrotérmico na reactividade e na
estrutura de um DOC comercial foi investigado. Os ensaios catalíticos foram efectuados num
banco de gás sintético utilizando condições próximas às condições reais, isto é, utilizando uma
mistura de gás sintético representativa dos gases à saída de um motor a diesel.
Diferentes técnicas de caracterização estrutural foram utilizadas: as propriedades texturais e
morfológicas foram analisadas por BET e TEM, a caracterização das
fases cristalográficas presentes foi efectuada através de DRX e a determinação do numero
de espécies reduzidas foi possível através de TPR. Os resultados do TEM mostram um
aumento no tamanho das partículas metálicas com o envelhecimento, ou seja, revelam a
presença de sinterização de partículas. Os resultados do TPR indicam ainda
a possível presença de sinterização do suporte. Ao contrário do esperado, os resultados
de DRX e BET revelaram que as condições de envelhecimento mais drásticas activaram
a superfície do catalisador. Como esperado, o envelhecimento afectou negativamente
a eficiência do catalisador na oxidação do CH4 e CO, enquanto, para o NO houve um aumento
da oxidação com o envelhecimento. Apesar disso, conclui-se que para as condições de
envelhecimento utilizadas a influência do envelhecimento na eficiência do catalisador foi pouco
significativa e, por conseguinte condições mais severas de envelhecimento deverão ser
utilizadas.
Palavras chave: DOC; envelhecimento hidrotérmico, banco de gás sintético, caracterização
estrutural; oxidação de metano.

Page VIII
Ageing on commercial automotive catalysts, a structure reactivity study

Page IX
Ageing on commercial automotive catalysts, a structure reactivity study
Index
Table of Contents
1. Chapter 1: Introduction and Objectives .............................................................................. 1
2. Chapter 2: Context of the bibliographic study ..................................................................... 5
2.1. Diesel exhaust emission ............................................................................................ 5
2.2. Pollutant formation and treatment .............................................................................. 6
2.3. Diesel oxidation catalysts ........................................................................................... 7
2.4. Catalyst Deactivation ............................................................................................... 10
2.5. Aging of catalysts..................................................................................................... 11
2.5.1. Thermal aging or Sintering ................................................................................... 12
2.6. Influence of different parameters on the light off (ignition) curves .............................. 14
2.6.1. Influence of the type of catalyst (Pd vs Pt:Pd catalyst) on the ignition curve of
propene ........................................................................................................................... 14
2.6.2. Influence of variation of the concentration of CO and NO in the ignition curve of
propene ........................................................................................................................... 15
2.6.3. Influence of variation of concentration of HC in the ignition curve of NO................ 17
2.7. Zone Coated Catalysts ............................................................................................ 18
3. Chapter 3: Materials and Experimental Methods .............................................................. 19
3.1. Catalyst Samples ..................................................................................................... 19
3.1.1. Hydrothermal aging procedure ............................................................................. 21
3.2. Catalytic activity studies: Synthetic gas bench (SGB carrots) .................................... 22
3.2.1. Briefly description of the procedure followed for the characterization of the catalyst
activity 28
3.3. Characterization of the catalyst ................................................................................ 29
4. Chapter 4: Results and Discussion .................................................................................. 33
4.1. Characterization of the catalyst ................................................................................ 33
4.1.1. Brunauer, Emett and Teller (BET) analysis ........................................................... 33
4.1.2. TEM analysis (Transmission Electronic Microscopy) ............................................ 34
4.1.3. DRX analysis (X-ray Diffraction) ........................................................................... 37
4.1.4. TPR analysis (Temperature programmed reduction) ............................................ 38
4.2. Catalytic activity essays ........................................................................................... 40
4.2.1. DOC performance on NO/CH4 oxidation ............................................................... 40
4.2.2. Effect of CO/CH4/NO on CH4/CO/NO oxidation over DOC .................................... 42
4.2.3. Effect of aging on CH4/NO/CO oxidation over DOC .............................................. 47
5. Chapter 5: Conclusions ................................................................................................... 49
6. Chapter 6: Perspectives .................................................................................................. 51
Bibliography ............................................................................................................................ 53

Page X
Ageing on commercial automotive catalysts, a structure reactivity study

Page XI
Ageing on commercial automotive catalysts, a structure reactivity study
Figures Index
Figure 1.1 - Development of the legally permitted emission of passager cars in EU a) For
gasoline engines b) For Diesel Engines ..................................................................................... 2
Figure 1.2 - Components of an abatement system. Reproduced from [8]. .................................. 3
Figure 2.1 - The structure of a monolithic exhaust gas catalyst. Reproduced from [1]................. 8
Figure 2.2 - Phase transformation and specific surface are of alumina. Reproduced from [20] . 12
Figure 2.3 - A model representing surface dehydroxylation from contact region of two adjacent
particles. Reproduced from [20]. .............................................................................................. 13
Figure 2.4- Typical ignition curves observed for the complete exhaust gas mixture over two
catalysts. a) Mono-metallic Pt catalyst: 500 ppm CO, 167 ppm H2, 500 ppm propene, 150 ppm
NO b) bi-metallic Pt:Pd catalyst: 500 ppm CO, 167 ppm H2 , 500 ppm propene, 600 ppm NO.
Reproduced from [23]. ............................................................................................................ 14
Figure 2.5- Effect of increasing the concentration of CO. Both experiments used 750 ppm
propene and 600 ppm NO, but the CO concentrations were 500(represented by symbols) and
2000 ppm (represented by lines). The dashed line is the CO conversion for the experiment with
2000 ppm CO. Reproduced from [23]. ..................................................................................... 15
Figure 2.6- Effect of increasing the concentration of NO. Both experiments used 250 ppm
propene and 500 ppm CO, but with NO concentrations of 150(represented by symbols) and 600
ppm (represented by lines). The higher NO concentration causes a sharper deviation with
concomitant flat area. Reproduced from [23] ........................................................................... 16
Figure 2.7- NO and propene oxidation conversion as a function of temperature and propene
concentration. The feed stream contained 200 ppm NO, 10% O2, 5%H2O and either 0,100,
200, 800 or 1000 ppm propene, and a balance of N2. Reproduced from [24]. .......................... 17
Figure 3.1- At left Diesel Particulate Filter (DPF) and at right Diesel Exhaust Catalyst (DOC) ... 19
Figure 3.2 - Catalyst samples. From left to the right: DOC 750ºC 4h, DOC 750ºC 10h, DOC
850ºC 4h and DOC 850ºC 10h ................................................................................................ 20
Figure 3.3- Synthetic gas bench, where the hydrothermal aging were conducted. At left
schematically representation of SGB. ...................................................................................... 21
Figure 3.4- Representation of the static aging used in this study. ............................................. 22
Figure 3.5- a) Stainless steel reactor and catalyst carrot b) Placement of the carrot catalyst
inside the reactor c) Placement of the reactor inside the oven. Note: To force the entire gas
mixture to pass through the catalyst, fiberglass insulation was used to cover the gap between
the outside of the catalyst and the walls of the reactor. ............................................................ 22
Figure 3.6- Temperature Program defined in the reactor (green) and in the preheater (blue). The
red “zone” corresponds to the saturation of the catalyst. .......................................................... 23
Figure 3.7- Scheme of the synthetic gas bench. 1) Serpentine heat exchanger (preheater); 2)
Oven in which the reactor is placed; 3) Eurotherm 2404/2408 PID controllers; 4) Refrigerating
circulation chiller 5) Volumetric flow controllers (Flowmeters) ................................................... 24
Figure 3.8- Simplified scheme of NOX detector ....................................................................... 25
Figure 3.9 - Simplified scheme of hydrocarbons detector ......................................................... 25
Figure 3.10- From left to the right Environment S.A. Analyzer Bench and Serv’ Instrumentation
Synthetic gas bench ................................................................................................................ 26

Page XII
Ageing on commercial automotive catalysts, a structure reactivity study
Figure 4.1- TEM images of the reference catalyst (750ºC_4h) and at upper right corner an EDS
analysis of the zone marked with a white circle. ....................................................................... 34
Figure 4.2- TEM images for reference and aged catalysts. Influence of aging on the surface of
the catalyst.............................................................................................................................. 36
Figure 4.3- Evolution of the particle distribution with the aging. ................................................ 36
Figure 4.4-X-ray diffractograms of the reference catalyst and aged catalysts. .......................... 37
Figure 4.5- H2-TPR profiles for the reference catalyst and aged catalysts. ............................... 38
Figure 4.7- Essay 1: Methane conversion as function of the catalyst inlet temperature. The feed
stream contained 600 ppmV CH4, 5%V CO2, 10%V O2 and N2 as balance. Results obtained
using the reference catalyst (750ºC_4h). ................................................................................. 40
Figure 4.8 – Essay 2: NO conversion as function of the catalyst inlet temperature. The feed
stream contained 300 ppmV NO, 5%V CO2, 10%V O2 and N2 as balance. Results obtained
using the reference catalyst (750ºC_4h). ................................................................................. 41
Figure 4.9 – Essay 2: Concentration of NO, NO2 and NOx (NO+NO2) as function of catalyst inlet
temperature. The feed stream contained 300 ppmV NO, 5%V CO2, 10%V O2 and N2 as
balance. Results obtained using the reference catalyst (750ºC_4h). ........................................ 41
Figure 4.10- Methane conversion into CO2 in function of the temperature: a) Essay 1: CH4 (■) b)
Essay 3: CH4+CO (▲) c) Essay 4: CH4+NO (●) d) Essay 5: CH4+CO+NO (♦). Results obtained
using the reference catalyst (750ºC_4h) .................................................................................. 42
Figure 4.11- Essay 2: CO concentration (●); CH4 concentration (♦); Light-off curve of methane
(■); Light-off curve of CO (▲). Results obtained using the reference catalyst (750ºC_4h). ....... 43
Figure 4.12- NO conversion into NO2 in function of the temperature: a) Essay 2: NO(■);b) Essay
4: NO+CH4 (●); c) Essay 5: CH4+NO+CO (♦) Results obtained using the reference catalyst
(750ºC_4h). ............................................................................................................................ 43
Figure 4.13- Essay 2: Concentration of NO and NO2 in function of the temperature. Essay 4:
Concentration of NO and NO2 in function of the temperature and light-off curve methane.
Results obtained using the reference catalyst (750ºC_4h). ...................................................... 45
Figure 4.14-Comparison of the methane light-off curves obtained using the reference catalyst
(750ºC_4h) and the aged catalyst (850ºC_4h) for essay 1 and essay 5. .................................. 47
Figure 4.15- Comparison of the NO light-off curves obtained using the reference catalyst
(750ºC_4h) and the aged catalyst (850ºC_4h) for essay 1 and essay 5. .................................. 48

Page XIII
Ageing on commercial automotive catalysts, a structure reactivity study
Table Index
Table 2.1 - Mechanisms of catalyst deactivation [16] ............................................................... 10
Table 3.1- Aging Conditions used in this study ........................................................................ 19
Table 3.2. - Description of the gases used in this study ........................................................... 26
Table 3.3- Experimental Schedule. The base feed stream consisted of 10%O2, 5%CO2, and
appropriate reactant gases, with N2 as the balance. Note: Due to technical problems with the
water evaporator, it was not possible to use water. .................................................................. 28
Table 4.1 -Textural parameters for the reference and aged catalysts. ...................................... 33
Table 4.2 - TPR results: temperature and hydrogen consumption of the existent peaks for the
reference and aged catalysts. ................................................................................................. 39

Page XIV
Ageing on commercial automotive catalysts, a structure reactivity study

Page XV
Ageing on commercial automotive catalysts, a structure reactivity study
Abbreviations Index
DOC: Diesel Oxidation Catalyst
TEM analysis: Transmission Electron Microscopy
TPR analysis: Temperature Programmed Reduction
BET analysis: Brunauer, Emmet and Teller
DRX analysis: X-ray Diffraction
SGB: Synthetic Gas Bench

Page XVI
Ageing on commercial automotive catalysts, a structure reactivity study
Page 1
CHAPTER 1: INTRODUCTION AND OBJECTIVES
Chapter 1: Introduction and Objectives
This work was carried out in the Jean Le Rond d’Alembert Institute of Pierre and Marie Curie
University, in cooperation with Continental with the purpose of researching the effect of aging on
diesel oxidation catalysts, and will be used to control the emissions of pollutants of vehicles in
Europe.
The widespread use of automobiles offers a degree of mobility to the individual that was
unthinkable just a few centuries ago, additionally it gave an important contribution to the
development of our modern society [1] [2]. On the other hand, the inherent consequences are
evident: in 2010, over 1 billion passenger cars were on the streets worldwide [3] ,and 63 million
additional new cars were produced in 2012, being 17 million produced in Europe (2nd world
largest producer) [4].
This enormous number of vehicles indicates that there are several severe problems one has to
deal with me. Almost all cars are powered by combustion engines which are fuelled by gasoline,
diesel or natural gas, and therefore rely upon fossil fuels. These natural resources are limited
and must be conserved. Tremendous efforts are made to limit the wastage of this raw material.
Manufactures are urged to offer cars with economical engines, and the government tries to
motivate the drivers to buy electric vehicles through fiscal incentives. A lot of research is done to
establish new engine concepts based on renewable energies (fuel cell technology, hydrogen
engines, etc.) instead of conventional petrol driven cars. But until these new technologies are fit
for series-production, the existing automotive combustion engines have to be improved and
optimized to use the existing fuel resources responsibly [5].
Furthermore, there is an increasing ecological consciousness to protect our natural
environment. The combustion of fossil fuels in millions of cars produces large amounts of
gaseous emissions, emerging as the major source of urban air pollution in the developing world
In order to preserve air quality, the European Union (UE) issued in 1970 its first directive
(Directive 70/220/EEC), also known by Euro 1, regulating the maximum quantities of pollutants
that can be emitted by an automobile vehicle, so that it can be approved for sale in UE [6].
Since then, successive “Euro” norms have been introduced imposing more stringent limits for
the emissions of different pollutants and in the long run further lowering can be expected. The
commonly controlled gas emissions are carbon monoxide (CO), hydrocarbons (HC), oxides of
nitrogen (NOx) and particulates (for diesel engines).

Page 2
CHAPTER 1: INTRODUCTION AND OBJECTIVES
Figure 0.1 - Development of the legally permitted emission of passenger cars in EU a) For gasoline engines b) For Diesel Engines
The need to respond to government legislation to reduce emissions from vehicles, like Euro 5
and further Euro 6, places increasing demands on the automotive industry to seek
improvements in automotive emission control systems enclosing new engine concepts, fuel
quality, and in the design of exhaust catalysis, therefore they are currently spending a lot of
money on research on these fields [5] [7].
Particularly, the continuous improvement of exhaust catalysts over the last 30 years brought
major advances in saving resources and fluffing present and further emissions directives. It is
estimated that by the year 2000, over 800 million tons of combined pollutants of HC, CO and
NOx could have been abated using auto exhaust catalyst. Nevertheless, there is still a need for
further improvement of automotive catalyst technology, to meet the legal standards, as well as
to minimize the pollutants toxic to the human health and prejudicial to the environment [5].
0
500
1000
1500
2000
2500
3000
3500
Euro 1(1992)
Euro 2(1996)
Euro 3(2000)
Euro 4(2005)
Euro 5(9/2009)
Euro 6(9/2014)
Em
issio
ns(
mg
/km
)
Gasoline Engines
a) Development of the legally permitted emission of passager cars in EU
CO HC NOX HC+ NOX PM
0
500
1000
1500
2000
2500
3000
3500
Euro 1(1992)
Euro 2(1996)
Euro 3(2000)
Euro 4(2005)
Euro 5(9/2009)
Euro 6(9/2014)
Em
issio
ns(m
g/k
m)
Diesel Engines
b) Development of the legally permitted emission of passager cars in EU
CO HC NOX HC+ NOX PM

Page 3
CHAPTER 1: INTRODUCTION AND OBJECTIVES
Although there are many variations, catalytic converters can be grouped into two main
categories. The first category is comprised of the system used for engines that have
stoichiometric air to fuel ration. These engines are usually spark ignition engines. Catalytic
converters of this type use a three way catalyst (TWC), in which the three pollutants (CO, HC
and NOX) are simultaneously reacted to eliminate them all. In the second category are systems
for engines operated with excess oxygen (lean burn) such as compression ignition diesel
engines.
For these systems, due to the high concentration of oxygen in the exhaust gas, it is impossible
to reduce NOx over a TWC. To overcome this problem, a combination of two types of
converters in series is used: on for oxidation and the other for reduction. The first one, called
diesel oxidation catalyst (DOC) is responsible for oxidizing CO and HC. In this converter, NO is
also oxidized to NO2, although some nitrous oxide (N2O) and nitrogen (N2) can also be formed
through selective catalytic reduction.
A diesel particulate filter (DPF) is placed after the DOC to trapsoot, which can be subsequently
oxidized by NO2 produced in the DOC. The second converter, either a selective catalytic
reduction unit (SCR) or a lean NOx-trap (LNT) is used to convert NO and NO2 to nitrogen using
a reducing agent -urea/water solution (UWS). Sometimes the DPF and SCR functions are
combined. The reduction of NOX in the SCR depends on the ratio of NO to NO2, thus the extent
of NO oxidation in the DOC is important. Finally, an ammonia slip catalyst may be used to
eliminate excess ammonia fed to an SCR.
Figure 0.2 - Components of an abatement system. Reproduced from [8].
Currently, the SCR and the lean NOx trap are reserved for the heavyweight vehicles and
commercial vehicles, but with implementation of Euro 6 legislation, that focus mainly in the
reduce of nitrogen oxide emissions, all diesel cars must implement one of these technology’s
[9].
A lot of interest is currently focused on catalysts for emission control in diesel engines, since
diesel engines enjoy increasing popularity, due to their economy of operation and their reduced
emission of greenhouse gases, most notably CO2 [5] [10].

Page 4
CHAPTER 1: INTRODUCTION AND OBJECTIVES
According to [11], the vast majority of Europe’s new cars are powered by gasoline or diesel
motors: diesel cars account for 55% of all new registrations, gasoline cars for 42%; all other
technologies – hybrids, electrics, and natural gas and ethanol-fuelled vehicles – combine to
make up the remaining 3% (Figures of 2013).
Increasingly stringed regulations for diesel engine emissions have a significant impact on the
required efficiency of DOC, which has to convert more pollutants at lower temperatures.
Measures to reduce engine-out NOx and PM, tend to increase CO and HC emissions.
Additionally, engine-out NOx reduction is mainly achieved through high amounts of exhaust gas
recirculation (EGR) that lower the combustion temperature,which impose great challenges to
tradional diesel oxidation aftertreatment devices.

Page 5
CHAPTER 2: CONTEXT OF THE BIBLIOGRAPHIC STUDY
1. Chapter 2: Context of the bibliographic study
In this chapter the context in which this study was carried out will be presented. This chapter
can be divided in 4 main sections.
The first one, where the components of diesel exhaust emission and their treatment are
presented. The second one, where diesel oxidation catalysts (DOC) is discussed in general.
In the third section, the main topic of this study - ageing of DOC- is primarily discussed. The last
section covers several topics that are important for global comprehension of the study.
2.1. Diesel exhaust emission
Engine exhausts consists in a complex mixture, which composition depends of a variety of
factors such as: type of engine (two- or four-stroke, spark-or compression (diesel)-ignited),
driving conditions, e.g. urban or extra-urban, vehicle speed, acceleration/deceleration, etc.
Diesel engines and lean-burn gasoline engines became more and more important due to
current efforts to increase fuel economy and reduce emissions of the greenhouse gas CO2 [12].
Diesel exhaust is lean because the engine only injects the required amount of fuel into
compressed hot air to generate the desired power. Partly due to the excess air input, diesel
exhaust is also, typically lower in temperature and have less NOx than gasoline exhaust. Diesel
and lean-burn gasoline engines are more fuel efficient, and other benefits include lower CO2
production and for diesel engines specifically, higher power production and durability.
However, of the combustion process result larger quantities of unburned fuel, lubricating oil
emissions and soot and the higher air-to-fuel ratio (fuel-lean, oxygen-rich environment) makes
the reduction of NOx to N2 more difficult. A trade-off between particulates and nitric oxides
impedes the simultaneous reduction of both emissions [1].
Diesel engines, due to their comparatively lean-burn characteristics produce, besides gaseous
compounds, liquid and solid combustion products [12]:
- Solid: dry carbon or soot;
- Liquid: unburned fuel, lubricating oil (collectively SOF) and liquid sulphates primarily,
sulphuric acid (H2O associated with the SO3 is included as a component of the liquid
particulate);
- Gas: carbon monoxide (CO), hydrocarbons (HC) derived primarily from partially burned
fuel, oxides of nitrogen and sulphur.

Page 6
CHAPTER 2: CONTEXT OF THE BIBLIOGRAPHIC STUDY
2.2. Pollutant formation and treatment
In a combustion engine a hydrocarbon fuel is oxidized by atmospheric oxygen. Under ideal
conditions only CO2, water, and heat would be generated (1).
OnHmCOOnmHC nm 222 5.025.0 (2.1)
Under engine conditions, however, ideal combustion is impossible because of the lack of
chemical equilibrium and the inhomogeneous gas phase. Therefore, besides water and carbon
dioxide, several other components, result of incomplete combustion, are found in the exhaust
gas [12].
The challenge for the automobile industry is to remove from these exhaust gases components
that have environmental and health implications, as greenhouse effect and urban smog.
Nowadays these components are [13] [9].
- Carbon monoxide (CO):
Carbon monoxide is a colourless and odourless gas, formed as an intermediate reaction
product during combustion of hydrocarbons. Incomplete combustion due to low combustion
temperature, lack of oxygen, or too short reaction time leads to the emission of CO, a poisonous
gas that displaces oxygen from the blood.
- Unburned and partially oxidized hydrocarbons(HC)
Incomplete combustion of hydrocarbon fuels leads to the emissions of unburned and partially
oxidized hydrocarbons. The hydrocarbons emitted from internal combustion engines are always
a mixture of various compounds: paraffins, olefins, acetylenes, and aromatics. The composition
depends on the combustion system, the operating conditions of the engine, and the fuel. The
known effects of hydrocarbons for the human health are related with the carcinogenic and
mutagenic caused by benzene and other aromatics.
- Oxides of nitrogen (NOx : NO+NO2)
They are generated at combustion temperatures by oxidation either of atmospheric nitrogen
or nitrogen contained in the fuel. During the combustion process mainly NO is formed; NO2,
which is more toxic than NO, is formed by the relatively slow oxidization of NO in the
atmosphere. In combustion processes with an excess of air significant NO2 can be expected.
NOx also reacts with hydrocarbons in sunlight to form ozone and photochemical smog. NOx
can increase respiratory illnesses and is a contributor to acid rain. Tropospheric ozone causes
breathing difficulties and damages plants. In the upper atmosphere NOx is involved in a
catalytic cycle that leads to the destruction of the ozone layer.

Page 7
CHAPTER 2: CONTEXT OF THE BIBLIOGRAPHIC STUDY
- Particulate Emissions(PM)
Particulates are tiny solid and liquid particles. They occur in the exhaust of diesel engines in
sizes from 0.01 to 1 µm and consist of carbon-rich particles (soot), hydrocarbons, and
sulphates. In a diesel engine, due to incomplete mixing, zones of air deficiency arise and lead to
soot formation. In parallel, in zones with excess air, soot is partially burned.
Recent research has shown that especially ultrafine particles (<100 nm in mean diameter) and
nanosized particles (<50 nm in mean diameter) are potentially dangerous due to their capability
to enter deep into the respiratory tract. Furthermore, these small particles supposedly can
penetrate cell membranes.
Noteworthy, that carbon dioxide (CO2), although the most commonly emitted combustion gas, is
normally not considered as a pollutant since adverse health effects are not known. However,
CO2 should be regarded as a serious pollutant in terms of its global-warming potential.
The basic reactions for CO and HC in the exhaust are oxidation with the desired product being
CO2, while the NOx reaction is a reduction with the desired product being N2, and the particles
are treated by combustion of suit in CO2. A catalyst promotes these reactions at lower
temperatures than a thermal process.
2.3. Diesel oxidation catalysts
The diesel oxidation catalyst (DOC) has been part of diesel exhaust systems since regulations
were introduced to limit the amount of harmful emissions released to the environment from
diesel engines .The DOC primary functions are oxidation of CO, unburned hydrocarbons to less
harmful products CO2 and H2O (2-3) and NO to NO2 (4) , which is important for efficient
performance of various downstream catalysts, such as NOx storage/reduction (NSR) catalysts,
SCR catalysts and DPFs (further discussed below). DOC has also the additional role of
periodically converting high amounts of HC and CO to generate the required thermal conditions
to burn the soot trapped in the DPF [14].
222
1COOCO (2.2)
OHCOOHC 222 (2.3)
222
1NOONO (2.4)

Page 8
CHAPTER 2: CONTEXT OF THE BIBLIOGRAPHIC STUDY
The first support for oxidation catalysts in automobiles was pellets in a canister, or a packed bed
arrangement, nevertheless this support was put aside due to the dramatic decrease in catalytic
performance over time caused by the mechanical degradation of the pellets via vibration and
inter-particle collision.
Current DOCs are generally based on cordierite (ceramic) “honeycomb” monoliths although
metal monoliths are also sometimes used. The ceramic monoliths have superior strength due to
the low porosity of the ceramic; however this property makes the monolith unsuitable to
disperse the catalyst. As such, a high surface area material, called a washcoat, is adhered to
the monolith surface, and the catalytic metal is then dispersed on the washcoat.
Using a high surface area washcoat support results in highly dispersed precious metal sites,
which is generally desired for good oxidation performance, because it increases the active
component exposed surface area for reaction and also lowers the amount of precious metal
required, thus decreasing the catalyst cost [1].
Figure 1.1 - The structure of a monolithic exhaust gas catalyst. Reproduced from [1]
Alumina (Al2O3) is a very common washcoat material, among others like silica (SiO2) and
zeolites, as well as combinations of these components. Noteworthy is that each material has
different properties that will affect its application and these properties can be tailored for the
target reactions. This can be explained if we consider the fact that catalyst support can
influence performance, for example by altering the thermal stability of the active component and
support, surface area, pore volume and surface reactivity. Examples of several experiments that
corroborated this can be found in [1].
Some supports additives have been used to improved thermal stability of the support. Typically,
the additives for Al2O3 are metal oxides such as BaO, CeO2, La2O3, SiO2 and ZrO2, although
these components can have other, possibly undesired (such as active site blocking), effects on
catalyst activity and therefore must be evaluated carefully [1].
Page 9
CHAPTER 2: CONTEXT OF THE BIBLIOGRAPHIC STUDY
As for the active components, Platinum group metal, including Platinum (Pt) and Palladium (Pd)
have been used in DOCs since their inception due to their good oxidation performance, their
good thermal durability, their lower tendency (compared with transition metals) to react with
support materials and they can process gas streams containing upwards of 1000 ppm (by
weight) sulphur without being transformed to bulk surface. Additionally Rhodium (Rh) is
sometimes used as well [15] [1].
However, in early R&D on automotive catalysts, it was attempted to use transition metals, such
as, copper and nickel largely due to concerns over the cost and availability of noble metals.
Nevertheless, it quickly became apparent that transition metals lacked intrinsic reactivity,
thermal durability and fuel oil contaminants (poison) resistance required for automotive
applications [15].
In terms of diesel emissions, DOCs with precious metal components provide high oxidation
activity for CO, unburned hydrocarbons, and liquid hydrocarbons (SOF components) [1].
The advantages and disadvantages of using Pt or Pd as active components are briefly
discussed below: while both metals act as adsorption sites for both oxygen and HCs, Pt has
lower relative surface oxygen coverage and is stereotypically considered to have the highest
oxidation activity. Pt also exhibits better performance with higher weight HCs compared to Pd.
Where extreme temperatures are not required, Pt provides good oxidation activity and sufficient
activity in the presence of SO2, a common catalyst poison.
However, in terms of thermal degradation, i.e., when high temperatures exist such as those
generated in the DOC for DPF regeneration, Pt activity decreases due to thermal degradation.
Similarly, Pd-based catalysts are also deactivated by high temperature exposure, which can
cause sintering (that will be discussed on section 2.5), and decomposition of the active PdO to
metallic Pd (that is less active), thereby decreasing catalyst activity. The associate use of Pt and
Pd (that will be mention more in detail on section 2.5) has shown more resistance to sintering at
higher temperatures than Pt [1].
A highly dispersed state is desired for the metal, as activity generally increases and cost
decreases with the surface-to-bulk (higher surface area for reaction) ratio of the particles,
although there is a lower limit on particle size for good oxidation performance [1].

Page 10
CHAPTER 2: CONTEXT OF THE BIBLIOGRAPHIC STUDY
2.4. Catalyst Deactivation
Catalyst deactivation, the loss over time of catalytic activity and/or selectivity, is a problem of
great concern in the practice of industrial catalytic process. Catalyst deactivation may occur by
several mechanisms, nevertheless the most relevant mechanisms are sintering (also known by
aging), fouling/coking and poisoning. These mechanisms can be classified according to their
nature in chemical, mechanical or thermal. A brief description of each mechanism is presented
in Table 2.1.
Table 1.1 - Mechanisms of catalyst deactivation [16]
Mechanism Type Brief Description/Definition
Poisoning Chemical Strong chemisorption of species on catalytic sites, thereby
blocking sites for catalytic reaction
Fouling Mechanical Physical deposition of species from fluid phase onto the
catalytic surface and in catalyst pores
Sintering
(Aging)
Thermal Thermally induced loss of catalytic surface area, support are
and active phase-support reactions
While catalyst deactivation is inevitable for most processes, some of its immediate drastic
consequences may be avoided, postponed or even reversed, therefore there is considerable
motivation to understand and treat catalyst decay. This area of research provides a critical
understanding which is the foundation for a modeling deactivation processes, designing stable
catalysts and optimizing processes to prevent or slow catalyst deactivation [16] . In this work
only the aging mechanism and their effect on catalytic activity for diesel oxidation catalyst will be
discussed.
Since the study of deactivation is usually conducted with synthetic aging, which attempts to
simulate the effects of actual aging in a shorter time frame and for less cost, it’s important to find
correlations between real and simulated for the development and assessment of catalysts.
Differences can arise between the aging methods, i.e. physical aspects of aging; take for
example the different effects observed on Pt/Al2O3 using homogeneous or heterogeneous
thermal aging.
For a homogeneous thermal aging process, where the catalyst was aged in an oven at 675ºC,
the time for the back-to-front ignition wave to travel increased through the entire catalyst length
compared to the fresh catalyst sample, and the aged catalyst dispersion measured by H2
chemisorption was 42% of the fresh catalyst dispersion [17].

Page 11
CHAPTER 2: CONTEXT OF THE BIBLIOGRAPHIC STUDY
While for the heterogeneous/non-uniform aging method, damaged wasn’t uniform through the
catalyst, i.e. each axial position of the catalyst of the catalyst was exposed to a different thermal
aging temperature environment, with higher temperature exposures at the catalyst inlet.
This was achieved pulsing propylene and oxygen into the reactor at 500ºC, resulting in the inlet
section of catalyst experiencing temperatures above 650ºC, thus indicating Pt sintering.
Additionally and despite the similar increasing on the back-to-front ignition time, the time
increase was focused heavily toward the catalyst inlet [18].
2.5. Aging of catalysts
The nature of automotive applications demands reliable performance of catalytic converters
over an extended time period with transient operating conditions. To achieve that, one of the
key challenges is dealing with the chemical and thermal aging effects on the catalytic activity.
In this work only thermal aging is predominantly discussed.
Being the first component exposed to “fresh” diesel exhaust, the DOC experiences more
damage than downstream components and besides that, new exhaust emission regulations
have a particular impact on the conditions of operation of DOC.
For example, active regeneration of diesel particulate filters (DPFs) by soot burning requires the
DOC withstand high temperature spikes. These exceed by far comparatively low diesel exhaust
gas temperature, thus causing potential thermal aging issues. Furthermore, with new
regulations limiting the sulfur content in diesel to 10 ppm, the same level as in gasoline, the
influence of motor oil based contaminants (e.g. Zn, Ca, Mg, P, Si) on the chemical aging of the
DOC is likely increase. Additionally, diesel can contain additives like ferrocene (Fe) used for
improved DPF regeneration, which can also contribute to chemical aging [19].
It’s important to mention, that the exhaust conditions affect the type and extent of deactivation.
Driving behavior has also been seen to impact the deactivation of catalysts, with highway
driving leading to more thermal deactivation and city driving with idling causing more poison
accumulation. Thermal aging tends also to increase with mileage, as the precious metal
dispersion decreases with aging time [1].
Lowered DOC oxidation efficiency due to aging effects can lead to reduced NO2 formation. This
potentially influences the efficiency of the exhaust aftertreatment systems downstream of the
DOC, including the diesel particulate filter, the NOx storage reduction catalyst, and the selective
reduction catalyst.
The DPF employs NO2 as an oxidizing agent to remove trapped soot; a lowered NO2
concentration can lead to blockage of the DPF. Besides that, DPF require temperatures of
about 500-600°C to oxidizes diesel particulate matter (soot) with O2.

Page 12
CHAPTER 2: CONTEXT OF THE BIBLIOGRAPHIC STUDY
However, NO2 oxidizes soot at temperatures close to 350°C. An NSR catalyst selectively stores
NOx during lean-phase operation (excess of O2) and reduces this stored NOx through a short,
reductant - enriched (rich) phase.
Several studies have proposed that NO2 is a precursor for, or intermediate in the trapping
process and overall, the presence of NO2 enhances the performance of the NSR catalyst
through improved NOx storage SCR catalysts selectively reduce equi-molar concentrations of
NO and NO2 to N2 in the presence of NH3 at faster rate than if only NO was available. [19]. NSR
catalyst can only store NO2 but not NO; lowered NO-oxidation efficiency of the DOC can
therefore result in NO slip
2.5.1. Thermal aging or Sintering
Sintering is a physical process where the active surface area of the catalyst decreases through
structural changes. It occurs, unequally, to both the catalyst support and active metal sites,
based on the exhaust gas conditions. However, temperature has the greatest effect on the
degree of sintering, with more sintering occurring as the temperature increases and with the
length of temperature exposure [1].
2.5.1.1. Support Sintering
As mentioned before alumina is the most common washcoat material for DOC, however there
are many different types of alumina. High temperature exposures cause undesired phase
transformations for alumina that change the washcoat properties: y-Alumina, having a high
surface area(a strong desired property for the catalyst support), is gradually transformed to δ-
Alumina and at still higher temperatures to α-phase via ϴ-phase. [1] [20].
Figure 1.2 - Phase transformation and specific surface are of alumina. Reproduced from [20]
The driving force for sintering is to lower the surface energy of the support, which occurs
through the transport of the material across the surface to decrease dispersion and/or eliminate
pores in the support. The result of support sintering in catalysts is the loss of surface area of the
carrier (or the washcoat in case of structured catalysts), besides that when the pores are
blocked off, the precious metal particles can be trapped inside (encapsulation) and hidden from
the reactants thereby decreasing the overall catalyst activity [1] [20].

Page 13
CHAPTER 2: CONTEXT OF THE BIBLIOGRAPHIC STUDY
Particle growth occurs by successive elimination of water via
condensation of hydroxyl groups residing on adjacent particles
close to an area of contact. The formed Al-O-Al bond brings more
hydroxyls into adjacency and in such way results in closure of
pores [20].
Temperature, size and shape of the metal particles, as well as
roughness, reaction atmosphere, metal type, metal dispersion,
promoters/impurities and support surface are used are the main
parameters controlling the sintering of given oxide [1] [20] [16].
However, temperature has the greatest effect on the degree of
sintering, with more sintering occurring as the temperature
increases and with the length of temperature exposure [1].
An example regarding reaction atmosphere, is the fact that water
vapor accelerates the crystallization and structural change in
oxide supports [20] .
In a study of water deactivation of PdO catalyst, Burch and
Urbano [21] suggested the active sites become more mobile on
the catalyst surface which causes decreased activity for PdO
active sites; the water, or the surface hydroxyl group interactions, allows the PdO to travel more
easily over the alumina washcoat. In the same study the investigators observed that the long
duration hydrothermal aging step caused permanent damage on the catalyst, possibly due to
Pd oxides changing to less active state. Other study [22] showed that a higher HC oxidation
light-off temperature over Pt- zeolite catalysts following hydrothermal damage, as well as a
lower surface area for both zeolite alone and Pt-zeolite combination, indicating that the zeolite
support is damaged.
2.5.1.2. Precious metal sintering
Precious metal sintering generally involves the movement of precious metal particles, allowing
agglomeration of the particles, and thus decreasing both the dispersion of the metal on the
surface and the surface-to-volume ratio of the particles [1]. Two sintering models have been
proposed for washcoat-supported precious metal catalysts, namely atomic and crystallite
migration models. In the first model, sintering occurs via escape of metal atoms from crystallite
and is transferred across the surface. Collision of these migrating atoms with other metal
crystallites results in the formation of larger particles. Based on the crystallite migration model,
sintering is taking place via migration along the support surface. The collision and coalescence
of two crystallites leads to the formation of larger particles. [20]
Figure 1.3 - A model representing surface dehydroxylation from contact region of two adjacent particles. Reproduced from
[20].

Page 14
CHAPTER 2: CONTEXT OF THE BIBLIOGRAPHIC STUDY
Calcium, barium and cerium are known to decrease the mobility of the atoms. Rare earth oxides
such as La2O3 and CeO2 are strongly interacting with noble metal particles to improve support
stability and thus reducing the sintering of some metals, although not Pt in particular.
As discussed above, blends of precious metals, such as Pt-Pd, have exhibited more resistance
to sintering compared to monometallic catalysts. The addition of Pd improved the DOC thermal
stability by mitigating the growth of precious metal particles, possibly because a portion of the
Pd forms a protective Pd oxide (PdO) layer [1].
2.6. Influence of different parameters on the l ight off (ignition) curves
2.6.1. Influence of the type of catalyst (Pd vs Pt:Pd catalyst) on the ignition
curve of propene
Khosravi et al. [23] study the oxidation of CO, NO and C3H6 and reduction of NO by propene
over DOCs using two commercial monolith samples of 400 CPSI with the total PGM loading of
95 g/ft3, one monolith had platinum catalyst only and the other was a bimetallic catalyst of 4:1 by
mass platinum and palladium. For the Pt catalyst, the investigators obtained ignition curves
similar to reported on the literature, i.e. the oxidation of CO occurs first, followed by that of C3H6.
As the propene begins oxidizes, it reacts with NO to produce N2 and N2O, and finally NO is
oxidized to NO as the C3H6 vanishes (Figure 2.4a).
However for the Pt:Pd catalyst there is a different shape for the propene ignition curve. It is
divided into two distinct regions, with a noticeable change in slope, and in some cases a
plateau, in the conversions between them (Figure 2.4b). Noteworthy is also the fact, that this
behavior was not seen for the same conditions in the absence of CO. From an examination of
these results, the investigators suggested that the slope change of the propene ignition tended
to happen at the point where the outlet CO conversion was close 100%.
Figure 1.4- Typical ignition curves observed for the complete exhaust gas mixture over two catalysts. a) Mono-metallic Pt catalyst: 500 ppm CO, 167 ppm H2, 500 ppm propene, 150 ppm NO b) bi-metallic Pt:Pd catalyst: 500 ppm CO, 167 ppm H2 , 500 ppm propene, 600 ppm NO. Reproduced from [23].
Page 15
CHAPTER 2: CONTEXT OF THE BIBLIOGRAPHIC STUDY
2.6.2. Influence of variation of the concentration of CO and NO in the
ignition curve of propene
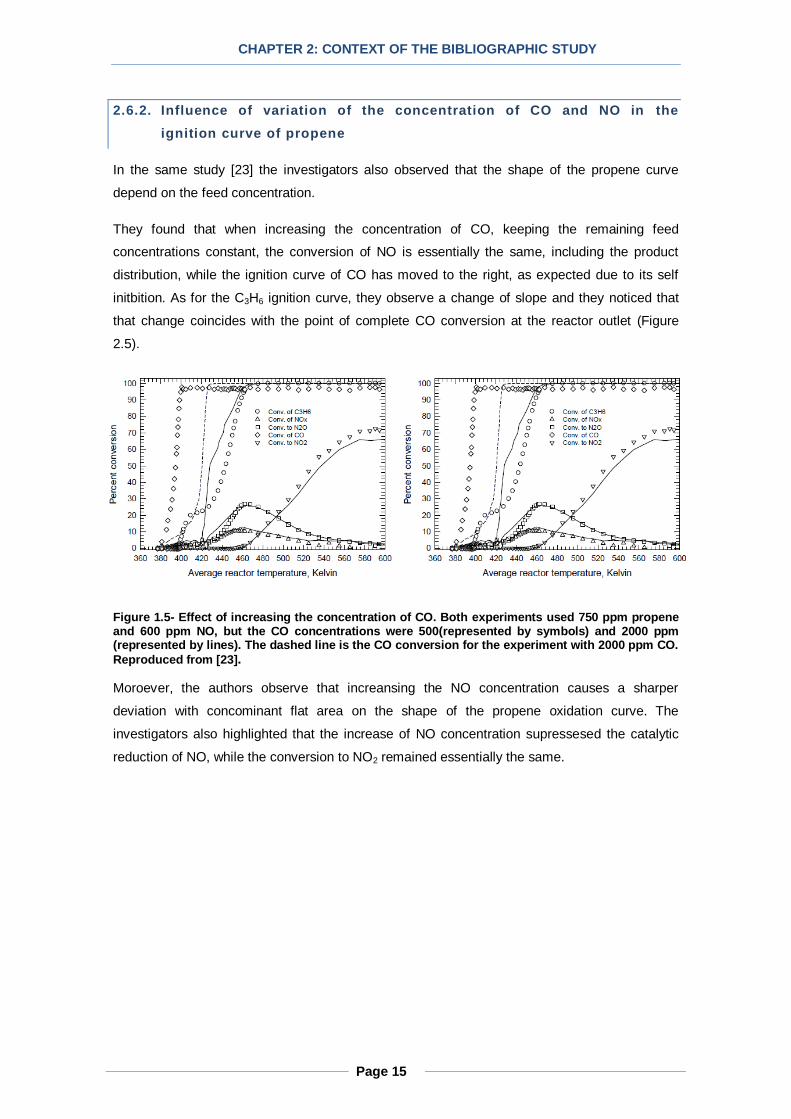
In the same study [23] the investigators also observed that the shape of the propene curve
depend on the feed concentration.
They found that when increasing the concentration of CO, keeping the remaining feed
concentrations constant, the conversion of NO is essentially the same, including the product
distribution, while the ignition curve of CO has moved to the right, as expected due to its self
initbition. As for the C3H6 ignition curve, they observe a change of slope and they noticed that
that change coincides with the point of complete CO conversion at the reactor outlet (Figure
2.5).
Figure 1.5- Effect of increasing the concentration of CO. Both experiments used 750 ppm propene and 600 ppm NO, but the CO concentrations were 500(represented by symbols) and 2000 ppm (represented by lines). The dashed line is the CO conversion for the experiment with 2000 ppm CO.
Reproduced from [23].
Moroever, the authors observe that increansing the NO concentration causes a sharper
deviation with concominant flat area on the shape of the propene oxidation curve. The
investigators also highlighted that the increase of NO concentration supressesed the catalytic
reduction of NO, while the conversion to NO2 remained essentially the same.

Page 16
CHAPTER 2: CONTEXT OF THE BIBLIOGRAPHIC STUDY
Figure 1.6- Effect of increasing the concentration of NO. Both experiments used 250 ppm propene and 500 ppm CO, but with NO concentrations of 150(represented by symbols) and 600 ppm (represented by lines). The higher NO concentration causes a sharper deviation with concomitant flat area. Reproduced from [23]
In another study [24] the authors found that the addition of NO caused propene oxidation light
off to occur at higher temperature, resulting in less propene conversion across the entire
temperature range, in comparison to experiments without NO (Figure 9 of [24])
In the same study by [24], the influence of NO2 on the light off curve of propene was also
studied. The authors observed that although propene oxidation light off occurred at the same
temperature when NO2 was or was not included, the addition of NO2 initially accelerates the
C3H6 oxidation, relative to no NO2, but then inhibits it after light off has occurred. The authors
attribute this negative effect to NO inhibition of C3H6 oxidation reaction, with the NO formed from
NO2 reduction.
Page 17
CHAPTER 2: CONTEXT OF THE BIBLIOGRAPHIC STUDY
2.6.3. Influence of variation of concentration of HC in the ignition curve of
NO
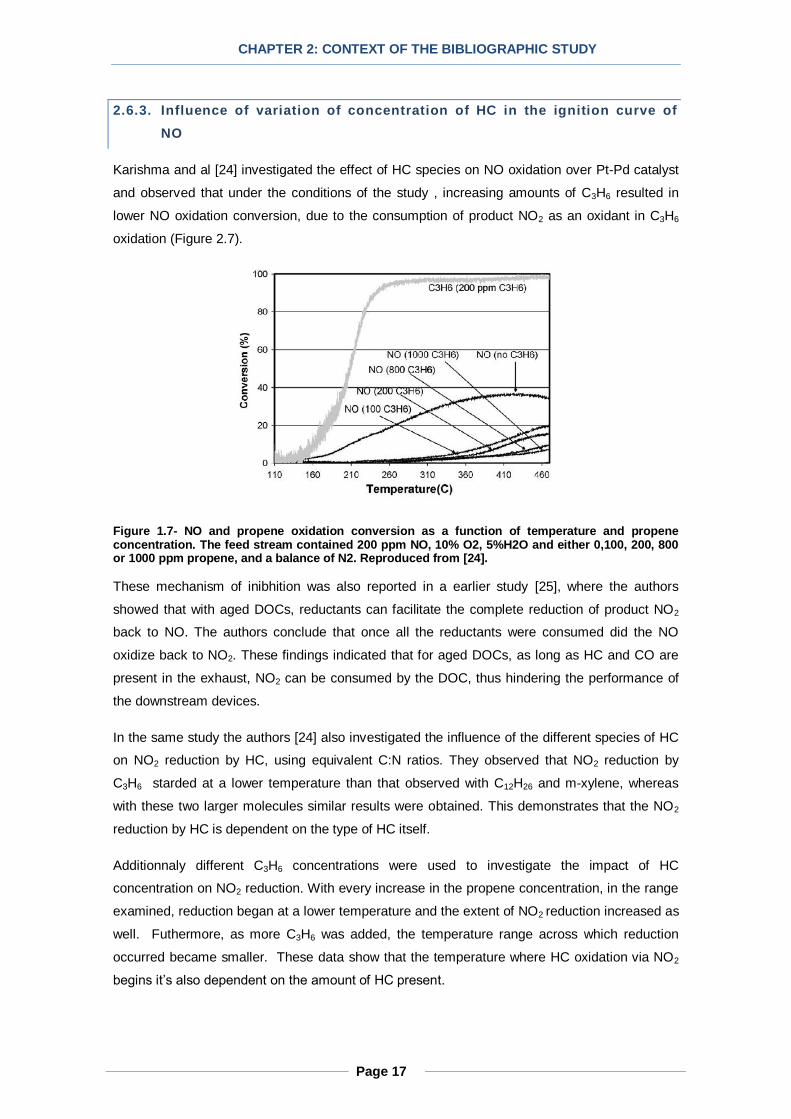
Karishma and al [24] investigated the effect of HC species on NO oxidation over Pt-Pd catalyst
and observed that under the conditions of the study , increasing amounts of C3H6 resulted in
lower NO oxidation conversion, due to the consumption of product NO2 as an oxidant in C3H6
oxidation (Figure 2.7).
Figure 1.7- NO and propene oxidation conversion as a function of temperature and propene concentration. The feed stream contained 200 ppm NO, 10% O2, 5%H2O and either 0,100, 200, 800 or 1000 ppm propene, and a balance of N2. Reproduced from [24].
These mechanism of inibhition was also reported in a earlier study [25], where the authors
showed that with aged DOCs, reductants can facilitate the complete reduction of product NO2
back to NO. The authors conclude that once all the reductants were consumed did the NO
oxidize back to NO2. These findings indicated that for aged DOCs, as long as HC and CO are
present in the exhaust, NO2 can be consumed by the DOC, thus hindering the performance of
the downstream devices.
In the same study the authors [24] also investigated the influence of the different species of HC
on NO2 reduction by HC, using equivalent C:N ratios. They observed that NO2 reduction by
C3H6 starded at a lower temperature than that observed with C12H26 and m-xylene, whereas
with these two larger molecules similar results were obtained. This demonstrates that the NO2
reduction by HC is dependent on the type of HC itself.
Additionnaly different C3H6 concentrations were used to investigate the impact of HC
concentration on NO2 reduction. With every increase in the propene concentration, in the range
examined, reduction began at a lower temperature and the extent of NO2 reduction increased as
well. Futhermore, as more C3H6 was added, the temperature range across which reduction
occurred became smaller. These data show that the temperature where HC oxidation via NO2
begins it’s also dependent on the amount of HC present.

Page 18
CHAPTER 2: CONTEXT OF THE BIBLIOGRAPHIC STUDY
2.7. Zone Coated Catalysts
The achievement of tigher emission standarts relies also on the reduction in the cold-start
emissions by attaining faster light-off of the catalytic converter, since automotive catalysts
operate inefficiently until they reach their light off temperature.
To improve the light-off performance and conversion of catalytic converters, the effect of
variatious design factores (such as cell density, length and diameter of the monolith,
composition of catalyst and axial catalyst distribution) on the performance of the catalyst
converter has been extensively study . Non-uniformly distributed metal or zone coated catalysts
has been receiving a particular interest from investigators [26].
For DOCs, the premise is that different Pt loadings would be used for different axial sections of
the catalyst to minimize the total amount of Pt used while still meeting emissions targets for NO,
CO, and/or HC conversions and possibly improving cold-start emissions [1] .Many researches (
[27], [28], [29]) investigate this concept with models and their studies indicate that non-uniform
catalyst distribution can improve the performance of catalytic converter. Oh and Oh and
Cavendish [28] examined the light-off behavior of three Pt distribution profiles along the reactor
length and showed that light-off performance improves substantially when the noble metal is
concentrated in the upstream section of the monolith. Cominos et al. [27] showed that for
methane oxidation non-uniform catalyst distributions have the potential to achieve lower thermal
stresses. Khanaev et al. [29] showed that in an adiabatic reactor the optimal profile is the one
that monotonically decreases along the bed length in the case of an exothermal reaction and
monotonically increases in the case of an endothermic reaction.

Page 19
CHAPTER 3: MATERIALS AND EXPERIMENTAL METHODS
2. Chapter 3: Materials and Experimental Methods
3.1. Catalyst Samples
In this study the catalyst used was a commercial DOC provided by Continental. The industrial
monolithic catalyst with 14,5 cm of diameter and a length of 11 cm was cut in cylindrical
“carrots” in shape of honeycombs with a diameter of 2,54 cm (1 inch) and a length of 2,6 cm.
Figure 2.1- At left Diesel Particulate Filter (DPF) and at right Diesel Exhaust Catalyst (DOC)
Being a commercial catalyst, we were expecting that it might be zone coated, i.e. the catalyst is
not impregnated in the same way from the entry until the end; however that did not occur, by
direct observation we noticed a uniform metal distribution on the monolithic catalyst. For this
reason and unlike what happened in a previous study [9] the axial position of the catalyst in
which the carrots were cut was not relevant and we chose to cut it at the entry, at the middle
and at the end.
In order to follow a real mileage of such catalytic system four different aging were used in this
study (Table 3.1). The aging conditions were chosen based on empirical knowledge acquired in
other studies and in order to be representative of real driving cycles.
Table 2.1- Aging Conditions used in this study
Designation
Aging Conditions
Temperature (ºC) Duration (h)
DOC 4h_750ºC 750 4
DOC 10h_750ºC 750 10
DOC 4h_850ºC 850 4
DOC 10h_850ºC 850 10

Page 20
CHAPTER 3: MATERIALS AND EXPERIMENTAL METHODS
Figure 2.2 - Catalyst samples. From left to the right: DOC 750ºC 4h, DOC 750ºC 10h, DOC 850ºC 4h and DOC 850ºC 10h
The first aging condition “4h_750ºC” is designated by reference, which means that all the results
obtained with the other aged catalysts were compared to it. The purpose of this aging was to
recreate the conditions of the catalyst on a new car.
Besides this condition, tree other aging conditions were defined in order to find the “right“ aging
condition to compare to the reference, in other words the condition that better recreates the
performance of the catalyst on a used car. For this, we must keep in mind that a converter
catalyst is designed to last the life of the car, which means that the catalytic activity should
never decrease drastically in comparison with the reference, because in this case it means that
we “overaged” the catalyst. Nevertheless, we must obtained significant catalytic activity
differences between the aged catalyst and the reference.
Page 21
CHAPTER 3: MATERIALS AND EXPERIMENTAL METHODS
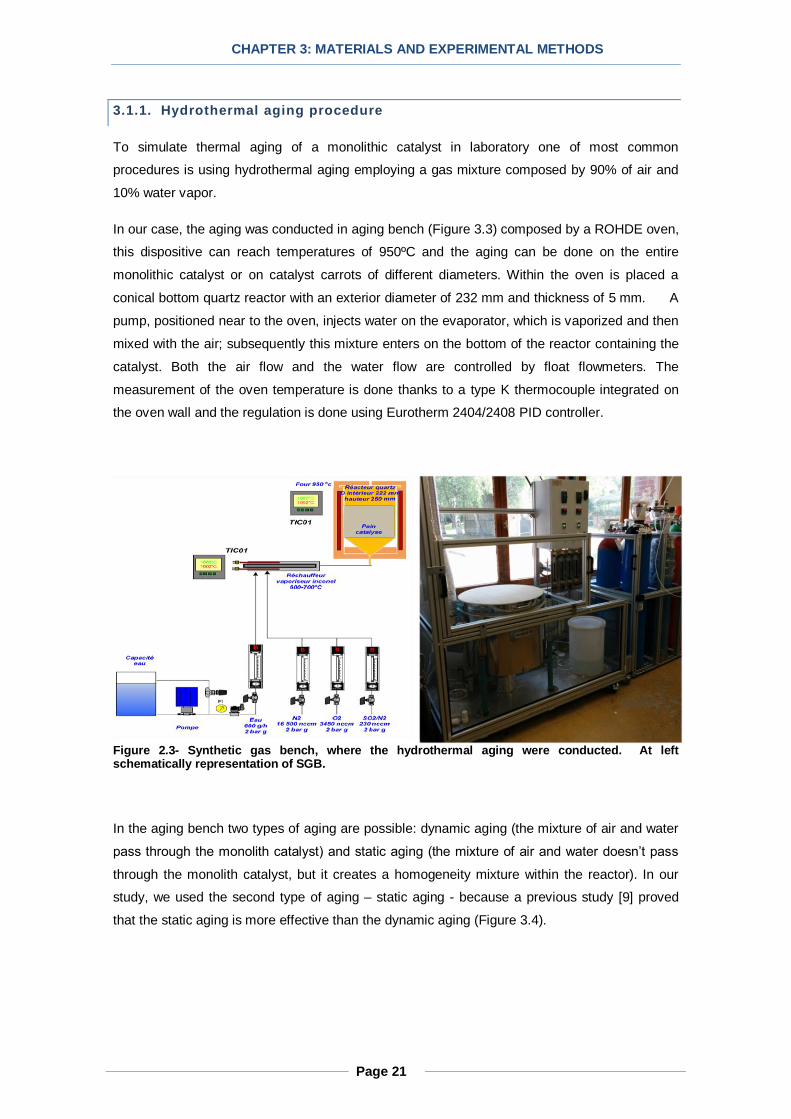
3.1.1. Hydrothermal aging procedure
To simulate thermal aging of a monolithic catalyst in laboratory one of most common
procedures is using hydrothermal aging employing a gas mixture composed by 90% of air and
10% water vapor.
In our case, the aging was conducted in aging bench (Figure 3.3) composed by a ROHDE oven,
this dispositive can reach temperatures of 950ºC and the aging can be done on the entire
monolithic catalyst or on catalyst carrots of different diameters. Within the oven is placed a
conical bottom quartz reactor with an exterior diameter of 232 mm and thickness of 5 mm. A
pump, positioned near to the oven, injects water on the evaporator, which is vaporized and then
mixed with the air; subsequently this mixture enters on the bottom of the reactor containing the
catalyst. Both the air flow and the water flow are controlled by float flowmeters. The
measurement of the oven temperature is done thanks to a type K thermocouple integrated on
the oven wall and the regulation is done using Eurotherm 2404/2408 PID controller.
Figure 2.3- Synthetic gas bench, where the hydrothermal aging were conducted. At left schematically representation of SGB.
In the aging bench two types of aging are possible: dynamic aging (the mixture of air and water
pass through the monolith catalyst) and static aging (the mixture of air and water doesn’t pass
through the monolith catalyst, but it creates a homogeneity mixture within the reactor). In our
study, we used the second type of aging – static aging - because a previous study [9] proved
that the static aging is more effective than the dynamic aging (Figure 3.4).

Page 22
CHAPTER 3: MATERIALS AND EXPERIMENTAL METHODS
Figure 2.4- Representation of the static aging used in this study.
The procedure followed for preparing the “4h_750ºC” catalysts is described hereafter: four
carrots of fresh catalyst were placed in the oven. Then the oven temperature and the
temperature of the evaporator were increased up to 750ºC and 300ºC, respectively, at a rate of
10ºC/min, while the flow air passed through the reactor at 1150 l/h. When the oven reached
750ºC, 10% of water vapor (115 l/h) was injected on the catalyst to accelerate the aging
process and the flow of air was reduced to 1035 l/h. The flows (air and water) and the
temperatures (evaporator and oven) were then kept constant for four hours.
3.2. Catalytic activ ity studies
The catalytic activity studies were conducted in a synthetic gas bench using a synthetic gas
mixture representative of the exhaust gases from diesel engines. The carrot catalyst (d=2,54
cm; L=2,6 cm) was placed inside a stainless steel reactor, which in is turn was positioned inside
an oven capable of reaching temperatures up to 900ºC.
Figure 2.5- a) Stainless steel reactor and catalyst carrot b) Placement of the carrot catalyst inside the reactor c) Placement of the reactor inside the oven. Note: To force the entire gas mixture to pass through the catalyst, fiberglass insulation was used to cover the gap between the outside of the catalyst and the walls of the reactor.
a) b)
c)

Page 23
CHAPTER 3: MATERIALS AND EXPERIMENTAL METHODS
To recreate real conditions, the synthetic gas bench has a serpentine heat exchanger
(preheater), in which the mixture of gases is heated before entering the reactor containing the
catalyst. This is done to minimize any artificial axial and radial temperature gradients during
experiments.To assure a thermal homogeneity on the preheater, this device was thermally
insulated using fiberglass insulation. The tubes that connected the preheater to the oven were
also thermally insulated to minimize the heat loss.
The temperatures in the reactor and in the preheater were controlled by Eurotherm 2404/2408
PID controllers. Two temperature programs were defined: one for the reactor and the second
one for preheater.
Figure 2.6- Temperature Program defined in the reactor (green) and in the preheater (blue). The red “zone” corresponds to the saturation of the catalyst.
About the temperature programs various aspects are noteworthy:
Several adjustments had to be done in the temperature programs in order to reach an
inlet catalyst temperature on the desired range (400ºC- 500ºC).
On the first version of the programs the heating rate was defined as being the same for
the reactor and for the preheater (12ºC/min), but we noticed that the increase of
temperature on the preheater is slower than the increase of temperature on the reactor.
This fact can be explained in two ways: the preheater was not well thermally insulated,
which was not the case, or the electrical resistance was not working properly, this
assumption seems more appropriate.
For this reason, we decided to increase quickly the temperature (15ºC/min) of the
preheater and then create a plateau at 700ºC with duration of 45 minutes.
The preheater is heated at higher temperatures than the reactor in order to increase the
reaction exothermicity.
Due to the good thermal insulation of the preheater and a certain inertia on the PID
controllers, the decrease of temperature on the preheater starts 5 minutes earlier

Page 24
CHAPTER 3: MATERIALS AND EXPERIMENTAL METHODS
To follow the reaction temperature, two thermocouples were used, one placed at the entry of
the reactor i.e. prior to the catalyst and the other positioned at the exit of the reactor. Two
thermocouples were also used in the pre-heater, one at entry of the device, to measure the
temperature, and the other at the exit, to control the temperature and to avoid overheating the
device.
With the purpose of doing two experiments per day a cooling system was installed employing a
Lauda Ecoline RE106 refrigerating circulation chiller. In this apparatus, the air, entering at room
temperature, is cooled up to -10ºC and then flows through the interior of the preheater and the
reactor exterior, thus cooling both equipment’s. To increase the heat exchange between the
refrigerant fluid and the air, a serpentine made of stainless steel was placed inside the cooler.
Figure 2.7- Scheme of the synthetic gas bench. 1) Serpentine heat exchanger (preheater); 2) Oven in which the reactor is placed; 3) Eurotherm 2404/2408 PID controllers; 4) Refrigerating circulation chiller 5) Volumetric flow controllers (Flowmeters)
In order to ascertain the catalytic activity of the catalyst, the reactor outflow was continuously
analyzed in Environment S.A. Analyzer Bench, which is composed by several detectors:
NOx Topaze 32 M Detector: Allowed the simultaneous detection of NO, NO2 and NOx
(NO+NO2). Its principle of detection is based on chemiluminescence, briefly described
below. This detector was calibrated to detect NOx in the range between 0-1000 ppm.
1
2
3
4
5

Page 25
CHAPTER 3: MATERIALS AND EXPERIMENTAL METHODS
NO is a relatively unstable molecule which will oxidize to
NO2 (especially) in the presence of O3. This reaction
produces a quantity of light for each NO molecule which
is reacted. This light can be measured using a
photomultiplier tube or solid state device.
hvONOONO 223 (3.1)
Chemiluminescence reaction of NO to NO2
Figure 2.8- Simplified scheme of NOX detector
If the amount of ozone present is sufficient to react all of the nitric oxide, then the quantity of
light produced by the reaction will be proportional to the concentration of nitric oxide in the gas
sample. To measure the total oxides of nitrogen (NOx), the sample pass over a heated catalyst
to reduce all the oxides of nitrogen to NO.
HC Graphite 52M Detector: This Flame ionization detector analyzes the total concentration
of Hydrocarbons (HC). A briefly description of its detection principle its present hereafter.
The chosen range was 0-1000 ppm.
In an FID the sample undergoes combustion in a hydrogen/synthetic
air flame. Ions and free electrons are formed in the flame. The
charged particles produce a measurable current flow in the gap
between two electrodes in the detector.
The resulting current flow is of greater strength than the signal
produced by the pure carrier gas and the fuel gas flame alone. This
signal differential provides information about the sample. The
current is proportional to the rate of ionization which in turn depends
upon the concentration of HC in the sample gas.
O2/CO/CO2 MIR 3M Detector: Allowed the simultaneous monitoring, via infrared
spectroscopy of the concentration O2, CO and CO2. The chosen range was 0-21%V for O2,
0-16%V for CO2 and 0-2000 ppm for CO.
NH3 UV-TF Detector: Analyzes via UV NH3 species. This detector was not used in this
study.
Figure 2.9 - Simplified scheme of hydrocarbons detector

Page 26
CHAPTER 3: MATERIALS AND EXPERIMENTAL METHODS
Figure 2.10- From left to the right Environment S.A. Analyzer Bench and Serv’ Instrumentation Synthetic gas bench
In this study several gases (some of them mixture of gases) were used (Table 3.2). All the
gases were supplied by Air liquid and the volumetric flow of each one of them was metered
using calibrated volumetric flow controllers (Brooks, Series 5850E).
Table 2.2. - Description of the gases used in this study
Gas Composition of the gas
(%V)
N2 100% N2
O2 100% O2
CO2 100% CO2
CO 0,25% CO and 99,75% N2
NO 0,75% NO and 99,25% N2
NO2 0,80% NO2 and 99,2% N2
CH4 1% CH4 and 99% N2
For this study CH4 was chosen as hydrocarbon source because methane has a global warming
potential of 21 (values of 2012), which means that the comparative impact of CH4 on climate
change is over 20 times greater than CO2 over a 100-year period.
The gas hourly space velocity (GHSV) was defined as 55000 h-1
. Considering a cylindrical
carrot with dimensions of d=2,54 cm and L=2,6 cm, the volume of catalyst (1.32×10⁻²
dm3) was
calculated, then using the equation below the total gas flow was calculated equal to 12,08
L.min-1
.

Page 27
CHAPTER 3: MATERIALS AND EXPERIMENTAL METHODS
𝐆𝐇𝐒𝐕(𝐡−𝟏) =𝐓𝐨𝐭𝐚𝐥 𝐠𝐚𝐬 𝐟𝐥𝐨𝐰(𝐝𝐦𝟑𝐡−𝟏)
𝐕𝐨𝐥𝐮𝐦𝐞 𝐨𝐟 𝐭𝐡𝐞 𝐜𝐚𝐭𝐚𝐥𝐲𝐬𝐭(𝐝𝐦𝟑) (3.1)
Given the total gas flow, the volumetric flow of each one the gas mixture was calculated as
follows:
Volumetric FlowGas x(dm3h−1) = Total gas flow(dm3h−1) ×CGas x,Desired (ppm)
CGas x,Bottle × 10−2(ppm)
In which:
𝐕𝐨𝐥𝐮𝐦𝐞𝐭𝐫𝐢𝐜 𝐅𝐥𝐨𝐰𝐆𝐚𝐬 𝐱 − Volumetric flow of the gas x
𝐂𝐆𝐚𝐬 𝐱,𝐃𝐞𝐬𝐢𝐫𝐞𝐝 − Desired Concentration of the gas x . This value can be found on the table 3.3.
𝐂𝐆𝐚𝐬 𝐱,𝐁𝐨𝐭𝐭𝐥𝐞 − Concentration of the gas x in the bottle . This value can be found on the table 3.2.
The study consisted in temperature programmed surface reaction essays. The objective of each
essay was to determine the light off curve of each pollutant (NO, CO and CH4) present in the
mixture of gases used.
The catalytic activity study was divided in two parts, whose main difference was the catalyst
used: DOC reference (DOC 750ºC_4H) for the first part and DOC aged for the second part. The
catalyst chosen for the second part was DOC 850ºC_4H.
The essays conducted with the DOC reference catalyst, had two goals: Firstly, using simple gas
mixture (Essay 1 and 2), the purpose was to investigate the DOC performance on the oxidation
of CH4 and NO and then gradually using more complex gas mixture - until reaching the
complete gas mixture, representative of the composition of the engine outlet gas - to study the
impact of each gas on the catalytic activity of CH4 and NO obtained previously , in other words
estimate the interactions effects between the different gases.
In the second part of the study and by redoing the experiments done previously using the
reference catalyst, but this time on aged catalyst the objectives were: studying how the aging
process affects DOC performance, by comparing the results of essay 1 and 2 using DOC
Reference and using DOC Aged and investigate if the aging process affects the interactions
effects observed on the first part of the study.
(3.2)
)
(3.1)
Page 28
CHAPTER 3: MATERIALS AND EXPERIMENTAL METHODS
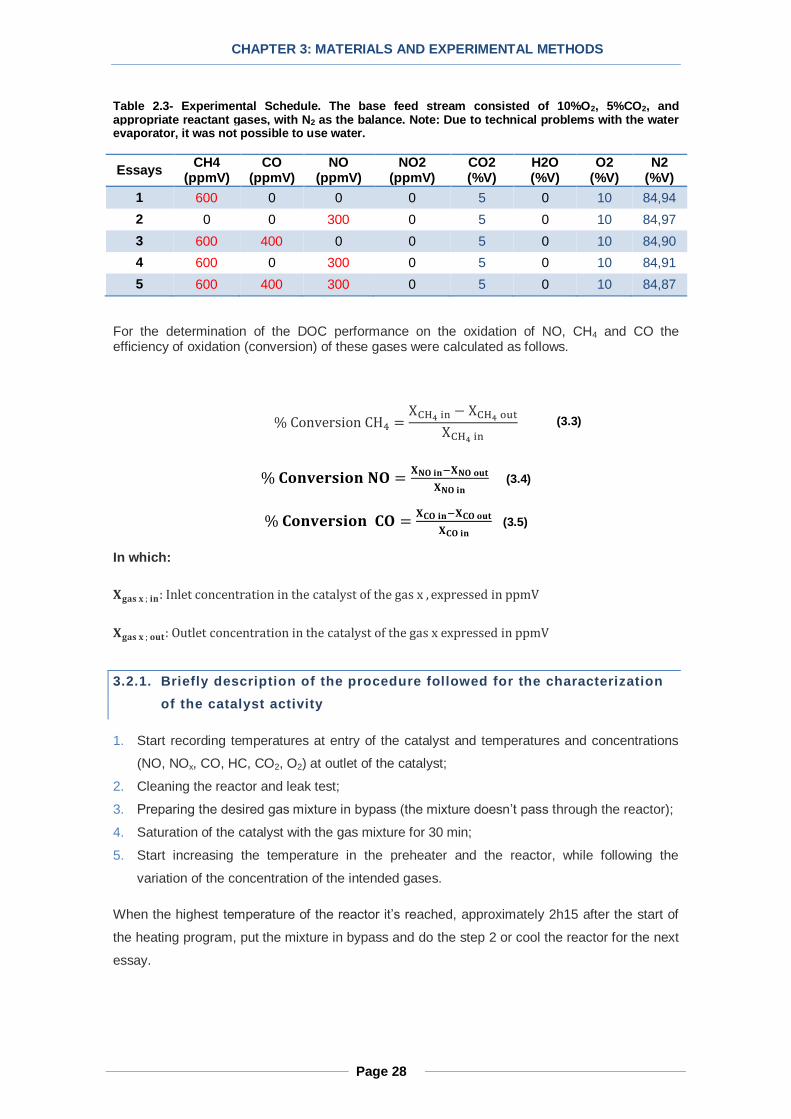
Table 2.3- Experimental Schedule. The base feed stream consisted of 10%O2, 5%CO2, and appropriate reactant gases, with N2 as the balance. Note: Due to technical problems with the water evaporator, it was not possible to use water.
Essays CH4
(ppmV) CO
(ppmV) NO
(ppmV) NO2
(ppmV) CO2 (%V)
H2O (%V)
O2 (%V)
N2 (%V)
1 600 0 0 0 5 0 10 84,94
2 0 0 300 0 5 0 10 84,97
3 600 400 0 0 5 0 10 84,90
4 600 0 300 0 5 0 10 84,91
5 600 400 300 0 5 0 10 84,87
For the determination of the DOC performance on the oxidation of NO, CH4 and CO the efficiency of oxidation (conversion) of these gases were calculated as follows.
% Conversion CH4 =XCH4 in − XCH4 out
XCH4 in
% 𝐂𝐨𝐧𝐯𝐞𝐫𝐬𝐢𝐨𝐧 𝐍𝐎 =𝐗𝐍𝐎 𝐢𝐧−𝐗𝐍𝐎 𝐨𝐮𝐭
𝐗𝐍𝐎 𝐢𝐧 (3.4)
% 𝐂𝐨𝐧𝐯𝐞𝐫𝐬𝐢𝐨𝐧 𝐂𝐎 =𝐗𝐂𝐎 𝐢𝐧−𝐗𝐂𝐎 𝐨𝐮𝐭
𝐗𝐂𝐎 𝐢𝐧 (3.5)
In which:
𝐗𝐠𝐚𝐬 𝐱 ; 𝐢𝐧: Inlet concentration in the catalyst of the gas x , expressed in ppmV
𝐗𝐠𝐚𝐬 𝐱 ; 𝐨𝐮𝐭: Outlet concentration in the catalyst of the gas x expressed in ppmV
3.2.1. Briefly description of the procedure followed for the characterization
of the catalyst activity
1. Start recording temperatures at entry of the catalyst and temperatures and concentrations
(NO, NOx, CO, HC, CO2, O2) at outlet of the catalyst;
2. Cleaning the reactor and leak test;
3. Preparing the desired gas mixture in bypass (the mixture doesn’t pass through the reactor);
4. Saturation of the catalyst with the gas mixture for 30 min;
5. Start increasing the temperature in the preheater and the reactor, while following the
variation of the concentration of the intended gases.
When the highest temperature of the reactor it’s reached, approximately 2h15 after the start of
the heating program, put the mixture in bypass and do the step 2 or cool the reactor for the next
essay.
(3.3)

Page 29
CHAPTER 3: MATERIALS AND EXPERIMENTAL METHODS
3.3. Characterization of the catalyst
The characterization of the catalysts is vital; because the catalyst physicochemical composition
plays an important role on the catalyst behavior, thence understand the catalyst composition
may explain the results obtained in the catalytic activity essays.
As mentioned before, in this study a commercial catalyst was used, which means that available
information about its composition is reduced. Besides that, and as previously discussed, the
emissions regulations have become more stringent, and therefore the complexity of exhaust
catalysts has increased over time, thus hindering the catalyst characterization.
For this reason, several characterization techniques were used to identify the physicochemical
composition of those catalytic materials, as well as to investigate the effect of the hydrothermal
aging on the surface of the catalyst. The samples for the several techniques were prepared by
finely crushing the catalyst carrots and both the washcoat and support were analyzed.
Which one of the four characterization techniques are briefly described below.
Identification of the crystallographic phases – X-ray Diffraction (DRX)
The X-ray Diffraction (DRX) allows the identification of the different crystallographic phases
presented on each monolith catalyst. This characterization technique is based on diffraction of a
monochromatic beam of X-rays by a crystalline compound.
The identification of the presented crystallographic phases on the catalyst was done using the
fiches published by International Centre for Diffraction Data (ICDD). Powder XRD patterns of
each catalyst were collected on a Bruker D8 Advance diffractometer equipped with a graphite
monochromator and using Cu-Kα radiation. A step size of 0.02º (2θ) and a step time of 12 s
were employed during acquisition. DRX measurements were conducted in CQE-IST's X-ray
diffraction facility and were performed between 5º and 70º.
Measurement of the specific surface area- Physique adsorption of azote(BET)
In order to understand the mechanism of aging of DOC, it’s necessary to determine the textural
proprieties of the catalysts before and after the hydrothermal aging, i.e. characterizing the
evolution of the textural properties like specific surface. Specific surface is one of the most
important textural proprieties and can be used for correlating the physique chemical proprieties
of the catalyst with its reactivity.
The specific surface area of powder is determined by physical adsorption of nitrogen, on the
surface of the solid and calculating the amount of the solid of adsorbate gas corresponding to a
monomolecular layer on the surface applying de Brunauer, Emett and Teller (BET) method.
The determination is usually carried out at the temperature of liquid nitrogen.
Page 30
CHAPTER 3: MATERIALS AND EXPERIMENTAL METHODS
The adsorption and desorption isotherms of Nitrogen were measured using a Micromeritics
ASAP 2010 apparatus.
Noteworthy is the fact that prior to the determination of the specific surface area of the sample,
a pre-treatment by heating under vacuum(2 × 10⁻³𝑡𝑜𝑟𝑟) at 200ºC for 2 hours, designed by
outgassing, was done to remove gases and vapors that may have become physically adsorbed.
This step it’s fundamental, because if outgassing is not achieved, the specific surface may be
reduce or may be variable, since part of the surface area was already covered with molecules
that were previously adsorbed.
Precise analyses of the microstructure- Transmission Electron Microscopy(TEM)
The transmission electron microscope uses a high energy electron beam transmitted through a
very thin sample to image and analyze the microstructure of material with atomic scale
resolution. Combining different modes of observation on the same catalyst sample, accurate
information about the morphology, crystal structure and defects, crystal phases and composition
can be obtained.
In this study TEM analysis allowed the investigation of both particle size and composition in the
reference state, as well as the change induced by the different states of hydrothermal aging.
Determination of the number of reducible species - Temperature Programmed
Reduction – TPR
This technique determines the numbers of reducible species present in the catalyst and the
temperature at which the reduction of each species occurs.
H2-TPR measurements were performed on a BELCAT-M-183 apparatus under 5%V H2 in
Argon flow. Argon is generally used as a carrier gas for hydrogen because it allows an
optimization of the thermal conductivity difference between the reactant and the carrier gas.
Besides that, five percent (by volume) it’s the usual concentration because it provides not only a
great deal of instrument sensitivity, but also a high safety factor.
The procedure followed is described hereafter: An amount between 50-60 mg of the sample
was mounted in a quartz reactor that is placed in an electric furnace. Prior to the TPR, the
sample undergoes a pre-treatment under flowing argon (flow rate of 50 mL min-1
) from room
temperature to 500 ºC (5 ºC.min-1
), kept at 500 ºC for 1 h and then cooled to room temperature
(RT). The reduction process was carried out under a mixture of 5% H2/Argon with a flow rate of
50 mL.min-1, from 60ºC to 900 ºC, at a heating rate of 7.5 ºC.min
-1. The H2 mixture was
stabilized in by-pass of the reactor and was put into contact with the catalyst only at the
beginning of the temperature ramp.

Page 31
CHAPTER 3: MATERIALS AND EXPERIMENTAL METHODS
The hydrogen consumption by the catalyst as function of temperature is derived by the change
in the thermal conductivity of the gas mixture monitored by a thermal conductivity detector. The
effluent gas is passed through a water trap containing a molecular-sieve trap to remove water,
then through the thermal conductivity detector. Removing water is important because it is well
known that water has an influence upon the signal of the detector and its presence does not
allow a correct integration of the reduction peaks for the quantification of H2 consumption.
The quantification, in moles, of H2 consumption was determined by integrating the TPD
spectrum obtained and by comparing that to the average area obtained in the loop calibration
pulses.
The loop calibration pulses, consisted in the manual injection of argon into the reactor through a
high precision loop valve system, in order to simulate the peaks obtained when the hydrogen is
consumed. It’s important to emphasize that prior to this; the signal on the TDC is stabilized
under a 5%V H2 in Argon flow. The number of moles of H2 consumed correspondent to each
peak can then be calculated as follows:
In which:
(𝐧𝐇𝟐)
𝐜𝐚𝐥− Number of moles correspondant to each peak of calibration(μmol)
𝐕𝐥𝐨𝐨𝐩 − Volume of the loop valve system(𝑚3)
𝐱𝐇𝟐− Volumetric percentage of H2 in the bottle of H2/Argon (
%𝑉
102)
𝐑 − Universal Constant of Ideal Gases (m3. Pa. K−1. mol−1)
𝐓 − Temperature of the gas at entering of the reactor (K)
The peaks of H2 consumption, generally five, are then integrated and the average area is
determined. This area corresponds to the number of moles of H2 consumed calculated above.
A relation between the moles of H2 consumed and the area of the peaks can be then
established (Equation).
TR
xVPn
Hloop
calH
2
2
calHcal nA
2
cal
xP
calHxPH
A
Ann
2,2
(3.6)
(3.8)
(3.7)

Page 32
CHAPTER 3: MATERIALS AND EXPERIMENTAL METHODS
In which:
𝐧𝐇𝟐,𝑷𝒙− Number of moles correspondant to a H2 consumption peak (μmol)
𝐀𝐏𝐱− Area of the H2 consumption peak (
μV
s)
�̅�𝐜𝐚𝐥 − Average area of the calibration peaks (μV
s)
To normalize the values of 𝑛𝐻2 ,𝑃𝑥 are divided for the mass of the sample.
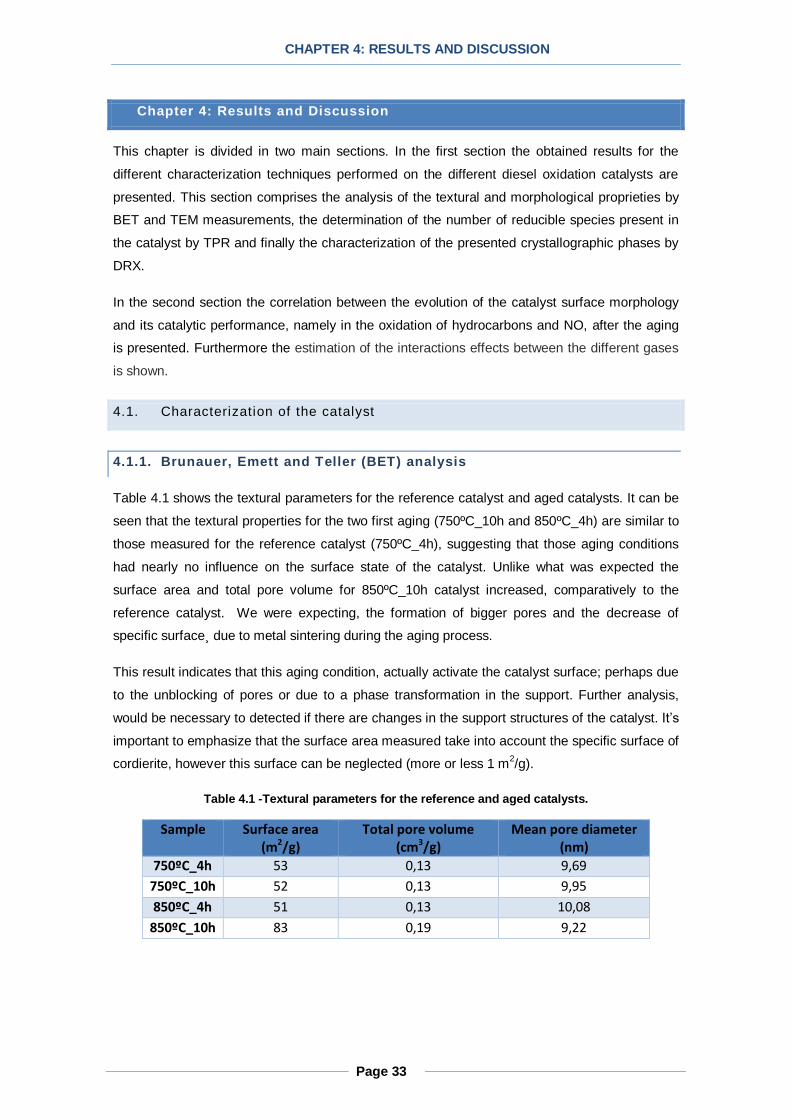
Page 33
CHAPTER 4: RESULTS AND DISCUSSION
4. Chapter 4: Results and Discussion
This chapter is divided in two main sections. In the first section the obtained results for the
different characterization techniques performed on the different diesel oxidation catalysts are
presented. This section comprises the analysis of the textural and morphological proprieties by
BET and TEM measurements, the determination of the number of reducible species present in
the catalyst by TPR and finally the characterization of the presented crystallographic phases by
DRX.
In the second section the correlation between the evolution of the catalyst surface morphology
and its catalytic performance, namely in the oxidation of hydrocarbons and NO, after the aging
is presented. Furthermore the estimation of the interactions effects between the different gases
is shown.
4.1. Characterization of the catalyst
4.1.1. Brunauer, Emett and Teller (BET) analysis
Table 4.1 shows the textural parameters for the reference catalyst and aged catalysts. It can be
seen that the textural properties for the two first aging (750ºC_10h and 850ºC_4h) are similar to
those measured for the reference catalyst (750ºC_4h), suggesting that those aging conditions
had nearly no influence on the surface state of the catalyst. Unlike what was expected the
surface area and total pore volume for 850ºC_10h catalyst increased, comparatively to the
reference catalyst. We were expecting, the formation of bigger pores and the decrease of
specific surface¸ due to metal sintering during the aging process.
This result indicates that this aging condition, actually activate the catalyst surface; perhaps due
to the unblocking of pores or due to a phase transformation in the support. Further analysis,
would be necessary to detected if there are changes in the support structures of the catalyst. It’s
important to emphasize that the surface area measured take into account the specific surface of
cordierite, however this surface can be neglected (more or less 1 m2/g).
Table 4.1 -Textural parameters for the reference and aged catalysts.
Sample Surface area (m2/g)
Total pore volume (cm3/g)
Mean pore diameter (nm)
750ºC_4h 53 0,13 9,69
750ºC_10h 52 0,13 9,95
850ºC_4h 51 0,13 10,08
850ºC_10h 83 0,19 9,22

Page 34
CHAPTER 4: RESULTS AND DISCUSSION
4.1.2. TEM analysis (Transmission Electronic Microscopy)
The results of the analysis of the reference catalyst (750ºC_4h) surface by TEM are shown in
figure 4.1; in the center is shown a picture of the reference catalyst and in the upper right corner
a EDS( Energy Dispersive spectroscopy) analysis performed on the zone marked with a white
circle.
Al2O
3
SiO2
EDS 07 b)
Pt/Pd
EDS 03 a)
Al2O
3
Figure 4.1- TEM images of the reference catalyst (750ºC_4h) and at upper right corner an EDS analysis of the zone marked with a white circle.

Page 35
CHAPTER 4: RESULTS AND DISCUSSION
From figure 4.1 one can conclude that the support is predominately composed by aluminum and
silicon. These two elements are presented in the form of oxides: alumina (Al2O3), which is the
main washcoat material and silica (SiO2). Traces of lanthanum was also found, this element in
the form of an oxide (La2O3) is commonly used as a support additive to improved thermal
stability of the support. Silica is also used as a support additive for alumina. Globally was
verified that the affinity of the metal particles for the alumina support is greater than their affinity
for the aluminosilicate support.
Regarding the active components, TEM analysis indicates that the noble metals presented are
palladium and platinum, most likely in bimetallic complex because they appear simultaneously
in all the EDS analysis. Platinum is presented in a large amount, however to know the exact
Pt/Pd proportion an elementary analysis by X-ray fluorescence would be necessary. This
analysis would also provide information concerning the evolution of the noble metals content
with the aging, and if a decrease of this parameter was observed i.e. loss of active phase, one
could conclude that a portion of the precious metal species was entrapped. To ascertain the
oxidation state of metal particles X-ray photoelectron spectroscopy (XPS) would also be
necessary. Cooper was also encountered; its presence was also reported on a previous DOC
study [9]. Additionally a pore distribution study would also be very important, to completely
understand the aging phenomena.
The chemical composition of the catalysts exposed to hydrothermal aging was identical to the
reference catalyst, excluding DOC 850ºC_10h, where the presence of other support elements
(manganese, titanium, magnesium, rhodium and nickel) were detected.
The effect of aging on the surface state of the different catalysts was followed by TEM,
providing information about the distribution and size of the metal particles on the catalyst
surface (figures 4.2 and 4.3).

Page 36
CHAPTER 4: RESULTS AND DISCUSSION
Figure 4.3- Evolution of the particle size distribution with the aging. Av: Average SD: Standard Deviation.
In the figure 4.2a and figure 4.3a one can see that for the reference catalyst (750ºC_4h) the
particle distribution on the catalyst surface is rich and homogeneous, with particles between 5-
35 nm. The histogram of the figure 4.3a indicates that the majority of the particles had a size
between 10-25 nm. These results provide us information about the particle reparation on the
reference catalyst, allowing the study of aging impact on this particle distribution.
Comparing these results, with those obtained for 750ºC_10h, we can observe that the particle
size remained in the same rage, but the particles between 10-20 nm increase their proportion,
which is partly explain by the agglomeration of the particles with the size between 5-10 nm. We
also noticed that the proportion of larger particles decreased, which might be explained due to
the redispersion of particles. Nevertheless, globally we didn’t observe significantly differences in
the particle reparation between the reference catalyst and the 750ºC_10h catalyst (figures 4.2b
and 4.3b). For the 850ºC_4h catalyst (figure 4.3c), the particles size was majority comprised
between 20-35 nm and particles between 35-60 nm, nonexistent on the reference catalyst were
also found. Furthermore, the minimum particle size increased to 10 nm. These results are
explained by the diffusion of the small particles to form other particles with a larger size, a
phenomenon, previously described, called sintering.
Finally, figure 4.3d shows that for 850ºC_10h catalyst the particle distribution continued to
increase, being that the particle size rage was between 15-70 nm, with the majority of the
particle population between 25-40 nm.
Figure 4.2- TEM images for reference and aged catalysts. Influence of aging on the surface of the catalyst.
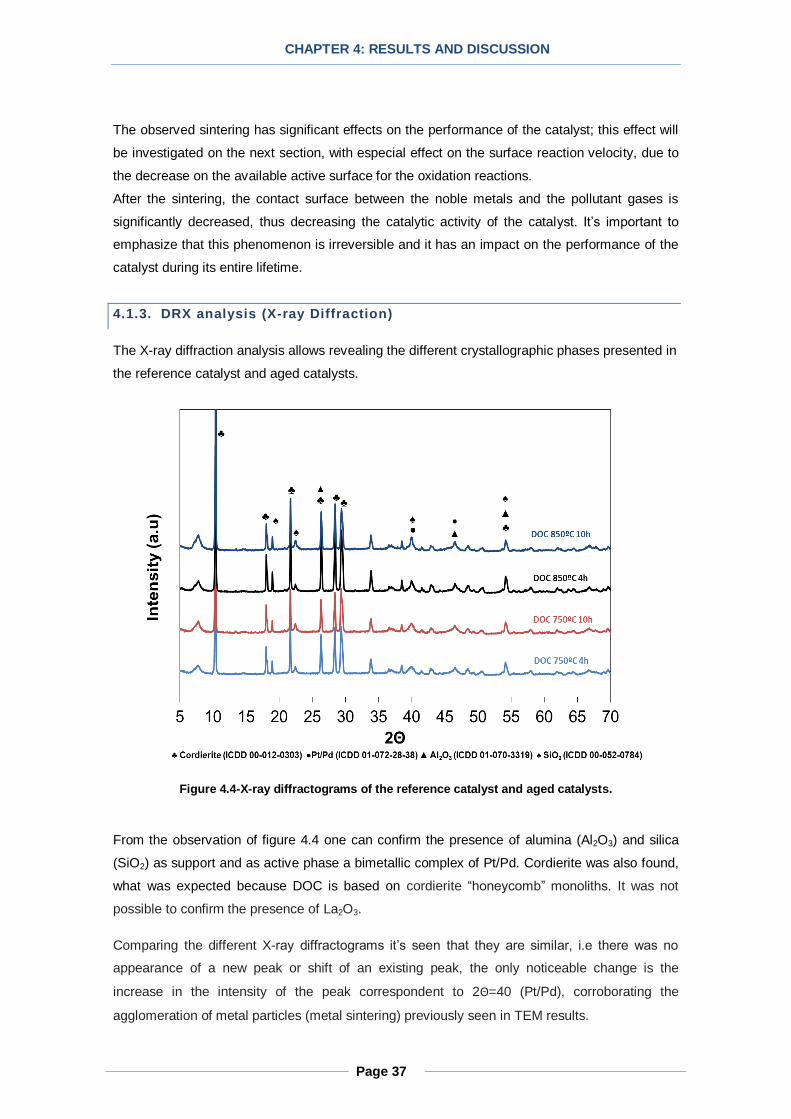
Page 37
CHAPTER 4: RESULTS AND DISCUSSION
The observed sintering has significant effects on the performance of the catalyst; this effect will
be investigated on the next section, with especial effect on the surface reaction velocity, due to
the decrease on the available active surface for the oxidation reactions.
After the sintering, the contact surface between the noble metals and the pollutant gases is
significantly decreased, thus decreasing the catalytic activity of the catalyst. It’s important to
emphasize that this phenomenon is irreversible and it has an impact on the performance of the
catalyst during its entire lifetime.
4.1.3. DRX analysis (X-ray Diffraction)
The X-ray diffraction analysis allows revealing the different crystallographic phases presented in
the reference catalyst and aged catalysts.
Figure 4.4-X-ray diffractograms of the reference catalyst and aged catalysts.
From the observation of figure 4.4 one can confirm the presence of alumina (Al2O3) and silica
(SiO2) as support and as active phase a bimetallic complex of Pt/Pd. Cordierite was also found,
what was expected because DOC is based on cordierite “honeycomb” monoliths. It was not
possible to confirm the presence of La2O3.
Comparing the different X-ray diffractograms it’s seen that they are similar, i.e there was no
appearance of a new peak or shift of an existing peak, the only noticeable change is the
increase in the intensity of the peak correspondent to 2Θ=40 (Pt/Pd), corroborating the
agglomeration of metal particles (metal sintering) previously seen in TEM results.
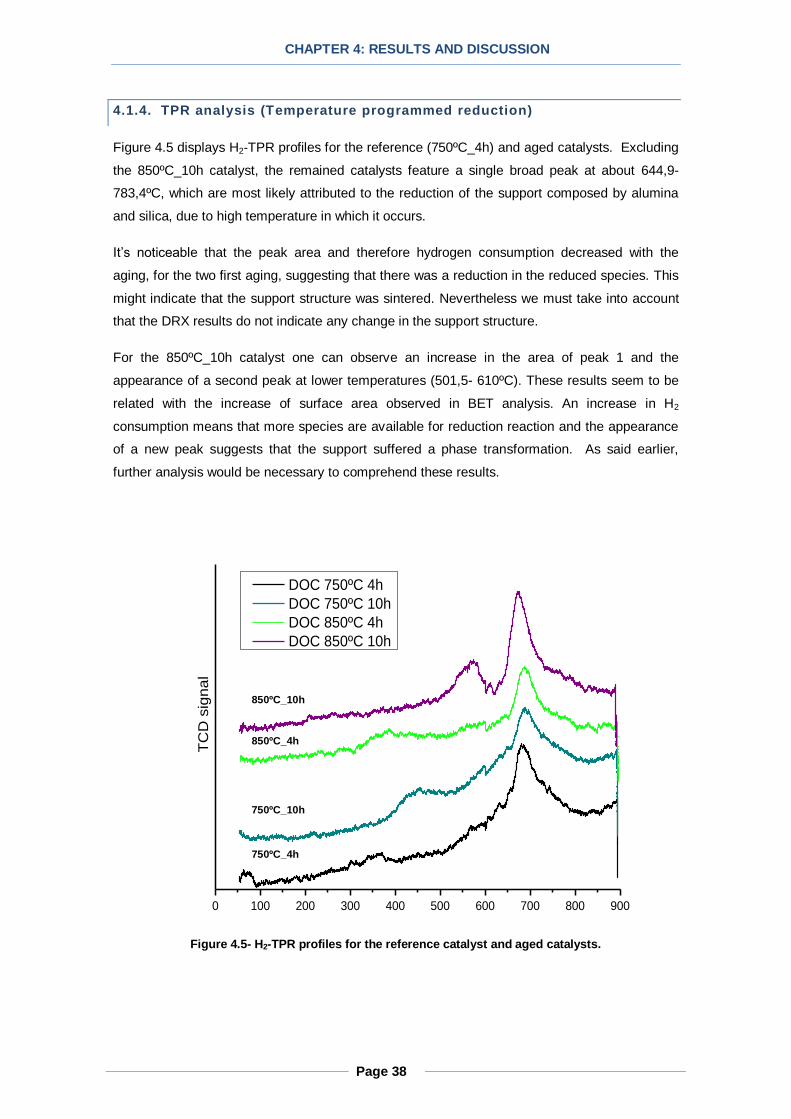
Page 38
CHAPTER 4: RESULTS AND DISCUSSION
4.1.4. TPR analysis (Temperature programmed reduction)
Figure 4.5 displays H2‐TPR profiles for the reference (750ºC_4h) and aged catalysts. Excluding
the 850ºC_10h catalyst, the remained catalysts feature a single broad peak at about 644,9-
783,4ºC, which are most likely attributed to the reduction of the support composed by alumina
and silica, due to high temperature in which it occurs.
It’s noticeable that the peak area and therefore hydrogen consumption decreased with the
aging, for the two first aging, suggesting that there was a reduction in the reduced species. This
might indicate that the support structure was sintered. Nevertheless we must take into account
that the DRX results do not indicate any change in the support structure.
For the 850ºC_10h catalyst one can observe an increase in the area of peak 1 and the
appearance of a second peak at lower temperatures (501,5- 610ºC). These results seem to be
related with the increase of surface area observed in BET analysis. An increase in H2
consumption means that more species are available for reduction reaction and the appearance
of a new peak suggests that the support suffered a phase transformation. As said earlier,
further analysis would be necessary to comprehend these results.
0 100 200 300 400 500 600 700 800 900
TC
D s
ign
al
Temperature(ºC)
DOC 750ºC 4h
DOC 750ºC 10h
DOC 850ºC 4h
DOC 850ºC 10h
Figure 4.5- H2-TPR profiles for the reference catalyst and aged catalysts.
750ºC_4h
750ºC_10h
850ºC_4h
850ºC_10h

Page 39
CHAPTER 4: RESULTS AND DISCUSSION
Table 4.2 - TPR results: temperature and hydrogen consumption of the existent peaks for the reference and aged catalysts.
Peak 1 Peak 2
Sample ΔT (ºC) H2 Consumption
(µmol/g) ΔT (ºC)
H2 Consumption (µmol/g)
750ºC_4h 644,9- 783,4 4,34
750ºC_ 10h 644,9- 783,5 3,24
850ºC_ 4h 644,9- 783,6 3,17
850ºC_10h 644,9- 783,7 6,51 501,5- 610 2,74

Page 40
CHAPTER 4: RESULTS AND DISCUSSION
4.2. Catalytic activ ity essays
4.2.1. DOC performance on NO/CH4 oxidation
The performance of the reference catalyst (750ºC_4h) on the oxidation of CH4 and NO under
lean conditions are presented in figures 4.7 and 4.8, respectively. Methane oxidation conversion
was measurable at approximately 350ºC and reached a maximum of about 16% at the
maximum temperature attained (393ºC), what suggests that higher conversions might have
been attained if the temperature ramp was continued to higher temperatures (Figure 4.7). The
lower methane conversions obtained and the high light-off temperature were expected because
short carbon chain hydrocarbons are more difficult to convert in the catalyst [30]. In the data
shown below, the x-axis temperature is the inlet temperature, thereby avoiding complications
from exothermic generated heat on or in the sample.
Figure 4.6- Essay 1: Methane conversion as function of the catalyst inlet temperature. The feed
stream contained 600 ppmV CH4, 5%V CO2, 10%V O2 and N2 as balance. Results obtained using the
reference catalyst (750ºC_4h).
NO oxidation conversion was measurable around 190ºC, and then it increases continuously
with the temperature until approximately 42%, where it reaches the maximum conversion at
42%. Thereafter the NO conversion decreases, being that, at highest temperature attained
(426ºC) the conversion had dropped to 40% (Figure 4.8).
This behavior was expected since, as mentioned, NO oxidation to NO2 is limited by kinetics at
lower temperatures and by thermodynamics at higher temperatures (reference). Mulla et all. [31]
proposed a mechanism for this reaction, in which the rate for NO and O2 is approximately first
order, but there is an approximately negative first order dependency for NO2.

Page 41
CHAPTER 4: RESULTS AND DISCUSSION
Figure 4.7 – Essay 2: NO conversion as function of the catalyst inlet temperature. The feed stream
contained 300 ppmV NO, 5%V CO2, 10%V O2 and N2 as balance. Results obtained using the
reference catalyst (750ºC_4h).
This product inhibition imposes significant constraints on NO conversion until thermodynamic
limitations are reached, typically above 350ºC [24]. In our case, NO/NO2 equilibrium limitations
were observed above 400ºC.
Figure 4.8 – Essay 2: Concentration of NO, NO2 and NOx (NO+NO2) as function of catalyst inlet
temperature. The feed stream contained 300 ppmV NO, 5%V CO2, 10%V O2 and N2 as balance.
Results obtained using the reference catalyst (750ºC_4h).
NO
NO2
NOx

Page 42
CHAPTER 4: RESULTS AND DISCUSSION
4.2.2. Effect of CO/CH4/NO on CH4/CO/NO oxidation over DOC
As previously mentioned, the purpose of this section is to evaluate the effects of NO and CO on
CH4 oxidation and CH4 and CO on NO oxidation. The light-off curves obtained from essay 1 to
essay 5 are presented on figure 4.10 and figure 4.12.
The CH4 conversions in the presence of CO are plotted in the figure 4.10b), curve named
CH4+NO. It is seen that despite the lower light off temperature (325ºC) the conversion of CH4
across the temperature range between 350ºC and 395ºC is significantly lower, compared to
data obtained for CH4 alone, which indicates that the presence of CO has an inhibition effect on
CH4 oxidation.
Figure 4.9- Methane conversion into CO2 in function of the temperature: a) Essay 1: CH4 (■) b)
Essay 3: CH4+CO (▲) c) Essay 4: CH4+NO (●) d) Essay 5: CH4+CO+NO (♦). Results obtained using
the reference catalyst (750ºC_4h)
Furthermore, from figure 4.11, one can see that CH4 oxidation only began after the
concentration of CO became practically invariable (indicator of the maximum conversion of CO),
thus confirming the CO inhibition effect on CH4 oxidation. This inhibition effect is most likely
explained by the competition between CO and CH4 for Pt/Pd sites and since CO conversion in
the catalyst it’s simpler than the CH4 conversion, the oxidation reaction rate of CO is higher than
the oxidation rate for CH4. Comparing the light-off curves, we can see that while for CO( in the
presence of CH4) the light off temperature was 146ºC, for CH4 ( alone) it was nearly 200ºC
higher(350ºC).

Page 43
CHAPTER 4: RESULTS AND DISCUSSION
It is noteworthy that, although we haven’t done an essay where we studied only the oxidation of
CO, we are almost certain that the results wouldn’t be significantly different from those obtained
for CO+CH4.
Figure 4.10- Essay 2: CO concentration (●); CH4 concentration (♦); Light-off curve of methane (■);
Light-off curve of CO (▲). Results obtained using the reference catalyst (750ºC_4h).
The effect of NO in CH4 is shown in figure 4.10c) namely in the curve CH4+NO. The data show
that the addition of NO resulted in a significant increase in the measured CH4 conversions to
CO2.
Figure 4.11- NO conversion into NO2 in function of the temperature: a) Essay 2: NO(■);b) Essay 4:
NO+CH4 (●); c) Essay 5: CH4+NO+CO (♦) Results obtained using the reference catalyst (750ºC_4h).
+CO

Page 44
CHAPTER 4: RESULTS AND DISCUSSION
The temperature for 16% of conversion of CH4 in Essay 4 decreased 58ºC in comparison with
the same in Essay 1, and a maximum conversion of 40% at 416-417ºC was observed.
Furthermore it caused the methane light-off curve to shift to lower temperatures (287-292ºC).
In parallel the effect of CH4 in NO oxidation is shown in figure 4.12b). One can see, that
although the addition of CH4 accelerates the NO oxidation reaction (the light-off occurs 59ºC
earlier), compared to NO alone, after 300ºC the light-off curve for NO in the presence of
methane was below the curve with NO alone, meaning that CH4 is inhibiting NO oxidation.
The explanation for both behaviors may be that NO2, a product of NO oxidation, is being
consumed as an oxidant in CH4 oxidation reaction, resulting in the appearance of NO oxidation
inhibition and hence in an increase of CH4 conversions. A proposed reaction mechanism for this
essay is presented hereafter:
)4.4(22:
)3.4(22
)2.4(22
)1.4(22
22224
22224
22
2224
OHNCOONOCHGlobally
OHNCONOCH
NOONO
OHCOOCH
Reaction 4.4. is called selective catalytic reduction (SCR). The SCR of NO by hydrocarbons has
been extensively reported in the literature over a variety of catalysts since the reaction was first
reported in 1990 In addition, the partial reduction of some NO to N2O may also occur, which is
an undesirable reaction because N2O is a strong greenhouse gas, and also leads to formation
of NO in the upper atmosphere [29].
)5.4(22
32 22224 OHONCOONOCH
We can also potentially have the reaction between NO2 and methane to form NO:
)6.4(22
322224 COOHNOONOCH
In a study [24] concerning the effect of HC species on NO oxidation over DOC, investigators
evaluated the efficiency of NO2 as an oxidant relative to O2 and concluded that even with high
levels of O2, almost all of NO2 was consumed in detriment to O2; in other words, NO2 was being
consumed preferentially in relation to the O2.

Page 45
CHAPTER 4: RESULTS AND DISCUSSION
The relation between NO2 reduction and CH4 oxidation is especially evident in figure 4.13. The
temperature range in which the NO2 measured in Essay 4 (NO+CH4) became lower than the
amount of NO2 measured in Essay 2 (NO), meaning a consumption of NO2, corresponds to the
temperature range in which the light-off for methane occurred.
Figure 4.12- Essay 2: Concentration of NO and NO2 in function of the temperature. Essay 4:
Concentration of NO and NO2 in function of the temperature and light-off curve methane. Results
obtained using the reference catalyst (750ºC_4h).
From detailed observation of the CH4 light-off curve for essay 4 (figure 4.10c), one can
distinguish two regions in the temperature range between 283ºC and 417ºC: one that starts at
the light-off temperature (283ºC) and goes until the curve inflection (344ºC) and a second
section starting at that point and going until the temperature corresponding at the maximum
conversion (417ºC).
There was a noticeable change in slope between the two regions: in the first region the slope
was steeper than in the second one, in other words the CH4 oxidation improvement effect
diminished as the temperature increased. This might be explained due to a switch between NO2
and O2 as an oxidant, i.e. increase of methane reaction with O2, which is in significantly higher
amounts. This also suggests that the curve inflection marks the temperature in which the switch
occurred.
CH
4 ox
ida
tion
into
CO
2

Page 46
CHAPTER 4: RESULTS AND DISCUSSION
In Figure 4.10d) the combined effect of CO and NO on CH4 oxidation is also presented.
Comparing the CH4 oxidation in the presence of NO and CO (essay 5) with the same, but only
in the presence of NO (essay 4), it’s perceptible that while the behavior of the both light-off
curves was nearly identical, being that even the curve inflection and the maximum conversion
occurred in the same temperature range, the slope between the light-off and the curve inflection
was more pronounced for the ignition curve in the presence of CO and NO, resulting thus in an
improvement in methane oxidation.
The maximum methane conversion was 57%, compared with 40% obtained in the essay 4:
CH4+NO. Furthermore the methane light-off curve for essay 5 was shifted to the left, relatively to
essay 4: CH4+NO.
Given that, as previously discussed, CO has an inhibition effect on methane, the improvement
in CH4 oxidation in the presence of NO and CO it’s most likely explained due to the effect of CO
on NO oxidation, which might be somehow related to the slope increase of the region between
light-off and the curve inflection and as mentioned before with the switch between oxidants.
On the contrary, the combined effect of CH4 and CO led to a further decrease in NO oxidation
(figure 4.12c), relatively to what was seen in the essay 4: CH4+NO. Moreover, the addition of
CH4 and CO caused NO light-off to occur at higher temperature. The reason for this behavior
it’s not clear, and further essays would be necessary to fully understand it, namely an essay to
study the effect of CO in NO oxidation and essays to evaluate the efficiency of CO2 as an
oxidant relatively to oxygen, to validate the reaction mechanism proposed below.
)10.4(22
1:
)9.4(22
)8.4(
)7.4(2
1
222224
22224
22
22
OHNCONONOOCHGlobally
OHNCONOCH
CONONOCO
COOCO
Moreover, from the obtained results, one can also concluded that NO has an slightly inhibition
effect on CO oxidation, given that the addition of CO and CH4 caused a delay in CO oxidation
light-off, resulting in less conversion across the entire temperature range, in comparison with
the essay CH4+CO. Nevertheless, it’s important to emphasize that the differences in light-off
temperature(less than 10ºC) and maximum conversion(less than 3%) between the two essays
are negligible.

Page 47
CHAPTER 4: RESULTS AND DISCUSSION
4.2.3. Effect of aging on CH4/NO/CO oxidation over DOC
Figures 4.14 and 4.15 show the influence of aging on DOC performance on the oxidation of NO
and CH4 for essay 1, essay 2 and essay 5. It was chosen not to show the results for all the
essays, because the aging effect is similar to those presented hereafter.
For methane, the results for essay 5 show a shift on the light-off curve towards higher
temperatures(approximately 40ºC) , however this had little impact on the methane conversions
obtained; we obtained the same conversions but at higher temperatures. Furthermore the gap
between both curves remained stable. For essay 1, despite the fact that the light-off for the
aged catalyst occurred sooner (20ºC sooner), the catalytic performance of the reference
catalyst was superior to the aged catalyst. These results were expected, nevertheless the
decrease of the catalytic activity was not significant, which means, that the catalyst has
excellent age resistance. Therefore, more drastic aging conditions (i.e. using the 850ºC_10h
catalyst) would be necessary to observe a significant change in the catalyst performance after
hydrothermal aging.
Figure 4.13-Comparison of the methane light-off curves obtained using the reference catalyst (750ºC_4h) and the aged catalyst (850ºC_4h) for essay 1 and essay 5.
On the contrary, the aging improved the NO oxidation reaction until 364ºC; comparatively to the
reference catalyst, but after this temperature the light-off curve for the aged catalyst remained
below the light-off curve for the reference catalyst. Furthermore, the light-off temperature for the
aged catalyst was 70ºC lower than for the reference catalyst and superior conversions were
obtained with the aged catalyst until 364ºC.

Page 48
CHAPTER 4: RESULTS AND DISCUSSION
The improvement of the NO oxidation performance with the aging was also reported in a
previous study where the authors explained that activity of the catalyst for NO oxidation
depends on the size of the Pt particle, where NO oxidation is better with larger particle size.
Additionally the authors reported that this has been observed with Pt supported on Al2O3, SiO2,
and TiO2, and suggests that some amount of thermal aging may actually improve NO oxidation
performance [24]. For essay 5 similar results were obtained with the exception of the light-off
temperature that occurred in the same temperature range for the reference and the aged
catalyst. For CO, the light-off occurred in the same temperature range for both catalysts,
however a decrease between 10-20% in the conversion was observed in the aged catalyst,
relatively to the reference catalyst.
Additionally the aging had no effect on the interactions between the different species observed
in the section 4.2.2.
Figure 4.14- Comparison of the NO light-off curves obtained using the reference catalyst (750ºC_4h) and the aged catalyst (850ºC_4h) for essay 1 and essay 5.

Page 49
CHAPTER 5: CONCLUSIONS
5. Chapter 5: Conclusions
This work was carried out in the Jean Le Rond d’ Alembert Institute of Pierre and Marie Curie
University, in cooperation with Continental with the purpose of researching the effect of
hydrothermal aging on the reactivity and structure of a commercial Diesel Oxidation Catalyst
(DOC).
Being the first component exposed to “fresh” diesel exhaust, the DOC experiences more
damage than downstream components and besides that increasingly stringed regulations for
diesel engine emission have a significant impact on the conditions of operation of DOC.
Measures to reduce engine-out NOx and PM, tend to increase CO and HC emissions.
Additionally, engine-out NOx reduction is mainly achieved through high amounts of exhaust gas
recirculation (EGR) that lower the combustion temperature. All of this, have an impact on the
required efficiency of DOC, which has to convert more pollutants at lower temperatures
Lowered DOC oxidation efficiency due to thermal aging effects can lead to reduced NO2
formation. This potentially influences the efficiency of the exhaust aftertreatment systems
downstream of the DOC, including the diesel particulate filter, the NOx storage reduction
catalyst, and the selective reduction catalyst.
As mentioned, in this study a commercial catalyst was used, which means that available
information about its composition is reduced. For this reason, several characterization
techniques were used to identify the physicochemical composition of those catalytic materials,
as well as to investigate the effect of the hydrothermal aging on the surface of the catalyst.
Furthermore, a correlation between the evolution of the catalyst surface morphology and its
catalytic performance, namely in the oxidation of hydrocarbons and NO, after the aging was
performed along with the estimation of the interactions effects between the different exhaust
gases.
Different structural characterization techniques were performed: textural and morphological
proprieties were analyzed by BET and TEM, the characterization of the presented
crystallographic phases was performed by DRX and the determination of the number of
reducible species was possible by TPR. The characterization of the catalytic performance was
carried out on a synthetic gas bench using carrots catalyst under conditions close to the realistic
conditions i.e. using a synthetic gas mixture, representative of the exhaust gases from diesel
engines, having into account , however the limitations of the apparatus( flows, pressures
,temperatures).

Page 50
CHAPTER 5: CONCLUSIONS
From TEM and DRX results, we conclude that the catalyst support is predominately composed
by aluminum and silicon, presented in the form of oxides: alumina (Al2O3), which is the main
washcoat material and silica (SiO2) and that, as active components we have a bimetallic
complex of palladium and platinum. Globally it was verified that the affinity of the metal particles
for the alumina support is greater than their affinity for the aluminosilicate support. TEM results
also shown, an increase of the metal particle size with the aging caused by the agglomeration of
metal particles, revealing the presence of metal sintering. DRX results suggest the presence of
support sintering, nevertheless further analysis would be necessary to prove that. Furthermore,
DRX and BET results unexpectedly reveal that the most drastic aging conditions used actually
activated the catalyst surface, due to the increase on the available active surface for the
oxidation reactions, suggesting an increase in catalytic activity.
From the catalytic activity essays one can conclude that CO has an inhibition effect on methane
oxidation, probably due to the competition between CO and CH4 for Pt/Pd sites. Moreover the
presence of NO affects positively methane oxidation conversions, while the presence of
methane inhibits the NO oxidation. The explanation for both behaviors may be that NO2, a
product of NO oxidation, is being consumed as an oxidant in CH4 oxidation reaction, resulting in
the appearance of NO oxidation inhibition and hence in an increase of CH4 conversions.
Additionally a relation between the change of slope of the methane light-off curve and the switch
between NO2 and O2 as an oxidant may have been established. The combined effect of CH4
and CO led to a further decrease in NO oxidation, for reasons that are not clear. In parallel, the
presence of CH4 and NO improved the CH4 oxidation conversions, explicable for reasons that
seem to be related with the switch between NO2 and O2 as an oxidant.
By comparing the light-off curves from the same essays, but using the reference catalyst and
the aged catalyst we conclude that the difference between the results for both catalysts,
although expected, were not significant which means, that the catalyst has excellent age
resistance. Therefore, more drastic aging conditions would be necessary to observe a
significant change in the catalyst performance after hydrothermal aging. As expected, the aging
affected negatively the catalyst performance on the oxidation of methane and CO, however an
improvement of the NO oxidation performance with the aging was observed. Explainable by the
fact that the activity of the catalyst for NO oxidation depends on the size of the Pt particle, being
that oxidation is better with larger particle size.

Page 51
CHAPTER 6: PERSPECTIVES
6. Chapter 6: Perspectives
Further work will focus in tree major areas:
Better comprehension of the effect of aging on the structure of DOC, namely understand if
support sintering takes place, through for example, a surface-sensitive quantitative
spectroscopic technique - XPS (X-ray photoelectron spectroscopy) analysis and perhaps
elementary analysis, to evaluate if a decrease of either aluminum or silicon, the two main
components of the support occurs. A pore size distribution study would also be necessary.
Obtain more significant differences between the aged and the reference catalysts, and for
that we have to use a catalyst aged at more severe conditions (850ºC_10h).
Better understanding of the mechanism behind the observed effect of methane and CO on
NO oxidation, for that an essay with NO in the presence of CO should be done. Additionally
the effect of NO2 should be studied, because it perhaps could clarify some aspects related
with that mechanism.

Page 52
CHAPTER 6: PERSPECTIVES

Page 53
BIBLIOGRAPHY
Bibliography
[1] A. Russel e W. Epling , “Diesel Oxidation Catalysts,” Catalysis Reviews: Science and
Engineering, 2011.
[2] E. Lox, D. Lindner, T. Kreuzer e J. Leyrer, “Advanced exhaust gas aftertreatment systems
for gasoline and diesel fuelled vehicles,” Catalysis today, 1996.
[3] Wards Auto, “World Vehicle Population Tops 1 Billion Units,” [Online]. Available:
http://wardsauto.com/ar/world_vehicle_population_110815. [Acesso em March 2014].
[4] International Organization of Motor Vehicle Manufactures(OICA), “World motor vehicle
production by country and type”.
[5] F. Haab e H. Fuess, “Structural Characterization of Automotive Catalysts,” Advanced
Engineering Materials, 2005.
[6] “Lubrizol,” [Online]. Available:
https://www.lubrizol.com/EngineOilAdditives/ACEA/ReferenceMaterial/EuropeanUnionEmi
ssionsStandards.html. [Acesso em 2 March 2014].
[7] S. Yea, Y. H. Yapb, S. T. Kolaczkowskib, K. Robinsona e D. Lukyanovb, “Catalyst ‘light-off’
experiments on a diesel oxidation,” Chemical Engineering Research and Design, 2012.
[8] H. Dieter Harder, M. Brugger e R. Bruck, “Future SCR NOx after treatment systems for
Euro 6”.
[9] A. Manigrasso, “Thèse de doctorat: Modélisations et études de l'impact des évolutions
technologiques et normatives sur la catalyse de dépollution Diesel,” 2013.
[10] R. Heck e R. Farrauto, “Automobile exhaust catalysts,” Applied Catalysis A: General,
2001.
[11] The international Council on Clean Transportation, “European Vehicle Market
Statistics,” 2013.
[12] M. Votsmeir, T. Kreuzer e G. Lepperhoff, “Automobile exhaust control”.
[13] M. Votsmeier, T. Kreuzer e G. Lepperhoff, “Automobile exhaust control,” Wiley-VCH
Verlag GmbH & Co. KGaA, 2005.
[14] S. Raux, A. Frobert e E. Jeudy, “Low temperature activity of Euro4 diesel oxidation
catalysts: comprehensive material analyses and experimental evaluation of a
representative panel,” Topics in Catalysis , 2009.
[15] H. Gandhi, G. Graham e R. McCabe, “Automotive exhaust catalysis,” Journal of catalysis,
2003.
[16] C. Bartholomew, “Mechanisms of catalysts deactivation,” Applied Catalysis A, 2001.
[17] O. Shakir, A. Yezerets, N. W. Currier e W. S. Epling, “Spatially resolving concentration and
temperature gradients during,” Applied Catalysis A: General , 2009.
[18] A. Russel, W. S. Epling, H. Hess, H.-Y. Chen, C. Henry, N. Currier e A. Yezerets,
“Spatially-Resolved Temperature and Gas Species Changes in a Lean-Burn Engine,” Ind.
Eng. Chem. Res., 2010.
[19] A. Winkler, D. Ferri e M. Aguirre, “The influence of chemical and thermal aging on the
catalytic activity of monolithic diesel oxidation catalyst,” Applied Catalysis B:
Environmental, 2009.
[20] A. K. Neyestanaki, F. Klingstedt, T. Salmi e Y. D. Murzin, “Deactivation of postcombustion
catalysts, a review,” Fuel First, 2004.

Page 54
BIBLIOGRAPHY
[21] R. Burch e F. Urbano, “Investigation of the Active State of Supported Palladium Catalysts
in the Combustion of Methane,” Applied Catalyses A: General, vol. 124, pp. 121-138,
1995.
[22] V. Kroger, T. Kanerva, U. Lassi, K. Rahkamaa-Tolonen, T. Lepisto e R. Keiski,
“Phosphorus Poisoning of ZSM-5 and Pt/ZSM-5 Zeolite Catalysts in Diesel Exhaust Gas
Conditions,” Topic in Catalysis , pp. 42–43 (1–4), 433–436., 2007.
[23] M. Khosravi, A. Abedi, R. Hayes, W. Epling e M. Votsmeir, “Kinetic modelling of Pt and
Pt:Pd Diesel oxidation catalysts,” Applied Catalysis B: Environmental, 2014.
[24] K. Irani, W. S. Epling e R. Blint, “Effect of hydrocarbon species on no oxidation over diesel
oxidation catalysts,” Applied Catalysis B: Environmental, 2009.
[25] S. Katare, J. Patterson e P. Laing, “Aged DOC is a net consumer of NO2: analysis of
vehicle engine dynamometer and reactor data,” SAE Techical Papers , 2007.
[26] Kim, Young-Deuk; Jeong, Soo-Jing; Kim, Woo-Seung, “Optimal design of axial noble metal
distribution for improving dual monolithic,” Chemical Engineering Science, 2009.
[27] V. Cominos e A. Gavriilidis, “Theoretical investigation of axially non-uniform catalytic
monoliths for methane combustion,” Chemical Engineering Science, vol. 56, pp. 3455-
3468, 2001.
[28] S. Oh e J. Cavendish, “Transients of monolithic catalytic converters: response to step
changes in feed stream temperature as related to controlling automobile emissions,”
Industrial and Engineering Chemistry Product Research and Development , vol. 21, p. 29–
37., 1982.
[29] V. Khanaev, E. Borisova e A. Noskov, “Optimization of the active component distribution
through the catalyst bed for the case of adiabatic reactor,” Chemical Engineering Science,
vol. 60, pp. 5792-5802, 2005.
[30] N. T. Inc., “http://www.nettinc.com/information/emissions-faq/how-does-an-oxidation-
catalyst-work,” [Online]. [Acesso em 09 2014].
[31] N. C. L. C. G. B. D. Z. W. D. W. E. F. R. S.S. Mulla, “Reaction of NO and O"2 to NO"2 on
Pt: Kinetics and catalyst deactivation,” Journal of Catalysis , vol. 241 , pp. 389-399, 2006.
[32] R. Farrauto, M. Hobson, T. Kenely e E. Waterman, “Catalytic chemistry of supported
palladium for combustion,” Applied Catalysis A: General, 1991.
[33] A. Manigrasso, N. Fouchal e P. Da Costa, “Hysteresis study on diesel oxidation for better
efficiency of SCR systems,” Catalysis Today, 2012.
[34] M.Khosravi, C.Sola, A.Abedi, R.E.Hayes, W.S.Epling e M.Votsmeir, “Oxidation and
selective catalytic reduction of NO by propene over Ptand Pt:Pd diesel oxidation catalysts,”
Applied Catalysis B: Environmental, vol. 147, pp. 264-274, 2014.