agence internationale de l’energieinternational energy agency h2 policy analysis using the etp...
TRANSCRIPT

AGENCE INTERNATIONALE DE L’ENERGIEINTERNATIONAL ENERGY AGENCY
H2 Policy Analysis using the ETP model
Dolf Gielen Giorgio Simbolotti
IPHE Task Force on Socio-Economics, Paris, 30 June 2005

INTERNATIONAL ENERGY AGENCY AGENCE INTERNATIONALE DE L’ENERGIE
Key pointsHydrogen may play a significant role by 2050This will require R&D successes and cost
reductionFCV cost constitute a key issue for a
hydrogen transitionTotal incremental investment cost till 2050
1.7-3.5 trillion USDThe environmental & supply security benefits
could be substantial, but require policies and technology advance
Competing options may also play a key role

INTERNATIONAL ENERGY AGENCY AGENCE INTERNATIONALE DE L’ENERGIE
Presentation Overview
Technology input data Investment analysis Baseline scenarios Sensitivity analysis Observations

AGENCE INTERNATIONALE DE L’ENERGIEINTERNATIONAL ENERGY AGENCY
Part 1: Technology input data

INTERNATIONAL ENERGY AGENCY AGENCE INTERNATIONALE DE L’ENERGIE
Technology typesProduction
CentralizedDecentralized
DistributionRefueling stationsVehicles
Fuel cellOn-board storage
INTERNATIONAL ENERGY AGENCY AGENCE INTERNATIONALE DE L’ENERGIE
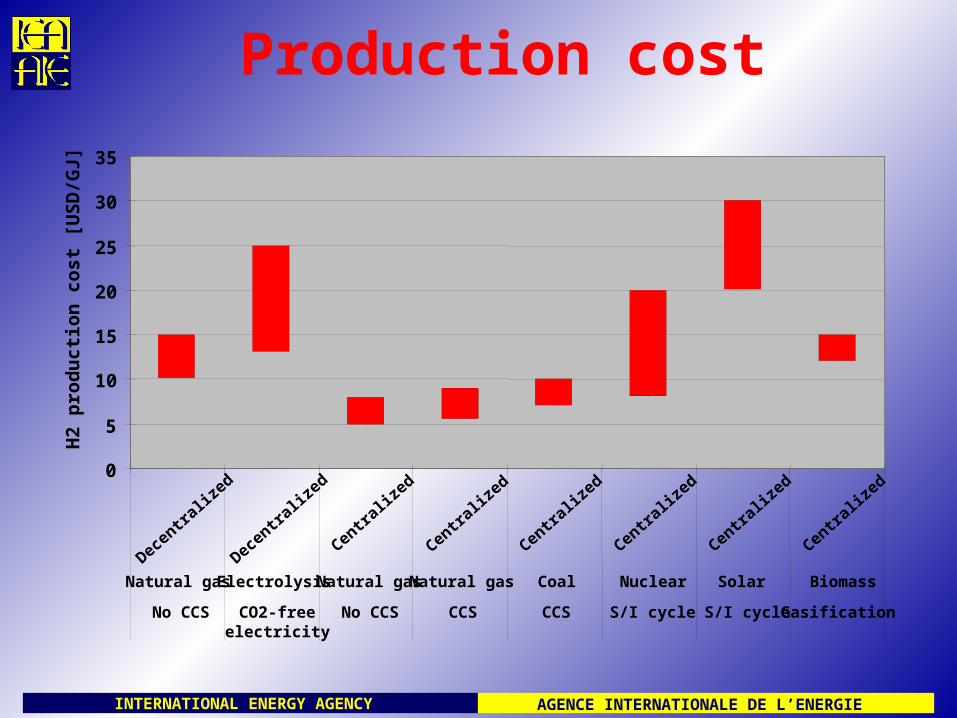
Production cost
0
5
10
15
20
25
30
35
Decentraliz
ed
Decentraliz
ed
Centraliz
ed
Centraliz
ed
Centraliz
ed
Centraliz
ed
Centraliz
ed
Centraliz
ed
Natural gas Electrolysis Natural gas Natural gas Coal Nuclear Solar Biomass
No CCS CO2-freeelectricity
No CCS CCS CCS S/I cycle S/I cycle Gasification
H2
pro
du
cti
on
co
st [
US
D/G
J]

INTERNATIONAL ENERGY AGENCY AGENCE INTERNATIONALE DE L’ENERGIE
H2 transportation cost
Pipelines constitute the only viable transportation mode
Some hydrogen (up to 9% e/e) can be mixed into natural gas in existing pipelines
New pipelines will be needed
Transportation cost six times those for natural gas
0.5-1 trillion USD for refuelling station supply, 5 trillion for all stationary gas users

INTERNATIONAL ENERGY AGENCY AGENCE INTERNATIONALE DE L’ENERGIE
Distribution and refueling cost
Distribution (pipeline/LH2) adds 2 USD/GJ delivered
Liquefaction: 7-10 USD/GJ H2 delivered
Refuelling station cost 3-6 USD/GJ H2 delivered (incl. pressurization, excl. decentralized production cost)

INTERNATIONAL ENERGY AGENCY AGENCE INTERNATIONALE DE L’ENERGIE
Hydrogen vehicles
EnginesHydrogen hybridsHydrogen FCVs
On-board storageGaseous 700 barGaseous 350 barLiquidMetal hydridesOther

INTERNATIONAL ENERGY AGENCY AGENCE INTERNATIONALE DE L’ENERGIE
Fuel cellsPresent cost 2000 USD/kW<50 USD/kW neededProton Exchange Membrane Fuel Cells (PEMFC)Current technology: Nafion membrane, Pt/C
catalystSignificant cost reduction possible (mass
production), but less than 100 USD/kW seems not likely with current materials
New catalyst alloys needed, or HT-membranes New materials may offer cost reduction potential

INTERNATIONAL ENERGY AGENCY AGENCE INTERNATIONALE DE L’ENERGIE
Future Cost Structure (2020)50% higher power density, 10 times cheaper
membranes, more than 50,000 cars/y (engines)
Cost Cost Share
[USD/m2] [USD/kW] [%]
Membrane 50 17 16
Electrode 150 50 49
Bipolar plates 91 30 29
Platinum catalyst 8 3 3
Peripherals 4 1 1
Assembly 2 2
Total 103 100
This is still too costly !!!

INTERNATIONAL ENERGY AGENCY AGENCE INTERNATIONALE DE L’ENERGIE
Further cost reductione.g. through higher power density
Factor 2 gain100 → 50 USD/kW
Present0
0.02
0.04
0.06
0.08
0.1
0.12
0.14
0.16
0.18
0 2 4 6 8
Power [kW/m2]
Sta
ck
po
wer
del
iver
y co
st [
US
D/k
Wh
]
Stack 66 USD/kW
Stack 50 USD/kW due tobetter membrane
- Higher power density gives lower efficiency- Higher power density gives lower stack cost- Therefore a balancing of fuel & stack cost needed
Long termShort term
INTERNATIONAL ENERGY AGENCY AGENCE INTERNATIONALE DE L’ENERGIE
H2 onboard storage
Gaseous 700 Bar seems the technology of choice for cars (350 bar for buses &vans)
4-5 kg storage needed/car (450-500 km)Present cost: 3300 USD/kgPresent mass production: 400-500 USD/kgAssumed 150 USD/kg by 2025Pressurization (1-800 bar) takes 14% energy
content (GJe/GJ H2) (assumed 10%, higher starting pressure)
Other storage systems may succeed, but they are still far away from commercialization

INTERNATIONAL ENERGY AGENCY AGENCE INTERNATIONALE DE L’ENERGIE
H2 production
Comparison on GJ-basis is deceptive, as FCV efficiency is 2.5 times current ICE efficiency
H2 can be supplied at 15-20 USD/GJ (2020-2030)
Fuel cost (ex tax)/km about the same as current gasoline vehicles

AGENCE INTERNATIONALE DE L’ENERGIEINTERNATIONAL ENERGY AGENCY
Part 2: Investment analysis

INTERNATIONAL ENERGY AGENCY AGENCE INTERNATIONALE DE L’ENERGIE
Assumed FC stack cost reduction35 USD/kW stack; 10 USD/kW storage; 15
USD/kW drive system
10
100
1000
10000
2000 2010 2020 2030 2040 2050
[US
D/k
W] GLO50
SensitivityAnalysis

INTERNATIONAL ENERGY AGENCY AGENCE INTERNATIONALE DE L’ENERGIE
FCVs: USD 1- 2.3 tr. incremental cost
2010 2015 2020 2030 2040 2050
Assumptions Used in Both Cases
Cumulative FCV Production, OECD (millions) 0.00 0.04 0.21 8.4 133.3 502.4
Cumulative FCV Production, World (millions) 0.00 0.04 0.22 8.6 143.7 727.5
FCV Share of Sales, OECD 0.0% 0.1% 0.2% 5.0% 50.0% 100.0%
FCV Share of total vehicle stock, OECD 0.0% 0.0% 0.1% 2.2% 13.1% 31.0%
Optimistic Case Results
FCV drive system cost, optimistic case (0.78 progress ratio) [USD/kW] 545 207 134 69 54 50
Total incremental cost of FCV, cumulative (bln USD) 0.1 0.6 2.1 27 244 965
Pessimistic Case Results
FCV cost drive system, pessimistic case (0.85 progress ratio) 545 284 207 114 81 69
Total incremental cost of FCV, cumulative (bln USD) 0.1 0.9 3.4 60 585 2,264

INTERNATIONAL ENERGY AGENCY AGENCE INTERNATIONALE DE L’ENERGIE
Incremental investment needsExcludes centralized production processes
FCVs: 1-2.3 trillion USD
Distribution: 0- 1 trillion USD
Refueling infrastructure: 0.2-0.7 tr. USD
Total: 1.7-3.5 trillion USD
Total GDP 2000-2050: 4,500 trillion USD
Therefore 0.03-0.1% of GDP

AGENCE INTERNATIONALE DE L’ENERGIEINTERNATIONAL ENERGY AGENCY
Part 3: Baseline scenarios

INTERNATIONAL ENERGY AGENCY AGENCE INTERNATIONALE DE L’ENERGIE
Why model analysis?
Account for competing options (e.g. biofuels)
Account for competing use of resources (e.g. electricity from renewables)
Account for regional differences (resource endowment, capital availability, car use etc.)
Quantify the relevance of H2 & FC on a global/regional level
Map uncertainties
Quantify the cost and specify additional policy requirements

INTERNATIONAL ENERGY AGENCY AGENCE INTERNATIONALE DE L’ENERGIE
Hydrogen model structure
Electrolysis at fuel station
(3 types)
Natural gas pipeline
Pyrolysis/Gasifier/
Reformer plantFuture Gen
Heating/cooking
Coke Ovens
ICE mobile applications
Refinery/NH3 etc.H2 storage
Natural gas
Fuel oilCoal
Biological/Direct solar
Liquef. + H2 truck
Natural gas
Biomass
Fuel cell mobile applications
ICE mobile applications
Industry MCFC/SOFC
10%
Ren. ele
Fossil+CCS
Res/Com MCFC/PEM FC/
SOFC
Reformer at fuel station
Renewables
LH2 storage
H2 distrib.
Solar SI cycleNuclear
CO2 removal
H2 pipeline
H2 gas storage 350 bar
H2 gas storage 700 bar
MeH2 storageNuclear

INTERNATIONAL ENERGY AGENCY AGENCE INTERNATIONALE DE L’ENERGIE
Structure of the analysis, so far
BASE scenario: no CO2 policies
GLO50 scenario: CO2 policies plus reasonable assumptions for H2/FC
GLO50 w/o H2/FC: what are the benefits on a systems level
Sensitivity analysis: individual parameter variations for GLO50

INTERNATIONAL ENERGY AGENCY AGENCE INTERNATIONALE DE L’ENERGIE
GLO50(reference)
21 model runs
ESTEC+++++
ESTEC-----
ESTEC++---
ESTEC+--+-
GLO50 w/o H2 & FC
BASEw&w/o
H2 & FC
GLO25w&w/o
H2 & FC
GLO50w&w/o
H2 & FC
BASE
Fuel Market Analysis
H2&FC Benefits Analysis
Scenario Analysis + Regional Results
H2&FC Potentials Analysis
Sensitivity Analysis
GLO50
how robust are H2 & FC results
H2 & FC supply security benefits
H2 & FC CO2&monetarybenefits
DRAFTREPORT
what are the key assumptions
INTERNATIONAL ENERGY AGENCY AGENCE INTERNATIONALE DE L’ENERGIE
Assumptions GLO50 (+range)50 USD/t CO2 incentive (0-100 USD/t)Fuel cell system 65 USD/kW (65-105)Same kW for ICE and FCV (80-100%)Oil price 2030 29 USD/bbl, slowly rising (29-35
USD/bbl) (WEO 2004)Biomass potential rising to 200 EJ/yr by 2050
(100-200 EJ)No transition issues (infrastructure transition
considered yes/no)Discount rates transport 3-12% (3-18%)Alternative fuel taxes rise to 75% of gasoline
tax (75-100%)

INTERNATIONAL ENERGY AGENCY AGENCE INTERNATIONALE DE L’ENERGIE
CO2 price A gradual rise to 50 USD/t

INTERNATIONAL ENERGY AGENCY AGENCE INTERNATIONALE DE L’ENERGIE
CO2 emissions: 50 USD/t CO2 = Emissions Stabilization
0
10
20
30
40
50
60
70
1970 1980 1990 2000 2010 2020 2030 2040 2050
[Gt
CO
2/y
r]
Base
GLO50
Statistics

INTERNATIONAL ENERGY AGENCY AGENCE INTERNATIONALE DE L’ENERGIE
Transport fuels
Total oil products
Hydrogen
CNG
Methanol/DME
FT fuels coal
FT fuels natural gas
Other biofuels
Ethanol
FT fuels biomass
Refinery products non-conventional oil
Refinery products conventional oil
ETP results
0
20
40
60
80
100
120
140
160
180
200
2002
WEO R
S 203
0
WBCSD 2
050
BASE, 205
0 (H
DR)
GLO50, 2
050
(HDR)
GLO50, 2
050
[EJ/
yr]

INTERNATIONAL ENERGY AGENCY AGENCE INTERNATIONALE DE L’ENERGIE
Key insights
No CO2 policy: more than a doubling in fuel use; 2/3 oil products; 1/3 alternative fuels
CO2 policy: 1/3 oil products, 1/3 biofuels, 1/10 H2; 30% efficiency gains
1/10 hydrogen replaces 2 times as much oil products (27% H2 FCV by 2050)

INTERNATIONAL ENERGY AGENCY AGENCE INTERNATIONALE DE L’ENERGIE
Transport CO2 emissions(WTW) -50% in 2050 but still rising
0
5
10
15
20
2000 2010 2020 2030 2040 2050
[Gt
CO
2/y
r]
BASE
GLO50

INTERNATIONAL ENERGY AGENCY AGENCE INTERNATIONALE DE L’ENERGIE
Key emission reductions
Globally 32 Gt CO2 reduction in 2050
Transport (WTW) 8.5 Gt CO2 reduction in 2050:Biofuels: 1.5 GtCCS: 2 Gt (alternative fuels production) (+1.9 Gt
H2 production)
Substitution effect H2 use: 1 Gt due to H2 use
Efficiency: 4 Gt (including 1 Gt due to H2 use)
Total 2 Gt due to H2 use
INTERNATIONAL ENERGY AGENCY AGENCE INTERNATIONALE DE L’ENERGIE
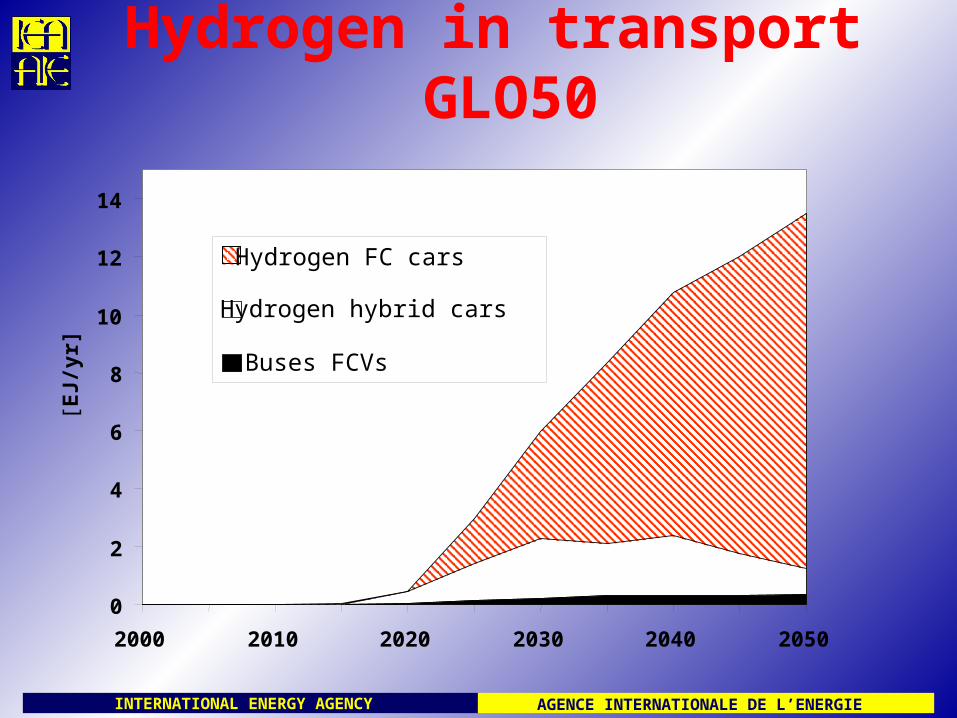
Hydrogen in transport GLO50
0
2
4
6
8
10
12
14
2000 2010 2020 2030 2040 2050
[EJ/
yr]
Hydrogen FC cars
Hydrogen hybrid cars
Buses FCVs

INTERNATIONAL ENERGY AGENCY AGENCE INTERNATIONALE DE L’ENERGIE
Stationary fuel cells
MCFC/SOFC
At present 10,000-15,000 USD/kW (50% stack)
1,600 USD/kW target (50% stack)
This is an order of magnitude higher than for mobile applications
Electric efficiency decentralized 40-45%
Efficiency centralized integrated 45-70% (wide range of estimates)

INTERNATIONAL ENERGY AGENCY AGENCE INTERNATIONALE DE L’ENERGIE
Stationary fuel cell useby sector
0
100
200
300
400
500
2000 2010 2020 2030 2040 2050
[GW
]
Power sector
Residential & Services
Industry

INTERNATIONAL ENERGY AGENCY AGENCE INTERNATIONALE DE L’ENERGIE
Stationary fuel cell useby fuel
0
100
200
300
400
500
2000 2010 2020 2030 2040 2050
[GW
]
Oil
Coal
Natural gas
Hydrogen

INTERNATIONAL ENERGY AGENCY AGENCE INTERNATIONALE DE L’ENERGIE
Comparison GLO50 to GLO50 w/o H2&FC
Systems effect: 1.3 Gt higher emissions in 2050 (+4%)
Systems effect: 7% higher crude oil use in 2050
This suggests significant benefits

AGENCE INTERNATIONALE DE L’ENERGIEINTERNATIONAL ENERGY AGENCY
Part 4: Sensitivity analysis
INTERNATIONAL ENERGY AGENCY AGENCE INTERNATIONALE DE L’ENERGIE
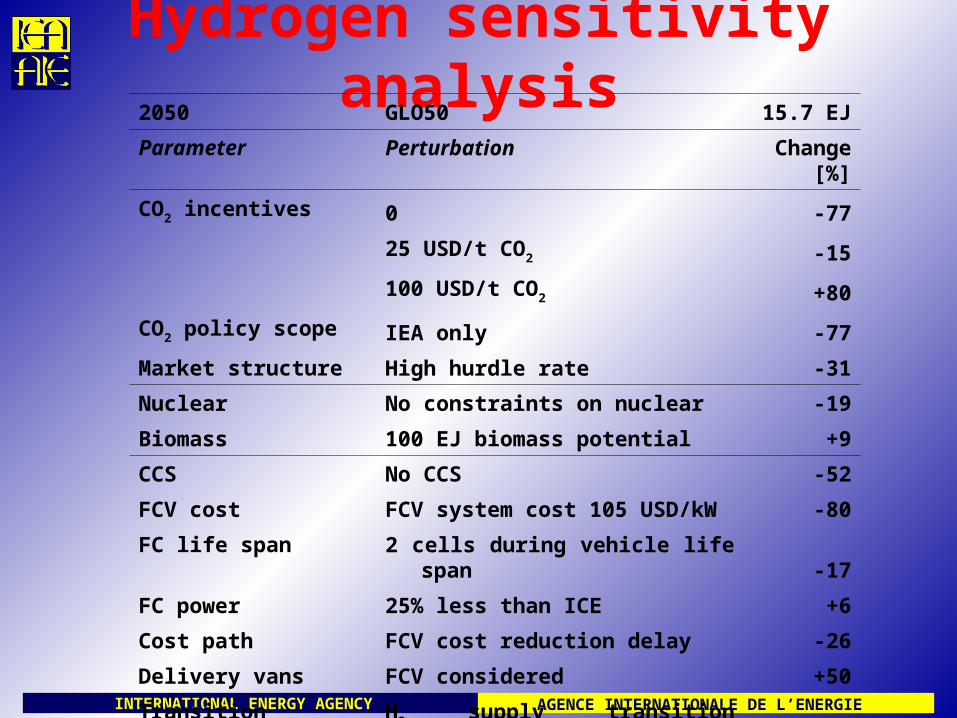
Hydrogen sensitivity analysis2050 GLO50 15.7 EJ
Parameter Perturbation Change[%]
CO2 incentives 0 -77
25 USD/t CO2 -15
100 USD/t CO2 +80
CO2 policy scope IEA only -77
Market structure High hurdle rate -31
Nuclear No constraints on nuclear -19
Biomass 100 EJ biomass potential +9
CCS No CCS -52
FCV cost FCV system cost 105 USD/kW -80
FC life span 2 cells during vehicle life span -17
FC power 25% less than ICE +6
Cost path FCV cost reduction delay -26
Delivery vans FCV considered +50
Transition H2 supply transition considered -42

INTERNATIONAL ENERGY AGENCY AGENCE INTERNATIONALE DE L’ENERGIE
H2 Production with & w/o transitionThe technology path is a key issue
0
2
4
6
8
10
12
14
16
18
2030 2030 2050 2050
GLO50 GLO50CHE GLO50 GLO50CHE
[EJ/
yr]
Other
Decentralized natural gas
Centralized natural gas + CCS
FutureGen

INTERNATIONAL ENERGY AGENCY AGENCE INTERNATIONALE DE L’ENERGIE
Prospects for electrolysis
Electricity becomes virtually CO2-free at relatively low CO2 price levels
A trade-off between diurnal electricity prices and H2 storage cost
So far diurnal H2 storage not considered
May reduce production cost by 3 USD/GJ H2
So far no reliable data for efficiency & cost of advanced electrolysis

INTERNATIONAL ENERGY AGENCY AGENCE INTERNATIONALE DE L’ENERGIE
CO2-emissions of electricity production
0
2
4
6
8
10
12
14
16
18
2000 2005 2010 2015 2020 2025 2030 2035 2040 2045 2050
[Gto
n C
O2]
0$
10$
25$
25$ No CCS
50$
50$ No CCS

AGENCE INTERNATIONALE DE L’ENERGIEINTERNATIONAL ENERGY AGENCY
Part 5: Observations

INTERNATIONAL ENERGY AGENCY AGENCE INTERNATIONALE DE L’ENERGIE
Need for secure, alternative transportation fuels beyond 2030 (supply argument)
CO2 policies (reduction/stabilization) also imply oil substitution (environmental argument)
Non-conventional oil, FT-synfuels, CNG have limited transition problems, but no substantial CO2 benefits
Efficiency, biofuels have limited transition problems, offer substantial CO2 benefits but limited potential
The H2 option requires R&D breakthroughs and cost reduction, transition will take decades; but holds potential for substantial benefits
The main challenge is the affordable FCV
Buses, delivery vans, H2 hybrids as a transition strategy
Overall benefits of having H2/FC: 4% lower GHG emissions, 7% less oil use
INTERNATIONAL ENERGY AGENCY AGENCE INTERNATIONALE DE L’ENERGIE
Workshop SummaryRelevant other studies
WBCSD SMP Concawe/EUCAR/JRC WTW study H2A CUTE Hyways ETSAP
4 working groups Production, transportation&distribution FCVs Stationary&portable FCs Technology scenarios
INTERNATIONAL ENERGY AGENCY AGENCE INTERNATIONALE DE L’ENERGIE
Workshop conclusionsData are uncertain (present and future)Challenge to get “true” FC dataDemand for more sensitivity analysisOptimisation vs. policy simulation
scenariosMore emphasis on regional
differences/detailsFocus more on R&D policies & transition
instead of long-term economics