agency versus hold-up: benefits and costs of … · per ostberg, fausto panunzi, tatjana-xenia...
TRANSCRIPT
Finance Working Paper N° 500/2017
April 2017
Alexander F. WagnerSwiss Finance Institute, University of Zurich, CEPR, and ECGI
Christoph WenkUniversity of Zurich
© Alexander F. Wagner and Christoph Wenk 2017. All rights reserved. Short sections of text, not to exceed two paragraphs, may be quoted without explicit permission provided that full credit, includ-ing © notice, is given to the source.
This paper can be downloaded without charge from:http://ssrn.com/abstract_id=1793089
www.ecgi.org/wp
Agency versus Hold-up: Benefits and Costs of Shareholder Rights

ECGI Working Paper Series in Finance
Working Paper N° 500/2017
April 2017
Alexander F. Wagner Christoph Wenk
Agency versus Hold-up: Benefits and Costs of Shareholder Rights
This research was supported by the Swiss National Science Foundation, the NCCR FINRISK, the Swiss Finance Institute, and the University Research Priority Program “Financial Market Regulation” of the University of Zurich. Our thanks go to seminar participants at NHH Bergen, the University of Innsbruck, Stockholm University, WHU, the Campus for Finance Conference, the Conference on Financial Regulation in Uncertain Times in Lugano, the Conference of the Swiss Society for Financial Market Research in Zurich, the London Business School Summer Symposium, the Financial Management Association Conference, the SAFE Workshop on Say-on-Pay, the SFI Annual Conference, and to Mike Burkart, Jay Cai, Diane Del Guercio, Susanne Espenlaub, Robert Göx, Denis Gromb, Wayne Guay, Michel Habib, Alexandra Niessen-Rünzi, Per Östberg, Fausto Panunzi, Tatjana-Xenia Puhan, Jean-Charles Rochet, Martin Schmalz, and Ekkehart Wenger for comments, to Egon Franck, Hans-Ueli Vogt, and Rolf Watter for discussions of the implications of the say-on-pay initiative, and to Thomas Minder for a conversation about the demands of his say-on-pay initiative. We thank PricewaterhouseCoopers (especially Robert Kuipers and Remo Schmid) for sharing insight into the compensation practices at Swiss companies. We thank Josefine Böhm, Alexandra Egg, Fabian Forrer, Roman Schneider, and Oliver Schrempp for research assistance. Disclosure: Wagner is an Independent Counsel for PricewaterhouseCoopers and chairman of SWIPRA. Wenk is a senior research associate of SWIPRA.
© Alexander F. Wagner and Christoph Wenk 2017. All rights reserved. Short sections of text, not to exceed two paragraphs, may be quoted without explicit permission provided that full credit, including © notice, is given to the source.
Abstract
A set of policy experiments regarding say-on-pay in Switzerland sheds light on the hitherto mostly theoretical argument that shareholders may prefer to have limits on their own power. The empirical evidence suggests a trade-off: On the one hand, binding say-on-pay provides shareholders with an enhanced ability to ensure alignment. On the other hand, when shareholders can (partially) set pay ex post, this may distort ex ante managerial incentives for extra-contractual, firm-specific investments. Thus, increased shareholder power reduces agency costs, but accentuates hold-up problems. These findings inform the design of policy. The direct-democratic process by which say-on-pay was introduced in Switzerland also highlights the conflicts between society and shareholders when it comes to executive compensation.
Keywords: Say-on-pay, event study, corporate governance, executive compensation
JEL Classifications: G38, G34
Alexander F. Wagner*Associate Professor of FinanceUniversity of Zurich, Department of Banking and FinancePlattenstrasse 14Zürich, 8032, Switzerlandphone: +41 44 634 3963e-mail: [email protected]
Christoph WenkResearch fellowUniversity of Zurich, Department of Banking and FinanceSchönberggasse 1Zürich, 8001, Switzerlandphone: +41 44 634 29 43e-mail: [email protected]
*Corresponding Author

Agency versus Hold-up:
Benefits and Costs of Shareholder Rights∗
Alexander F. Wagner† Christoph Wenk‡
March 30, 2017
Abstract
A set of policy experiments regarding say-on-pay in Switzerland sheds light on the
hitherto mostly theoretical argument that shareholders may prefer to have limits on
their own power. The empirical evidence suggests a trade-off: On the one hand, binding
say-on-pay provides shareholders with an enhanced ability to ensure alignment. On the
other hand, when shareholders can (partially) set pay ex post, this may distort ex ante
managerial incentives for extra-contractual, firm-specific investments. Thus, increased
shareholder power reduces agency costs, but accentuates hold-up problems. These
findings inform the design of policy. The direct-democratic process by which say-on-
pay was introduced in Switzerland also highlights the conflicts between society and
shareholders when it comes to executive compensation.
∗This research was supported by the Swiss National Science Foundation, the NCCR FINRISK, the SwissFinance Institute, and the University Research Priority Program “Financial Market Regulation” of the Uni-versity of Zurich. Our thanks go to seminar participants at NHH Bergen, the University of Innsbruck,Stockholm University, WHU, the Campus for Finance Conference, the Conference on Financial Regulationin Uncertain Times in Lugano, the Conference of the Swiss Society for Financial Market Research in Zurich,the London Business School Summer Symposium, the Financial Management Association Conference, theSAFE Workshop on Say-on-Pay, the SFI Annual Conference, and to Mike Burkart, Jay Cai, Diane Del Guer-cio, Susanne Espenlaub, Robert Gox, Denis Gromb, Wayne Guay, Michel Habib, Alexandra Niessen-Runzi,Per Ostberg, Fausto Panunzi, Tatjana-Xenia Puhan, Jean-Charles Rochet, Martin Schmalz, and EkkehartWenger for comments, to Egon Franck, Hans-Ueli Vogt, and Rolf Watter for discussions of the implicationsof the say-on-pay initiative, and to Thomas Minder for a conversation about the demands of his say-on-payinitiative. We thank PricewaterhouseCoopers (especially Robert Kuipers and Remo Schmid) for sharing in-sight into the compensation practices at Swiss companies. We thank Josefine Bohm, Alexandra Egg, FabianForrer, Roman Schneider, and Oliver Schrempp for research assistance. Disclosure: Wagner is an Indepen-dent Counsel for PricewaterhouseCoopers and chairman of SWIPRA. Wenk is a senior research associate ofSWIPRA.†Swiss Finance Institute and University of Zurich, CEPR, and ECGI. Mailing address: Department of
Banking and Finance, University of Zurich, Plattenstrasse 14, CH-8032 Zurich, Switzerland, Phone: +41-44-634-3963, Email: [email protected].‡Department of Banking and Finance, University of Zurich, Email: [email protected].

1. Introduction
In this paper, we study shareholder reactions and management responses to a direct-democratic
push for an enhancement of shareholder rights. 68% of Swiss voters approved, in a referen-
dum, a constitutional amendment that requires binding shareholder votes on compensation.
Strikingly, around 70% of Swiss public corporations responded with negative abnormal stock
returns when it became known that the referendum would be held.
This result indicates two things. First, there is a tension between society and shareholders
in the perception of the necessity and impact of additional shareholder rights. Second, and
counter-intuitive at first, more shareholder power appears to be eyed critically by sharehold-
ers on average. The purpose of this study is to shed light on the value implications of changes
in shareholder rights by dissecting the reaction of shareholders and companies to events re-
lated to the referendum. We find that alignment benefits of enhanced shareholder rights
can explain part of the stock price reactions, but we provide novel evidence that sharehold-
ers also worry significantly about the distortion of executives’ extra-contractual incentives
when shareholders obtain particularly large power by being able to vote retrospectively on
compensation for the elapsed year. We also find corresponding real effects in terms of CEO
turnover, compensation structure, and pay levels. Overall, our results imply that there is
a trade-off between agency and hold-up when it comes to the role of shareholder power in
shareholder value creation.
Understanding the advantages and disadvantages of shareholder power and say-on-pay
is of significant policy relevance. For example, the UK began mandating non-binding share-
holder votes on executive pay already in 2002 and revised these rules in 2013 to provide
shareholders with a binding vote on the companies’ pay policies at least every three years.
In November 2016, the UK government issued a green paper to evaluate whether binding
say-on-pay should be extended to not only cover forward-looking aspects, but also apply ex
post to compensation reports. Such retrospective votes on the compensation report would
1
have a similar spirit as the say-on-pay rules analyzed in this paper. Several other countries
are considering or have implemented a (partially) binding say-on-pay rule.1 The revised
EU Shareholder Rights Directive, approved by the European Parliament in March 2017, in-
troduces, among other things, a shareholder say on the remuneration policy for the board
of directors and the executive management, as well as a mandatory advisory vote on the
compensation report throughout the European Union. Whether or not the vote on remu-
neration policy is of binding or advisory nature is left to each member country to decide. In
the U.S., following the “Dodd-Frank Wall Street Reform and Consumer Protection Act” of
2010, the SEC adopted a rule in January 2011 that requires an advisory shareholder vote on
executive compensation at least once every three years. Binding say-on-pay rules have also
been considered in in the U.S., though less intensely.2
The regulatory push for binding say-on-pay is understandable from a political economy
perspective, with voters dissatisfied with the governance of corporations and the perceived
widening inequality as a result thereof. Yet, it is remarkable that the implementation of
binding rules occurs without much evidence regarding its effects, as existing studies (reviewed
below) concern advisory say-on-pay only. This paper fills this gap.
We exploit a recent natural experiment in Switzerland, including four relevant regulatory
events. Specifically, on February 26, 2008 (event 1 ), it became public that enough Swiss
voters had signed the “Anti-Rip-Off-Initiative” (“Fat-Cat-Initiative,” “Initiative gegen die
Abzockerei”) to force a constitutional referendum. The initiative’s central element was the
introduction of binding say-on-pay for shareholders of all publicly traded firms in Switzerland.
On March 3, 2013, almost 70% of Swiss voters accepted this constitutional amendment (event
2 ). In June 2013, a draft ordinance for the actual implementation of the law was released
(event 3 ). Since November 20, 2013, the final Ordinance against Excessive Compensation
1For example, Belgium, the Czech Republic, Denmark, Finland, France, Hungary, Latvia, the Nether-lands, Norway, Portugal, and Sweden have introduced laws on say-on-pay with partially binding elements.
2For example, the Excessive Pay Shareholder Approval Act (May 2009) would have required a 60%shareholder approval if an executive received more than 100 times the average salary within a firm.
2

(OaEC) is in place, retaining the basic features of the earlier draft ordinance (event 4 ).
The new law coming out of the referendum provides for the most stringent version of
binding say-on-pay, namely, votes on actual amounts of compensation (not merely the com-
pensation system). However, over time two quite different implementation proposals were
made: Under the original initiative (events 1 and 2), only “retrospective” (“ex-post”) binding
say-on-pay was envisioned: Shareholders would vote on compensation for the past year. By
contrast, under the OaEC regime (events 3 and 4), a “prospective” (“ex-ante”) approach also
became possible. Thus, shareholders would vote on a “bonus budget” for the upcoming year.
In this quasi-experimental setting, we test the prediction that enhancing shareholder
power may lead to hold-up problems and distort firm-specific investment incentives of CEOs
(Hypothesis 1 ). Burkart, Gromb, and Panunzi (1997) study optimal shareholder ownership
dispersion, and Blair and Stout (1999) and Stout (2003) deal with the relationship between
the board and shareholders. The common idea of these studies is that when one stakeholder
has more power, other stakeholders who make specific investments in the firm are more likely
to fear that the more powerful stakeholder “holds them up” (Grossman and Hart, 1986; Hart
and Moore, 1990). Applied to the present setting the hypothesis implies that, as shareholders
obtain the power to set pay ex post, CEOs expect that they will not receive the full returns
on their firm-specific investments, and their ex-ante incentives to engage in such efforts are
diminished, leading to lower firm value. Gox, Imhof, and Kunz (2014) develop this idea
theoretically and find support for this idea in a laboratory experiment, but no empirical
evidence exists so far regarding this prediction. Additionally, we explore to what extent a
binding say-on-pay may align shareholder and manager interests and improve shareholder
value (Hypothesis 2 ).
We test these two hypotheses from two viewpoints. First, we consider the cross-sectional
variation in stock price reactions of Swiss corporations to the four events. The advantage of
considering asset price changes is that they capture current expectations; the researcher does
not need to trace all the future changes to cash flows and discount rates separately (Schwert,
3
1981). Second, we evaluate whether there were real adjustments in companies’ management
and policies that were in line with the observed market reactions.
While there is no obvious direct measure of the intensity of the hold-up problem (Hy-
pothesis 1 ), we propose three (largely uncorrelated) groups of proxies: First, shareholders
of firms that use only cash bonuses – which would be subject to an ex-post shareholder
vote under the terms of the original initiative, – may especially worry about a distortion of
the ex ante incentives for executives. Second, shareholders of firms with younger CEOs are
likely to worry more that their CEOs will have diminished incentives to make firm-specific
investments; these CEOs would be more inclined to improve or exercise their outside op-
tions. Third, shareholders of firms with higher uncertainty concerning their annual sales or
costs will find it more difficult to contract with management efficiently as more contingencies
would have to be planned for.
Supporting the prediction of Hypothesis 1, we find that abnormal stock price declines
in events 1 and 2 were more pronounced in these three groups of firms. Moreover, in line
with the hypothesis, we find that these firms’ stock prices reacted more positively to events
3 and 4, which resolved, or at least significantly ameliorated, the hold-up concern by giving
shareholders the opportunity to choose a prospective, budget-based say-on-pay regime.
Hypothesis 2, regarding the alignment benefits of binding say-on-pay, also receives sup-
port. Firms which had outperformed size- or risk-based benchmarks in the past experienced
particularly substantial abnormal stock price drops, whereas poor performers reacted rela-
tively more positively. Also, the stock prices of firms where abnormal executive pay was
either highly positive or negative reacted positively. Again, these effects are stronger for
stricter say-on-pay (events 1 and 2) than for the more flexible system (events 3 and 4).
Companies with a large blockholder tended to react more negatively to the initiative.
This is consistent with expectations. For companies with a large blockholder, benefits from
the initiative in terms of better alignment are arguably small, while direct costs from the
implementation and, to a lesser extent, from hold-up remain.
4
Besides the fact that most companies chose the prospective voting system for future say-
on-pay votes, the changes in CEO turnover behavior and compensation policies following
the events also vindicate the stock price reactions: CEO turnover rose markedly in those
firms that reacted most negatively to event 1, that is, in companies whose shareholders per-
ceived high hold-up costs and limited alignment benefits. Companies that awarded cash-only
bonuses prior to the initiative adjusted their variable compensation structure by reducing
the cash-share of CEO pay, thus ameliorating the hold-up problem. Conversely, to improve
alignment, companies that had paid their CEOs abnormally high variable compensation prior
to the regulation reduced it in economically and statistically significant ways.
In sum, we obtain considerable evidence that, while the idea of shareholder power may
appeal to the public as a control mechanism, shareholders themselves may feel that less can
be more when it comes to shareholder rights. Shareholder power reduces agency costs, but
accentuates hold-up problems. This trade-off should be reflected in policy design.
By documenting the basic tension between voter preferences and shareholder reactions,
this paper contributes, first, to the study of the political economy of finance and corporate
governance (see Pagano and Volpin (2001), Perotti (2014), and Roe and Vatiero (2015) for
reviews). Pagano and Volpin (2005) show how the electoral system can shape political pref-
erences and government decisions on investor rights. Tensions between the political majority
and shareholders can arise, for example, in Perotti and von Thadden (2006), who show that
individuals with lower financial wealth prefer high labor rents to higher financial returns.
While elections may provide some insight into society’s views on corporate governance, a
direct-democratic referendum allows us to match a concrete policy chosen by the people (not
by a regulator) to stock price reactions in a fairly clean way.3
3Switzerland has a lively tradition of direct democracy (see, for example, Frey (1994)). It is conceivable(but not the subject of our paper) that society’s strong support for comprehensive say-on-pay in Switzer-land partially occurred because the idea of a shareholder democracy appealed to Swiss voters. In Paganoand Volpin (2005), ideology plays a role in addition to economic interests; Roe (2000) instead ascribes alldifferences between the European and US corporate governance system to ideology.
5
Second, with our focus on shareholder and manager reactions, we contribute to the liter-
ature on the effects of shareholder power on shareholder value. Overall, the literature draws
a fairly positive conclusion on shareholder power, generally focusing on alignment benefits.
Gompers, Ishii, and Metrick (2003) document a positive association between shareholder
rights and equity prices. Several studies assess specific shifts in power towards shareholders:
Cai and Walkling (2011) find neutral to slightly positive stock market effects of advisory
say-on-pay, with positive outcomes in firms that paid their CEOs large excess compensa-
tion. Ferri and Maber (2013) find that the UK’s advisory say-on-pay law led to a positive
stock price reaction at firms with weak penalties for poor performance. Conyon and Sadler
(2010) argue that this law only had little impact on CEO pay in real terms, though Thomas,
Palmiter, and Cotter (2012) document that firms tend to adjust their pay practices after neg-
ative voting outcomes.4 In a cross-country study (not including Switzerland), Correa and Lel
(2016) provide evidence suggesting that say-on-pay laws reduce the upward trend in CEO
pay and contribute to increased firm value. More generally, the literature documents that
enhanced proxy access and provisions that shift power to shareholders are met with positive
reactions in firms with pronounced agency problems (Becker, Bergstresser, and Subrama-
nian, 2013; Cohn, Gillan, and Hartzell, 2016; Cunat, Gine, and Guadalupe, 2016).5 These
positive results do not necessarily mean that more governance regulation is in the interest
of shareholders. For example, Larcker, Ormazabal, and Taylor (2011) document negative
market reactions to legal developments that suggest higher probabilities of governance and
4See Kronlund and Sandy (2014); Zhang, Lo, and Yang (2014); Brunarski, Campbell, and Harman (2015)for additional studies on firm responses.
5Other literature has focused on the idea that authority within the governance framework should beplaced with the best-informed party (see, e.g., Burkart, Miglietta, and Østergaard (2017) for a study ofallocation of powers in early 20th century Norwegian corporations) and that shifts in authority inducedifferent information acquisition incentives (Cornelli, Kominek, and Ljungqvist, 2013). In the Swiss legalsystem, even if the authority on the compensation decision rests with shareholders, the responsibility for theoverall company remains with the board. In practice, the board needs to be equally well-informed under anydecision-making authority regarding pay because it needs to prepare the annual general meeting materials(and is ultimately held responsible by shareholders for poorly prepared compensation proposals).
6
executive pay regulation.
Our analysis adds to this existing work by offering a combination of several features:
First, we document that shareholders appear to consider a trade-off: They welcome binding
say-on-pay because it helps them reign in agency costs, but they also anticipate hold-up
problems when they have too much power. This confirms a prediction that so far has only
been documented theoretically. The only study we know of that addresses potential hold-up
effects of binding say-on-pay is Gox, Imhof, and Kunz (2014). Consistent with our empir-
ical evidence, they show in a laboratory experiment that, while advisory say-on-pay votes
do not distort investment decisions, binding rules do so and may thus impair shareholder
value. Second, this paper focuses on binding say-on-pay, as a currently fashionable policy
alternative to advisory say-on-pay. Third, the analysis exploits different characteristics of
the various implementation proposals, thus allowing us to flesh out the effects of different
designs of binding say-on-pay. Fourth, the direct-democratic process by which say-on-pay
was introduced in Switzerland allows us to highlight the potential conflicts between society
and shareholders when it comes to corporate governance.
2. Legislative setting and the binding say-on-pay initiative
To provide a better understanding of the setting in which our study is conducted, we first
describe the political environment that surrounds it. Second, we describe the main proposals
of the binding say-on-pay initiative as well as the implementation in actual Swiss law. In a
third step, to validate the appropriateness of the events for the empirical analysis, we provide
an overview of how each event was discussed in the media.
2.1. The Swiss legislation process
The Swiss political system knows two common ways of enacting new laws (see Kloeti,
Knoepfel, Kriesi, Linder, Papadopoulos and Sciarini (2007) for a more detailed summary
7

of the Swiss system). One way is through a consensus decision between parliament and
senate. The second way is through the public itself, by means of an initiative which can be
started by every Swiss citizen. If an initiative receives the backing of at least 100’000 Swiss
citizens (about 2% of the electorate of around 5’000’000) within 18 months, it must be put
on the agenda for a national vote. In case the public vote supports the initiative, it will
turn into an amendment to the Swiss constitution. The fraction of public initiatives that
eventually pass the popular vote has been increasing in recent years.
2.2. Content of the initiative and its implementation in law
We consider the so-called “Initiative gegen die Abzockerei” (“Anti-Rip-Off-Initiative,”“Fat-
Cat-Initiative”). This initiative was launched by entrepreneur Mr. Thomas Minder. Accord-
ing to the initiative’s text, it was proposed “to protect the economy, private property and
the shareholders,” making the initiative and the following regulatory events reasonably well
suited to study shareholder reactions.
We exploit various steps in the implementation of the initiative from 2008 to 2013. On
February 26, 2008, the announcement was made that the above-mentioned threshold of
signatures in favor of the initiative had been collected. Unlike many initiatives that are
a general call for legal action to parliament and senate rather than original proposals to
turn into law, the present initiative had a clear program that it aimed at turning into
legislation. The fact that the approval of the initiative only represents a step towards a
possible law implies that by studying stock market reactions to the initial announcement we
likely underestimate the true economic impact it would have upon enactment. The initiative
affects all public Swiss limited liability companies. It requires a binding annual vote on
total compensation (the sum of all pay components, such as fixed and variable pay) for each
of three groups: the board of directors (BOD), the executive board (EB) as well as the
advisory council. On March 3, 2013, almost 70% of Swiss voters accepted this constitutional
8

amendment.6
The constitutional amendment required an ordinance by the Swiss Federal Government
to become actionable law. In June 2013, such a draft ordinance for the actual implementation
of the law was released by the Federal Council. Since November 20, 2013, the final Ordi-
nance against Excessive Compensation (OaEC) is in place. It turned out that the Federal
Government retained the basic features of the earlier draft ordinance.7
Interestingly, the way this binding say-on-pay would be implemented was understood
more narrowly when the original initiative was passed (that is, up to March 3, 2013) than
what the Federal Government’s OaEC now allows for companies.
The main differences concern variable compensation.8 The original initiative (events 1
and 2) envisioned a distinction for the two typical parts of variable compensation, equity plans
and cash bonuses. Equity plans would be enshrined in the company’s articles of association.
For example, shareholders would once (or every few years, when changes would be necessary)
approve, by an amendment of the articles of association, that a certain percentage of base
salary would in addition be provided in the form of shares. Shareholders could also approve
other types of equity plans, for example, performance share units, that is, equity grants that
are subject to performance (and service) vesting conditions. As long as this plan remains the
same, no extra vote would be necessary in the following year’s annual shareholder meeting;
the value of managerial equity granted may simply go up or down. By contrast, cash bonus
amounts, which would be handed out depending on company-wide or individual performance
6On February 26, 2008, the probability of the initiative passing into law quickly was seen as substantial andserious enough to catch the attention of the stock market participants. That subsequent political discussionsdelayed a vote on the initiative is similar to the case that occurred in the US, where it took more than threeyears for the 2007 U.S. House Say-on-Pay Bill to find its way into law in the form of the Dodd-Frank Act in2010).
7The full text of the initiative can be found in Supplementary Appendix B. An (unofficial) translation ofthe OaEC is available here: http://bit.ly/OaEC-E.
8The original initiative and the OaEC do not differ much with respect to fixed pay (salary). As this doesnot typically vary much from year-to-year, even under the original initiative there was little question thatthis amount would be annually approved in advance of the upcoming year.
9

in the prior year, and which could not be specified in suitable detail in the articles, would
need to be voted on ex post at the annual general meeting following the performance year.
In today’s terminology, this corresponds to a retrospective say-on-pay regime for all firms.
The fraction of variable compensation that is conveyed in cash is an indication of the part of
compensation that is subject to a retrospective say-on-pay vote. Importantly, the immediate
consequences of a turned down retrospective shareholder vote are strict as no compensation
can be paid (or has to be reclaimed if already paid out). Yet, a survey of international and
local institutional investors (SWIPRA, 2016) shows that 38.3% of the respondents would be
willing to reject a proposed compensation amount if it is deemed excessive.9
The draft and final versions of the OaEC (events 3 and 4), instead, allow shareholders
to set the voting mechanism in the articles of association. In particular, they can elect to
vote on all variable compensation prospectively. Thus, shareholders approve, at the annual
general meeting in year t (for example, in April 2015) a budget for variable compensation
to be available for fiscal year t+1 (2016 in the example). The board of directors is then free
to allocate from this budget within t+1 and to hand out bonuses after the end of t+1. In
practice, the vast majority of the companies of the Swiss Performance Index have adopted
this system for their executive management.10
Another difference is that under the original initiative, contracts with new management
would be conditional on their pay packages being approved at the next general assembly,
with high uncertainty for management and the board. The OaEC also addressed this issue,
at least to some extent. In the case of prospective voting, companies can determine in
9Since the Ordinance against Excessive Compensation was implemented, compensation packages werevoted down twice. In 2015, the majority shareholder of Sika, who felt that the board of directors had notacted in their best interest, voted against the compensation of the board (prospective vote). Because thecompensation was turned down a second time in 2016, this time in a retrospective vote, the members of theboard did not receive any compensation for the financial year 2015.
10Over 98% of the companies opted for a fully or partially prospective voting system: about 75% ofcompanies vote on all compensation elements in a prospective manner (sometimes combined with an advisoryvote on the compensation report in the following year), while 25% vote prospectively for base and long-termcompensation and ex-post for the short-term incentive.
10
their articles of association a certain amount or percentage of total compensation that is
automatically available for additional management appointments if the amount approved by
the shareholders is not sufficient. This again provides additional flexibility, especially for
firms in an uncertain environment.
While the public discussion and media coverage of the initiative and the OaEC mostly
concerned its say-on-pay content, we note that the initiative also contains some other pro-
visions. Our setting provides an opportunity to test whether the market reacted to these
provisions. Specifically, the initiative also prohibits any kind of termination pay or advance
payments to the board of directors or the executive management. Other compensation ben-
efits (loans, pension benefits, etc.) need to be set in the firm’s articles of association. Other
requirements pertain to the election modes of the board of directors and the compensation
committee. As we document in Section 5.2 below, the cross-sectional variation in market
reactions is not explained by these elements.
2.3. The events and their coverage in the media
A broad outline of the initiative’s development and the most notable milestones are sum-
marized in Supplementary Appendix A. To retain the validity of our empirical analysis, we
focus on those events that received the largest public attention and were the least predictable
by the market.
Event 1 was on February 26, 2008, when it was announced that a sufficient number of
signatures in favor of the initiative had been collected to force a popular vote. This event was
hardly predictable for market participants since there was no publicly available signatures
count. The news of the announcement were to some extent also picked up internationally;
for example, after having posted the announcement by the Swiss News Agency (SDA) in
German in the early afternoon, Bloomberg further reported on the initiative’s success in the
late afternoon in English under the heading “Swiss May Vote to Expand Shareholder Rights
11

Over Executive Pay.”
Event 2 took place on March 3, 2013, when the public voted in favor of the initiative
which directly impacted the Swiss corporate law. The news coverage of this positive outcome
was large and resonated internationally as the initiative approved by the Swiss public was
one of the most stringent frameworks internationally. It was also followed closely by foreign
lawmakers involved in drafting bills that deal with shareholder power.
Event 3 was the release of the first draft of the OaEC on June 14, 2013. This draft defined
the general framework in which the final implementation of the initiative would be set. The
date of release of this draft was not known by stock market participants in advance. As the
content of this first draft was also largely unknown up to its release, its publication received
great attention from the business community.
Event 4, the release of the final version of the OaEC on November 2013, was picked
because it had ultimately the largest real effects as it forced a new legal framework on the
Swiss corporate landscape. The November date was known a few weeks before the release.
Given that many different opinions had been voiced about the initial draft11, the content of
this final version was also, to a certain extent, unclear before the final release date.
In sum, the legal importance and the uncertainty surrounding the chosen events render
them attractive from a methodological point of view for studying stock price reactions as
well as changes in corporate policies.
3. Hypothesis development and data
Our analysis is guided by two conceptual ideas. Sections 3.1 and 3.2 motivate our hypotheses
and outline the subsequent empirical predictions. We describe the data used in the empirical
analysis in Section 3.3.
11Between June 14 and July 28, 2013, a total of 71 participants, ranging from political parties, listedissuers, pension funds, asset managers, lawyers, proxy advisors as well as various associations, voiced theiropinion and made suggestions on how to amend the initial draft.
12
3.1. Hypothesis 1: Hold-up
Our primary focus is on a channel that has, for lack of appropriate data and settings, received
little empirical attention so far, but that has long been proposed in the theoretical literature
on optimal shareholder rights and managerial discretion (see in particular Burkart, Gromb,
and Panunzi (1997); Blair and Stout (1999), and Stout (2003)): When shareholders have
more power, other stakeholders who make specific investments in the firm are more likely
to fear that shareholders “hold them up.” Shareholders recognize that ultimately their own
“piece of the pie” will be smaller when such specific investments are not made. Under the
plan of the original initiative (events 1 and 2), shareholders vote on cash bonuses for man-
agement effort and performance in the elapsed year (“retrospective vote”). As in Switzerland
annual incentives are relatively much more important than long-term shareholdings of CEOs
compared to countries such as the US, this setup can have significant effects. If CEOs expect
that they will not receive the full returns on their firm-specific investments, their ex-ante
incentives to engage in such efforts are diminished.12 This issue is not only of theoretical
relevance, but also of a high significance to practitioners. In an interview shortly before the
March 2013 vote, Dennis Nally, head of the global consulting firm PwC, noted that many
firms in Switzerland were very concerned about the initiative, exactly because the previously
described hold-up problem will make it hard to find skilled managers.13
Hypothesis 1 , therefore, states that the value impact of retrospective binding say-on-pay
is more negative in firms where specific investments by CEOs are more difficult or more
important to secure. We expect Hypothesis 1 to hold strongly for events 1 and 2. Binding
12This is true even if ex-post renegotiation iscostless and efficient; see Grossman and Hart (1986) and Hart and Moore (1990) for seminal work on
the hold-up problem. If renegotiation leads to disappointment and psychological costs ex post, this hasadditional distortionary implications (Hart and Moore, 2008).
13The interview was published in NZZ am Sonntag on November 11, 2012. This concern was shared by thetrade association SwissHoldings, which warned in a newspaper article that the initiative’s demands wouldconsiderably harm the competitiveness of the Swiss economy as new talent will be hard to recruit (NeueZurcher Zeitung, November 13, 2012).
13

say-on-pay can, however, also come in the form of allowing shareholders to vote prospectively,
that is, to approve a budget (bonus pool) for the upcoming year. This system is possible
under the OaEC, which allows shareholders to choose between retrospective and prospective
voting systems. Thus, we expect the hold-up problem to be less value-relevant or indeed
avoided under the regime in place after events 3 and 4.
As for firm choices, this hypothesis implies that companies most affected by hold-up
issues should see an increase in CEO turnover and a shift in the compensation structure
away from cash bonuses.
3.2. Hypothesis 2: Agency
Say-on-pay may better align shareholder and manager interests and improve governance
and performance. Allowing shareholders to have a say in executive pay may help to reduce
the agency costs between executives, directors and shareholders, resulting in more efficient
compensation contracts and thus add value to the firm.
Hypothesis 2, therefore, states that the value impact of binding say-on-pay is more positive
in firms where alignment is currently poor. This channel partially features in existing work
on advisory say-on-pay; we extend the existing literature by conducting the first study of
implications of binding say-on-pay. In addition, we expect the alignment effect to work more
strongly under the stricter say-on-pay regime (events 1 and 2) than under the somewhat
more flexible regime (events 3 and 4).
As for firm choices, this hypothesis implies that the increase in alignment as a result of
the initiative as well as the OaEC should lead companies to reduce abnormal compensation
levels of their executives.
14
3.3. Data
The event study requires that we focus on sufficiently liquid stocks, which arguably allow
for a fast processing of new information into stock prices. As information is more quickly
reflected in stock prices for large firms (Hong, Lim, and Stein, 2000; Hou and Moskowitz,
2005; Peng, 2005), we restrict the sample to those firms classified as large and medium by
SIX Swiss Exchange. This corresponds to 100 firms for each year. This classification reflects
not only market capitalization, but also stock liquidity and free float, amongst other factors.
Of the 100 firms, three have a dual-class share structure with both instruments listed. In
our analysis, we only focus on the publicly held, more liquid share-class. Our sample covers
97.9% of the SPI market capitalization in 2007 and 98.6% in 2014. Most of the remaining
roughly 100 firms are extremely small and thinly traded.
To calculate firm-level stock returns, we use daily closing prices of the SPI constituent
companies from the Thomson Reuters Datastream database. We screen the data following
the recommendations of Ince and Porter (2006).
The free-float adjusted market value (Market Capitalization in what follows)14, the value
of total assets, other price data for the Swiss Performance Index (which we used to calculate
the market return), trading volume, sales volume, the SPI size-segment indices (each SPI
stock is assigned to either the small-size, medium-size, or large-size stock index), and the long-
term Swiss government bond rate (a proxy for the risk-free interest rate) are also collected
from Thomson Reuters Datastream. Sales Volatility measures the standard deviation of a
firm’s sales during a five year window and scales it by the average annual sales of the company
during the same period. Return data for the SPI size-segment subindices are used to obtain
each stock’s size-index adjusted one-year performance (Relative Performance).
CEO Age is obtained from Bloomberg and, where necessary, extended by hand-collection
from the companies’ annual reports.
14In four cases where free-float adjusted market value was not available, we used total market value instead.
15
Compensation, CEO turnover and CEO nationality (CEO Swiss) data are hand-collected
from firms’ annual reports. When the CEO is not the highest-paid individual, his compen-
sation does not need to be disclosed, resulting in missing data. This was the case for eight
companies in 2008 and two companies in 2013.15 CEO Cash Incentives is the portion of
variable compensation conveyed in cash (and not in equity). In the spirit of Bebchuk, Cre-
mers, and Peyer (2011), we calculate abnormal compensation as the difference between total
compensation paid and remuneration granted by the average comparable firm (Abnormal
CEO Compensation). The prediction of the normal CEO compensation is based on the
log of market capitalization, Ln(Market Capitalization), and on the one-year, size-index ad-
justed firm performance, with a further control for executive turnover, Months, the number
of months an executive worked in the firm during the previous period, as well as Dual, a
binary indicator stating whether the CEO holds the position as chairman of the board at
the same time. To avoid confounding effects of non-regular pay elements (e.g., non-compete
payments or replacement awards), in the main analysis we do not consider those three to
five observations per year with abnormal compensation levels above CHF 5.0m.16
We also hand-collect, from firms’ annual reports, the fraction of Management Sharehold-
ings in the firm. Variables on shareholder structure are calculated with data from Orbis. To
avoid double counting of investors’ holdings, Orbis data were screened manually.17 Block-
holder is a dummy variable equal to one in case a single investor holds at least 20% of a
company’s outstanding shares.
Abnormal Trading Volume is the difference between trading volume in the event window
15Most companies provide business reports in the period January - March of the following year. As such,at the end of February 2008, strictly speaking, information on compensation in all companies in 2007 maynot yet have been publicly available. Reliable compensation data for 2006 is not available for Switzerland,however. The Transparency Act requiring firms to disclose compensation data came into force only in 2007.
16All regression results remain statistically and economically significant when not imposing this constraint,except for abnormal CEO compensation, where the coefficients retain the sign but fall just below conventionalsignificance levels.
17For one company it was not possible to identify all double counts so that shareholder coverage wastruncated at 100%.
16
and the median trading volume of the respective firm in the previous year, relative to the
median trading volume of the respective firm in the previous year. The binary indicator
variable Company Event is equal to one if a firm communicated its previous year’s figures to
the media within five days around the event window.
The summary statistics for all variables of interest are collected in Table 1. Due to the
sometimes limited availability of certain data, the working sample is smaller for some parts of
the analysis. The average company in our sample has a market capitalization of CHF 10.1bn
and a CEO that is 53.5 years old. There is substantial variation in firm-level variables
such as sales volatility, relative performance, compensation structure, and compensation
levels.18 The average CEO turnover within our sample is 18.75% per year. A third of the
companies covered in our sample have a blockholder owning more than 20% of the company’s
outstanding shares.
Correlations for the most important variables are in Table 2. We note that the correlations
of the explanatory variables of interest in the sample are overall very low.
TABLES 1 AND 2 ABOUT HERE
4. Results
Section 4.1 discusses the reactions of the stock market to the announcements of the events.
In Section 4.2 we provide evidence of adjustments in companies’ policies following the events.
4.1. Stock market reactions
In analyzing stock market reactions, we follow standard practices (Kothari and Warner, 2007;
MacKinlay, 1997). Based on the four events described in the Section 2.3, we define an event
18When estimating normal compensation levels, we only rely on data available at the time of the eventto get the most accurate prediction. Estimates for the event in 2008 and the events in 2013 are, therefore,based on a different set of data. Consequently, the average abnormal compensation in our overall sampleshown in Table 1 differs from zero. Naturally, in each individual year, the mean abnormal compensation iszero.
17
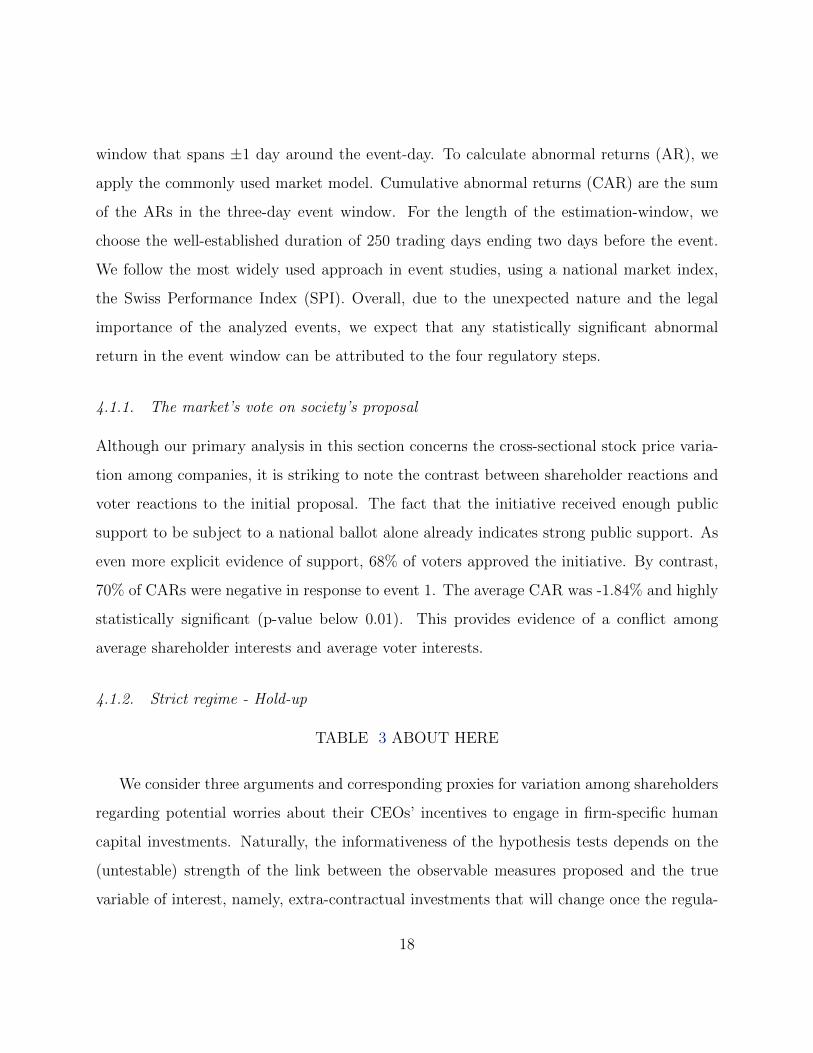
window that spans ±1 day around the event-day. To calculate abnormal returns (AR), we
apply the commonly used market model. Cumulative abnormal returns (CAR) are the sum
of the ARs in the three-day event window. For the length of the estimation-window, we
choose the well-established duration of 250 trading days ending two days before the event.
We follow the most widely used approach in event studies, using a national market index,
the Swiss Performance Index (SPI). Overall, due to the unexpected nature and the legal
importance of the analyzed events, we expect that any statistically significant abnormal
return in the event window can be attributed to the four regulatory steps.
4.1.1. The market’s vote on society’s proposal
Although our primary analysis in this section concerns the cross-sectional stock price varia-
tion among companies, it is striking to note the contrast between shareholder reactions and
voter reactions to the initial proposal. The fact that the initiative received enough public
support to be subject to a national ballot alone already indicates strong public support. As
even more explicit evidence of support, 68% of voters approved the initiative. By contrast,
70% of CARs were negative in response to event 1. The average CAR was -1.84% and highly
statistically significant (p-value below 0.01). This provides evidence of a conflict among
average shareholder interests and average voter interests.
4.1.2. Strict regime - Hold-up
TABLE 3 ABOUT HERE
We consider three arguments and corresponding proxies for variation among shareholders
regarding potential worries about their CEOs’ incentives to engage in firm-specific human
capital investments. Naturally, the informativeness of the hypothesis tests depends on the
(untestable) strength of the link between the observable measures proposed and the true
variable of interest, namely, extra-contractual investments that will change once the regula-
18

tion is put in place. We aim to ameliorate this concern by studying three largely independent
arguments.
First, consider the pay structure. In Switzerland, annual incentives are relatively much
more important than long-term shareholdings of CEOs compared to countries such as the US.
Therefore, changes in the way these annual incentives work can in principle have profound
effects on behavior. As explained in Section 2.2, the time-line of how executive pay will be
set according to the original initiative would have led to potential distortions: Cash bonuses
for the elapsed year would need to be approved at the next shareholder meeting. This is
almost a prototypical case of the hold-up problem: Ex post, shareholders have little incentive
to approve the awards; moreover, shareholders may have changed over time.19 The CEO,
in turn, may anticipate this problem and, therefore, not make the firm-specific investments
that maximize firm and shareholder value. Importantly, we expect the resulting distortions
to be greatest where executives are mostly compensated with cash bonuses. Consistent with
this prediction, column (1) of Table 3 shows that the CARs were 1.4 percentage points more
negative in firms that only use cash bonuses as variable compensation than in firms that use
equity-based compensation or a mix of the two.
Second, the time horizon of the manager plays a role. Younger CEOs have a relatively
higher incentive, under binding say-on-pay rules, to invest in general rather than firm-specific
skills than older CEOs because young CEOs wish to retain their option to secure a different
position. Consistent with this argument, we find that firms with young CEOs reacted 0.9
percentage points more negatively to the say-on-pay initiative than companies with older
19In particular, the shareholders’ incentives to approve the bonuses are considerably smaller than theboard’s: Boards of Swiss companies are explicitly charged to act for the benefit of the overall corporation.Also, their benefits from expropriating management are significantly lower than those of the shareholders.
19

CEOs; see column (2) of Table 3.20
Third, where uncertainty is high, it is more difficult to contract on all possible contin-
gencies. Therefore, incompleteness of contracts becomes a major concern. The binding
say-on-pay initiative may further exacerbate the ensuing hold-up problem. In line with this
argument, column (3) of Table 3 shows that stock prices of firms with higher-than-median
demand or cost uncertainty exhibited 0.8 percentage points larger abnormal declines than
firms with lower-than-median uncertainty.
All these results hold when including all variables jointly together with other controls
(column (4) of Table 3). We comment on the analysis including alignment benefits in more
detail below.
Overall, it may well be that multiple forces are at work that drive the empirical facts
we observe.21 Nonetheless, the extra-contractual investments framework is attractive be-
cause it provides a “brittle hypothesis:” It is a single framework that makes several different
predictions that could easily be wrong. Recall also from Table 2 that the various factors
for which it correctly makes predictions are almost uncorrelated empirically. None of the
three independent predictions – regarding pay structure, time horizon of the manager, and
uncertainty – is rejected in the data.
Summarizing, these considerations lead us to view the extra-contractual investments
framework as particularly useful for adding to our understanding of shareholder reactions to
enhanced shareholder power.
20 Relatedly, CEOs who have had a long tenure at the respective company are likely to already haveacquired substantial firm-specific knowledge. By contrast, CEOs who have only relatively recently joinedthe company face the choice whether to engage in firm-specific or general human capital investments, i.e.,whether to fully contribute to their current firm’s fortunes or whether to at least partially work on theiroutside options. In results not tabulated we find that shareholders of firms with CEOs in the shortest tenurequartile were more worried about the value consequences of binding say-on-pay.
21In the model of Cohn and Rajan (2013) reputational concerns make managers reluctant to implementstrategy changes. According to their hypothesis 1, board strength is optimally greater when the manager isyoung. This is consistent with our results.
20

4.1.3. Strict regime - Alignment
Contrary to the extra-contractual investments framework, the alignment channel of say-on-
pay is broadly established in the literature. We test the alignment hypothesis in our setting
by empirically assessing two common arguments. First, if management was not working in
the interest of shareholders before the adoption of binding say-on-pay, firm-specific stock
performance was likely to be poor. According to the hypothesis that binding say-on-pay
helps improve alignment of managerial with shareholder interests, we should observe that
firms with poor performance in the past benefit more from say-on-pay than those with the
best performance.
In line with this prediction, the results in Table 3 display a negative relationship between
the one year relative performance and the cumulative abnormal return. These findings
confirm that, indeed, binding say-on-pay is relatively more attractive for shareholders of
firms that have performed poorly than for those that have performed well.22 (We find similar
results for the risk-adjusted performance measure.)
Second, we consider variation in share price reactions depending on the current pay
level.23 If a company overpays or underpays its management, this suggests poor governance.
The positive quadratic abnormal compensation term in Table 3 (coupled with the negative
main effect) suggests that shareholders react more favorably in firms where pay practices are
suboptimal in this respect. Our results in Table 3 suggest that for those companies paying
their CEOs CHF 1.0m or more above the expected normal compensation level (about 25%
of the observations in our sample), alignment benefits outweigh implementation costs.
This result confirms findings in the case of advisory say-on-pay in the US and the UK,
where those firms with the highest abnormal pay benefited substantially from enhanced
22This result is also consistent with an explanation based on extra-contractual investments. If performancewas high in the past, this suggests that the firm had an able CEO who made substantial firm-specificinvestments. This CEO, or a successor, may be less likely to continue doing so under the new regime.
23Ertimur, Ferri, and Muslu (2011) document that in the U.S., activists target firms with high CEO pay,but voting support is high and subsequent pay changes occur only at firms with excess CEO pay.
21
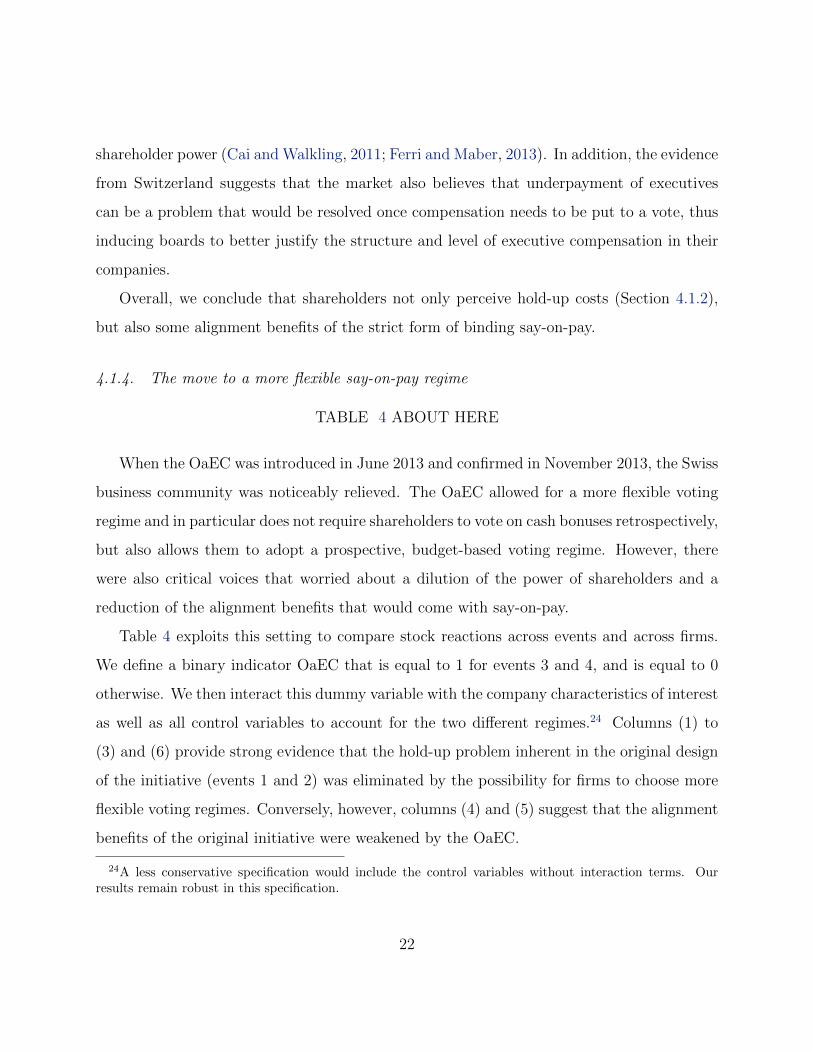
shareholder power (Cai and Walkling, 2011; Ferri and Maber, 2013). In addition, the evidence
from Switzerland suggests that the market also believes that underpayment of executives
can be a problem that would be resolved once compensation needs to be put to a vote, thus
inducing boards to better justify the structure and level of executive compensation in their
companies.
Overall, we conclude that shareholders not only perceive hold-up costs (Section 4.1.2),
but also some alignment benefits of the strict form of binding say-on-pay.
4.1.4. The move to a more flexible say-on-pay regime
TABLE 4 ABOUT HERE
When the OaEC was introduced in June 2013 and confirmed in November 2013, the Swiss
business community was noticeably relieved. The OaEC allowed for a more flexible voting
regime and in particular does not require shareholders to vote on cash bonuses retrospectively,
but also allows them to adopt a prospective, budget-based voting regime. However, there
were also critical voices that worried about a dilution of the power of shareholders and a
reduction of the alignment benefits that would come with say-on-pay.
Table 4 exploits this setting to compare stock reactions across events and across firms.
We define a binary indicator OaEC that is equal to 1 for events 3 and 4, and is equal to 0
otherwise. We then interact this dummy variable with the company characteristics of interest
as well as all control variables to account for the two different regimes.24 Columns (1) to
(3) and (6) provide strong evidence that the hold-up problem inherent in the original design
of the initiative (events 1 and 2) was eliminated by the possibility for firms to choose more
flexible voting regimes. Conversely, however, columns (4) and (5) suggest that the alignment
benefits of the original initiative were weakened by the OaEC.
24A less conservative specification would include the control variables without interaction terms. Ourresults remain robust in this specification.
22

In sum, the central result revealed in our analysis is a so far empirically unexplored trade-
off: The overall reaction of shareholders to enhanced power not only reflects the trade-off
between alignment benefits and compliance costs, but also a trade-off between alignment
benefits and a worsening of the hold-up problem.
4.1.5. Further results: Firm size and shareholder structure
We also explore the role of additional variables, such as firm size, management shareholdings
and blockholder presence.
First, consider company size. Many of the very large Swiss firms had already introduced
advisory say-on-pay in 2007. As a result, alignment between shareholders and management in
large companies is arguably already better than in small companies that only start interacting
with their shareholders as a result of the initiative. An established regular interaction with
its largest shareholders allows companies to better explain its compensation and adapt to
their feedback, reducing the uncertainty surrounding compensation-related shareholder votes.
Consequently, hold-up is arguably less pronounced in larger companies. Furthermore, it
seems reasonable to assume that fixed costs associated with binding say-on-pay will weigh
less for the largest firms. Overall, we generally find a positive relationship between firm
size and CARs, suggesting that the effect of lower hold-up and lower implementation costs
dominates.
Next, consider the fraction of management shareholdings. When management holds a
significant portion of shares, this can mean two (non-exclusive) things. On the one hand, if a
manager’s wealth invested in the company outweighs his annual flow of compensation, he has
incentives to invest in extra-contractual efforts. Thus, a more positive/less negative effect of
the initiative is expected. On the other hand, large management shareholdings indicate that
alignment with shareholder interests is already strong. Hence, the initiative is contributing
little in alignment benefits, but predominantly causes implementation costs for the company
23
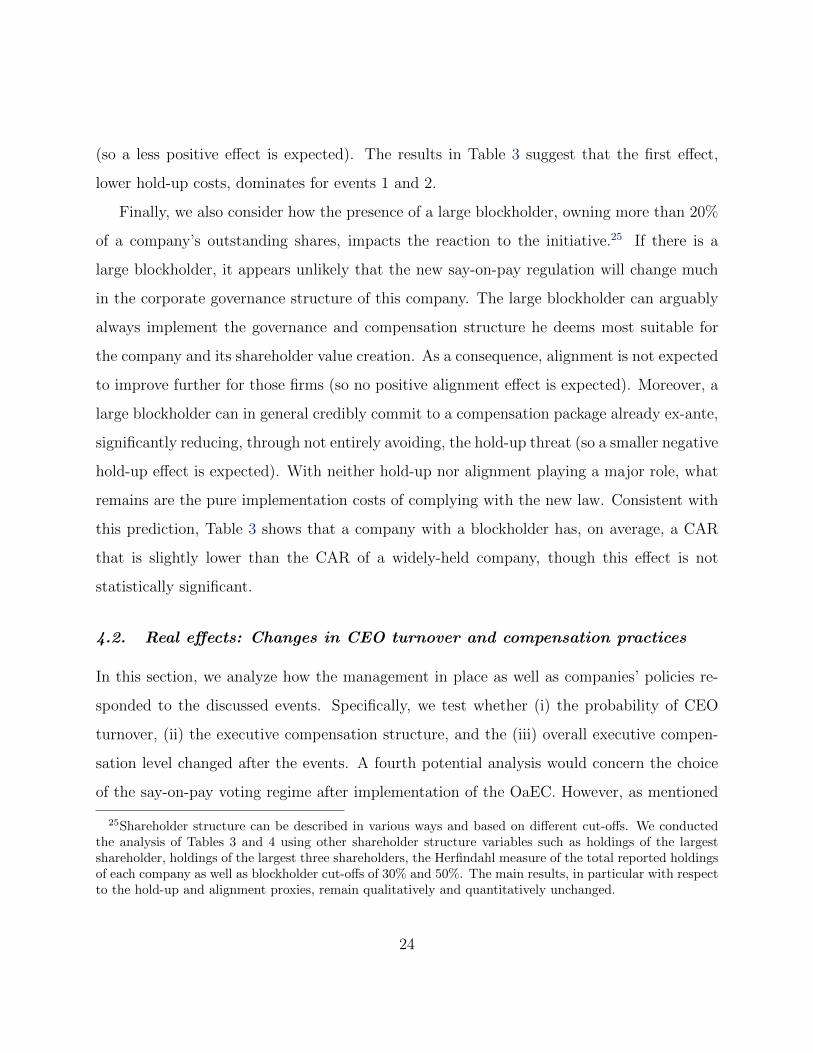
(so a less positive effect is expected). The results in Table 3 suggest that the first effect,
lower hold-up costs, dominates for events 1 and 2.
Finally, we also consider how the presence of a large blockholder, owning more than 20%
of a company’s outstanding shares, impacts the reaction to the initiative.25 If there is a
large blockholder, it appears unlikely that the new say-on-pay regulation will change much
in the corporate governance structure of this company. The large blockholder can arguably
always implement the governance and compensation structure he deems most suitable for
the company and its shareholder value creation. As a consequence, alignment is not expected
to improve further for those firms (so no positive alignment effect is expected). Moreover, a
large blockholder can in general credibly commit to a compensation package already ex-ante,
significantly reducing, through not entirely avoiding, the hold-up threat (so a smaller negative
hold-up effect is expected). With neither hold-up nor alignment playing a major role, what
remains are the pure implementation costs of complying with the new law. Consistent with
this prediction, Table 3 shows that a company with a blockholder has, on average, a CAR
that is slightly lower than the CAR of a widely-held company, though this effect is not
statistically significant.
4.2. Real effects: Changes in CEO turnover and compensation practices
In this section, we analyze how the management in place as well as companies’ policies re-
sponded to the discussed events. Specifically, we test whether (i) the probability of CEO
turnover, (ii) the executive compensation structure, and the (iii) overall executive compen-
sation level changed after the events. A fourth potential analysis would concern the choice
of the say-on-pay voting regime after implementation of the OaEC. However, as mentioned
25Shareholder structure can be described in various ways and based on different cut-offs. We conductedthe analysis of Tables 3 and 4 using other shareholder structure variables such as holdings of the largestshareholder, holdings of the largest three shareholders, the Herfindahl measure of the total reported holdingsof each company as well as blockholder cut-offs of 30% and 50%. The main results, in particular with respectto the hold-up and alignment proxies, remain qualitatively and quantitatively unchanged.
24
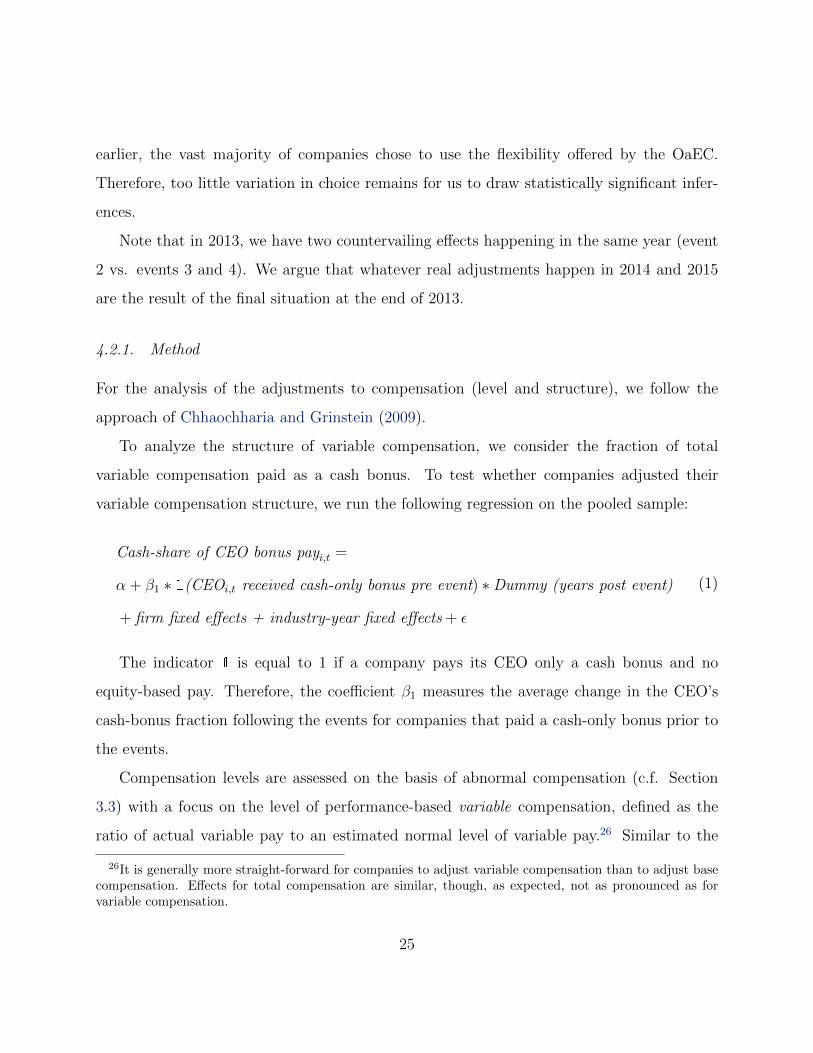
earlier, the vast majority of companies chose to use the flexibility offered by the OaEC.
Therefore, too little variation in choice remains for us to draw statistically significant infer-
ences.
Note that in 2013, we have two countervailing effects happening in the same year (event
2 vs. events 3 and 4). We argue that whatever real adjustments happen in 2014 and 2015
are the result of the final situation at the end of 2013.
4.2.1. Method
For the analysis of the adjustments to compensation (level and structure), we follow the
approach of Chhaochharia and Grinstein (2009).
To analyze the structure of variable compensation, we consider the fraction of total
variable compensation paid as a cash bonus. To test whether companies adjusted their
variable compensation structure, we run the following regression on the pooled sample:
Cash-share of CEO bonus payi,t =
α + β1 ∗ 1(CEOi,t received cash-only bonus pre event) ∗ Dummy (years post event)
+ firm fixed effects + industry-year fixed effects + ε
(1)
The indicator 1 is equal to 1 if a company pays its CEO only a cash bonus and no
equity-based pay. Therefore, the coefficient β1 measures the average change in the CEO’s
cash-bonus fraction following the events for companies that paid a cash-only bonus prior to
the events.
Compensation levels are assessed on the basis of abnormal compensation (c.f. Section
3.3) with a focus on the level of performance-based variable compensation, defined as the
ratio of actual variable pay to an estimated normal level of variable pay.26 Similar to the
26It is generally more straight-forward for companies to adjust variable compensation than to adjust basecompensation. Effects for total compensation are similar, though, as expected, not as pronounced as forvariable compensation.
25
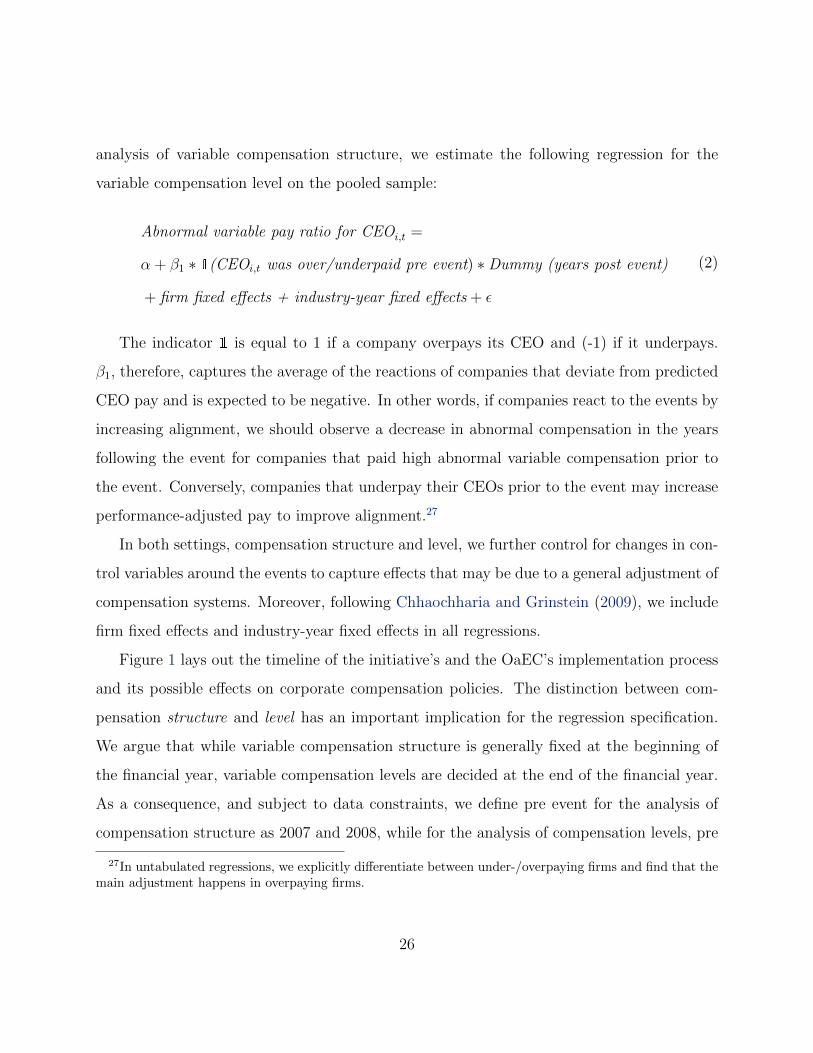
analysis of variable compensation structure, we estimate the following regression for the
variable compensation level on the pooled sample:
Abnormal variable pay ratio for CEOi,t =
α + β1 ∗ 1(CEOi,t was over/underpaid pre event) ∗ Dummy (years post event)
+ firm fixed effects + industry-year fixed effects + ε
(2)
The indicator 1 is equal to 1 if a company overpays its CEO and (-1) if it underpays.
β1, therefore, captures the average of the reactions of companies that deviate from predicted
CEO pay and is expected to be negative. In other words, if companies react to the events by
increasing alignment, we should observe a decrease in abnormal compensation in the years
following the event for companies that paid high abnormal variable compensation prior to
the event. Conversely, companies that underpay their CEOs prior to the event may increase
performance-adjusted pay to improve alignment.27
In both settings, compensation structure and level, we further control for changes in con-
trol variables around the events to capture effects that may be due to a general adjustment of
compensation systems. Moreover, following Chhaochharia and Grinstein (2009), we include
firm fixed effects and industry-year fixed effects in all regressions.
Figure 1 lays out the timeline of the initiative’s and the OaEC’s implementation process
and its possible effects on corporate compensation policies. The distinction between com-
pensation structure and level has an important implication for the regression specification.
We argue that while variable compensation structure is generally fixed at the beginning of
the financial year, variable compensation levels are decided at the end of the financial year.
As a consequence, and subject to data constraints, we define pre event for the analysis of
compensation structure as 2007 and 2008, while for the analysis of compensation levels, pre
27In untabulated regressions, we explicitly differentiate between under-/overpaying firms and find that themain adjustment happens in overpaying firms.
26

event is defined as 2007.
4.2.2. CEO turnover
In line with Hypothesis 1, we argue that CEOs who are most concerned about being held-up
look for alternative job opportunities outside the company.
FIGURE 2 ABOUT HERE
If CEOs worry about hold-up, they are likely to seek alternative employment opportuni-
ties. Consistent with this prediction, Panel a in Figure 2 shows that companies reacting the
most negatively to event 1 saw a sharp increase in their CEO turnover rate, from 17.4% in
2007 to 27.3% in 2009, while in all other firms CEO turnover remained flat, with 18.3% in
2007 and 16.6% in 2009. More specifically, we estimate a normal turnover level based on a
panel regression at firm level (i):
Turnoveri,t =
α + β1 ∗ LowCAREvent1 + β2 ∗ ln(MV )i,t−1 + β3 ∗RelativePerformancei,t−1
+ β4 ∗ CEOAgei,t + β5 ∗ CEOSwissi,t + Γ1industry + Γ2year + ε,
(3)
with Γ1 and Γ2 representing industry and year fixed-effects. The residual of regression 3 is
plotted in Panel b of Figure 2. There is substantial divergence in residual turnover rates
between the two groups.
Regression results in columns (1) and (2) of Table 5 confirm that the turnover rate
in companies that reacted the most negatively to event 1 is significantly higher (about 10
percentage points) than for all other companies in the years following the event. This finding
is robust to the inclusion of further controls such as firm size, total shareholder return, CEO
age, CEO nationality and industry.
27
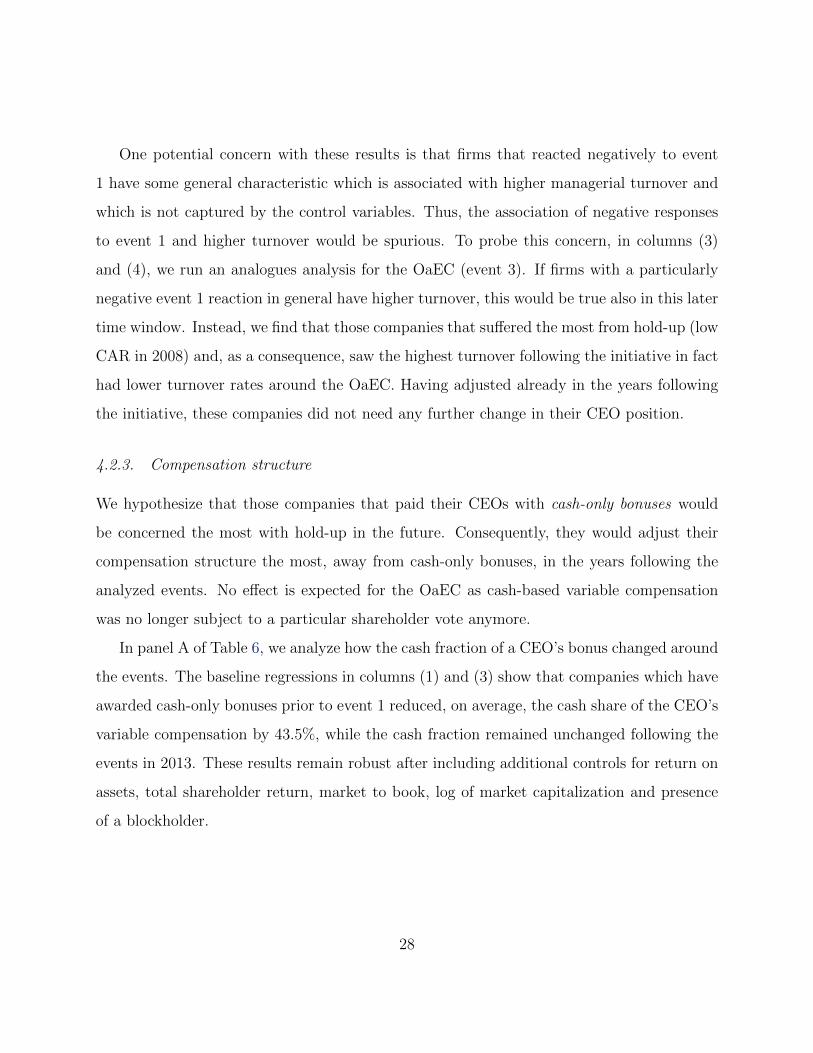
One potential concern with these results is that firms that reacted negatively to event
1 have some general characteristic which is associated with higher managerial turnover and
which is not captured by the control variables. Thus, the association of negative responses
to event 1 and higher turnover would be spurious. To probe this concern, in columns (3)
and (4), we run an analogues analysis for the OaEC (event 3). If firms with a particularly
negative event 1 reaction in general have higher turnover, this would be true also in this later
time window. Instead, we find that those companies that suffered the most from hold-up (low
CAR in 2008) and, as a consequence, saw the highest turnover following the initiative in fact
had lower turnover rates around the OaEC. Having adjusted already in the years following
the initiative, these companies did not need any further change in their CEO position.
4.2.3. Compensation structure
We hypothesize that those companies that paid their CEOs with cash-only bonuses would
be concerned the most with hold-up in the future. Consequently, they would adjust their
compensation structure the most, away from cash-only bonuses, in the years following the
analyzed events. No effect is expected for the OaEC as cash-based variable compensation
was no longer subject to a particular shareholder vote anymore.
In panel A of Table 6, we analyze how the cash fraction of a CEO’s bonus changed around
the events. The baseline regressions in columns (1) and (3) show that companies which have
awarded cash-only bonuses prior to event 1 reduced, on average, the cash share of the CEO’s
variable compensation by 43.5%, while the cash fraction remained unchanged following the
events in 2013. These results remain robust after including additional controls for return on
assets, total shareholder return, market to book, log of market capitalization and presence
of a blockholder.
28

4.2.4. Compensation level
We hypothesize that those companies that paid their CEOs the highest abnormal variable
compensation, arguably as a result of low shareholder alignment, will react the most, by
reducing their abnormal compensation levels, in the years following the analyzed events.
TABLE 6 ABOUT HERE
For CEO abnormal variable pay, baseline regressions in columns (1) and (3) in panel
B of Table 6 show that companies that paid an abnormal variable compensation prior to
the event adjusted their abnormal variable compensation in a statistically significant way
during the two years following the event towards the expected normal variable compensation
level. This holds for the event in 2008 as well as the events in 2013. The effect suggests
that, on average, previously over-/underpaying companies reduced/increased their abnormal
compensation by 16.6% and 21.3%, respectively, following the regulatory steps. This effect
remains unchanged for both events after we introduce various controls for other changes
possibly occurring around the event year (regressions (2) and (4) of Table 6). These results
are also in line with the stock price reaction found earlier: Shareholders of companies with
the most overpaid CEOs reacted most positively because these companies indeed reduced
excessive variable compensation. Thus, for both channels that we analyze, the shareholder
reaction (which was based on expected company policy changes) seems vindicated by what
companies actually did.
5. Robustness
5.1. Parallel trends of CARs before the events
By considering cross-sectional variation of abnormal returns during the event windows, we
have established that firms exhibited different reactions to the regulatory changes. It is
29
conceivable, however, that firms already exhibited different pre-event trends. This could
lead to erroneous inferences regarding the causal effects of the events.
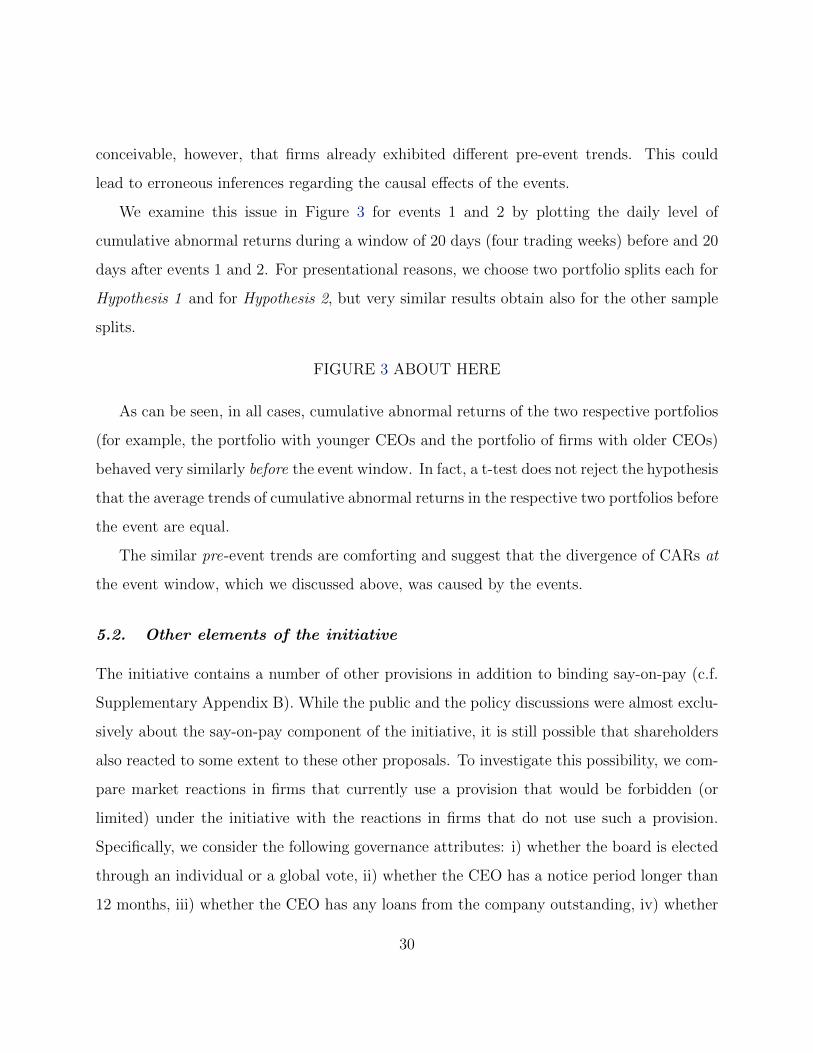
We examine this issue in Figure 3 for events 1 and 2 by plotting the daily level of
cumulative abnormal returns during a window of 20 days (four trading weeks) before and 20
days after events 1 and 2. For presentational reasons, we choose two portfolio splits each for
Hypothesis 1 and for Hypothesis 2, but very similar results obtain also for the other sample
splits.
FIGURE 3 ABOUT HERE
As can be seen, in all cases, cumulative abnormal returns of the two respective portfolios
(for example, the portfolio with younger CEOs and the portfolio of firms with older CEOs)
behaved very similarly before the event window. In fact, a t-test does not reject the hypothesis
that the average trends of cumulative abnormal returns in the respective two portfolios before
the event are equal.
The similar pre-event trends are comforting and suggest that the divergence of CARs at
the event window, which we discussed above, was caused by the events.
5.2. Other elements of the initiative
The initiative contains a number of other provisions in addition to binding say-on-pay (c.f.
Supplementary Appendix B). While the public and the policy discussions were almost exclu-
sively about the say-on-pay component of the initiative, it is still possible that shareholders
also reacted to some extent to these other proposals. To investigate this possibility, we com-
pare market reactions in firms that currently use a provision that would be forbidden (or
limited) under the initiative with the reactions in firms that do not use such a provision.
Specifically, we consider the following governance attributes: i) whether the board is elected
through an individual or a global vote, ii) whether the CEO has a notice period longer than
12 months, iii) whether the CEO has any loans from the company outstanding, iv) whether
30
the company has change in control clause that would benefit the current management, v)
whether the CEO has termination benefits.
In Table A1, we provide regressions including proxies for the different other provisions
of the initiative. While all previous findings retain their sign and significance, none of the
other variables related to the initiative have a significant association with the CARs. There
is a modest indication that change in control clauses entail, on average, an agency problem
and that their abolishment is impacting a company’s value positively.
Overall, these findings confirm that the primary aspect to which shareholders reacted
was the new say-on-pay regime.
6. Conclusion
Policy makers around the world are active in enhancing shareholder rights. Yet, from a
theoretical perspective, it is not clear that more is always better for shareholders. This paper
lends empirical support to this idea. Specifically, this analysis uses a series of regulatory
events to investigate how shareholder power impacts shareholder value. It does so in the
context of the adoption and implementation of the Swiss “Abzocker-Initiative.”
The cross-sectional variation in stock price reactions is consistent with the view that
shareholders rationally anticipate that binding say-on-pay has benefits and costs for them.
Greater power provides shareholders with an enhanced ability to ensure alignment of man-
agerial interests with shareholder value. But we also find evidence of the negative side of
binding say-on-pay. Theory predicts that this additional power would have been likely to
ex-ante distort extra-contractual managerial investments that are specific to the firm. Con-
sistent with this prediction, companies more exposed to this problem reacted more negatively.
In the second two phases of the regulatory process – when the “Ordinance against Exces-
sive Compensation” was released, which allowed more flexible voting systems including, for
example, a prospective bonus budget system – shareholders needed to worry less about the
31

hold-up problem, but also realized a somewhat reduced alignment benefit. This again was
reflected in stock price reactions. By highlighting the resulting trade-off between agency
versus hold-up, we believe that this is one of the first papers to empirically support the argu-
ment, so far mostly presented in theoretical discussions, that it may be in the best interests
of shareholders not to maximize their power.
These findings have important implications for the current policy discussion on how to
design shareholder rights laws. Policymakers should recognize that shareholders may do
well to cede some control to directors (as they do under advisory say-on-pay, compared to
binding say-on-pay, and as they do when they approve prospective compensation budgets,
rather than retrospective bonus amounts).
Overall, while the idea of “power to the people” (the most explicit form of which is
direct democracy) is morally appealing, our findings suggest that a stronger and more direct
“shareholder democracy” may not generally be in the interest of shareholders themselves.
The unique political setting of Switzerland illustrates this point most directly: 68% of voters
approved the say-on-pay referendum, but 70% of stock price reactions were negative in
response to the initial launch of the referendum. As such, this study highlights that there
can be substantial tensions as regards corporate governance not only within firms (between
shareholders and managers) but also between firms (shareholders) and society more broadly.
Understanding and mitigating these tensions is important for a stable society, and future
research should, therefore, shed more light on these questions.
32
References
Bebchuk, Lucian A., Martijn Cremers, and Urs Peyer, 2011, The CEO pay slice, Journal ofFinancial Economics 102, 199–221.
Becker, Bo, Daniel Bergstresser, and Guhan Subramanian, 2013, Does Shareholder ProxyAccess Improve Firm Value? Evidence from the Business Roundtable Challenge, Journalof Law and Economics 56, 127 – 160.
Blair, Margaret M., and Lynn A. Stout, 1999, A Team Production Theory of Corporate Law,Virginia Law Review 85, 247–328.
Brunarski, Kelly R, T Colin Campbell, and Yvette S Harman, 2015, Evidence on the out-come of say-on-pay votes: How managers, directors, and shareholders respond, Journal ofCorporate Finance 30, 132–149.
Burkart, Mike, Denis Gromb, and Fausto Panunzi, 1997, Large Shareholders, Monitoring,and the Value of the Firm, Quarterly Journal of Economics 112, 693–728.
Burkart, Mike, Salvatore Miglietta, and Charlotte Østergaard, 2017, Why do Boards Exist?Governance Design in the Absence of Corporate Law, Working paper.
Cai, Jie, and Ralph A. Walkling, 2011, Shareholders’ Say on Pay: Does it Create Value?,Journal of Financial and Quantitative Analysis 46, 299–339.
Chhaochharia, Vidhi, and Yaniv Grinstein, 2009, CEO compensation and board structure,The Journal of Finance 64, 231–261.
Cohn, Jonathan B., Stuart Gillan, and Jay C. Hartzell, 2016, On Enhancing ShareholderControl: A (Dodd-) Frank Assessment of Proxy Access, The Journal of Finance 71, 1623–1668.
Cohn, Jonathan B, and Uday Rajan, 2013, Optimal corporate governance in the presence ofan activist investor, Review of Financial Studies 26, 985–1020.
Conyon, Martin J., and Graham Sadler, 2010, Shareholder voting and directors’ remunerationreport legislation: Say on pay in the UK, Corporate Governance: An International Review18, 296–312.
Cornelli, Francesca, Zbigniew Kominek, and Alexander Ljungqvist, 2013, Monitoring Man-agers: Does It Matter?, The Journal of Finance 68, 431–481.
Correa, Ricardo, and Ugur Lel, 2016, Say on pay laws, executive compensation, pay slice,firm value around the world, Journal of Financial Economics forthcoming.
Cunat, Vicente, Mireia Gine, and Maria Guadalupe, 2016, Say pays! Shareholder voice andfirm performance, Review of Finance 20, 1799–1834.
Ertimur, Yonca, Fabrizio Ferri, and Volkan Muslu, 2011, Shareholder activism and CEO pay,Review of Financial Studies 24, 535–592.
Ferri, Fabrizio, and David A. Maber, 2013, Say on Pay Votes and CEO Compensation:Evidence from the UK, Review of Finance 17, 527–563.
33

Frey, Bruno S., 1994, Direct Democracy: Politico-Economic Lessons from Swiss Experience,The American Economic Review 84, 338–342.
Gompers, Paul A., Joy L. Ishii, and Andrew Metrick, 2003, Corporate governance and equityprices, Quarterly Journal of Economics 118, 107–155.
Gox, Robert F., Frederic Imhof, and Alexis H. Kunz, 2014, The Enforcement of Say on PayVotes and CEOs’ Investment Incentives, Working paper.
Grossman, Sanford, and Oliver Hart, 1986, The costs and benefits of ownership: A theoryof vertical and lateral integration, Journal of Political Economy 94, 691–719.
Hart, Oliver, and John Moore, 1990, Property rights and the nature of the firm, Journal ofPolitical Economy 98, 1119–1158.
, 2008, Contracts as reference points, Quarterly Journal of Economics 123, 1–48.
Hong, Harrison, Terence Lim, and Jeremy C. Stein, 2000, Bad News Travels Slowly: Size,Analyst Coverage, and the Profitability of Momentum Strategies, Journal of Finance 55,265–295.
Hou, Kewei, and Tobias J. Moskowitz, 2005, Market Frictions, Price Delay, and the Cross-Section of Expected Returns, Review of Financial Studies 18, 981–1020.
Ince, Ozgur S., and R. Burt Porter, 2006, Individual equity return data from ThomsonDatastream: Handle with care!, Journal of Financial Research 29, 463–479.
Kloeti, Ulrich, Peter Knoepfel, Hanspeter Kriesi, Wolf Linder, Yannis Papadopoulos, andPascal Sciarini, 2007, Handbook of Swiss Politics (Neue Zurcher Zeitung NZZ Libro:Zurich) 2nd edn.
Kothari, S. P., and Jerold B. Warner, 2007, Econometrics of event studies, in B. EspenEckbo, ed.: Handbook of Corporate Finance: Empirical Corporate Financevol. 1 . pp.3–35 (Elsevier, Oxford, UK).
Kronlund, Mathias, and Shastri Sandy, 2014, Does shareholder scrutiny affect executivecompensation? Evidence from say-on-pay voting, Working paper.
Larcker, David F., Gaizka Ormazabal, and Daniel J. Taylor, 2011, The market reaction tocorporate governance regulation, Journal of Financial Economics 101, 431–448.
MacKinlay, A. Craig, 1997, Event Studies in Economics and Finance, Journal of EconomicLiterature 35, 13–39.
Pagano, Marco, and Paolo Volpin, 2001, The political economy of finance, Oxford Review ofEconomic Policy 17, 502–519.
Pagano, Marco, and Paolo F. Volpin, 2005, The political economy of corporate governance,American Economic Review 95, 1005–1030.
Peng, Lin, 2005, Learning with Information Capacity Constraints, Journal of Financial andQuantitative Analysis 40, 307–329.
Perotti, Enrico C., 2014, The political economy of finance, Capitalism and Society 9, 1–44.
34

, and Ernst-Ludwig von Thadden, 2006, The political economy of corporate controland labor rents, Journal of Political Economy 114, 145–175.
Roe, Mark J., 2000, Political Preconditions to Separating Ownership from Control: TheIncompatibility of the American Public Firm with Social Democracy, Stanford Law Review53, 536–606.
, and Massimiliano Vatiero, 2015, Corporate Governance and Its Political Economy,Working paper.
Schwert, G. William, 1981, Using financial data to measure effects of regulation, Journal ofLaw and Economics 24, 121–158.
Stout, Lynn A., 2003, The Shareholder as Ulysses: Some Empirical Evidence on Why In-vestors in Public Corporations Tolerate Board Governance, University of PennsylvaniaLaw Review 152, 667–712.
SWIPRA, 2016, Corporate Governance between Globalization, Shareholder Activism andProxy Advisors, http://swipra.ch/wp-content/uploads/2017/03/SWIPRASurvey2016.pdf.
Thomas, Randall S., Alan R. Palmiter, and James F. Cotter, 2012, Dodd-Frank’s Say onPay: Will It Lead To A Greater Role For Shareholders in Corporate Governance?, CornellLaw Review 97, 1213–1266.
Zhang, Jenny Li, Kin Lo, and Shuo Yang, 2014, Say-on-pay votes and compensation practice,Working paper.
35
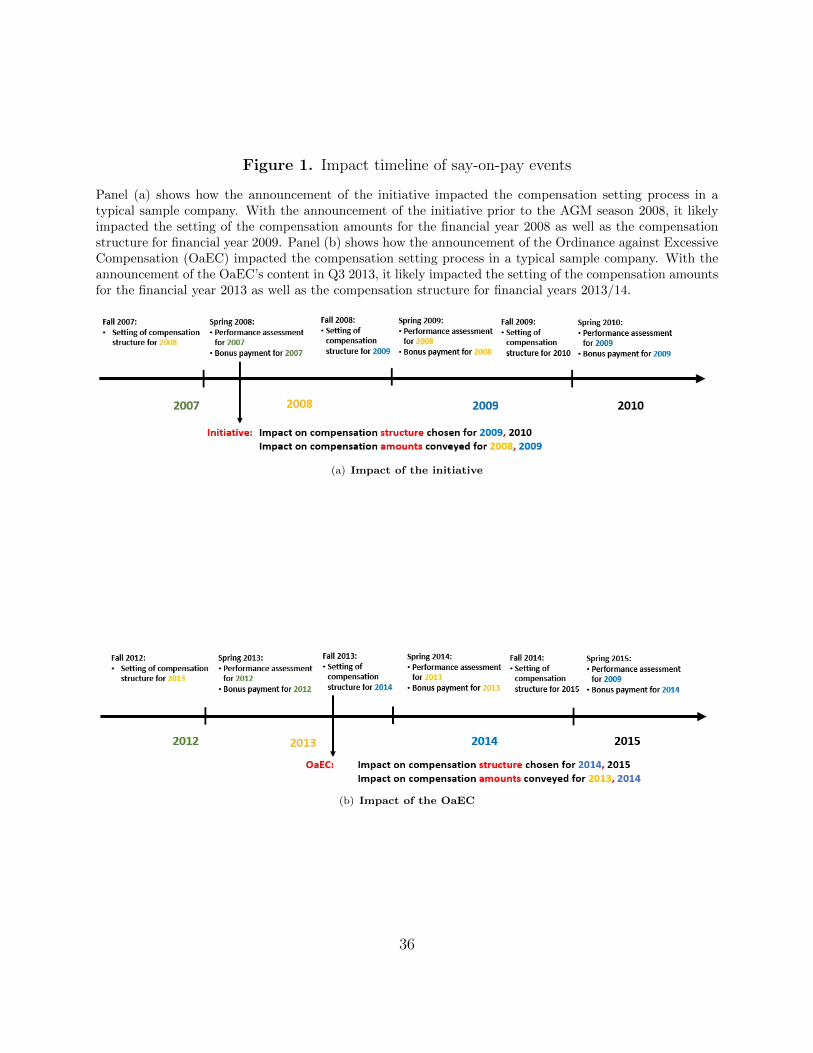
Figure 1. Impact timeline of say-on-pay events
Panel (a) shows how the announcement of the initiative impacted the compensation setting process in atypical sample company. With the announcement of the initiative prior to the AGM season 2008, it likelyimpacted the setting of the compensation amounts for the financial year 2008 as well as the compensationstructure for financial year 2009. Panel (b) shows how the announcement of the Ordinance against ExcessiveCompensation (OaEC) impacted the compensation setting process in a typical sample company. With theannouncement of the OaEC’s content in Q3 2013, it likely impacted the setting of the compensation amountsfor the financial year 2013 as well as the compensation structure for financial years 2013/14.
(a) Impact of the initiative
(b) Impact of the OaEC
36

Figure 2. CEO turnover around event 1
Panel (a) shows the unconditional development of the average CEO turnover rate around event 1. Panel(b) shows the average annual residual of the expected turnover regression (probit): turnover=α + β1 age+ β2 relative performancet−1 + β3 ln(MV)t−1 + Γ1 industry + Γ2 year + ε estimated for the 100 largestcompanies of the Swiss Performance Index for the years 2007 - 2015. The vertical axis represents the annualturnover rate (panel a) and percentage point deviation of the actual from the expected turnover rate (panelb). Both panels split the sample according to the abnormal cumulative return around event 1, where Q1represents the companies in the quartile of the lowest (that is, the most negative) cumulative abnormalreturns and Other companies represent companies in quartiles 2-4.
(a) Turnover rates (b) Residual turnover rates
37
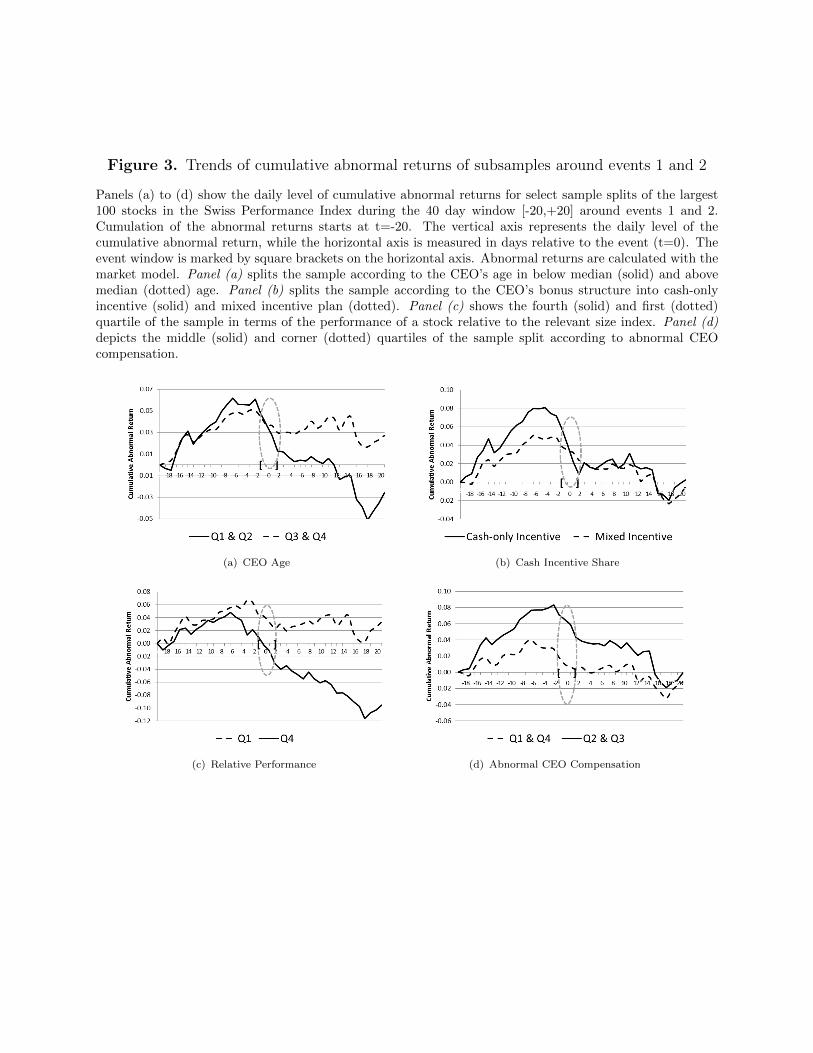
Figure 3. Trends of cumulative abnormal returns of subsamples around events 1 and 2
Panels (a) to (d) show the daily level of cumulative abnormal returns for select sample splits of the largest100 stocks in the Swiss Performance Index during the 40 day window [-20,+20] around events 1 and 2.Cumulation of the abnormal returns starts at t=-20. The vertical axis represents the daily level of thecumulative abnormal return, while the horizontal axis is measured in days relative to the event (t=0). Theevent window is marked by square brackets on the horizontal axis. Abnormal returns are calculated with themarket model. Panel (a) splits the sample according to the CEO’s age in below median (solid) and abovemedian (dotted) age. Panel (b) splits the sample according to the CEO’s bonus structure into cash-onlyincentive (solid) and mixed incentive plan (dotted). Panel (c) shows the fourth (solid) and first (dotted)quartile of the sample in terms of the performance of a stock relative to the relevant size index. Panel (d)depicts the middle (solid) and corner (dotted) quartiles of the sample split according to abnormal CEOcompensation.
(a) CEO Age (b) Cash Incentive Share
(c) Relative Performance (d) Abnormal CEO Compensation

Table 1. Summary statistics
This table displays firm summary statistics averaged over all four events considered in the analysis. Thelargest 100 firms in the Swiss Performance Index (SPI) constitute the sample for each event. Sales Volatilityis a firm’s ratio of the standard deviation of sales to the average sales over the last five years. RelativePerformance measures the difference between the observed stock return and the return of the correspondingSPI size-index over a one year period prior to the event window. Management Shareholdings is the percentageof outstanding equity held by the firm’s management and board. Blockholder is a dummy variable equal to1 if the largest shareholder owns a stake of more than 20% in the company. Market Capitalization measuresthe market value of the free float on event day closing. Company Event is a binary indicator equal to one ifthe firm held an earnings call during a 10 day window around the event window. Abnormal Trading Volumeis the ratio between the trading volume in the event window and the median trading volume of the respectivefirm in the previous year. CEO Cash Incentive Share is the share of a CEO’s variable remuneration that ispaid in cash. Abnormal CEO Compensation is measured as the difference between paid CEO compensationand estimated CEO normal compensation in terms of firm size, relative performance and tenure within thelast year. Only abnormal compensation values below CHF 5.0m are considered. CEO Total Compensationis the sum of a CEO’s base and variable pay. CEO Variable Compensation is the sum of all variable CEOpay disbursed in cash and stock. CEO Turnover is a dummy variable equal to 1 if there was a CEO turnoverduring the calendar year. CEO Swiss is a dummy variable equal to 1 if the CEO’s nationality is Swiss. Dualis a dummy variable equal to 1 if the CEO also serves as chairman of the board of the same company. CAREvent 1 - 4 is the cumulative abnormal return of the sample firms during a three day event window. CARsare based on market model estimations.
Variable Mean Std. Dev. Min. Max. Firms
Firm CharacteristicsSales Volatility (ratio) 0.18 0.20 0.02 1.51 116Relative Performance (p.a.) 0.03 0.28 -0.62 1.49 114Management Shareholdings (in %) 0.10 0.26 0.00 2.21 115Blockholder (binary indicator) 0.337 0.455 0 1 115Market Capitalization (in Mio. CHF) 10’020 29’636 286.1 205’736 116Company Event (binary indicator) 0.12 0.20 0.00 1.00 116Abnormal Trading Volume (ratio) 0.49 1.07 -0.62 9.67 114
CEO Compensation & AttributesCEO Cash Incentive Share 0.61 0.30 0.00 1.00 116CEO Age (years) 53.54 5.85 37.00 73.00 115Abnormal CEO Compensation (in Mio. CHF) 0.37 1.48 -3.13 4.82 111CEO Total Compensation (in Mio. CHF) 3.44 3.10 0.48 15.42 116CEO Variable Compensation (in Mio. CHF) 1.88 2.29 0.00 11.61 116CEO Turnover (binary indicator) .19 .35 0 1 116CEO Swiss (binary indicator) 0.59 0.49 0 1.00 114Dual (binary indicator) 0.07 0.22 0.00 1.00 114
EventsCAR Event 1 (in %) -1.84 4.19 -16.85 6.57 97CAR Event 2 (in %) -0.003 2.39 -6.44 10.64 97CAR Event 3 (in %) -0.01 1.78 -7.90 4.74 97CAR Event 4 (in %) -0.55 1.77 -5.83 5.03 97
39

Table 2. Correlations of explanatory variables
This table displays average correlations of the explanatory variables of the sample firms over all four eventsconsidered in the analysis. Variables are defined in Table 1.
Variables 1 2 3 4 5 6 7 8 9 10 11
CEO Cash Incentive Share 1.00
CEO Age -0.01 1.00
Sales Volatility -0.03 -0.02 1.00
Relative Performance -0.08 -0.08 0.13 1.00
Abnormal CEO Compensation -0.14 -0.02 0.13 0.07 1.00
Management Shareholdings 0.16 0.14 0.08 -0.01 0.09 1.00
Blockholder 0.14 0.02 -0.01 -0.02 -0.11 0.17 1.00
ln(Market Capitalization) -0.53 0.14 -0.28 0.00 0.08 -0.16 -0.12 1.00
Abnormal Trading Volume 0.03 -0.00 0.18 0.02 -0.08 0.08 0.03 -0.22 1.00
CEO Turnover 0.12 -0.05 -0.00 -0.06 -0.09 -0.09 0.01 -0.00 -0.06 1.00
CEO Swiss 0.40 0.02 0.05 -0.02 -0.22 0.05 0.06 -0.39 0.08 -0.11 1.00

Table 3. Market reaction to binding say-on-pay, events 1 and 2
Regressions in this table are based on events 1 and 2 where, according to the legislation process, compensationvotes were subject to retrospective shareholder approval only. The dependent variable is the CumulativeAbnormal Return during the three day event window in each event. The explanatory variables are defined inTable 1. Variables appended by quartile specifications are indicator variables with the indicator equal to onefor the quartile stated. For example, Young CEO (Q1&Q2) is a binary indicator equal to one if the CEO’sage is below median. t-values are calculated based on robust standard errors and reported in brackets, withsignificance levels: * 0.10, ** 0.05, *** 0.01.
Dependent variable: Cumulative Abnormal Return (%)
(1) (2) (3) (4)
Cash-only Incentive (Q4) -0.014* -0.013**(-1.90) (-1.98)
Young CEO (Q1&Q2) -0.009** -0.008*(-2.01) (-1.88)
Sales Volatility (Q3&Q4) -0.008* -0.011**(-1.71) (-2.41)
Relative Performance -0.026*** -0.022** -0.023** -0.025***(-3.13) (-2.20) (-2.44) (-3.32)
Abnormal CEO Compensation -0.004** -0.004** -0.004* -0.004**(-2.29) (-2.12) (-1.92) (-2.28)
(Abnormal CEO Compensation)2 0.002 0.002* 0.002 0.001(1.65) (1.71) (1.53) (1.55)
Management Shareholdings 0.033*** 0.028** 0.032** 0.035**(2.77) (2.34) (2.55) (2.60)
Blockholder -0.007 -0.003 -0.003 -0.006(-1.65) (-0.68) (-0.69) (-1.50)
ln(Market Capitalization) 0.003 0.004** 0.004** 0.002(1.50) (1.98) (2.23) (1.17)
Company Event 0.003 0.008 0.008 0.003(0.48) (1.25) (1.20) (0.56)
Abnormal Trading Volume -0.007 -0.005 -0.005 -0.006(-1.56) (-1.04) (-1.03) (-1.56)
Constant -0.091*** -0.057** -0.089*** -0.063***(-5.97) (-2.30) (-5.75) (-4.40)
Industry fixed effects Yes Yes Yes Yes
Observations 159 164 164 159Adjusted R-squared 0.256 0.189 0.187 0.288
41

Table 4. Market reaction to binding say-on-pay, comparing strict and flexible regimes
Regressions in this table are based on all four events. Events 1 and 2 were subject to the original initiativewhich required that compensation votes are subject to retrospective shareholder approval. Events 3 and 4were subject to the Ordinance against Excessive Compensation (OaEC), which allowed for a more flexiblecompensation voting regime. This switch in compensation voting regimes is captured by the variable OaEC,which is equal to 1 for events 3 and 4 (flexible voting regime) and 0 for events 1 and 2 (strict votingregime). The interaction terms, marked as *OaEC, provide an indication of how the switch in voting regimewas perceived by the stock market. The dependent variable is the Cumulative Abnormal Return during thethree day event window in each event. The explanatory variables are defined in Table 1. Variables appendedby quartile specifications are indicator variables with the indicator equal to one for the quartile stated. Forexample, Young CEO (Q1&Q2) is a binary indicator equal to one if the CEO is of below median age. Controlsindicate that the regressions control, besides the indicated interacted variables, for all explanatory variablesused in Table 3 as well as their *OaEC-cross-terms. t-values are calculated based on robust standard errorsand reported in brackets, with significance levels: * 0.10, ** 0.05, *** 0.01.
Dependent variable: Cumulative Abnormal Return (%)
(1) (2) (3) (4)
Cash-only Incentive (Q4) -0.015** -0.015**(-2.27) (-2.40)
Cash-only Incentive * OaEC 0.018** 0.018**(2.25) (2.30)
Young CEO (Q1&Q2) -0.008* -0.007(-1.82) (-1.56)
Young CEO (Q1&Q2) * OaEC 0.009* 0.008(1.84) (1.64)
Sales Volatility (Q3&Q4) -0.008* -0.011**(-1.68) (-2.42)
Sales Volatility (Q3&Q4) * OaEC 0.010* 0.013**(1.76) (2.37)
Relative Performance -0.027*** -0.023** -0.024*** -0.026***(-3.31) (-2.38) (-2.62) (-3.50)
Relative Performance * OaEC 0.019** 0.012 0.013 0.018**(2.05) (1.17) (1.27) (2.04)
Abnormal CEO Compensation -0.004** -0.004** -0.003* -0.004**(-2.36) (-2.14) (-1.89) (-2.33)
Abnormal CEO Compensation * OaEC 0.005** 0.004** 0.003* 0.004**(2.48) (2.10) (1.76) (2.36)
(Abnormal CEO Compensation)2 0.001 0.002 0.002 0.001(1.50) (1.64) (1.45) (1.33)
(Abnormal CEO Compensation)2 * OaEC -0.002* -0.002* -0.002 -0.001(-1.73) (-1.84) (-1.60) (-1.54)
OaEC 0.015 0.027 0.022 -0.013(0.91) (1.52) (1.30) (-0.75)
Constant -0.022 -0.039* -0.037** 0.004(-1.16) (-1.95) (-1.99) (0.21)
Controls Yes Yes Yes YesIndustry fixed effects Yes Yes Yes Yes
Observations 329 344 344 329Adjusted R-squared 0.226 0.168 0.169 0.246
42
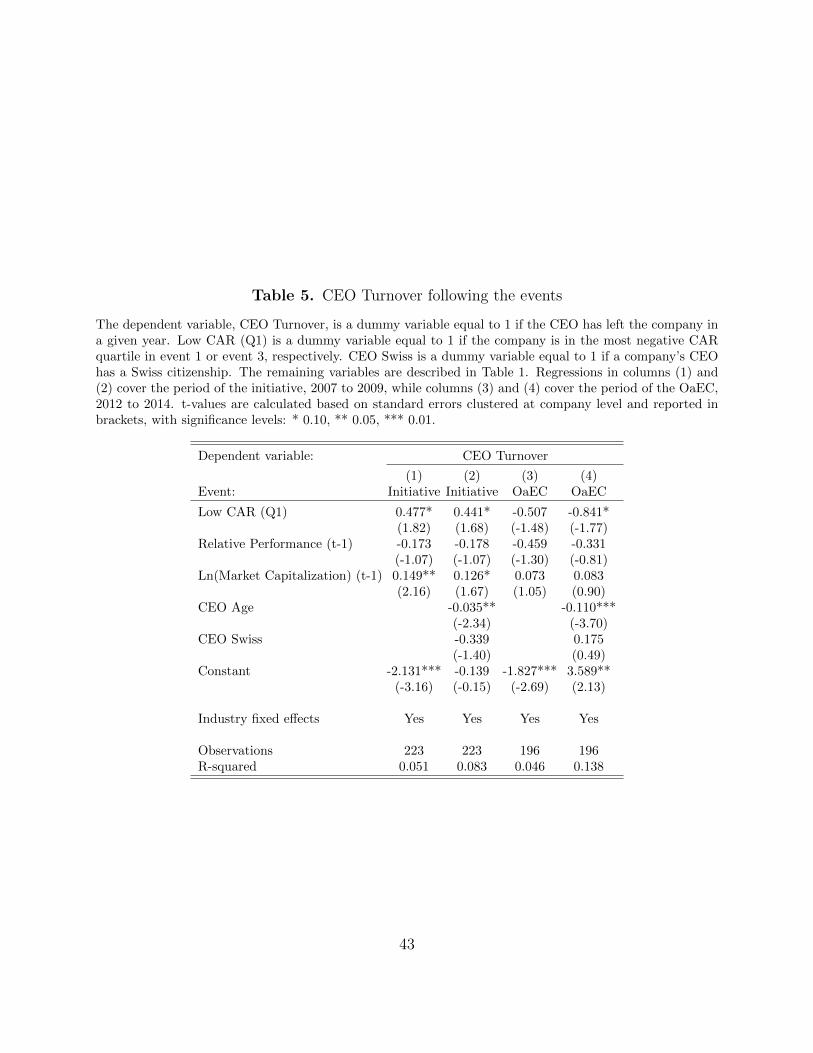
Table 5. CEO Turnover following the events
The dependent variable, CEO Turnover, is a dummy variable equal to 1 if the CEO has left the company ina given year. Low CAR (Q1) is a dummy variable equal to 1 if the company is in the most negative CARquartile in event 1 or event 3, respectively. CEO Swiss is a dummy variable equal to 1 if a company’s CEOhas a Swiss citizenship. The remaining variables are described in Table 1. Regressions in columns (1) and(2) cover the period of the initiative, 2007 to 2009, while columns (3) and (4) cover the period of the OaEC,2012 to 2014. t-values are calculated based on standard errors clustered at company level and reported inbrackets, with significance levels: * 0.10, ** 0.05, *** 0.01.
Dependent variable: CEO Turnover
(1) (2) (3) (4)Event: Initiative Initiative OaEC OaEC
Low CAR (Q1) 0.477* 0.441* -0.507 -0.841*(1.82) (1.68) (-1.48) (-1.77)
Relative Performance (t-1) -0.173 -0.178 -0.459 -0.331(-1.07) (-1.07) (-1.30) (-0.81)
Ln(Market Capitalization) (t-1) 0.149** 0.126* 0.073 0.083(2.16) (1.67) (1.05) (0.90)
CEO Age -0.035** -0.110***(-2.34) (-3.70)
CEO Swiss -0.339 0.175(-1.40) (0.49)
Constant -2.131*** -0.139 -1.827*** 3.589**(-3.16) (-0.15) (-2.69) (2.13)
Industry fixed effects Yes Yes Yes Yes
Observations 223 223 196 196R-squared 0.051 0.083 0.046 0.138
43

Table 6. Adjustments in compensation following the events
Regressions in this table are based on events 1 and 2 (Initiative) and events 3 and 4 (OaEC). In Panel A,the dependent variable is the Cash-share of a CEO’s Bonus Pay, i.e., the fraction of variable compensationpaid in cash for a given year. Cash-only is a dummy variable equal to 1 if a company paid the entire bonusin cash prior the Initiative (2007/2008) and the OaEC (2012/2013), respectively. Post event is a dummyvariable equal to 1 for 2009 and 2010 (Initiative) and for 2014 and 2015 (OaEC). In Panel B, the dependentvariable is the Abnormal Variable Pay Ratio, defined as the ratio between actual variable compensationto an estimated normal variable compensation as defined in section 5.1. Variable compensation covers allcompensation that is performance related. AVC is short for abnormal variable compensation. Pre and postrefer to the year of the event (2008 for the initiative and 2013 for the OaEC) considered in the regression.For the Initiative, pre event is equal to 1 for 2007 and 0 otherwise, while post event is equal to 1 for 2008 and2009 and zero otherwise. For the OaEC, pre event is equal to 1 for 2012 and 0 otherwise while post event isequal to 1 for 2013 and 2014 and zero otherwise. 1(Pre AVC) is an indicator variable equal to (1) if AVCis positive and (-1) if AVC is negative. Pre positive (negative) AVC is the actual value of AVC if AVC>0(<0). The differences in pre/post event definitions in the two panels derives from a difference in timingin terms of compensation setting and payout (see Figure 3). Controls are return on assets (ROA), totalshareholder return (return), market to book (M/B), log of market capitalization (ln(market capitalization))and presence of a blockholder controlling ≥20% of a company’s shares (blockholder). t-values are calculatedbased on standard errors clustered at company level and reported in brackets, with significance levels: *0.10, ** 0.05, *** 0.01.
Panel A: Changes in Cash Compensation
Dependent variable: Cash-share of CEO Bonus Pay
(1) (2) (3) (4)Event: Initiative Initiative OaEC OaEC
CEO cash-only bonus pre event -0.435*** -0.500*** 0.011 0.016* dummy(post event) (-3.72) (-3.21) (0.20) (0.25)
Pre/Post Controls No Yes No YesIndustry-year fixed effects Yes Yes Yes Yes
Observations 268 251 296 289R-squared 0.115 0.135 0.095 0.124
Panel B: Changes in Abnormal Variable Compensation
Dependent variable: Abnormal Variable Pay Ratio
(1) (2) (3) (4)Event: Initiative Initiative OaEC OaEC
1(Pre AVC)*dummy(post event) -0.249** -0.263** -0.294*** -0.283***(-2.27) (-2.00) (-3.99) (-3.64)
Pre/Post Controls No Yes No YesIndustry-year fixed effects Yes Yes Yes Yes
Observations 216 204 306 296R-squared 0.185 0.297 0.281 0.324
44

Supplementary Appendix
A. Initiative / OaEC Development
The initiative was mentioned in the first week of August 2006, officially verified in mid-
October 2006, and the collection of signatures started on the last day of October 2006. On
February 26, 2008 it was publicly announced that the initiative has received enough public
support to be subject to a national ballot with, subject to a public approval, potentially
large impacts on the Swiss corporate law landscape. On December 5, 2008 the Swiss Federal
Government’s executive council issued a public statement in which it recommended to vote
against the initiative and drafted a direct counter proposal that would offer the public a less
stringent alternative than the initiative at the time the ballot is held. On June 11, 2009 the
Senate proposed an indirect counter proposal that would be adopted in case the originators
of the initiative agreed to withdraw the initiative (in which case the direct counter proposal
would also be void) and abstain from a national ballot. On March 16, 2012 Parliament and
Senate agreed to the terms of this indirect counter proposal, but failed, on June 15, 2012
to come to terms on the direct counter proposal. On March 3, 2013 the national ballot was
ultimately held and turned out in favor of the initiative and thus rendered the indirect counter
proposal obsolete. On June 14, 2013 the executive council issued a first draft of the bill that
would implement the initiative into law, namely, the before-mentioned Ordinance against
Excessive Compensation (OaEC). The Federal Government released the final Ordinance on
November 20, 2013.
B. Initiative
The initiative proposes a concrete legal text. Specifically, it reads:
”The federal constitution of April 18, 1999 is amended as follows:
Art. 95 Par. 3 (new): To protect the economy, private property and the shareholders and
45

in the spirit of sustainable corporate management, this law regulates Swiss companies, listed
nationally and internationally, according to the following principles: a) The general assembly
votes annually on the total compensation (monetary and in-kind) of the board of directors,
the executive board, and the advisory board. It elects annually the chairman of the board
and, individually, the members of the board, the members of the compensation committee,
and the independent vote representative. Pension funds vote in the interest of the insured
and disclose their voting behavior. Shareholders can use electronic / distance voting. There
is no proxy voting by company representatives or depository institutions. b) The board
of directors and the executive board receive no severance or any other payment upon their
leaving the firm, no advance compensation, no bonus payments in the case of firm acquisitions
/ divestures, and no additional consulting or employment contract by another company of
the group. Executive management cannot be delegated to another firm. c) The articles of
association contain provisions for the amounts of credit, loans, and retirement pensions to
corporate executives and board members, their performance and share / participation plans,
and the maximum number of external mandates as well as the duration of their employment
contracts. d) Violation of these provisions is punishable by a jail sentence of up to three
years and a fine of up to six times annual compensation.”
46

Table A1. Other provisions of the initiative
Regressions in this table are based on events 1 and 2, related to the original initiative requiring retrospectiveshareholder approval for compensation. The dependent variable is the Cumulative Abnormal Return duringthe three day event window around each event. In this table, we control for other provisions of the initiative:Single Election is a dummy variable equal to 1 if board members are elected individually, Long Notice Periodis a dummy variable equal to 1 if the notice period for the CEO is longer than 12 months, CEO Loansis a dummy variable equal to 1 if the CEO has outstanding loans with the company, Change of Controlis a dummy variable equal to 1 if the company has a change in control clause with respect to the CEO’sposition, Termination Benefits is a dummy variable equal to 1 if the CEO has contractually guaranteedtermination benefits. All other explanatory variables are defined in Table 1. Variables appended by quartilespecifications are indicator variables with the indicator equal to one for the quartile stated. For example,Young CEO (Q1&Q2) is a binary indicator equal to one if the CEO is of below median age. Controls indicatethat the regressions control, besides the indicated interacted variables, for all explanatory variables used inTable 3. t-values are calculated based on robust standard errors and reported in brackets, with significancelevels: * 0.10, ** 0.05, *** 0.01.
Dependent variable: Cumulative Abnormal Return (%)
(1) (2) (3) (4) (5)
Single Election -0.000(-0.10)
Long Notice Period 0.008(1.10)
CEO Loans 0.008(1.04)
Change of Control 0.010(1.58)
Termination Benefits 0.003(0.27)
Cash-only Incentives (Q4) -0.017** -0.015** -0.016** -0.014** -0.016**(-2.32) (-2.03) (-1.98) (-2.03) (-2.03)
Young CEO (Q1&Q2) -0.011** -0.011** -0.011** -0.011** -0.011**(-2.36) (-2.34) (-2.35) (-2.44) (-2.61)
Sales Volatility (Q3&Q4) -0.015*** -0.013** -0.012** -0.013** -0.014***(-2.77) (-2.54) (-2.30) (-2.56) (-2.69)
Relative Performance -0.028*** -0.028*** -0.027*** -0.027*** -0.028***(-5.48) (-4.91) (-4.19) (-4.99) (-5.02)
Abnormal CEO Compensation -0.004** -0.004** -0.003 -0.005*** -0.004**(-2.50) (-2.53) (-1.54) (-2.85) (-2.45)
(Abnormal CEO Compensation)2 0.000* 0.000* 0.000 0.000** 0.000(1.66) (1.70) (1.13) (2.20) (1.64)
Constant -0.009 -0.009 -0.008 -0.065*** -0.063***(-0.35) (-0.37) (-0.35) (-4.59) (-4.21)
Controls Yes Yes Yes Yes YesIndustry fixed effects Yes Yes Yes Yes Yes
Observations 136 142 133 138 138R-squared 0.367 0.356 0.358 0.379 0.366

about ECGI
The European Corporate Governance Institute has been established to improve corpo-rate governance through fostering independent scientific research and related activities.
The ECGI produces and disseminates high quality research while remaining close to the concerns and interests of corporate, financial and public policy makers. It draws on the expertise of scholars from numerous countries and bring together a critical mass of exper-tise and interest to bear on this important subject.
The views expressed in this working paper are those of the authors, not those of the ECGI or its members.
www.ecgi.org

ECGI Working Paper Series in Finance
Editorial Board
Editor Ernst Maug, Professor for Corporate Finance, Mannheim Business School, University of Mannheim
Consulting Editors Franklin Allen, Nippon Life Professor of Finance and Economics, The Wharton School, University of Pennsylvania Julian Franks, Professor of Finance, London Business School Marco Pagano, Professor of Economics, Facoltà di Economia Università di Napoli Federico II Xavier Vives, Professor of Economics and Financial Management, IESE Business School, University of Navarra Luigi Zingales, Robert C. McCormack Professor of Entrepreneurship and Finance, University of Chicago, Booth School of BusinessEditorial Assistants : Tamas Barko, University of Mannheim Ulrich Keesen, University of Mannheim Mengqiao Du, University of Mannheim
www.ecgi.org\wp
Electronic Access to the Working Paper Series
The full set of ECGI working papers can be accessed through the Institute’s Web-site (www.ecgi.org/wp) or SSRN:
Finance Paper Series http://www.ssrn.com/link/ECGI-Finance.html Law Paper Series http://www.ssrn.com/link/ECGI-Law.html
www.ecgi.org\wp