agenda - tegma 1 the transformation of the mexican railroad system scosttdale, az. january 2016...
TRANSCRIPT

01/02/2016
1
The Transformation of the Mexican Railroad System
Scosttdale, Az. January 2016
Agenda
1. The Past: Ferrocarriles Nacionales de Mexico.
2. The Transformation: Private Railroads performance
3. Grupo Mexico and Ferromex
4. Grain: Key to Ferromex´s results
5. Reform to Railroad Law

01/02/2016
2
How bad can a Railroad be?
Ferrocarriles Nacionales de México
Francisco J. Gorostiza, Renacimiento de los ferrocarriles de carga en México
FNM

01/02/2016
3
Francisco J. Gorostiza, Renacimiento de los ferrocarriles de carga en México
FNM
Francisco J. Gorostiza, Renacimiento de los ferrocarriles de carga en México
FNM

01/02/2016
4
Government owned FNM splits for future
bidding in 5 units
Grupo México creates GFM later owner of
Ferromex
KCS acquires TFM. New KCSM
Ferromexacquires Ferrosur
Ferromex wins dispute with Antitrust Commission
SEP´95
NOV´96
DEC´98 APR´05
NOV´05 MAR´11FEB´98
Ferromex starts operations
Ferrosur starts operations
New Railroad law
JAN´15
TFM starts operations
JUN´97
Time Line
*MTON-KM (Millions)
Mexico: Rail System
Private FNM INDICATOR 2014 1995 % VAR CARG
MTKM Millions 80,683 37,613 115% 4.3%EMPLOYEES 15,260 46,283 -67% -6.0%PRODUCTIVITY (TKM / EMPLOYEE) 5.29 0.81 551% 11.0%AVERAGE HP PER LOCOMOTIVE 3,035 2,696 13% 0.7%CARLOADS / TRAIN 75 37 103% 4.0%
Key Performance Indicators

01/02/2016
5
Mexico: Rail System
Key Performance Indicators
0.52 0.57
0.44
0.81
-
10,000
20,000
30,000
40,000
50,000
60,000
70,000
80,000
90,000
1980 1985 1990 1995 ‐
0.10
0.20
0.30
0.40
0.50
0.60
0.70
0.80
0.90
Empl
oyee
s
MTK
N /
Empl
oyee
MTKN/EMPLOYEE EMPLOYEE
3.18
5.33 5.45 5.29
0.81 -
5,000
10,000
15,000
20,000
25,000
30,000
35,000
40,000
45,000
50,000
2000 2005 2010 2014 1995 ‐
1.00
2.00
3.00
4.00
5.00
6.00
Empl
oyee
s
MTK
N /
Empl
oyee
MTKN/EMPLOYEE EMPLOYEE
FNM PRIVATE
65% FXE+FSRRMarket Share
% Railroad share MMTKM
Railroads Market Share
FXE, 41%FXE, 47% FXE, 52% FXE, 49%
FSRR, 9%FSRR, 8%
FSRR, 8% FSRR, 16%
KCSM, 35%KCSM, 33%
KCSM, 28%
KCSM, 31%
OTHERS, 14% OTHERS, 12% OTHERS, 12%OTHERS, 5%
0%
10%
20%
30%
40%
50%
60%
70%
80%
90%
100%
2000 2005 2010 2014
OTHERS KCSM FSRR FXE
Rail traffic share from land transportation increase from 19% to 26%, FXE+FSRR supports most of it

01/02/2016
6
USD
Cents P
erTo
n-Ki
lom
eter
Competitiveness
Source: Inter-American Development Bank, 2013OECD: Organization for Economic Cooperation and Development
Productivity per LocomotiveMillions tons - Km per Locomotive
Source: Inter-American Development Bank, 2013OECD: Organization for Economic Cooperation and Development
Productivity

01/02/2016
7
Mining
100%
Americas MiningCorporation (AMC)
85.2%
ASARCO
100%SouthernCopper
Corporation
MexicoDivision
100%
PeruDivision
100%
Transportation
75%
FMRail Holdings (FMRH)
FERROMEX
100%
26%
FERROSUR
100%
IMEX
100%
TEXAS PACIFICO
100%
Grupo FerrioviarioMexicano
74%
Infraestructura y Transportes Ferroviarios
100%
Infrastructure
100%
México Proyectos y Desarrollo
Perforadora México
100%
MéxicoGeneradora de Energía
100%100%
25%
MéxicoCompañía
Constructora e Ingeniería
Grupo Mexico: Structure
Grupo México Statistics
$9,3ANNUAL REVENUE (BILLION USD)
30,018EMPLOYEES
3 COUNTRIES
556 FORBES LIST 2015
LARGEST COPPER RESERVESWORLDWIDE1°4thCOPPER PRODUCER WORLDWIDE
COPPER PRODUCER WORLDWIDELARGEST RAILROAD IN MEXICO 1°
Grupo Mexico at a Glance

01/02/2016
8
Ferromex
The largest Railroad in Mexico
Ferromex at a Glance
6,719MILES
798LOCOMOTIVES 6 US BORDERS SERVED
9 PORTS SERVED
NTKM MOVED 201554 MM
27,485RAIL CARS
10,021EMPLOYEES 1.4MM CARLOADS MOVED 2015
Ferromex Statistics

01/02/2016
9
Ferromex Network
Ferromex: Customer Base
Grain 28.2%
Automotive 12.0%
Industrial 10.6%
Minerals 9.7%
Chemicals 8.5%
Energy 7.8%
Intermodal, 7.4%
Metals 6.2%
Cement 4.4%Others, 5.2%

01/02/2016
10
*MTON-KM (Millions)
Ferromex: Performance by Segment
Segment 2015 2000 %Part %VAR CARG
Total 54,220 27,292 99% 5%
Grain 19,545 7,607 36% 157% 7%Minerals 7,825 6,177 14% 27% 2%
Chemicals 4,757 3,186 9% 49% 3%Metals 4,733 776 9% 510% 14%
Intermodal 4,029 1,388 7% 190% 8%Energy 4,028 1,200 7% 236% 9%
Industrial 3,594 4,117 7% -13% -1%Cement 2,967 3,600 5% -18% -1%
Automotive 2,743 421 5% 552% 14%
Ferromex: Cross border volume
Cross border traffic key to our growth
33% 37%
49% 50% 51% 49% 48%50%
51%
0%
10%
20%
30%
40%
50%
60%
‐
50
100
150
200
250
300
350
400
450
2007 2008 2009 2010 2,011 2012 2013 2014 2015
% SH
ARE
ofRA
ILRO
AD IN
TERN
ATIO
NALL
TRA
FFIC
CAR
LOAD
S (0
00's)
Expo Impo Market Share
01/02/2016
11
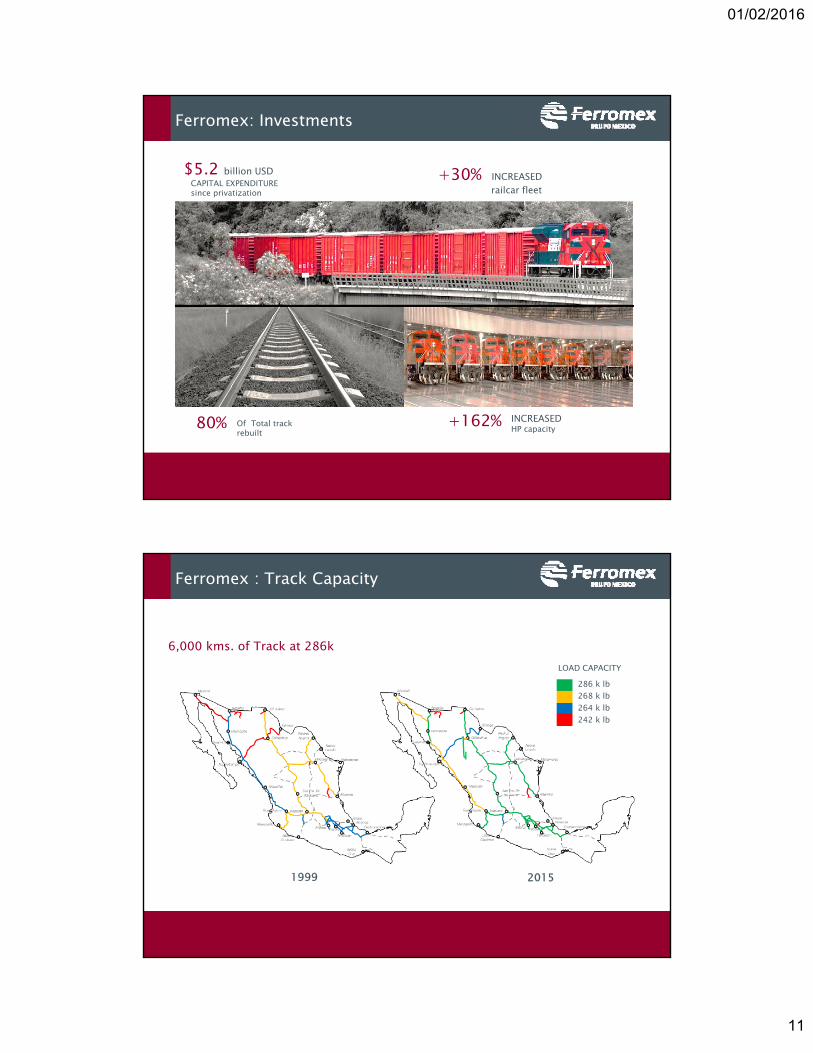
Ferromex: Investments
80%
CAPITAL EXPENDITUREsince privatization
$5.2 billion USD +30% INCREASED railcar fleet
+162%Of Total track rebuilt
INCREASED HP capacity
1999 2015
6,000 kms. of Track at 286k
Ferromex : Track Capacity
286 k lb268 k lb264 k lb242 k lb
LOAD CAPACITY

01/02/2016
12
Source: U.S. Census Bureau (2002 – 2011) and Association of American Railroad
Ferromex has invested 27.5 % of the total revenues, significantly above class 1’s and most industries.
Ferromex: Investments
GROSS TON-KM +186%
FUEL PRODUCTIVITY +33%
GROSS TONS PER TRAIN +52%
ACCIDENTS RATE -97%
Ferromex: Efficiency

01/02/2016
13
321
540
84
125
30
159
101
263
-
200
400
600
800
1,000
1,200
1999 2015
Grain
Auto
Consumer
Others
159% Cummulativegrowth
CARG 7%
*Does not include containers
Carloads (000,s)
Grain Products the biggest segment in FXE with high growth
Grain our key segment
Major Crop Areas (Million MT)
CornWheat
Sorghum
5.5
2.6
6.7
1.8
2.4
Corn
Wheat
Sorghum
Source: GCMA based on SIAP November and GCMA estimated for December

01/02/2016
14
SOYBEAN
CORN SORGHUM
WHEATPRODUCTION
3.8CONSUMPTION
8.2
DEFICIT -4,454%
PRODUCTION6.5
CONSUMPTION7.3
DEFICIT - 0.811%
PRODUCTION25.8
CONSUMPTION37.4
PRODUCTION0.5
CONSUMPTION6.2
DEFICIT -5.692 %
DEFICIT -11.431 %
Source: GCMA based on SIAP November and GCMA estimated for December
2015 Mexico Production/Consumption
Opportunities FXE
CORN: -1.2 SORGHUM: -0.5
WHEAT: -0.3 SOYBEAN: -0.8
-2,3
CORN: -6,5SORGHUM: -1,5
WHEAT: -3.2SOYBEAN: -1.0
-12,0
CORN: -2,.6SORGHUM: -0.6
WHEAT: -0.9SOYBEAN: -0.5
-3.4
Grain Deficit (Million MTons)
Source: GCMA based on SIAP November and GCMA estimated for December

01/02/2016
15
34 Shuttle Terminals in 2016
2000 2005 2010NEW
PROJECTS2015
4 6716 Source: GCMA based on SIAP November and GCMA estimated for December
Ferromex: Shuttle Trains
28
299
379
2000 2009 2015
+ 23 Terminals
CAGR30%
CAGR5%
+ 6 Terminals

01/02/2016
16
Grain: Our key segment
1. Track investments for longer and heavier trains
2. Equipment to capitalize on Northwest Crop
3. Continue development of grain terminals´ network
4. Continue development of unit an shuttle trains
5. Power increase and crews development
Our Strategy:
Grain: Our Key Segment
1. Add 550 new hoppers. Total fleet 5,552
2. Hopper car exchange with UP and BNSF during peak
seasons.
3. Reduce unload time to 15Hrs in shuttle train terminals
4. Rate incentives to increase unit and shuttle train use.
Our Plans:

01/02/2016
17
Reform to the Railroad Law
Mexico New Railroad Law
1. Open access for licensee carriers without concession
2. All rates, including contracts, to be published3. Concessionaries responsible for construction and
maintenance of railway crossings
4. Change to the exclusivity periods
Negative issues with the original proposal

01/02/2016
18
Mexico New Railroad Law
Negative Issues Original IniciativeFinal changes to the Law: Positive
Main changes:
Competition and Interchange More interchange points and guaranteed competition
Regulatory AgencyCreation of Regulatory AgencyRate regulation only with lack of effective competition
Rule 11 Customers can negotiate rates with each carrier
No licensee carriers Eliminated
Otherchanges:
Safety RailcrossingFund Creation of National Fund
Unused Track SCT to offer for bid
ConcessionRevocation More aggressive sanctions to revoke concessions

01/02/2016
19

01/02/2016
20
Transformation

01/02/2016
21