agenda anything new? tests returned naked economics quiz review gdp and the business cycle problems...
TRANSCRIPT

AgendaAnything new? Tests ReturnedNaked Economics QuizReview GDP and the Business CycleProblems with GDP
Article Video
Economic ChallengesStudent CompaniesHOMEWORKReview Powerpoint for next class (online)Read “Current Reading Assignment” (online)
Review…GDP / Business Cycle
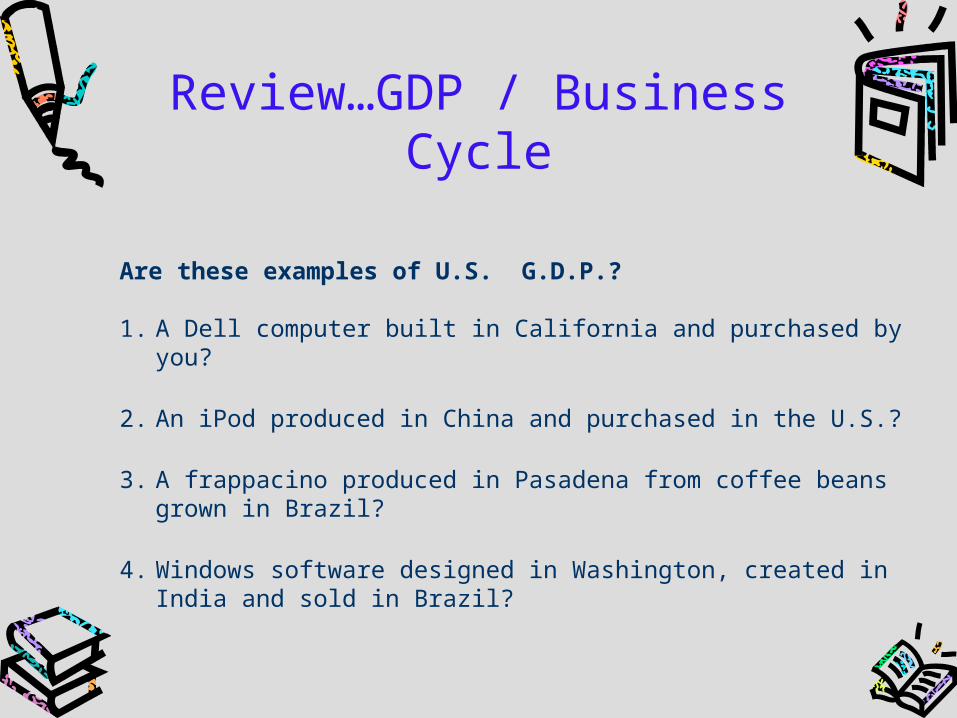
Are these examples of U.S. G.D.P.?
1. A Dell computer built in California and purchased by you?
2. An iPod produced in China and purchased in the U.S.?
3. A frappacino produced in Pasadena from coffee beans grown in Brazil?
4. Windows software designed in Washington, created in India and sold in Brazil?
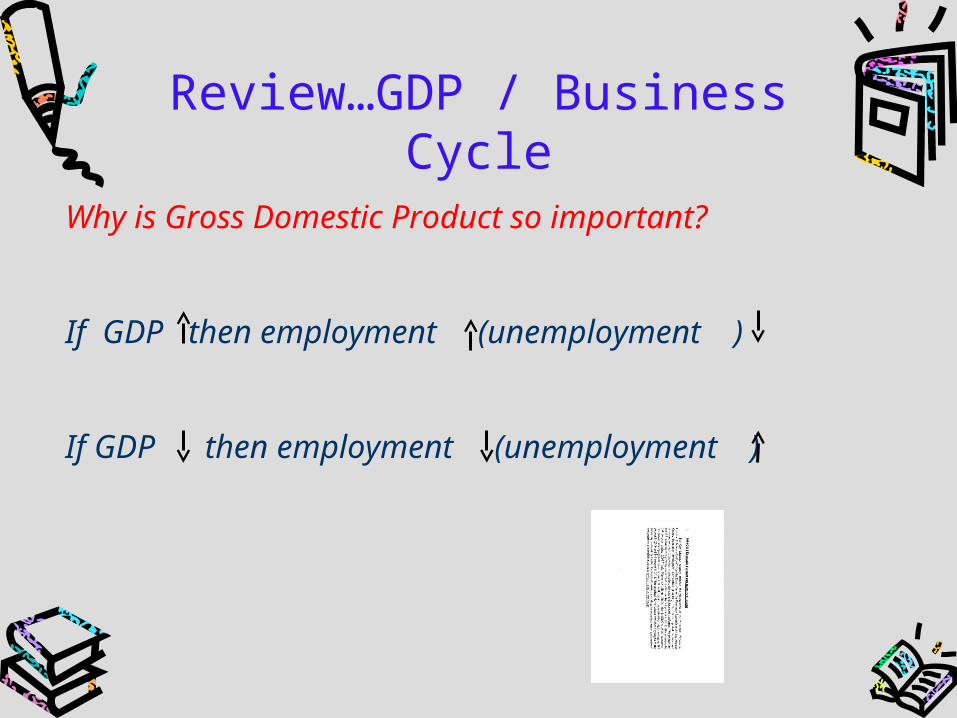
Review…GDP / Business CycleWhy is Gross Domestic Product so important?
If GDP then employment (unemployment )
If GDP then employment (unemployment )
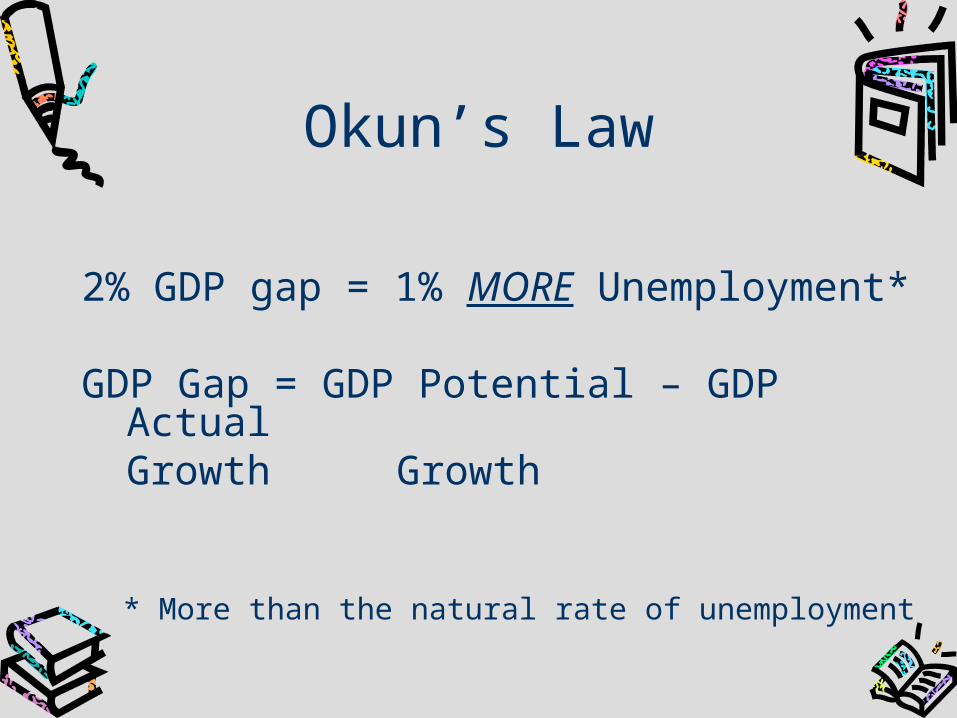
Okun’s Law
2% GDP gap = 1% MORE Unemployment*
GDP Gap = GDP Potential – GDP ActualGrowth Growth
* More than the natural rate of unemployment

The data….

GDP…a better lookReal vs. Nominal GDP
Nominal GDP is GDP measured in current prices. It does not account for price level increases from year to year. Real GDP is GDP expressed in constant, or unchanging, dollars. Real GDP adjusts for inflation
Real GDP is the important one
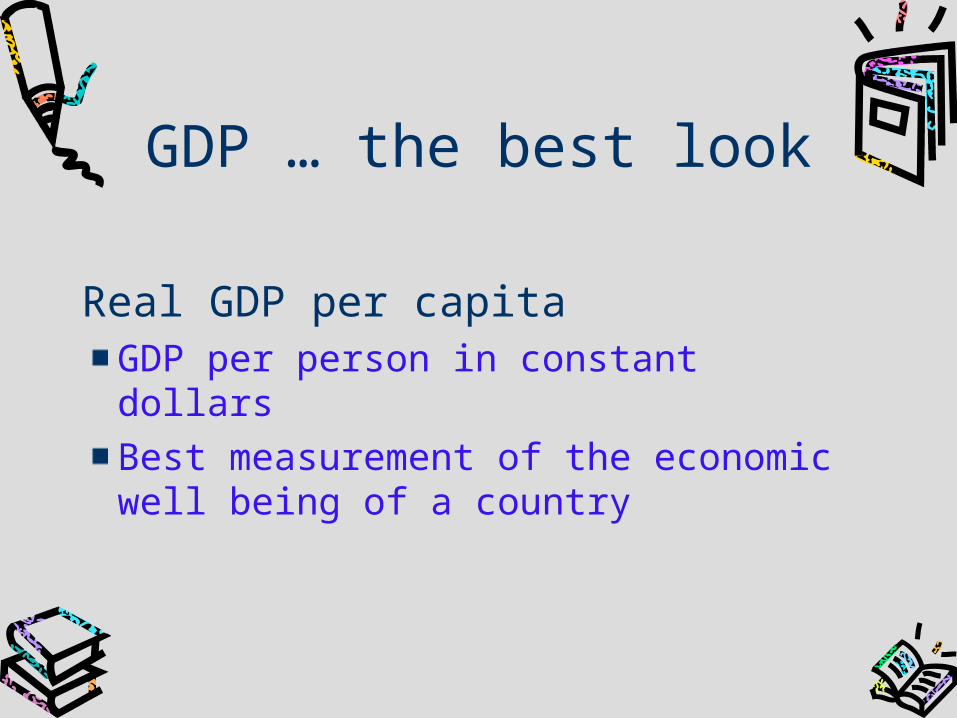
GDP … the best look
Real GDP per capitaGDP per person in constant dollarsBest measurement of the economic well being of a country

The Problems with GDP
Nonmarket ActivitiesGDP does not measure goods and services that people make or do themselves, such as caring for children, mowing lawns, or cooking dinner.
Negative ExternalitiesUnintended economic side effects, such as pollution, have a monetary value that is often not reflected in GDP.
The Underground EconomyThere is much economic activity which, although income is generated, never reported to the government. Examples include black market transactions and "under the table" wages.

The Problems with GDP (cont.)
Quality of LifeAlthough GDP is often used as a quality of life measurement, there are factors not covered by it. These include leisure time, pleasant surroundings, and personal safety.
Doesn’t capture improvements in quality A smartphone is better but cheaper. GDP is going down (cheaper) but life is better (higher quality). Same with cars getting better even if not cheaper
The Problems With GDP
ARTICLE
The Problems With GDP
http://www.youtube.com/watch?v=QUaJMNtW6GA&NR=1
THREE MINUTE BREAK
http://www.online-stopwatch.com/bomb-countdown/

Economic Challenges(new stuff)
Unemployment
Poverty
Inflation
Economic Inequality
They are called “challenges” because they never go away.(Problems are solved, challenges stay with us)
Economic Challenges
Unemployment Not enough jobs, people without jobs
Measured as…
Total number of people unemployedTotal Labor Force*
Why is that a challenge?People without jobs have no economic security or equity
* Note that it is Labor Force, not total population
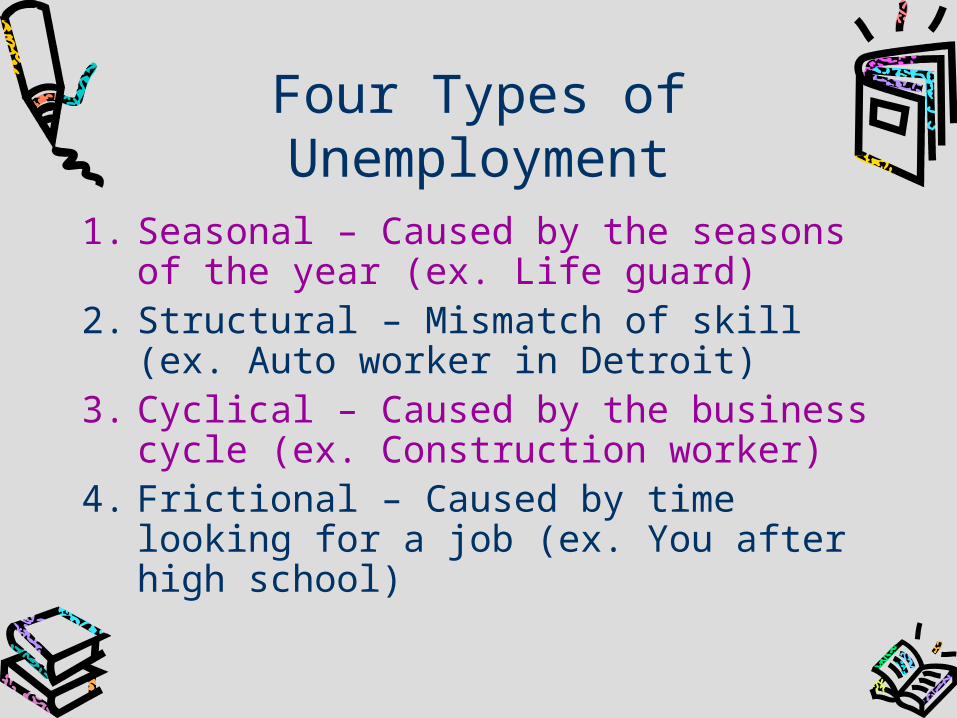
Four Types of Unemployment
1. Seasonal – Caused by the seasons of the year (ex. Life guard)
2. Structural – Mismatch of skill (ex. Auto worker in Detroit)
3. Cyclical – Caused by the business cycle (ex. Construction worker)
4. Frictional – Caused by time looking for a job (ex. You after high school)

Economic Challenges
Poverty – People with an income below a level considered needed to sustain yourself
Measured as…a dollar amount
Why is that a challenge?No Economic Equity or Security
Economic Challenges
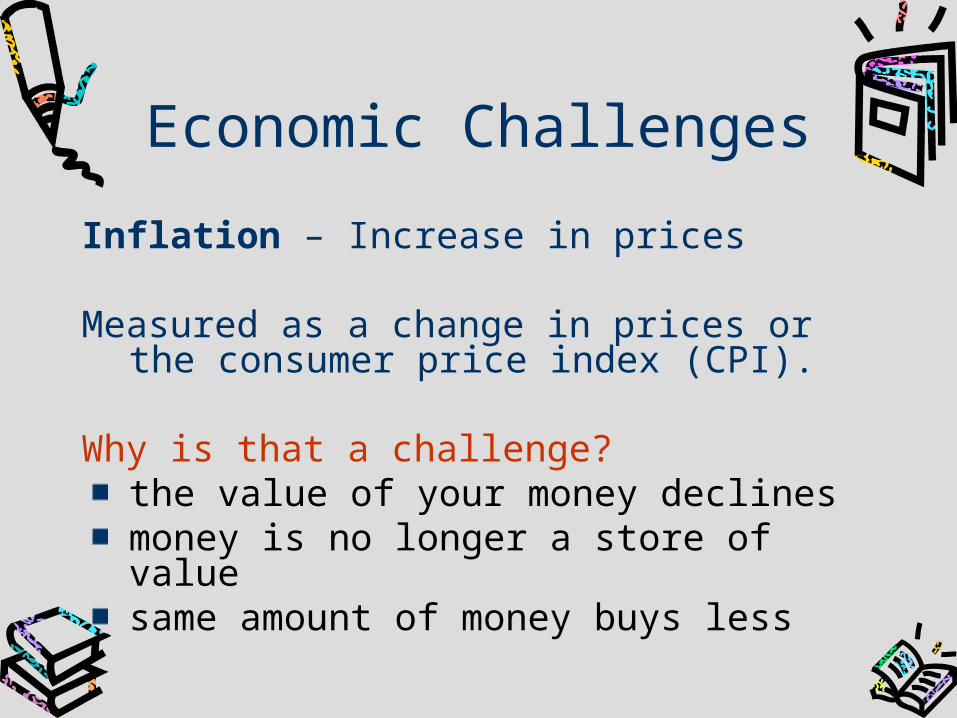
Inflation – Increase in prices
Measured as a change in prices or the consumer price index (CPI).
Why is that a challenge?the value of your money declinesmoney is no longer a store of valuesame amount of money buys less
Video
The Consumer Price Index (CPI) explained
http://www.youtube.com/watch?v=Si37yjZM-SA

What’s in the CPI
http://www.bls.gov/cpi/cpifaq.htm#Question_1
Impact of Inflation
http://www.bls.gov/data/inflation_calculator.htm/
Inflation (cont.)
Three types of inflation1. Demand pull2. Cost push3. Wage / Price spiral

Inflation (cont.)
Demand Pull inflation is caused by increasing or excessive demand
demandsupply

Inflation (cont.)
Cost Push inflation is caused by decreasing supply as resource prices increase
demandsupply

Inflation (cont.)
Wage / Price Spiral are caused by increasing demand caused by increase wages (sort of like demand pull)
demandsupply
Wage / Price Spiral…An Example
La Salle High School

Economic Inequality
Gap between rich and poor, the haves and the have nots
Three Common MeasurementsGini index – Most Common20:20 RatioPalma ratio

Inequality Measurements
Gini indexThe range of the Gini index is between 0 and 1 (0% and 100%), where 0 indicates perfect equality and 1 (100%) indicates maximum inequality.The Gini index is the most frequently used inequality index.But it’s a little confusing…

Gini Index
Totally Equal
Less Equal
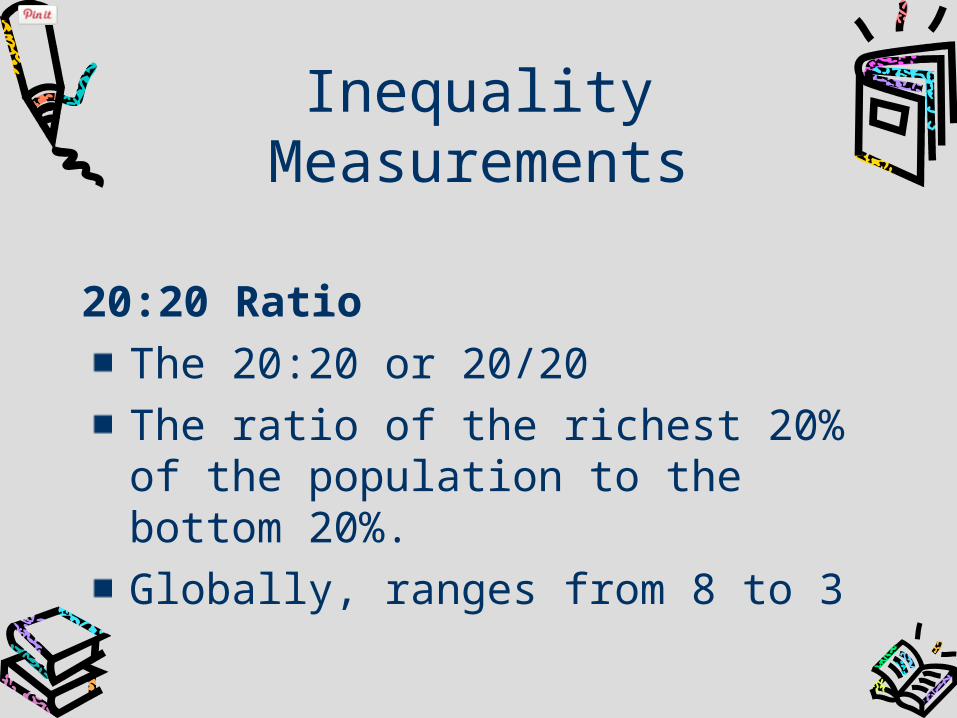
Inequality Measurements
20:20 RatioThe 20:20 or 20/20 The ratio of the richest 20% of the population to the bottom 20%.Globally, ranges from 8 to 3
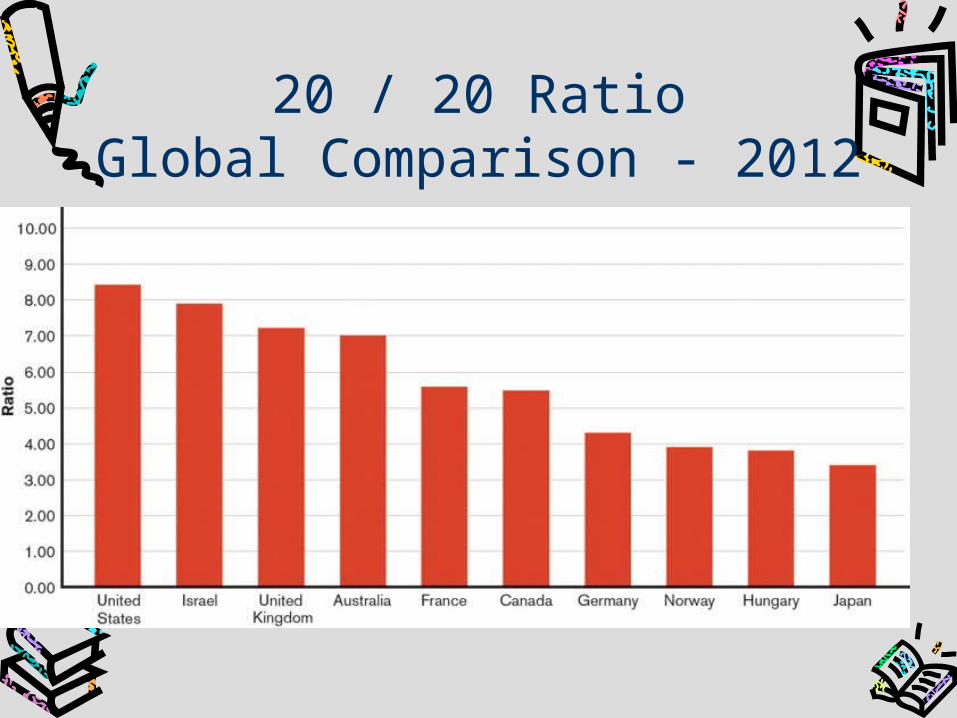
20 / 20 RatioGlobal Comparison - 2012

Inequality Measurements (cont.)
Palma ratioThe ratio of the richest 10%’s share of income divided by the poorest 40%'s share. Developed by Chilean economist Gabriel Palma who found that middle class incomes almost always represent about half of national income Example: If the richest 10% have 30% of the income and the poorest 40% have 20%, the ratio is 30/20 or 1.5Weakness – Assumes everyone in the middle 50% is equal

Gini Index
Homework
Review Powerpoint for next class (online)Read “Current Reading Assignment” (online)

handouts