agenda central florida expressway … · central florida expressway authority board workshop may...
TRANSCRIPT

AGENDA CENTRAL FLORIDA EXPRESSWAY AUTHORITY
BOARD WORKSHOP May 30, 2018
10:00 a.m.
Meeting location: Central Florida Expressway Authority Pelican Conference Room
4974 ORL Tower Road Orlando, FL 32807
A. CALL TO ORDER / PLEDGE OF ALLEGIANCE
B. PUBLIC COMMENT
Pursuant to Rule 1-1.011, the governing Board for CFX has set aside at least 15 minutes at the beginning of each regular meeting for citizens to speak to the Board on any matter of public interest under the Board's authority and jurisdiction, regardless of whether the public interest is on the Board's agenda but excluding pending procurement issues. Each speaker shall be limited to 3 minutes.
C. BUDGET - FY 2019 OPERATIONS, MAINTENANCE & ADMINISTRATION AND FY 2019 THROUGH FY 2023 FIVE YEAR WORK PLAN
D. BOARD MEMBER COMMENT
E. ADJOURNMENT
This meeting is open to the public.
Section 286.0105, Florida Statutes states that if a person decides to appeal any decision made by a board, agency, or commission with respect to any matter considered at a meeting or hearing, he or she will need a record of the proceedings, and that, for such purpose, he or she may need to ensure that a verbatim record of the proceedings is made, which record includes the testimony and evidence upon which the appeal is to be based.
In accordance with the Americans with Disabilities Act (ADA), if any person with a disability as defined by the ADA needs special accommodation to participate in this proceeding, then not later than two (2) business days prior to the proceeding, he or she should contact the Central Florida Expressway Authority at 407-690-5000.
Persons who require translation services, which are provided at no cost, should contact CFX at (407) 690-5000 x5317 or by email at [email protected] at least three business days prior to the event.

DRAFTFY 2019 OPERATIONS, MAINTENANCE & ADMINISTRATION BUDGET
and
FY 2019 – FY 2023 FIVE YEAR WORK PLANMay 30, 2018
1

Total Proposed Spending for FY 2019
Operations11%
Maintenance3%
Administration1%
Debt Service28%
System Projects40%
Technology Projects
9%
Renewal and Replacement Projects
8%
2
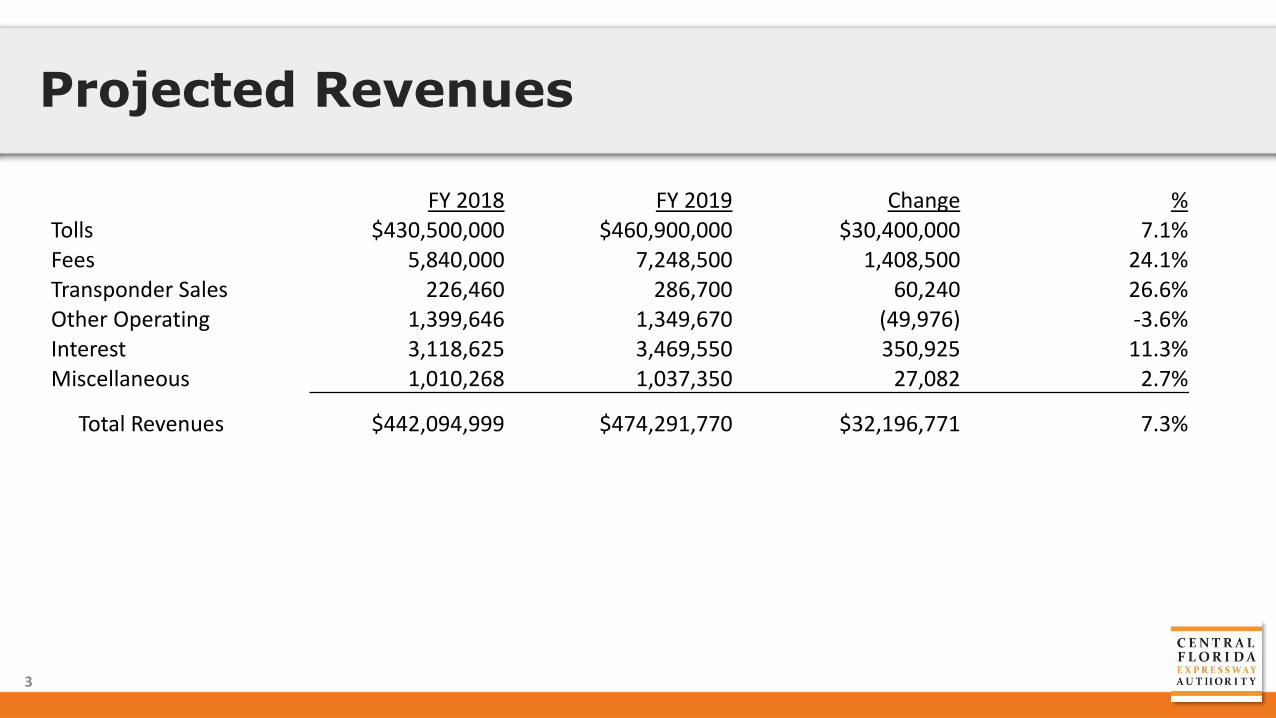
Projected Revenues
FY 2018 FY 2019 Change %Tolls $430,500,000 $460,900,000 $30,400,000 7.1%Fees 5,840,000 7,248,500 1,408,500 24.1%Transponder Sales 226,460 286,700 60,240 26.6%Other Operating 1,399,646 1,349,670 (49,976) -3.6%Interest 3,118,625 3,469,550 350,925 11.3%Miscellaneous 1,010,268 1,037,350 27,082 2.7%
Total Revenues $442,094,999 $474,291,770 $32,196,771 7.3%
3

Proposed Operations Budget
FY 2018 Budget FY 2019 Budget Change %
$57,173,411 $63,606,058 $6,432,648 11.3%
Cost Increases:Service Center
• Contract personnel – wage increase for CSRs• Interoperability transaction fee – increased traffic• Credit card fees – increased traffic• Dues and subscriptions – new agreement for license plate
look up
4

Proposed Maintenance Budget
FY 2018 Budget FY 2019 Budget Change %
$17,831,023 $19,937,227 $2,106,204 11.8%
Cost Increases:Maintenance Administration
• Contract personnel – security and inspector• Motorist service patrol agreement – additional patrol for
Wekiva Parkway
Routine Maintenance• Roadway and Bridges Maintenance – Wekiva Parkway
5

Proposed Administrative Budget
FY 2018 Budget FY 2019 Budget Change %
$8,135,422 $8,366,477 $231,055 2.8%
Cost Increases:General
• Insurance – cyber insurance• Facilities maintenance – additional building hours
Cost Decreases:Records Management
• Professional services – bringing a position in house
6

Major OM&A Capital Items and Projects
Major Capital Items and Projects:• IT equipment and software• Purchase of 2 vehicles• Security equipment• New timesheet software• Changes to corporate website
7

Proposed OM&A Budget – Debt Service Ratio
FY 2018 Budget FY 2018 Projected FY 2019 BudgetedTotal Revenues $442,094,999 $452,323,274 $474,291,770 Total Expenses 85,675,454 82,673,809 94,363,512 OM&A Reserve Deposits 735,436 735,436 1,086,007 FDOT Advances (7,022,890) (6,916,087) (7,070,420)Net Revenues $362,706,999 $375,830,116 $385,912,671
Senior Debt Service Payments $162,955,205 $162,955,205 $160,988,513
Senior Debt Service Ratio 2.23 2.31 2.40
8

Proposed OM&A Budget –Goldenrod Road Extension
Goldenrod Budget• Total operations and maintenance expense budget - $449,734
• Toll revenue budget - $2,200,000
9

Total Proposed Spending for FY 2019
Operations11%
Maintenance3%
Administration1%
Debt Service28%
Work Plan57%
10
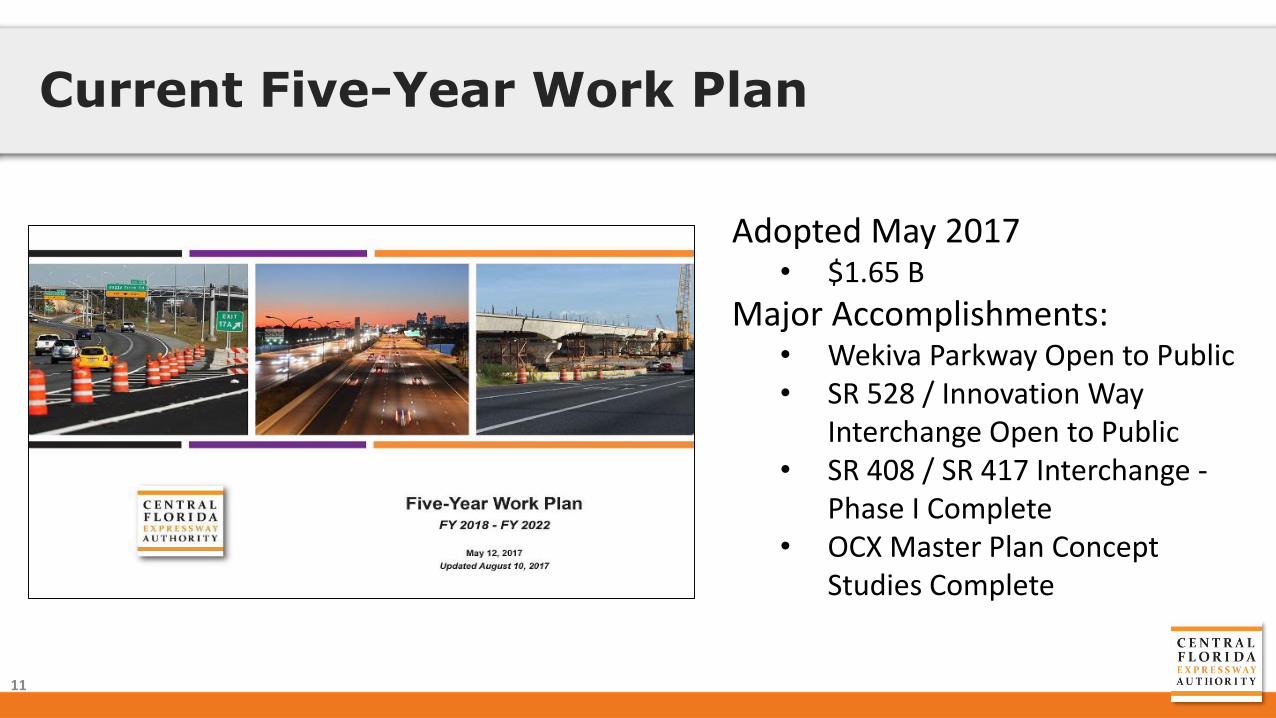
Current Five-Year Work Plan
Adopted May 2017• $1.65 B
Major Accomplishments:• Wekiva Parkway Open to Public• SR 528 / Innovation Way
Interchange Open to Public• SR 408 / SR 417 Interchange -
Phase I Complete• OCX Master Plan Concept
Studies Complete
11

Draft FY 2019-2023 Work Plan
Project Cost Summary ($000’s)Fiscal Year
Category Totals2018/19 2022/232019/20 2020/21 2021/22
Existing System Improvements 96,128 46,983153,340 309,648 152,794 758,894
System Expansion Projects 12,420 387,14012,149 37,645 105,784 555,138
Interchange Projects 117,416 43,70496,314 6,617 12,350 276,401
Facilities Projects 11,811 1,15512,735 1,704 1,554 28,959
Transportation Technology Projects 14,065 3,1389,009 5,554 3,989 35,755
Signing and Pavement Markings 1,837 1802,847 1,966 1,392 8,222
Renewal and Replacement Projects 44,000 8,11958,165 31,203 35,335 176,822
Landscape Projects 810 805805 1,435 810 4,665
TOTALS 335,746 491,223362,053 403,023 314,008 1,906,054
Non-System Projects 0 00 0 0 0
Information Technology Projects 37,259 016,689 7,251 0 61,199
12
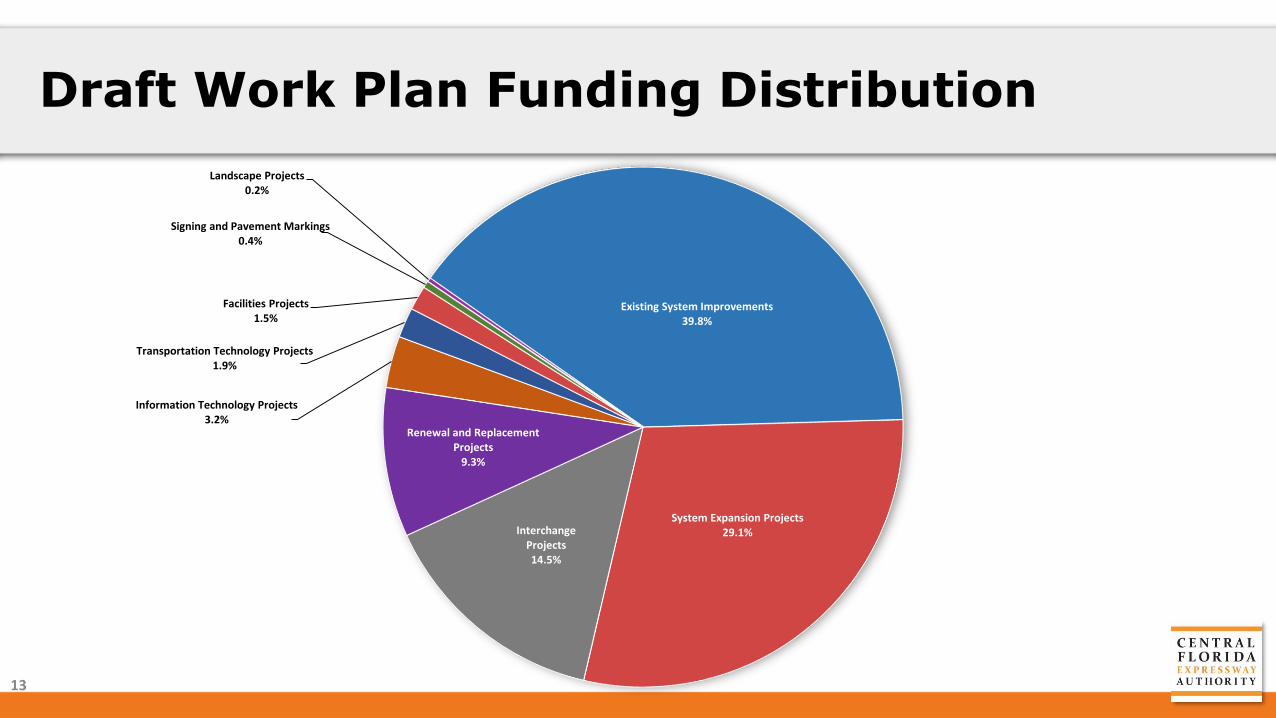
Draft Work Plan Funding Distribution
Existing System Improvements39.8%
System Expansion Projects29.1%Interchange
Projects14.5%
Renewal and Replacement Projects
9.3%
Information Technology Projects3.2%
Transportation Technology Projects1.9%
Facilities Projects1.5%
Signing and Pavement Markings0.4%
Landscape Projects0.2%
13

Draft Work Plan Major Projects
Capacity Improvements → $729.8 M
• SR 408 from SR 417 to Alafaya Trail
• SR 417 from I-Drive to SR 528
• SR 417 from Econ Trail to Seminole County Line
• SR 429 from Florida’s Turnpike to SR 414
• SR 528 from SR 436 to Goldenrod Road
• SR 528 from Narcoossee Road to Innovation Way
14

Draft Work Plan Major Projects
Interchange Projects → $266.4 M
• SR 408 / SR 417
• Phase II Complete in Summer 2019
• SR 408 / I-4 Ultimate
• SR 528 / Dallas Boulevard
15

Draft Work Plan Major Projects
Expansion Projects → $533.3 M• Lake / Orange Connector (Potential)
• US 27 to SR 429• SR 408 Eastern Extension (Potential)
• Challenger Pkwy. to Avalon Park Blvd.• Osceola Parkway Extension (Potential)
• Jeff Fuqua Blvd. to Sunbridge Pkwy. (Future)• Poinciana / I-4 Connector (Potential)
• Cypress Pkwy. to Kinny Harmon Rd.• Southport Connector (Potential)
• Pleasant Hill Rd. to Canoe Creek Rd.
16

Draft Work Plan Major Projects
Milling & Resurfacing → $135.6 M
Toll Collection System Upgrade → $25.7 M
E-PASS Back Office Update → $19.6 M
Connected Vehicle Technology → $2.3 M
Transportation Technology Master Plan → $0.2 M
17

Draft Work Plan Major Projects
18

Draft Work Plan Major Resurfacing Projects
19
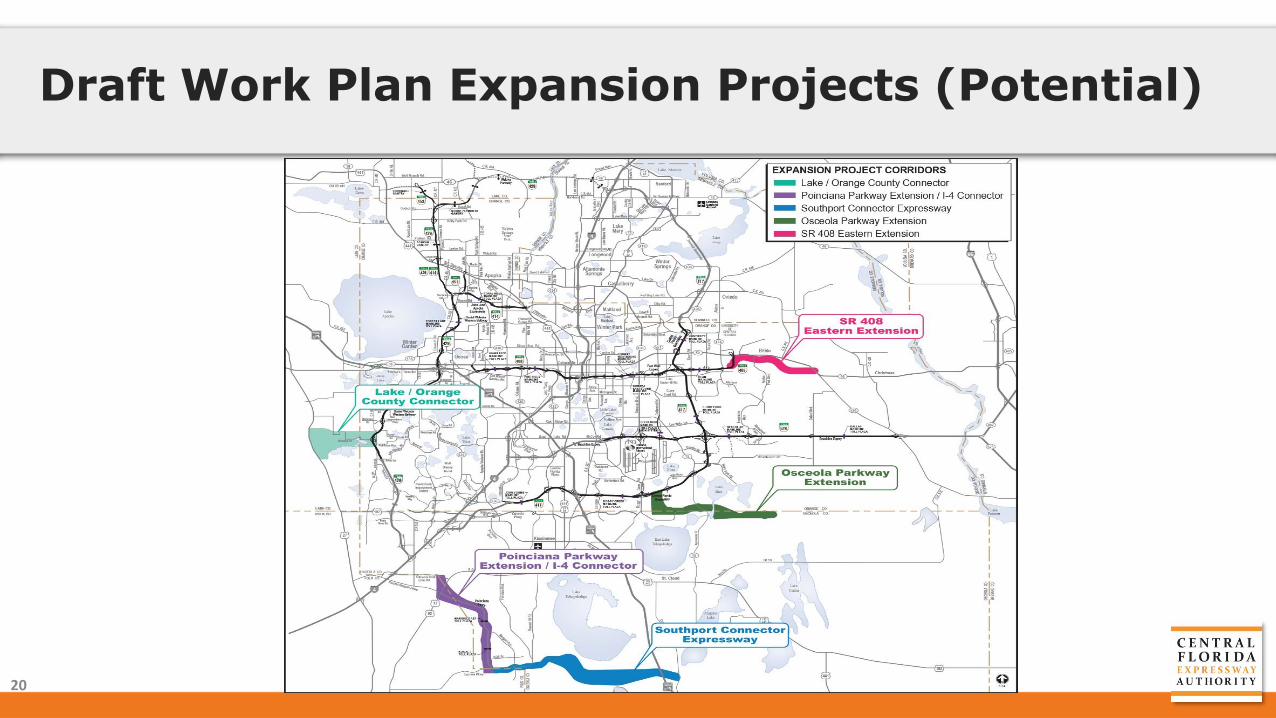
Draft Work Plan Expansion Projects (Potential)
20

Lake/Orange County Connector (Potential)
21

408 Eastern Extension (Potential)
22

Osceola Parkway Extension (Potential)
23

Poinciana Parkway Ext./I-4 Connector (Potential)
24

Southport Connector Expressway (Potential)
25

Capital Planning Model Assumptions
Debt issuance assumptions are:
• 30-year, fixed rate bonds
• Interest rates• AAA Municipal Market Data as of 5/1/2018 plus 50 basis points of
credit spread (based of CFX’s current credit ratings) and an additional 50 basis points of cushion
• Additional 25 basis points added per year for each future issuance
• Debt Service Ratio target of 1.60 (senior debt lien)
• Fully cash funded debt service reserve funds
26

Capital Planning Model Results
Requires additional debt• Approximately $915 million (FY19, FY21, FY23)
• Approximately 42% of project expenditures over the 5 year period
Modeling updated• New bonds are issued
• New major assumptions
Debt coverage ratio meets 1.60 planning target
27

Projected Senior Lien Coverage Ratio
1.00
1.10
1.20
1.30
1.40
1.50
1.60
1.70
1.80
1.90
2.00
2.10
2.20
2.30
2.40
2019 2020 2021 2022 2023 2024 2025 2026 2027 2028 2029 2030 2031 2032 2033 2034 2035 2036 2037 2038 2039 2040 2041
CFX Planning Target CFX Board Policy CFX Bond Covenants28
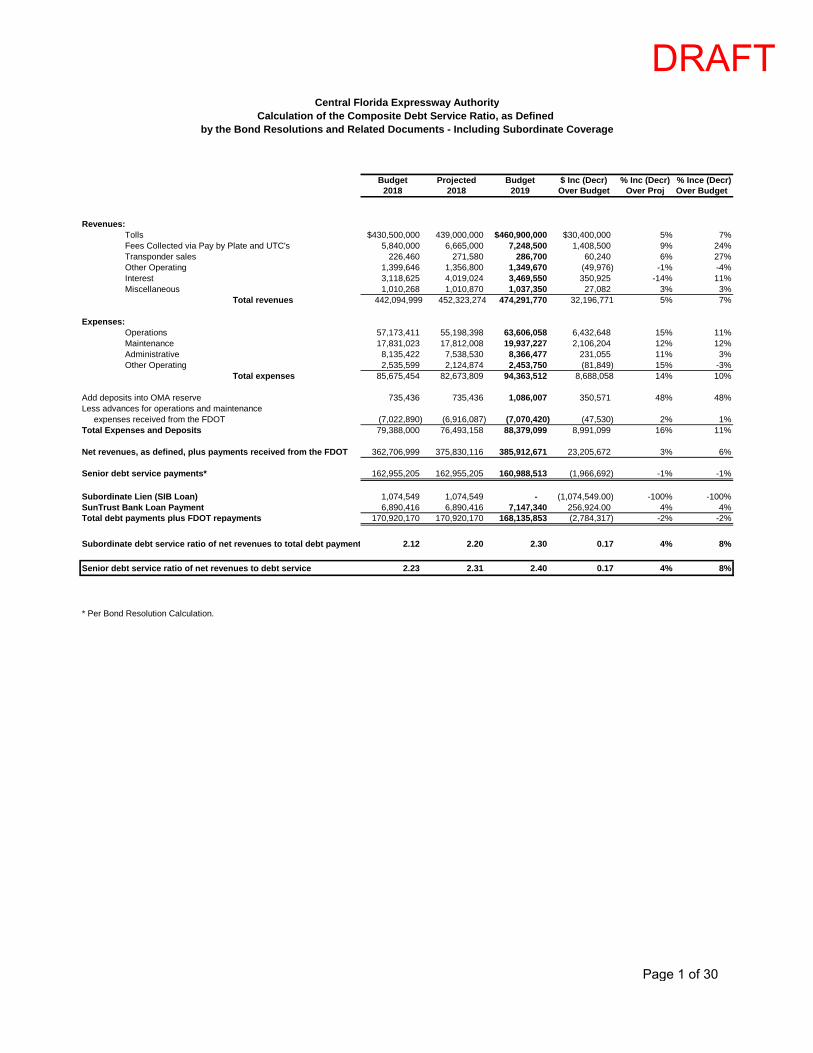
Budget Projected Budget $ Inc (Decr) % Inc (Decr) % Ince (Decr)2018 2018 2019 Over Budget Over Proj Over Budget
Revenues: Tolls $430,500,000 439,000,000 $460,900,000 $30,400,000 5% 7% Fees Collected via Pay by Plate and UTC's 5,840,000 6,665,000 7,248,500 1,408,500 9% 24% Transponder sales 226,460 271,580 286,700 60,240 6% 27% Other Operating 1,399,646 1,356,800 1,349,670 (49,976) -1% -4% Interest 3,118,625 4,019,024 3,469,550 350,925 -14% 11% Miscellaneous 1,010,268 1,010,870 1,037,350 27,082 3% 3% Total revenues 442,094,999 452,323,274 474,291,770 32,196,771 5% 7%
Expenses: Operations 57,173,411 55,198,398 63,606,058 6,432,648 15% 11% Maintenance 17,831,023 17,812,008 19,937,227 2,106,204 12% 12% Administrative 8,135,422 7,538,530 8,366,477 231,055 11% 3% Other Operating 2,535,599 2,124,874 2,453,750 (81,849) 15% -3% Total expenses 85,675,454 82,673,809 94,363,512 8,688,058 14% 10%
Add deposits into OMA reserve 735,436 735,436 1,086,007 350,571 48% 48%Less advances for operations and maintenance expenses received from the FDOT (7,022,890) (6,916,087) (7,070,420) (47,530) 2% 1%Total Expenses and Deposits 79,388,000 76,493,158 88,379,099 8,991,099 16% 11%
Net revenues, as defined, plus payments received from the FDOT 362,706,999 375,830,116 385,912,671 23,205,672 3% 6%
Senior debt service payments* 162,955,205 162,955,205 160,988,513 (1,966,692) -1% -1%
Subordinate Lien (SIB Loan) 1,074,549 1,074,549 - (1,074,549.00) -100% -100%SunTrust Bank Loan Payment 6,890,416 6,890,416 7,147,340 256,924.00 4% 4%Total debt payments plus FDOT repayments 170,920,170 170,920,170 168,135,853 (2,784,317) -2% -2%
Subordinate debt service ratio of net revenues to total debt payment 2.12 2.20 2.30 0.17 4% 8%
Senior debt service ratio of net revenues to debt service 2.23 2.31 2.40 0.17 4% 8%
* Per Bond Resolution Calculation.
Central Florida Expressway AuthorityCalculation of the Composite Debt Service Ratio, as Defined
by the Bond Resolutions and Related Documents - Including Subordinate Coverage
DRAFT
Page 1 of 30

Budget Projected Budget $ Inc (Decr) % Inc (Decr) % Ince (Decr)2018 2018 2019 Over Budget Over Proj Over Budget
Revenues: Tolls $430,500,000 439,000,000 $460,900,000 $30,400,000 5% 7% Fees Collected via Pay by Plate and UTC's 5,840,000 6,665,000 7,248,500 1,408,500 9% 24% Transponder sales 226,460 271,580 286,700 60,240 6% 27% Other Operating 1,399,646 1,356,800 1,349,670 (49,976) -1% -4% Interest 3,118,625 4,019,024 3,469,550 350,925 -14% 11% Miscellaneous 1,010,268 1,010,870 1,037,350 27,082 3% 3% Total revenues 442,094,999 452,323,274 474,291,770 32,196,771 5% 7%
Expenses: Operations 57,173,411 55,198,398 63,606,058 6,432,648 15% 11% Maintenance 17,831,023 17,812,008 19,937,227 2,106,204 12% 12% Administrative 8,135,422 7,538,530 8,366,477 231,055 11% 3% Other Operating 2,535,599 2,124,874 2,453,750 (81,849) 15% -3% Total expenses 85,675,454 82,673,809 94,363,512 8,688,058 14% 10%
Debt service payments 162,955,205 162,955,205 162,165,363 (789,842.00) 0% 0%
Subordinate Lien (SIB Loan) 1,074,549 1,074,549 - (1,074,549) -100% -100%
SunTrust Bank Loan Payment 6,890,416 6,890,416 7,147,340 256,924 4% 4%
Renewal and Replacement Reserve 21,000,000 24,000,000 44,000,000 23,000,000 83% 110%
OM&A Capital Expenditures & Projects 456,500 263,677 468,500 12,000 78% 3%
Net Available for System Projects $164,042,875 $174,465,618 $166,147,055 $2,104,180 -5% 1%
Central Florida Expressway AuthorityBudgeted Flow of Funds - Including Subordinate Payments
On a Cash Flow Basis
DRAFT
Page 2 of 30
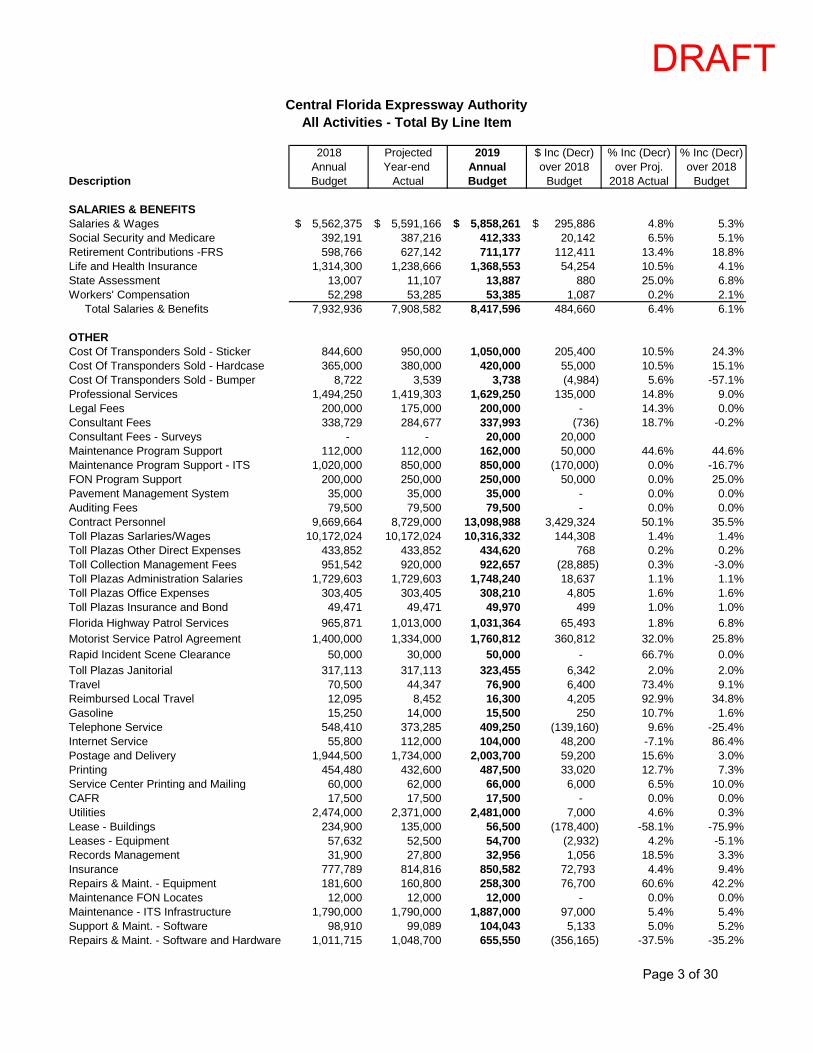
2018 Projected 2019 $ Inc (Decr) % Inc (Decr) % Inc (Decr)Annual Year-end Annual over 2018 over Proj. over 2018
Description Budget Actual Budget Budget 2018 Actual Budget
SALARIES & BENEFITSSalaries & Wages 5,562,375$ 5,591,166$ 5,858,261$ 295,886$ 4.8% 5.3%Social Security and Medicare 392,191 387,216 412,333 20,142 6.5% 5.1%Retirement Contributions -FRS 598,766 627,142 711,177 112,411 13.4% 18.8%Life and Health Insurance 1,314,300 1,238,666 1,368,553 54,254 10.5% 4.1%State Assessment 13,007 11,107 13,887 880 25.0% 6.8%Workers' Compensation 52,298 53,285 53,385 1,087 0.2% 2.1% Total Salaries & Benefits 7,932,936 7,908,582 8,417,596 484,660 6.4% 6.1%
OTHERCost Of Transponders Sold - Sticker 844,600 950,000 1,050,000 205,400 10.5% 24.3%Cost Of Transponders Sold - Hardcase 365,000 380,000 420,000 55,000 10.5% 15.1%Cost Of Transponders Sold - Bumper 8,722 3,539 3,738 (4,984) 5.6% -57.1%Professional Services 1,494,250 1,419,303 1,629,250 135,000 14.8% 9.0%Legal Fees 200,000 175,000 200,000 - 14.3% 0.0%Consultant Fees 338,729 284,677 337,993 (736) 18.7% -0.2%Consultant Fees - Surveys - - 20,000 20,000 Maintenance Program Support 112,000 112,000 162,000 50,000 44.6% 44.6%Maintenance Program Support - ITS 1,020,000 850,000 850,000 (170,000) 0.0% -16.7%FON Program Support 200,000 250,000 250,000 50,000 0.0% 25.0%Pavement Management System 35,000 35,000 35,000 - 0.0% 0.0%Auditing Fees 79,500 79,500 79,500 - 0.0% 0.0%Contract Personnel 9,669,664 8,729,000 13,098,988 3,429,324 50.1% 35.5%Toll Plazas Sarlaries/Wages 10,172,024 10,172,024 10,316,332 144,308 1.4% 1.4%Toll Plazas Other Direct Expenses 433,852 433,852 434,620 768 0.2% 0.2%Toll Collection Management Fees 951,542 920,000 922,657 (28,885) 0.3% -3.0%Toll Plazas Administration Salaries 1,729,603 1,729,603 1,748,240 18,637 1.1% 1.1%Toll Plazas Office Expenses 303,405 303,405 308,210 4,805 1.6% 1.6%Toll Plazas Insurance and Bond 49,471 49,471 49,970 499 1.0% 1.0%Florida Highway Patrol Services 965,871 1,013,000 1,031,364 65,493 1.8% 6.8%Motorist Service Patrol Agreement 1,400,000 1,334,000 1,760,812 360,812 32.0% 25.8%Rapid Incident Scene Clearance 50,000 30,000 50,000 - 66.7% 0.0%Toll Plazas Janitorial 317,113 317,113 323,455 6,342 2.0% 2.0%Travel 70,500 44,347 76,900 6,400 73.4% 9.1%Reimbursed Local Travel 12,095 8,452 16,300 4,205 92.9% 34.8%Gasoline 15,250 14,000 15,500 250 10.7% 1.6%Telephone Service 548,410 373,285 409,250 (139,160) 9.6% -25.4%Internet Service 55,800 112,000 104,000 48,200 -7.1% 86.4%Postage and Delivery 1,944,500 1,734,000 2,003,700 59,200 15.6% 3.0%Printing 454,480 432,600 487,500 33,020 12.7% 7.3%Service Center Printing and Mailing 60,000 62,000 66,000 6,000 6.5% 10.0%CAFR 17,500 17,500 17,500 - 0.0% 0.0%Utilities 2,474,000 2,371,000 2,481,000 7,000 4.6% 0.3%Lease - Buildings 234,900 135,000 56,500 (178,400) -58.1% -75.9%Leases - Equipment 57,632 52,500 54,700 (2,932) 4.2% -5.1%Records Management 31,900 27,800 32,956 1,056 18.5% 3.3%Insurance 777,789 814,816 850,582 72,793 4.4% 9.4%Repairs & Maint. - Equipment 181,600 160,800 258,300 76,700 60.6% 42.2%Maintenance FON Locates 12,000 12,000 12,000 - 0.0% 0.0%Maintenance - ITS Infrastructure 1,790,000 1,790,000 1,887,000 97,000 5.4% 5.4%Support & Maint. - Software 98,910 99,089 104,043 5,133 5.0% 5.2%Repairs & Maint. - Software and Hardware 1,011,715 1,048,700 655,550 (356,165) -37.5% -35.2%
Central Florida Expressway AuthorityAll Activities - Total By Line Item
DRAFT
Page 3 of 30

2018 Projected 2019 $ Inc (Decr) % Inc (Decr) % Inc (Decr)Annual Year-end Annual over 2018 over Proj. over 2018
Description Budget Actual Budget Budget 2018 Actual BudgetMaintenance - Toll Collection Software 890,000 950,000 890,000 - -6.3% 0.0%Maintenance - Toll System Replacement 511,372 250,000 511,000 (372) 104.4% -0.1%Repairs & Maint. - Fiber Optic Network 380,000 300,000 365,000 (15,000) 21.7% -3.9%Facilities Maintenance 2,058,120 2,017,137 1,906,680 (151,440) -5.5% -7.4%Repairs and Maint. - Toll Equipment 2,987,796 2,820,750 2,894,082 (93,714) 2.6% -3.1%Repairs and Maint. - Toll Equipment Parts 420,500 360,250 390,500 (30,000) 8.4% -7.1%Repairs & Maint. - VES Equipment 521,303 500,000 515,069 (6,234) 3.0% -1.2%Repairs & Maint. - Vehicles 10,100 9,433 10,000 (100) 6.0% -1.0%System Modifications Maintenance -Website 5,400 25,000 5,400 - -78.4% 0.0%Roadway and Bridges Maintenance 5,259,300 6,772,465 6,373,540 1,114,240 -5.9% 21.2%Landscape Maintenance Service 3,707,300 2,672,336 3,843,311 136,011 43.8% 3.7%Bridge Inspection 342,000 356,500 342,000 - -4.1% 0.0%Sign Maintenance/Inspection 294,500 282,000 306,280 11,780 8.6% 4.0%Traffic Signals and Lights 164,000 126,300 164,000 - 29.8% 0.0%Aquatics 218,750 158,121 240,625 21,875 52.2% 10.0%Board Meeting Broadcasting 8,700 8,700 8,700 - 0.0% 0.0%Promotion - Sponsorships - 1,017 - - -100.0%Promotion 1,757,500 1,757,500 1,800,000 42,500 2.4% 2.4%Newsletter 2,000 3,600 3,600 1,600 0.0% 80.0%Photography 2,000 4,000 2,000 - -50.0% 0.0%Displays 1,500 1,500 3,500 2,000 133.3% 133.3%Graphic Production Services 78,500 57,500 70,000 (8,500) 21.7% -10.8%Promotional Items 26,000 26,300 27,500 1,500 4.6% 5.8%Advertising and Legal Notices 7,500 7,300 7,500 - 2.7% 0.0%Bank Fees 1,230,000 1,425,300 1,549,500 319,500 8.7% 26.0%Credit Card Fees 7,345,537 7,100,000 7,870,000 524,463 10.8% 7.1%Security 14,260 12,990 7,110 (7,150) -45.3% -50.1%Special Events 21,000 26,500 37,000 16,000 39.6% 76.2%Employee Support Services 3,000 5,800 7,000 4,000 20.7% 133.3%Miscellaneous Expense 20,550 3,350 22,150 1,600 561.2% 7.8%Office Supplies 94,019 76,500 88,750 (5,269) 16.0% -5.6%Office Expense - Other 198,575 166,640 196,700 (1,875) 18.0% -0.9%Operating Supplies 39,250 36,125 39,250 - 8.7% 0.0%Transponder Supplies 10,000 7,000 10,000 - 42.9% 0.0%Software Expense 49,775 75,150 3,100 (46,675) -95.9% -93.8%Dues and Subscriptions 242,685 237,729 601,584 358,899 153.1% 147.9%Books and Publications 600 100 600 - 500.0% 0.0%Seminars and Conferences 30,300 32,454 40,425 10,125 24.6% 33.4%Staff Training and Education 72,600 60,550 74,550 1,950 23.1% 2.7%Contingency (Projects) 57,500 5,000 57,500 - 1050.0% 0.0%Furniture 33,800 21,080 35,250 1,450 67.2% 4.3% Total Other: 69,706,919 67,640,353 75,992,166 6,285,247 12.3% 9.0%
Interoperability Transaction Fee 5,500,000 5,000,000 7,500,000 2,000,000 50.0% 36.4%
Other Operating Expenses 2,535,599 2,124,874 2,453,750 (81,849) 15.5% -3.2%
TOTAL 85,675,454 82,673,809 94,363,512 8,688,058 14.1% 10.1%
CAPITAL EXPENDITURESGeneral Equipment 168,500 68,000 213,500 45,000 214.0% 26.7%Vehicle Purchases 113,000 107,677 60,000 (53,000) -44.3% -46.9%Software 175,000 88,000 195,000 20,000 121.6% 11.4% Total Capital Expenditures: 456,500 263,677 468,500 12,000 77.7% 2.6%
DRAFT
Page 4 of 30

2018 Projected 2019 $ Inc (Decr) % Inc (Decr) % Inc (Decr)Budget Year-end Annual over 2018 over Proj. over 2018
Actual Budget Budget 2018 Actual Budget
Toll Operations (710) 543,117$ 519,836$ 561,165$ 18,048$ 8% 3%IT (720) 4,431,746 4,720,946 4,568,412 136,666 -3% 3%Special Projects (725) 221,369 196,192 215,969 (5,399) 10% -2%Service Center (740 & 750) 20,087,392 18,647,919 24,150,079 4,062,687 30% 20%E-PASS Business Services (743) - - 154,059 154,059 Public Outreach/Education (745) 2,545,651 2,564,366 2,517,100 (28,551) -2% -1%Toll Facilities 23,844,136 23,549,140 23,939,274 95,138 2% 0%Subtotal 51,673,411 50,198,398 56,106,058 4,432,648 12% 9%
Interoperability Transaction Fee 5,500,000 5,000,000 7,500,000 2,000,000 50% 36%
Total Operating Costs 57,173,411 55,198,398 63,606,058 6,432,648 15% 11%
Capital Expenditures and Projects
Capital ExpendituresIT (720) 153,500 60,000 153,500 - 156% 0%
Central Florida Expressway AuthorityOperations Activity - Summary
DRAFT
Page 5 of 30

2018 Projected 2019 $ Inc (Decr) % Inc (Decr) % Inc (Decr)Annual Year-end Annual over 2018 over Proj. over 2018
Description Budget Actual Budget Budget 2018 Actual Budget
SALARIES & BENEFITSSalaries & Wages 1,272,573$ 1,541,930$ 1,405,883$ 133,310$ -9% 10.5%Social Security and Medicare 91,404 114,272 104,556 13,152 -9% 14.4%Retirement Contributions -FRS 123,958 151,429 157,645 33,687 4% 27.2%Life and Health Insurance 310,035 352,796 342,442 32,407 -3% 10.5%State Assessment 2,850 2,972 3,427 577 15% 20.3%Workers' Compensation 3,983 4,802 4,628 645 -4% 16.2% Total Salaries & Benefits 1,804,802 2,168,202 2,018,580 213,779 -7% 11.8%
OTHERCost Of Transponders Sold - Sticker 844,600 950,000 1,050,000 205,400 11% 24.3%Cost Of Transponders Sold - Hardcase 365,000 380,000 420,000 55,000 11% 15.1%Cost Of Transponders Sold - Bumper 8,722 3,539 3,738 (4,984) 6% -57.1%Professional Services 659,000 740,000 904,000 245,000 22% 37.2%Consultant Fees- Surveys - - 20,000 20,000 Contract Personnel 9,020,405 8,090,000 12,020,101 2,999,696 49% 33.3%Toll Plazas Sarlaries/Wages 10,172,024 10,172,024 10,316,332 144,308 1% 1.4%Toll Plazas Other Direct Expenses 433,852 433,852 434,620 768 0% 0.2%Toll Collection Management Fees 951,542 920,000 922,657 (28,885) 0% -3.0%Toll Plazas Administration Salaries 1,729,603 1,729,603 1,748,240 18,637 1% 1.1%Toll Plazas Office Expenses 303,405 303,405 308,210 4,805 2% 1.6%Toll Plazas Insurance and Bond 49,471 49,471 49,970 499 1% 1.0%Toll Plazas Janitorial 317,113 317,113 323,455 6,342 2% 2.0%Travel 12,200 5,900 14,700 2,500 149% 20.5%Reimbursed Local Travel 1,450 1,150 2,950 1,500 157% 103.4%Gasoline 1,900 1,400 2,150 250 54% 13.2%Telephone Service 528,560 356,020 409,250 (119,310) 15% -22.6%Internet Service 55,800 112,000 104,000 48,200 -7% 86.4%Postage and Delivery 1,937,500 1,728,000 1,997,500 60,000 16% 3.1%Printing 448,500 427,600 480,500 32,000 12% 7.1%Service Center Printing and Mailing 60,000 62,000 66,000 6,000 6% 10.0%Utilities 2,042,000 1,939,000 2,035,000 (7,000) 5% -0.3%Lease - Buildings 234,900 135,000 56,500 (178,400) -58% -75.9%Leases - Equipment 20,200 16,500 18,200 (2,000) 10% -9.9%Records Management 1,900 1,800 1,900 - 6% 0.0%Insurance 676,855 670,000 695,139 18,284 4% 2.7%Repairs & Maint. - Equipment 171,300 155,800 248,300 77,000 59% 45.0%Repairs & Maint. - Software and Hardware 884,865 933,700 613,700 (271,165) -34% -30.6%Maintenance - Toll Collection Software 890,000 950,000 890,000 - -6% 0.0%Maintenance - Toll System Replacement 511,372 250,000 511,000 (372) 104% -0.1%Facilities Maintenance 1,832,620 1,841,637 1,661,180 (171,440) -10% -9.4%Repairs and Maint. - Toll Equipment 2,987,796 2,820,750 2,894,082 (93,714) 3% -3.1%Repairs and Maint. - Toll Equipment Parts 420,500 360,250 390,500 (30,000) 8% -7.1%Repairs & Maint. - VES Equipment 521,303 500,000 515,069 (6,234) 3% -1.2%Repairs & Maint. - Vehicles 2,050 1,500 2,000 (50) 33% -2.4%Promotion - Sponsorships - 1,017 - - Promotion 1,757,500 1,757,500 1,800,000 42,500 2% 2.4%Newsletter 2,000 3,600 3,600 1,600 0% 80.0%Displays 1,500 1,500 3,500 2,000 133% 133.3%Graphic Production Services 63,500 50,000 60,000 (3,500) 20% -5.5%Promotional Items 25,000 25,000 25,000 - 0% 0.0%Bank Fees 1,194,000 1,389,300 1,512,500 318,500 9% 26.7%Credit Card Fees 7,345,537 7,100,000 7,870,000 524,463 11% 7.1%Security 12,760 9,990 5,610 (7,150) -44% -56.0%Miscellaneous Expense 3,050 1,500 3,650 600 143% 19.7%Office Supplies 43,569 34,900 43,900 331 26% 0.8%Office Expense - Other 150,025 148,100 150,250 225 1% 0.1%Operating Supplies 39,250 36,125 39,250 - 9% 0.0%Transponder Supplies 10,000 7,000 10,000 - 43% 0.0%Software Expense 47,275 50,150 600 (46,675) -99% -98.7%Dues and Subscriptions 17,460 16,350 365,325 347,865 2134% 1992.4%Books and Publications 600 100 600 - 500% 0.0%
Central Florida Expressway AuthorityOperations Activity - Total By Line Item
DRAFT
Page 6 of 30

2018 Projected 2019 $ Inc (Decr) % Inc (Decr) % Inc (Decr)Annual Year-end Annual over 2018 over Proj. over 2018
Description Budget Actual Budget Budget 2018 Actual BudgetSeminars and Conferences 3,725 6,850 4,700 975 -31% 26.2%Staff Training and Education 34,000 22,000 36,000 2,000 64% 5.9%Contingency Project(s) 10,000 5,000 10,000 - 100% 0.0%Furniture 9,550 5,200 12,050 2,500 132% 26.2% Total Other: 49,868,609 48,030,196 54,087,478 4,218,869 13% 8.5%
SUBTOTAL 51,673,411 50,198,398 56,106,058 4,432,648 12% 8.6%
Interoperability Transaction Fee 5,500,000 5,000,000 7,500,000 2,000,000 50% 36.4%
TOTAL 57,173,411 55,198,398 63,606,058 6,432,648 15% 11.3%
CAPITAL EXPENDITURESGeneral Equipment 133,500 50,000 133,500 - 167% 0.0%Software 20,000 10,000 20,000 - 100% 0.0% Total Capital Expenditures: 153,500 60,000 153,500 - 156% 0.0%
DRAFT
Page 7 of 30
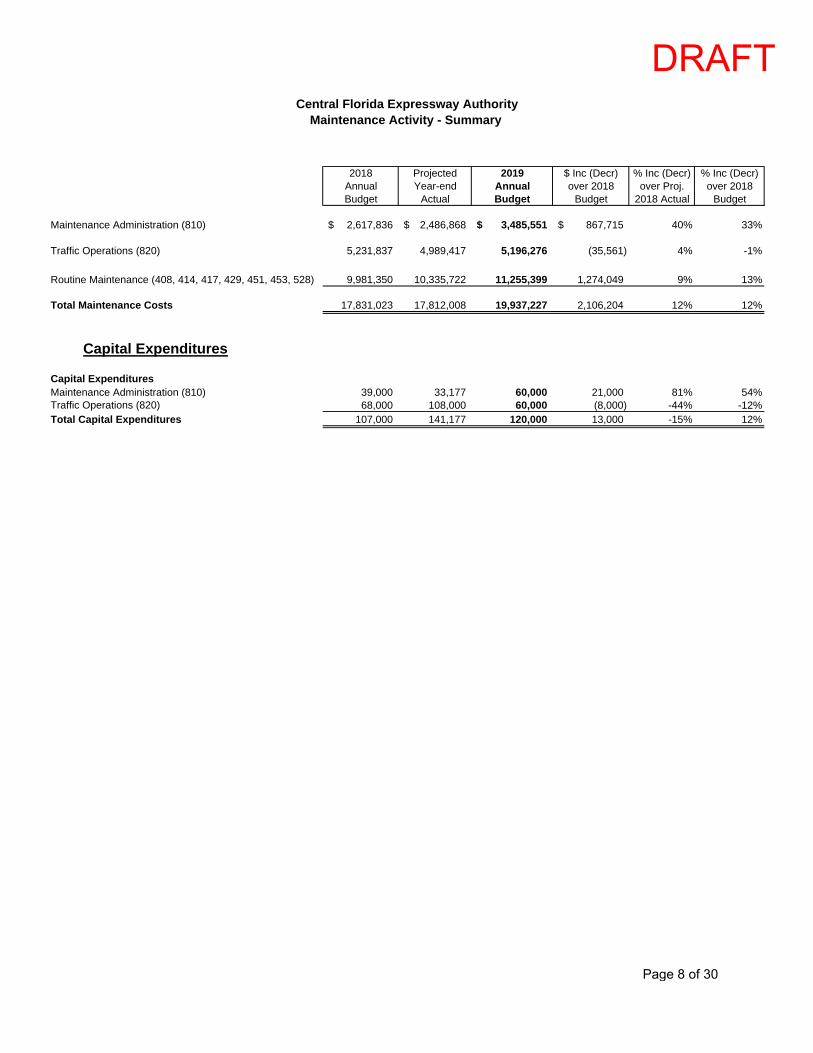
2018 Projected 2019 $ Inc (Decr) % Inc (Decr) % Inc (Decr)Annual Year-end Annual over 2018 over Proj. over 2018Budget Actual Budget Budget 2018 Actual Budget
Maintenance Administration (810) 2,617,836$ 2,486,868$ 3,485,551$ 867,715$ 40% 33%
Traffic Operations (820) 5,231,837 4,989,417 5,196,276 (35,561) 4% -1%
Routine Maintenance (408, 414, 417, 429, 451, 453, 528) 9,981,350 10,335,722 11,255,399 1,274,049 9% 13%
Total Maintenance Costs 17,831,023 17,812,008 19,937,227 2,106,204 12% 12%
Capital Expenditures
Capital ExpendituresMaintenance Administration (810) 39,000 33,177 60,000 21,000 81% 54%Traffic Operations (820) 68,000 108,000 60,000 (8,000) -44% -12%Total Capital Expenditures 107,000 141,177 120,000 13,000 -15% 12%
Central Florida Expressway AuthorityMaintenance Activity - Summary
DRAFT
Page 8 of 30
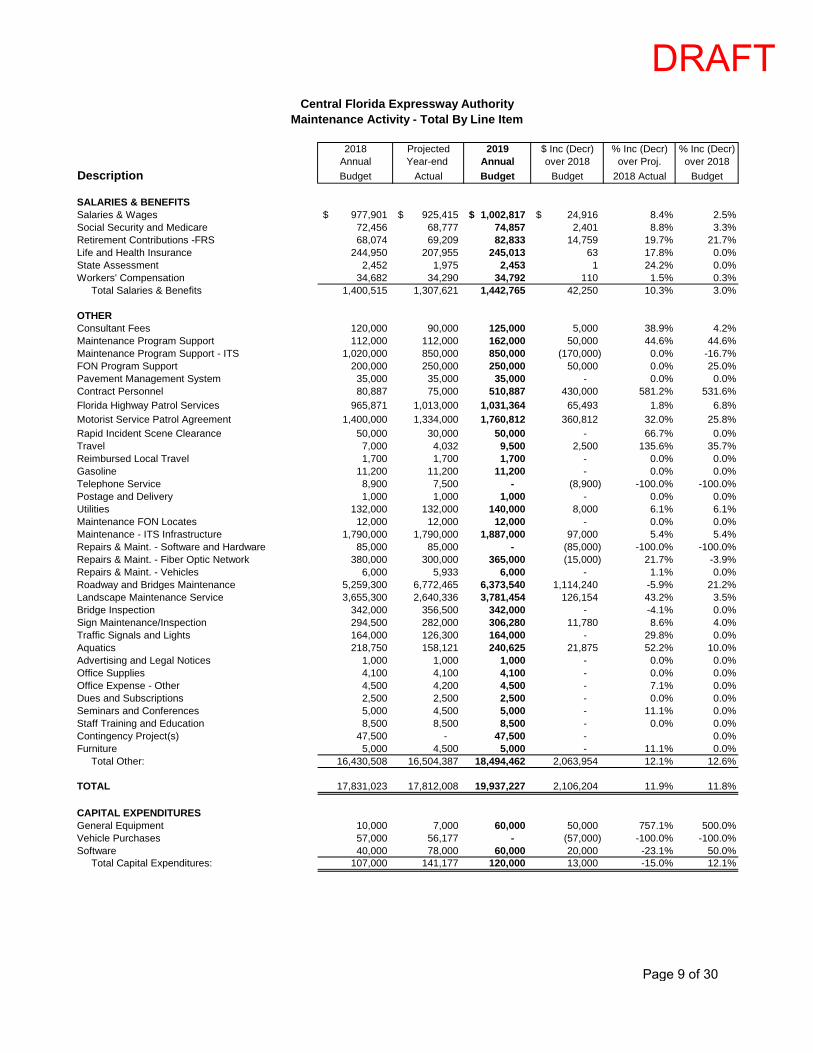
2018 Projected 2019 $ Inc (Decr) % Inc (Decr) % Inc (Decr)Annual Year-end Annual over 2018 over Proj. over 2018
Description Budget Actual Budget Budget 2018 Actual Budget
SALARIES & BENEFITSSalaries & Wages 977,901$ 925,415$ 1,002,817$ 24,916$ 8.4% 2.5%Social Security and Medicare 72,456 68,777 74,857 2,401 8.8% 3.3%Retirement Contributions -FRS 68,074 69,209 82,833 14,759 19.7% 21.7%Life and Health Insurance 244,950 207,955 245,013 63 17.8% 0.0%State Assessment 2,452 1,975 2,453 1 24.2% 0.0%Workers' Compensation 34,682 34,290 34,792 110 1.5% 0.3% Total Salaries & Benefits 1,400,515 1,307,621 1,442,765 42,250 10.3% 3.0%
OTHERConsultant Fees 120,000 90,000 125,000 5,000 38.9% 4.2%Maintenance Program Support 112,000 112,000 162,000 50,000 44.6% 44.6%Maintenance Program Support - ITS 1,020,000 850,000 850,000 (170,000) 0.0% -16.7%FON Program Support 200,000 250,000 250,000 50,000 0.0% 25.0%Pavement Management System 35,000 35,000 35,000 - 0.0% 0.0%Contract Personnel 80,887 75,000 510,887 430,000 581.2% 531.6%
Florida Highway Patrol Services 965,871 1,013,000 1,031,364 65,493 1.8% 6.8%
Motorist Service Patrol Agreement 1,400,000 1,334,000 1,760,812 360,812 32.0% 25.8%
Rapid Incident Scene Clearance 50,000 30,000 50,000 - 66.7% 0.0%Travel 7,000 4,032 9,500 2,500 135.6% 35.7%Reimbursed Local Travel 1,700 1,700 1,700 - 0.0% 0.0%Gasoline 11,200 11,200 11,200 - 0.0% 0.0%Telephone Service 8,900 7,500 - (8,900) -100.0% -100.0%Postage and Delivery 1,000 1,000 1,000 - 0.0% 0.0%Utilities 132,000 132,000 140,000 8,000 6.1% 6.1%Maintenance FON Locates 12,000 12,000 12,000 - 0.0% 0.0%Maintenance - ITS Infrastructure 1,790,000 1,790,000 1,887,000 97,000 5.4% 5.4%Repairs & Maint. - Software and Hardware 85,000 85,000 - (85,000) -100.0% -100.0%Repairs & Maint. - Fiber Optic Network 380,000 300,000 365,000 (15,000) 21.7% -3.9%Repairs & Maint. - Vehicles 6,000 5,933 6,000 - 1.1% 0.0%Roadway and Bridges Maintenance 5,259,300 6,772,465 6,373,540 1,114,240 -5.9% 21.2%Landscape Maintenance Service 3,655,300 2,640,336 3,781,454 126,154 43.2% 3.5%Bridge Inspection 342,000 356,500 342,000 - -4.1% 0.0%Sign Maintenance/Inspection 294,500 282,000 306,280 11,780 8.6% 4.0%Traffic Signals and Lights 164,000 126,300 164,000 - 29.8% 0.0%Aquatics 218,750 158,121 240,625 21,875 52.2% 10.0%Advertising and Legal Notices 1,000 1,000 1,000 - 0.0% 0.0%Office Supplies 4,100 4,100 4,100 - 0.0% 0.0%Office Expense - Other 4,500 4,200 4,500 - 7.1% 0.0%Dues and Subscriptions 2,500 2,500 2,500 - 0.0% 0.0%Seminars and Conferences 5,000 4,500 5,000 - 11.1% 0.0%Staff Training and Education 8,500 8,500 8,500 - 0.0% 0.0%Contingency Project(s) 47,500 - 47,500 - 0.0%Furniture 5,000 4,500 5,000 - 11.1% 0.0% Total Other: 16,430,508 16,504,387 18,494,462 2,063,954 12.1% 12.6%
TOTAL 17,831,023 17,812,008 19,937,227 2,106,204 11.9% 11.8%
CAPITAL EXPENDITURESGeneral Equipment 10,000 7,000 60,000 50,000 757.1% 500.0%Vehicle Purchases 57,000 56,177 - (57,000) -100.0% -100.0%Software 40,000 78,000 60,000 20,000 -23.1% 50.0% Total Capital Expenditures: 107,000 141,177 120,000 13,000 -15.0% 12.1%
Central Florida Expressway AuthorityMaintenance Activity - Total By Line Item
DRAFT
Page 9 of 30

2018 Projected 2019 $ Inc (Decr) % Inc (Decr) % Inc (Decr)Budget Year-end Annual over 2018 over Proj. over 2018
Actual Budget Budget 2018 Actual Budget
General (610) 821,679$ 744,440$ 908,519$ 86,840$ 22% 11%
525 Magnolia (615) 24,646 24,605 25,324 678 3% 3%
Administrative Services (620) 2,052,154 2,025,879 2,108,650 56,496 4% 3%
Engineering (623) 57,185 55,980 60,316 3,130 8% 5%
Legal (625) 742,944 644,661 752,219 9,275 17% 1%
Accounting (630) 1,547,653 1,417,871 1,585,147 37,494 12% 2%
Procurement (640) 472,018 457,284 486,381 14,363 6% 3%
Records Management (655) 418,921 286,742 373,470 (45,451) 30% -11%
Human Resources (660) 308,510 252,944 317,415 8,905 25% 3%
Supplier Diversity (665) 361,421 326,646 364,054 2,633 11% 1%
Communications (670) 704,937 689,203 759,841 54,904 10% 8%
Construction Administration (685) 59,354 48,277 61,142 1,788 27% 3%
Internal Audit (690) 564,000 564,000 564,000 - 0% 0%
Total Administration Costs 8,135,422 7,538,530 8,366,477 231,055 11% 3%
Capital Expenditures and Projects
Capital ExpendituresGeneral (610) 45,000 31,500 45,000 - 43% 0%HR (660) 30,000 - 30,000 - 0%Communications (670) 85,000 - 85,000 - 0%Construction Administration (685) 36,000 31,000 35,000 (1,000) 13% -3%Total Capital Expenditures 196,000 62,500 195,000 (1,000) 212% -1%
Central Florida Expressway AuthorityAdministration Activity - Summary
DRAFT
Page 10 of 30

2018 Projected 2019 $ Inc (Decr) % Inc (Decr) % Inc (Decr)Annual Year-end Annual over 2018 over Proj. over 2018
Description Budget Actual Budget Budget 2018 Actual Budget
SALARIES & BENEFITSSalaries & Wages 3,311,901$ 3,123,821$ 3,449,561$ 137,660$ 10.4% 4.2%Social Security and Medicare 228,331 204,167 232,920 4,589 14.1% 2.0%Retirement Contributions -FRS 406,734 406,504 470,700 63,965 15.8% 15.7%Life and Health Insurance 759,315 677,915 781,099 21,783 15.2% 2.9%State Assessment 7,706 6,160 8,007 302 30.0% 3.9%Workers' Compensation 13,633 14,193 13,965 331 -1.6% 2.4% Total Salaries & Benefits 4,727,620 4,432,760 4,956,251 228,631 11.8% 4.8%
OTHERProfessional Services 835,250 679,303 725,250 (110,000) 6.8% -13.2%Legal Fees 200,000 175,000 200,000 - 14.3% 0.0%Consultant Fees 218,729 194,677 212,993 (5,736) 9.4% -2.6%Auditing Fees 79,500 79,500 79,500 - 0.0% 0.0%Contract Personnel 568,372 564,000 568,000 (372) 0.7% -0.1%Travel 51,300 34,415 52,700 1,400 53.1% 2.7%Reimbursed Local Travel 8,945 5,602 11,650 2,705 108.0% 30.2%Gasoline 2,150 1,400 2,150 - 53.6% 0.0%Telephone Service 10,950 9,765 - (10,950) -100.0% -100.0%Postage and Delivery 6,000 5,000 5,200 (800) 4.0% -13.3%Printing 5,980 5,000 7,000 1,020 40.0% 17.1%CAFR 17,500 17,500 17,500 - 0.0% 0.0%Utilities 300,000 300,000 306,000 6,000 2.0% 2.0%Leases - Equipment 37,432 36,000 36,500 (932) 1.4% -2.5%Records Management 30,000 26,000 31,056 1,056 19.4% 3.5%Insurance 100,934 144,816 155,443 54,509 7.3% 54.0%Repairs & Maint. - Equipment 10,300 5,000 10,000 (300) 100.0% -2.9%Support & Maint. - Software 98,910 99,089 104,043 5,133 5.0% 5.2%Repairs & Maint. - Software and Hardware 41,850 30,000 41,850 - 39.5% 0.0%Facilities Maintenance 225,500 175,500 245,500 20,000 39.9% 8.9%Repairs & Maint. - Vehicles 2,050 2,000 2,000 (50) 0.0% -2.4%System Modifications Maintenance - Website 5,400 25,000 5,400 - -78.4% 0.0%Landscape Maintenance Service 52,000 32,000 61,857 9,857 93.3% 19.0%Board Meeting Broadcasting 8,700 8,700 8,700 - 0.0% 0.0%Photography 2,000 4,000 2,000 - -50.0% 0.0%Graphic Production Services 15,000 7,500 10,000 (5,000) 33.3% -33.3%Promotional Items 1,000 1,300 2,500 1,500 92.3% 150.0%Advertising and Legal Notices 6,500 6,300 6,500 - 3.2% 0.0%Bank Fees 36,000 36,000 37,000 1,000 2.8% 2.8%Security 1,500 3,000 1,500 - -50.0% 0.0%Special Events 21,000 26,500 37,000 16,000 39.6% 76.2%Employee Support Services 3,000 5,800 7,000 4,000 20.7% 133.3%Miscellaneous Expense 17,500 1,850 18,500 1,000 900.0% 5.7%Office Supplies 46,350 37,500 40,750 (5,600) 8.7% -12.1%Office Expense - Other 44,050 14,340 41,950 (2,100) 192.5% -4.8%Software Expense 2,500 25,000 2,500 - -90.0% 0.0%Dues and Subscriptions 222,725 218,879 233,759 11,034 6.8% 5.0%Seminars and Conferences 21,575 21,104 30,725 9,150 45.6% 42.4%Staff Training and Education 30,100 30,050 30,050 (50) 0.0% -0.2%Furniture 19,250 11,380 18,200 (1,050) 59.9% -5.5% Total Other: 3,407,802 3,105,770 3,410,226 2,424 9.8% 0.1%
TOTAL 8,135,422 7,538,530 8,366,477 231,055 11.0% 2.8%
CAPITAL EXPENDITURESGeneral Equipment 25,000 11,000 20,000 (5,000) 81.8% -20.0%Vehicles 56,000 51,500 60,000 4,000 16.5% 7.1%Software 115,000 - 115,000 - 0.0% Total Capital Expenditures: 196,000 62,500 195,000 (1,000) 212.0% -0.5%
Central Florida Expressway AuthorityAdministration Activity - Total By Line Item
DRAFT
Page 11 of 30

2018 Projected 2019 $ Inc (Decr) % Inc (Decr) % Inc (Decr)
Annual Year-end Annual over 2018 over Proj. over 2018Budget Actual Budget Budget 2018 Actual Budget
Traffic & Engineering Consultant 500,000$ 444,755$ 461,750$ (38,250)$ 4% -8%
General Systems Consultant - - 400,000 400,000
General Engineering Consultant 2,035,599 1,680,119 1,592,000 (443,599) -5% -22%
Total Other Operating Expenses 2,535,599 2,124,874 2,453,750 (81,849) 15% -3%
Cental Florida Expressway AuthorityOther Operating
DRAFT
Page 12 of 30

2018 Projected 2019 $ Inc (Decr) % Inc (Decr) % Inc (Decr)Annual Year-end Annual over 2018 over Proj. over 2018Budget Actual Budget Budget 2018 Actual Budget
Maintenance 151,000$ 155,545$ 127,702$ (23,298)$ -18% -15%
Operations 308,786 297,249 322,032 13,246 8% 4%
TOTAL 459,786 452,794 449,734 (10,052) -1% -2%
TOLL REVENUE (2,000,000) (2,200,000) (2,200,000) (200,000) 10%
NET RESULT OF ACTIVITY 1,540,214 1,747,206 1,750,266 210,052 0% 14%
Cental Florida Expressway AuthorityGoldenrod Road - Summary
DRAFT
Page 13 of 30

Central Florida Expressway AuthorityFive-Year Work Plan
Category Summary
20/21 21/22 22/23E U E U U U U
Existing System Improvements 74,023 22,105 12,634 140,706 309,648 152,794 46,983 758,894
System Expansion Projects 2,744 9,676 0 12,149 37,645 105,784 387,140 555,138
Interchange Projects 117,416 0 90,819 5,495 6,617 12,350 43,704 276,401
Facilities Projects 47 11,764 0 12,735 1,704 1,554 1,155 28,959
Transportation Technology Projects 7,184 6,881 0 9,009 5,554 3,989 3,138 35,755
Information Technology Projects 21,922 15,337 4,854 11,835 7,251 0 0 61,199
Signing and Pavement Markings 210 1,627 0 2,847 1,966 1,392 180 8,222
Renewal and Replacement Projects 18,826 25,174 0 58,165 31,203 35,335 8,119 176,822
Landscape Projects 0 810 0 805 1,435 810 805 4,665
SUB TOTALS 242,372 93,374 108,307 253,746 403,023 314,008 491,223
TOTALS 403,023 314,008 491,223 1,906,054
Non-System Projects 0 0 0 0 0 0 0 0
GRAND TOTALS 403,023 314,008 491,223 1,906,054
* Construction costs escalated at 2.8% for FY 2019, 2.6% for FY 2020, 2.5% for FY 2021, 2.7% for FY 2022, and 2.8% for FY 2023. In general, all other costs escalated at an average of 2.7% per year.E = Encumbered costs from projects under contracts from previous fiscal years
U = Unencumbered costs
Project Cost (thousand $)
Category Fiscal YearTotal
335,746 362,053
335,746 362,053
18/19 19/20
Category SumJune 14, 2018 i
Central Florida Expressway AuthorityFY 19-23 Work Plan
DRAFT
Page 14 of 30

Central Florida Expressway AuthorityFive-Year Work Plan
Existing System Improvements Summary (Page 1 of 2)
20/21 21/22 22/23
E U E U U U U
1 408-128 SR 408 Widening from SR 417 to Alafaya Trail SR 417 Alafaya Trail 4.1 Add Lanes, Mill &Resurface 44,800 0 11,200 0 0 0 0 SP Construction
2 417-134 SR 417 Widening from Econ Trail to County Line
Econlockhatchee Trail County Line 2.3 Add Lanes, Mill &
Resurface 0 16,052 0 30,263 0 0 0 SP Bidding & Construction
3 417-141 SR 417 Widening from International Drive to John Young Parkway International Drive John Young Parkway 4.1 Add Lanes, Mill &
Resurface 6,660 0 0 28,975 58,350 0 0 SP Design & Construction
4 417-142 SR 417 Widening from John Young Parkway to Landstar Boulevard
John Young Parkway Landstar Boulevard 3.7 Add Lanes, Mill &
Resurface 6,570 0 0 28,584 57,148 0 0 SP Design & Construction
5 417-149 SR 417 Widening from Landstar Boulevard to Boggy Creek Road Landstar Boulevard Boggy Creek Road 3.7 Add Lanes, Mill &
Resurface 4,536 0 1,134 12,420 49,641 12,410 0 SP Design & Construction
6 417-150 SR 417 Widening from Boggy Creek Road to Narcoossee Road Boggy Creek Road Narcoossee Road 4.5 Add Lanes, Mill &
Resurface 0 0 0 0 976 3,903 21,198 SP Design & Partial Construction
7 417-151 SR 417 Widening from Narcoossee Road to SR 528 Narcoossee Road SR 528 4.7 Add Lanes, Mill &
Resurface 0 1,479 0 5,917 32,128 64,236 0 SP Design & Construction
8 - SR 417 Widening - Curry Ford to Lake Underhill Road Landscaping Curry Ford Road Lake Underhill Road 1.6 Landscaping 0 0 0 19 300 20 20 SP Design, Installation & Maintenance
9 417-253G SR 417 / SR 408 Interchange Landscaping - - - Interchange Landscaping 0 0 0 0 0 80 1,098 SP Design, Installation & Partial Maintenance
10 - SR 417 / Florida's Turnpike Interchange Landscaping - - - Interchange Landscaping 0 0 0 0 54 780 20 SP Design, Installation & Partial
Maintenance
11 - SR 429 / Florida's Turnpike Interchange - - - Interchange Improvements 0 0 0 0 0 0 10,000 SP Agency Partnership
12 429-152 SR 429 Widening from Florida's Turnpike to West Road
Florida's Turnpike / SR 50 West Road 4.3 Add Lanes, Mill &
Resurface 0 3,120 0 2,090 45,196 22,598 0 SP Design & Construction
13 429-153 SR 429 Widening from West Road to SR 414 West Road SR 414 3.7 Add Lanes, Mill &Resurface 0 536 0 2,145 11,653 24,125 0 SP Design & Construction
14 429-654D SR 429 / CR 535 Northbound On Ramp Improvements - - - On Ramp Improvements 6,832 0 0 0 0 0 0 SP Partial Construction
Encumbered Total 69,398 12,334
Unencumbered Total 21,187 110,413 255,446 128,152 32,336
SUB-TOTALS (Page 1) 122,747 255,446 128,152 32,336
* Construction costs escalated at 2.8% for FY 2019, 2.6% for FY 2020, 2.5% for FY 2021, 2.7% for FY 2022, and 2.8% for FY 2023. In general, all other costs escalated at an average of 2.7% per year.E = Encumbered costs from projects under contracts from previous fiscal yearsU = Unencumbered costs
Pag
e
Project Number Project Name Length (miles)ToFrom Work Description
Project Description
Fund Source Project Phases Funded
Project Cost (thousands $) by Fiscal Year *
18/19 19/20
90,585
Ext Sys Sum (1)June 14, 2018 ii
Central Florida Expressway AuthorityFY 19-23 Work Plan
DRAFT
Page 15 of 30

Central Florida Expressway AuthorityFive-Year Work Plan
Existing System Improvements Summary (Page 2 of 2)
20/21 21/22 22/23
E U E U U U U
15 528-143 SR 528 Widening - SR 436 to Goldenrod Rd. SR 436 Goldenrod Road 1.4 Ramps, Add Lanes, Mill &Resurface 4,400 0 0 25,452 50,885 0 0 SP Design & Construction
16 - SR 528 Widening from Narcoossee Road to SR 417 Narcoossee Road SR 417 1.8 Add Lanes, Mill &
Resurface 0 0 0 802 812 20,743 0 SP Design & Construction
17 - SR 528 Widening from SR 417 to Innovation Way SR 417 Innovation Way 3.2 Add Lanes, Mill &
Resurface 0 0 0 0 624 2,498 13,571 SP Design & Partial Construction
18 - SR 528 Airport Frontage Landscaping Boggy Creek Road SR 436 2.1 Landscaping 0 0 0 0 250 20 20 SP Design, Installation & Maintenance
19 528-915 Owner's Authorized Rep. for the Brightline Const. along SR 528 OIA SR 520 - Roadway Construction CEI 225 0 300 0 300 75 0 SP Construction Liaison
20 599-156 SR 408 WB exit ramp Intersection Improvements with Old Winter Garden Rd. - - - Minor Roadway Projects -
Signalization 0 60 0 174 0 0 0 SP Design & Construction
21 - SR 408 EB Mills Avenue Exit Ramp Improvements - - - Minor Roadway Projects 0 60 0 174 0 0 0 SP Design & Construction
22 - Systemwide Safety and Operational Improvement Projects - - - Minor Roadway Projects 0 50 0 473 316 301 176 SP Design & Construction
23 - Systemwide Guardrail Upgrade - - - Guardrail Improvements 0 20 0 155 155 150 90 SP Design & Construction
24 - Systemwide Drainage Improvements - - - Drainage Improvements 0 20 0 155 155 150 90 SP Design & Construction
25 - SR 528 / SR 520 Interchange Lighting - - - Lighting Replacement 0 158 0 2,338 0 0 0 SP Design & Construction
26 599-137 Systemwide Lighting & LED Upgrades - - - Lighting Rehabilitation 0 0 0 20 155 155 150 SP Design & Construction
27 - Multimodal/Intermodal Opportunity Study - - - Multimodal/Intermodal Study 0 300 0 300 300 300 300 SP Multimodal/Intermodal Study
28 - Safety Campaign - - - Safety Project 0 250 0 250 250 250 250 SP Communications
Encumbered Total 4,625 300
Unencumbered Total 918 30,293 54,202 24,642 14,647
SUB-TOTALS (Page 2) 30,593 54,202 24,642 14,647
TOTALS 153,340 309,648 152,794 46,983
* Construction costs escalated at 2.8% for FY 2019, 2.6% for FY 2020, 2.5% for FY 2021, 2.7% for FY 2022, and 2.8% for FY 2023. In general, all other costs escalated at an average of 2.7% per year.E = Encumbered costs from projects under contracts from previous fiscal yearsU = Unencumbered costs
96,128
5,543
Project Phases FundedFrom To Length
(miles) Work Description 18/19 19/20Fund
Source Pag
e
Project Number Project Name
Project DescriptionProject Cost (thousands $) by Fiscal Year *
Ext Sys Sum (2)June 14, 2018 iii
Central Florida Expressway AuthorityFY 19-23 Work Plan
DRAFT
Page 16 of 30

Central Florida Expressway AuthorityFive-Year Work Plan
System Expansion Projects Summary (Page 1 of 2)
20/21 21/22 22/23
E U E U U U U
29 599-215 Northeast Connector Expressway Extension Study Northeast District SR 528 8.0 New Expressway 1,059 0 0 0 0 0 0 SP Concept, Feasibility & Mobility
Study
30 599-225 Lake / Orange Connector Feasibility/PD&E Study US 27 SR 429 - New Expressway 1,500 0 0 0 0 0 0 SP PD&E
31 - Lake / Orange Connector (Potential) US 27 SR 429 5.0 New Expressway 0 0 0 0 0 7,531 7,531 SP Design
32 408-254 SR 408 Eastern Extension PD&E Challenger Parkway SR 520 - New Expressway 100 0 0 0 0 0 0 SP PD&E
33 - SR 408 Eastern Extension - Segment 1 (Potential)
Challenger Parkway Avalon Park Boulevard 2.1 New Expressway 0 0 0 0 0 8,513 8,513 SP Design
34 599-221 Osceola Parkway Extension PD&E Study Re-Evaluation (Potential) Boggy Creek Road Sunbridge Parkway - New Expressway 0 2,000 0 0 0 0 0 SP PD&E
35 - Osceola Parkway Extension - Segment 1 (Potential)
Jeff Fuqua Boulevard Narcoossee Road 7.5 New Expressway 0 0 0 7,547 15,094 34,519 125,214 SP Design, Partial Right-of-Way, &
Partial Construction
36 - Osceola Parkway Extension - Segment 2 (Potential) Narcoossee Road Sunbridge Parkway 5.3 New Expressway 0 0 0 0 13,386 19,012 126,453 SP Design, Partial Right-of-Way, &
Partial Construction
37 599-224 Poinciana / I-4 Connector PD&E Study (Potential) Cypress Parkway CR 532 - New Expressway 0 2,000 0 0 0 0 0 SP PD&E
38 - Poinciana / I-4 Connector - Segment 1 (Potential) Cypress Parkway SR 538 @ Kinny
Harmon Road 7.4 New Expressway 0 0 0 0 0 4,425 8,849 SP Design
39 - Southport Connector - Segment 1 (Potential) Pleasant Hill Rd. Future Interchange 5.0 New Expressway 0 0 0 0 0 9,823 51,621 SP Design & Partial Right-of-Way
40 - Southport Connector - Segment 2 (Potential) Future Interchange Florida's Turnpike 4.5 New Expressway 0 0 0 0 0 6,548 46,357 SP Design & Partial Right-of-Way
41 - Southport Connector - Segment 3 (Potential) Florida's Turnpike Canoe Creek Rd. 2.0 New Expressway 0 0 0 0 6,945 13,891 11,582 SP Design & Partial Right-of-Way
Encumbered Total 2,659 0
Unencumbered Total 4,000 7,547 35,425 104,262 386,120
SUB-TOTALS (Page 1) 6,659 7,547 35,425 104,262 386,120
* Construction costs escalated at 2.8% for FY 2019, 2.6% for FY 2020, 2.5% for FY 2021, 2.7% for FY 2022, and 2.8% for FY 2023. Right-of-Way costs escalated at 6.0% per year.In general, all other costs escalated at an average of 2.7% per year.
E = Encumbered costs from projects under contracts from previous fiscal yearsU = Unencumbered costs
Project NameProject Number
Pag
e
Project Phases FundedFund SourceWork Description
Project DescriptionProject Cost (thousands $) by Fiscal Year *
18/19 19/20Length (miles)ToFrom
EXP Sum (1)June 14, 2018 iv
Central Florida Expressway AuthorityFY 19-23 Work Plan
DRAFT
Page 17 of 30

Central Florida Expressway AuthorityFive-Year Work Plan
System Expansion Projects Summary (Page 2 of 2)
20/21 21/22 22/23
E U E U U U U
42 - SR 414 Direct Connection Study (Potential) US 441 SR 434 - New Expressway 0 0 0 517 0 0 0 SP Concept Study
43 - Future Corridor Planning Studies (Potential) - - - New Expressway 0 1,000 0 1,000 1,000 1,000 1,000 SP Planning Studies
44 - 2045 Master Plan - - - Master Plan 0 0 0 0 637 0 0 SP Planning
45 429-200G SR 429 / SR 414 Interchange Landscape Phase II - - - Landscaping 20 0 0 0 0 0 0 SP Partial Maintenance
46 429-825 Wekiva Parkway (206) Landscape Coronado Somerset Dr. SR 46 - Landscaping 0 951 0 20 10 0 0 SP Installation & Maintenance
47 429-824 Wekiva Parkway (202 & 203) Landscape US 441 Kelly Park Road - Landscaping 0 60 0 60 0 0 0 SP Maintenance
48 429-826 Wekiva Parkway (205) Landscape Plymouth Sorrento Rd.
South of Orange/Lake County Line - Landscaping 65 879 0 884 20 5 0 SP Design, Installation & Maintenance
49 - Wekiva Parkway (204) Landscape (Systems IC)
South of Ondich Rd. Plymouth Sorrento Rd. - Landscaping 0 161 0 2,085 20 15 0 SP Design, Installation & Maintenance
50 - Wekiva Parkway (203) Kelly Park Rd. Interchange Landscape
Kelly Park Rd. Interchange - - Landscaping 0 0 0 36 533 502 20 SP Design, Installation & Partial
Maintenance
51 429-051 SR 429 - Wekiva Parkway (Right-of-Way) US 441 East of Mt Plymouth Rd and NW to SR 46 - New Expressway 0 2,625 0 0 0 0 0 SP / CF Right-of-Way
Encumbered Total 85 0
Unencumbered Total 5,676 4,602 2,220 1,522 1,020
SUB-TOTALS (Page 2) 5,761 4,602 2,220 1,522 1,020
TOTALS 12,149 37,645 105,784 387,140
* Construction costs escalated at 2.8% for FY 2019, 2.6% for FY 2020, 2.5% for FY 2021, 2.7% for FY 2022, and 2.8% for FY 2023. Right-of-Way costs escalated at 6.0% per year.In general, all other costs escalated at an average of 2.7% per year.
E = Encumbered costs from projects under contracts from previous fiscal yearsU = Unencumbered costs
12,420
Pag
e
Project Number Project Name
Project DescriptionProject Cost (thousands $) by Fiscal Year *
Project Phases FundedFrom To Length
(miles) Work Description 18/19 19/20Fund
Source
EXP Sum (2)June 14, 2018 v
Central Florida Expressway AuthorityFY 19-23 Work Plan
DRAFT
Page 18 of 30

Central Florida Expressway AuthorityFive-Year Work Plan
Interchange Projects Summary
20/21 21/22 22/23
E U E U U U U
52 408-253G SR 408/SR 417 Interchange (Phase II) Design-Build SR 408/SR 417 Lake Underhill Road - Ramps, Mill & Resurface 41,216 0 10,304 0 0 0 0 SP Construction
53 - SR 429 / Schofield Road Interchange Landscaping - - - Landscaping 0 0 0 0 0 0 14 SP Partial Design
54 417-301D SR 417 / Boggy Creek Road Interchange (Phase III) Landscaping - - - Landscaping 20 0 15 0 0 0 0 SP Partial Maintenance
55 408-312 SR 408 at I-4 Ultimate - - - Interchange Reconstruction 75,500 0 80,500 0 300 0 0 SP Contribution, Corridor Consultant, & Const. Liaison
56 429-316A SR 429 Stoneybrook West Interchange - - - Interchange Design 680 0 0 5,490 3,160 0 0 SP Design & Construction
57 - SR 528 / Innovation Way Landscaping - - - Landscaping 0 0 0 0 48 598 20 SP Design, Installation & Partial Maintenance
58 - SR 528 - Dallas Boulevard Interchange East of Econ River Bridge East of Dallas Blvd. - Interchange Reconstruction 0 0 0 5 3,109 11,752 43,670 SP Design & Construction
Encumbered Total 117,416 90,819
Unencumbered Total 0 5,495 6,617 12,350 43,704
TOTALS 117,416 96,314 6,617 12,350 43,704
* Construction costs escalated at 2.8% for FY 2019, 2.6% for FY 2020, 2.5% for FY 2021, 2.7% for FY 2022, and 2.8% for FY 2023. In general, all other costs escalated at an average of 2.7% per year.E = Encumbered costs from projects under contracts from previous fiscal yearsU = Unencumbered costs
Pag
e
Project Description
Work DescriptionLength (miles)ToFrom
Project NameProject Number 18/19 19/20
Project Cost (thousands $) by Fiscal Year *
Project Phases FundedFund Source
ICH SumJune 14, 2018 vi
Central Florida Expressway AuthorityFY 19-23 Work Plan
DRAFT
Page 19 of 30

Central Florida Expressway AuthorityFive-Year Work Plan
Facilities Projects Summary
20/21 21/22 22/23
E U E U U U U
59 - Systemwide Toll Plaza Projects - - - Toll Plaza Projects 0 100 0 100 100 100 100 SP Design & Construction
60 - Systemwide Generator Replacement (SR 417 / 408 / 429) - - - Generator Replacement 0 35 0 2,140 0 0 0 SP Design & Construction
61 - Systemwide Generator Replacement (SR 429) - - - Generator Replacement 0 0 0 41 595 0 0 SP Design & Construction
62 - Systemwide Generator Replacements and Upgrades - - - Generator Replacements 0 0 0 0 16 346 26 SP Design & Construction
63 599-732A SR 408 and SR 429 Toll Plaza Air Conditioner Replacements - - - Air Conditioner
Replacements 47 0 0 0 0 0 0 SP Construction
64 - Systemwide Air Conditioner Unit Replacement 408 / 429 / 414 - - - Air Conditioner
Replacements 0 41 0 297 0 0 0 SP Design & Construction
65 - Systemwide Air Conditioner Replacements and Upgrades - - - Air Conditioner
Replacements 0 0 0 0 28 143 64 SP Design & Construction
66 - SR 408 Ramp Plazas Roof Replacements - - - Roof Replacements 0 716 0 0 0 0 0 SP Design & Construction
67 - Systemwide Roof Replacements - - - Roof Replacements 0 0 0 540 540 540 540 SP Design & Construction
68 - Systemwide Uninterrupted Power Supply (UPS) Replacements - - - UPS Replacements 0 110 0 110 110 110 110 SP Installation
69 599-413 CFX Headquarters 1st & 3rd Floor Renovations - - - Building Modification 0 1,197 0 0 0 0 0 SP Bidding & Construction
70 - Miscellaneous CFX Headquarters Improvements - - - Miscellaneous Projects 0 25 0 315 315 315 315 SP Design & Construction
71 599-416A CFX East District Facility - - - District Facility 0 6,109 0 3,050 0 0 0 SP Design & Construction
72 - CFX West District Facility - - - District Facility 0 3,431 0 6,142 0 0 0 SP Design & Construction
Encumbered Total 47 0
Unencumbered Total 11,764 12,735 1,704 1,554 1,155
TOTALS 11,811 12,735 1,704 1,554 1,155
* Construction costs escalated at 2.8% for FY 2019, 2.6% for FY 2020, 2.5% for FY 2021, 2.7% for FY 2022, and 2.8% for FY 2023. In general, all other costs escalated at an average of 2.7% per year.E = Encumbered costs from projects under contracts from previous fiscal yearsU = Unencumbered costs
Project NameProject Number
Pag
e
Work Description
Project Description
Length (miles)ToFrom 18/19 19/20 Project Phases FundedFund
Source
Project Cost (thousands $) by Fiscal Year *
Facilities SumJune 14, 2018 vii
Central Florida Expressway AuthorityFY 19-23 Work Plan
DRAFT
Page 20 of 30

Central Florida Expressway AuthorityFive-Year Work Plan
Transportation Technology Projects Summary
20/21 21/22 22/23
E U E U U U U
73 408-509 Fiber Optic Network (FON) Utility Adjustments - - - Utility Adjustments 0 100 0 50 50 50 50 SP Utility Adjustments
74 599-536 Regional ITS Partnership Projects - - - Regional ITS Partnership Projects 0 180 0 180 180 180 180 SP Partnership Contributions
75 599-524 ITS Network Upgrade Phase II - - - Re-splice Network Physical Architecture 0 1,820 0 0 0 0 0 SP Design & Installation
76 599-547 Wekiva Parkway CCTV Deployment Sections 2A, 2B & 2C - - - CCTV Cameras 0 953 0 943 0 0 0 SP Installation
77 - Advanced Expressway Operations Performance Measures - - - Enhancements to ITS Data
Analysis Systems 0 0 0 1,345 0 0 0 SP Implementation
78 599-537 Supplemental DCS and CCTV Deployment - - - Deploy DCS and CCTV Cameras 7,184 0 0 0 0 0 0 SP Installation
79 599-526 Wrong-Way Driving Countermeasures - - - Wrong-Way Driving Countermeasures 0 35 0 1,735 1,193 0 0 SP Design & Construction
80 - Security Cameras - Plazas, Ramps, and Service Centers - - - Security Cameras 0 215 0 308 0 0 0 SP Design & Construction
81 - Traffic Safety Improvements Pilot - - - Warning Devices 0 322 0 0 0 0 0 SP Bidding & Construction
82 - Three-Line DMS Upgrade Program - - - New Full-Color DMS roadway signs 0 2,581 0 3,764 3,862 3,593 1,205 SP Design & Construction
83 - Field Ethernet Switch Replacement - - - IT Network switches 0 153 0 157 162 166 0 SP Implementation
84 - Connected Vehicle Study - - - Connected Vehicle Study 0 150 0 0 0 0 0 SP Concept Study
85 - Transportation Technology Master Plan - - - Connected Vehicle Pilot Concept 0 203 0 0 0 0 0 SP Concept
86 599-538 Connected Vehicle Pilot Project - - - Pilot Project 0 169 0 236 0 0 0 SP Design and Construction
87 - Connected Vehicle Technology Deployment - - - Deployment of Connected Vehicle Technology 0 0 0 0 0 0 1,703 SP Design and Implementation
88 - Terminal Server Replacement - - - Replacement of Digi Terminal Servers 0 0 0 135 0 0 0 SP Construction
89 - Remote Power Managers Replacement - - - Replacement of Minuteman Remote Power Managers 0 0 0 52 0 0 0 SP Installation
90 - MG2 Lower Arm Replacement - - - Replacement of Lowering Arms for HD Cameras 0 0 0 104 107 0 0 SP Installation
Encumbered Total 7,184 0
Unencumbered Total 6,881 9,009 5,554 3,989 3,138
TOTALS 14,065 9,009 5,554 3,989 3,138
* Construction costs escalated at 2.8% for FY 2019, 2.6% for FY 2020, 2.5% for FY 2021, 2.7% for FY 2022, and 2.8% for FY 2023. In general, all other costs escalated at an average of 2.7% per year.E = Encumbered costs from projects under contracts from previous fiscal yearsU = Unencumbered costs
Project Phases FundedFund SourceWork DescriptionLength
(miles)To Pag
eProject Description
19/2018/19
Project Cost (thousands $) by Fiscal Year *
FromProject NameProject Number
TT SumJune 14, 2018 viii
Central Florida Expressway AuthorityFY 19-23 Work Plan
DRAFT
Page 21 of 30

Central Florida Expressway AuthorityFive-Year Work Plan
Information Technology Projects Summary
20/21 21/22 22/23
E U E U U U U
91 599-902 Toll Collection System Upgrade - - - Hardware & Software 17,668 0 4,436 0 3,569 0 0 SP Implementation & Testing
92 599-533 Software - Hardware Replacements & Upgrades - - - Hardware and Software 0 1,200 0 1,200 0 0 0 SP Design & Implementation
93 - Back Office - E-PASS Re-Write - - - Hardware & Software 0 9,202 0 6,958 3,482 0 0 SP Design & Implementation
94 599-531 eCommerce Mobile Application - - - Software 0 468 0 366 0 0 0 SP Design & Implementation
95 - Financial / Accounting Software Replacement - - - Software 0 810 0 0 0 0 0 SP Design
96 - E-PASS Service Center Relocations and Buildout - - - New Building for Walk-Up
Center 0 1,117 0 2,911 0 0 0 SP Design & Construction
97 - E-PASS Parking Initiatives - - - E-PASS at Offsite Garages 0 2,040 0 0 0 0 0 SP Design and Implementation
98 - Third-Party Toll Technology - - - Software Testing 0 500 0 400 200 0 0 SP Support Services
99 - Airport E-PASS Rental Car Program - - - E-PASS for airport car rentals. 2,000 0 0 0 0 0 0 SP Design, Construction,
Implementation
100 - Toll Plazas Security Camera - - - Hardware & Software 2,254 0 418 0 0 0 0 SP Implementation & Testing
Encumbered Total 21,922 4,854
Unencumbered Total 15,337 11,835 7,251 0 0
TOTALS 37,259 16,689 7,251 0 0
* Construction costs escalated at 2.8% for FY 2019, 2.6% for FY 2020, 2.5% for FY 2021, 2.7% for FY 2022, and 2.8% for FY 2023. In general, all other costs escalated at an average of 2.7% per year.E = Encumbered costs from projects under contracts from previous fiscal yearsU = Unencumbered costs
Pag
e
Project Number Project Name
Project DescriptionProject Cost (thousands $) by Fiscal Year *
Project Phases FundedFrom To Length
(miles) Work Description 18/19 19/20Fund
Source
IT SumJune 14, 2018 ix
Central Florida Expressway AuthorityFY 19-23 Work Plan
DRAFT
Page 22 of 30
Central Florida Expressway AuthorityFive-Year Work Plan
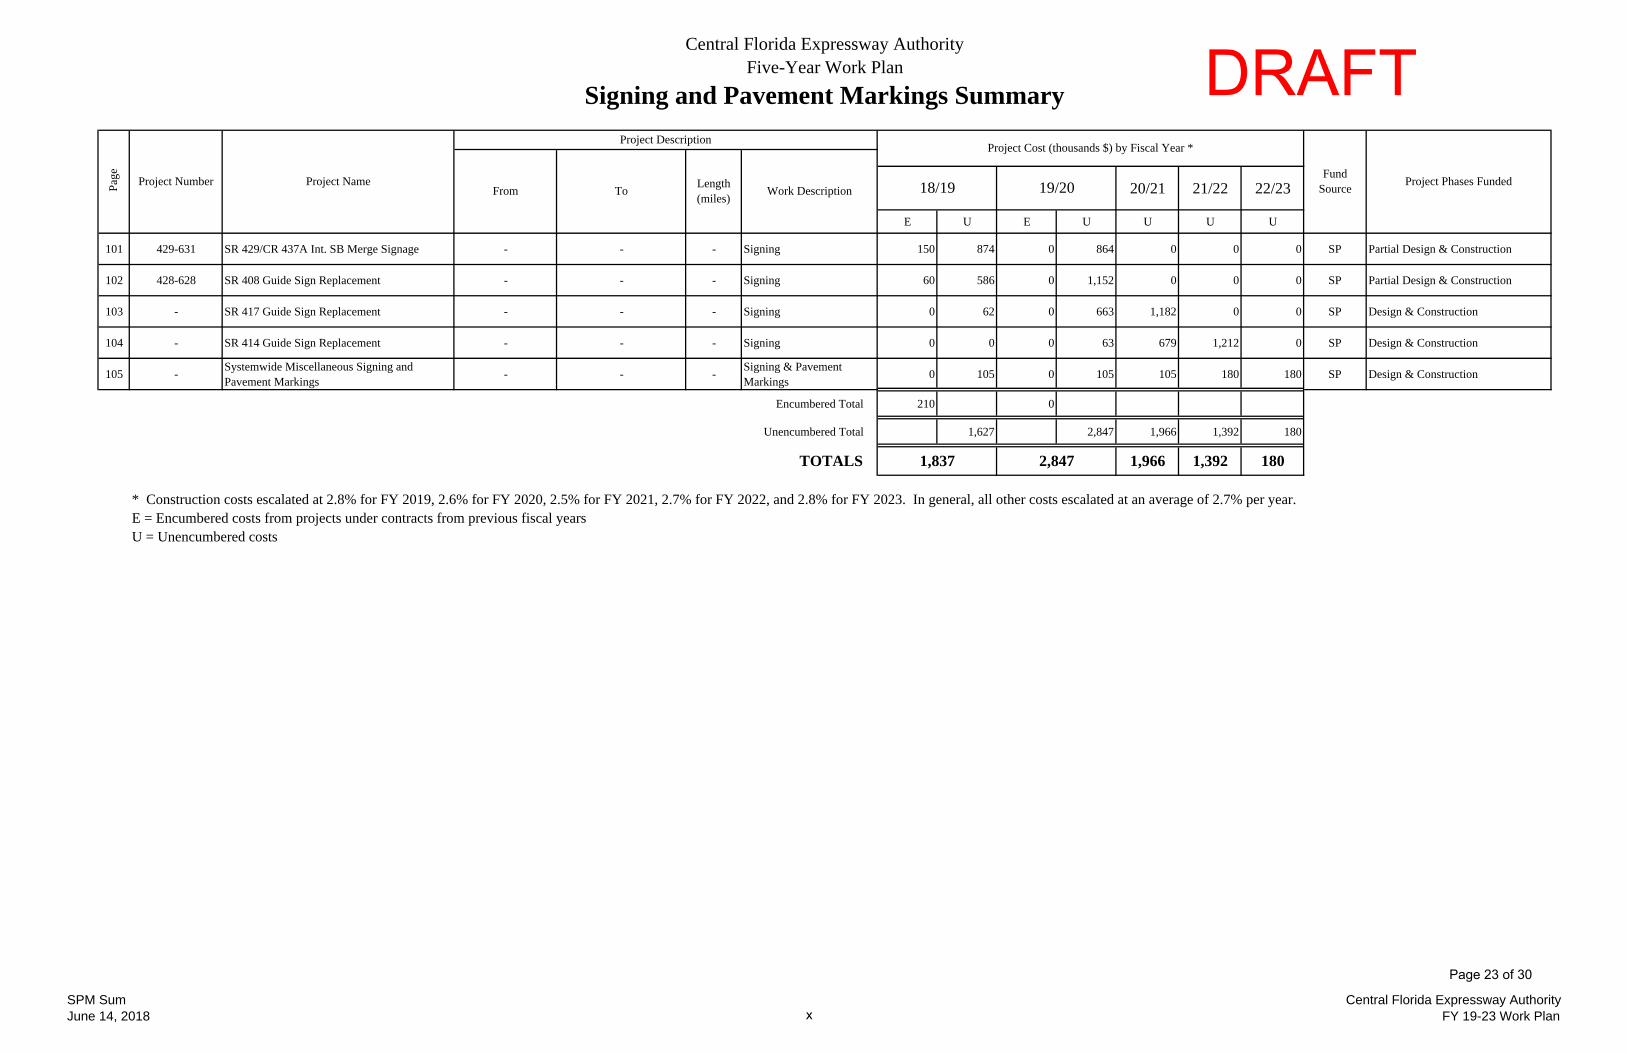
Signing and Pavement Markings Summary
20/21 21/22 22/23
E U E U U U U
101 429-631 SR 429/CR 437A Int. SB Merge Signage - - - Signing 150 874 0 864 0 0 0 SP Partial Design & Construction
102 428-628 SR 408 Guide Sign Replacement - - - Signing 60 586 0 1,152 0 0 0 SP Partial Design & Construction
103 - SR 417 Guide Sign Replacement - - - Signing 0 62 0 663 1,182 0 0 SP Design & Construction
104 - SR 414 Guide Sign Replacement - - - Signing 0 0 0 63 679 1,212 0 SP Design & Construction
105 - Systemwide Miscellaneous Signing and Pavement Markings - - - Signing & Pavement
Markings 0 105 0 105 105 180 180 SP Design & Construction
Encumbered Total 210 0
Unencumbered Total 1,627 2,847 1,966 1,392 180
TOTALS 1,837 2,847 1,966 1,392 180
* Construction costs escalated at 2.8% for FY 2019, 2.6% for FY 2020, 2.5% for FY 2021, 2.7% for FY 2022, and 2.8% for FY 2023. In general, all other costs escalated at an average of 2.7% per year.E = Encumbered costs from projects under contracts from previous fiscal yearsU = Unencumbered costs
Pag
e
Project Number Project Name Project Phases FundedFund SourceToFrom Length
(miles) Work Description
Project Description
18/19 19/20
Project Cost (thousands $) by Fiscal Year *
SPM SumJune 14, 2018 x
Central Florida Expressway AuthorityFY 19-23 Work Plan
DRAFT
Page 23 of 30

Central Florida Expressway AuthorityFive-Year Work Plan
Renewal and Replacement Projects Summary (Page 1 of 2)
20/21 21/22 22/23
E U E U U U U
106 408-742A SR 408 Resurfacing West SR 50 Ortman/Mercy Dr. 3.9 Mill & Resurface 4,400 0 0 0 0 0 0 RR Construction
107 408-742B SR 408 Resurfacing Ortman/Mercy Dr. I-4 3.2 Mill & Resurface 2,205 0 0 0 0 0 0 RR Construction
108 408-746 SR 408 Resurfacing East of I-4 Lake Underhill Bridge 1.8 Mill & Resurface 0 6,109 0 3,050 0 0 0 RR Construction
109 - SR 408 Resurfacing Yucatan Drive SR 417 2.6 Mill & Resurface 0 0 0 0 679 12,904 0 RR Design & Construction
110 - SR 408 Resurfacing East of Woodbury Rd. North of SR 50 (East) 1.3 Mill & Resurface 0 0 0 0 230 4,305 0 RR Design & Construction
111 - SR 414 Resurfacing West of SR 451 West of Keene Rd. 3.8 Mill & Resurface 0 796 0 10,187 5,088 0 0 RR Design & Construction
112 - SR 414 Resurfacing West of Keene Rd. US 441 (East) 3.1 Mill & Resurface 0 551 0 7,056 3,523 0 0 RR Design & Construction
113 - SR 417 Resurfacing SR 528 Curry Ford Rd. 2.6 Mill & Resurface 0 0 0 723 9,244 4,617 0 RR Design & Construction
114 - SR 417 Resurfacing SR 408 Canal E-4 Bridge 2.1 Mill & Resurface 0 0 0 472 9,043 0 0 RR Design & Construction
115 429-752 SR 429 Pavement Study CR 535 to SR 451 CR 535 SR 451 1.6 Pavement Study 10 0 0 0 0 0 0 RR Study
116 - SR 429/414 Resurfacing SR 414 US 441 3.0 Mill & Resurface 0 0 0 0 0 0 784 RR Design
117 - SR 451 Resurfacing North of CR 437A Ramps US 441 1.7 Mill & Resurface 0 0 0 0 258 4,957 0 RR Design & Construction
118 528-747 SR 528 Resurfacing SR 417 Innovation Way 5.8 Mill & Resurface 218 6,152 0 12,404 0 0 0 RR Partial Design & Construction
119 528-749 SR 528 Resurfacing Innovation Way East of Dallas Blvd. 6.7 Mill & Resurface 93 4,616 0 4,606 0 0 0 RR Partial Design & Construction
Encumbered Total 6,927 0
Unencumbered Total 18,224 38,498 28,065 26,783 784
25,151 38,498 28,065 26,783 784
* Construction costs escalated at 2.8% for FY 2019, 2.6% for FY 2020, 2.5% for FY 2021, 2.7% for FY 2022, and 2.8% for FY 2023. In general, all other costs escalated at an average of 2.7% per year.E = Encumbered costs from projects under contracts from previous fiscal yearsU = Unencumbered costs
SUB-TOTALS (Page 1)
Project Phases FundedFund SourceProject NameProject Number
Pag
e
19/2018/19
Project Cost (thousands $) by Fiscal Year *
Work DescriptionLength (miles)
Project Description
ToFrom
R&R Sum (1)June 14, 2018 xi
Central Florida Expressway AuthorityFY 19-23 Work Plan
DRAFT
Page 24 of 30

Central Florida Expressway AuthorityFive-Year Work Plan
Renewal and Replacement Projects Summary (Page 2 of 2)
20/21 21/22 22/23
E U E U U U U
120 528-750 SR 528 Resurfacing East of Dallas Blvd. SR 520 7.6 Mill & Resurface 162 5,384 0 10,748 0 0 0 RR Partial Design & Construction
121 528-131 SR 528 Econ River Bridge - - - Bridge Replacement & Widening 6,586 0 0 0 0 0 0 RR Construction
122 - Miscellaneous Resurfacing Projects - - - Mill & Resurface 0 25 0 290 290 290 290 RR Design & Construction
123 - Miscellaneous Drainage and Stormwater Projects - - - Drainage and Stormwater 0 60 0 310 310 310 310 RR Design & Construction
124 - Systemwide Bridge Projects - - - Misc. Structural Projects 0 52 0 429 429 392 243 RR Design & Construction
125 599-734 Systemwide Coatings SR 408 Good Homes Road I-4 - Painting & Inspections 5,152 0 0 0 0 0 0 RR Construction
126 - Systemwide Coatings Ramp Plaza Butterfly Structures - - - Painting & Inspections 0 46 0 425 0 0 0 RR Design & Construction
127 - Systemwide Coatings - - - Painting & Inspections 0 150 0 4,490 160 4,630 4,490 RR Design & Construction
128 - Systemwide Fence Projects - - - Fencing Replacement 0 275 0 275 275 275 275 RR Construction
129 - Systemwide Bridge Joint & Approach Slab Projects - - - Structural 0 17 0 110 110 110 110 RR Design & Construction
130 - Systemwide Reflective Pavement Markers & Thermo Striping - - - RPM & Striping 0 25 0 135 180 185 140 RR Design & Construction
131 - Systemwide Trailblazer Upgrades - - - Signing 0 620 0 615 1,085 620 645 RR Design & Construction
132 - Systemwide Signing Replacement Projects - - - Signing 0 145 0 1,685 140 1,740 832 RR Design & Construction
133 599-528 Traffic Management CCTV Upgrade - - - Equipment Cameras 0 151 0 155 159 0 0 RR Implementation
Encumbered Total 11,900 0
Unencumbered Total 6,950 19,667 3,138 8,552 7,335
18,849 19,667 3,138 8,552 7,335
TOTALS 44,000 58,165 31,203 35,335 8,119
* Construction costs escalated at 2.8% for FY 2019, 2.6% for FY 2020, 2.5% for FY 2021, 2.7% for FY 2022, and 2.8% for FY 2023. In general, all other costs escalated at an average of 2.7% per year.E = Encumbered costs from projects under contracts from previous fiscal yearsU = Unencumbered costs
SUB-TOTALS (Page 2)
Project Phases FundedFrom To Length
(miles) Work Description 18/19 19/20Fund
Source Pag
e
Project Number Project Name
Project DescriptionProject Cost (thousands $) by Fiscal Year *
R&R Sum (2)June 14, 2018 xii
Central Florida Expressway AuthorityFY 19-23 Work Plan
DRAFT
Page 25 of 30

Central Florida Expressway AuthorityFive-Year Work Plan
Landscape Projects Summary
20/21 21/22 22/23
E U E U U U U
134 - Systemwide Discretionary Landscape Projects - - - Landscaping 0 810 0 805 1,435 810 805 SP Design & Construction
Encumbered Total 0 0
Unencumbered Total 810 805 1,435 810 805
TOTALS 810 805 1,435 810 805
* Construction costs escalated at 2.8% for FY 2019, 2.6% for FY 2020, 2.5% for FY 2021, 2.7% for FY 2022, and 2.8% for FY 2023. In general, all other costs escalated at an average of 2.7% per year.E = Encumbered costs from projects under contracts from previous fiscal yearsU = Unencumbered costs
ToFromProject NameProject Number
Pag
e
Project Description
Work DescriptionLength (miles)
18/19 19/20
Project Cost (thousands $) by Fiscal Year *
Project Phases FundedFund Source
Landscape SumJune 14, 2018 xiii
Central Florida Expressway AuthorityFY 19-23 Work Plan
DRAFT
Page 26 of 30
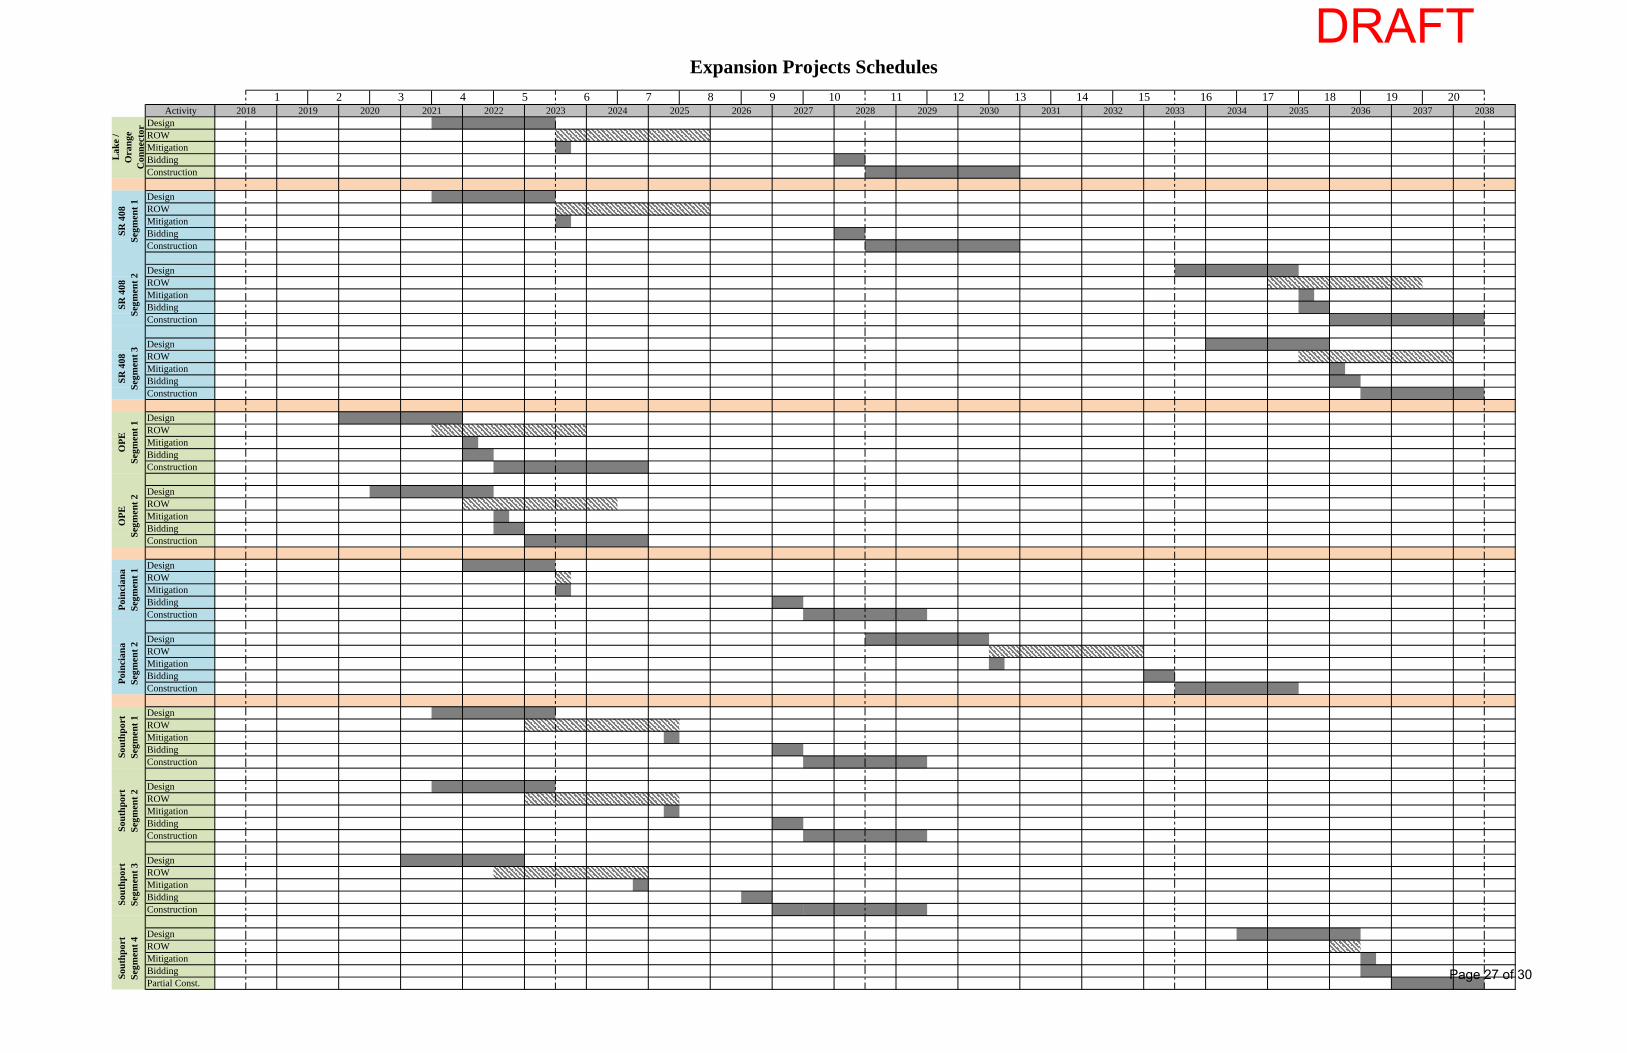
Activity 2018 2019 2020 2021 2022 2023 2024 2025 2026 2027 2028 2029 2030 2031 2032 2033 2034 2035 2036 2037 2038DesignROWMitigationBiddingConstruction
DesignROWMitigationBiddingConstruction
DesignROWMitigationBiddingConstruction
DesignROWMitigationBiddingConstruction
DesignROWMitigationBiddingConstruction
DesignROWMitigationBiddingConstruction
DesignROWMitigationBiddingConstruction
DesignROWMitigationBiddingConstruction
DesignROWMitigationBiddingConstruction
DesignROWMitigationBiddingConstruction
DesignROWMitigationBiddingConstruction
DesignROWMitigationBiddingPartial Const.
Expansion Projects Schedules16 17 18 19 201 2 3 4 5 6 7 8 9 10 11 12 13 14 15
Lak
e /
Ora
nge
Con
nect
or
SR 4
08Se
gmen
t 1SR
408
Segm
ent 2
SR 4
08Se
gmen
t 3O
PESe
gmen
t 1O
PESe
gmen
t 2Po
inci
ana
Segm
ent 1
Poin
cian
aSe
gmen
t 2So
uthp
ort
Segm
ent 1
Sout
hpor
tSe
gmen
t 2So
uthp
ort
Segm
ent 3
Sout
hpor
tSe
gmen
t 4
DRAFT
Page 27 of 30
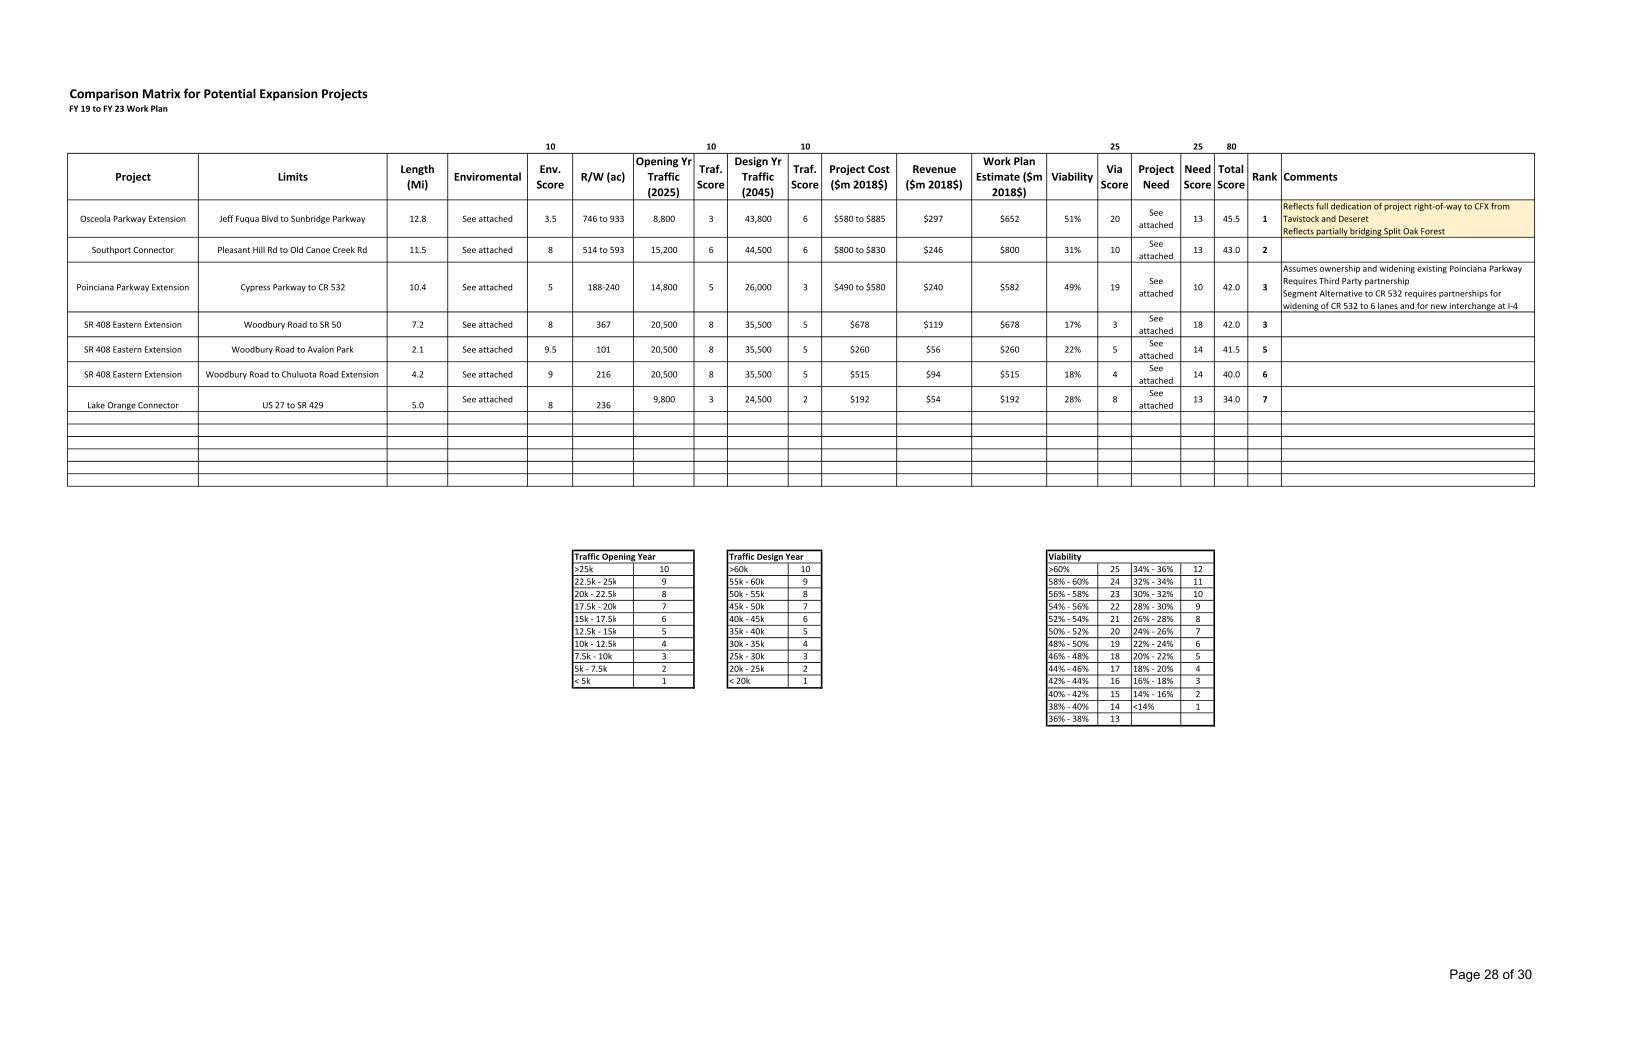
Comparison Matrix for Potential Expansion ProjectsFY 19 to FY 23 Work Plan
10 10 10 25 25 80
Project LimitsLength (Mi)
EnviromentalEnv. Score
R/W (ac)Opening Yr Traffic (2025)
Traf.Score
Design Yr Traffic (2045)
Traf.Score
Project Cost ($m 2018$)
Revenue ($m 2018$)
Work Plan Estimate ($m
2018$)Viability
Via Score
Project Need
Need Score
Total Score
Rank Comments
Osceola Parkway Extension Jeff Fuqua Blvd to Sunbridge Parkway 12.8 See attached 3.5 746 to 933 8,800 3 43,800 6 $580 to $885 $297 $652 51% 20See
attached13 45.5 1
Reflects full dedication of project right‐of‐way to CFX from Tavistock and DeseretReflects partially bridging Split Oak Forest
Southport Connector Pleasant Hill Rd to Old Canoe Creek Rd 11.5 See attached 8 514 to 593 15,200 6 44,500 6 $800 to $830 $246 $800 31% 10See
attached13 43.0 2
Poinciana Parkway Extension Cypress Parkway to CR 532 10.4 See attached 5 188‐240 14,800 5 26,000 3 $490 to $580 $240 $582 49% 19See
attached10 42.0 3
Assumes ownership and widening existing Poinciana ParkwayRequires Third Party partnershipSegment Alternative to CR 532 requires partnerships for widening of CR 532 to 6 lanes and for new interchange at I‐4
SR 408 Eastern Extension Woodbury Road to SR 50 7.2 See attached 8 367 20,500 8 35,500 5 $678 $119 $678 17% 3See
attached18 42.0 3
SR 408 Eastern Extension Woodbury Road to Avalon Park 2.1 See attached 9.5 101 20,500 8 35,500 5 $260 $56 $260 22% 5See
attached14 41.5 5
SR 408 Eastern Extension Woodbury Road to Chuluota Road Extension 4.2 See attached 9 216 20,500 8 35,500 5 $515 $94 $515 18% 4See
attached14 40.0 6
Lake Orange Connector US 27 to SR 429 5.0 See attached 8 236 9,800 3 24,500 2 $192 $54 $192 28% 8See
attached13 34.0 7
Traffic Opening Year Traffic Design Year Viability>25k 10 >60k 10 >60% 25 34% ‐ 36% 1222.5k ‐ 25k 9 55k ‐ 60k 9 58% ‐ 60% 24 32% ‐ 34% 1120k ‐ 22.5k 8 50k ‐ 55k 8 56% ‐ 58% 23 30% ‐ 32% 1017.5k ‐ 20k 7 45k ‐ 50k 7 54% ‐ 56% 22 28% ‐ 30% 915k ‐ 17.5k 6 40k ‐ 45k 6 52% ‐ 54% 21 26% ‐ 28% 812.5k ‐ 15k 5 35k ‐ 40k 5 50% ‐ 52% 20 24% ‐ 26% 710k ‐ 12.5k 4 30k ‐ 35k 4 48% ‐ 50% 19 22% ‐ 24% 67.5k ‐ 10k 3 25k ‐ 30k 3 46% ‐ 48% 18 20% ‐ 22% 55k ‐ 7.5k 2 20k ‐ 25k 2 44% ‐ 46% 17 18% ‐ 20% 4< 5k 1 < 20k 1 42% ‐ 44% 16 16% ‐ 18% 3
40% ‐ 42% 15 14% ‐ 16% 238% ‐ 40% 14 <14% 136% ‐ 38% 13
Page 28 of 30
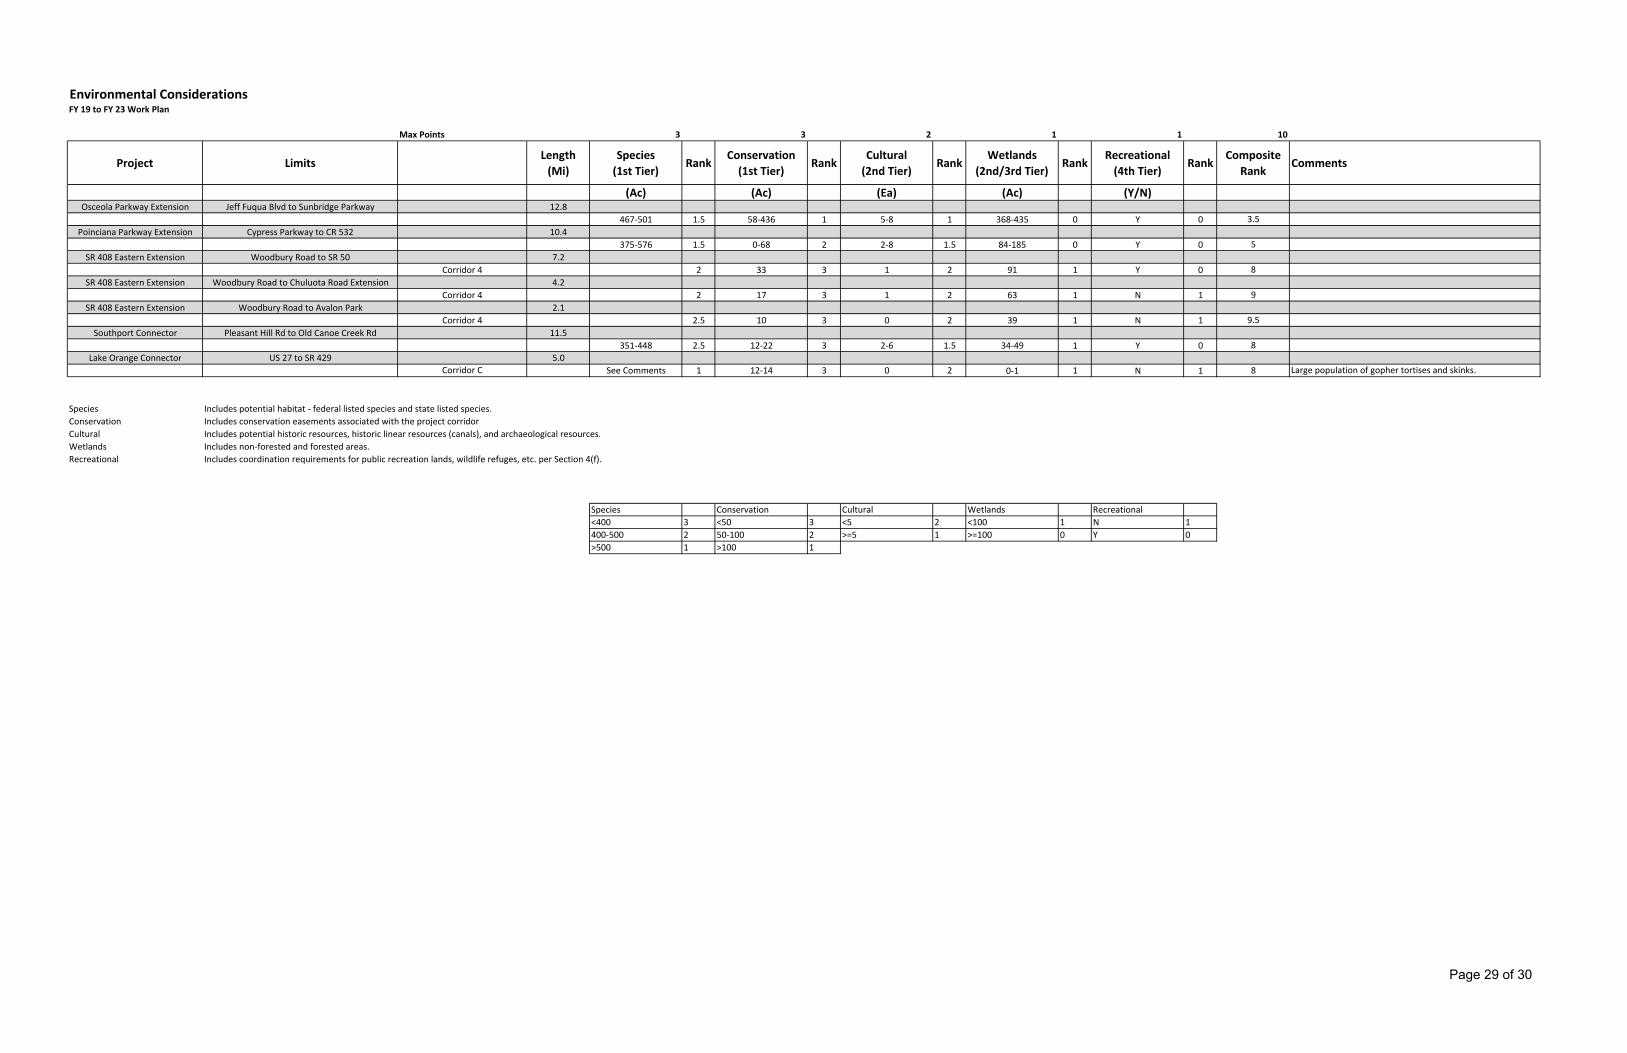
Environmental ConsiderationsFY 19 to FY 23 Work Plan
Max Points 3 3 2 1 1 10
Project LimitsLength (Mi)
Species(1st Tier)
RankConservation(1st Tier)
RankCultural(2nd Tier)
RankWetlands
(2nd/3rd Tier)Rank
Recreational(4th Tier)
RankComposite
RankComments
(Ac) (Ac) (Ea) (Ac) (Y/N)Osceola Parkway Extension Jeff Fuqua Blvd to Sunbridge Parkway 12.8
467‐501 1.5 58‐436 1 5‐8 1 368‐435 0 Y 0 3.5Poinciana Parkway Extension Cypress Parkway to CR 532 10.4
375‐576 1.5 0‐68 2 2‐8 1.5 84‐185 0 Y 0 5SR 408 Eastern Extension Woodbury Road to SR 50 7.2
Corridor 4 2 33 3 1 2 91 1 Y 0 8SR 408 Eastern Extension Woodbury Road to Chuluota Road Extension 4.2
Corridor 4 2 17 3 1 2 63 1 N 1 9SR 408 Eastern Extension Woodbury Road to Avalon Park 2.1
Corridor 4 2.5 10 3 0 2 39 1 N 1 9.5Southport Connector Pleasant Hill Rd to Old Canoe Creek Rd 11.5
351‐448 2.5 12‐22 3 2‐6 1.5 34‐49 1 Y 0 8Lake Orange Connector US 27 to SR 429 5.0
Corridor C See Comments 1 12‐14 3 0 2 0‐1 1 N 1 8 Large population of gopher tortises and skinks.
Species Includes potential habitat ‐ federal listed species and state listed species.Conservation Includes conservation easements associated with the project corridor.Cultural Includes potential historic resources, historic linear resources (canals), and archaeological resources.Wetlands Includes non‐forested and forested areas.Recreational Includes coordination requirements for public recreation lands, wildlife refuges, etc. per Section 4(f).
Species Conservation Cultural Wetlands Recreational<400 3 <50 3 <5 2 <100 1 N 1400‐500 2 50‐100 2 >=5 1 >=100 0 Y 0>500 1 >100 1
Page 29 of 30

Project NeedFY 19 to FY 23 Work Plan
Max Points 2 5 2 1 2 5 2 5 1 25
Project LimitsLength (Mi)
Status ScoreSystem Linkage
Score Capacity ScoreTransportation
DemandScore Legislation Score
Social Demands or Economic Development
ScoreModal
InterrelationshipsScore
Safety & Evacuation Support
ScoreRoadway
DeficienciesScore
Composite Score
Comments
(Y/N) (Y/N) (Y/N) (Y/N) (Y/N) (Y/N)Osceola Parkway Extension Jeff Fuqua Blvd to Sunbridge Parkway 12.8
CF&M 1 See Below 1 N 0 Y 1 Y 2 See Below 5 Y 2 See Below 1 N 0 13Poinciana Parkway Extension Cypress Parkway to CR 532 10.4
CF&M 1 See Below 1 N 0 Y 1 N 0 See Below 3 N 0 See Below 3 Y 1 10 Undivided two‐way facility to a divided 4‐lane facilitySR 408 Eastern Extension Woodbury Road to SR 50 7.2
PD&E 2 See Below 5 Y 2 Y 1 Y 2 See Below 1 N 0 See Below 5 N 0 18SR 408 Eastern Extension Woodbury Road to Chuluota Road Extension 4.2
PD&E 2 See Below 1 Y 2 Y 1 Y 2 See Below 3 N 0 See Below 3 N 0 14SR 408 Eastern Extension Woodbury Road to Avalon Park 2.1
PD&E 2 See Below 1 Y 2 Y 1 Y 2 See Below 3 N 0 See Below 3 N 0 14Southport Connector Pleasant Hill Rd to Old Canoe Creek Rd 11.5
CF&M 1 See Below 5 N 0 Y 1 N 0 See Below 5 N 0 See Below 1 N 0 13Lake Orange Connector US 27 to SR 429 5.0
CF&M 1 See Below 5 N 0 Y 1 N 0 See Below 5 N 0 See Below 1 N 0 13
The need for the project arises from deficiencies, issues, and/or concerns that currently exist or are expected to occur within the project area. The need serves as the foundation for the proposed project.Status Disposition of the projectSystem Linkage Discuss how the proposed project fits into the existing and future local, regional and state transportation system (network) and contributes to the movement of people, goods, and services.Capacity Discuss the capacity of the existing facility, its existing and anticipated LOS, and any operational deficiencies of the facility.Transportation Demand Discuss the project relationship to any statewide transportation plan or adopted urban transportation plan.Legislation Document the need to respond to federal, state, or local government requirements. (ECF Task Force ‐ 408 and OPE)Social Demands or Economic Development Describe how the action will foster new employment, benefit schools, land use plans, recreation facilities.Modal Interrelationships Identify the need to address other modes of transportationSafety & Evacuation Support Discuss crashes which have occurred in the study area that may indicate a need for improvement.Roadway Deficiencies Is the proposed project necessary to correct existing roadway deficiencies?
StatusSystem Linkage Capacity
Transportation Demand Legislation
Social Demands or Economic Development Modal Interrelationships
Safety & Evacuation Support
Roadway Deficiencies
PD&E complete 2 See Below 5 Yes 1 Yes 1 Yes 1 See Below 5 Yes 1 See Below 5 Yes 1CF&M complete1 See Below 3 No 0 No 0 No 0 See Below 3 No 0 See Below 3 No 0Conceptual 0 See Below 1 See Below 1 See Below 1
System Linkage1 ‐ Included in regional planning and future network3 ‐ Included in regional planning and future network, provides new regional connection between two major facilities5 ‐ Included in regional planning and future network, provides new regional connection between two major facilities, and includes multi‐modal elements
Social Demands or Economic Development1 ‐ Fosters new growth3 ‐ Fosters new growth, supports approved land use changes5 ‐ Fosters new growth, supports approved land use changes, and supports approved DRI's
Safety & Evacuation Support1 ‐ Improves traffic flow and relieves congestion3 ‐ Improves traffic flow and relieves congestion and diverts traffic from a higher hazard facility5 ‐ Improves traffic flow and relieves congestion, diverts traffic from a higher hazard facility, and serves as a direct hurricane evacuation route
Page 30 of 30