agenda - indiana universitycns.iu.edu/docs/presentations/2015-borner-laurin-skupin-aaas... ·...
TRANSCRIPT

1

2
Agenda
Welcome by Julia and Katy
Setting the Stage:
Visual Languages: Industry Pull
by Julia Laurin, Thomson Reuters
Visualization Frameworks: Academic Push
by Katy Börner, Indiana University
Invited Talk:
Visualizing Knowledge Spaces: Cartographic Perspectives
by Dr. André Skupin, Geography, San Diego State University
Discussion

3
Visual Languages: Industry Pull
by Julia Laurin, Thomson Reuters

Visualizing Across Domains: Lessons Learned
4
Intellectual Property
Thomson Data Analyzer
Life Sciences
Cortellis Data Fusion
Scholarly Research
Web of Science
• Support multiple approaches to data
• User-driven and use case driven
• Balancing transparency and usability

Graph Analytics: Answering the Big Questions
Mission: Research and develop solutions which support graph data, analytics and machine learning at big data scales
How do we provide research funders with areas of research on the verge of developing into new fields and worthy of deeper funding?
graph community detection and prediction
How do we provide scientific researchers with a topic hierarchy for research discovery which remains current w/rt recently published articles?
graph-based topic generation and clustering
How do we provide university administrators with aggregation tools that effectively disambiguate entities like people and organizations?
graph-based pattern matching

Getting from Table to Graph
6
37,225,696 publications 602,346,147 total citations

Mapping Science Requires a lot of Choices
• Insight needed
• Types of analysis
• Levels of analysis
• Data scale types
• Visualization types
• Graphic symbol types
• Level of interactivity
7

Uncharted Territory – Together
• Visual perception and cognition
• Power of big computing
• Sheer complexity of data
• Interactive and 3D gamification
8

9
Visualization Frameworks: Academic Push
by Katy Börner, Indiana University

10
De-Facto Standardization of Science Basemaps

11

12
How to Classify Different Visualizations?
By
• User insight needs?
• User task types?
• Data to be visualized?
• Data transformation?
• Visualization technique?
• Visual mapping transformation?
• Interaction techniques?
How to support the design of effective visualizations by experts and citizen scientists?

Study
13 See page 5
14 See page 24
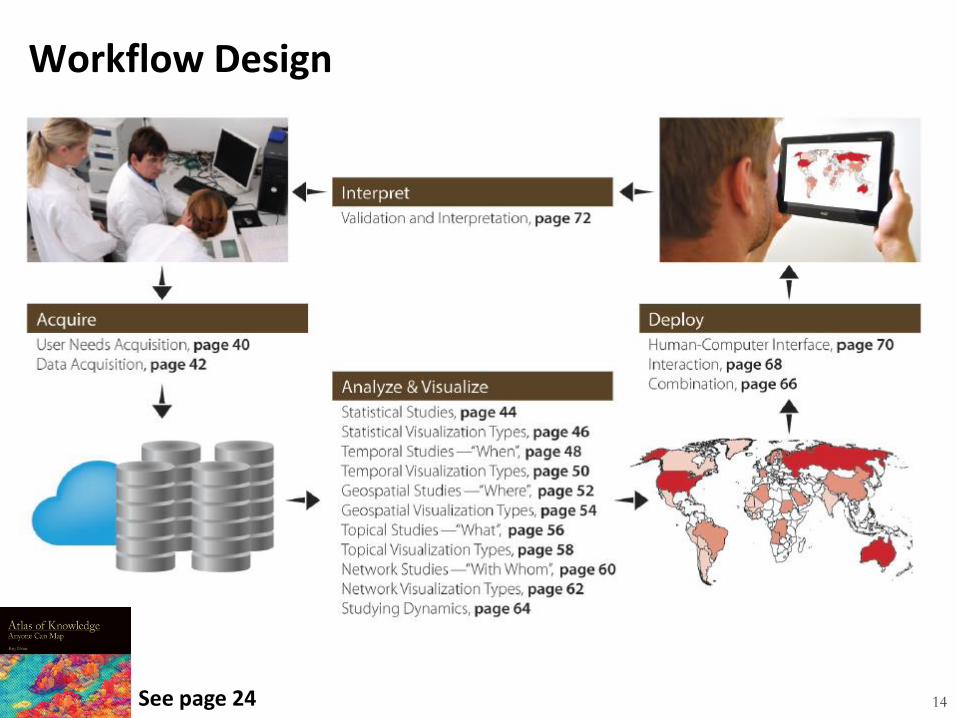
Workflow Design
15 See page 24
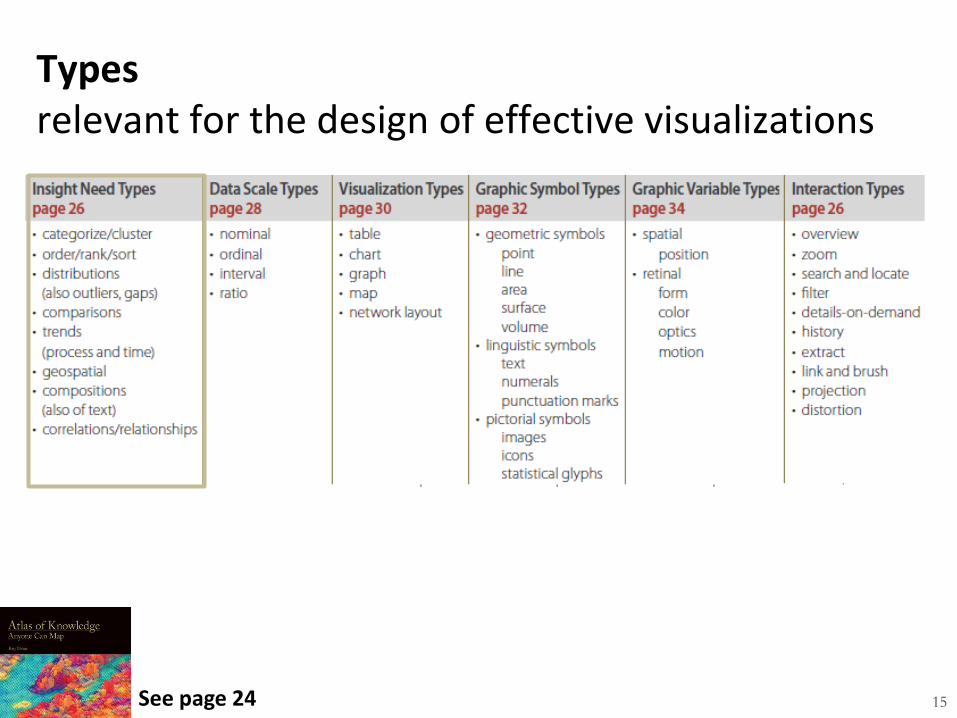
Types relevant for the design of effective visualizations

16 See page 26

17 See page 30
Types relevant for the design of effective visualizations

18
Visualization Types (Reference Systems)
1. Charts: No reference system—e.g., Wordle.com, pie charts
2. Tables: Categorical axes that can be selected, reordered; cells can be color coded and might contain proportional symbols. Special kind of graph.
3. Graphs: Quantitative or qualitative (categorical) axes. Timelines, bar graphs, scatter plots.
4. Geospatial maps: Use latitude and longitude reference system. World or city maps.
5. Network graphs: Node position might depends on node attributes or node similarity. Tree graphs: hierarchies, taxonomies, genealogies. Networks: social networks, migration flows.

19 See page 25
Types relevant for the design of effective visualizations

20 See page 36


23
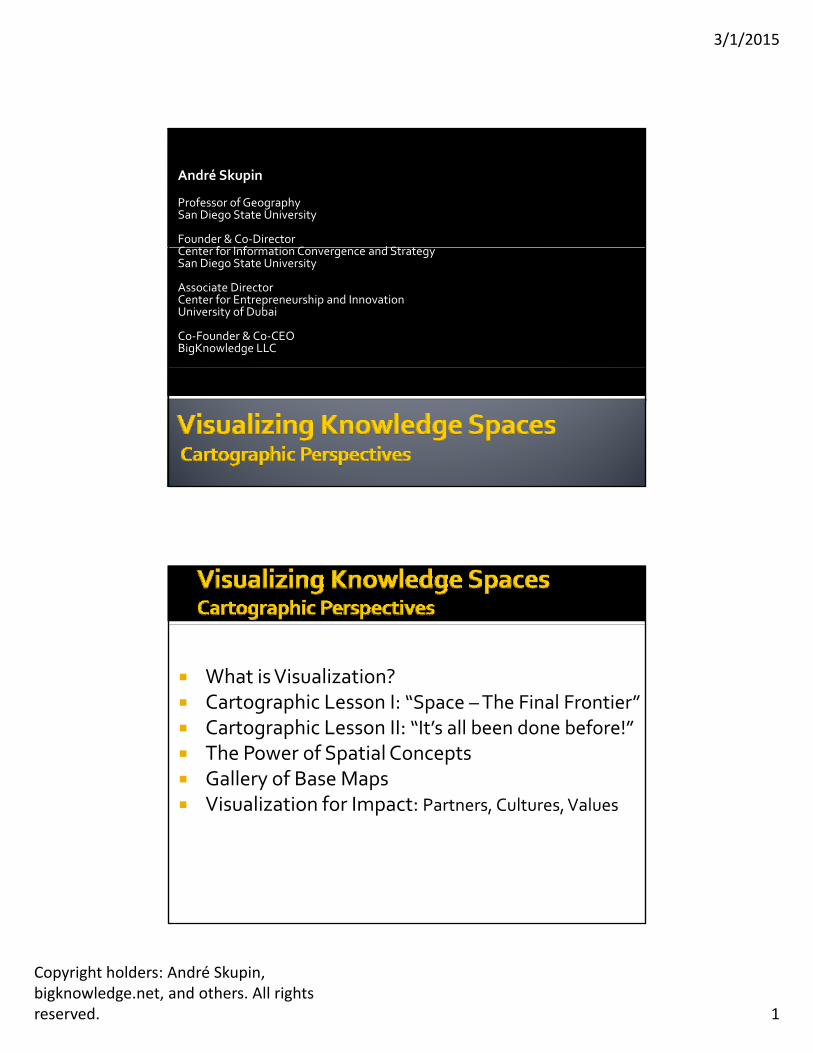
Invited Talk:
Visualizing Knowledge Spaces: Cartographic Perspectives
by Dr. André Skupin, Geography, San Diego State University
3/1/2015
Copyright holders: André Skupin, bigknowledge.net, and others. All rights reserved. 1
André Skupin
Professor of GeographySan Diego State University
Founder & Co‐Director C t f I f ti C d St tCenter for Information Convergence and StrategySan Diego State University
Associate DirectorCenter for Entrepreneurship and InnovationUniversity of Dubai
Co‐Founder & Co‐CEOBigKnowledge LLC
What is Visualization? Cartographic Lesson I: “Space –The Final Frontier” Cartographic Lesson II: “It’s all been done before!” The Power of Spatial Concepts Gallery of Base Maps Visualization for Impact: Partners Cultures Values Visualization for Impact: Partners, Cultures, Values

3/1/2015
Copyright holders: André Skupin, bigknowledge.net, and others. All rights reserved. 2
“Visualization is a data‐driven representation aimed at amplifying cognition, frequently supported by computation and interactivity.”

3/1/2015
Copyright holders: André Skupin, bigknowledge.net, and others. All rights reserved. 3
See: http://scimaps.org/
Geographic Space Discrete objects Continuous fields
Vector Space Entities Properties
Network Space Nodes Links
Knowledge Space Domains Actors Concepts Artifacts

3/1/2015
Copyright holders: André Skupin, bigknowledge.net, and others. All rights reserved. 4
Data Symbols Understandingy g Scale & Abstraction Semantic Zooming Base Map Creation Base Map Use Thematic Overlays Thematic Overlays Truth in Mapping
visual | graphic | semiotic variables
for static maps for static maps Bertin (1967/1983)▪ seven variables ▪ Position
▪ Size
▪ Value
▪ Texture
▪ Hue
▪ Orientation
▪ Shape

3/1/2015
Copyright holders: André Skupin, bigknowledge.net, and others. All rights reserved. 5
visual | graphic | semiotic variables
for static maps for static maps Bertin+▪ eight variables▪ size
▪ value
▪ saturation
▪ pattern texture
▪ pattern arrangement
▪ hue
▪ orientation
▪ shape
visual | graphic | semiotic variables
for static maps for static maps Bertin+▪ quantitative data▪ size
▪ value
▪ saturation
▪ pattern texture
▪ qualitative data▪ pattern arrangement
▪ hue
▪ orientation
▪ shape

3/1/2015
Copyright holders: André Skupin, bigknowledge.net, and others. All rights reserved. 6
visual | graphic | semiotic variables
for static maps for animated maps for static maps Bertin+▪ quantitative data▪ size
▪ value
▪ saturation
▪ pattern texture
for animated maps▪ duration
▪ rate of change
▪ order
▪ display date
▪ frequency
▪ synchronization
▪ qualitative data▪ pattern arrangement
▪ hue
▪ orientation
▪ shape
From: Zondervan (1901) Allgemeine Karten kunde, Leipzig: B. G. Teubner. (Original source: Sydow‐Wagners Methodischer Schulatlas)
3/1/2015
Copyright holders: André Skupin, bigknowledge.net, and others. All rights reserved. 7
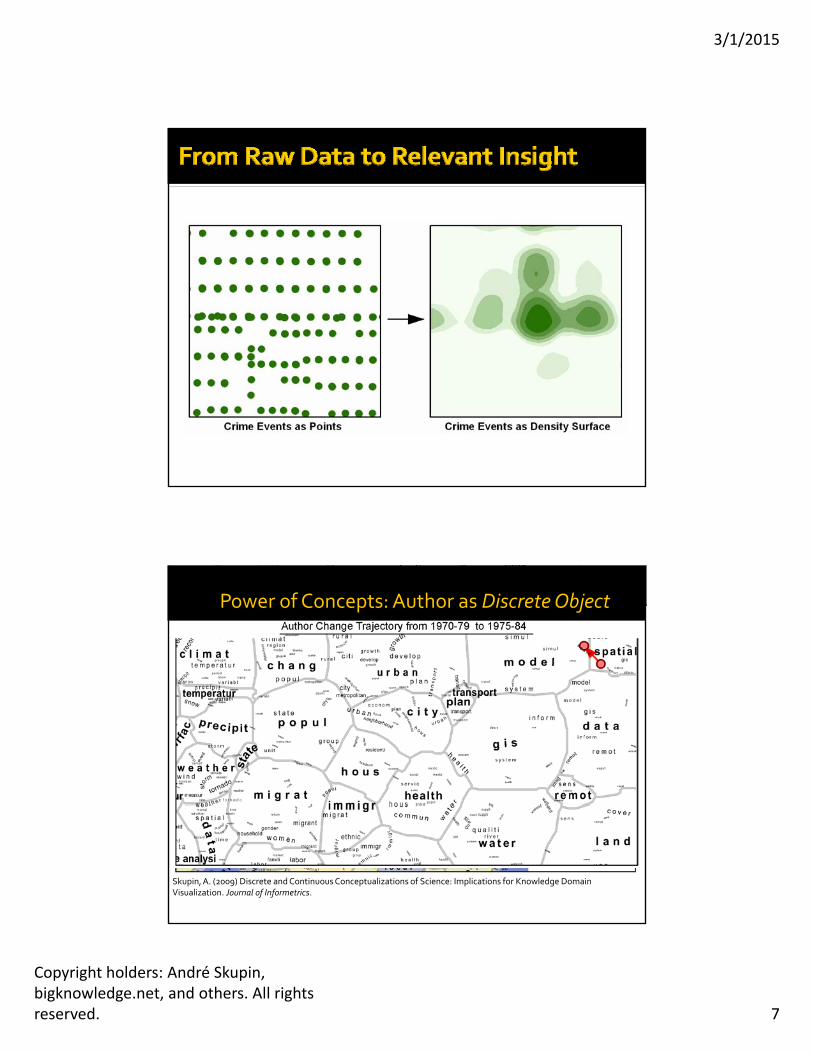
Power of Concepts: Author as Continuous FieldPower of Concepts: Author as Discrete Object
Skupin, A. (2009) Discrete and Continuous Conceptualizations of Science: Implications for Knowledge Domain Visualization. Journal of Informetrics.
3/1/2015
Copyright holders: André Skupin, bigknowledge.net, and others. All rights reserved. 8
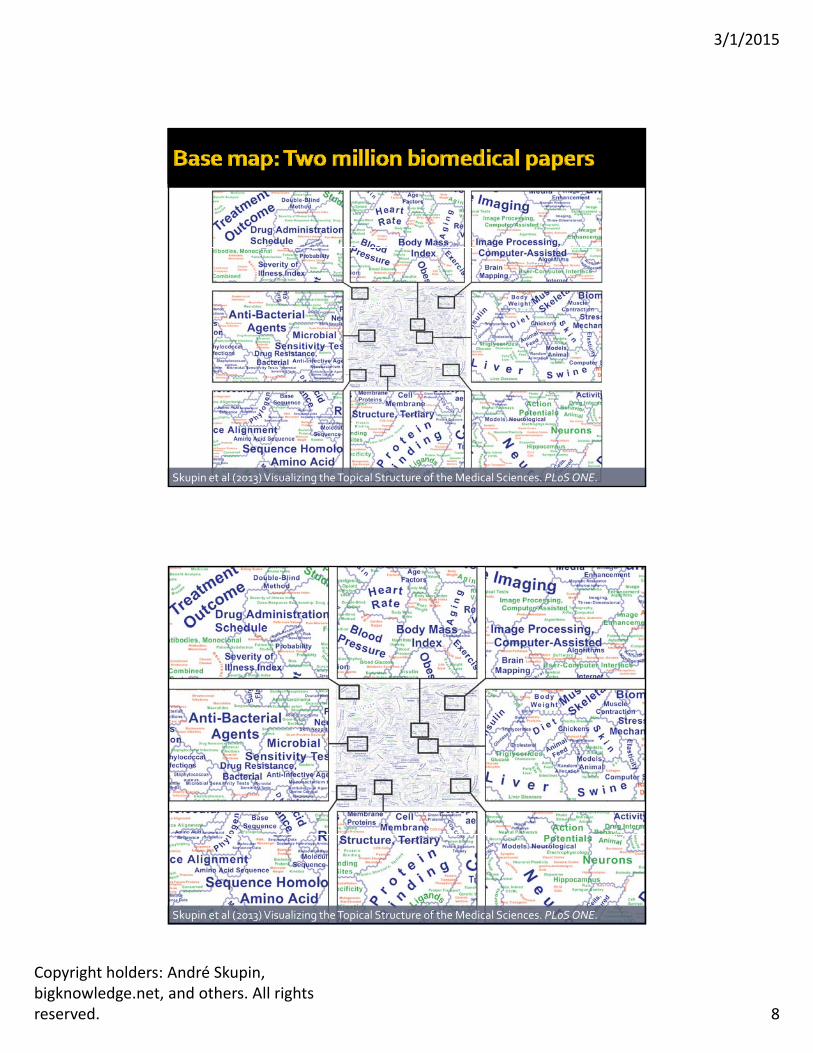
Skupin et al (2013) Visualizing the Topical Structure of the Medical Sciences. PLoSONE.
Skupin et al (2013) Visualizing the Topical Structure of the Medical Sciences. PLoSONE.
3/1/2015
Copyright holders: André Skupin, bigknowledge.net, and others. All rights reserved. 9
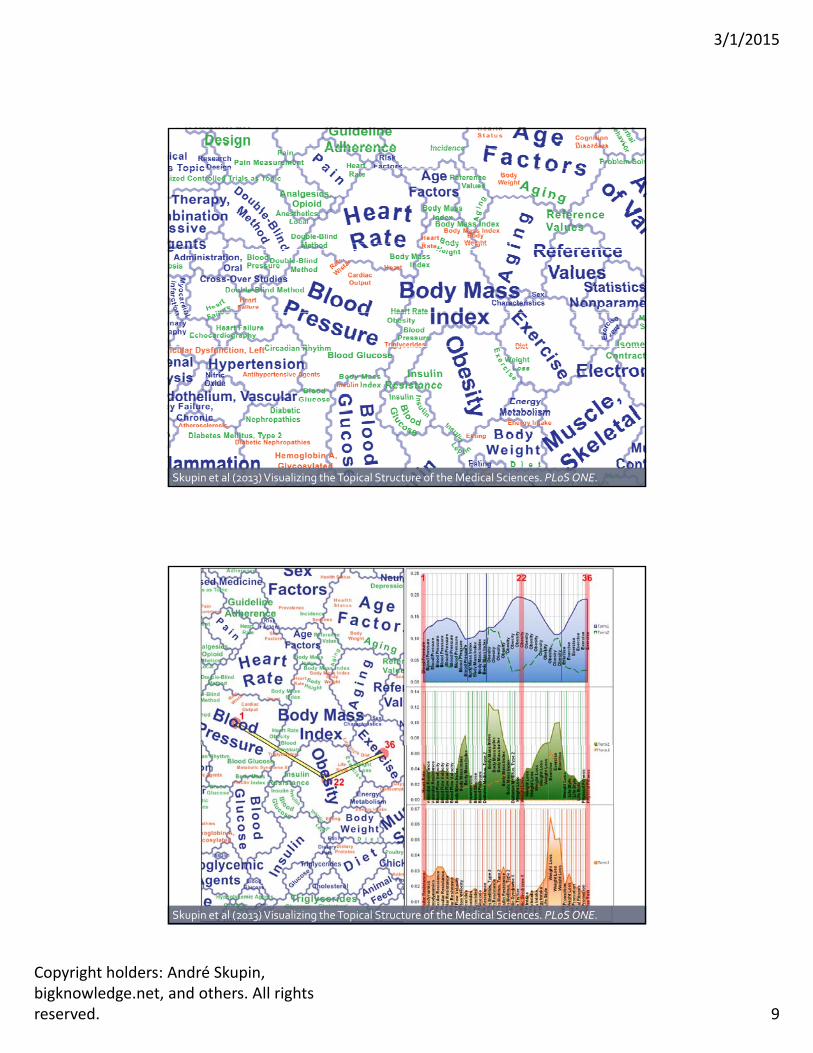
Skupin et al (2013) Visualizing the Topical Structure of the Medical Sciences. PLoSONE.
Skupin et al (2013) Visualizing the Topical Structure of the Medical Sciences. PLoSONE.

3/1/2015
Copyright holders: André Skupin, bigknowledge.net, and others. All rights reserved. 10
2010 NSF/Science Visualization Challenge: Finalist2011 International Institute for Information Design Award (Social Affairs Category)
Impactful Visualization
Inspire [domain experts]Inspire [domain experts]
Connect [across disciplines]Understand [domain patterns]
Power of Diversity Partners Institutions Disciplines Cultures Technologies Values

3/1/2015
Copyright holders: André Skupin, bigknowledge.net, and others. All rights reserved. 11

3/1/2015
Copyright holders: André Skupin, bigknowledge.net, and others. All rights reserved. 12