agenda microsoft platform -overview microsoft platform -overview operations, support & security?...
TRANSCRIPT

AgendaAgenda
Microsoft Platform -overviewMicrosoft Platform -overview Operations, support & security?Operations, support & security? Scalability Scalability ReliabilityReliability Total cost of ownershipTotal cost of ownership mySAP Business Intelligence with SQL mySAP Business Intelligence with SQL
Server Analysis ServicesServer Analysis Services Other solutionsOther solutions

Microsoft Platform Microsoft Platform advantages for SAPadvantages for SAP Windows is the leading development Windows is the leading development
platform at SAP HQplatform at SAP HQ SQL Server is the development DB on SQL Server is the development DB on
Windows – all other supported databases Windows – all other supported databases are ported from SQL Serverare ported from SQL Server
Windows and SQL Server have SAP as Windows and SQL Server have SAP as ‘ship-criteria’‘ship-criteria’
SAP automatically supports new Windows SAP automatically supports new Windows and SQL Server versions and Service and SQL Server versions and Service PacksPacks
SAP has part of the DBSL team co-located SAP has part of the DBSL team co-located at Microsoft Redmondat Microsoft Redmond
0
10
20
30
40
50
1994 1995 1996 1997 1998 1999 2000 20010
10
20
30
40
50
1994 1995 1996 1997 1998 1999 2000 2001
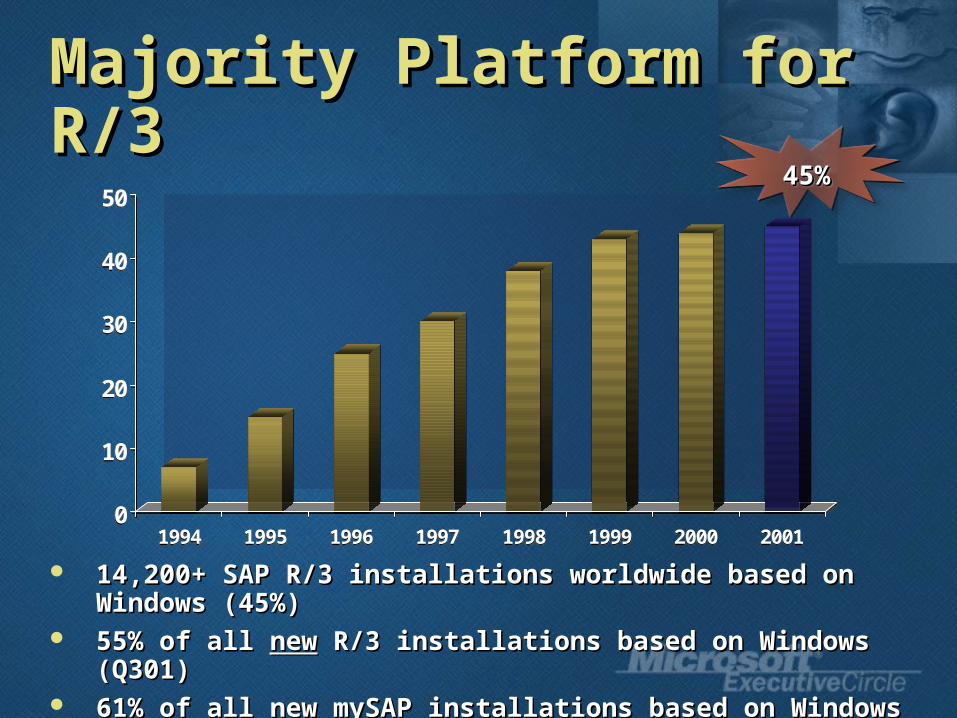
14,200+ SAP R/3 installations worldwide based on Windows (45%)14,200+ SAP R/3 installations worldwide based on Windows (45%) 55% of all 55% of all newnew R/3 installations based on Windows (Q301) R/3 installations based on Windows (Q301) 61% of all 61% of all newnew mySAP installations based on Windows (Q301) mySAP installations based on Windows (Q301)
45%45%45%45%
Majority Platform for R/3Majority Platform for R/3

SAP Sales & Distribution Benchmark Data SAP Sales & Distribution Benchmark Data Concurrent Users – Windows / SQL ServerConcurrent Users – Windows / SQL Server
IBM’s last published benchmark on OS/390 = 8,000 SD users on 3node 10CPU Sysplex Cluster. R/3 release 3.1HOracle’s last published benchmark = 4,900 SD on 8-way, 550Mhz. R/3 release 4.0BMicrosoft benchmark = 24,000 SD on Unisys ES7000 32-way, 900Mhz. R/3 release 4.6CWindows/SQL Server also SAP’s #1 Retail Benchmark at >3M items/hr.
0
5000
10000
15000
20000
25000
30000
1995 1996 1997 1998 1999 2000 2001
24,000
7,5004,512
Over 430% Over 430% growthgrowthin 28 months!in 28 months!
Microsoft / Unisys = #1 Benchmark

Typical Support ProcessTypical Support Process
Customers typically will Customers typically will open a Support Case via open a Support Case via SAP firstSAP first
Cases are escalated to Cases are escalated to Microsoft via SAP Microsoft via SAP development support or development support or SAP escalation managersSAP escalation managers
If the symptoms warrant, If the symptoms warrant, the customer may open a the customer may open a case via their regular case via their regular Microsoft Support Microsoft Support mechanism.mechanism.
TextText
SAPSAP
Mic
roso
ftM
icro
soft
Customer
Customer
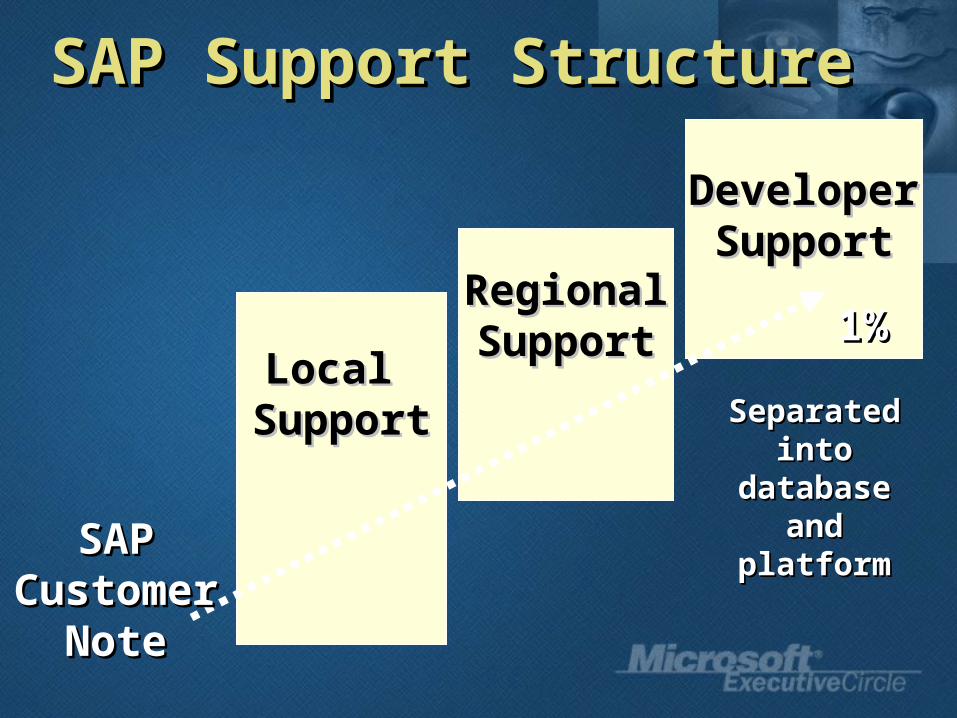
SAP Support StructureSAP Support Structure
Local Local SupportSupport
DeveloperDeveloperSupportSupport
RegionalRegionalSupportSupport
SAP SAP Customer Customer
NoteNote
1%1%
Separated Separated into into
database database and and
platformplatform

Developer Support has SAP Developer Support has SAP and MS Resourcesand MS Resources
DeveloperDeveloperSupportSupport
(SQL)(SQL)
Mark Weber, Mark Weber, MicrosoftMicrosoft RedmondRedmond
Martin MerdesMartin MerdesClas Hortien,Clas Hortien,
Microsoft Microsoft WalldorfWalldorf

SQL Server advantages for SAPSQL Server advantages for SAP Fragmentation Indicator will show tables Fragmentation Indicator will show tables
which are highly fragmentedwhich are highly fragmented Does not block any mySAP.com transactionDoes not block any mySAP.com transaction
Online DefragmentationOnline Defragmentation Re-Organize tables without impacting 24/7Re-Organize tables without impacting 24/7
Automatic Update StatisticsAutomatic Update Statistics Tables can be excluded from being automatically Tables can be excluded from being automatically
updatedupdated
Automatic internal Memory configurationAutomatic internal Memory configuration Tunes internal memory configuration like # of Tunes internal memory configuration like # of
locks, Open Object buffer, SPs etc.locks, Open Object buffer, SPs etc.
NeverNever set SQL Server to dynamic memory set SQL Server to dynamic memory configurationconfiguration

ScalabilityScalabilityWindows 2000 and SQL Windows 2000 and SQL Server 2000Server 2000
Oracle’s last published benchmark on Windows = 4,900 SD on 8-way, 550MhzSun’s best benchmark on Solaris/Oracle = 19,360 on 64-way, 64 bitMicrosoft benchmark = 26,000 SD on a 32-way, 900MhzWindows/SQL Server also SAP’s #1 Retail Benchmark at >3M items/hr.
0
5000
10000
15000
20000
25000
30000
1995 1996 1997 1998 1999 2000 2001 2002
24,000
7,500
4,512
26,000

ScalabilityScalability 16-way and 32-way systems16-way and 32-way systems
CMP and Numa ArchitecturesCMP and Numa Architectures 32-bit and 64-bit32-bit and 64-bit
New Intel 32-bit ChipsetsNew Intel 32-bit Chipsets 1.6 GHz (codename “Foster”)1.6 GHz (codename “Foster”) 2.0 GHz (codename “Gallatin”)2.0 GHz (codename “Gallatin”)
64-bit Windows and SQL Server 64-bit Windows and SQL Server (IA64)(IA64) Itanium 2 (now)Itanium 2 (now) Codename “Madison” (spring 2003)Codename “Madison” (spring 2003)

High Availability BasicsHigh Availability BasicsUse RAID 0+1 for all database filesUse RAID 0+1 for all database filesFull database backup once a dayFull database backup once a dayLog backup every 10 to 15 minutesLog backup every 10 to 15 minutesRegular restore and disaster recovery Regular restore and disaster recovery teststestsTape re-use scheduleTape re-use scheduleRegular backups of master and msdbRegular backups of master and msdbOff-site storage of backup tapesOff-site storage of backup tapes
Fixed in SQL 2000: Fixed in SQL 2000: The primary data file (.mdf) is as critical as The primary data file (.mdf) is as critical as the log file BACKUP LOG WITH NO_TRUNCATE).the log file BACKUP LOG WITH NO_TRUNCATE).
© 2002 Accenture. All Rights Reserved.
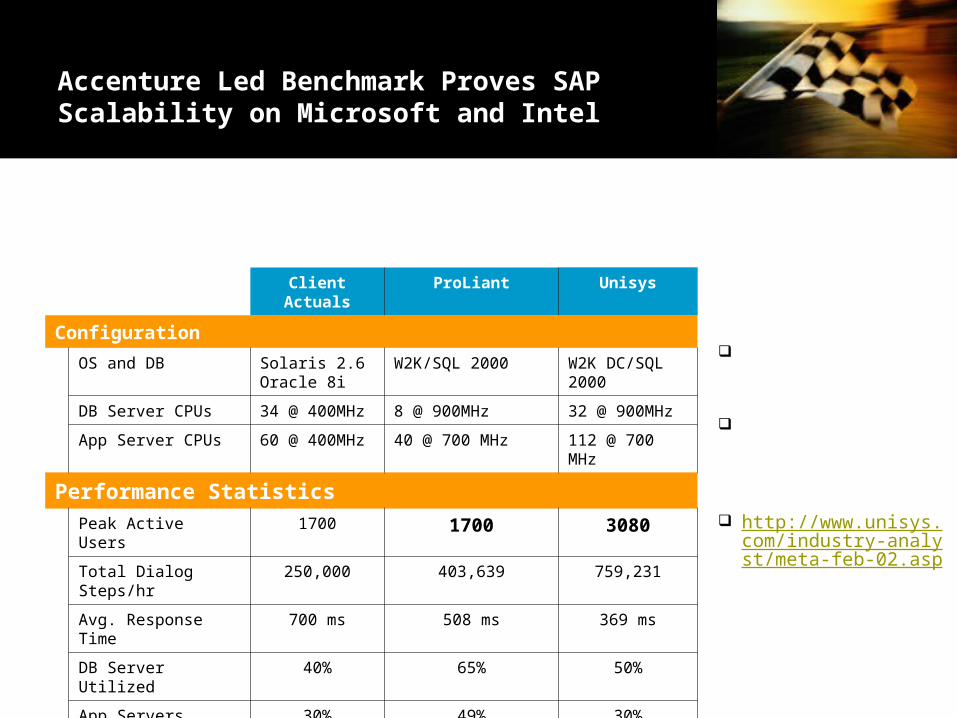
Accenture Led Benchmark Proves SAP Scalability on Microsoft and Intel
Both the HP and Unisys environments showed significant scalability with Intel based technology and Microsoft software.
Client Actuals ProLiant Unisys
Configuration
OS and DB Solaris 2.6 Oracle 8i
W2K/SQL 2000 W2K DC/SQL 2000
DB Server CPUs 34 @ 400MHz 8 @ 900MHz 32 @ 900MHz
App Server CPUs 60 @ 400MHz 40 @ 700 MHz 112 @ 700 MHz
Performance Statistics
Peak Active Users 1700 1700 3080
Total Dialog Steps/hr 250,000 403,639 759,231
Avg. Response Time 700 ms 508 ms 369 ms
DB Server Utilized 40% 65% 50%
App Servers Utilized 30% 49% 30%
META Group Audit Validated our testing
Methodology Verified the test
represented an actual client workload
http://www.unisys.com/industry-analyst/meta-feb-02.asp

© 2002 Accenture. All Rights Reserved.
Accenture Led Benchmark Proves SAP Cost Benefits on Microsoft
Microsoft Platform
…Can scale like UNIX Systems & support large complex clients
…Offers lower acquisition and operational costs (TCO advantage)
…Positions platform for the future
$0
$1
$2
$3
$4
$5
$6
$7
$8
Co
st in
Mill
ions
Sun UNIX/OracleBaseline
Unisys W2K/SQL HP ProLiantW2K/SQL
Management SoftwareSoftware (OS & DB Licenses)Server Hardware
40% of
Baseline
40% of
Baseline 17%
of Baseli
ne
17% of
Baseline

© 2002 Accenture. All Rights Reserved.
SAP Utilities Client Benchmark
Due to the unique requirements of the SAP module for Utilities (IS-U/CCS), we performed another study to evaluate the batch processing capability of the Intel/Microsoft platform.
Client Equivalent Utility Company with over 2 Million
Customers Requires processing 120,000 bills
and meter reads per night Batch window limited to 4 hours The composition for the overall
customer base, and that used for the batch runs, was approximately 86.5% Domestic, 13.25% General Service and 0.25% Bulk.
Utility Customer Details
Total Customer Records 2,000,000
Bills Processed / Night 120,000
Performance Statistics
JobTime
(h:mm)
Meter Read Order Creation 1:05
Meter Reading Upload 0:21
Billing Order Creation 0:13
Invoice Document Creation 1:31
Invoice Printing* 0:57
Total Batch Run-time 4:07

© 1999-2002 NerveWire, Inc. All rights reserved. --Proprietary and Confidential
®
Key Take-Aways from NerveWire ERP Migration Study
• Firms at a “decision-point” for their ERP solutions can gain significant benefits by switching to SQL Server
• Our modeled ERP migration business case shows a $400K NPV over 5 years
• Companies can, in many cases, recoup the investment cost from the outset, especially if they are facing a large scale hardware upgrade
Note: Note: Unlike many TCO studies that rely on theoretical TCO models, this Unlike many TCO studies that rely on theoretical TCO models, this TCO study is based on analysis of five enterprise customers across TCO study is based on analysis of five enterprise customers across a variety of industries that are currently using SQL Server and the a variety of industries that are currently using SQL Server and the leading DB competitorleading DB competitor
Note: Note: Unlike many TCO studies that rely on theoretical TCO models, this Unlike many TCO studies that rely on theoretical TCO models, this TCO study is based on analysis of five enterprise customers across TCO study is based on analysis of five enterprise customers across a variety of industries that are currently using SQL Server and the a variety of industries that are currently using SQL Server and the leading DB competitorleading DB competitor
Executive Summary

© 1999-2002 NerveWire, Inc. All rights reserved. --Proprietary and Confidential
®
SQL Server Saves Organizations up to $807,000 (or 47%) over 3 Years over the Leading DB Competitor
$0
$200.000
$400.000
$600.000
$800.000
$1.000.000
$1.200.000
$1.400.000
$1.600.000
$1.800.000
Departmental Applications (50-100 users)
Cross-OrganizationalApplications (100+ users)
SQL Server TCO
Competing Product TCO
3-Year Total Cost Of Ownership
• SQL Server saves organizations $807,000 (47%) over 3 years for cross-organizational applications
• SQL Server saves organizations $203,000 (40%) over 3 years for departmental applications
Source:: NerveWire Customer Interviews and Analysis, 2002

© 1999-2002 NerveWire, Inc. All rights reserved. --Proprietary and Confidential
®
SQL Server Offers Lower TCO in Every Cost Category; Largest Savings in Ongoing Operations
• SQL Server cost advantages versus the competing product translated into a 47% cost savings over the 3 year period covered in this survey.
• The data reveals that SQL Server has the most significant cost advantage in ongoing operations
Source:: NerveWire Customer Interviews and Analysis, 2002
$0
$100.000
$200.000
$300.000
$400.000
$500.000
$600.000
$700.000
$800.000
$900.000
$1.000.000
Training Maintenance Design &Development
Hardware SoftwareLicensing
OngoingOperations
SQL Server TCO
Competing Product TCO

Simplified Simplified ManagementManagement
•Detect R/3 systems & servicesDetect R/3 systems & services•MMC snap-in provides enterprise viewMMC snap-in provides enterprise view•AD Group Policy can deploy SAPGUIAD Group Policy can deploy SAPGUI
Strengthened Strengthened SecuritySecurity
•Single Sign On with WindowsSingle Sign On with Windows•Automatic encryption of data channelsAutomatic encryption of data channels•Choice of authentication mechanismsChoice of authentication mechanisms
Benefits of SAP/AD IntegrationBenefits of SAP/AD IntegrationCost Reduction!Cost Reduction!
Leverages Leverages Existing Existing
InvestmentsInvestments
•Use Active Directory as a storeUse Active Directory as a store•SAP Portal can use AD for authNSAP Portal can use AD for authN•Reduced training requirementsReduced training requirements
Microsoft SQL Server Microsoft SQL Server Analysis Services with Analysis Services with
mySAP BImySAP BI

SAP Business Warehouse 3.0 SAP Business Warehouse 3.0
mySAP BI 3.0A offers integration of mySAP BI 3.0A offers integration of SQL Server Analysis ServicesSQL Server Analysis Services
mySAP BI uses ROLAP with other DB mySAP BI uses ROLAP with other DB engines (Informix, Oracle, DB2) and engines (Informix, Oracle, DB2) and MOLAP with SQL ServerMOLAP with SQL Server Performance increase with SQL ServerPerformance increase with SQL Server
Table descriptors are redefined and Table descriptors are redefined and allow easier access from Excel allow easier access from Excel directly (not yet supported by SAP)directly (not yet supported by SAP)

BW 3.0 – AS architectureBW 3.0 – AS architecture
BW 3.0A
SAP
Gate-
way
SAP
MOLAPBridge
MS
Analysis
Services
2000
OleDb /
ODBC
Datasource
Bw
Database
MS
SQLServer
2000
Rfc Reg.
Server
DSO
ADOMD
Used only during:
- Dataload ( processing )
- structure Validation
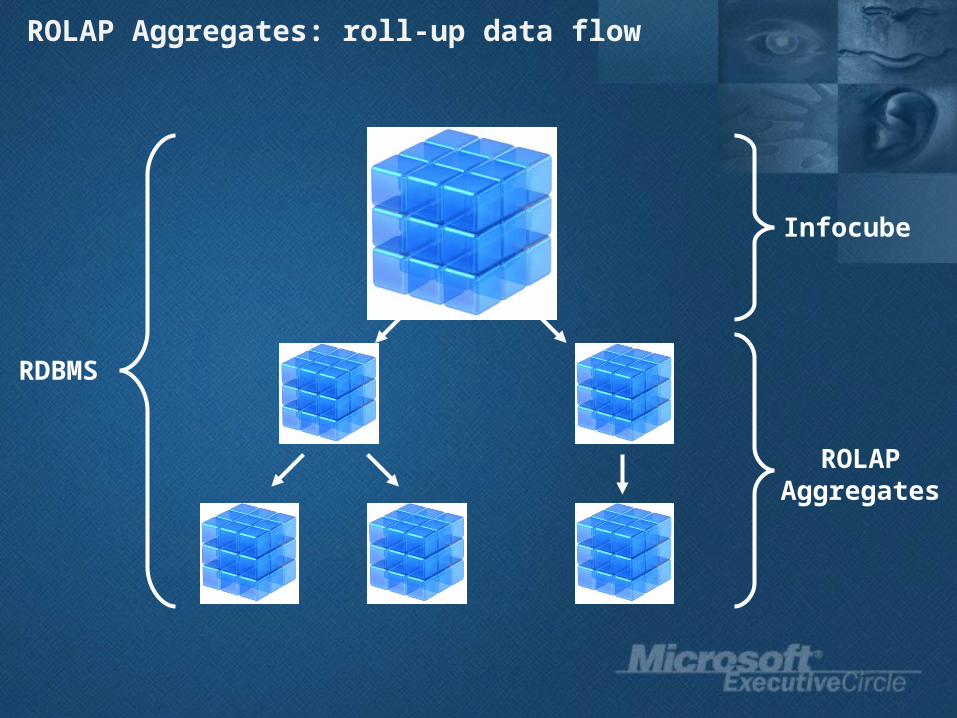
Infocube
ROLAPAggregates
RDBMS
ROLAP Aggregates: roll-up data flow

Infocube
MOLAPAggregates
RDBMS
MOLAP Root-Aggregate
MOLAPStorage
MOLAP Aggregates: roll-up data flow

Extensible by customersExtensible by customers
Version 3.0 direct access to Analysis Services Version 3.0 direct access to Analysis Services notnot supported by SAP. However…supported by SAP. However…
Many features in Analysis Services not in BW that Many features in Analysis Services not in BW that we’d like customers to be able to take advantage we’d like customers to be able to take advantage of, for example:of, for example: > Data mining> Data mining > Local cubes> Local cubes > Actions> Actions
We will publish whitepapers and guidance on how We will publish whitepapers and guidance on how to take advantage of additional features and what to take advantage of additional features and what is and is not ok to modify.is and is not ok to modify.
Features customers use in this way will help Features customers use in this way will help determine what interfaces that should be determine what interfaces that should be developed in the future.developed in the future.

Leading TCOLeading TCO Software, Hardware, Services, MaintenanceSoftware, Hardware, Services, Maintenance
Scalability & ReliabilityScalability & Reliability Ease of Integration and ExtensibilityEase of Integration and Extensibility Majority Platform for SAPMajority Platform for SAP Microsoft Enterprise CommitmentMicrosoft Enterprise Commitment
R&D investment: $5.5 billion in FY03R&D investment: $5.5 billion in FY03 Key Intel vendors R&D: $10+ billionKey Intel vendors R&D: $10+ billion
Solid PartnershipSolid Partnership
Microsoft Value PropositionMicrosoft Value Proposition
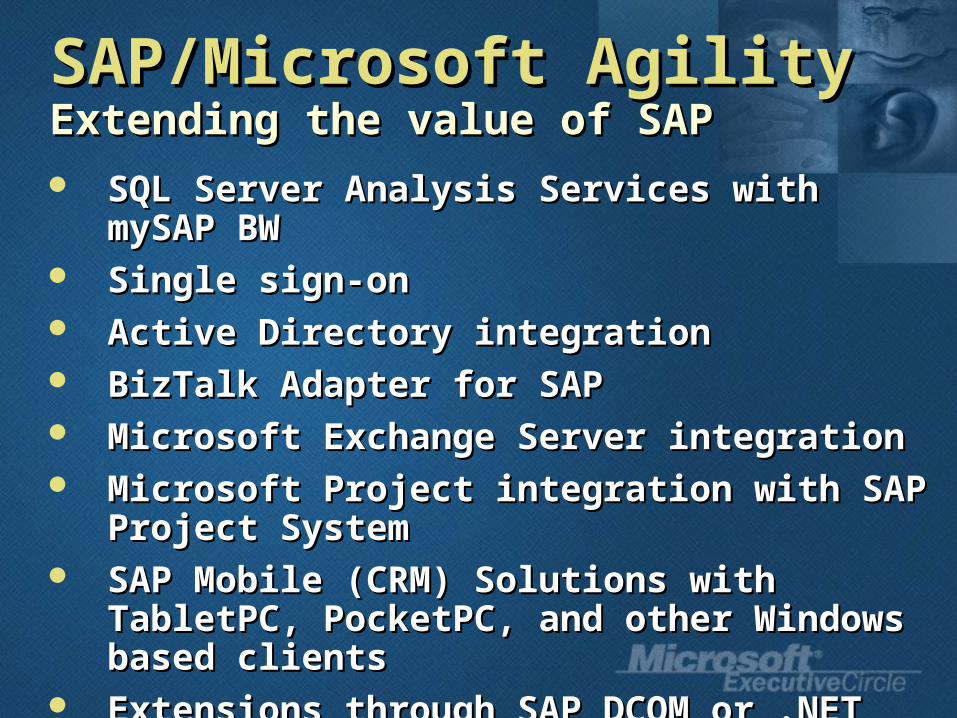
SAP/Microsoft AgilitySAP/Microsoft AgilityExtending the value of SAP Extending the value of SAP
SQL Server Analysis Services with mySAP BW SQL Server Analysis Services with mySAP BW Single sign-onSingle sign-on Active Directory integrationActive Directory integration BizTalk Adapter for SAPBizTalk Adapter for SAP Microsoft Exchange Server integrationMicrosoft Exchange Server integration Microsoft Project integration with SAP Project Microsoft Project integration with SAP Project
SystemSystem SAP Mobile (CRM) Solutions with TabletPC, SAP Mobile (CRM) Solutions with TabletPC,
PocketPC, and other Windows based clientsPocketPC, and other Windows based clients Extensions through SAP DCOM or .NET Extensions through SAP DCOM or .NET
ConnectorConnector