agent-based analysis of cross-border effects for switzerland file7 25.06.2017 research group ......
TRANSCRIPT

Chair of Energy Economics (Prof Fichtner)
Research Group ‘Energy markets and energy systems analysis’
www.kit.eduKIT – The Research University in the Helmholtz Association
Agent-based analysis of cross-border effects for Switzerland
Florian Zimmermann, Dogan Keles, Wolf Fichtner
The 40th IAEE International Conference, 18-21 June 2017, Singapore
2 25.06.2017 Research Group
‘Energy markets and energy systems analysis’
Florian Zimmermann - The 40th IAEE International Conference, 18-21 June 2017,
Singapore
Agenda
Motivation
Methodology
Preliminary results
Conclusion

3 25.06.2017 Research Group
‘Energy markets and energy systems analysis’
Motivation
Florian Zimmermann - The 40th IAEE International Conference, 18-21 June 2017,
Singapore
60%
33%
4% 3%
Water Nuklear Thermal other Renewables
Source: Dehler et al. 2016, Gesamtenergiestatistik 2015
Swiss electricity production 2015
In May 2017 Swiss citizens vote
for nuclear phase-out
No investments in new nuclear
power plants
Current plan: Shut-down all
nuclear power plants until 2034
successively
Swiss electricity prices are highly
depended on the demand and
wholesale prices of neighbouring
countries (Dehler et al. 2016)
Changes of market designs in
large European electricity
markets (Germany, France and
Italy)
Strategic reserve in Germany
Capacity markets in France and
Italy
Nuclear phase-out until 2034 in
Switzerland (and in Germany by
the end of 2022)
How do the market design
changes affect the electricity
markets in Switzerland?

4 25.06.2017 Research Group
‘Energy markets and energy systems analysis’
Market simulation with integrated capacity
expansion
Florian Zimmermann - The 40th IAEE International Conference, 18-21 June 2017,
Singapore
PowerACE
Input data
Agent-based
Simulation
Model results
From market simulation
Electricity production
Emissions
Spot market prices and
volumes
Exchange volume
From investment evaluation
Capacity development
Investment decisions and
Power plant decommissioning
Ex-Post analyses
Hourly simulation of the day-
ahead market (8760h/a)
Yearly investment decisions
Time horizon until 2050
Fuel and CO2-Prices
Investment options in flexible
power plants
Detailed power plant data with
techno-economical parameters
(e.g. efficiency, etc.)
Hourly RES in-feed profiles
Hourly electricity demand
profiles
Trading capacities between
market areas
Source: Genoese (2010), Keles et al. (2016)

5 25.06.2017 Research Group
‘Energy markets and energy systems analysis’
Overview of PowerACE market coupling
Agent-based simulation model for electricity wholesale markets (e.g. Genoese
2010)
Florian Zimmermann - The 40th IAEE International Conference, 18-21 June 2017,
Singapore

6 25.06.2017 Research Group
‘Energy markets and energy systems analysis’
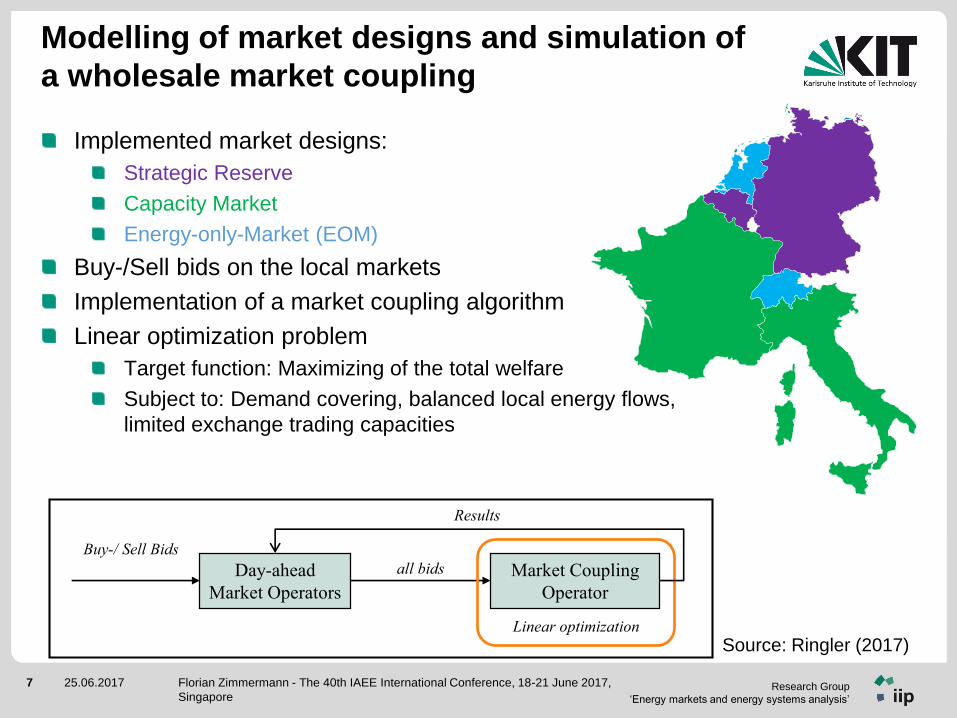
Modelling of market designs and simulation of
a wholesale market coupling
Florian Zimmermann - The 40th IAEE International Conference, 18-21 June 2017,
Singapore
7 25.06.2017 Research Group
‘Energy markets and energy systems analysis’
Modelling of market designs and simulation of
a wholesale market coupling
Implemented market designs:
Strategic Reserve
Capacity Market
Energy-only-Market (EOM)
Buy-/Sell bids on the local markets
Implementation of a market coupling algorithm
Linear optimization problem
Target function: Maximizing of the total welfare
Subject to: Demand covering, balanced local energy flows,
limited exchange trading capacities
Florian Zimmermann - The 40th IAEE International Conference, 18-21 June 2017,
Singapore
Day-ahead
Market Operators
Buy-/ Sell Bids
Market Coupling
Operator
Linear optimization
all bids
Results
Source: Ringler (2017)

8 25.06.2017 Research Group
‘Energy markets and energy systems analysis’
PowerACE - Investment Modul
Long term: Investment plannerAgents represent load serving
entities
InformationCO2- and fuel price prognosis
Investment options
Wholesale market price prognosis
ProcedureNet Present Value (NPV) calculation
Investment decision in case of a
capacity gap for an agent
New power plants enter the market
with a time lag
Florian Zimmermann - The 40th IAEE International Conference, 18-21 June 2017,
Singapore

9 25.06.2017 Research Group
‘Energy markets and energy systems analysis’
Modelling of the French capacity market
Market price and volume in a unit price auction (once per simulation
year)
Supplier: Power plants offer capacity reliability certificates to difference
costs
Demand: Load serving entities (LSE) need certificates depending on their
peak load prognosis in a specific year plus a given margin (2 GW)
Trading of the certificates two years in advance
Over capacities: Certificate prices can drop to 0 Euro/MW
Difference costs (bid price of the suppliers)
Costs, that can not be covered from electricity market trading activities, but
necessary for an economic operation in the long run
𝑐𝑗,𝑡𝑑𝑖𝑓𝑓= max{0 , 𝐼𝑗,𝑡
𝑎𝑛 + 𝑐𝑗,𝑡𝑓𝑖𝑥− 𝐶𝐹𝑗,𝑡
𝐸𝑥𝑝} 𝑤𝑖𝑡ℎ 𝐼𝑗
𝑎𝑛 = 𝐼𝑛𝑣𝑒𝑠𝑡𝑚𝑒𝑛𝑡𝑠𝑗 ∙(1+𝑖)𝑛∙𝑖
(1+𝑖)𝑛−1
Florian Zimmermann - The 40th IAEE International Conference, 18-21 June 2017,
Singapore
cdiff = difference costs, cfix = fix costs, CFExp = expected cash flows, j = power plant,
Ian = annuity investments, t = year, n = economic lifetime in years, i = interest rate

10 25.06.2017 Research Group
‘Energy markets and energy systems analysis’
Preliminary results – Electricity wholesale
prices
Energy only markets vs. planned
market designs
Increasing prices in CH and DE
lead to investments in the
particular market areas
Increasing prices of capacity
certificates lead to investments in
France
Investments in France and
Germany drop the prices in
Switzerland
Florian Zimmermann - The 40th IAEE International Conference, 18-21 June 2017,
Singapore
CH IT FR DE
Avg. electricity price change -7% -1% -6% -8%
-25%
-15%
-5%
5%
15%
2018 2028 2038 2048
Pri
ce c
han
ge
Year
CH DE FR IT
Swiss electricity wholesale prices
are still highly depended on the
prices in the neighbouring countries
11 25.06.2017 Research Group
‘Energy markets and energy systems analysis’
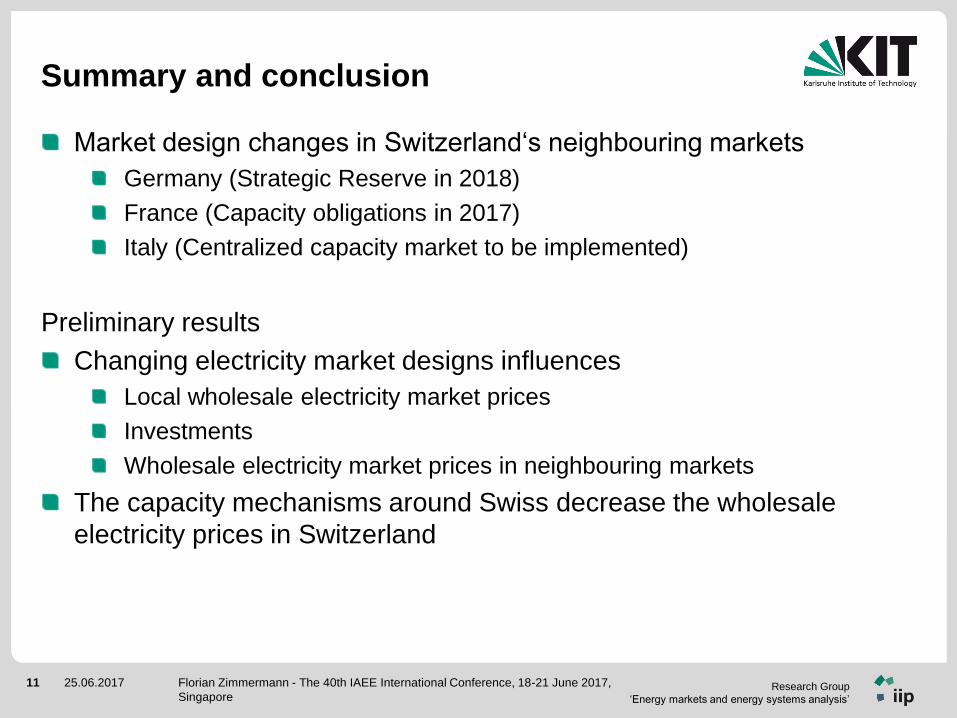
Summary and conclusion
Market design changes in Switzerland‘s neighbouring markets
Germany (Strategic Reserve in 2018)
France (Capacity obligations in 2017)
Italy (Centralized capacity market to be implemented)
Preliminary results
Changing electricity market designs influences
Local wholesale electricity market prices
Investments
Wholesale electricity market prices in neighbouring markets
The capacity mechanisms around Swiss decrease the wholesale
electricity prices in Switzerland
Florian Zimmermann - The 40th IAEE International Conference, 18-21 June 2017,
Singapore

12 25.06.2017 Research Group
‘Energy markets and energy systems analysis’
Critical Reflection
Some effects might be overestimated
Investments
Boom and bust cycles of the capacity prices in France
Austria is not yet modelled
Pump storage and seasonal hydro power should be implemented with
regard to Switzerland
Storage systems and demand response could highly influence the
system in future
Validating model results of the French capacity certificates regarding
long term market prices
Adjust the investment methodology to improve the consideration of
cross-border effects
Florian Zimmermann - The 40th IAEE International Conference, 18-21 June 2017,
Singapore

13 25.06.2017 Research Group
‘Energy markets and energy systems analysis’
THANK YOU FOR YOUR
ATTENTION
Florian Zimmermann - The 40th IAEE International Conference, 18-21 June 2017,
Singapore

14 25.06.2017 Research Group
‘Energy markets and energy systems analysis’
BACKUP
Florian Zimmermann - The 40th IAEE International Conference, 18-21 June 2017,
Singapore

15 25.06.2017 Research Group
‘Energy markets and energy systems analysis’
Quellen
RÉSEAU DE TRANSPORT D’ÉLECTRICITÉ [RTE]: French Capacity Market – Report accompanying the draft rules. 09.04.2014
KELES, Dogan ; BUBLITZ, Andreas ; ZIMMERMANN, Florian ; GENOESE, Massimo ; FICHTNER, Wolf: Analysis of design
options for the electricity market : The German case. In: Applied Energy 183 (2016), S. 884–901
GENOESE, Massimo (2010): Energiewirtschaftliche Analysen des deutschen Strommarkts mit agentenbasierter
Simulation. Zugl.: Karlsruhe, Univ., Diss., 2010. 1. Aufl. Baden-Baden: Nomos-Verl.-Ges.
RINGLER, Philipp; KELES, Dogan; FICHTNER, Wolf (2017): How to benefit from a common European electricity market
design. In: Energy Policy 101, S. 629–643. DOI: 10.1016/j.enpol.2016.11.011.
ENTSO-E: Ten-Year Network Development Plan (TYNDP) 2016. URL https://www.entsoe.eu/major-projects/ten-year-
network-development-plan/ten%20year%20network%20development%20plan%202016/Pages/default.aspx
VITA, A. de ; TASIOS, N. ; EVANGELOPOULOU, S. ; FORSELL, N. ; FRAGIADAKIS, K. ; FRAGKOS, P. ; FRANK, S. ; GOMEZ-
SANABRIA, A. ; GUSTI, M. ; CAPROS, P. ; HAVLÍK, P. ; HÖGLUND-ISAKSSON, L. ; KANNAVOU, M. ; KARKATSOULIS, P. ;
KESTING, Monika ; KOUVARITAKIS, N. ; NAKOS, Ch ; OBERSTEINER, M. ; PAPADOPOULOS, D. ; PAROUSSOS, L. ;
PETROPOULOS, A. ; PUROHIT, P. ; SISKOS, P. ; TSANI, S. ; WINIWARTER, W. ; WITZKE, H. P. ; ZAMPARA, M.: EU reference
scenario 2016: Energy, transport and GHG emissions: trends to 2050. Luxembourg: Publications Office, 2016
FEIX, Olivier ; WIEDE, Thomas ; STRECKER, Marius ; KÖNIG, Regina (2016): Szenariorahmen für die
Netzentwicklungspläne Strom 2030 (NEP 2030). Entwurf der Übertragungsnetzbetreiber. Online verfügbar unter
https://www.netzentwicklungsplan.de/nep-file-download?file=160108_nep_szenariorahmen_2030.pdf.
Florian Zimmermann - The 40th IAEE International Conference, 18-21 June 2017,
Singapore

16 25.06.2017 Research Group
‘Energy markets and energy systems analysis’
Objective function: Welfare maximizing of all corresponding market areas
max𝑞𝑖
𝑚∈ℳ
𝑑∈𝒟𝑚
𝑃𝑑𝑄𝑑𝑞𝑑 −
𝑠∈𝒮𝑚
𝑃𝑠𝑄𝑠𝑞𝑠
Subject to
0 ≤ 𝑞𝑑 ≤ 1 ∀𝑑 ∈ 𝒟𝑚, 0 ≤ 𝑞𝑠 ≤ 1 ∀𝑠 ∈ 𝒮𝑚
𝑑∈𝒟𝑚
𝑄𝑑𝑞𝑑 +
𝑚′∈ℳ′
𝑄𝑚→𝑚′𝑒𝑥 =
𝑠∈𝒮𝑚
𝑄𝑠𝑞𝑠 +
𝑚′∈ℳ′
𝑄𝑚′→𝑚𝑒𝑥 ∀𝑚 ∈ ℳ
𝑄𝑚1→𝑚2𝑒𝑥 ≤ 𝑄𝑚1→𝑚2
𝑒𝑥,𝑚𝑎𝑥 ∀𝑚1,𝑚2 ∈ ℳ
For every time step
Possible sensitivities
Without market coupling (isolation)
Unlimited interconnection capacities (compare ELIX - European Electricity Index)
Formal description of market coupling
Variables
𝑞𝑖 Accepting Rate Bid i
𝑄𝑚1→𝑚2𝑒𝑥 Flow from Node (Market Area)
𝑚1 to Node (Market Area) 𝑚2[MWh]
Parameters
𝑃𝑖 Price Bid i [EUR/MWh]
𝑄𝑖 Quantity Bid i [MWh]
𝑄𝑚1→𝑚2𝑚𝑎𝑥 Maximal Flow from Node
(Market Area) 𝑚1 to Node
(Market Area) 𝑚2 [MWh]
Indices/Exponents
𝑚 Market Area
𝑑 Demand Bid
𝑠 Supply Bid
𝑒𝑥 Exchange
Set
ℳ Market Areas
ℳ′ Coupled Market Areas
𝒟 Demand Bids
𝒮 Supply Bids
Florian Zimmermann - The 40th IAEE International Conference, 18-21 June 2017,
Singapore

17 25.06.2017 Research Group
‘Energy markets and energy systems analysis’
Overview about CRM
Capacity remuneration mechanisms (CRM)
Reserve Central procurement of strategic reserve (about 5%
of the peak load) by TSO
Usage only if market does not clear
No way back for power plants
Central Capacity
Market
„Reliability Options“
Secured power plant capacity is prequalified
Regulator determines demand for capacity
RES receive capacity credits according to their
availability
Decentral Capacity
Market
Decentralized procurement of capacity certificates
by supply companies (sales departments)
Penalty for missing certificates
Florian Zimmermann - The 40th IAEE International Conference, 18-21 June 2017,
Singapore

18 25.06.2017 Research Group
‘Energy markets and energy systems analysis’
Simulation of a centralized capacity mechanism
• Determination of conventional capacity demand ConCap :
𝐶𝑜𝑛𝐶𝑎𝑝𝑡+𝑥 = 1 + 𝑅𝑡+𝑥 ∗ 𝐷𝑝𝑒𝑎𝑘 ,𝑡+𝑥 − 𝐸𝐸𝑡+𝑥 − 𝐼𝑚𝑝𝑡+𝑥
• Determination of power required by each energy supply company (Capacity Obligation
CO): 𝐶𝑂𝑡+𝑥 = 𝑠ℎ𝑎𝑟𝑒𝑝𝑒𝑎𝑘𝑡 ∗ 𝐶𝑜𝑛𝐶𝑎𝑝 𝑡+𝑥
• Calculation of Peak Energy Rent: Contribution margin of a reference gas turbine;
deducted each year from the capacity revenues
Preparing offers for the capacity auction
• Descending Clock Auction
• Floor and starting price based on the Cost of New Entry (CONE) of a reference gas turbine
Step 1: Regulator
Step 2:Generators
Step 3: Capacity auction
Florian Zimmermann - The 40th IAEE International Conference, 18-21 June 2017,
Singapore

19 25.06.2017 Research Group
‘Energy markets and energy systems analysis’
Central capacity mechanism (II)
Different offer types
OfferExistent: existing capacity, used to satisfy CO
→ offer price: 0 €/kW
OfferNew: New power plants,
→ any offer price between floor and starting price
Determination of capacity price for new power plants
NPV = −𝐼0 + 𝑡=1𝑛 (𝑑𝑏−𝑐𝑓𝑖𝑥)
(1+𝑧)𝑡+ (𝑎𝑓 ∗ 𝑝𝑐𝑎𝑝) ∗ 𝑡=1
𝑡+𝑥 1
1+𝑧 𝑡+ (𝑎𝑓 ∗ 𝑝𝑝𝑟𝑜𝑔) ∗
1
(1+𝑧)𝑡= 0
Highest net present
value so fary years fix price
z years predicted price
Florian Zimmermann - The 40th IAEE International Conference, 18-21 June 2017,
Singapore

20 25.06.2017 Research Group
‘Energy markets and energy systems analysis’
Descending Clock Auction
Surplus
Start price
P1
P2
P3
P4
P5
P6
P7MCP
Round 1
Volume (MW)
Price (€/MW)
Round 2
Round 3
Starting price = 2 * CONE
MCP: Market clearing price
Central capacity mechanism
Florian Zimmermann - The 40th IAEE International Conference, 18-21 June 2017,
Singapore

21 25.06.2017 Research Group
‘Energy markets and energy systems analysis’
Strategic Reserve
Auction
Yearly auction for upcoming year
Volume 5 GW
(about 5% of the total thermal capacities in Germany )
Single-price auction, selection of bids via capacity price
Maximum price equals CONE
Usage
If day-ahead market cannot be cleared, full capacity of strategic reserve is
offered at maximum market price (3000 Euro/MWh)
Variable costs are reimbursed to power plant owners, profits remain with
regulator
Participating power plants
Technical requirements: Power plants need to be available 10 h after
request
Power plants once in the strategic reserve are not allowed to participate in
other markets (no-way-back)
Florian Zimmermann - The 40th IAEE International Conference, 18-21 June 2017,
Singapore

22 25.06.2017 Research Group
‘Energy markets and energy systems analysis’
Strategic Reserve
Bidding
Power plants that have been unprofitable for several years bid their fixed
costs in order to avoid decommission
Power plants that have been profitable bid fixed costs + yearly profit from
past (opportunity costs) No strategic bidding (Price agreement or volume
manipulation)
Currently no consideration of option value
(enter the strategic reserve in the future and not being able to enter other
markets again)
Regulator offers gas turbine at CONE
Florian Zimmermann - The 40th IAEE International Conference, 18-21 June 2017,
Singapore

23 25.06.2017 Research Group
‘Energy markets and energy systems analysis’
Decentralized capacity mechanism
Auction
Price and volume determined by market players
Willing to pay for certificates depends on expected penalty and scarcity
expectation
In case of surplus capacities, price can drop to zero
Regulator
Issue certificates to power plant owners
Check if consumers have enough certificates, in case of trigger event e.g.
price or market scarcity reaches a certain predetermined level
If customers require more electricity than their certificates allow them to
do, they have to pay a fine (a multiple of the certificate price)
Florian Zimmermann - The 40th IAEE International Conference, 18-21 June 2017,
Singapore

24 25.06.2017 Research Group
‘Energy markets and energy systems analysis’
Modelling of decentralized capacity market
Determine demand agents into 3 groups according to the personal risk (risk-
averse, -neutral, -taker)
Demand
Creating bids for demand agents and learning effects
Price prognosis corresponds to the CONE
Every demand agent has a risk factor according to the personal risk propensity
Majority is risk neutral
Number of years without scarcity reduces the willingness to buy certificates
Risk factor: 0.8–1.2; more risk => lower value
Learning factor: 0–0.3; higher factor => higher learning abilities
Supply
Power plants bid to difference costs (missing profits) in the capacity market
))YearsFactor (LearningFactor(Risk Price PrognosisPrice Bid Scarcitywithout
Florian Zimmermann - The 40th IAEE International Conference, 18-21 June 2017,
Singapore

25 25.06.2017 Research Group
‘Energy markets and energy systems analysis’
Status Capacity Mechanisms, Jan 2016
Florian Zimmermann - The 40th IAEE International Conference, 18-21 June 2017,
Singapore
Source: Eurelectric 2016

26 25.06.2017 Research Group
‘Energy markets and energy systems analysis’
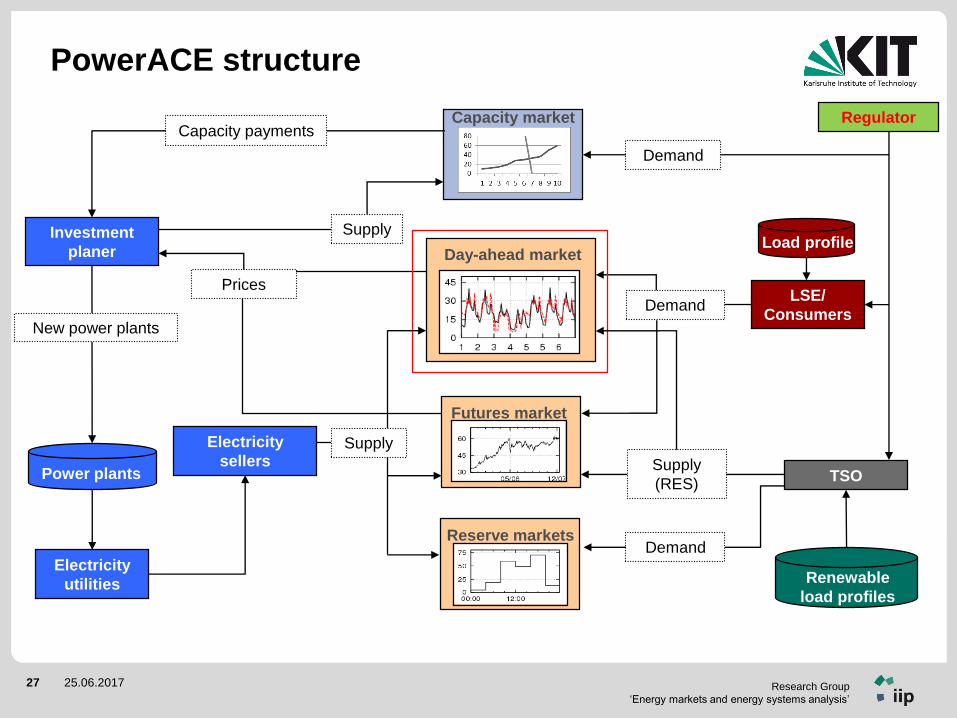
Supply TradersPower plants
Investment
planerLoad profile
TSO
Renewable
load profiles
Supply
Prices
Supply
(RES)
LSE/
Consumers
Day-ahead market
Futures market
Reserve markets
Capacity market
Demand
Regulator
Supply
Capacity payments
Demand
Demand
PowerACE structure
27 25.06.2017 Research Group
‘Energy markets and energy systems analysis’
Electricity
utilities
Electricity
sellersPower plants
Investment
planerLoad profile
TSO
Renewable
load profiles
Supply
Prices
Supply
(RES)
LSE/
Consumers
Day-ahead market
Futures market
Reserve markets
Capacity market
Demand
Regulator
Supply
New power plants
Capacity payments
Demand
Demand
PowerACE structure

28 25.06.2017 Research Group
‘Energy markets and energy systems analysis’
Ergebnisse nach Einführung des französischen
Kapazitätsmarkts
Florian Zimmermann - The 40th IAEE International Conference, 18-21 June 2017,
Singapore
-10%
-5%
0%
5%
10%
15%
20%
25%
DE NL BE FR
0
20
40
60
80
100
120
202
0
202
2
202
4
202
6
202
8
203
0
203
2
203
4
203
6
203
8
204
0
204
2
204
4
204
6
204
8
205
0
Zert
ifik
atep
reis
[T.E
UR
/MW
p.a
.]
Jahr
Kapazität
Zertifikatspreise
DE NL BE FR
9,21% -0,32% 0,84% -15,91%
Durchschnittliche Preisänderung am Spotmarkt
Vergleich zu EOM
Durchschnittliche Spotmarkt-
preise reduzieren sich deutlich
in Frankreich und erhöhen sich
in Deutschland
Zusätzliche Kosten für
Kapazitätszertifikate in
Frankreich
Investitionen stark erhöht in
Frankreich durch
Kapazitätszertifikate
Jedoch geringere Investitionen
in Deutschland

29 25.06.2017 Research Group
‘Energy markets and energy systems analysis’
Ergebnisse bei Einführung aller beschlossenen
Marktdesignänderungen
DE NL BE FR
-6,3% -0,8% 0,2% -16,2%
Vergleich zu EOM
Zukünftige Kombination der
Elektrizitätsmarktdesigns
Strategische Reserven in
Deutschland und Belgien
Französischer Kapazitätsmarkt
Höhere Investitionen in
Frankreich und Deutschland
Dadurch Senkung der
Spotmarktpreise
Aber zusätzliche Kosten durch
Mechanismen
Florian Zimmermann - The 40th IAEE International Conference, 18-21 June 2017,
Singapore
-5%
0%
5%
10%
15%
20%
25%
DE NL BE FR
Kapazität
Durchschnittliche Preisänderung am Spotmarkt

30 25.06.2017 Research Group
‘Energy markets and energy systems analysis’
Ausblick
Weitere Analysen und Modellanpassungen notwendig
Manche Effekte möglicherweise überschätzt (Investitionen in
Frankreich)
Räumliche Auflösung erhöhen: Schweiz sowie Italien integrieren,
aufgrund hoher Kuppelkapazitäten (CH->DE 5,7 GW in 2030 (NEP
2016))
Speicher und DSM in allen modellierten Ländern abbilden
Methodik und Ergebnisse der französischen Kapazitätsobligationen
validieren anhand langfristiger Marktergebnisse
Investitionsmethodik/Preis-Forecast anpassen, um
grenzüberschreitende Wechselwirkungen bei den Investitionen besser
zu berücksichtigen
Florian Zimmermann - The 40th IAEE International Conference, 18-21 June 2017,
Singapore

31 25.06.2017 Research Group
‘Energy markets and energy systems analysis’
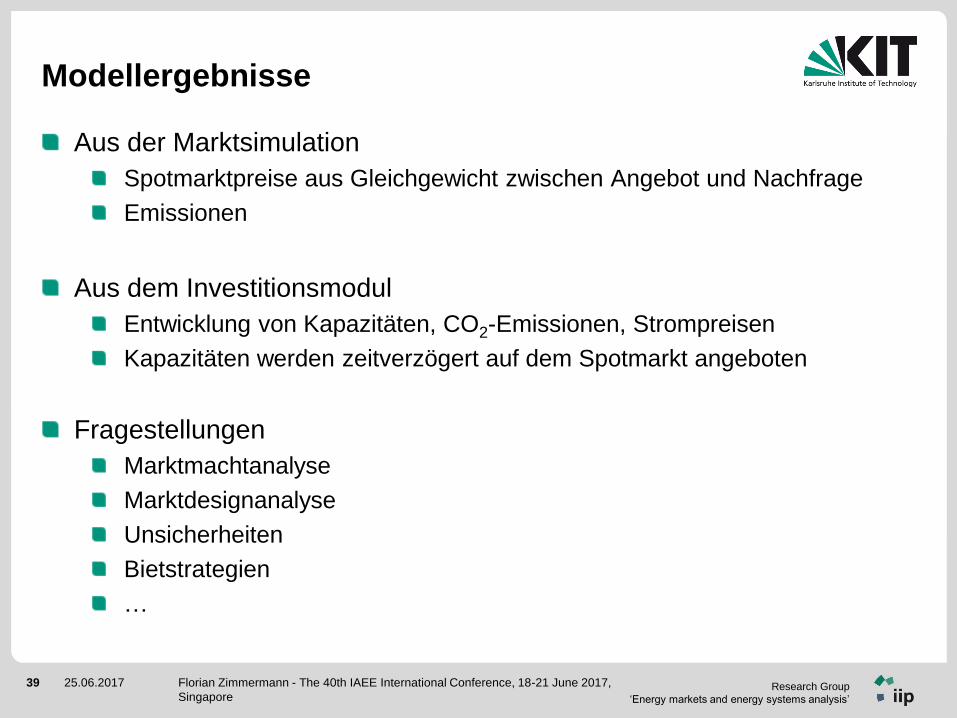
Modellergebnisse
Aus der Marktsimulation
Spotmarktpreise aus Gleichgewicht zwischen Angebot und Nachfrage
Emissionen
Aus dem Investitionsmodul
Entwicklung von Kapazitäten, CO2-Emissionen, Strompreisen
Kapazitäten werden zeitverzögert auf dem Spotmarkt angeboten
Fragestellungen
Marktmachtanalyse
Marktdesignanalyse
Unsicherheiten
Bietstrategien
…
Florian Zimmermann - The 40th IAEE International Conference, 18-21 June 2017,
Singapore

32 25.06.2017 Research Group
‘Energy markets and energy systems analysis’
Modellaufbau PowerACE
Kraftwerks-
betreiber
Stromverkäufer
Kraftwerke
Investitions-
planer
Lastprofile
Netzbetreiber
EE Lastprofile
Gebot
Ergebnisse
Nachfrage
Nachfrage Strom-
käufer
Spotmarkt
Terminmarkt
Reservemarkt
Angebot
Kapazitätsmarkt
EVU
Nachfrage
Nachfrage
Erlöse
Strom-
käufer
Regulator
Gebot
Nachfrage
Kraftwerks-
neubauten
Kapazitätszahlungen
Florian Zimmermann - The 40th IAEE International Conference, 18-21 June 2017,
Singapore

33 25.06.2017 Research Group
‘Energy markets and energy systems analysis’
Modellstruktur - Marktsimulation
EnergieversorgungsunternehmenÜberregionale EVU
Regionale und Industrielle Betreiber
aggregiert
InformationPreisdaten, verfügbare Kraftwerke,
Strompreisprognosen
AufgabeVerkauf der Kapazitäten auf den
Märkten
Florian Zimmermann - The 40th IAEE International Conference, 18-21 June 2017,
Singapore

34 25.06.2017 Research Group
‘Energy markets and energy systems analysis’
Modellierung des dezentraler Kapazitätsmarkts
Aufteilung der Nachfrageagenten in 3 Gruppen (risikoavers, -neutral, -freudig)
Gebotserstellung der Nachfrageagenten und Lerneffekte:
Prognosepreis entspricht dem CONE einer Gasturbine
Jeder Nachfrageagent hat einen persönlichen Risikofaktor, der die
Risikoeinstellung ausdrückt
Überwiegender Teil der Nachfrage ist risikoneutral
Anzahl der Jahre ohne Triggerereignis (Knappheit) senkt die Bereitschaft,
Zertifikate zu beschaffen und damit den Gebotspreis
)*( rohneTriggeJahreLernfaktororRisikofakteisPrognoseprsGebotsprei
Florian Zimmermann - The 40th IAEE International Conference, 18-21 June 2017,
Singapore

35 25.06.2017 Research Group
‘Energy markets and energy systems analysis’
Stärken der Modellierung
Agentenbasiertes Modell PowerACE ermöglicht …
Abbildung der Akteursperspektive:
Kraftwerksinvestitionsentscheidungen mittels erwarteter
Zahlungsströme und Kapitalwertansatz - kein „Perfect-Foresight“
Stilllegung unwirtschaftlicher Kraftwerke
Nachfrageunterdeckung möglich bei zu geringen Investitionen
Ex-post-Analysen: Wirtschaftlichkeitsrechnung für einzelne Kraftwerke
Analyse von Wechselwirkungen zwischen Marktsegmenten
Neue Märkte und Akteuren sind modular integrierbar
Einsatz von abschaltbaren und verschiebbaren Lasten
Demand-Side-Management (DSM)
Kraftwerksbetreiber bieten zum Teil oberhalb von variablen Kosten (Peak-
load-pricing/Markup)
Durch geringere Rechenzeiten hohe zeitliche Auflösung möglich
Florian Zimmermann - The 40th IAEE International Conference, 18-21 June 2017,
Singapore

36 25.06.2017 Research Group
‘Energy markets and energy systems analysis’
Aktuelle Modellweiterentwicklungen
Anbindung weiterer Länder (Frankreich, Benelux, Schweiz,
Italien,…)
Entwicklung eines gesamteuropäischen Modells
Implementierung weiterer Kapazitätsmechanismen
Abbildung einer elastischen Nachfrage
Implementierung der Regelenergiemärkte
Implementierung eines Intradaymarkts
Endogene Abbildung von erneuerbaren Energien
Florian Zimmermann - The 40th IAEE International Conference, 18-21 June 2017,
Singapore

37 25.06.2017 Research Group
‘Energy markets and energy systems analysis’
Grenzen der Modellierung
Unsicherheiten der Modellrechnungen in PowerACE:
Datengrundlagen, insbesondere für zukünftige Jahre, unterliegen
Unsicherheiten bspw. Brennstoffpreisentwicklung oder DSM-
Verfügbarkeiten
Neue Marktsegmente (wie dezentraler Kapazitätsmarkt) erfordern
Annahmen, die sich derzeit noch nicht validieren lassen
Unterstelltes Akteursverhalten ist unsicher, ihre Investitionsentscheidungen
beruhen auf wissenschaftlich fundierten Methoden, wobei bspw. die
Risikoneigung nicht bekannt ist
Florian Zimmermann - The 40th IAEE International Conference, 18-21 June 2017,
Singapore

38 25.06.2017 Research Group
‘Energy markets and energy systems analysis’
Anwendungen
Marktdesignanalyse
Merit-Order-Effekt durch Einsatz erneuerbarer Energien
Analyse dezentraler Energiesysteme mit regionaler
Marktstruktur
Analyse von Versorgungssicherheit auf Kapazitätsebene
Florian Zimmermann - The 40th IAEE International Conference, 18-21 June 2017,
Singapore
39 25.06.2017 Research Group
‘Energy markets and energy systems analysis’
Modellergebnisse
Aus der Marktsimulation
Spotmarktpreise aus Gleichgewicht zwischen Angebot und Nachfrage
Emissionen
Aus dem Investitionsmodul
Entwicklung von Kapazitäten, CO2-Emissionen, Strompreisen
Kapazitäten werden zeitverzögert auf dem Spotmarkt angeboten
Fragestellungen
Marktmachtanalyse
Marktdesignanalyse
Unsicherheiten
Bietstrategien
…
Florian Zimmermann - The 40th IAEE International Conference, 18-21 June 2017,
Singapore

40 25.06.2017 Research Group
‘Energy markets and energy systems analysis’
Stärken der Modellierung
Agentenbasiertes Modell PowerACE ermöglicht …
Abbildung der Akteursperspektive:
Kraftwerksinvestitionsentscheidungen mittels erwarteter
Zahlungsströme und Kapitalwertansatz - kein „Perfect-Foresight“
Stilllegung unwirtschaftlicher Kraftwerke
Nachfrageunterdeckung möglich bei zu geringen Investitionen
Ex-post-Analysen: Wirtschaftlichkeitsrechnung für einzelne Kraftwerke
Analyse von Wechselwirkungen zwischen Marktsegmenten
Neue Märkte und Akteuren sind modular integrierbar
Einsatz von abschaltbaren und verschiebbaren Lasten
Demand-Side-Management (DSM)
Kraftwerksbetreiber bieten zum Teil oberhalb von variablen Kosten (Peak-
load-pricing/Markup)
Durch geringere Rechenzeiten hohe zeitliche Auflösung möglich
Florian Zimmermann - The 40th IAEE International Conference, 18-21 June 2017,
Singapore

41 25.06.2017 Research Group
‘Energy markets and energy systems analysis’
Grenzen der Modellierung
Unsicherheiten der Modellrechnungen in PowerACE:
Datengrundlagen, insbesondere für zukünftige Jahre, unterliegen
Unsicherheiten bspw. Brennstoffpreisentwicklung oder DSM-
Verfügbarkeiten
Neue Marktsegmente (wie dezentraler Kapazitätsmarkt) erfordern
Annahmen, die sich derzeit noch nicht validieren lassen
Unterstelltes Akteursverhalten ist unsicher, ihre Investitionsentscheidungen
beruhen auf wissenschaftlich fundierten Methoden, wobei bspw. die
Risikoneigung nicht bekannt ist
Florian Zimmermann - The 40th IAEE International Conference, 18-21 June 2017,
Singapore

42 25.06.2017 Research Group
‘Energy markets and energy systems analysis’
Modellergebnisse
Aus der Marktsimulation
Spotmarktpreise aus Gleichgewicht zwischen Angebot und Nachfrage
Emissionen
Aus dem Investitionsmodul
Entwicklung von Kapazitäten, CO2-Emissionen, Strompreisen
Kapazitäten werden zeitverzögert auf dem Spotmarkt angeboten
Fragestellungen
Marktmachtanalyse
Marktdesignanalyse
Unsicherheiten
Bietstrategien
…
Florian Zimmermann - The 40th IAEE International Conference, 18-21 June 2017,
Singapore
43 25.06.2017 Research Group
‘Energy markets and energy systems analysis’
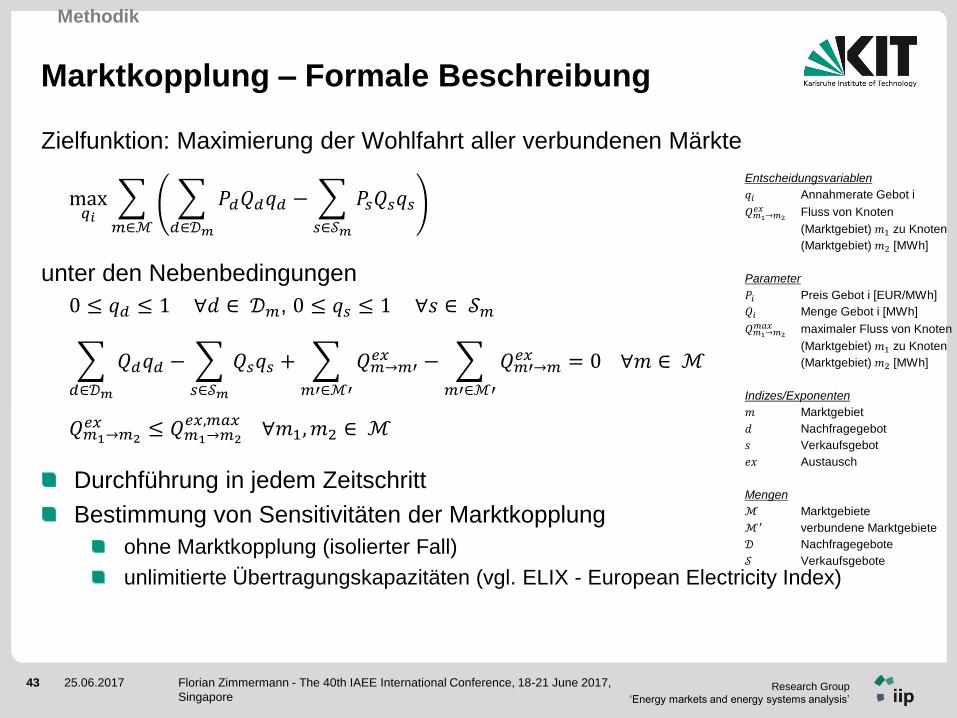
Zielfunktion: Maximierung der Wohlfahrt aller verbundenen Märkte
max𝑞𝑖
𝑚∈ℳ
𝑑∈𝒟𝑚
𝑃𝑑𝑄𝑑𝑞𝑑 −
𝑠∈𝒮𝑚
𝑃𝑠𝑄𝑠𝑞𝑠
unter den Nebenbedingungen
0 ≤ 𝑞𝑑 ≤ 1 ∀𝑑 ∈ 𝒟𝑚, 0 ≤ 𝑞𝑠 ≤ 1 ∀𝑠 ∈ 𝒮𝑚
𝑑∈𝒟𝑚
𝑄𝑑𝑞𝑑 −
𝑠∈𝒮𝑚
𝑄𝑠𝑞𝑠 +
𝑚′∈ℳ′
𝑄𝑚→𝑚′𝑒𝑥 −
𝑚′∈ℳ′
𝑄𝑚′→𝑚𝑒𝑥 = 0 ∀𝑚 ∈ ℳ
𝑄𝑚1→𝑚2𝑒𝑥 ≤ 𝑄𝑚1→𝑚2
𝑒𝑥,𝑚𝑎𝑥 ∀𝑚1,𝑚2 ∈ ℳ
Durchführung in jedem Zeitschritt
Bestimmung von Sensitivitäten der Marktkopplung
ohne Marktkopplung (isolierter Fall)
unlimitierte Übertragungskapazitäten (vgl. ELIX - European Electricity Index)
Marktkopplung – Formale Beschreibung
Entscheidungsvariablen
𝑞𝑖 Annahmerate Gebot i
𝑄𝑚1→𝑚2𝑒𝑥 Fluss von Knoten
(Marktgebiet) 𝑚1 zu Knoten
(Marktgebiet) 𝑚2 [MWh]
Parameter
𝑃𝑖 Preis Gebot i [EUR/MWh]
𝑄𝑖 Menge Gebot i [MWh]
𝑄𝑚1→𝑚2𝑚𝑎𝑥 maximaler Fluss von Knoten
(Marktgebiet) 𝑚1 zu Knoten
(Marktgebiet) 𝑚2 [MWh]
Indizes/Exponenten
𝑚 Marktgebiet
𝑑 Nachfragegebot
𝑠 Verkaufsgebot
𝑒𝑥 Austausch
Mengen
ℳ Marktgebiete
ℳ′ verbundene Marktgebiete
𝒟 Nachfragegebote
𝒮 Verkaufsgebote
Methodik
Florian Zimmermann - The 40th IAEE International Conference, 18-21 June 2017,
Singapore

44 25.06.2017 Research Group
‘Energy markets and energy systems analysis’
Bietstrategien am Spotmarkt
Variable Kosten
Gebotspreis unter Berücksichtigung
von Anfahrkosten
, , ,1 , ,1 , , , ,, , , ,spot spot spot spot spot
i h i h i h i h S i h Sbid p q p q
2
fuel , j ,d fuel
var, j ,d other var, j CO , d fuel
j j
p EFc c p
,
var, , var, ,
,
, var, , var, ,
var, ,
max( , )startup j
j d h j d
u
startup j
j h j d h j d
s
j d
cc 0 p c j B
t
cp c p c j P
t
c sonst
, 1
,
0 ,
,
,
l
fix j l l l
fix j
h
h h
f sf b
markup c f b sf b
c sonst
Knappheitsabhängiger
Preisaufschlag zur Deckung
der fixen Kosten
,
toth
th h
Psf
dem
Indizes Parameter Variablen
i Agent, j Anlage, h Stunde,
S Stufe, k Gebot, d Tag, r reserviert
fuel Brennstoff
c Kosten, Einpreisefaktor, B Kraftwerke in Betrieb, P Anfahren erforderlich,
bi Schwelle, fi Fixkostenanteil, sf Knappheitsindikator, Wirkungsgrad,
EF Emissionsfaktor, tu Stunden ohne Einsatz , ts Stunden mit Einsatz, Reservefaktor ,
dem Nachfrage, P Leistung, av Verfügbarkeitsfaktor
p Preis, q Menge, x [0,1]-
gleichverteilte ZV
Knappheit
Gebot
, , , , ,
, ,max
0 sonst
net j d r j d j d j
j i
P P x avq
Angebotsmenge
Florian Zimmermann - The 40th IAEE International Conference, 18-21 June 2017,
Singapore

45 25.06.2017 Research Group
‘Energy markets and energy systems analysis’
Entscheidungsregeln –
Investitionsentscheidungen
a,m h,a var,h
h
db max p c ,0
util
a,m m m cert ,ainvAdd K T BM p
n
a
0,m 0,m a,m fix,m a,m
a 1
C I db c invAdd (1 z )
0
*
*
maxa a 5a 5i imax
a
a 0,mi net ,m
demmax capacity capacity ,0
dem0.5 C 0
quantity P
0 sonst
Deckungsbeitrag pro
Kraftwerksoption m und Jahr a
Kapitalwert pro
Kraftwerksoption m
Investitionszuschuss pro Jahr
und Kraftwerk
Zubaumenge (m*) für Agent i in
Jahr a
Indizes Parameter Variablen
i Agent, m Technologieoption, h
Stunde, a Jahr, f fix, var variabelp Preis, c Kosten, EF Emissionsfaktor, Tm geschätzte Volllaststunden, z
Zinssatz, n Nutzungsdauer, K Kürzungsfaktor gemäß NAP, BM Benchmark
dem Nachfrage, Pnet Blockgröße
quantity Zubaumenge
Florian Zimmermann - The 40th IAEE International Conference, 18-21 June 2017,
Singapore

46 25.06.2017 Research Group
‘Energy markets and energy systems analysis’
Überblick über PowerACE-Modell
Florian Zimmermann - The 40th IAEE International Conference, 18-21 June 2017,
Singapore
Methodischer Ansatz
agentenbasiertes Simulationsmodell für Stromgroßhandelsmärkte (z. B.
Genoese 2010)